Embed Size (px)
Citation preview

Rehab and Health Reform
October 16, 2012
San Diego, CA
Preparing Your IRF for the Future!
American Medical Rehabilitation Providers Association
10th Annual AMRPA Educational Conference

1
Ø Introduce Walter Consulting
Ø Discuss three major areas that will be key to success under health reform
Ø Review IRF short-term & long-term action items
Ø Discussion
Focus of Today’s Session

n Over one-third of the +/- 100 freestanding NFP IRFs nationally
n Multiple proprietary IRFs and systems
n Major academic medical centers and integrated health systems
n Community hospitals and faith-based organizations
n Freestanding and hospital-based SNFs
n Freestanding and hospital-based HHAs
n Proprietary and NFP LTCHs
n Clients in 40+ states
n Other
2
National Rehab and Post-acute Consulting Experience
Post-acute Clients
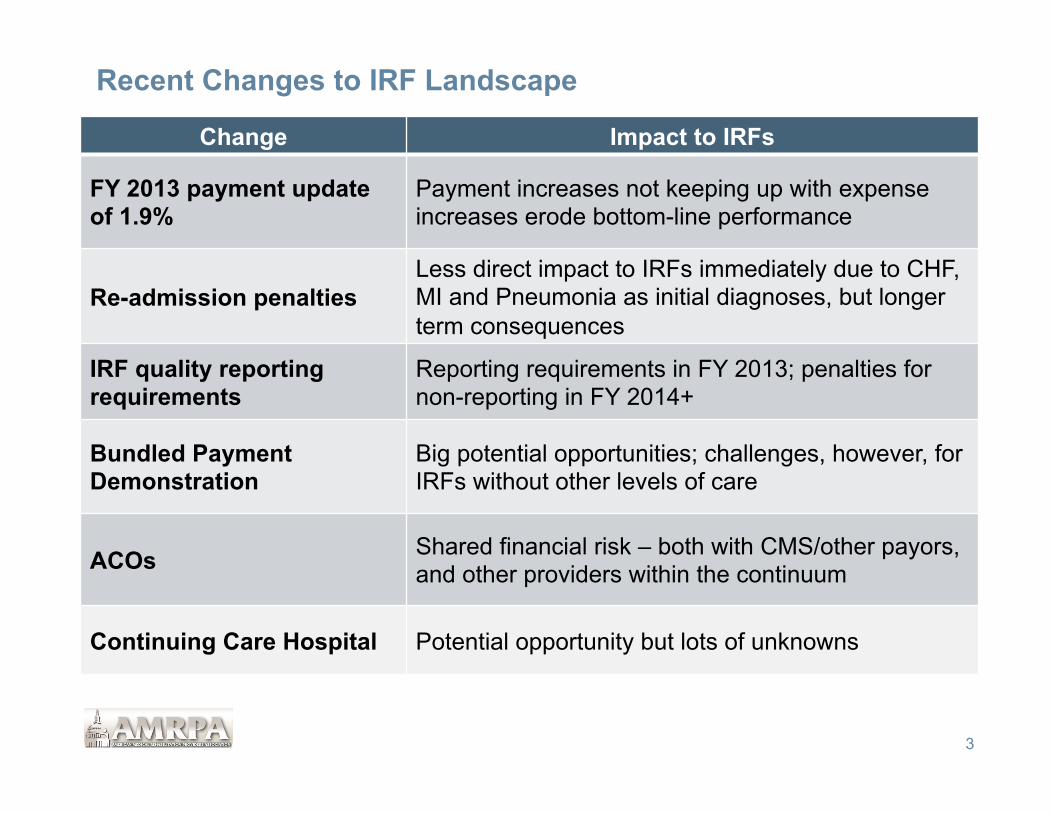
Recent Changes to IRF Landscape
3
Change Impact to IRFs
FY 2013 payment update of 1.9%
Payment increases not keeping up with expense increases erode bottom-line performance
Re-admission penalties Less direct impact to IRFs immediately due to CHF, MI and Pneumonia as initial diagnoses, but longer term consequences
IRF quality reporting requirements
Reporting requirements in FY 2013; penalties for non-reporting in FY 2014+
Bundled Payment Demonstration
Big potential opportunities; challenges, however, for IRFs without other levels of care
ACOs Shared financial risk – both with CMS/other payors, and other providers within the continuum
Continuing Care Hospital Potential opportunity but lots of unknowns
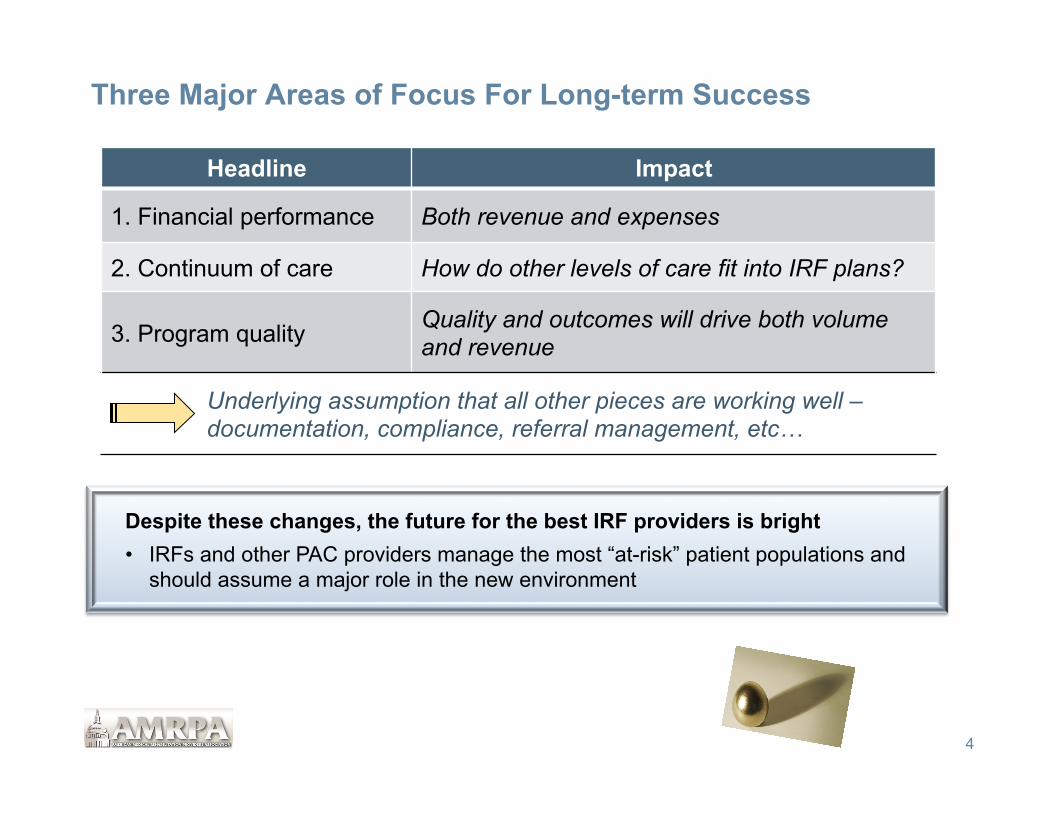
Three Major Areas of Focus For Long-term Success
4
Headline Impact
1. Financial performance Both revenue and expenses
2. Continuum of care How do other levels of care fit into IRF plans?
3. Program quality Quality and outcomes will drive both volume and revenue
Underlying assumption that all other pieces are working well – documentation, compliance, referral management, etc…
Despite these changes, the future for the best IRF providers is bright • IRFs and other PAC providers manage the most “at-risk” patient populations and
should assume a major role in the new environment

Financial Pressure Continue To Increase
n Generally, IRF expenses have been increasing significantly more than 1.8 percent annually
n Revenue impact offset somewhat by increases in CMI and decreases in ALOS
n However, from 2004-2010, average occupancy has decreased from 68 percent to 62 percent
5
Year Baseline % Increase FY 2002 $11,838 - FY 2003 $12,193 3.0% FY 2004 $12,525 2.7% FY 2005 $12,958 3.5% FY 2006 $12,658 -2.3% FY 2007 $12,981 2.6% FY 2008 $13,034 0.4% FY 2009 $12,958 -0.6% FY 2010 $13,661 5.4% FY 2011 $13,860 1.5% FY 2012 $14,076 1.6% FY 2013 $14,343 1.9%
Average 1.8%
Medicare Annual IRF Increases
Word to the wise • Going forward, there will be less $$$, not more • IRFs and other providers must be able to operate under different financial drivers

Modest Revenue Adjustments (e.g., 1.8%) Likely to Increase Financial Pressure on IRFs n Because Medicare is largest IRF payor, modest reimbursement increases that
do not keep pace with inflation present significant challenges for providers - Medicaid adjustments likely less than Medicare
6
Annual Inflation
Projections Base Year Year 1 Year 2 Year 3 Year 4 Year 5
Net Revenue $1,000 1.8% $1,018 $1,036 $1,055 $1,074 $1,093 Expenses $950 3.5% $983 $1,018 $1,053 $1,090 $1,128 Net Income $50 $35 $19 $2 -$16 -$35 Operating Margin 5.0% 3.4% 1.8% 0.2% -1.5% -3.2%
Any volume decreases over this same period would accelerate the negative trend
Impact of Revenue Adjustments Remaining Lower Than Expense Adjustments
Regardless of current financial performance, status-quo operations and strategic initiatives are not an option
Expenses
Net Revenue
$900
$950
$1,000
$1,050
$1,100
$1,150
Year 1 Year 2 Year 3 Year 4 Year 5
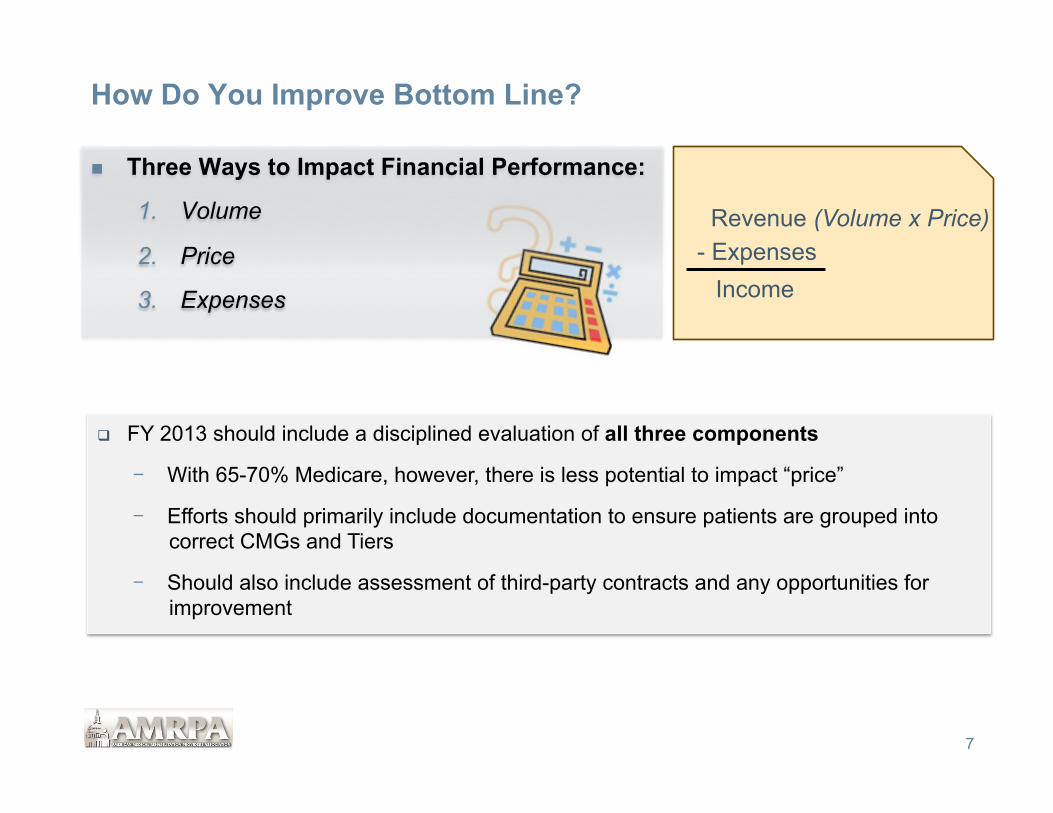
How Do You Improve Bottom Line?
n Three Ways to Impact Financial Performance:
1. Volume
2. Price
3. Expenses
7
Revenue (Volume x Price) - Expenses
Income
q FY 2013 should include a disciplined evaluation of all three components
- With 65-70% Medicare, however, there is less potential to impact “price”
- Efforts should primarily include documentation to ensure patients are grouped into correct CMGs and Tiers
- Should also include assessment of third-party contracts and any opportunities for improvement
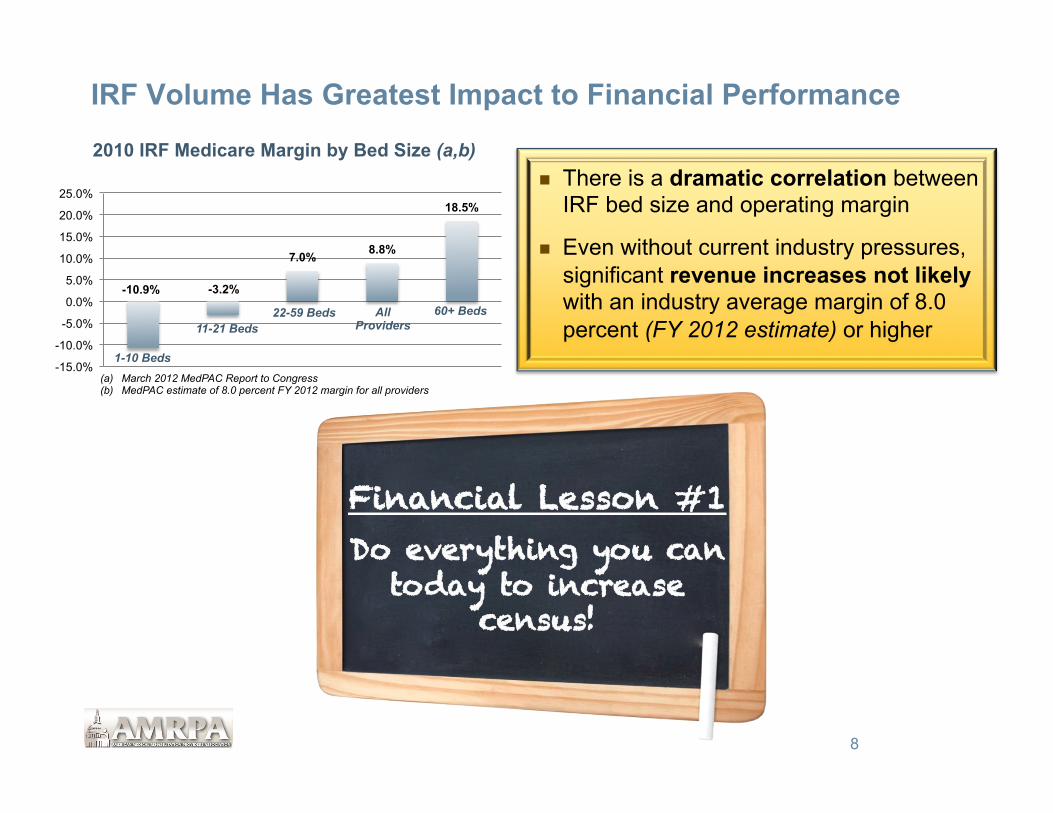
IRF Volume Has Greatest Impact to Financial Performance
n There is a dramatic correlation between IRF bed size and operating margin
n Even without current industry pressures, significant revenue increases not likely with an industry average margin of 8.0 percent (FY 2012 estimate) or higher
8
Financial Lesson #1 Do everything you can
today to increase census!
-10.9% -3.2%
7.0% 8.8%
18.5%
-15.0%
-10.0%
-5.0%
0.0%
5.0%
10.0%
15.0%
20.0%
25.0%
2010 IRF Medicare Margin by Bed Size (a,b)
1-10 Beds
11-21 Beds 22-59 Beds All
Providers 60+ Beds
(a) March 2012 MedPAC Report to Congress (b) MedPAC estimate of 8.0 percent FY 2012 margin for all providers

What Will You Do To Increase IRF Census?
FY 2013 Base Rate $14,343 Avg CMI (a) 1.26 Avg Payment $18,072 Est. Cost (assumes 8% margin) $16,717 Est. Variable Cost (b) $8,358 Est. ContribuKon Margin $9,714 Est. Margin PPD (c) $747 Est. Annual Impact of 1 ADC $272,734 (a) Source: erehabdata (b) Assumes cost structure is 50/50, fixed/variable (c) Assumes 13.0 ALOS (erehabdata)
9
What could you do TODAY to get 2 more admissions this month?
Est. FY 2013 Impact of 1 Occupied Bed Nationally, every 1.0 increase in IRF ADC drives $250K-$300K to the bottom line
With a 13.0 ALOS, this equates to 28 admissions/year, or just over 2.0 admissions/month
For smaller programs with a current margin less than 8.0 percent, the impact may be greater because they probably have a higher percentage of fixed costs, and the true, incremental “cost” of having 1 additional patient is not high

Case Study #1 Ø Large multi-hospital system in the Midwest – approximately 60,000 total discharges Ø One freestanding IRF and one HB-IRF unit Ø Non-CON state, many LTCHs in service area (none within health system)
Neurology/BI Orthopedics SCI/MMT All Other Total Admits Admits Admits Admits Admits
Hospital Potential Actual Percent Potential Actual Percent Potential Actual Percent Potential Actual Percent Potential Actual Percent Variance Hospital 1 122 51 41.4% 102 120 118.2% 12 4 30.4% 45 52 115.6% 280 226 80.7% -54
Hospital 2 54 32 58.3% 48 68 143.2% 9 4 47.1% 20 26 127.5% 130 129 99.2% -1
Hospital 3 71 30 42.3% 34 57 166.2% 5 5 90.0% 33 41 126.2% 143 132 92.6% -11
Hospital 4 284 219 77.1% 76 110 144.9% 134 85 63.7% 137 145 106.2% 630 559 88.7% -71
Hospital 5 55 48 87.3% 57 128 223.7% 17 13 73.5% 17 20 117.6% 146 208 142.5% 62
TOTAL 586 379 64.7% 316 482 152.6% 176 110 62.4% 251 284 112.9% 1,328 1,254 94.4% -74
10
FY 2012 Potential IRF admissions by Hospital and Diagnosis
Findings 1. Although system doing a good job of capturing Ortho and Debility/Misc. patients, there
was significant opportunity to improve capture of Neurology and Trauma patients 2. An additional 275 admissions would increase IRF ADC by 12.0 patients, and improve
Net Income by $3.0+ Million annually

Case Study #1
11
Financial Class Home IRF SNF LTCH HHA Hospice All Other Total
Medicare 11,500 1,200 2,800 2,300 3,100 700 2,000 24,500 Managed Care 18,300 400 200 300 1,100 100 600 21,000 Medicaid 11,500 100 100 100 600 100 600 13,100 All Other 3,900 100 - - 100 - 300 4,400 Total 45,200 1,800 3,100 2,700 4,900 900 3,500 63,000
FY 2011 Discharges by Disposition by Financial Class
n LTCHs were clearly filling IRF void – very competitive
n Over time, as risk-sharing increases with Medicare reimbursement, Medicare referral pattern will likely more closely mimic Managed Care pattern
2009 National Cost Per Discharge (Medicare)
$37,500
$16,500
$9,300 $5,750
$0
$5,000
$10,000
$15,000
$20,000
$25,000
$30,000
$35,000
$40,000
LTCH IRF SNF HHA

General IRF Planning Rules of Thumb
12
Hospital-specific Approximately 4 to 6% of Medicare discharges from acute care are appropriate referrals Medicare represents 65% of all rehabilitation discharges nationally (up to 90% from acute care hospitals that are not trauma centers) The ALOS for all rehabilitation is approximately 13 days Volumes will vary based upon profile of hospital, Centers of Excellence, etc.
Market-specific A geographic area with a normal age distribution can generally support +/- 10 acute rehabilitation beds/100,000 population (85 percent occupancy)
Older populations could support more beds; younger populations less
Variables include referral patterns, in-migration, out-migration, etc.
Actual utilization will depend upon competition from other levels of care (i.e.., SNF, LTCH)
Every IRF should complete its own comprehensive market assessment at least every 3 years!

Capturing New Referrals Requires Planning and Discipline
IRF Initiative Success Criteria
Market Assessment
• Know what the referral potential is within your market or hospital, and where to go to increase census
Admission criteria
• Have clear message to the market • Evenly applied by all liaisons and medical staff
Admissions process
• Open referral funnel as wide as possible • Set response times and stick to them • Screen patients “In” not “Out”
Medical staff coverage
• Different issues for IRFs and IRUs • Access to medical specialties • Minimize returns to acute
Clinical staff competencies
• May require infusing more med/surg skills into nursing staff in order to admit higher acuity patients
• Medically complex patients may also require challenges from therapy perspective
Delivering on your promise
• “Sicker” patients means that your program is living up to “hospital” level of care
• A program is only as good as its weakest link…
Know where to go for patients
Ensure effective- ness with “getting them in the door”
Manage them well once they are there
Pulling it all together…

Expense Management Critical Element As Well
14
Expense management is not simply about reducing staff or cutting costs
• The single biggest opportunity for expense management is to implement “best practices” operational practices - For similar diagnosis, look at various practices and outcomes by physician or by
location ü Length-of-stay ü Therapy/other ancillary utilization ü Pre-admission/admission processes and days on-set prior to admission ü Other
• Consider implementation of Dash Board planning tools for expense management, productivity, staffing, etc.
• Ensure appropriate IT systems for effective resource utilization • Do we need to “right-size” certain programs? • Can we afford to stay in all existing business lines? • Other – try to think outside of the box…

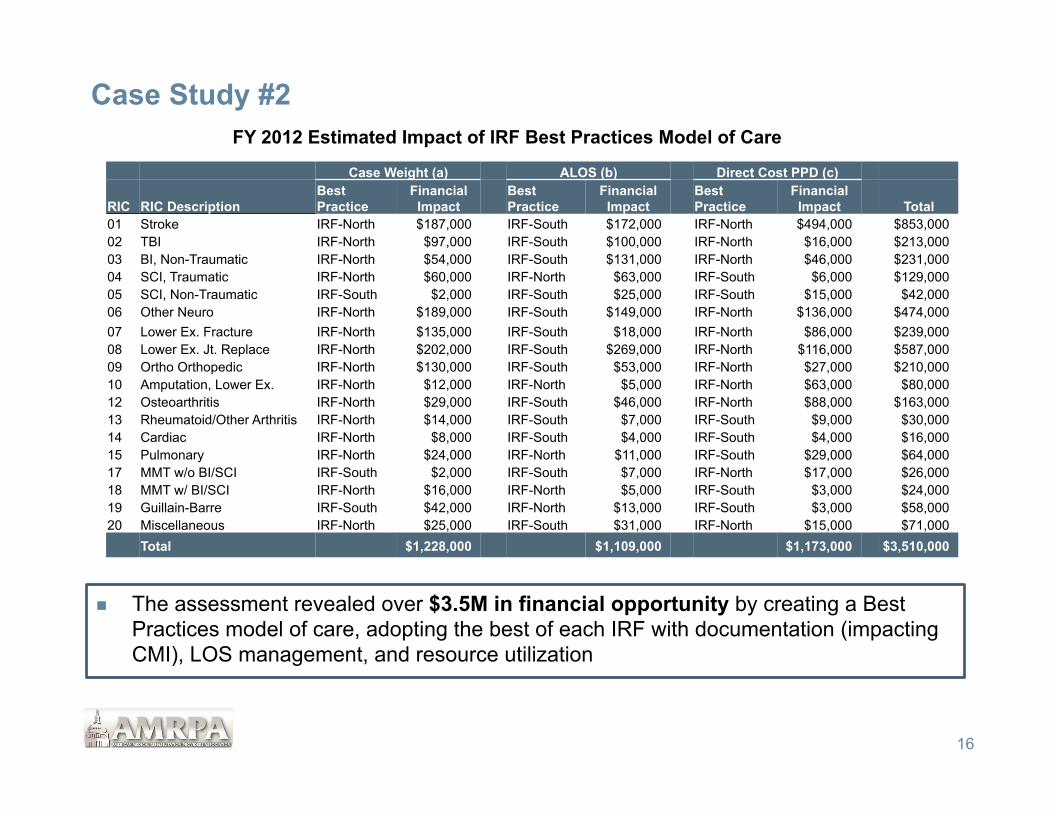
Case Study #2 – Evaluating Cost Structure Ø Rehabilitation system in the Southwest that includes, among many other programs and
services, two freestanding IRFs – (a/k/a IRF-North and IRF-South) Ø IRFs relatively similar in size and scope of services; same geographic market Ø Similar FIM scores and other outcome measures Ø Very different financial performance at a CMG and RIC level Ø Same corporate services, so cost structure variances not due to overhead Ø Operated separately, however, with two administrators, separate DONs, medical staff, etc.
15
Ø Project focus was a five-year strategic plan, and one of the primary initiatives was a financial analysis to identify those existing opportunities to improve financial performance
Ø A “Best Practices” analysis was completed that evaluated on a CMG-level • FIM scores • CMI • ALOS
Ø Clear differences emerged that suggested the system would be better off to implement the Best Practices represented from both IRFs across the system
Case Study #2
n The assessment revealed over $3.5M in financial opportunity by creating a Best Practices model of care, adopting the best of each IRF with documentation (impacting CMI), LOS management, and resource utilization
16
Case Weight (a) ALOS (b) Direct Cost PPD (c)
RIC RIC Description Best Practice
Financial Impact
Best Practice
Financial Impact
Best Practice
Financial Impact Total
01 Stroke IRF-North $187,000 IRF-South $172,000 IRF-North $494,000 $853,000 02 TBI IRF-North $97,000 IRF-South $100,000 IRF-North $16,000 $213,000 03 BI, Non-Traumatic IRF-North $54,000 IRF-South $131,000 IRF-North $46,000 $231,000 04 SCI, Traumatic IRF-North $60,000 IRF-North $63,000 IRF-South $6,000 $129,000 05 SCI, Non-Traumatic IRF-South $2,000 IRF-South $25,000 IRF-South $15,000 $42,000 06 Other Neuro IRF-North $189,000 IRF-South $149,000 IRF-North $136,000 $474,000 07 Lower Ex. Fracture IRF-North $135,000 IRF-South $18,000 IRF-North $86,000 $239,000 08 Lower Ex. Jt. Replace IRF-North $202,000 IRF-South $269,000 IRF-North $116,000 $587,000 09 Ortho Orthopedic IRF-North $130,000 IRF-South $53,000 IRF-North $27,000 $210,000 10 Amputation, Lower Ex. IRF-North $12,000 IRF-North $5,000 IRF-North $63,000 $80,000 12 Osteoarthritis IRF-North $29,000 IRF-South $46,000 IRF-North $88,000 $163,000 13 Rheumatoid/Other Arthritis IRF-North $14,000 IRF-South $7,000 IRF-South $9,000 $30,000 14 Cardiac IRF-North $8,000 IRF-South $4,000 IRF-South $4,000 $16,000 15 Pulmonary IRF-North $24,000 IRF-North $11,000 IRF-South $29,000 $64,000 17 MMT w/o BI/SCI IRF-South $2,000 IRF-South $7,000 IRF-North $17,000 $26,000 18 MMT w/ BI/SCI IRF-North $16,000 IRF-North $5,000 IRF-South $3,000 $24,000 19 Guillain-Barre IRF-South $42,000 IRF-North $13,000 IRF-South $3,000 $58,000 20 Miscellaneous IRF-North $25,000 IRF-South $31,000 IRF-North $15,000 $71,000
Total $1,228,000 $1,109,000 $1,173,000 $3,510,000
FY 2012 Estimated Impact of IRF Best Practices Model of Care
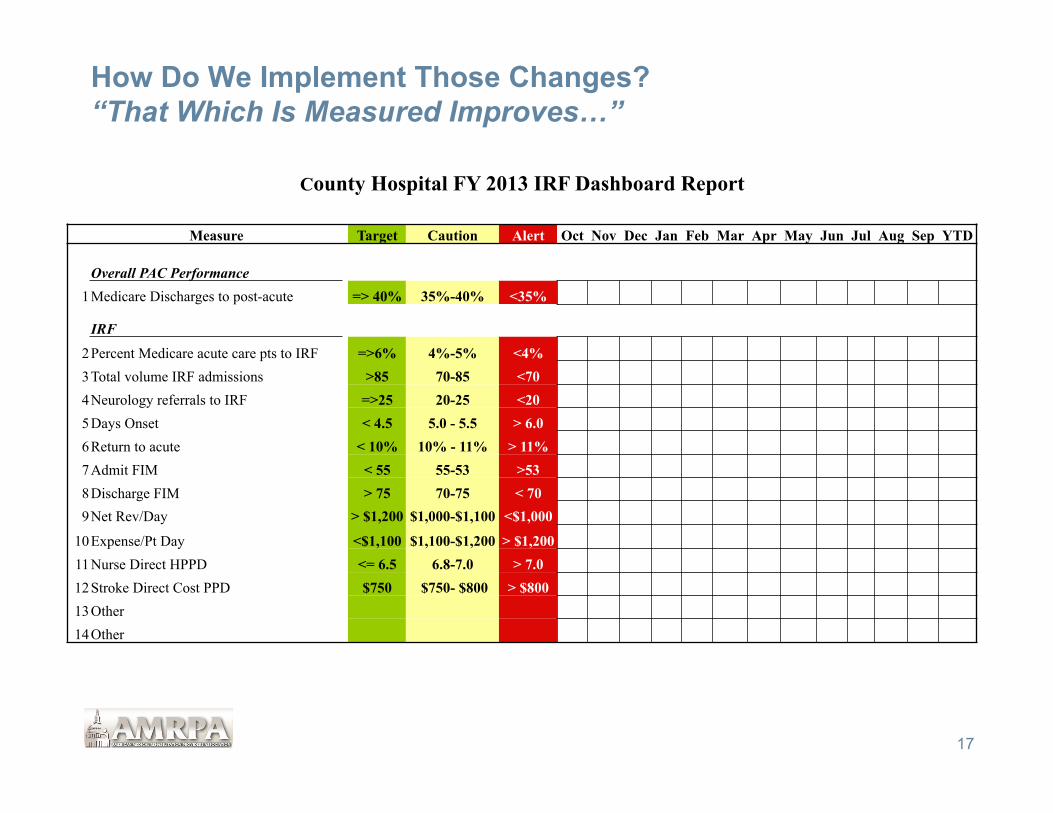
How Do We Implement Those Changes? “That Which Is Measured Improves…”
17
County Hospital FY 2013 IRF Dashboard Report
Measure Target Caution Alert Oct Nov Dec Jan Feb Mar Apr May Jun Jul Aug Sep YTD Overall PAC Performance
1 Medicare Discharges to post-acute => 40% 35%-40% <35%
IRF
2 Percent Medicare acute care pts to IRF =>6% 4%-5% <4% 3 Total volume IRF admissions >85 70-85 <70 4 Neurology referrals to IRF =>25 20-25 <20 5 Days Onset < 4.5 5.0 - 5.5 > 6.0 6 Return to acute < 10% 10% - 11% > 11% 7 Admit FIM < 55 55-53 >53 8 Discharge FIM > 75 70-75 < 70 9 Net Rev/Day > $1,200 $1,000-$1,100 <$1,000
10 Expense/Pt Day <$1,100 $1,100-$1,200 > $1,200 11 Nurse Direct HPPD <= 6.5 6.8-7.0 > 7.0 12 Stroke Direct Cost PPD $750 $750- $800 > $800 13 Other 14 Other

Continuum of Care n Is your mission - Inpatient rehabilitation as defined by Medicare Conditions of Participation? - Inpatient rehabilitation regardless of patient level of care? - Rehabilitation regardless of setting? - Post-acute care? - Other?
n With the advent of ACOs, Bundled Payments, etc., is it time to rethink your continuum of care?
n The more patients we can accept, the greater value we will provide to potential referral sources
18
Discharge All Best Practices (b) Disposition Medicare (a) Low High
IRF 3.2% 4.0% 6.0% SNF 17.3% 12.0% 15.0% HHA 16.0% 22.0% 24.0% LTCH 1.0% 1.5% 2.0% Hospice 2.1% 2.5% 3.0% Total 39.6% 42.0% 50.0%
(a) Source: MedPAC June 2008 Annual Data Book. (b) Source: Walter Consulting.
2006 Na'onal Post-‐acute U'liza'on Rates
A greater number of patients require other levels of care than IRF
In addition, many patients also in the SNF and HHA setting have rehabilitation as a primary reason for admission…

If We Provide Inpatient Rehab, Should SNF Be Part Of Our Continuum?
n Historically, many providers felt there was +/- a 30 percent overlap between IRF and SNF rehab – significantly less since full implementation of 60 Percent Rule, but overlap still clearly exists
n With such a high volume of rehab patients requiring SNF level of care, are you a greater asset within the continuum if you also offer this level of care? Have you widened your referral funnel in this way?
19
2011 RUGs Distribution by RUG Group
SNF PPS Definitions Percent Medicare
Pt. Days RUG Category Min. Weekly
Therapy Minutes Therapy Hrs/5-
day Week Rehab Ultra High 720 2.4 47.6% Rehab Very High 500 1.7 27.2% Rehab High 325 1.1 10.2% All Other NA NA 15.0% Total 100.0%
SNF, however, is a very different business, and caution should be exercised before jumping in feet first – lower margins and different skill sets required for success

Case Study # 3 – Expanding the Continuum: Build or Buy?
n Situation: Two hospital health system in Midwest; 50,000 discharges; 60-bed IRF; no SNF services; preference to use system capital for other growth needs rather than SNF development; desires SNF partner to help with acute care throughput and to manage difficult-to-place patients (i.e., Self-pay)
n Process: Initial screen identified 5-6 local SNF partners that would meet system needs: bed capacity; reputation; physician preference; other
RFP sent to these targeted providers
20
Partner Requirements Partnership Requirements
Measureable quality metrics: § Readmission rates § ED visits § Mortality rates § Five-star Rating § Patient satisfaction
Improved clinical integration between acute care and SNF: § Selection of SNF facility/program Medical
Directors § Staff education § Information exchange
Solid financial position; ability to invest in programs and services as needed
Acceptance of some level of unfunded patients (although potential for limited subsidies)
Willingness to create new business model
Financial incentives based upon specific targets, including readmission rates compared to targets

How Do We Best Manage Multiple Levels of Rehabilitation?
21
In health systems that offer both an IRF and SNF (or other levels of PAC), it is critical that coordination be key! Ø Often times, when IRF managers are asked “Who is your biggest
competitor?”, the response is “The subacute unit down the hall.” Big Mistake!
Ø All things being equal, in today’s environment, if a rehabilitation patient meets IRF admission criteria, from a financial perspective, that should be the desired placement option for most systems – this is subject to change, however, with health reform initiatives emerging
Ø In today’s environment, an HB-SNF should target those acute care patients that cannot be placed in the IRF or other community programs
- Focusing on those SNF patients with the best financial return may not be in the best interest of the health system
These two programs must be joined at the hip, ideally under one manager, with appropriate program objectives and metrics. Physician, staff, and case manager education also critical
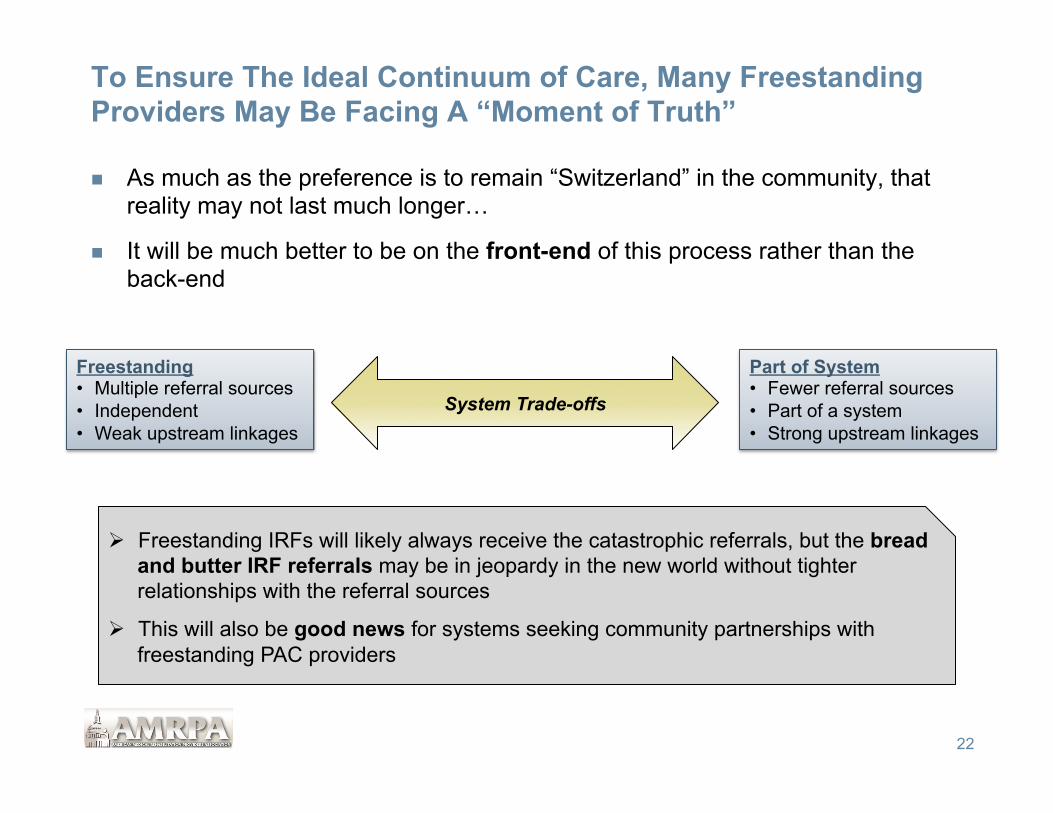
To Ensure The Ideal Continuum of Care, Many Freestanding Providers May Be Facing A “Moment of Truth”
n As much as the preference is to remain “Switzerland” in the community, that reality may not last much longer…
n It will be much better to be on the front-end of this process rather than the back-end
22
System Trade-offs
Freestanding • Multiple referral sources • Independent • Weak upstream linkages
Part of System • Fewer referral sources • Part of a system • Strong upstream linkages
Ø Freestanding IRFs will likely always receive the catastrophic referrals, but the bread and butter IRF referrals may be in jeopardy in the new world without tighter relationships with the referral sources
Ø This will also be good news for systems seeking community partnerships with freestanding PAC providers

Prepare For Payment Linked to Demonstrated Quality
23
§ Clearly, it will not be enough to simply say “We provide excellent quality” without measureable indicators comparing your performance to industry and local competitors
§ The information reported will also need to go far beyond FIM gain and/or Return to the Community
§ Every IRF must be able to demonstrate effectiveness on these measures without sacrificing performance on other measures
Ø Admission Days Onset, FIM score, CMI and discharge FIM must remain as good or better than both the industry and local competitors
Ø Cannot afford to be risk-adverse in order to achieve quality targets – if this is being done, then program content needs to be evaluated - Staffing - Competencies - Medical staff coverage - Etc.

Key Quality Improvement Activities
24
Set clinical quality targets that go beyond FIM, Quality Reporting Requirements, and readmissions
• Should be RIC or diagnostic/CMI specific • Each department must have its own targets (lab, nursing, therapy, etc.)
In addition to clinical quality standards, the most successful IRFs will target quality improvement for non-clinical areas as well (patient satisfaction, billing, documentation, etc.)
Progressive providers will continually push the envelope to improve quality
Technology will be critical success factor
“That which is measured improves…”

Strategic Planning Process: Potential Quality Work Plan Impact on Quality
Targets Ease of
Implementation Impact on
Financial Targets Comment
Initiative Greatest Impact = 1 Easiest = 1 Greatest Return = 1
Implement “Best Practices” 1 3 1 Does this require program consolidation? What kind of tools might be required to determine “best practice?
Address internal operational barriers
1 2 2 What is the appropriate structure to achieve long-term goals?
Implement TQM process 1 3 1 How do we prioritize initiatives?
Implement EMR 2 3 2 What is the timing?
Cost of implementation?
Ensure MD contractual financial incentives have measureable quality targets
1 2 1 How do we do this when physicians are not employees?
Other_______________________ Other_______________________ Other_______________________
25

Next Steps: Five Priorities for FY 2012
26
1. Bring in every IRF admission today that is possible • Every incremental admission strengthens your organization for the short-term, and
better positions you for the long-term
• Complete a demand assessment to make sure you are capturing all potential referrals and admissions
• Assess marketing and admissions processes to ensure effectiveness in developing referrals and converting referrals to admissions
2. Make sure you are the low cost provider • Evaluate your cost of care and compare to local providers as well as “best in class”
• Look at operations, staffing, and productivity, but also support and overhead functions that make up a large component of total cost
3. Evaluate your rehabilitation Continuum of Care • Assess opportunity to widen funnel for referrals
• Identify potential programs that fit mission, community and referral source needs • Complete “Build or Buy” assessment
• If freestanding IRF, consider the potential for upstream linkages with acute care systems

Next Steps: Five Priorities for FY 2012
27
4. Develop plan for Continuous Quality Improvement • Evaluate all components of organization, not just readmissions or those included in FIM
score (e.g., billing, housekeeping, transport, etc.)
• If overall performance compares favorably to industry (such as readmissions), identify those areas of lower performance and develop plan for improvement
• Link performance to compensation if possible
5. Complete Strategic Plan • Begin to decide today where your organization would like to be in 2015-2016 – develop a
vision • Evaluate alternatives and decide how to best achieve that vision
• Be proactive as to where you would like your IRF to be strategically as systems consolidate and organizations assume greater financial risk under bundled payments
• Develop a written strategic plan to serve as your road map for the future
There will be lot of opportunity for forward-thinking IRFs, but the work needs to start today to ensure long-term success in this dynamic environment!

Questions?
28

Contact Information
Daniel B. Walter Senior Principal Walter Consulting 404.636.9700 [email protected] www.walterconsulting.com
29