Embed Size (px)
Citation preview

8/14/2019 Presenting QM
http://slidepdf.com/reader/full/presenting-qm 1/26
PresentingPresentingQMQM

8/14/2019 Presenting QM
http://slidepdf.com/reader/full/presenting-qm 2/26
CONTENT
• Introduction to Organisation & Presentation of Data
• Types of Presentation
• Other Type of Tabular Presentation
• Summary• Bibliography

8/14/2019 Presenting QM
http://slidepdf.com/reader/full/presenting-qm 3/26
OrganisationOrganisation & & PresentationPresentation of Dataof Data
Organizing ref. to arranging & classifying data
Presentation of Data ref. to presenting facts fromwhich conclusion can be drawn
8/14/2019 Presenting QM
http://slidepdf.com/reader/full/presenting-qm 4/26
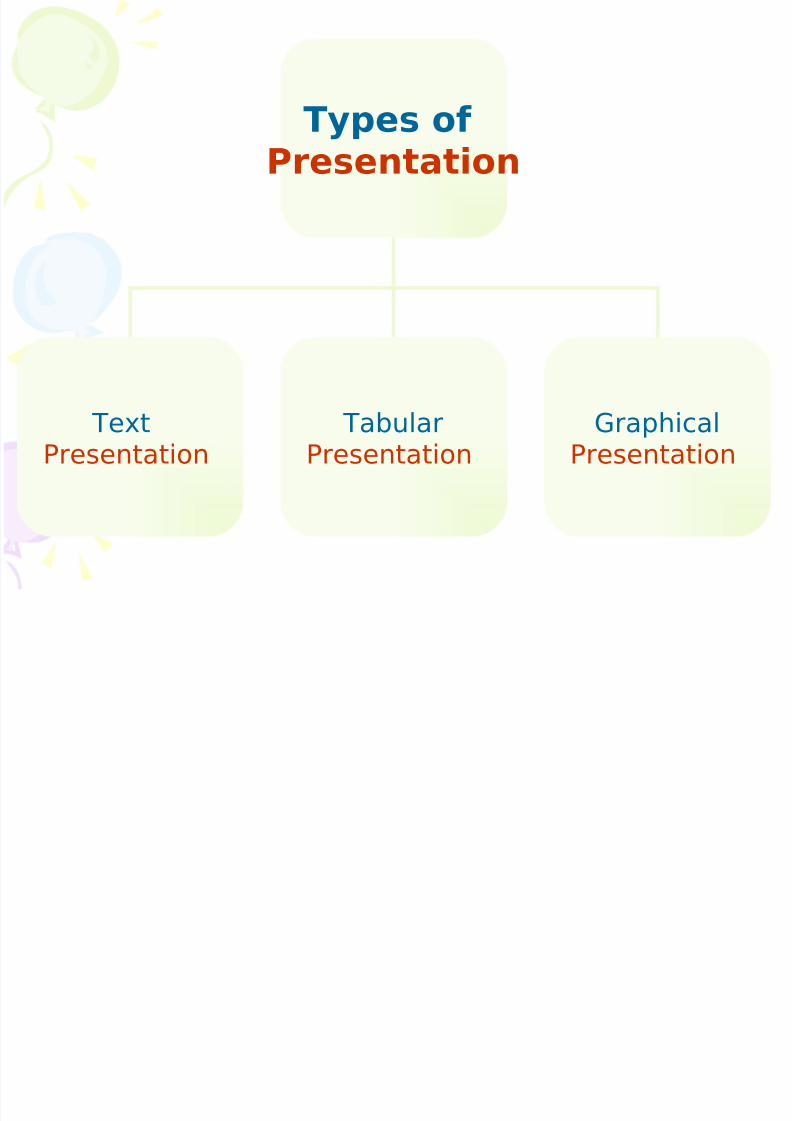
Types of Presentation
TextPresentation
TabularPresentation
Graphical Presentation

8/14/2019 Presenting QM
http://slidepdf.com/reader/full/presenting-qm 5/26
TextText PresentationPresentation
Not very effective
Need to read theparagraph carefully
Hardly anyoneunderstand suchpresentation
8/14/2019 Presenting QM
http://slidepdf.com/reader/full/presenting-qm 6/26
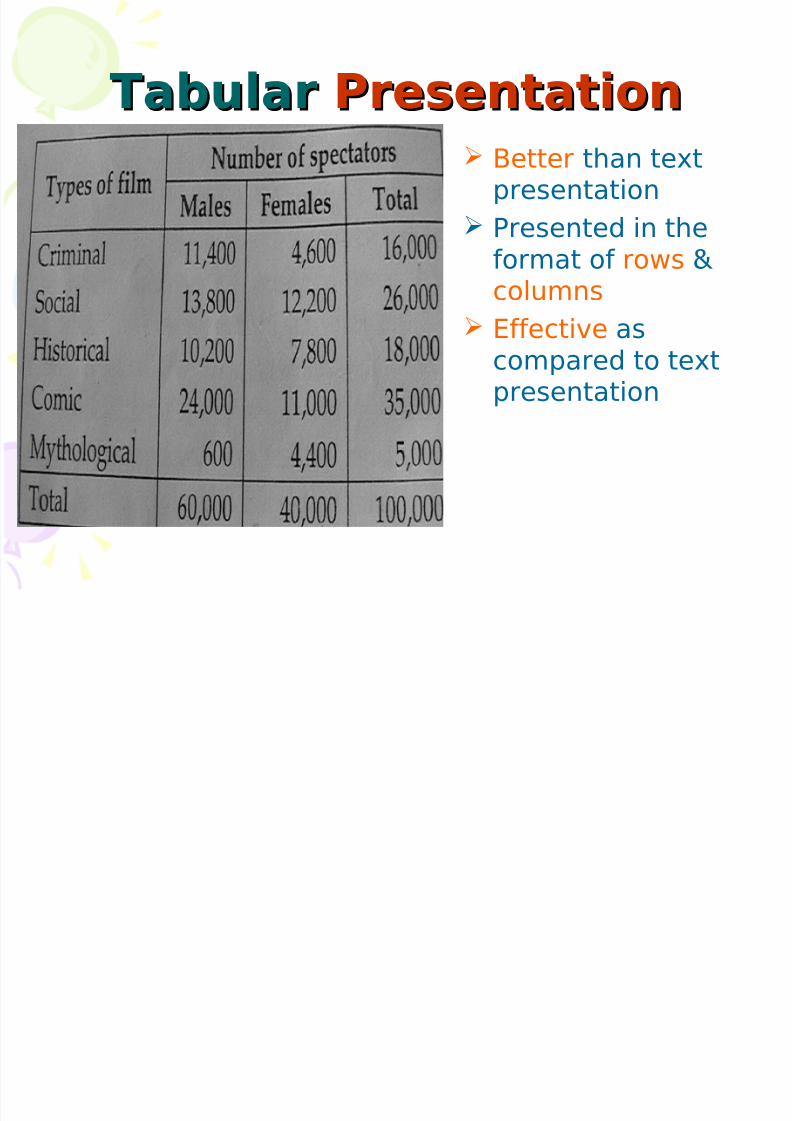
TabularTabular PresentationPresentation Better than text
presentation
Presented in theformat of rows & columns
Effective ascompared to textpresentation
8/14/2019 Presenting QM
http://slidepdf.com/reader/full/presenting-qm 7/26
Tabular Presentation
Geographicclassification
Time SeriesDescriptive
Characteristics
Differences of kind
Differences of degree
8/14/2019 Presenting QM
http://slidepdf.com/reader/full/presenting-qm 8/26
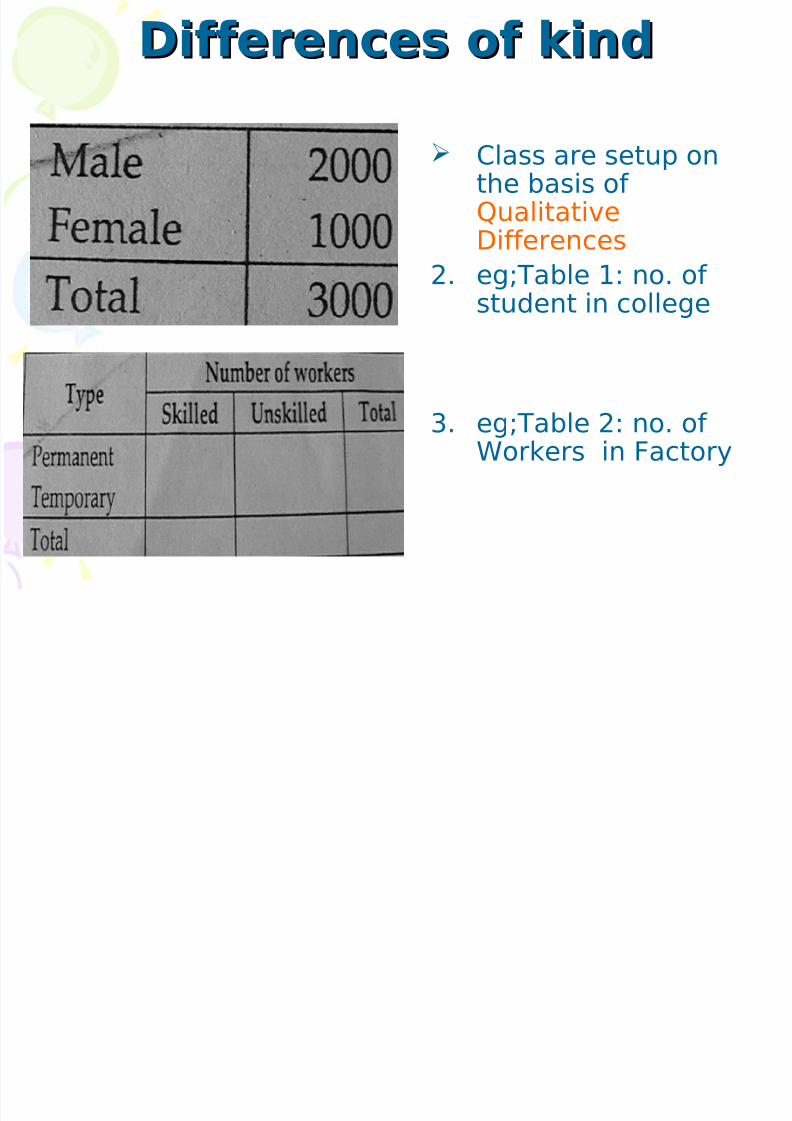
Differences of kindDifferences of kind
Class are setup onthe basis of QualitativeDifferences
2. eg;Table 1: no. of student in college
3. eg;Table 2: no. of Workers in Factory
8/14/2019 Presenting QM
http://slidepdf.com/reader/full/presenting-qm 9/26
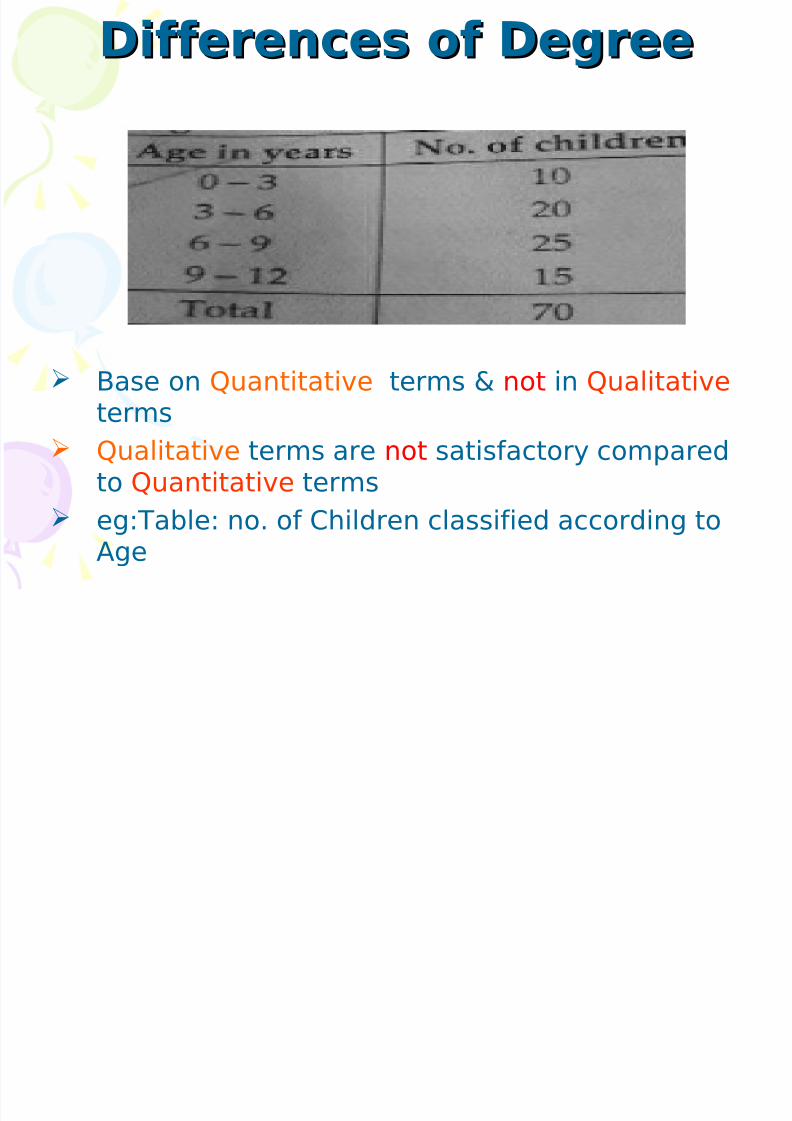
Differences of DegreeDifferences of Degree
Base on Quantitative terms & not in Qualitative
terms Qualitative terms are not satisfactory compared
to Quantitative terms
eg:Table: no. of Children classified according to
Age

8/14/2019 Presenting QM
http://slidepdf.com/reader/full/presenting-qm 10/26
Geographic ClassificationGeographic Classification
Separates data into groups according to
Geographical division2. eg;Table: Rainfall in state’s in India
8/14/2019 Presenting QM
http://slidepdf.com/reader/full/presenting-qm 11/26
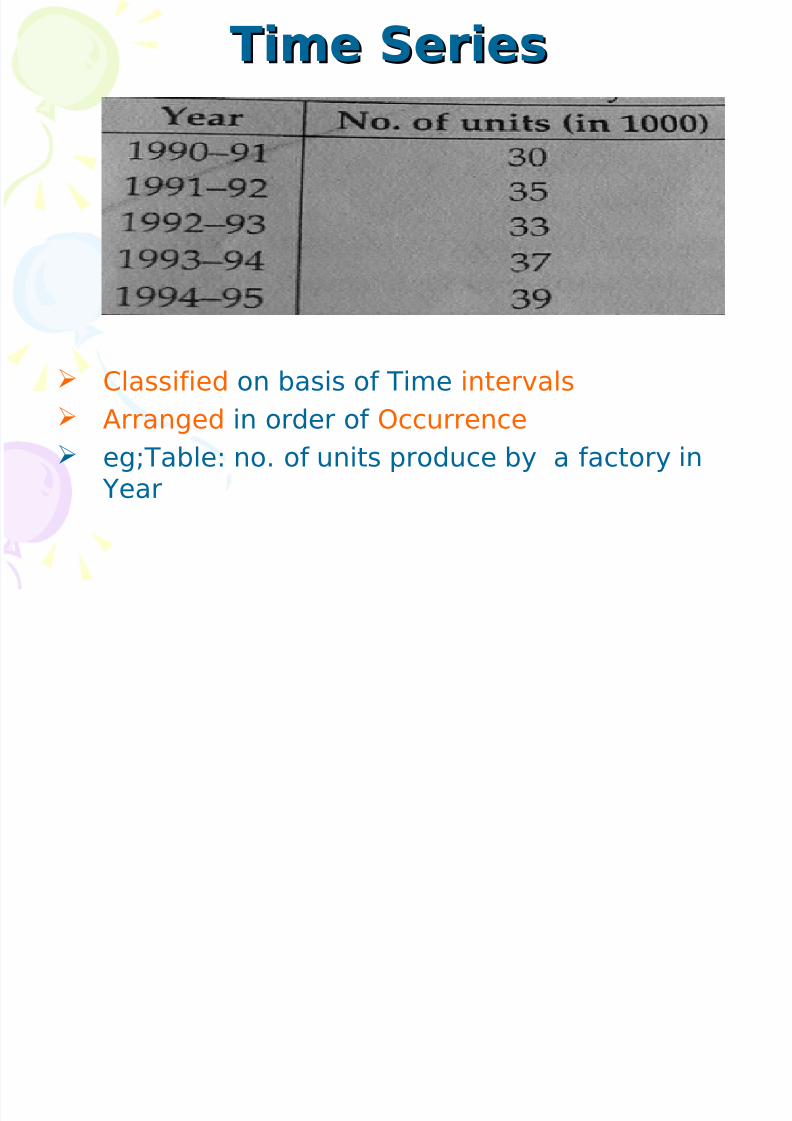
Time SeriesTime Series
Classified on basis of Time intervals
Arranged in order of Occurrence eg;Table: no. of units produce by a factory in
Year
8/14/2019 Presenting QM
http://slidepdf.com/reader/full/presenting-qm 12/26
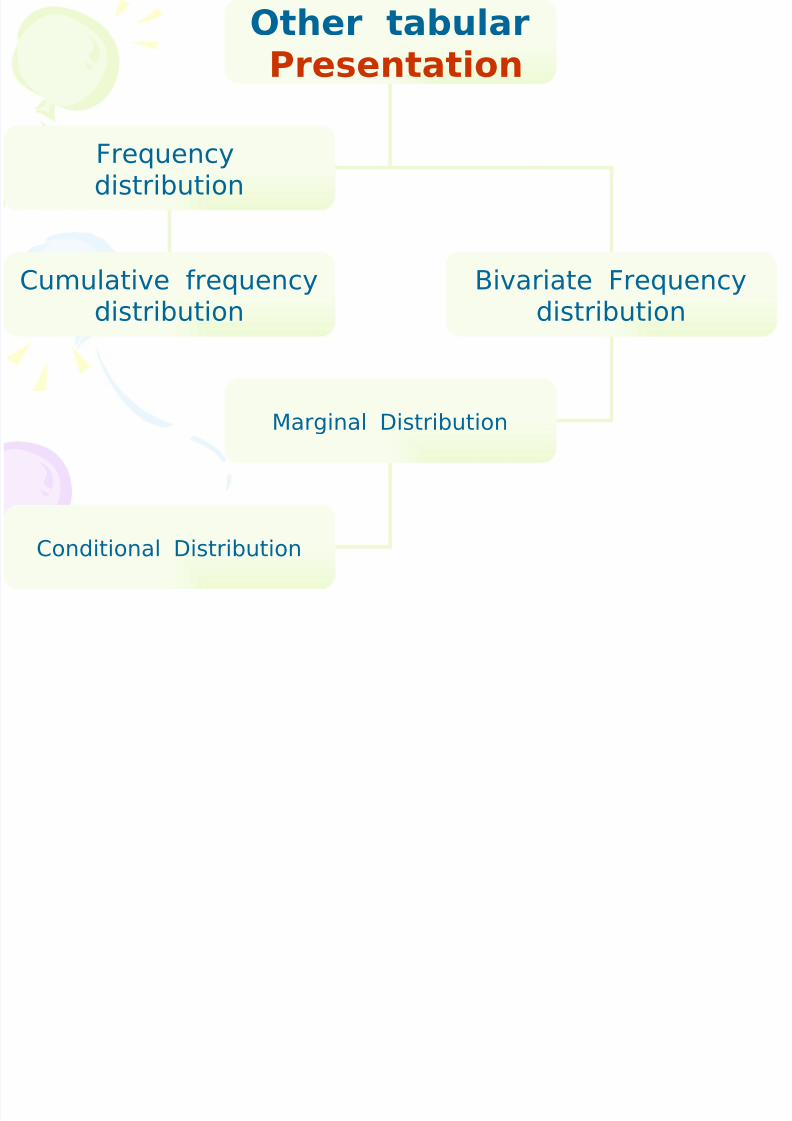
Other tabular Presentation
Cumulative frequencydistribution
Bivariate Frequencydistribution
Frequencydistribution
Marginal Distribution
Conditional Distribution
8/14/2019 Presenting QM
http://slidepdf.com/reader/full/presenting-qm 13/26
Frequency DistributionFrequency Distribution Frequency Table: different class intervals
known as Frequency Table
Frequency Distribution: total no of
observation over different class intervalsDiscrete Distribution: each class is
denoted by numbers
Continuous Distribution: continuity of thevalues of the variable
C l iC l ti F
8/14/2019 Presenting QM
http://slidepdf.com/reader/full/presenting-qm 14/26
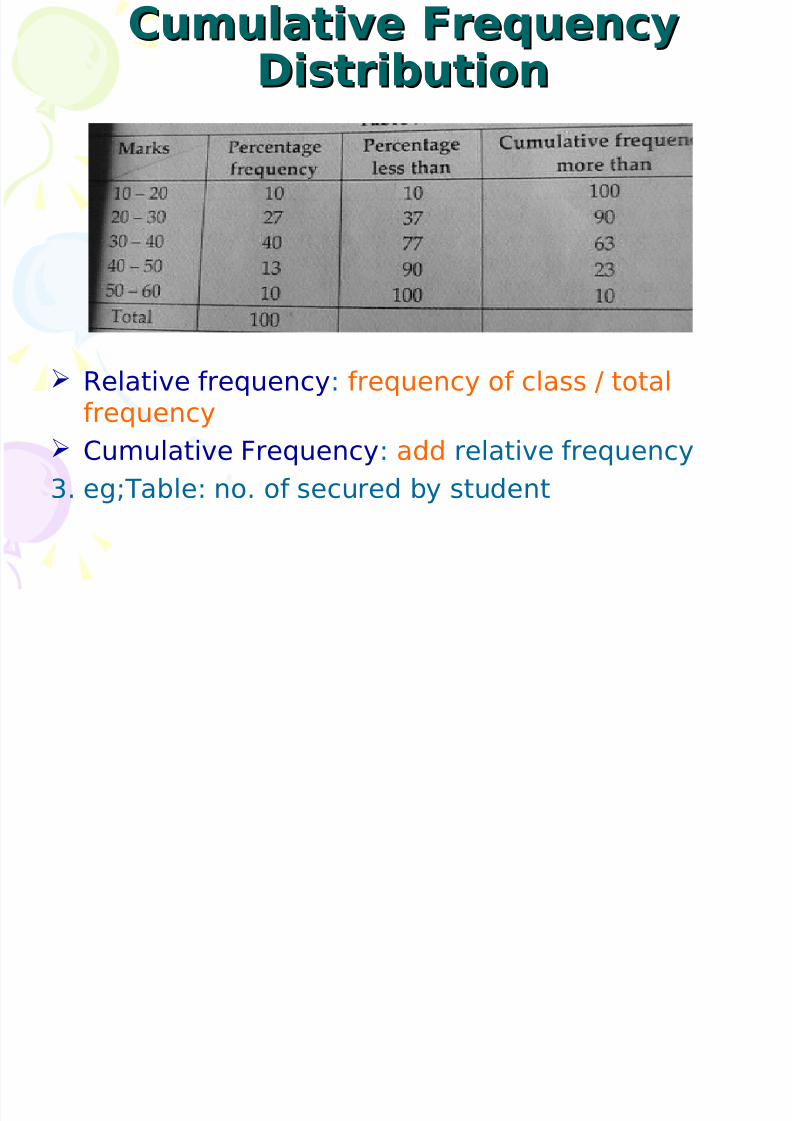
Cumulative FrequencyCumulative FrequencyDistributionDistribution
Relative frequency: frequency of class / total
frequency Cumulative Frequency: add relative frequency
3. eg;Table: no. of secured by student
8/14/2019 Presenting QM
http://slidepdf.com/reader/full/presenting-qm 15/26
Bivariate FrequencyBivariate FrequencyDistributionDistribution
It is used in case where more than one things have to be considered.
Two types of Bivariate Frequency Distribution:
Marginal Distribution Conditional Distribution
B t F

8/14/2019 Presenting QM
http://slidepdf.com/reader/full/presenting-qm 16/26
B var ate Frequencyvar a e requencyDistributionDistribution
1st Type of Bivariate Frequency Distribution:-
Marginal Distribution: class intervalcorresponding to the data & correspondingrows
eg;Table : no. of marks secured in sub.
8/14/2019 Presenting QM
http://slidepdf.com/reader/full/presenting-qm 17/26
GraphicalGraphical PresentationPresentation
Easy to understand
Effective & Efficient compared to TextPresentation
Limited set of data can be easily understand Graphical Presentation are of two type:
Co-ordinates of Point
Representing Frequency Distribution
8/14/2019 Presenting QM
http://slidepdf.com/reader/full/presenting-qm 18/26
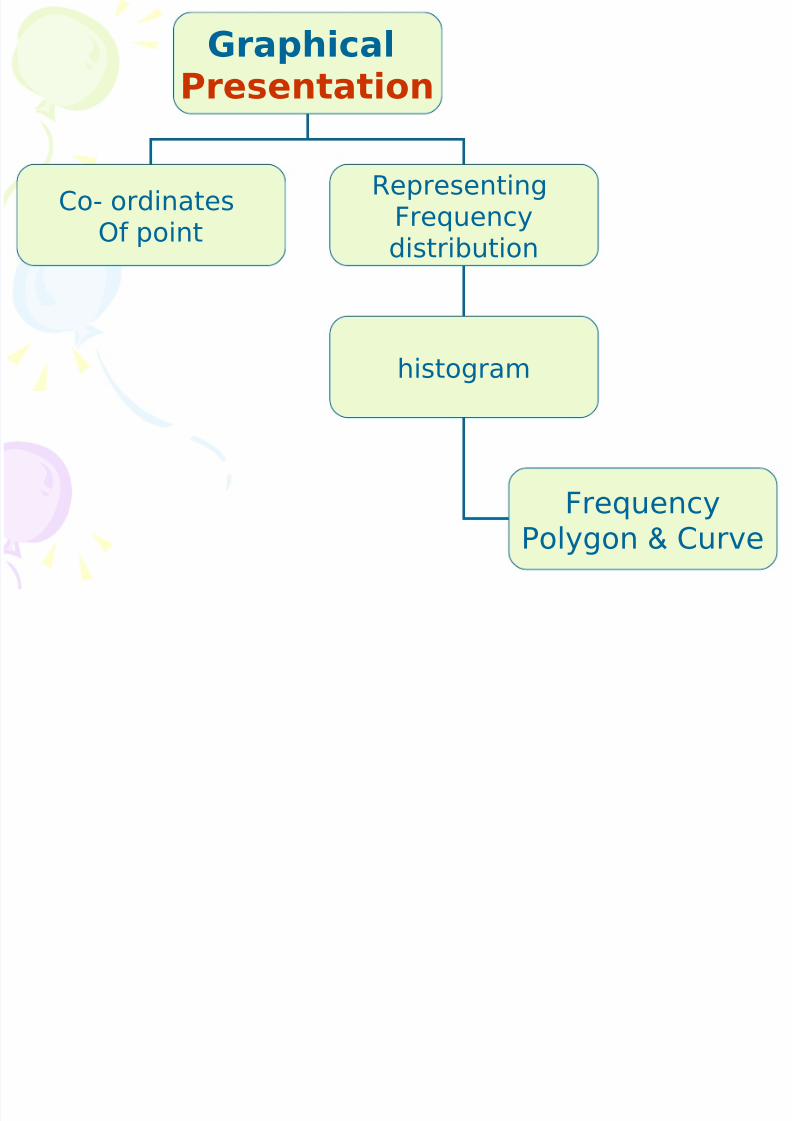
GraphicalPresentation
Co- ordinatesOf point
RepresentingFrequencydistribution
histogram
FrequencyPolygon & Curve

8/14/2019 Presenting QM
http://slidepdf.com/reader/full/presenting-qm 19/26
GraphicalGraphical PresentationPresentation 1st type of
RepresentingFrequencyDistribution:-
Histogram: bar chartrepresenting afrequencydistribution i.e.
height of barsrepresent observedgraph
3. eg;Table: no. of
marks secured bystudent
8/14/2019 Presenting QM
http://slidepdf.com/reader/full/presenting-qm 20/26
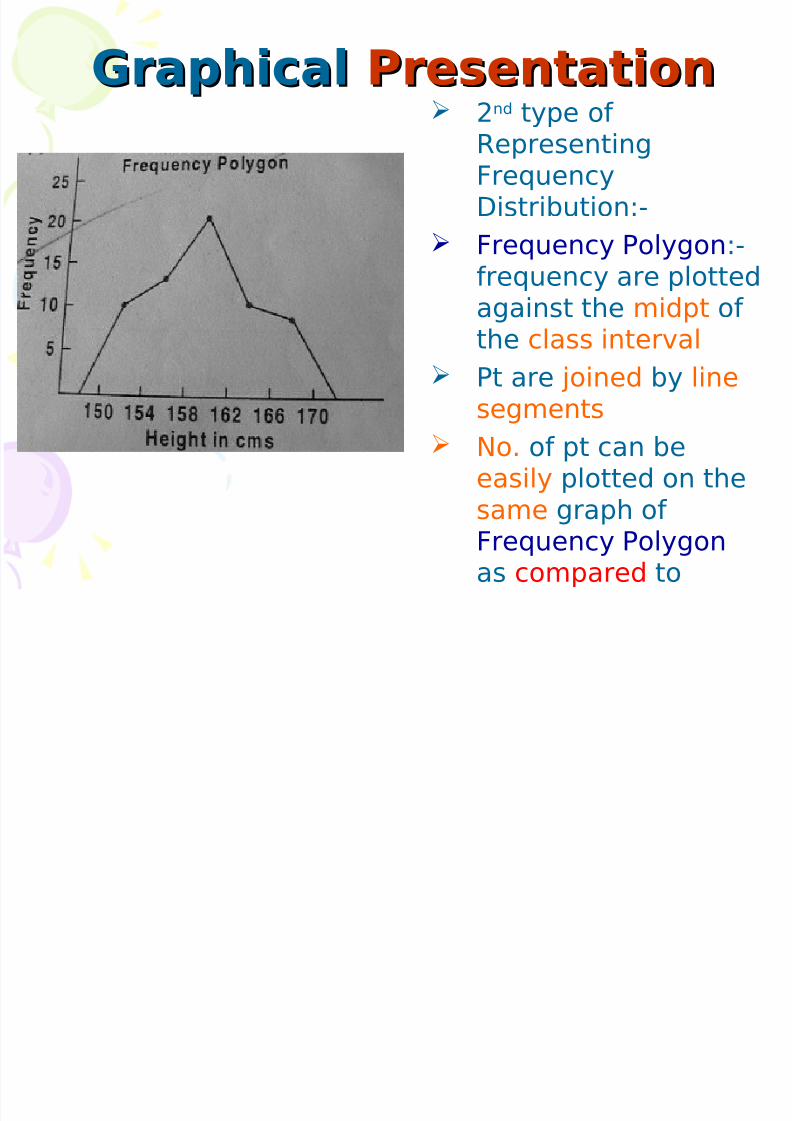
GraphicalGraphical PresentationPresentation 2nd type of
RepresentingFrequencyDistribution:-
Frequency Polygon:-
frequency are plottedagainst the midpt of the class interval
Pt are joined by line
segments No. of pt can be
easily plotted on thesame graph of
Frequency Polygon as compared to
8/14/2019 Presenting QM
http://slidepdf.com/reader/full/presenting-qm 21/26
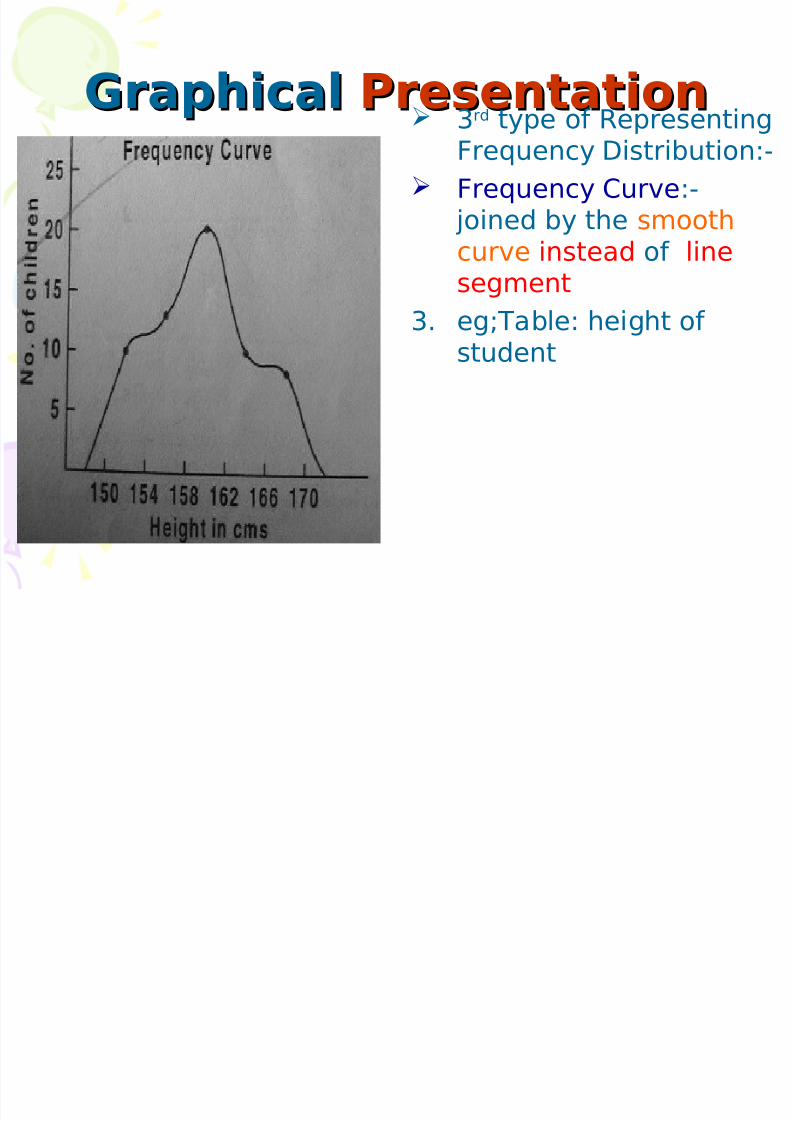
GraphicalGraphical PresentationPresentation 3rd type of Representing
Frequency Distribution:-
Frequency Curve:- joined by the smoothcurve instead of line
segment3. eg;Table: height of
student
ummaryummary
8/14/2019 Presenting QM
http://slidepdf.com/reader/full/presenting-qm 22/26
ummaryummary
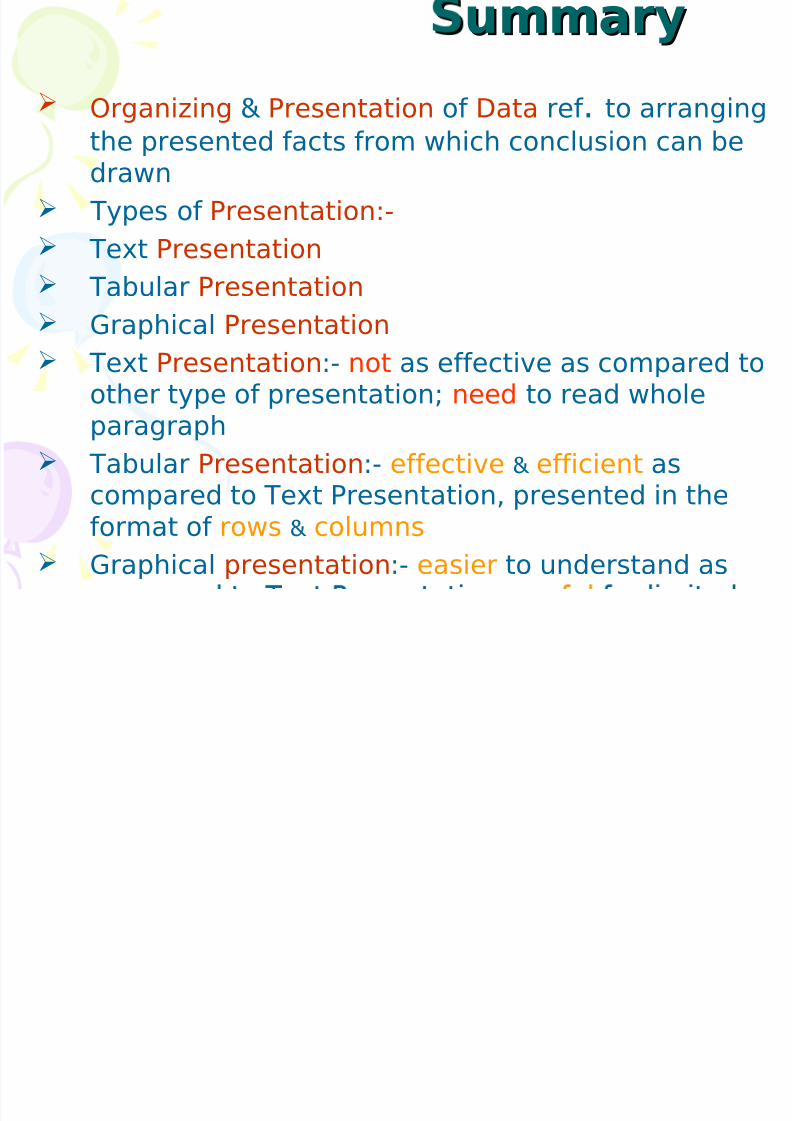
Organizing & Presentation of Data ref . to arranging
the presented facts from which conclusion can bedrawn
Types of Presentation:-
Text Presentation
Tabular Presentation
Graphical Presentation
Text Presentation:- not as effective as compared toother type of presentation; need to read whole
paragraph
Tabular Presentation:- effective & efficient ascompared to Text Presentation, presented in theformat of rows & columns
Graphical presentation:- easier to understand as
8/14/2019 Presenting QM
http://slidepdf.com/reader/full/presenting-qm 23/26
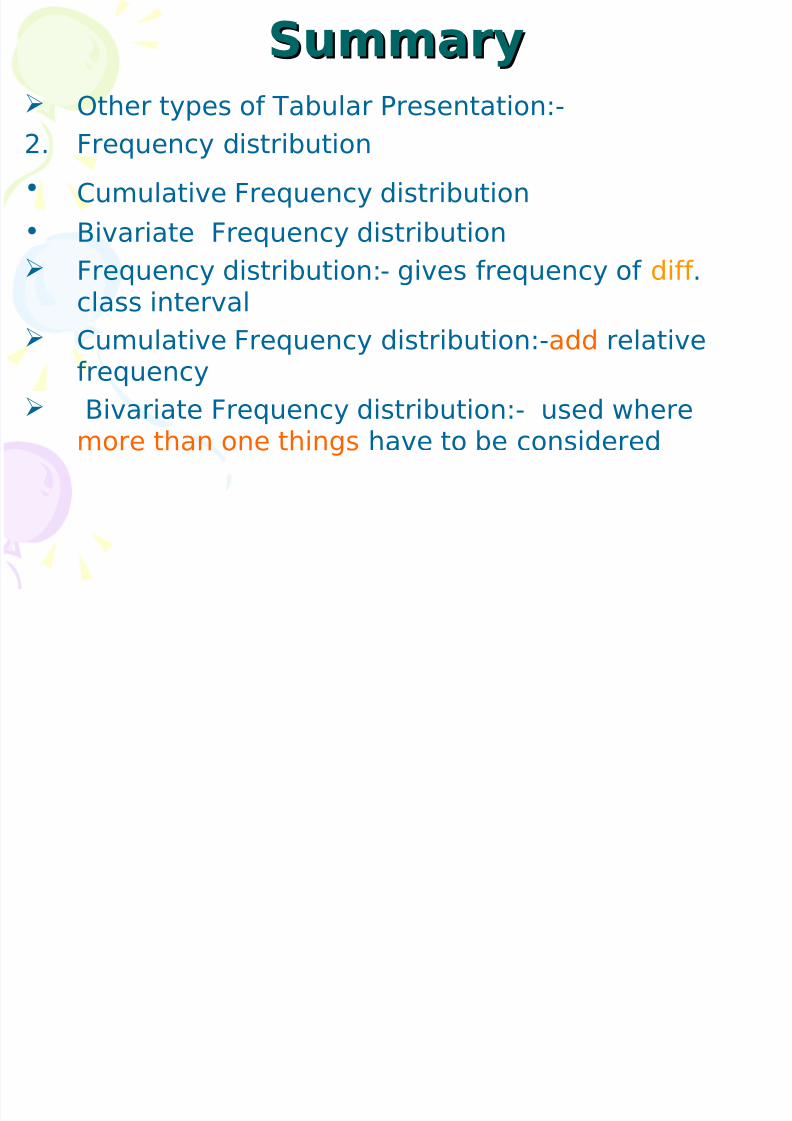
SummarySummary Other types of Tabular Presentation:-
2. Frequency distribution
• Cumulative Frequency distribution
• Bivariate Frequency distribution
Frequency distribution:- gives frequency of diff .class interval
Cumulative Frequency distribution:-add relativefrequency
Bivariate Frequency distribution:- used where
more than one things have to be considered

8/14/2019 Presenting QM
http://slidepdf.com/reader/full/presenting-qm 24/26
Bib-blographyBib-blography Quantitative Methods – 1
2. A.V.Deshpande
3. M.L. Vaidya
4. A.P.Kumtha

8/14/2019 Presenting QM
http://slidepdf.com/reader/full/presenting-qm 25/26
Thanks to mrs S. RAO
8/14/2019 Presenting QM
http://slidepdf.com/reader/full/presenting-qm 26/26
:-:-
• Mohit.M 25
• Pratik.K 18• Kunal.S 41
• Atul.S 40
• Amar. J 13• Pawan.K 17