Embed Size (px)
Citation preview
Produced in conjunction with the China Tourist Hotel Association | 2014Hotels & Hospitality Group
China Hotel Market Overview 2014

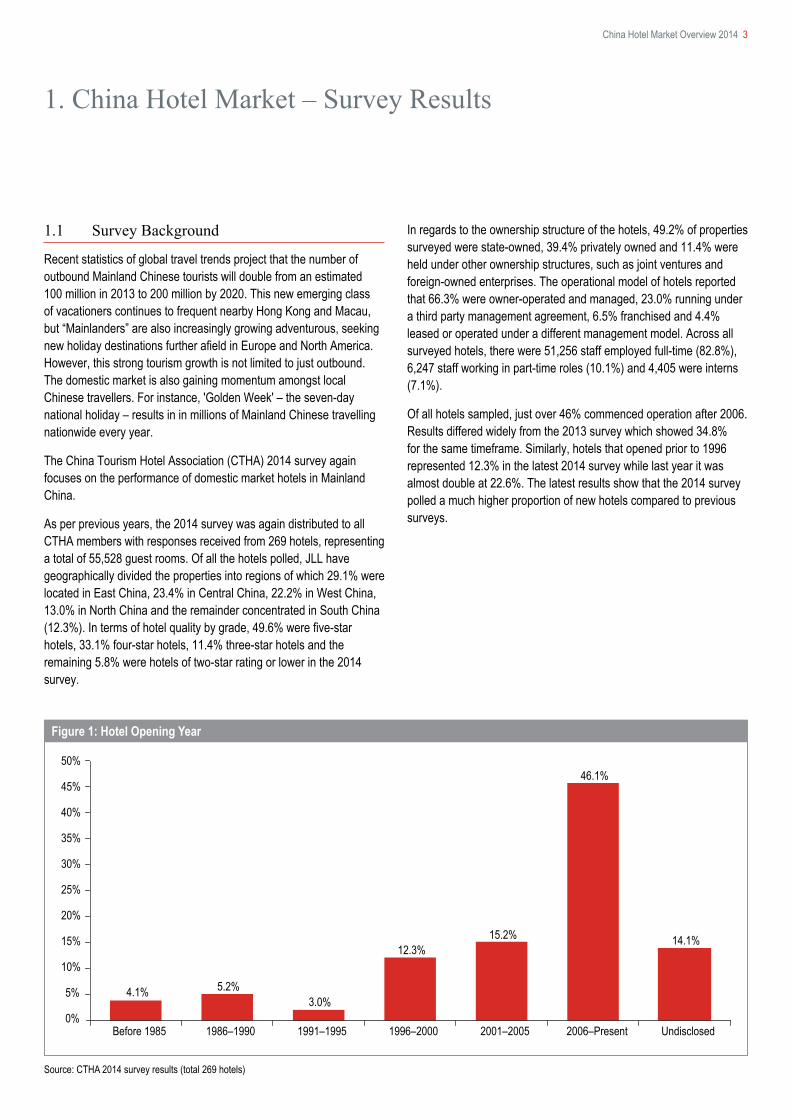
Figure 1: Hotel Opening Year
Source: CTHA 2014 survey results (total 269 hotels)
4.1% 5.2%3.0%
12.3%15.2%
46.1%
14.1%
0%
5%
10%
15%
20%
25%
30%
35%
50%
40%
45%
Before 1985 1986–1990 Undisclosed2006–Present2001–20051996–20001991–1995
China Hotel Market Overview 2014 3
1.1 Survey Background
Recent statistics of global travel trends project that the number of outbound Mainland Chinese tourists will double from an estimated 100 million in 2013 to 200 million by 2020. This new emerging class of vacationers continues to frequent nearby Hong Kong and Macau, but “Mainlanders” are also increasingly growing adventurous, seeking new holiday destinations further afield in Europe and North America. However, this strong tourism growth is not limited to just outbound. The domestic market is also gaining momentum amongst local Chinese travellers. For instance, 'Golden Week' – the seven-day national holiday – results in in millions of Mainland Chinese travelling nationwide every year.
The China Tourism Hotel Association (CTHA) 2014 survey again focuses on the performance of domestic market hotels in Mainland China.
As per previous years, the 2014 survey was again distributed to all CTHA members with responses received from 269 hotels, representing a total of 55,528 guest rooms. Of all the hotels polled, JLL have geographically divided the properties into regions of which 29.1% were located in East China, 23.4% in Central China, 22.2% in West China, 13.0% in North China and the remainder concentrated in South China (12.3%). In terms of hotel quality by grade, 49.6% were five-star hotels, 33.1% four-star hotels, 11.4% three-star hotels and the remaining 5.8% were hotels of two-star rating or lower in the 2014 survey.
1. China Hotel Market – Survey Results
In regards to the ownership structure of the hotels, 49.2% of properties surveyed were state-owned, 39.4% privately owned and 11.4% were held under other ownership structures, such as joint ventures and foreign-owned enterprises. The operational model of hotels reported that 66.3% were owner-operated and managed, 23.0% running under a third party management agreement, 6.5% franchised and 4.4% leased or operated under a different management model. Across all surveyed hotels, there were 51,256 staff employed full-time (82.8%), 6,247 staff working in part-time roles (10.1%) and 4,405 were interns (7.1%).
Of all hotels sampled, just over 46% commenced operation after 2006. Results differed widely from the 2013 survey which showed 34.8% for the same timeframe. Similarly, hotels that opened prior to 1996 represented 12.3% in the latest 2014 survey while last year it was almost double at 22.6%. The latest results show that the 2014 survey polled a much higher proportion of new hotels compared to previous surveys.
Source: CTHA 2014 survey results (total 269 hotels)*Estimates provided in 2014 survey
Source: CTHA 2014 survey results (total 269 hotels)*Estimates provided in 2014 survey
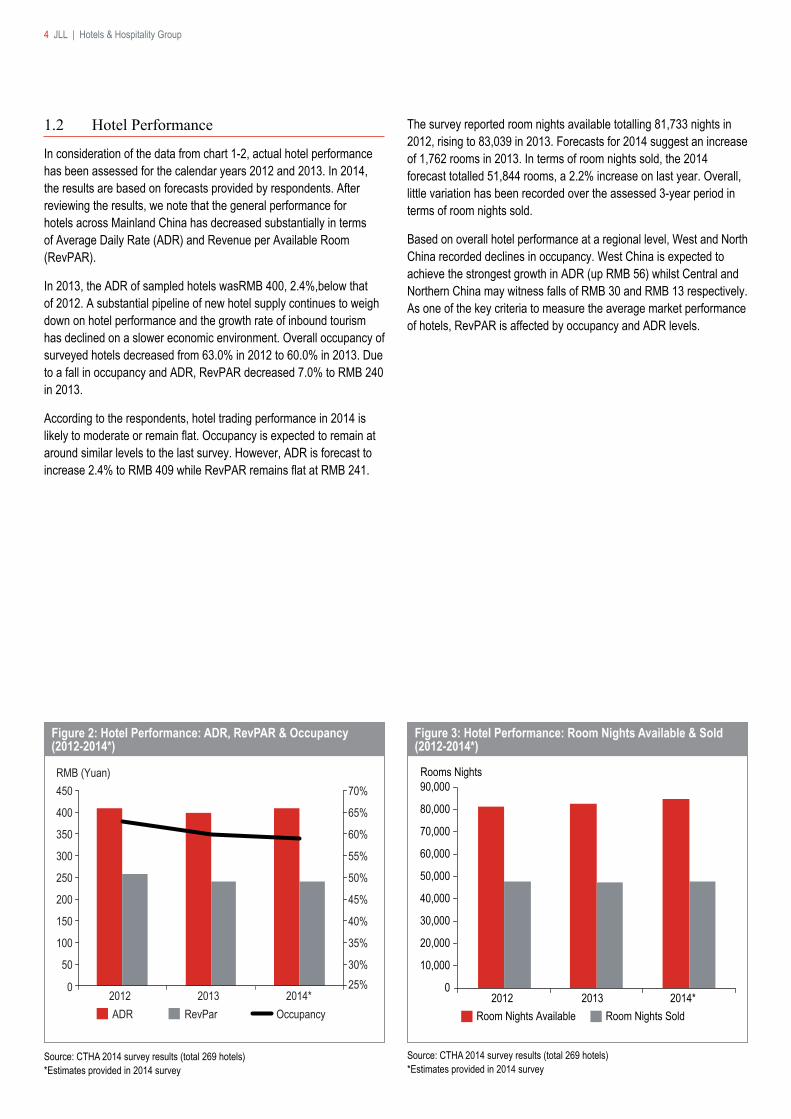
Figure 2: Hotel Performance: ADR, RevPAR & Occupancy (2012-2014*)
Figure 3: Hotel Performance: Room Nights Available & Sold (2012-2014*)
25%30%
35%
40%
45%
50%
60%
70%
55%
65%
0
150
100
50
200
250
300
350
400
450
2012
RMB (Yuan)
ADR RevPar Occupancy2014*2013
0
90,000
20132012
Rooms Nights
10,000
20,000
30,000
40,000
50,000
60,000
70,000
80,000
Room Nights Available Room Nights Sold2014*
4 JLL | Hotels & Hospitality Group
1.2 Hotel Performance
In consideration of the data from chart 1-2, actual hotel performance has been assessed for the calendar years 2012 and 2013. In 2014, the results are based on forecasts provided by respondents. After reviewing the results, we note that the general performance for hotels across Mainland China has decreased substantially in terms of Average Daily Rate (ADR) and Revenue per Available Room (RevPAR).
In 2013, the ADR of sampled hotels wasRMB 400, 2.4%,below that of 2012. A substantial pipeline of new hotel supply continues to weigh down on hotel performance and the growth rate of inbound tourism has declined on a slower economic environment. Overall occupancy of surveyed hotels decreased from 63.0% in 2012 to 60.0% in 2013. Due to a fall in occupancy and ADR, RevPAR decreased 7.0% to RMB 240 in 2013.
According to the respondents, hotel trading performance in 2014 is likely to moderate or remain flat. Occupancy is expected to remain at around similar levels to the last survey. However, ADR is forecast to increase 2.4% to RMB 409 while RevPAR remains flat at RMB 241.
The survey reported room nights available totalling 81,733 nights in 2012, rising to 83,039 in 2013. Forecasts for 2014 suggest an increase of 1,762 rooms in 2013. In terms of room nights sold, the 2014 forecast totalled 51,844 rooms, a 2.2% increase on last year. Overall, little variation has been recorded over the assessed 3-year period in terms of room nights sold.
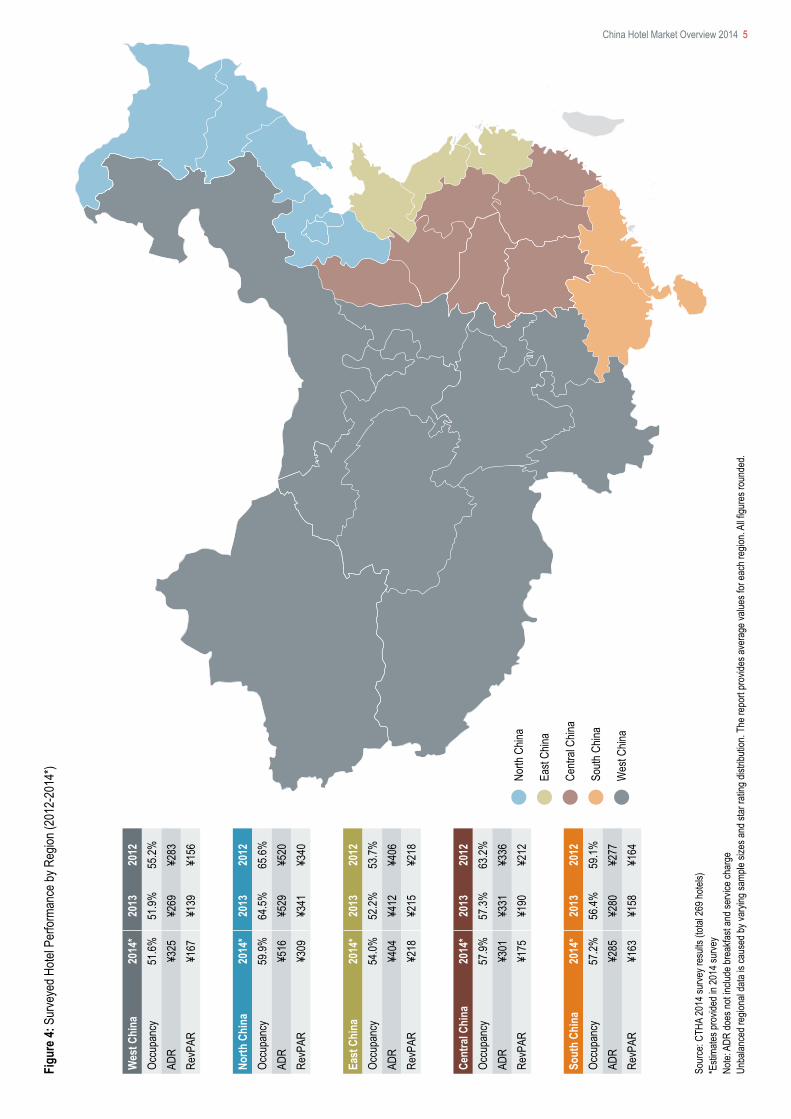
Based on overall hotel performance at a regional level, West and North China recorded declines in occupancy. West China is expected to achieve the strongest growth in ADR (up RMB 56) whilst Central and Northern China may witness falls of RMB 30 and RMB 13 respectively. As one of the key criteria to measure the average market performance of hotels, RevPAR is affected by occupancy and ADR levels.
North
Chin
a
East
China
Centr
al Ch
ina
South
Chin
a
Wes
t Chin
a
Figu
re 4:
Sur
veye
d Hote
l Per
forma
nce b
y Reg
ion (2
012-
2014
*)
Sour
ce: C
THA
2014
surve
y res
ults (
total
269 h
otels)
*E
stima
tes pr
ovide
d in 2
014 s
urve
yNo
te: A
DR do
es no
t inclu
de br
eakfa
st an
d ser
vice c
harg
eUn
balan
ced r
egion
al da
ta is
caus
ed by
varyi
ng sa
mple
sizes
and s
tar ra
ting d
istrib
ution
. The
repo
rt pr
ovide
s ave
rage
value
s for
each
regio
n. Al
l figu
res r
ound
ed.
North
Chi
na20
14*
2013
2012
Occu
panc
y59
.9%64
.5%65
.6%AD
R¥5
16¥5
29¥5
20Re
vPAR
¥309
¥341
¥340
East
Chi
na20
14*
2013
2012
Occu
panc
y54
.0%52
.2%53
.7%AD
R¥4
04¥4
12¥4
06Re
vPAR
¥218
¥215
¥218
Sout
h Ch
ina
2014
*20
1320
12Oc
cupa
ncy
57.2%
56.4%
59.1%
ADR
¥285
¥280
¥277
RevP
AR¥1
63¥1
58¥1
64
Wes
t Chi
na20
14*
2013
2012
Occu
panc
y51
.6%51
.9%55
.2%AD
R¥3
25¥2
69¥2
83Re
vPAR
¥167
¥139
¥156
Cent
ral C
hina
2014
*20
1320
12Oc
cupa
ncy
57.9%
57.3%
63.2%
ADR
¥301
¥331
¥336
RevP
AR¥1
75¥1
90¥2
12No
rth C
hina
East
Chin a
Centr
al Ch
ina
South
Chin
a
Wes
t Chin
a
China Hotel Market Overview 2014 5
Source: CTHA 2014 survey results (total 269 hotels)
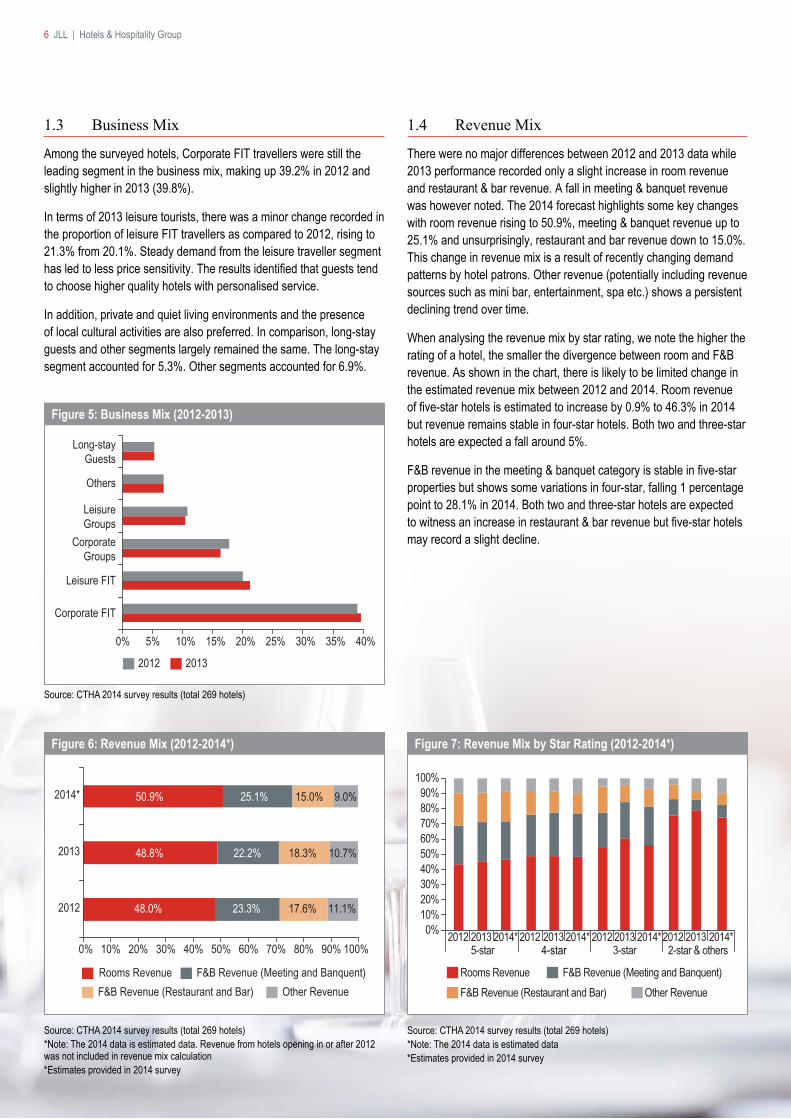
Figure 5: Business Mix (2012-2013)
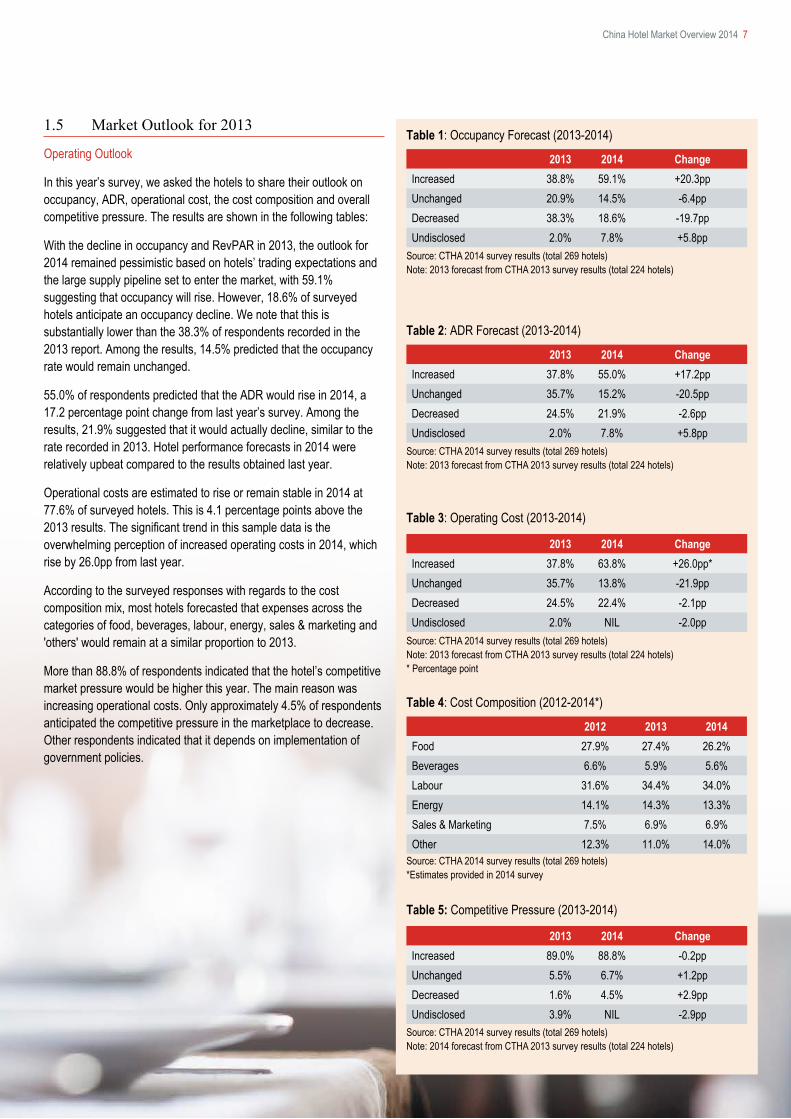
Figure 6: Revenue Mix (2012-2014*)
Source: CTHA 2014 survey results (total 269 hotels)*Note: The 2014 data is estimated data. Revenue from hotels opening in or after 2012 was not included in revenue mix calculation*Estimates provided in 2014 survey
Figure 7: Revenue Mix by Star Rating (2012-2014*)
Source: CTHA 2014 survey results (total 269 hotels)*Note: The 2014 data is estimated data*Estimates provided in 2014 survey
0%
Corporate FIT
CorporateGroups
Leisure FIT
Others
LeisureGroups
Long-stayGuests
2012 2013
40%35%30%25%20%15%10%5%
0% 100%
2012
2013
2014*
Rooms Revenue F&B Revenue (Meeting and Banquent)F&B Revenue (Restaurant and Bar) Other Revenue
23.3%
22.2%
25.1%
48.0%
48.8%
50.9%
17.6%
18.3%
15.0%
11.1%
10.7%
9.0%
90%80%70%60%50%40%30%20%10%0%
10%20%30%40%50%60%70%80%90%
100%
2012 20135-star 4-star 3-star 2-star & others
Rooms Revenue F&B Revenue (Meeting and Banquent)F&B Revenue (Restaurant and Bar) Other Revenue
2014*20122014*201320122014*201320122014*2013
6 JLL | Hotels & Hospitality Group
1.3 Business Mix
Among the surveyed hotels, Corporate FIT travellers were still the leading segment in the business mix, making up 39.2% in 2012 and slightly higher in 2013 (39.8%).
In terms of 2013 leisure tourists, there was a minor change recorded in the proportion of leisure FIT travellers as compared to 2012, rising to 21.3% from 20.1%. Steady demand from the leisure traveller segment has led to less price sensitivity. The results identified that guests tend to choose higher quality hotels with personalised service.
In addition, private and quiet living environments and the presence of local cultural activities are also preferred. In comparison, long-stay guests and other segments largely remained the same. The long-stay segment accounted for 5.3%. Other segments accounted for 6.9%.
1.4 Revenue Mix
There were no major differences between 2012 and 2013 data while 2013 performance recorded only a slight increase in room revenue and restaurant & bar revenue. A fall in meeting & banquet revenue was however noted. The 2014 forecast highlights some key changes with room revenue rising to 50.9%, meeting & banquet revenue up to 25.1% and unsurprisingly, restaurant and bar revenue down to 15.0%. This change in revenue mix is a result of recently changing demand patterns by hotel patrons. Other revenue (potentially including revenue sources such as mini bar, entertainment, spa etc.) shows a persistent declining trend over time.
When analysing the revenue mix by star rating, we note the higher the rating of a hotel, the smaller the divergence between room and F&B revenue. As shown in the chart, there is likely to be limited change in the estimated revenue mix between 2012 and 2014. Room revenue of five-star hotels is estimated to increase by 0.9% to 46.3% in 2014 but revenue remains stable in four-star hotels. Both two and three-star hotels are expected a fall around 5%.
F&B revenue in the meeting & banquet category is stable in five-star properties but shows some variations in four-star, falling 1 percentage point to 28.1% in 2014. Both two and three-star hotels are expected to witness an increase in restaurant & bar revenue but five-star hotels may record a slight decline.
2013 2014 ChangeIncreased 37.8% 63.8% +26.0pp*Unchanged 35.7% 13.8% -21.9ppDecreased 24.5% 22.4% -2.1ppUndisclosed 2.0% NIL -2.0pp
Source: CTHA 2014 survey results (total 269 hotels) Note: 2013 forecast from CTHA 2013 survey results (total 224 hotels)* Percentage point
Table 3: Operating Cost (2013-2014)
Table 1: Occupancy Forecast (2013-2014)
Source: CTHA 2014 survey results (total 269 hotels)Note: 2013 forecast from CTHA 2013 survey results (total 224 hotels)
2013 2014 ChangeIncreased 38.8% 59.1% +20.3ppUnchanged 20.9% 14.5% -6.4ppDecreased 38.3% 18.6% -19.7ppUndisclosed 2.0% 7.8% +5.8pp
Source: CTHA 2014 survey results (total 269 hotels) Note: 2013 forecast from CTHA 2013 survey results (total 224 hotels)
2013 2014 ChangeIncreased 37.8% 55.0% +17.2ppUnchanged 35.7% 15.2% -20.5ppDecreased 24.5% 21.9% -2.6ppUndisclosed 2.0% 7.8% +5.8pp
Table 2: ADR Forecast (2013-2014)
Source: CTHA 2014 survey results (total 269 hotels)*Estimates provided in 2014 survey
2012 2013 2014Food 27.9% 27.4% 26.2%Beverages 6.6% 5.9% 5.6%Labour 31.6% 34.4% 34.0%Energy 14.1% 14.3% 13.3%Sales & Marketing 7.5% 6.9% 6.9%Other 12.3% 11.0% 14.0%
Table 4: Cost Composition (2012-2014*)
Source: CTHA 2014 survey results (total 269 hotels)Note: 2014 forecast from CTHA 2013 survey results (total 224 hotels)
2013 2014 ChangeIncreased 89.0% 88.8% -0.2ppUnchanged 5.5% 6.7% +1.2ppDecreased 1.6% 4.5% +2.9ppUndisclosed 3.9% NIL -2.9pp
Table 5: Competitive Pressure (2013-2014)
China Hotel Market Overview 2014 7
1.5 Market Outlook for 2013
Operating Outlook
In this year’s survey, we asked the hotels to share their outlook on occupancy, ADR, operational cost, the cost composition and overall competitive pressure. The results are shown in the following tables:
With the decline in occupancy and RevPAR in 2013, the outlook for 2014 remained pessimistic based on hotels’ trading expectations and the large supply pipeline set to enter the market, with 59.1% suggesting that occupancy will rise. However, 18.6% of surveyed hotels anticipate an occupancy decline. We note that this is substantially lower than the 38.3% of respondents recorded in the 2013 report. Among the results, 14.5% predicted that the occupancy rate would remain unchanged.
55.0% of respondents predicted that the ADR would rise in 2014, a 17.2 percentage point change from last year’s survey. Among the results, 21.9% suggested that it would actually decline, similar to the rate recorded in 2013. Hotel performance forecasts in 2014 were relatively upbeat compared to the results obtained last year.
Operational costs are estimated to rise or remain stable in 2014 at 77.6% of surveyed hotels. This is 4.1 percentage points above the 2013 results. The significant trend in this sample data is the overwhelming perception of increased operating costs in 2014, which rise by 26.0pp from last year.
According to the surveyed responses with regards to the cost composition mix, most hotels forecasted that expenses across the categories of food, beverages, labour, energy, sales & marketing and 'others' would remain at a similar proportion to 2013.
More than 88.8% of respondents indicated that the hotel’s competitive market pressure would be higher this year. The main reason was increasing operational costs. Only approximately 4.5% of respondents anticipated the competitive pressure in the marketplace to decrease. Other respondents indicated that it depends on implementation of government policies.
Source: CTHA 2014 survey results (Total 269 hotels) Note: 2014 forecast from CTHA 2013 survey results (total 224 hotels)
Table 6: Guest Demand Drivers (2013-2014)
2013 2014Large scale meeting / activities / exhibitions 30.2% 30.1%Major tourism project developments / improvements 24.2% 25.4%Expansion of development / high-tech zones 15.2% 15.2%Development and expansion of transportation hub 15.0% 13.1%Increased office supply 9.7% 10.8%Increased government demand 5.8% 5.4%
Source: CTHA 2014 survey results (total 269 hotels)
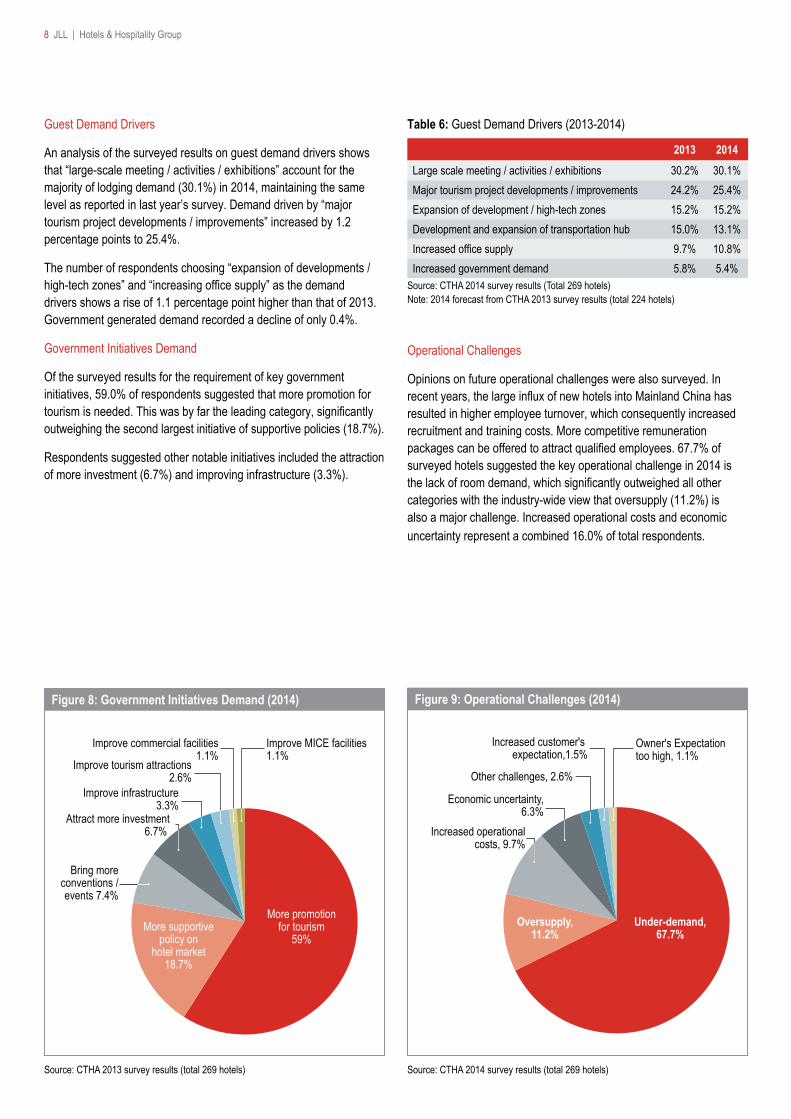
Figure 9: Operational Challenges (2014)
Source: CTHA 2013 survey results (total 269 hotels)
Figure 8: Government Initiatives Demand (2014)
Increased operationalcosts, 9.7%
Increased customer's expectation,1.5%
Other challenges, 2.6%
Economic uncertainty,6.3%
Owner's Expectationtoo high, 1.1%
Under-demand,67.7%
Oversupply,11.2%
More promotionfor tourism
59%More supportive
policy onhotel market
18.7%
Improve tourism attractions2.6%
Bring moreconventions /events 7.4%
Attract more investment6.7%
Improve commercial facilities1.1%
Improve infrastructure3.3%
Improve MICE facilities1.1%
8 JLL | Hotels & Hospitality Group
Guest Demand Drivers
An analysis of the surveyed results on guest demand drivers shows that “large-scale meeting / activities / exhibitions” account for the majority of lodging demand (30.1%) in 2014, maintaining the same level as reported in last year’s survey. Demand driven by “major tourism project developments / improvements” increased by 1.2 percentage points to 25.4%.
The number of respondents choosing “expansion of developments / high-tech zones” and “increasing office supply” as the demand drivers shows a rise of 1.1 percentage point higher than that of 2013. Government generated demand recorded a decline of only 0.4%.
Government Initiatives Demand
Of the surveyed results for the requirement of key government initiatives, 59.0% of respondents suggested that more promotion for tourism is needed. This was by far the leading category, significantly outweighing the second largest initiative of supportive policies (18.7%).
Respondents suggested other notable initiatives included the attraction of more investment (6.7%) and improving infrastructure (3.3%).
Operational Challenges
Opinions on future operational challenges were also surveyed. In recent years, the large influx of new hotels into Mainland China has resulted in higher employee turnover, which consequently increased recruitment and training costs. More competitive remuneration packages can be offered to attract qualified employees. 67.7% of surveyed hotels suggested the key operational challenge in 2014 is the lack of room demand, which significantly outweighed all other categories with the industry-wide view that oversupply (11.2%) is also a major challenge. Increased operational costs and economic uncertainty represent a combined 16.0% of total respondents.
1.6 Market Outlook
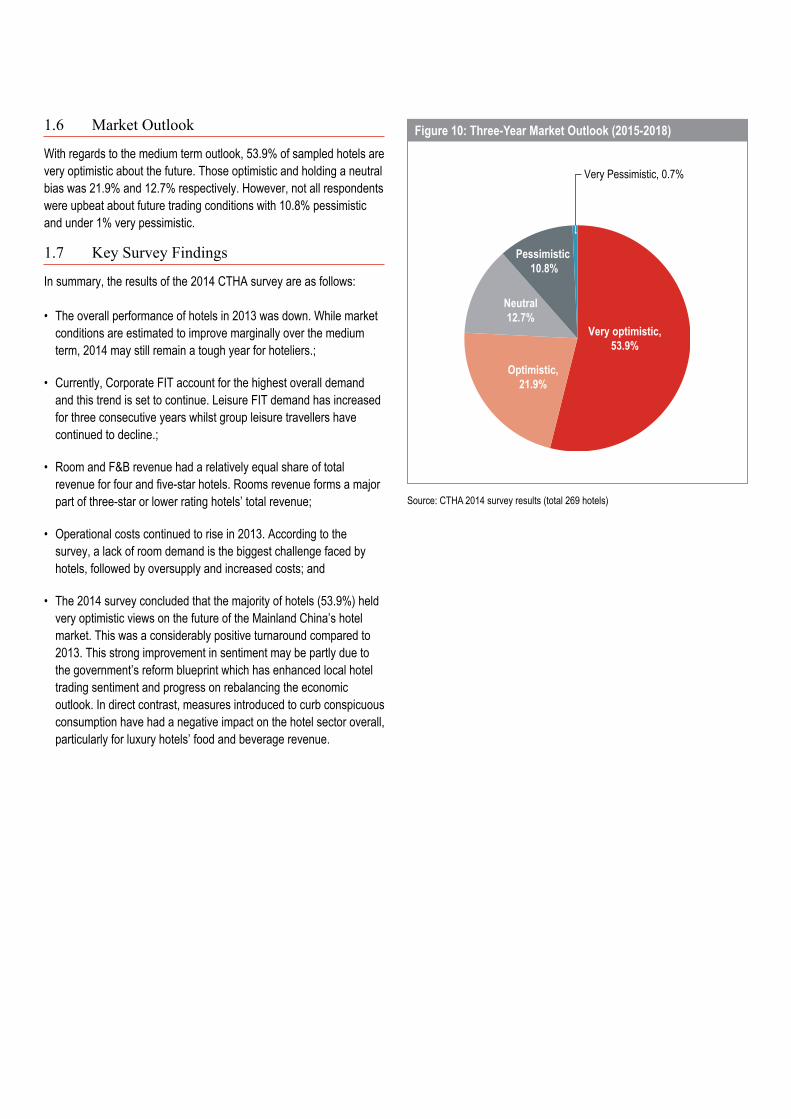
With regards to the medium term outlook, 53.9% of sampled hotels are very optimistic about the future. Those optimistic and holding a neutral bias was 21.9% and 12.7% respectively. However, not all respondents were upbeat about future trading conditions with 10.8% pessimistic and under 1% very pessimistic.
1.7 Key Survey Findings
In summary, the results of the 2014 CTHA survey are as follows:
• The overall performance of hotels in 2013 was down. While market conditions are estimated to improve marginally over the medium term, 2014 may still remain a tough year for hoteliers.;
• Currently, Corporate FIT account for the highest overall demand and this trend is set to continue. Leisure FIT demand has increased for three consecutive years whilst group leisure travellers have continued to decline.;
• Room and F&B revenue had a relatively equal share of total revenue for four and five-star hotels. Rooms revenue forms a major part of three-star or lower rating hotels’ total revenue;
• Operational costs continued to rise in 2013. According to the survey, a lack of room demand is the biggest challenge faced by hotels, followed by oversupply and increased costs; and
• The 2014 survey concluded that the majority of hotels (53.9%) held very optimistic views on the future of the Mainland China’s hotel market. This was a considerably positive turnaround compared to 2013. This strong improvement in sentiment may be partly due to the government’s reform blueprint which has enhanced local hotel trading sentiment and progress on rebalancing the economic outlook. In direct contrast, measures introduced to curb conspicuous consumption have had a negative impact on the hotel sector overall, particularly for luxury hotels’ food and beverage revenue.
Figure 10: Three-Year Market Outlook (2015-2018)
Source: CTHA 2014 survey results (total 269 hotels)
Very Pessimistic, 0.7%
Optimistic,21.9%
Neutral12.7%
Pessimistic 10.8%
Very optimistic,53.9%
10 JLL | Hotels & Hospitality Group
2.1 Selected Cities
Based on “China 50,” JLL’s World-Winning Cities Research Programme focusing on 50 cities across Mainland China that will offer substantial commercial real estate opportunities over the next decade, we have selected 38 cities of Tiers 1, 1.5, 2, 3, and 3.5, and three other uncovered provincial capitals that we think are of great importance to understand the Mainland China’s hotel market. To analyse the supply and demand factors of the hotel market, we will review the China market first and then take a closer look at the following 41 cities.
2. Mainland China Hotel Market – Supply & Demand Factors
Note: Ranking according to China 50, JLL
Table 7: 41 Cities
Tier 1 Tier 1.5 Tier 2 Tier 3 Tier 3.5 Other Provincial Capitals
Beijing Chongqing Hangzhou Hefei Zhengzhou Kunming Nanchang Taiyuan Lhasa
Shanghai Tianjin Wuhan Qingdao Ningbo Hohhot Shijiazhuang Urumqi Yinchuan
Guangzhou Chengdu Shenyang Jinan Changsha Changchun Wenzhou Haikou Xining
Shenzhen Suzhou Dalian Dongguan Xiamen Foshan Fuzhou Lanzhou
Nanjing Wuxi Xi’an Nanning Harbin Guiyang
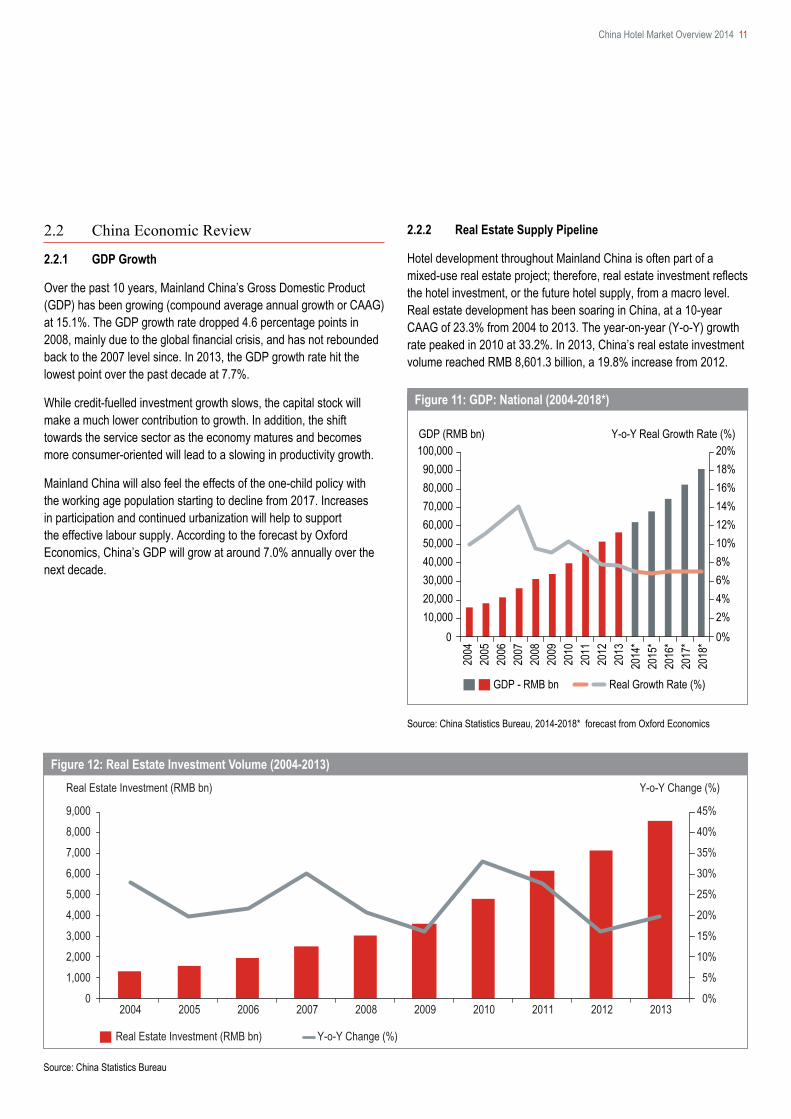
Figure 11: GDP: National (2004-2018*)
Source: China Statistics Bureau, 2014-2018* forecast from Oxford Economics
Figure 12: Real Estate Investment Volume (2004-2013)
Source: China Statistics Bureau
Y-o-Y Real Growth Rate (%)
2004
0 10,00020,00030,00040,00050,00060,00070,00080,00090,000
100,000GDP (RMB bn)
0%2%4%6%8%10%12%14%16%
20%18%
GDP - RMB bn Real Growth Rate (%)20
18*
2017
*20
16*
2015
*20
14*
2013
2012
2011
2010
2009
2008
2007
2006
2005
0%
5%
10%
15%
20%
25%
30%
35%
40%
45%
0
1,000
2,000
3,000
4,000
5,000
6,000
7,000
8,000
9,000
Y-o-Y Change (%)Real Estate Investment (RMB bn)
Real Estate Investment (RMB bn) Y-o-Y Change (%)
2004 201320122011201020092008200720062005
China Hotel Market Overview 2014 11
2.2 China Economic Review
2.2.1 GDP Growth
Over the past 10 years, Mainland China’s Gross Domestic Product (GDP) has been growing (compound average annual growth or CAAG) at 15.1%. The GDP growth rate dropped 4.6 percentage points in 2008, mainly due to the global financial crisis, and has not rebounded back to the 2007 level since. In 2013, the GDP growth rate hit the lowest point over the past decade at 7.7%.
While credit-fuelled investment growth slows, the capital stock will make a much lower contribution to growth. In addition, the shift towards the service sector as the economy matures and becomes more consumer-oriented will lead to a slowing in productivity growth.
Mainland China will also feel the effects of the one-child policy with the working age population starting to decline from 2017. Increases in participation and continued urbanization will help to support the effective labour supply. According to the forecast by Oxford Economics, China’s GDP will grow at around 7.0% annually over the next decade.
2.2.2 Real Estate Supply Pipeline
Hotel development throughout Mainland China is often part of a mixed-use real estate project; therefore, real estate investment reflects the hotel investment, or the future hotel supply, from a macro level. Real estate development has been soaring in China, at a 10-year CAAG of 23.3% from 2004 to 2013. The year-on-year (Y-o-Y) growth rate peaked in 2010 at 33.2%. In 2013, China’s real estate investment volume reached RMB 8,601.3 billion, a 19.8% increase from 2012.
Source: China National Tourism Administration
Figure 13: Domestic & International Visitor Arrivals (2004-2013)
Domestic Visitor Arrivals (mil) International Visitor Arrivals (mil)Y-o-Y Change (%) - Domestic Y-o-Y Change (%) - International
–5%
0%
5%
10%
15%
20%
25%
35%
30%
Y-o-Y Change (%)
0
1,000
500
1,500
2,000
2,500
3,000
3,500
4,000Visitor Arrivals to China (mil)
2004 201320122011201020092008200720062005
-20%
-15%
-10%
-5%
0%
5%
10%
15%
20%
25%
0
10%
20%
30%
40%
50%
60%
70%
80%
90%
Beijin
g
Yinc
huan
Haiko
uGu
angz
hou
Hohh
otSh
angh
aiUr
umqi
Shen
zhen
Guiya
ngJin
anTa
iyuan
Nanji
ngDo
nggu
anHa
ngzh
ou
Xi'an
Xiam
en
Harb
inLa
nzho
uCh
engd
uQi
ngda
oKu
nming
Tianji
nNa
nning
Wuh
anW
enzh
ou
Wux
iFu
zhou
Suzh
ouXi
ning
Ning
boSh
ijiazh
uang
Dalia
nCh
ongq
ingZh
engz
hou
Chas
hang
Nanc
hang
Hefei
Shen
yang
Fosh
an
Chan
gchu
n
Tertiary Industry/GDP (%) Y-o-Y Change (%)
Tertiary Industry/GDP (%) Y-o-Y Change (%)
12 JLL | Hotels & Hospitality Group
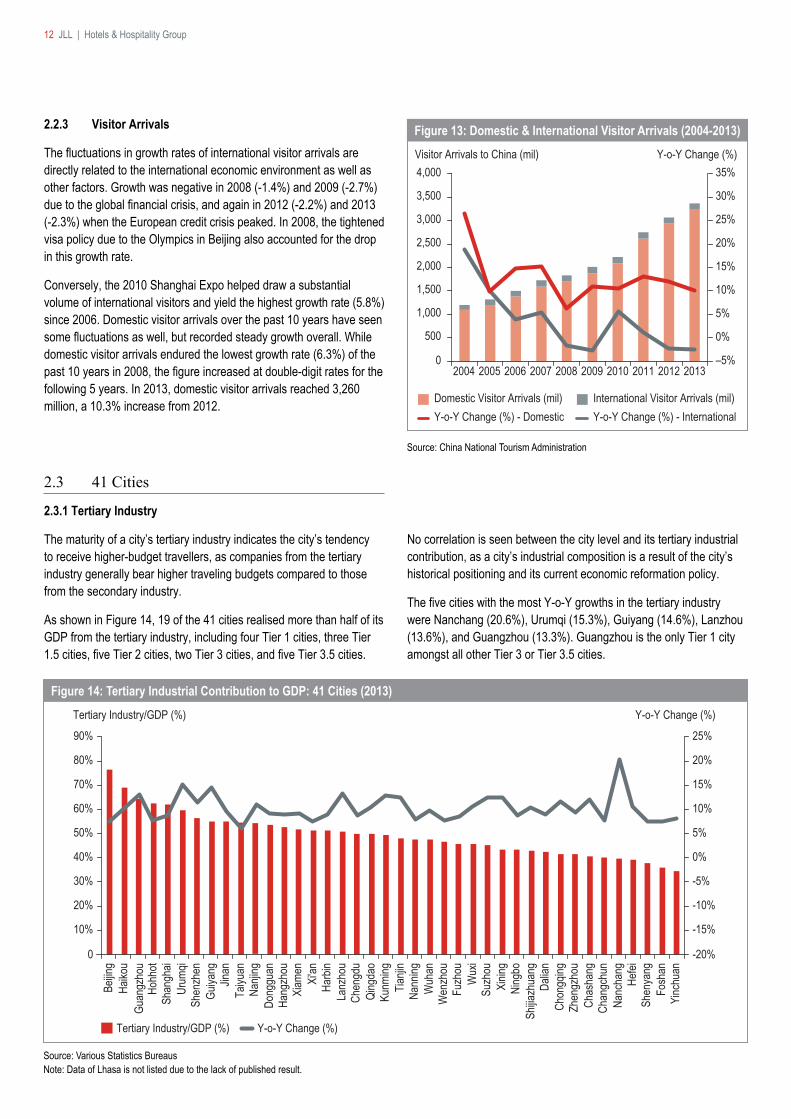
2.2.3 Visitor Arrivals
The fluctuations in growth rates of international visitor arrivals are directly related to the international economic environment as well as other factors. Growth was negative in 2008 (-1.4%) and 2009 (-2.7%) due to the global financial crisis, and again in 2012 (-2.2%) and 2013 (-2.3%) when the European credit crisis peaked. In 2008, the tightened visa policy due to the Olympics in Beijing also accounted for the drop in this growth rate.
Conversely, the 2010 Shanghai Expo helped draw a substantial volume of international visitors and yield the highest growth rate (5.8%) since 2006. Domestic visitor arrivals over the past 10 years have seen some fluctuations as well, but recorded steady growth overall. While domestic visitor arrivals endured the lowest growth rate (6.3%) of the past 10 years in 2008, the figure increased at double-digit rates for the following 5 years. In 2013, domestic visitor arrivals reached 3,260 million, a 10.3% increase from 2012.
2.3 41 Cities
2.3.1 Tertiary Industry
The maturity of a city’s tertiary industry indicates the city’s tendency to receive higher-budget travellers, as companies from the tertiary industry generally bear higher traveling budgets compared to those from the secondary industry.
As shown in Figure 14, 19 of the 41 cities realised more than half of its GDP from the tertiary industry, including four Tier 1 cities, three Tier 1.5 cities, five Tier 2 cities, two Tier 3 cities, and five Tier 3.5 cities.
Source: Various Statistics BureausNote: Data of Lhasa is not listed due to the lack of published result.
Figure 14: Tertiary Industrial Contribution to GDP: 41 Cities (2013)
No correlation is seen between the city level and its tertiary industrial contribution, as a city’s industrial composition is a result of the city’s historical positioning and its current economic reformation policy.
The five cities with the most Y-o-Y growths in the tertiary industry were Nanchang (20.6%), Urumqi (15.3%), Guiyang (14.6%), Lanzhou (13.6%), and Guangzhou (13.3%). Guangzhou is the only Tier 1 city amongst all other Tier 3 or Tier 3.5 cities.
-20%
0%
20%
40%
60%
80%
100%
0
3
6
9
12
15
18
Y-o-Y Change (%)Actual Utilized FDI (USD bn)
Tianji
n
Xinin
g
Actually Utilized FDI (USD bn) Y-o-Y Change (%)
Shan
ghai
Dalia
nCh
ongq
ingCh
engd
u Su
zhou
Beijin
gSh
enya
ngQi
ngda
oSh
enzh
enHa
ngzh
ouW
uhan
Guan
gzho
uCh
angc
hun
Nanji
ngDo
nggu
anCh
angs
haW
uxi
Zhen
gzho
uNi
ngbo
Xi'an
Nanc
hang
Fosh
anHe
feiHa
rbin
Xiam
enKu
nming
Hohh
otFu
zhou
Jinan
Shijia
zhua
ngTa
iyuan
Nann
ingGu
iyang
Haiko
uW
enzh
ouUr
umqi
Yinc
huan
Lanz
hou
China Hotel Market Overview 2014 13
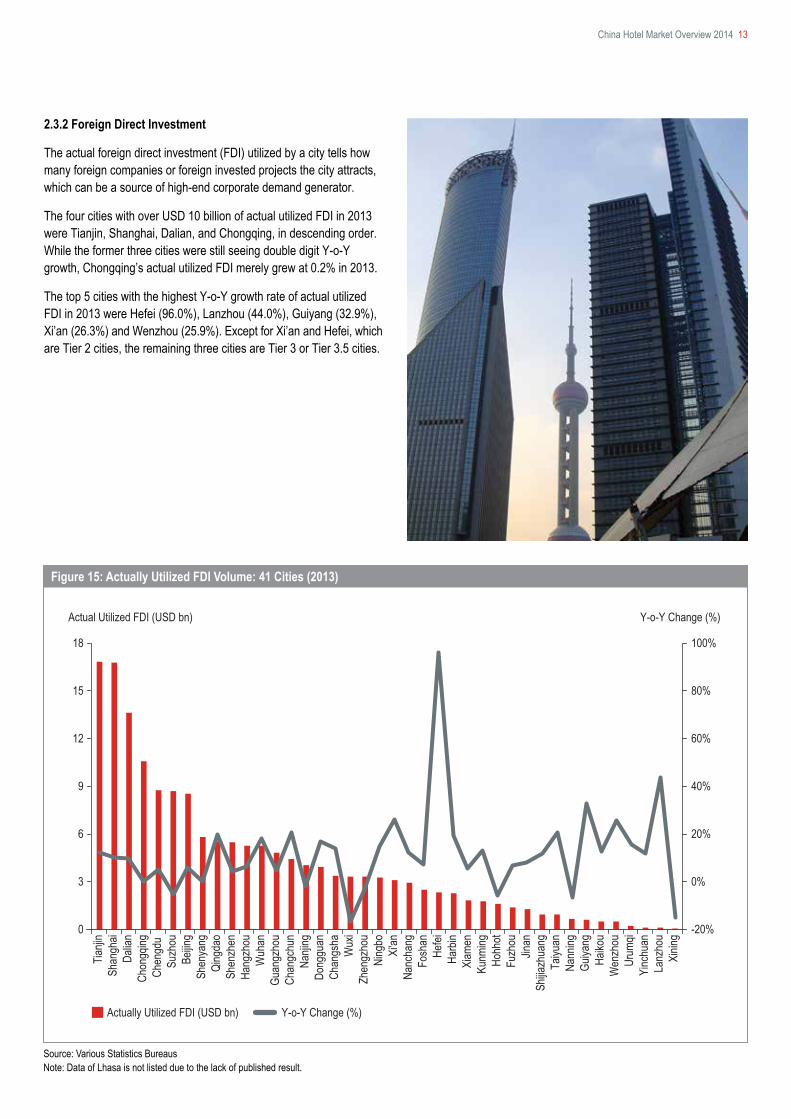
2.3.2 Foreign Direct Investment
The actual foreign direct investment (FDI) utilized by a city tells how many foreign companies or foreign invested projects the city attracts, which can be a source of high-end corporate demand generator.
The four cities with over USD 10 billion of actual utilized FDI in 2013 were Tianjin, Shanghai, Dalian, and Chongqing, in descending order. While the former three cities were still seeing double digit Y-o-Y growth, Chongqing’s actual utilized FDI merely grew at 0.2% in 2013.
The top 5 cities with the highest Y-o-Y growth rate of actual utilized FDI in 2013 were Hefei (96.0%), Lanzhou (44.0%), Guiyang (32.9%), Xi’an (26.3%) and Wenzhou (25.9%). Except for Xi’an and Hefei, which are Tier 2 cities, the remaining three cities are Tier 3 or Tier 3.5 cities.
Figure 15: Actually Utilized FDI Volume: 41 Cities (2013)
Source: Various Statistics BureausNote: Data of Lhasa is not listed due to the lack of published result.
-50%
-20%
-40%
-30%
-10%
0%
10%
20%
30%
50%
40%
0
10
20
30
40
50
60
70
80
100
90
Y-o-Y Change (%) Airport Throughtput (mil)
Beijin
g
Fosh
an
Shan
ghai
Guan
gzho
uCh
engd
uSh
enzh
enKu
nming
Xi'an
Chon
gqing
Hang
zhou
Xiam
enCh
asha
ngW
uhan
Urum
qiNa
njing
Qing
dao
Dalia
nZh
engz
hou
Shen
yang
Haiko
uGu
iyang
Harb
inTia
njin
Fuzh
ouNa
nning
Jinan
Taiyu
anNa
ncha
ngCh
angc
hun
Wen
zhou
Hohh
otLa
nzho
uHe
feiNi
ngbo
Shijia
zhua
ngYi
nchu
anW
uxi
Xinin
gLh
asa
Airport Throughtput (mil) Y-o-Y Change (%)
14 JLL | Hotels & Hospitality Group
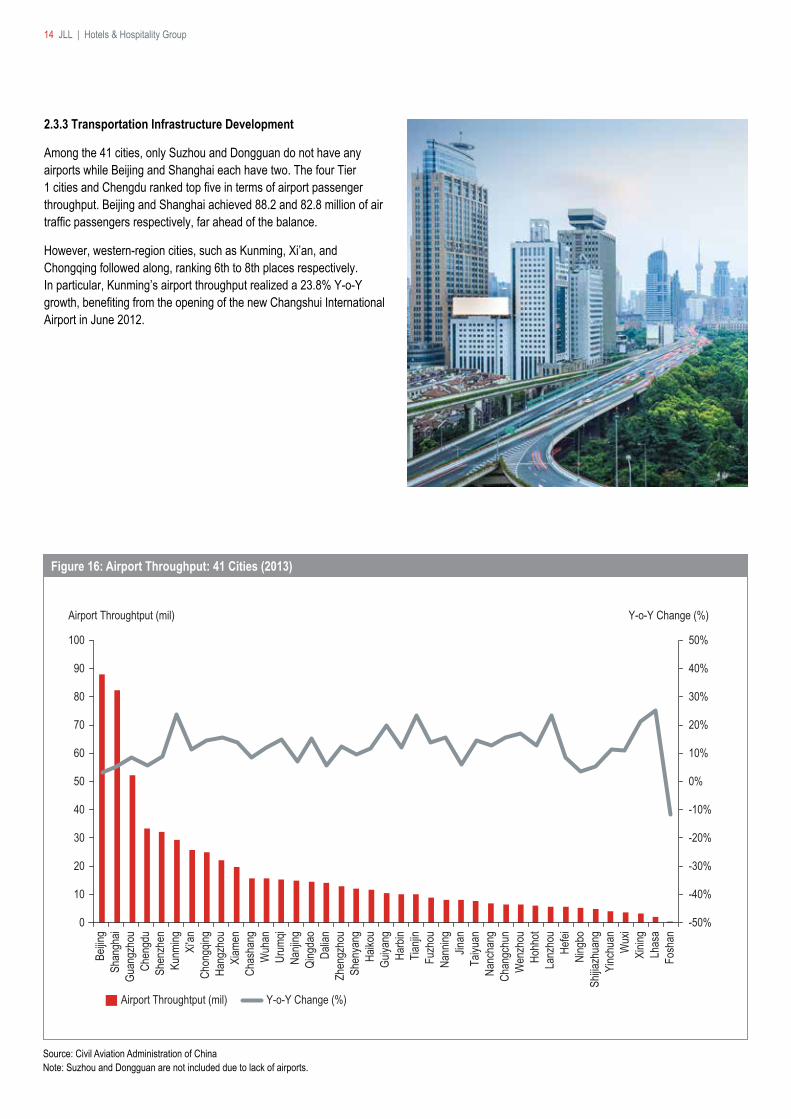
2.3.3 Transportation Infrastructure Development
Among the 41 cities, only Suzhou and Dongguan do not have any airports while Beijing and Shanghai each have two. The four Tier 1 cities and Chengdu ranked top five in terms of airport passenger throughput. Beijing and Shanghai achieved 88.2 and 82.8 million of air traffic passengers respectively, far ahead of the balance.
However, western-region cities, such as Kunming, Xi’an, and Chongqing followed along, ranking 6th to 8th places respectively. In particular, Kunming’s airport throughput realized a 23.8% Y-o-Y growth, benefiting from the opening of the new Changshui International Airport in June 2012.
Source: Civil Aviation Administration of ChinaNote: Suzhou and Dongguan are not included due to lack of airports.
Figure 16: Airport Throughput: 41 Cities (2013)
Total Stock YE 2013 Total Stock YE 2016* Vacancy Rate YE 2013 Vacancy Rate YE 2016*
0
2,000
4,000
6,000
8,000
10,000
0%
25%
50%
75%
100% Vacancy Rate (%)Grade-A Office Stock ('000 sqm)
Beijin
g
Shan
ghai
Guan
gzho
u
Shen
zhen
Chen
gdu
Dalia
n
Hang
zhou
Xi'an
Suzh
ou
Wuh
an
Nanji
ng
Chon
gqing
Ning
bo
Xiam
en
Zhen
gzho
u
Shen
yang
Tianji
n
Qing
dao
Wux
i
Chan
gsha
China Hotel Market Overview 2014 15
2.4 Hotel Demand Drivers
Hotel demand can be segmented by travel purposes, including corporate, Meetings, Incentives, Conventions, Exhibitions (MICE), and leisure. Each demand segment can be driven by different infrastructure or represented by various indicators.
2.4.1 Corporate Demand Drivers
Commercial real estate, especially high-quality office buildings and business parks, are often indicators of corporate demand. Supply and demand of these commercial properties can show a city’s potential corporate demand.
Source: JLL*Estimated data
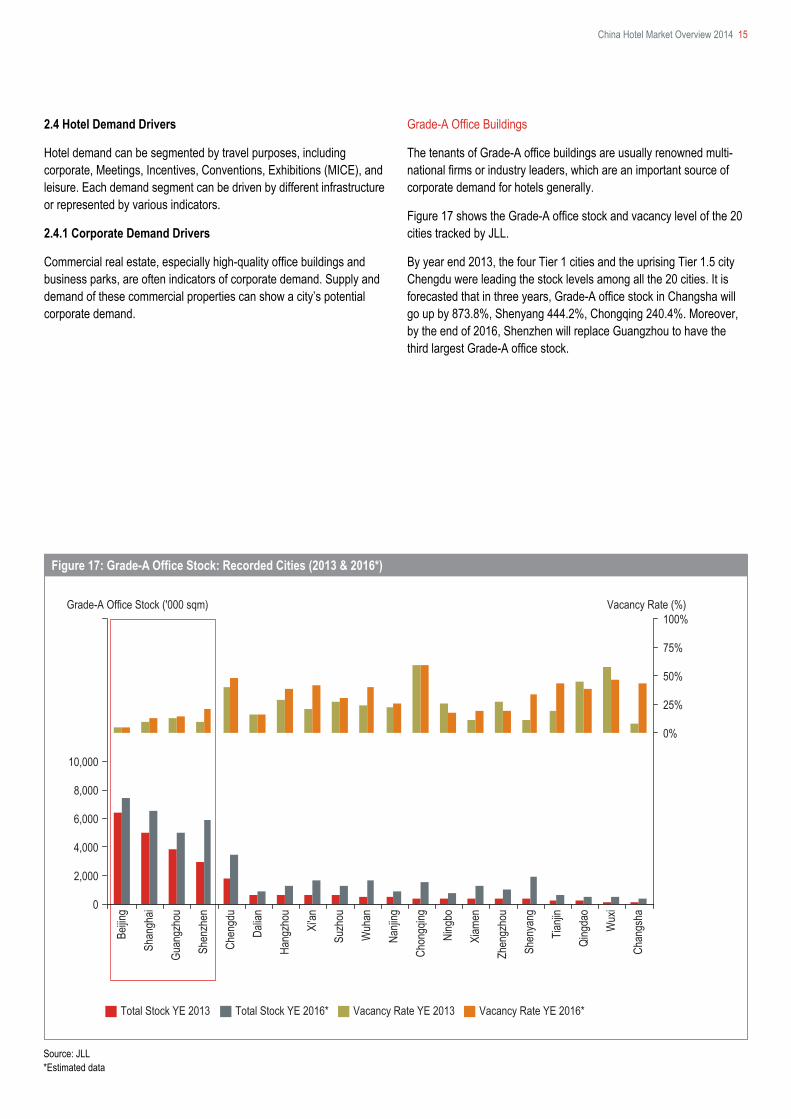
Grade-A Office Buildings
The tenants of Grade-A office buildings are usually renowned multi-national firms or industry leaders, which are an important source of corporate demand for hotels generally.
Figure 17 shows the Grade-A office stock and vacancy level of the 20 cities tracked by JLL.
By year end 2013, the four Tier 1 cities and the uprising Tier 1.5 city Chengdu were leading the stock levels among all the 20 cities. It is forecasted that in three years, Grade-A office stock in Changsha will go up by 873.8%, Shenyang 444.2%, Chongqing 240.4%. Moreover, by the end of 2016, Shenzhen will replace Guangzhou to have the third largest Grade-A office stock.
Figure 17: Grade-A Office Stock: Recorded Cities (2013 & 2016*)
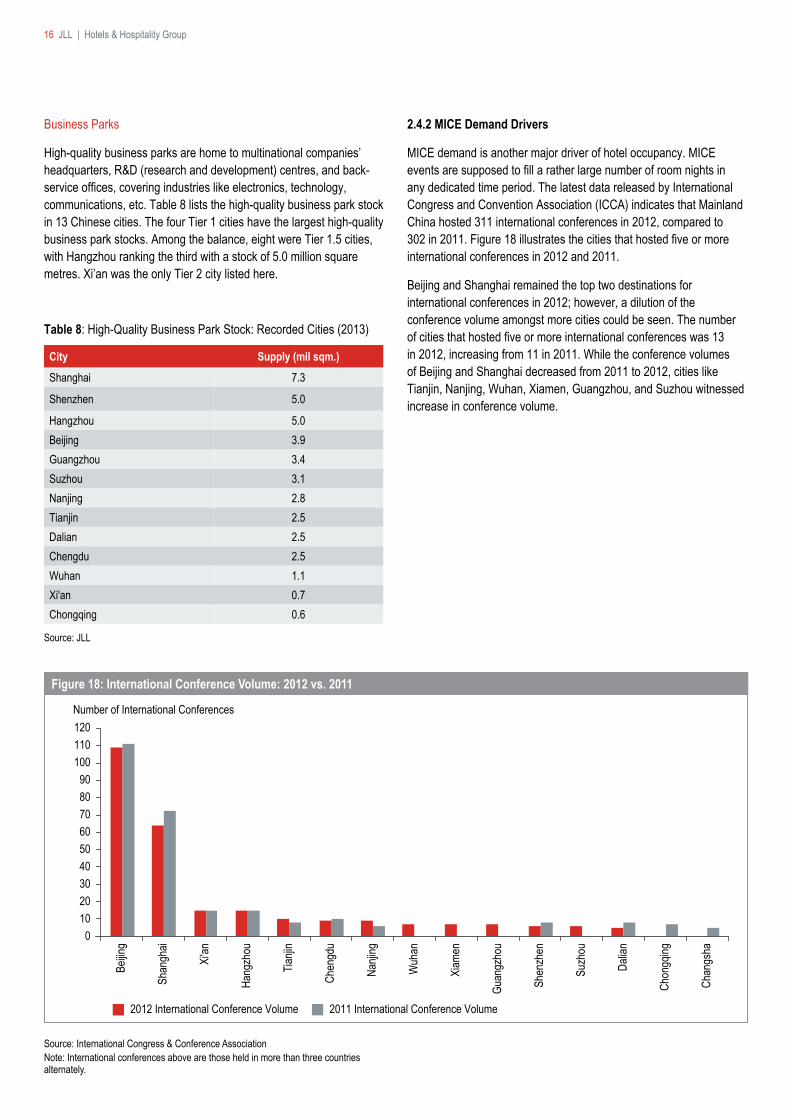
Table 8: High-Quality Business Park Stock: Recorded Cities (2013)
Source: JLL
City Supply (mil sqm.)Shanghai 7.3
Shenzhen 5.0
Hangzhou 5.0Beijing 3.9Guangzhou 3.4Suzhou 3.1Nanjing 2.8Tianjin 2.5Dalian 2.5Chengdu 2.5Wuhan 1.1Xi'an 0.7Chongqing 0.6
0
120Number of International Conferences
2012 International Conference Volume 2011 International Conference Volume
102030405060708090
100110
Beijin
g
Shan
ghai
Xi'an
Hang
zhou
Tianji
n
Chen
gdu
Nanji
ng
Wuh
an
Xiam
en
Guan
gzho
u
Shen
zhen
Suzh
ou
Dalia
n
Chon
gqing
Chan
gsha
16 JLL | Hotels & Hospitality Group
Business Parks
High-quality business parks are home to multinational companies’ headquarters, R&D (research and development) centres, and back-service offices, covering industries like electronics, technology, communications, etc. Table 8 lists the high-quality business park stock in 13 Chinese cities. The four Tier 1 cities have the largest high-quality business park stocks. Among the balance, eight were Tier 1.5 cities, with Hangzhou ranking the third with a stock of 5.0 million square metres. Xi’an was the only Tier 2 city listed here.
2.4.2 MICE Demand Drivers
MICE demand is another major driver of hotel occupancy. MICE events are supposed to fill a rather large number of room nights in any dedicated time period. The latest data released by International Congress and Convention Association (ICCA) indicates that Mainland China hosted 311 international conferences in 2012, compared to 302 in 2011. Figure 18 illustrates the cities that hosted five or more international conferences in 2012 and 2011.
Beijing and Shanghai remained the top two destinations for international conferences in 2012; however, a dilution of the conference volume amongst more cities could be seen. The number of cities that hosted five or more international conferences was 13 in 2012, increasing from 11 in 2011. While the conference volumes of Beijing and Shanghai decreased from 2011 to 2012, cities like Tianjin, Nanjing, Wuhan, Xiamen, Guangzhou, and Suzhou witnessed increase in conference volume.
Figure 18: International Conference Volume: 2012 vs. 2011
Source: International Congress & Conference AssociationNote: International conferences above are those held in more than three countries alternately.

Figure 19: International Conference Volume: Global (2003-2012)
Source: International Congress and Conference Association
-30%
-20%
-10%
0%
10%
20%
30%
0
2,000
4,000
6,000
8,000
10,000
12,000
2003 2011
Y-o-Y Change (%)Number of International Conferences
Worldwide International Conference VolumeY-o-Y Change (%)
20122010200920082007200620052004
-20%
-10%
0%
10%
20%
30%
40%
50%
60%
0
40
80
120
160
200
240
280
320
Total Visitor Arrivals (mil) Y-o-Y Change (%)
Y-o-Y Change (%)Total Visitor Arrivals (mil)
Shan
ghai
Beijin
gW
uhan
Chen
gdu
Tianji
nXi
'anHa
ngzh
ouSu
zhou
Chan
gsha
Nanji
ngSh
enya
ngW
uxi
Zhen
gzho
uCh
ongq
ingNi
ngbo
Qing
dao
Guiya
ngHe
feiW
enzh
ouKu
nming
Harb
inDa
lian
Guan
gzho
uSh
ijiazh
uang
Xiam
enSh
enzh
enFo
shan
Taiyu
anFu
zhou
Nanc
hang
Dong
guan
Lanz
hou
Urum
qiJin
anXi
ning
Haiko
uYi
nchu
anLh
asa
China Hotel Market Overview 2014 17
Figure 20: Total Visitor Arrivals: 41 Cities (2013)
Source: Various Statistics BureausNote: Data of Nanning and Changchun are not listed due to the lack of published results.
Figure 19 extends to international MICE demand. Worldwide international conference volume endured a fast recovery in 2004 after the outbreak of Severe Acute Respiratory Syndrome (SARS) in 2003 and yet another significant slowdown in the growth rate in 2008 when the global economic crisis happened. This slowdown in the MICE market continued until 2012, when the Y-o-Y growth of the worldwide international conference volume picked up to 10.8%, an indication that the global economy is showing signs of recovery.
2.4.3 Leisure Demand Drivers
The leisure demand driver is hard to be captured with one comprehensive measurement, but a city’s inbound visitor arrivals and tourism receipts can reflect the city’s lodging demand as a tourism destination from a broad perspective.
As shown in Figure 20, the top five cities that received the most visitor arrivals in 2013 were Shanghai, Beijing, Wuhan, Chengdu, and Tianjin, all major gateway cities (Tier 1 and Tier 1.5) in West, East, and Central China. The five cities that experienced the most rapid Y-o-Y growth from 2012 to 2013 were Yinchuan (50.4%), Nanchang (30.2%), Lanzhou (28.0%), Xi’an (27.0%), and Chengdu (26.0%), with more cities in the lower Tiers 2 to 3.5.
-20%
-10%
0%
10%
20%
30%
40%
50%
60%
0
50
100
150
200
250
300
400
350
Y-o-Y Change (%)Total Tourism Receipt (RMB bn)
Beijin
g
Yinc
huan
Shan
ghai
Guan
gzho
uCh
ongq
ingW
uhan
Hang
zhou
Suzh
ouNa
njing
Chen
gdu
Wux
iTia
njin
Chan
gsha
Ning
boQi
ngda
oSh
enya
ngDa
lian
Xi'an
Zhen
gzho
uGu
iyang
Harb
inXi
amen
Wen
zhou
Jinan
Hefei
Kunm
ingDo
nggu
anFo
shan
Taiyu
anFu
zhou
Nanc
hang
Shen
zhen
Urum
qiLa
nzho
uHa
ikou
Lhas
aXi
ning
Total Tourism Receipt (RMB bn) Y-o-Y Change (%)
Shijia
zhua
ng
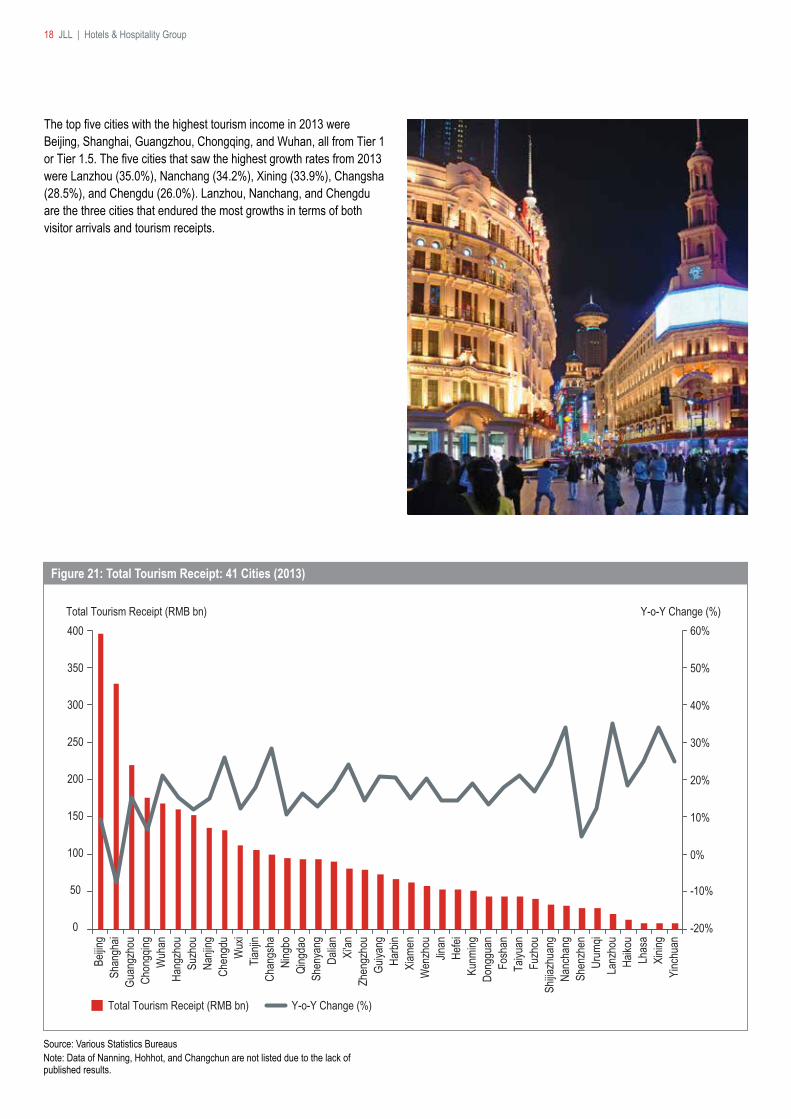
Figure 21: Total Tourism Receipt: 41 Cities (2013)
Source: Various Statistics BureausNote: Data of Nanning, Hohhot, and Changchun are not listed due to the lack of published results.
18 JLL | Hotels & Hospitality Group
The top five cities with the highest tourism income in 2013 were Beijing, Shanghai, Guangzhou, Chongqing, and Wuhan, all from Tier 1 or Tier 1.5. The five cities that saw the highest growth rates from 2013 were Lanzhou (35.0%), Nanchang (34.2%), Xining (33.9%), Changsha (28.5%), and Chengdu (26.0%). Lanzhou, Nanchang, and Chengdu are the three cities that endured the most growths in terms of both visitor arrivals and tourism receipts.
Xining
Shanghai
Number of Hotel Rooms2010 Existing Stock 2010–2013 New Supply
LhasaLanzhou
ChangchunWenzhou
ShijiazhuangUrumqiFuzhou
NanchangYinchuan
HarbinNanning
HaikouHohhot
JinanGuiyangKunmingTaiyuanFoshan
ChangshaHefei
ZhengzhouDongguan
NanjingWuxi
NingboDalian
XiamenSuzhouWuhan
QingdaoShenyangChengdu
Xi'anHangzhou
TianjinChongqingShenzhen
GuangzhouBeijing
55,0000 50,00045,00040,00035,00030,00025,00020,00015,00010,0005,000
China Hotel Market Overview 2014 19
Figure 22: Hotel Room Stock: 41 Cities (2013)
Source: JLL Hotels & Hospitality Group, Industry InformationNote: Above data includes international-branded hotels only.
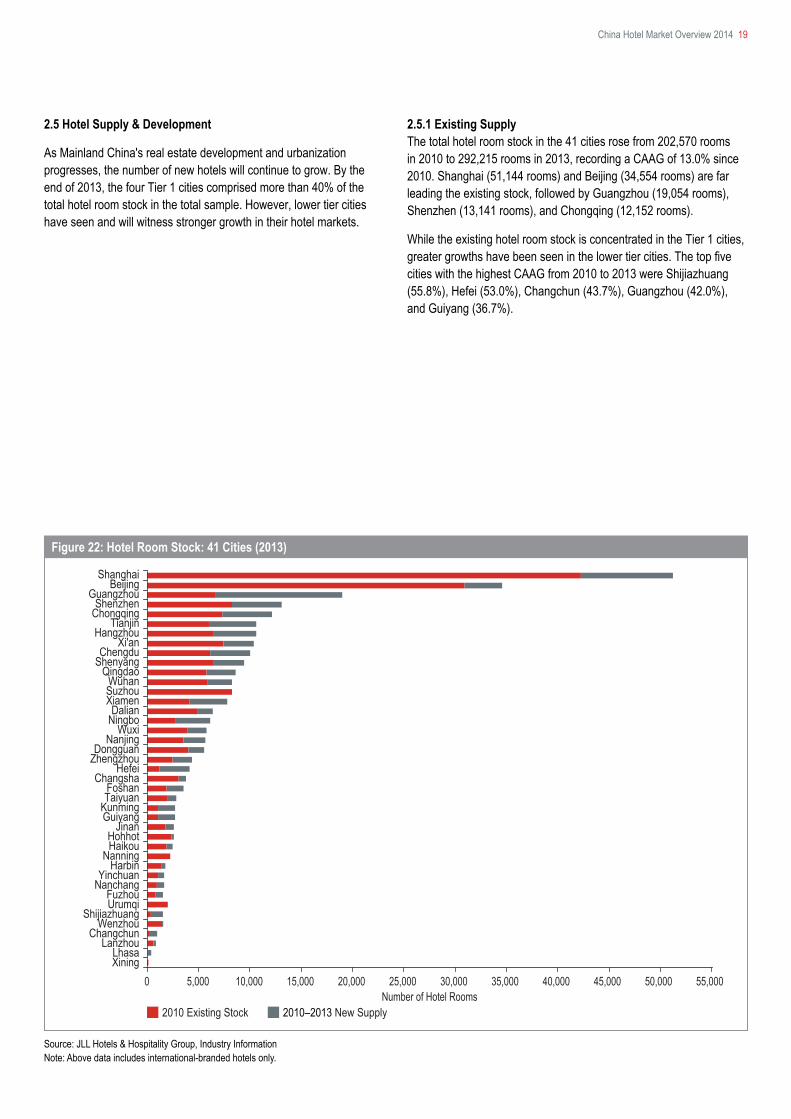
2.5 Hotel Supply & Development
As Mainland China's real estate development and urbanization progresses, the number of new hotels will continue to grow. By the end of 2013, the four Tier 1 cities comprised more than 40% of the total hotel room stock in the total sample. However, lower tier cities have seen and will witness stronger growth in their hotel markets.
2.5.1 Existing Supply The total hotel room stock in the 41 cities rose from 202,570 rooms in 2010 to 292,215 rooms in 2013, recording a CAAG of 13.0% since 2010. Shanghai (51,144 rooms) and Beijing (34,554 rooms) are far leading the existing stock, followed by Guangzhou (19,054 rooms), Shenzhen (13,141 rooms), and Chongqing (12,152 rooms).
While the existing hotel room stock is concentrated in the Tier 1 cities, greater growths have been seen in the lower tier cities. The top five cities with the highest CAAG from 2010 to 2013 were Shijiazhuang (55.8%), Hefei (53.0%), Changchun (43.7%), Guangzhou (42.0%), and Guiyang (36.7%).
Source: JLL Hotels & Hospitality Group, Industry InformationNote: Cities in red are newly included in the respective category this year.
Table 9: Future Hotel Room Stock: 41 Cities (YE 2016)
Cities> 20,000 Shanghai, Beijing, Chengdu, Guangzhou
10,001 – 20,000 Tianjin, Chongqing, Hangzhou, Shenzhen, Wuhan, Xi’an, Suzhou, Qingdao, Shenyang, Xiamen
7,001 – 10,000 Changsha, Wuxi, Dalian, Nanjing, Ningbo, Zhengzhou, Kunming, Foshan
4,001 – 7,000 Haikou, Hefei, Dongguan, Taiyuan, Guiyang, Jinan
-20%
-10%
0%
10%
20%
30%
40%
50%
60%
0
50
100
150
200
250
300
400
350
Beijin
g
Xinin
g
Chon
gqing
Shan
ghai
Shen
yang
Chen
gdu
Wuh
anHa
ngzh
ouDa
lian
Xi'an
Guan
gzho
uTia
njin
Suzh
ouCh
angs
ha
Kunm
ingFu
zhou
Chas
hang
Wux
iNi
ngbo
Nanji
ngHe
feiQi
ngda
oSh
ijiazh
uang
Shen
zhen
Harb
inFo
shan
Wen
zhou
Jinan
Chan
gchu
nHo
hhot
Xiam
enDo
nggu
anTa
iyuan
Nann
ingNa
ncha
ngYi
nchu
anHa
ikou
Lanz
hou
Urum
qi
Real Estate Investment (RMB bn) Y-o-Y Change (%)
Real Estate Investment (RMB bn) Y-o-Y Change (%)
Figure 23: Real Estate Investment: 41 Cities (2013)
Source: Various Statistics BureausNote: Data of Guiyang and Lhasa are not listed due to the lack of published results.
20 JLL | Hotels & Hospitality Group
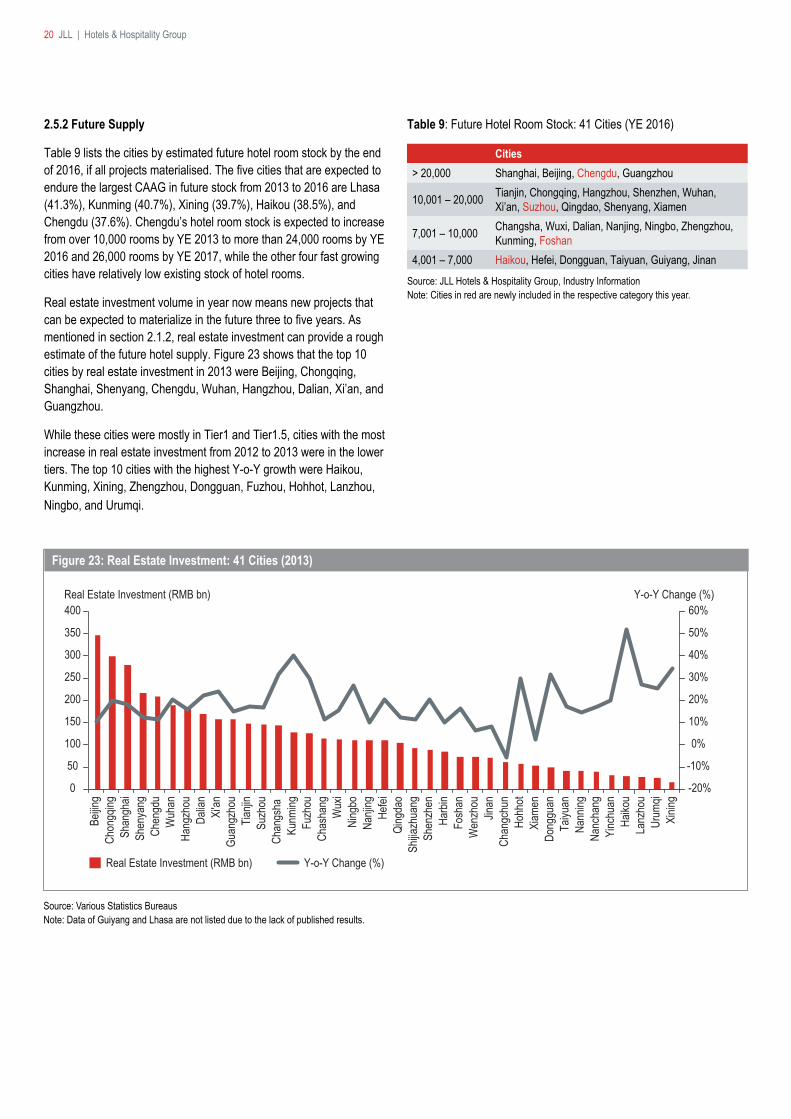
2.5.2 Future Supply
Table 9 lists the cities by estimated future hotel room stock by the end of 2016, if all projects materialised. The five cities that are expected to endure the largest CAAG in future stock from 2013 to 2016 are Lhasa (41.3%), Kunming (40.7%), Xining (39.7%), Haikou (38.5%), and Chengdu (37.6%). Chengdu’s hotel room stock is expected to increase from over 10,000 rooms by YE 2013 to more than 24,000 rooms by YE 2016 and 26,000 rooms by YE 2017, while the other four fast growing cities have relatively low existing stock of hotel rooms.
Real estate investment volume in year now means new projects that can be expected to materialize in the future three to five years. As mentioned in section 2.1.2, real estate investment can provide a rough estimate of the future hotel supply. Figure 23 shows that the top 10 cities by real estate investment in 2013 were Beijing, Chongqing, Shanghai, Shenyang, Chengdu, Wuhan, Hangzhou, Dalian, Xi’an, and Guangzhou.
While these cities were mostly in Tier1 and Tier1.5, cities with the most increase in real estate investment from 2012 to 2013 were in the lower tiers. The top 10 cities with the highest Y-o-Y growth were Haikou, Kunming, Xining, Zhengzhou, Dongguan, Fuzhou, Hohhot, Lanzhou, Ningbo, and Urumqi.
China Hotel Market Overview 2014 21
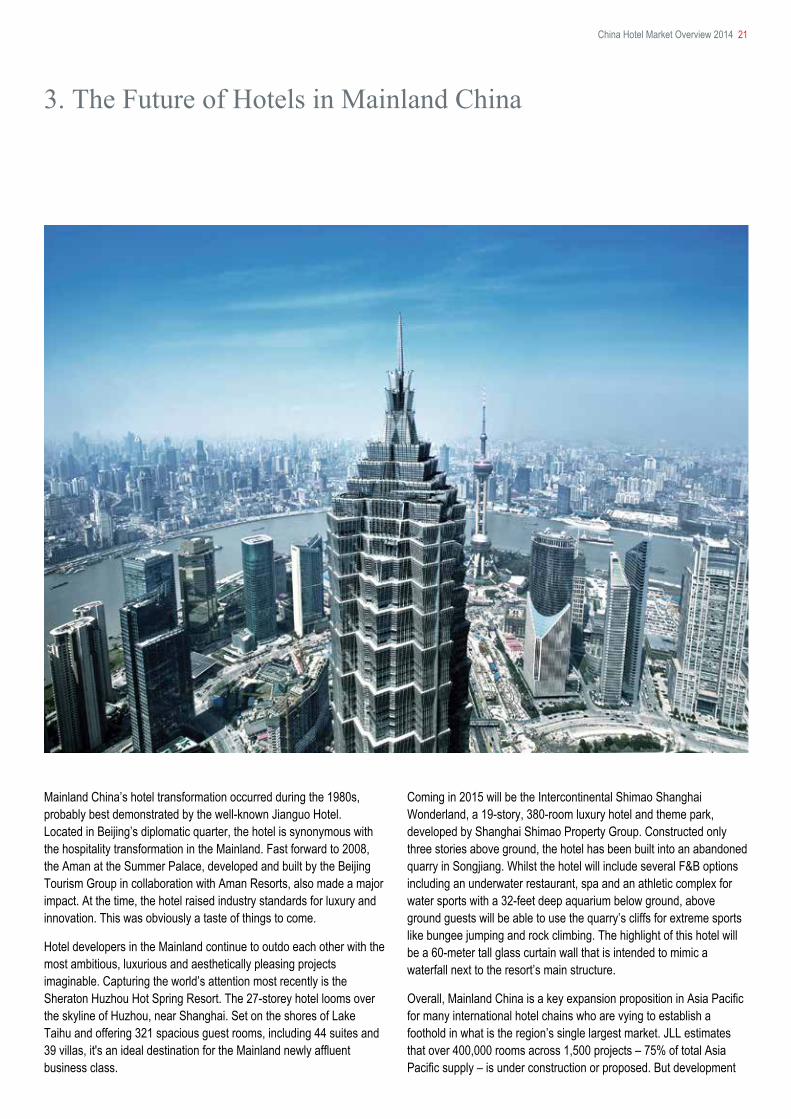
Mainland China’s hotel transformation occurred during the 1980s, probably best demonstrated by the well-known Jianguo Hotel. Located in Beijing’s diplomatic quarter, the hotel is synonymous with the hospitality transformation in the Mainland. Fast forward to 2008, the Aman at the Summer Palace, developed and built by the Beijing Tourism Group in collaboration with Aman Resorts, also made a major impact. At the time, the hotel raised industry standards for luxury and innovation. This was obviously a taste of things to come.
Hotel developers in the Mainland continue to outdo each other with the most ambitious, luxurious and aesthetically pleasing projects imaginable. Capturing the world’s attention most recently is the Sheraton Huzhou Hot Spring Resort. The 27-storey hotel looms over the skyline of Huzhou, near Shanghai. Set on the shores of Lake Taihu and offering 321 spacious guest rooms, including 44 suites and 39 villas, it's an ideal destination for the Mainland newly affluent business class.
3. The Future of Hotels in Mainland China
Coming in 2015 will be the Intercontinental Shimao Shanghai Wonderland, a 19-story, 380-room luxury hotel and theme park, developed by Shanghai Shimao Property Group. Constructed only three stories above ground, the hotel has been built into an abandoned quarry in Songjiang. Whilst the hotel will include several F&B options including an underwater restaurant, spa and an athletic complex for water sports with a 32-feet deep aquarium below ground, above ground guests will be able to use the quarry’s cliffs for extreme sports like bungee jumping and rock climbing. The highlight of this hotel will be a 60-meter tall glass curtain wall that is intended to mimic a waterfall next to the resort’s main structure.
Overall, Mainland China is a key expansion proposition in Asia Pacific for many international hotel chains who are vying to establish a foothold in what is the region’s single largest market. JLL estimates that over 400,000 rooms across 1,500 projects – 75% of total Asia Pacific supply – is under construction or proposed. But development
22 JLL | Hotels & Hospitality Group
aside, these new international brands must also ‘localise’ for the highly competitive Chinese market.
International hotel chains are adapting their services to suit unique Chinese preferences. Hotel operator Accor has focused on Mainland China as it re-engineered its Grand Mercure brand to tailor to the needs of the wealthy Chinese traveller. Known in Chinese as ‘Mei Jue’, the upscale hotels are highly influenced by Chinese design and each property is tailored to the characteristics of the Chinese city in which it operates. It’s not just the grand designs that make a brand distinctly ‘Chinese’. Grand Mercure, for example, caters to Chinese palates by offering a 24-hour congee menu.
Besides localising its existing brands, InterContinental Hotels Group (IHG), one of the largest international hotel operators in the country, has develop a new luxury hotel concept designed specifically for Chinese guests. Hualuxe – which uses the Chinese word “Hua” for majestic and in English “luxe” for luxury – will debut this year. Hualuxe will offer guests a more traditional experience based on four priorities that Chinese travellers are said to require: Chinese etiquette, rejuvenation, status recognition, and space for social interaction.
In the competitive international hotel market a “one size fits all” approach doesn’t work. In a world where cross-cultural influences affect even the biggest brands, being responsive to changes in consumer preferences could prove to be the difference between success and failure. As hotel operators continue to seek opportunities throughout Mainland China, we can expect global brands entering the market with innovative ways to identify with the local culture. And we can also be sure to bid farewell to the few who fail to localise.
Attachment: List of Provinces in each region North China: Heilongjiang, Jilin, Liaoning, Tianjin, Hebei East China: Shanghai, Jiangsu, Zhejiang, Shandong Central China: Shanxi, Anhui, Jiangxi, Henan, Hubei, Hunan, Fujian South China: Guangdong, Hainan, Guangxi West China: Inner Mongolia, Chongqing, Sichuan, Guizhou, Yunnan, Tibet, Shaanxi, Gansu, Qinghai, Ningxia, Xinjiang
China Hotel Market Overview 2014 23
Disclaimer
This report is confidential to the recipient of the report. No reference to the report or any part of it may be published in any document, statement or circular or in any communication with third parties without the prior written consent of Jones Lang LaSalle Hotels & Hospitality Group, including specifically in relation to the form and context in which it will appear.
We stress that forecasting is a problematical exercise which at best should be regarded as an indicative assessment of possibilities rather than absolute certainties. The process of making forward projections involves assumptions in respect of a considerable number of variables which are acutely sensitive to changing conditions, variations in any one of which may significantly affect the outcome and we draw your attention to this factor. Jones Lang LaSalle Hotels & Hospitality Group makes no representation, warranty, assurance or guarantee with respect to any material with which this report may be issued and this report should not be taken as an endorsement of or recommendation on any participation by any intending investor or any other party in any transaction whatsoever.
This report has been produced solely as a general guide and does not constitute advice. Users should not rely on this report and must make their own enquiries to verify and satisfy themselves of all aspects of information set out in the report. We have used and relied upon information from sources generally regarded as authoritative and reputable, but the information obtained from these sources may not have been independently verified by Jones Lang LaSalle Hotels & Hospitality Group.
Whilst the material contained in the report has been prepared in good faith and with due care, no representation or warranty is made in relation to the accuracy, currency, completeness, suitability or otherwise of the whole or any part of the report. Jones Lang LaSalle Hotels & Hospitality Group, its officers, employees, subcontractors and agents shall not be liable (to the extent permitted by law) to any person for any loss, liability, damage or expense (“liability”) arising directly or indirectly from or connected in any way with any use of or reliance on this report. If any liability is established, notwithstanding this exclusion, it shall not exceed $1,000.
JLL Hotels & Hospitality Group
JLL Hotels & Hospitality Group serves as the hospitality industry’s global leader in real estate services for luxury, upscale, select service and budget hotels; timeshare and fractional ownership properties; convention centers; mixed-use developments and other hospitality properties. The firm’s more than 265 dedicated hotel and hospitality experts partner with investors and owner/operators around the globe to support and shape investment strategies that deliver maximum value throughout the entire lifecycle of an asset. In the last five years, the team completed more transactions than any other hotels and hospitality real estate advisor in the world totalling nearly US$30 billion, while also completing approximately 4,000 advisory, valuation and asset management assignments. The group’s hotels and hospitality specialists provide independent and expert advice to clients, backed by industry-leading research.
For more news, videos and research from JLL‘s Hotels & Hospitality Group, please visit: www.jll.com/hospitality or download the Hotels & Hospitality Group’s app from the App Store.
About CTHA
Established in February 1982, the CTHA is a national non-profit industry organization formed, in a voluntary manner, by the association of tourist hotels, local hotels, hotel management companies, hotel equipment & supplies providers and other relevant organizations in China as well as the hotel experts and senior scholars, under the operational guidance, supervision and management of the China National Tourism Administration. The CTHA’s mission is to act in compliance with local law, protect its members’ legal rights and interests and serve as a bridge between its members and the Government. Today, the CTHA counts 2,700 members, 333 directors, 115 standing directors and 25 vice presidents. Mr. Zhang Run Gang is the president of the Association. The CTHA serves its members by strengthening communication amongst its members, collecting information on the domestic and international hotel market, providing hotel training programs and forums and by liaising with overseas hotel & tourism organizations. In 1994, the CTHA joined the International Hotel & Restaurant Association as one of its directors.
Jones Lang LaSalle Property Consultants Pte Ltd | CEA Licence No. L3007326E© 2014 Jones Lang LaSalle IP, Inc. All rights reserved. All information contained herein is from sources deemed reliable; however, no representation or warranty is made to the accuracy thereof.
www.jll.com/hospitality
Hotels & Hospitality’s Dedicated Offices
Atlanta 3344 Peachtree Road, Suite 1200 Atlanta, GA 30326, United States tel +1 404 995 2100 fax +1 404 995 2109Bangkok 19/F Sathorn City Tower 175 South Sathorn Road Tungmahamek, Sathorn Bangkok 10120, Thailand tel +66 2 624 6400 fax +66 2 679 6519Barcelona Passeig de Gracia 11 4a Planta, Esc. A 08007 Barcelona, Spain tel +34 93 318 5353 fax +34 93 301 2999Beijing 11/F China World Tower 1 Jianguomenwai Avenue Beijing 100004, China (PRC) tel +86 10 5922 1300 fax +86 10 5922 1346Brisbane Level 33, Central Plaza One 345 Queen Street Brisbane QLD 4000, Australia tel +61 7 3231 1400 fax +61 7 3231 1411Buenos Aires Av Cordoba 673 7th Floor C1054AAS Buenos Aires, Argentina tel +54 11 4893 2600 fax +54 11 4893 2080Chengdu 30/F, Tower 1, Plaza Central 8 Shuncheng Avenue Chengdu 610016 Sichuan, China (PRC) tel +86 28 6680 5000 fax +86 28 6680 5096Chicago 200 E Randolph Drive Chicago IL 60601, United States tel +1 312 782 5800 fax +1 312 782 4339
Dallas 8343 Douglas Avenue, Suite 100 Dallas TX 75225, United States tel +1 214 438 6100 fax +1 214 438 6101Denver 1225 Seventeenth Street Suite 1900 Denver, CO 80202, United States tel +1 303 260 6500 fax +1 303 260 6501Dubai Emaar Square, Building 1 Office 403, Sheikh Zayed Road, PO Box 214029, Dubai, UAE tel +971 4 426 6999 fax +971 4 365 3260 Düsseldorf Kaistrasse 5 40221 Düsseldorf, Germany tel +49 211 13006 0 fax +49 211 13399 0Exeter Keble House, Southernhay East Exeter EX1 1NT tel +44 1392 423696 fax +44 1392 423698Frankfurt Wilhelm-Leuschner-Strasse 78 60329 Frankfurt, Germany tel +49 69 2003 0 fax +49 69 2003 1040Glasgow 150 St Vincent Street Glasgow G2 5ND, United Kingdom tel +44 141 248 6040 fax +44 141 567 6678 Istanbul Yesim Sk. No:2 Akatlar – Levent Istanbul 34335, Turkey tel +90 212 350 0800 fax +90 212 350 0806
Jakarta Jakarta Stock Exchange Building Tower 2, 19th Floor, Sudirman Central, Business District Jl. Jend Sudirman Kav 52-53 Jakarta 12190, Indonesia tel +62 21 2922 3888 fax +62 21 515 3232Leeds St Paul’s House, Park Square Leeds LS1 2ND, United Kingdom tel +44 113 244 6440 fax +44 113 245 4664London 30 Warwick Street London W1B 5NH, United Kingdom tel +44 20 7493 6040 fax +44 20 7399 5694Los Angeles 515 South Flower Street, Suite 1300 Los Angeles, CA 90071, United States tel +1 213 239 6000 fax +1 213 239 6100Lyon 55 Avenue Foch 69006 Lyon, France tel +33 4 7889 2626 fax +33 4 7889 0476Madrid Paseo de la Castellana, 51 Planta 5, 28046 Madrid, Spain tel +34 91 789 1100 fax +34 91 789 1200Manchester 1 Piccadilly Gardens Manchester, M1 1RG, United Kingdom tel +44 161 828 6440 fax +44 161 828 6490Marseille 2 Place Sadi-Carnot 13002 Marseille, France tel +33 4 9509 1313 fax +33 4 9509 1300Melbourne Level 21, Bourke Place 600 Bourke Street Melbourne VIC 3000, Australia tel +61 3 9672 6666 fax +61 3 9600 1715
Mexico City Monte Pelvoux 111, Piso 5 Lomas de Chapultepec México, DF 11000, Mexico tel +52 55 5980 8054 fax +52 55 5202 4377Miami 2333 Ponce de Leon Blvd, Suite 1000 Coral Gables, Florida 33134 United States tel +1 305 529 6345 fax +1 305 529 6398Milan Via Agnello 8 20121 Milan, Italy tel +39 2 8586 8672 fax +39 2 8586 8670Moscow Kosmodamianskaya Nab. 52/3 Moscow 115054, Russia tel +7 495 737 8000 fax +7 495 737 8011Munich Ludwigpalais Ludwigstrasse 6 80539 Munich, Germany tel +49 89 2900 8882 fax +49 89 2900 8888 New Delhi Level 9 Tower A Global Business Park, Mehrauli Gurgaon Road, Sector 26, Gurgaon 122002 Haryana, India tel +91 124 4605000 fax +91 124 4605001New York 330 Madison Avenue New York NY 10017, United States tel +1 212 812 5700 fax + 1 212 421 5640Paris 40-42, rue La Boétie 75008 Paris, France tel +33 1 4055 1718 fax +33 1 4055 1868
Perth Level 29, Central Park 152-158 St Georges Terrace Perth WA 6000 tel +61 8 9322 5111 fax +61 8 9481 0107Rome Via Bissolati 20 00187 Rome, Italy tel +39 6 4200 6771 fax +39 6 4200 6720San Francisco One Front Street, Suite 300 San Francisco, CA 94111, United States tel +1 415 395 4900 fax +1 415 955 1150São Paulo Rua Joaquim Floriano, 72 – cj. 97 04534-000 São Paulo, SP, Brazil tel +55 11 3071 0747 fax +55 11 3071 4766Shanghai 25/F Tower 2 Plaza 66 1366 Nanjing Road (West) Jing An District Shanghai 200040, China (PRC) tel +86 21 6393 3333 fax +86 21 62888 2246Singapore 9 Raffles Place, #38-01 Republic Plaza Singapore 048619 tel +65 6536 0606 fax +65 6533 2107Sydney Level 26, 420 George Street Sydney NSW 2000, Australia tel +61 2 9220 8777 fax +61 2 9220 8765Tokyo 4th Floor, Prudential Tower 2-13-10 Nagatacho, Chiyoda-ku Tokyo 100-0014, Japan tel +81 3 5501 9240 fax +81 3 5501 9211Washington D.C. 1801 K Street NW, Suite 1000 Washington, DC 20006, United States tel +1 202 719 5000 fax +1 202 719 5001