Embed Size (px)
Citation preview
PPRROOMMIITTHHEEAASS –– 44
KKnnoowwlleeddggee ttrraannssffeerr aanndd rreesseeaarrcchh nneeeeddss ffoorr pprreeppaarriinngg
mmiittiiggaattiioonn//aaddaappttaattiioonn ppoolliiccyy ppoorrttffoolliiooss
((CCoonnttrraacctt NNoo.. 226655118822))
EEvvaalluuaattiioonn ooff
MMiittiiggaattiioonn // AAddaappttaattiioonn
ppoolliiccyy ppoorrttffoolliiooss ffoorr
UUkkrraaiinnee
Author: Mariia KOKORINA, Prof. Evgenij INSHEKOV
Institute for Energy Saving and Energy Management
National Technical University of Ukraine “Kiev Polytechnic Institute”
Co-authors: Dr. Popi KONIDARI, Anna FLESSA M.Sc.
National and Kapodistrian University of Athens - Energy Policy and Development Centre
Kiev, 2013
PROMITHEAS-4: “Knowledge transfer and research
needs for preparing mitigation/adaptation policy portfolios”
2
PROMITHEAS-4: “Knowledge transfer and research
needs for preparing mitigation/adaptation policy portfolios”
3
This document is part of the relevant report prepared for the FP7 funded project
“PROMITHEAS-4: Knowledge transfer and research needs for preparing
mitigation/adaptation policy portfolios”, coordinated by Prof. Dimitrios MAVRAKIS,
Energy Policy and Development Centre (Greece). The whole report contains twelve
(12) documents for each one of the emerging economies that participate in the
project: Albania, Armenia, Azerbaijan, Bulgaria, Estonia, Kazakhstan, Moldova,
Romania, Russia, Serbia, Turkey and Ukraine.

PROMITHEAS-4: “Knowledge transfer and research
needs for preparing mitigation/adaptation policy portfolios”
4
PROMITHEAS-4: “Knowledge transfer and research
needs for preparing mitigation/adaptation policy portfolios”
5
CCOONNTTEENNTTSS
Contents.........................................................................................................................5
List of Tables .................................................................................................................5
List of Figures ...............................................................................................................5
Abbreviations.................................................................................................................6
Assessment of the scenarios for Ukraine, through the multi - criteria method AMS 9
Conclusions .................................................................................................................30
LLIISSTT OOFF TTAABBLLEESS
Table 6: Total emissions for the country. ______________________________________________9 Table 7: Emissions per sector for the country. __________________________________________9 Table 8: Other environmental effects for the country under each scenario, _________________10 Table 9: Water use for cooling (Energy sector). ________________________________________10 Table 10: Mean CEI for each sector depending on the policy instruments of the BAU scenario. 12 Table 11: Mean CEI for each sector depending on the selected policy instruments of the OPT
scenario. ___________________________________________________________________13 Table 12: Mean CEI for each sector depending on the selected policy instruments of the PES
scenario. ___________________________________________________________________15 Table 13: Overall cost efficiency for the three scenarios._________________________________17 Table 14: Equity measurement. _____________________________________________________19 Table 15: AMS results for each scenario. _____________________________________________26
LLIISSTT OOFF FFIIGGUURREESS Figure 52: ClimAMS-2012...................................................................................................................10 Figure 53: Environmental performance of the scenarios..................................................................11 Figure 54: Political acceptability.........................................................................................................20 Figure 55: Feasibility of implementation............................................................................................26 Figure 56: Final grades. .......................................................................................................................26
PROMITHEAS-4: “Knowledge transfer and research
needs for preparing mitigation/adaptation policy portfolios”
6
AABBBBRREEVVIIAATTIIOONNSS
AAU Assigned Amount of Units
ARENAECO Agency for Rational Energy Use and Ecology
ARES Alternative Renewable Energy Sources
BAP Biomass Action Plan
CEC Commission of the European Communities
CIS Commonwealth Independent States
CM Cabinet of Ministers
CSPES Comprehensive State Program of Energy Saving
EPC Energy Performance Contracts
ERU Emission reduction units
GDP Gross Domestic Product
GHG Greenhouse Gas
GIS Green Investment Scheme
GVA Gross Value Added
EBRD European Bank of Reconstruction and Development
EIB European Investment Bank
EITI Extractive Industries Transparency Initiative
ENPI European Neighbourhood and Partnership Instrument
ESCO Energy Services COmpany
FAO Food and Agriculture Organization of the United Nations
FFVs Flexible fuel vehicles
HPP Hydroelectric Power Plant
IAEA International Atomic Energy Agency (IAEA) IEA International Energy Agency
IISD International Institute for Sustainable Development
IMF International Monetary Fund
JI Joint Implementation
LED Light-emitting diode LULUCF Land Use, Land Use Change, Foresty
MECI Ministry of Energy and Coal Industry of Ukraine
MoAP Ministry of Agrarian Policy
MoU Memorandum of Understanding
NAP National Adaptation Plan
NEIA National Environmental Investment Agency of Ukraine
NERC National Electricity Regulation Commission of Ukraine
NIF Neighbourhood Investment Facility
OECD Organisation for Economic Co-operation and Development
PDD Project Design Documents
PTL Power Transmission Line
RCP Representative Concentration Pathways
RES Renewable Energy Sources
RES-e Electricity production from RES
SEIA State Environmental Investment Agency
SES Solar Energy Systems
SSC State Statistics Committee of Ukraine
TAIEX Technical Assistance and Information Exchange Instrument
TFC Total final consumption
T.o.e Ton of oil equivalent
TPES Total Primary Energy Supply
UAH Ukrainian hryvnia, the national currency of Ukraine
UCTE Union for the Coordination of the Transmission of Electricity
UKEEP Ukraine Energy Efficiency Programme
UN United Nations
PROMITHEAS-4: “Knowledge transfer and research
needs for preparing mitigation/adaptation policy portfolios”
7
UNDP United Nations Development Programme
UNFCCC United Nations Framework Convention on Climate Change
USD United States Dollar WPP Wind Power Plants

PROMITHEAS-4: “Knowledge transfer and research
needs for preparing mitigation/adaptation policy portfolios”
8
PROMITHEAS-4: “Knowledge transfer and research
needs for preparing mitigation/adaptation policy portfolios”
9
AASSSSEESSSSMMEENNTT OOFF TTHHEE SSCCEENNAARRIIOOSS FFOORR UUKKRRAAIINNEE,,
TTHHRROOUUGGHH TTHHEE MMUULLTTII -- CCRRIITTEERRIIAA MMEETTHHOODD AAMMSS
GGeenneerraall ccoommmmeennttss The three scenarios have been assessed trough the multi criteria method AMS. This
method is combines three multi-criteria methods: Analytical Hierarchy Process (AHP), Multi-Attribute Utility Theory (MAUT) and Simple Multi-Attribute Ranking Technique (SMART) (Konidari and Mavrakis, 2007; 2006). AMS is developed for evaluating climate policy instruments (PI) or relevant Policy Mixes (PM) and with suitable modification for evaluating their interactions as well.
Three criteria are applied in AMS – environmental performance, political acceptability, and feasibility of implementation. Evaluation results for each criterion are reviewed below.
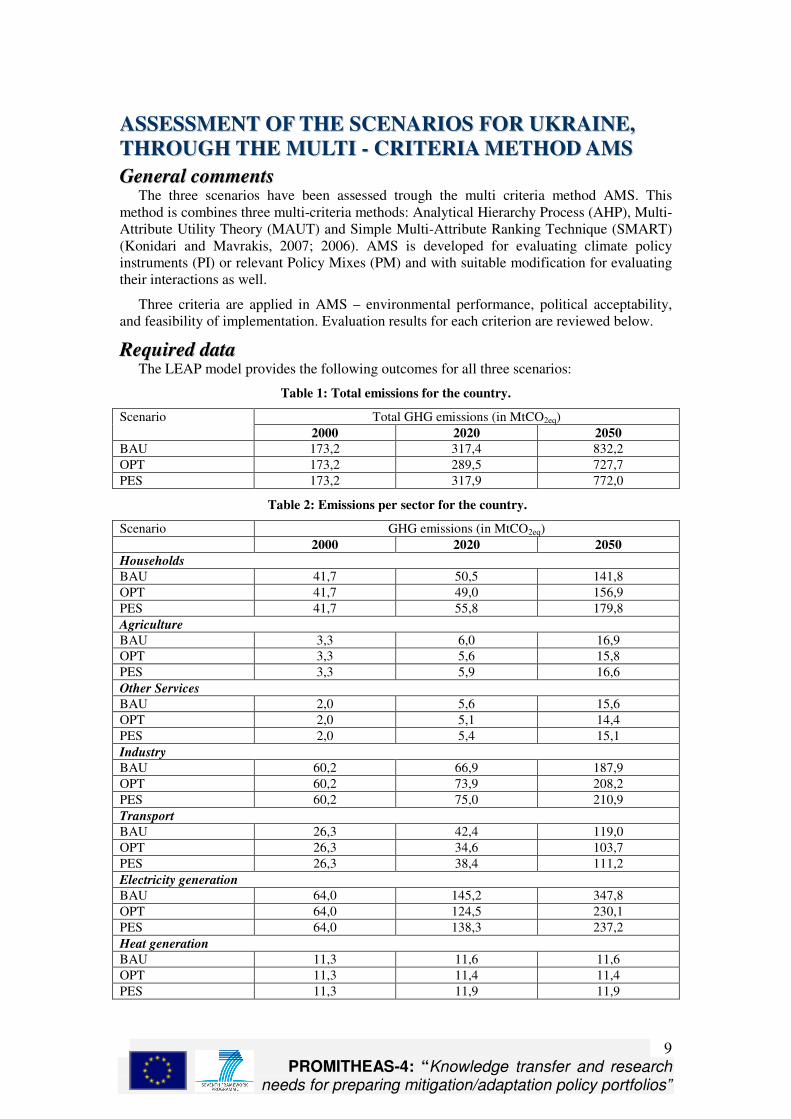
RReeqquuiirreedd ddaattaa The LEAP model provides the following outcomes for all three scenarios:
Table 1: Total emissions for the country.
Total GHG emissions (in MtCO2eq) Scenario
2000 2020 2050
BAU 173,2 317,4 832,2
OPT 173,2 289,5 727,7
PES 173,2 317,9 772,0
Table 2: Emissions per sector for the country.
Scenario GHG emissions (in MtCO2eq)
2000 2020 2050
Households BAU 41,7 50,5 141,8
OPT 41,7 49,0 156,9
PES 41,7 55,8 179,8
Agriculture BAU 3,3 6,0 16,9
OPT 3,3 5,6 15,8
PES 3,3 5,9 16,6
Other Services BAU 2,0 5,6 15,6
OPT 2,0 5,1 14,4
PES 2,0 5,4 15,1
Industry BAU 60,2 66,9 187,9
OPT 60,2 73,9 208,2
PES 60,2 75,0 210,9
Transport BAU 26,3 42,4 119,0
OPT 26,3 34,6 103,7
PES 26,3 38,4 111,2
Electricity generation
BAU 64,0 145,2 347,8
OPT 64,0 124,5 230,1
PES 64,0 138,3 237,2
Heat generation
BAU 11,3 11,6 11,6
OPT 11,3 11,4 11,4
PES 11,3 11,9 11,9
PROMITHEAS-4: “Knowledge transfer and research
needs for preparing mitigation/adaptation policy portfolios”
10
Table 3: Other environmental effects for the country under each scenario,
Scenario Million Metric Tonnes CO2 eq
2000 2020 2050
Environmental effects (Carbon Monoxide (CO)- Nitrogen Oxides (NOx)- Non Methane Volatile
Organic Compounds- Sulfur Dioxide)
BAU 0,037 0,038 0,038
OPT 0,037 0,037 0,037
PES 0,037 0,038 0,038
Table 4: Water use for cooling (Energy sector).
Billion cubic meters Scenario
2000 2020 2050
BAU - - -
OPT - - -
PES - - -
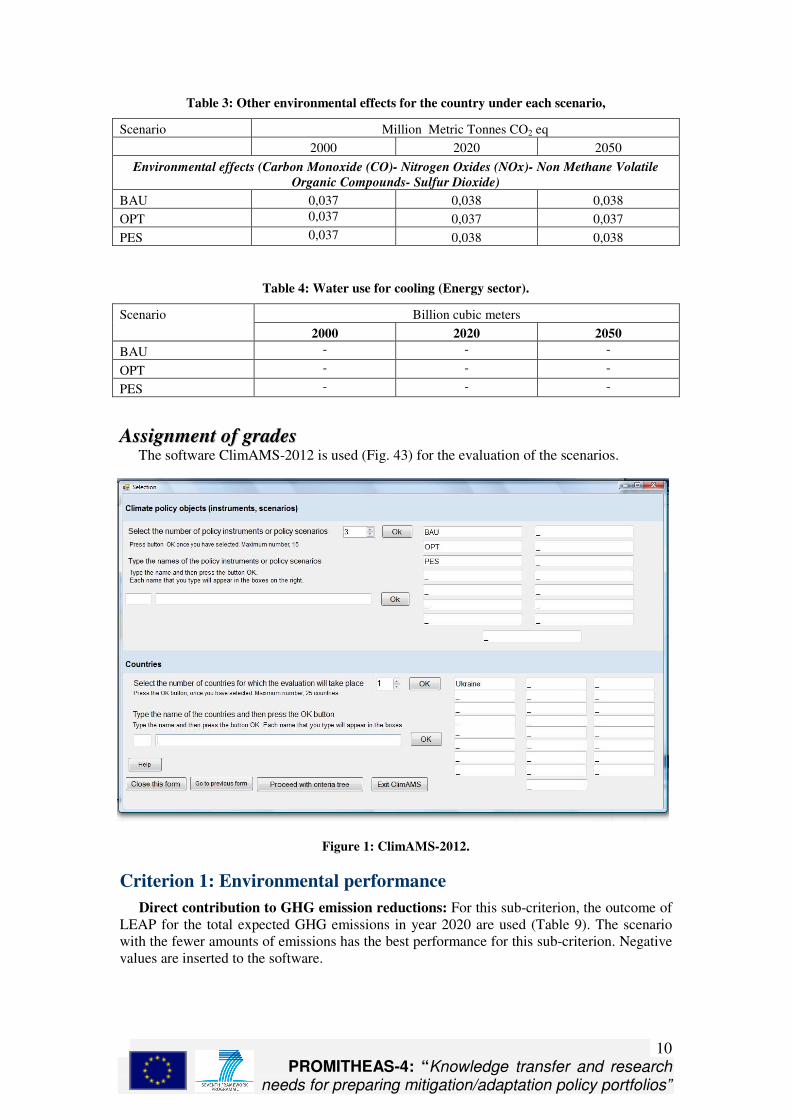
AAssssiiggnnmmeenntt ooff ggrraaddeess The software ClimAMS-2012 is used (Fig. 43) for the evaluation of the scenarios.
Figure 1: ClimAMS-2012.
Criterion 1: Environmental performance
Direct contribution to GHG emission reductions: For this sub-criterion, the outcome of LEAP for the total expected GHG emissions in year 2020 are used (Table 9). The scenario with the fewer amounts of emissions has the best performance for this sub-criterion. Negative values are inserted to the software.
PROMITHEAS-4: “Knowledge transfer and research
needs for preparing mitigation/adaptation policy portfolios”
11
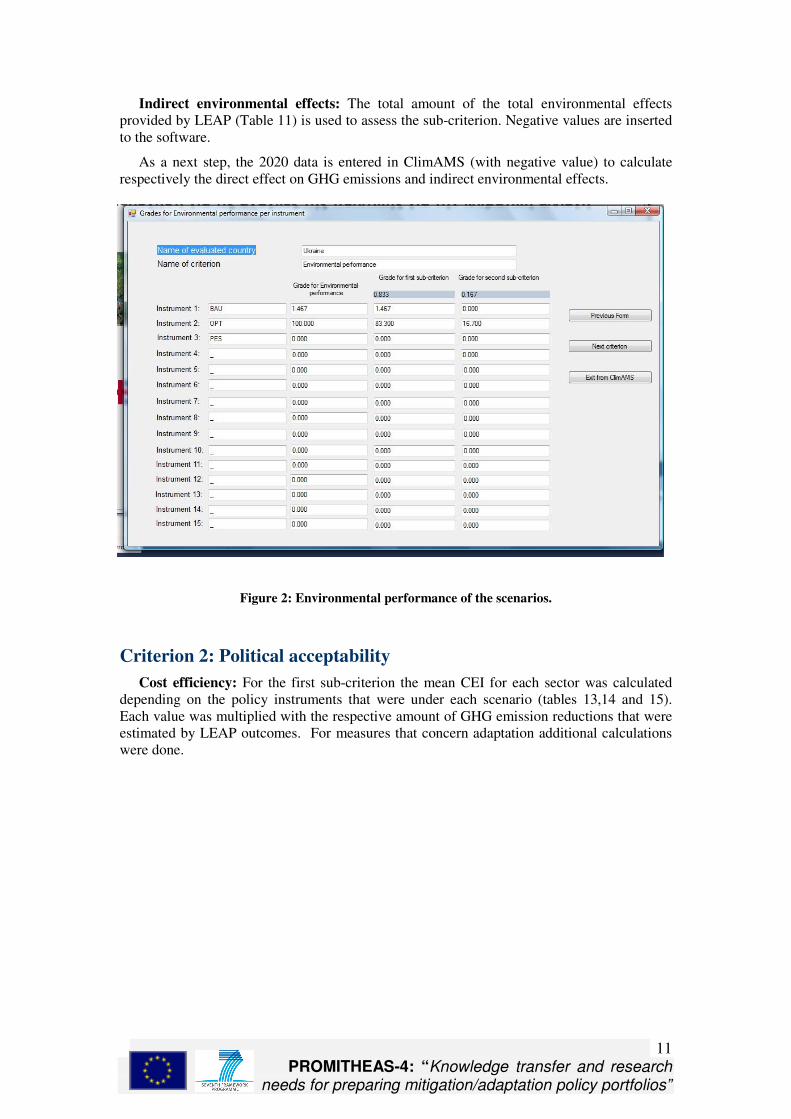
Indirect environmental effects: The total amount of the total environmental effects provided by LEAP (Table 11) is used to assess the sub-criterion. Negative values are inserted to the software.
As a next step, the 2020 data is entered in ClimAMS (with negative value) to calculate respectively the direct effect on GHG emissions and indirect environmental effects.
Figure 2: Environmental performance of the scenarios.
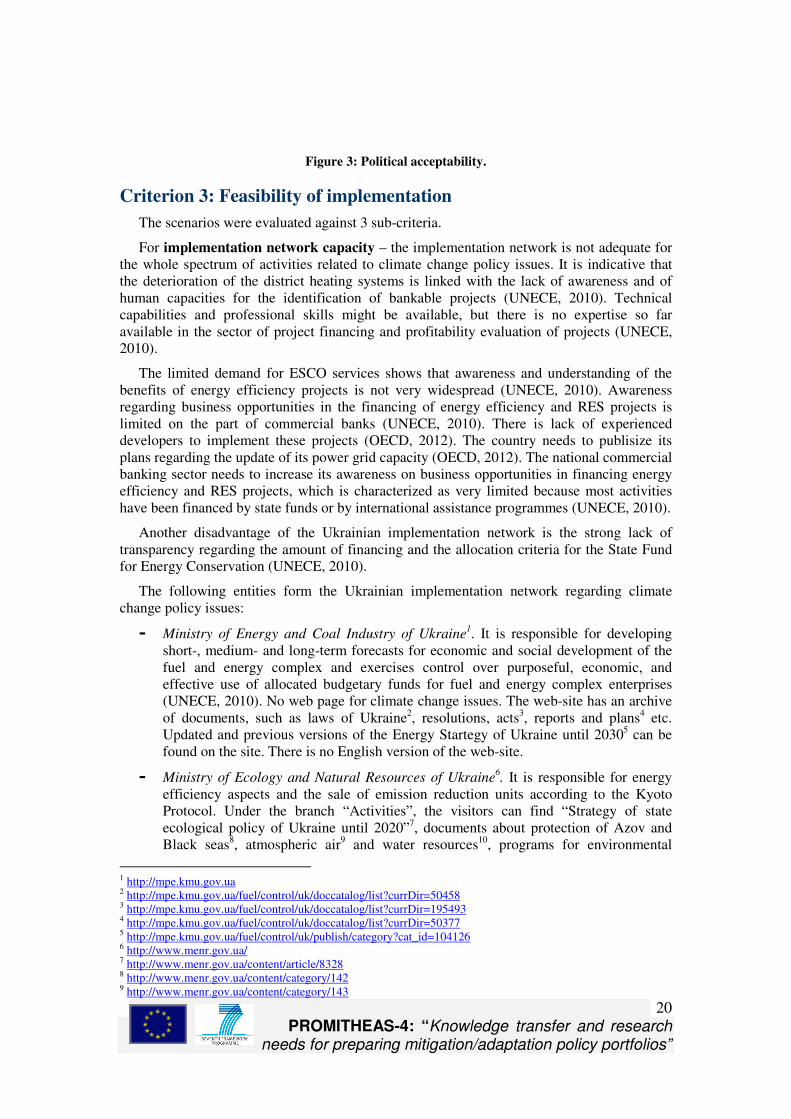
Criterion 2: Political acceptability
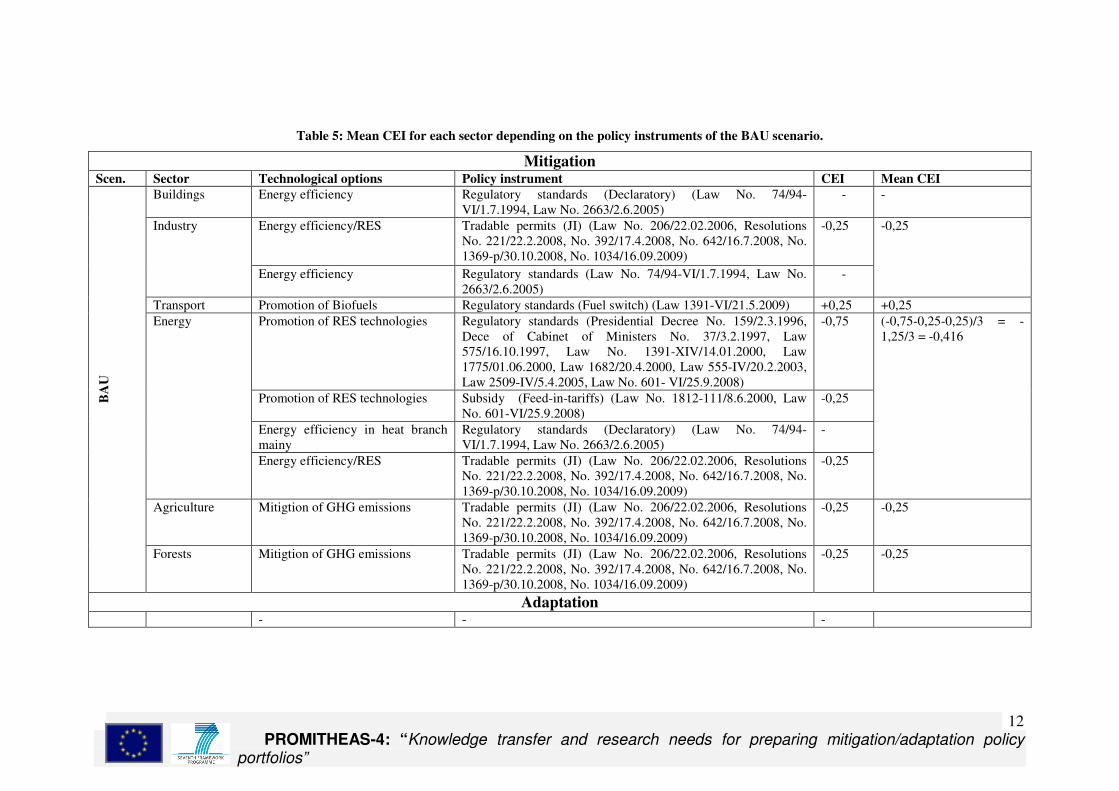
Cost efficiency: For the first sub-criterion the mean CEI for each sector was calculated depending on the policy instruments that were under each scenario (tables 13,14 and 15). Each value was multiplied with the respective amount of GHG emission reductions that were estimated by LEAP outcomes. For measures that concern adaptation additional calculations were done.
PROMITHEAS-4: “Knowledge transfer and research needs for preparing mitigation/adaptation policy
portfolios”
12
Table 5: Mean CEI for each sector depending on the policy instruments of the BAU scenario.
Mitigation Scen. Sector Technological options Policy instrument CEI Mean CEI
Buildings Energy efficiency Regulatory standards (Declaratory) (Law No. 74/94-VI/1.7.1994, Law No. 2663/2.6.2005)
- -
Energy efficiency/RES Tradable permits (JI) (Law No. 206/22.02.2006, Resolutions No. 221/22.2.2008, No. 392/17.4.2008, No. 642/16.7.2008, No. 1369-p/30.10.2008, No. 1034/16.09.2009)
-0,25 Industry
Energy efficiency Regulatory standards (Law No. 74/94-VI/1.7.1994, Law No. 2663/2.6.2005)
-
-0,25
Transport Promotion of Biofuels Regulatory standards (Fuel switch) (Law 1391-VI/21.5.2009) +0,25 +0,25
Promotion of RES technologies Regulatory standards (Presidential Decree No. 159/2.3.1996, Dece of Cabinet of Ministers No. 37/3.2.1997, Law 575/16.10.1997, Law No. 1391-XIV/14.01.2000, Law 1775/01.06.2000, Law 1682/20.4.2000, Law 555-IV/20.2.2003, Law 2509-IV/5.4.2005, Law No. 601- VI/25.9.2008)
-0,75
Promotion of RES technologies Subsidy (Feed-in-tariffs) (Law No. 1812-111/8.6.2000, Law No. 601-VI/25.9.2008)
-0,25
Energy efficiency in heat branch mainy
Regulatory standards (Declaratory) (Law No. 74/94-VI/1.7.1994, Law No. 2663/2.6.2005)
-
Energy
Energy efficiency/RES Tradable permits (JI) (Law No. 206/22.02.2006, Resolutions No. 221/22.2.2008, No. 392/17.4.2008, No. 642/16.7.2008, No. 1369-p/30.10.2008, No. 1034/16.09.2009)
-0,25
(-0,75-0,25-0,25)/3 = - 1,25/3 = -0,416
Agriculture Mitigtion of GHG emissions Tradable permits (JI) (Law No. 206/22.02.2006, Resolutions No. 221/22.2.2008, No. 392/17.4.2008, No. 642/16.7.2008, No. 1369-p/30.10.2008, No. 1034/16.09.2009)
-0,25 -0,25
BA
U
Forests Mitigtion of GHG emissions Tradable permits (JI) (Law No. 206/22.02.2006, Resolutions No. 221/22.2.2008, No. 392/17.4.2008, No. 642/16.7.2008, No. 1369-p/30.10.2008, No. 1034/16.09.2009)
-0,25 -0,25
Adaptation
- - -

PROMITHEAS-4: “Knowledge transfer and research needs for preparing mitigation/adaptation policy
portfolios”
13
Table 6: Mean CEI for each sector depending on the selected policy instruments of the OPT scenario.
Mitigation Scen. Sector Technological options Policy instrument CEI Mean CEI
Energy efficiency Regulatory standards (Declaratory) (Law No. 74/94-VI/1.7.1994, Law No. 2663/2.6.2005)
-
Energy efficiency Proposed (Draft Law) Performance standards -5,75
Energy efficiency Proposed – Subsidies (efficient appliances, lighting) -0,75
Buildings
Energy efficiency Proposed - Disemination policy instruments (Behaviour change) -0,25
(-5,75-0,75-0,25)/3 = -6,75/3 = -2,25
Energy efficiency/RES Tradable permits (JI) (Law No. 206/22.02.2006, Resolutions No. 221/22.2.2008, No. 392/17.4.2008, No. 642/16.7.2008, No. 1369-p/30.10.2008, No. 1034/16.09.2009)
-0,25 Industry
Energy efficiency Regulatory standards (Law No. 74/94-VI/1.7.1994, Law No. 2663/2.6.2005)
-
-0,25
Promotion of Biofuels Regulatory standards (Fuel switch) (Law 1391-VI/21.5.2009, Law No. 4970-VI/19.06.2012)
+0,25
Energy efficiency Proposed - Disemination policy instruments (Behaviour change) -0,25
Transport
Energy efficient vehicles Proposed - Subsidies -0,25
(+0,25-0,25-0,25)/3 = -0,25/3 = -0,083
Promotion of RES technologies Regulatory standards (Presidential Decree No. 159/2.3.1996, Dece of Cabinet of Ministers No. 37/3.2.1997, Law 575/16.10.1997, Law No. 1391-XIV/14.01.2000, Law 1775/01.06.2000, Law 1682/20.4.2000, Law 555-IV/20.2.2003, Law 2509-IV/5.4.2005, Law No. 601- VI/25.9.2008)
-0,75
Promotion of RES technologies Subsidy (Feed-in-tariffs) (Law No. 1812-111/8.6.2000, Law No. 601-VI/25.9.2008)
-0,25
Promotion of RES technologies Regulatory standards (Guarantee of origin) (Law No. 5485-VI/20.11.2012)
-0,75
Promotion of RES technologies Proposed - Subsidies, tax exemptions -0,25
Energy efficiency in heat branch mainly
Regulatory standards (Declaratory) (Law No. 74/94-VI/1.7.1994, Law No. 2663/2.6.2005)
-
Energy efficiency Proposed - Subsidies (Resolutions of Cabinet of Ministers No. 439/13.4.2011, No. 1056/17.10.2011, No. 615/11.07.2012, Law No. 3812-VI/4.10.2011)
-0,25
OP
T Energy
Energy efficiency/RES Tradable permits (JI) (Law No. 206/22.02.2006, Resolutions No. 221/22.2.2008, No. 392/17.4.2008, No. 642/16.7.2008, No.
-0,25
(-0,75-0,25-0,75-0,25-0,25-0,25)/6 = - 2,5/6 = -0,416

PROMITHEAS-4: “Knowledge transfer and research needs for preparing mitigation/adaptation policy
portfolios”
14
1369-p/30.10.2008, No. 1034/16.09.2009)
Agriculture Mitigtion of GHG emissions Tradable permits (JI) (Law No. 206/22.02.2006, Resolutions No. 221/22.2.2008, No. 392/17.4.2008, No. 642/16.7.2008, No. 1369-p/30.10.2008, No. 1034/16.09.2009)
-0,25 -0,25
Forests Mitigtion of GHG emissions Tradable permits (JI) (Law No. 206/22.02.2006, Resolutions No. 221/22.2.2008, No. 392/17.4.2008, No. 642/16.7.2008, No. 1369-p/30.10.2008, No. 1034/16.09.2009)
-0,25 -0,25
Adaptation
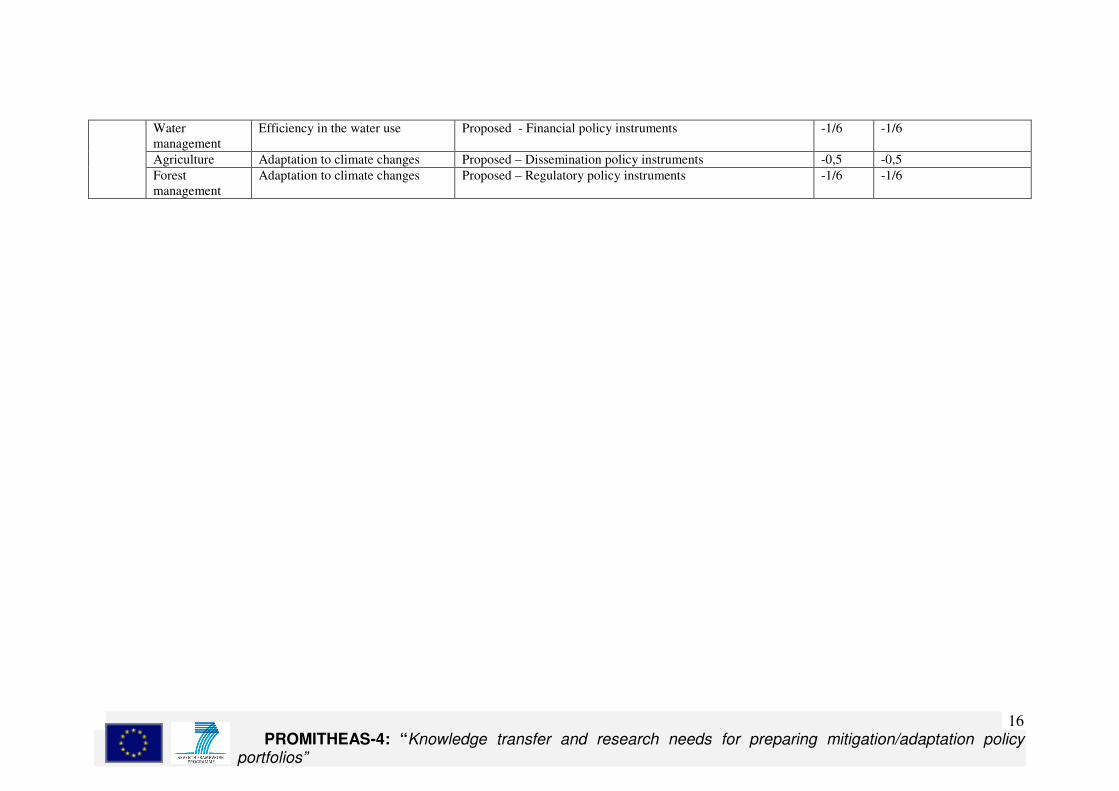
Efficiency in the water use Proposed - Financial policy instruments -1/6 Water management Efficiency in the water use Proposed – Dissemination policy instruments -1/6
(-1/6-1/6)/2 = -1/6
Adaptation to climate changes Proposed - Financial policy instruments -0,3 Agriculture
Adaptation to climate changes Proposed – Dissemination policy instruments -0,5
(-0,3-0,5)/2 = -0,4
Forest management
Adaptation to climate changes Proposed – Regulatory policy instruments -1/6 -1/6
PROMITHEAS-4: “Knowledge transfer and research needs for preparing mitigation/adaptation policy
portfolios”
15
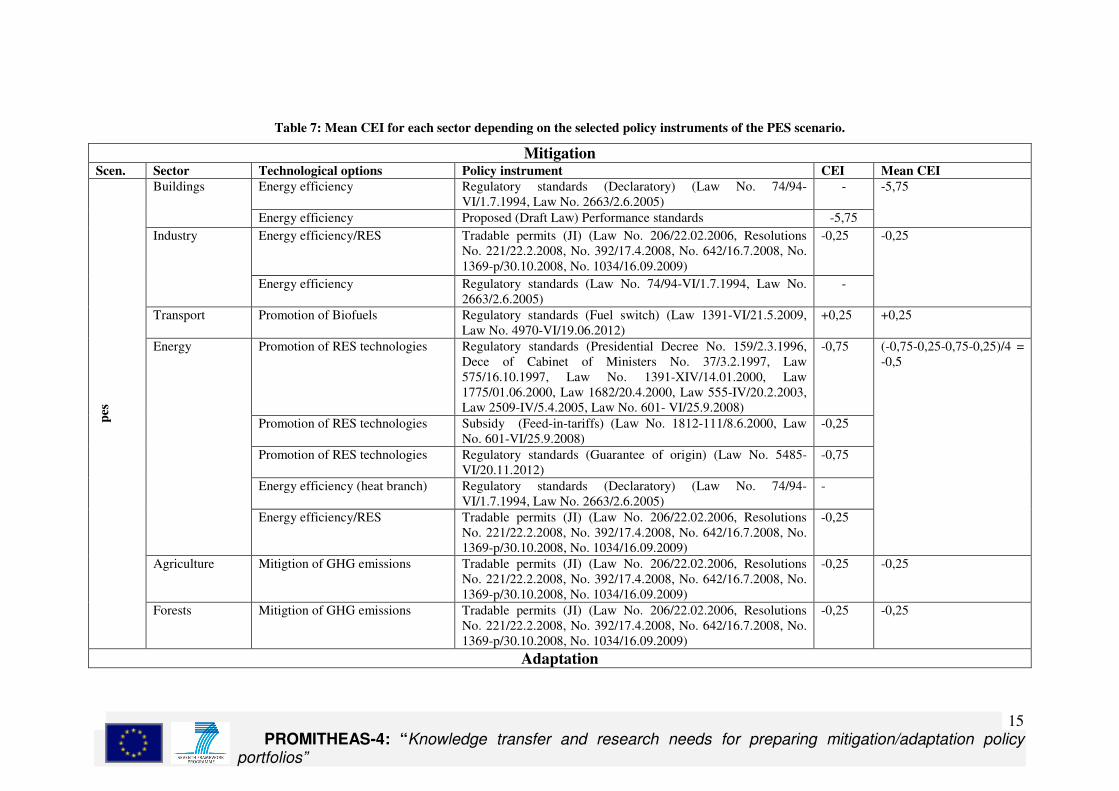
Table 7: Mean CEI for each sector depending on the selected policy instruments of the PES scenario.
Mitigation Scen. Sector Technological options Policy instrument CEI Mean CEI
Energy efficiency Regulatory standards (Declaratory) (Law No. 74/94-VI/1.7.1994, Law No. 2663/2.6.2005)
- Buildings
Energy efficiency Proposed (Draft Law) Performance standards -5,75
-5,75
Energy efficiency/RES Tradable permits (JI) (Law No. 206/22.02.2006, Resolutions No. 221/22.2.2008, No. 392/17.4.2008, No. 642/16.7.2008, No. 1369-p/30.10.2008, No. 1034/16.09.2009)
-0,25 Industry
Energy efficiency Regulatory standards (Law No. 74/94-VI/1.7.1994, Law No. 2663/2.6.2005)
-
-0,25
Transport Promotion of Biofuels Regulatory standards (Fuel switch) (Law 1391-VI/21.5.2009, Law No. 4970-VI/19.06.2012)
+0,25 +0,25
Promotion of RES technologies Regulatory standards (Presidential Decree No. 159/2.3.1996, Dece of Cabinet of Ministers No. 37/3.2.1997, Law 575/16.10.1997, Law No. 1391-XIV/14.01.2000, Law 1775/01.06.2000, Law 1682/20.4.2000, Law 555-IV/20.2.2003, Law 2509-IV/5.4.2005, Law No. 601- VI/25.9.2008)
-0,75
Promotion of RES technologies Subsidy (Feed-in-tariffs) (Law No. 1812-111/8.6.2000, Law No. 601-VI/25.9.2008)
-0,25
Promotion of RES technologies Regulatory standards (Guarantee of origin) (Law No. 5485-VI/20.11.2012)
-0,75
Energy efficiency (heat branch) Regulatory standards (Declaratory) (Law No. 74/94-VI/1.7.1994, Law No. 2663/2.6.2005)
-
Energy
Energy efficiency/RES Tradable permits (JI) (Law No. 206/22.02.2006, Resolutions No. 221/22.2.2008, No. 392/17.4.2008, No. 642/16.7.2008, No. 1369-p/30.10.2008, No. 1034/16.09.2009)
-0,25
(-0,75-0,25-0,75-0,25)/4 = -0,5
Agriculture Mitigtion of GHG emissions Tradable permits (JI) (Law No. 206/22.02.2006, Resolutions No. 221/22.2.2008, No. 392/17.4.2008, No. 642/16.7.2008, No. 1369-p/30.10.2008, No. 1034/16.09.2009)
-0,25 -0,25
pes
Forests Mitigtion of GHG emissions Tradable permits (JI) (Law No. 206/22.02.2006, Resolutions No. 221/22.2.2008, No. 392/17.4.2008, No. 642/16.7.2008, No. 1369-p/30.10.2008, No. 1034/16.09.2009)
-0,25 -0,25
Adaptation
PROMITHEAS-4: “Knowledge transfer and research needs for preparing mitigation/adaptation policy
portfolios”
16
Water management
Efficiency in the water use Proposed - Financial policy instruments -1/6 -1/6
Agriculture Adaptation to climate changes Proposed – Dissemination policy instruments -0,5 -0,5
Forest management
Adaptation to climate changes Proposed – Regulatory policy instruments -1/6 -1/6
PROMITHEAS-4: “Knowledge transfer and research
needs for preparing mitigation/adaptation policy portfolios”
17
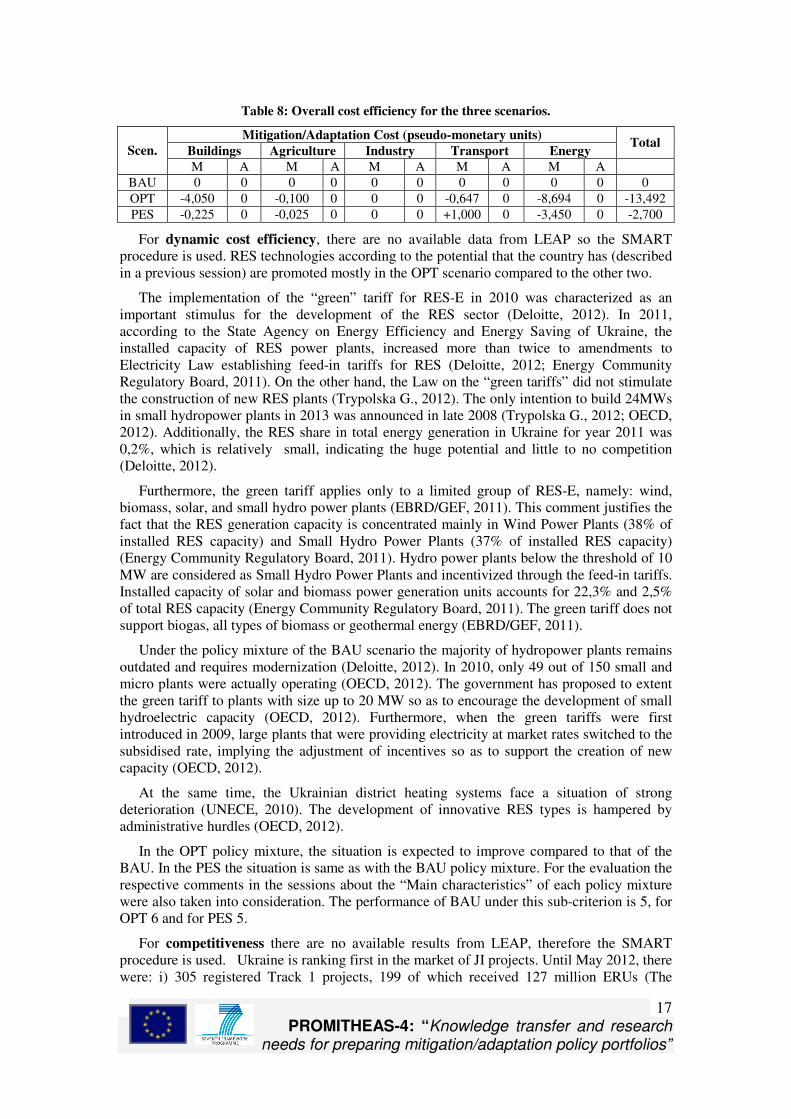
Table 8: Overall cost efficiency for the three scenarios.
Mitigation/Adaptation Cost (pseudo-monetary units)
Buildings Agriculture Industry Transport Energy Total
Scen.
M A M A M A M A M A
BAU 0 0 0 0 0 0 0 0 0 0 0
OPT -4,050 0 -0,100 0 0 0 -0,647 0 -8,694 0 -13,492
PES -0,225 0 -0,025 0 0 0 +1,000 0 -3,450 0 -2,700
For dynamic cost efficiency, there are no available data from LEAP so the SMART procedure is used. RES technologies according to the potential that the country has (described in a previous session) are promoted mostly in the OPT scenario compared to the other two.
The implementation of the “green” tariff for RES-E in 2010 was characterized as an important stimulus for the development of the RES sector (Deloitte, 2012). In 2011, according to the State Agency on Energy Efficiency and Energy Saving of Ukraine, the installed capacity of RES power plants, increased more than twice to amendments to Electricity Law establishing feed-in tariffs for RES (Deloitte, 2012; Energy Community Regulatory Board, 2011). On the other hand, the Law on the “green tariffs” did not stimulate the construction of new RES plants (Trypolska G., 2012). The only intention to build 24MWs in small hydropower plants in 2013 was announced in late 2008 (Trypolska G., 2012; OECD, 2012). Additionally, the RES share in total energy generation in Ukraine for year 2011 was 0,2%, which is relatively small, indicating the huge potential and little to no competition (Deloitte, 2012).
Furthermore, the green tariff applies only to a limited group of RES-E, namely: wind, biomass, solar, and small hydro power plants (EBRD/GEF, 2011). This comment justifies the fact that the RES generation capacity is concentrated mainly in Wind Power Plants (38% of installed RES capacity) and Small Hydro Power Plants (37% of installed RES capacity) (Energy Community Regulatory Board, 2011). Hydro power plants below the threshold of 10 MW are considered as Small Hydro Power Plants and incentivized through the feed-in tariffs. Installed capacity of solar and biomass power generation units accounts for 22,3% and 2,5% of total RES capacity (Energy Community Regulatory Board, 2011). The green tariff does not support biogas, all types of biomass or geothermal energy (EBRD/GEF, 2011).
Under the policy mixture of the BAU scenario the majority of hydropower plants remains outdated and requires modernization (Deloitte, 2012). In 2010, only 49 out of 150 small and micro plants were actually operating (OECD, 2012). The government has proposed to extent the green tariff to plants with size up to 20 MW so as to encourage the development of small hydroelectric capacity (OECD, 2012). Furthermore, when the green tariffs were first introduced in 2009, large plants that were providing electricity at market rates switched to the subsidised rate, implying the adjustment of incentives so as to support the creation of new capacity (OECD, 2012).
At the same time, the Ukrainian district heating systems face a situation of strong deterioration (UNECE, 2010). The development of innovative RES types is hampered by administrative hurdles (OECD, 2012).
In the OPT policy mixture, the situation is expected to improve compared to that of the BAU. In the PES the situation is same as with the BAU policy mixture. For the evaluation the respective comments in the sessions about the “Main characteristics” of each policy mixture were also taken into consideration. The performance of BAU under this sub-criterion is 5, for OPT 6 and for PES 5.
For competitiveness there are no available results from LEAP, therefore the SMART procedure is used. Ukraine is ranking first in the market of JI projects. Until May 2012, there were: i) 305 registered Track 1 projects, 199 of which received 127 million ERUs (The
PROMITHEAS-4: “Knowledge transfer and research
needs for preparing mitigation/adaptation policy portfolios”
18
National Ecological Centre of Ukraine, 2012); ii) 39 Track 2 projects with final determination, 27 of which generated almost 17 million ERUs. Two countries Ukraine (90 projects) and Russia (42 projects) have a significant share of the registered projects and ERUs (The National Ecological Centre of Ukraine, 2012). Annual data for new registered projects show that Ukraine produced the highest number of JI projects in 2011, followed by Russia that increased its project registrations in 2012 (The National Ecological Centre of Ukraine, 2012).
The World Bank financed some JI projects by buying almost one million Emission Reduction Units (ERUs) for the Netherlands European Carbon Facility (UNECE, 2010). It also supported the setting up of the Ukrainian Green Investment Scheme, while it intends to purchase Ukrainian AAUs and promote GHG emission reduction projects in the country (possibly with other international carbon funds) after 2012 (UNECE, 2010). Memoranda of Understanding exist already with France, Spain, Norway, and Switzerland (UNECE, 2010).
The country ranks in the 29th position regarding its attractiveness in RES investments (Ernest & Young, 2012). The reasons are the following. The production of power from RES has a much lower cost in Ukraine than in other countries (OECD, 2012). The production of one MWh of wind energy costs roughly 33 USD compared with 145 USD in the Czech Republic, and 50 USD in China (OECD, 2012). The average cost of producing electricity from wind farms is 0,027 EUR per kWh, significantly less than that in OECD countries (OECD, 2012). Wind energy benefits also from a feed-in tariff of 0,066 EUR per kWh, which makes the sector very attractive to foreign investors (OECD, 2012). Similarly, average costs for producing one KWh of bioelectricity in Ukraine are estimated at 0,057 EUR, while the current green tariff in Europe for bioelectricity is 0,127 per KWh EUR (OECD, 2012).
Forecasts refer to investments of approximately 5 bn USD for RES generation, including solar and wind energy, biomass and biofuel production, in the next five years (Deloitte, 2012). It is indicative that the level of green tariffs for wind power plants in Ukraine are slightly higher than the average level of 90 Euro/MWh across Europe, making this RES type very attractive for local and foreign developers from all over the world (Deloitte, 2012; EBRD/GEF, 2011). Additionally, a number of companies, including well-known companies such as: Sharp, Schneider Electric and Renewable Energy Corp are considering of Investing in solar modules production in Ukraine (Deloitte, 2012). At the beginning of 2012 there are approximately 30 private companies in the country investing in RES production, particularly in small hydropower plants (Deloitte, 2012).
On the other hand, competitiveness is affected due to the following reasons. There is difficulty in receiving access to credit resources due to the reluctance of banks to provide loans for investments with a payback period of more than one year (UNECE, 2010). No information is available regarding commercial financing for energy efficiency and RES, except for several Carbon Funds, active in the market of JI projects (UNECE, 2010). International investors have complained about no clearly stated criteria for admittance to the wholesale electricity market (OECD, 2012). There were reported cases for which approval was revoked for unclear to the investor reasons and granted only after months of negotiations (OECD, 2012).
The profitability of projects is put at risk due to inefficient market structures and incomplete market opening, with regulated prices on the wholesale market and below-market tariffs for end customers (UNECE, 2010). Municipal administrations apply political tariffs to the supply of heat, thus generating debt and loss of profitability (UNECE, 2010).
The introduction of incentives so as to increase the demand for ESCO services along with a network of auditors for implementing measures indicated by energy audits would probably contribute to the development of the market for energy efficiency measures more efficiently than the penalty system (UNECE, 2010).
PROMITHEAS-4: “Knowledge transfer and research
needs for preparing mitigation/adaptation policy portfolios”
19
For the BAU scenario Ukrainian agliculture is already affected by climate changes (see in “Key assumptions” of BAU, the session that refers to “Agriculture”. The policy mixture does not support the maintenance of its competitiveness. In OPT the situation is better.
Under BAU and OPT policy mixtures the country most probably will retain its competitiveness for the JI projects allowing through the GIS to invest in the energy sector. In the PES scenario due to the increased share of coal in the energy mix that will result to less tradable emission permits affecting the competitiveness of the country. The assigned grades are: BAU – 8, OPT – 8, PES-5.
For equity the ratio GHG emission reductions in MtCO2eq to capita is used. It is considered that the larger the ratio is the fairer is the scenario in sharing the burden among the sectors.
Table 9: Equity measurement.
Scenario Total amount of 2020 GHG emissions (MtCO2eq)
Reductions compared to BAU
Population in 2020 (in million)
Ratio reductions tCO2eq per capita
BAU 317,4 0 43,5 0
OPT 289,5 27,9 43,5 0,641
PES 317,9 -0,5 43,5 -0,011
For flexibility the scenarios are compared towards the incentives and the options that they offer to target groups. There are incentives to produce green electricity in Ukraine such as waivers of import duty and value added tax for the imported equipment, zero profits tax if profit is obtained from selling green electricity and waiver of rent of land used for the construction of RES facilities (Trypolska G., 2012). The supply of machinery and equipment to produce energy from RES types is exempted from import duty until 2019; the same situation is for bonus depreciation for new assets so as to stimulate investment in new capital assets; and profits derived in the period 2010 until 2019 from cogeneration and/or heat production using RES are exempted from taxation (Trypolska G., 2012). The situation in OPT scenario improves due to more incentives (subsidies).In PES these subsidies are not proposed. The grades are for BAU – 7, OPT -8 and PES-6.
For stringency for non-compliance, the level of stringency is determined by sanctions, penalties and other rules-influencing mechanisms for transgressors. There are penalties collected from companies that are not using energy efficiently (UNECE, 2010). No other information is available for the performance of the three policy portfolios under this sub-criterion. So, all are assigned with grade 5.
PROMITHEAS-4: “Knowledge transfer and research
needs for preparing mitigation/adaptation policy portfolios”
20
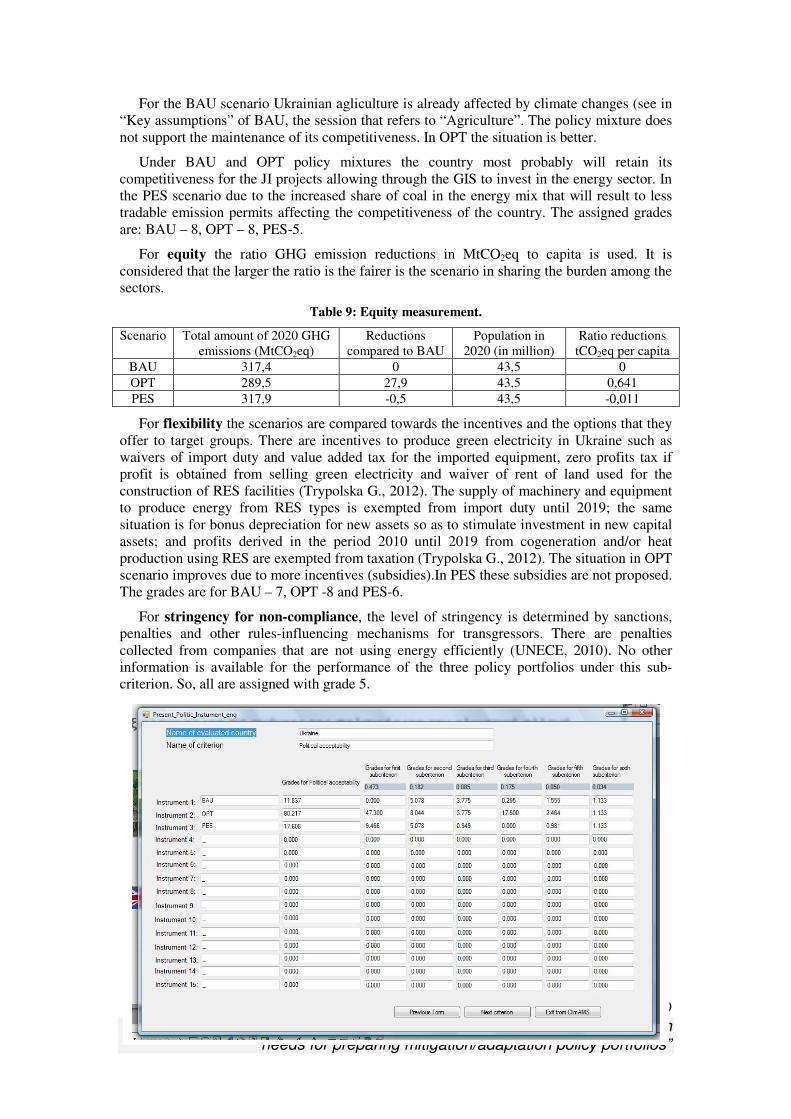
Figure 3: Political acceptability.
Criterion 3: Feasibility of implementation
The scenarios were evaluated against 3 sub-criteria.
For implementation network capacity – the implementation network is not adequate for the whole spectrum of activities related to climate change policy issues. It is indicative that the deterioration of the district heating systems is linked with the lack of awareness and of human capacities for the identification of bankable projects (UNECE, 2010). Technical capabilities and professional skills might be available, but there is no expertise so far available in the sector of project financing and profitability evaluation of projects (UNECE, 2010).
The limited demand for ESCO services shows that awareness and understanding of the benefits of energy efficiency projects is not very widespread (UNECE, 2010). Awareness regarding business opportunities in the financing of energy efficiency and RES projects is limited on the part of commercial banks (UNECE, 2010). There is lack of experienced developers to implement these projects (OECD, 2012). The country needs to publisize its plans regarding the update of its power grid capacity (OECD, 2012). The national commercial banking sector needs to increase its awareness on business opportunities in financing energy efficiency and RES projects, which is characterized as very limited because most activities have been financed by state funds or by international assistance programmes (UNECE, 2010).
Another disadvantage of the Ukrainian implementation network is the strong lack of transparency regarding the amount of financing and the allocation criteria for the State Fund for Energy Conservation (UNECE, 2010).
The following entities form the Ukrainian implementation network regarding climate change policy issues:
- Ministry of Energy and Coal Industry of Ukraine1. It is responsible for developing
short-, medium- and long-term forecasts for economic and social development of the fuel and energy complex and exercises control over purposeful, economic, and effective use of allocated budgetary funds for fuel and energy complex enterprises (UNECE, 2010). No web page for climate change issues. The web-site has an archive of documents, such as laws of Ukraine2, resolutions, acts3, reports and plans4 etc. Updated and previous versions of the Energy Startegy of Ukraine until 20305 can be found on the site. There is no English version of the web-site.
- Ministry of Ecology and Natural Resources of Ukraine6. It is responsible for energy
efficiency aspects and the sale of emission reduction units according to the Kyoto Protocol. Under the branch “Activities”, the visitors can find “Strategy of state ecological policy of Ukraine until 2020”7, documents about protection of Azov and Black seas8, atmospheric air9 and water resources10, programs for environmental
1 http://mpe.kmu.gov.ua 2 http://mpe.kmu.gov.ua/fuel/control/uk/doccatalog/list?currDir=50458 3 http://mpe.kmu.gov.ua/fuel/control/uk/doccatalog/list?currDir=195493 4 http://mpe.kmu.gov.ua/fuel/control/uk/doccatalog/list?currDir=50377 5 http://mpe.kmu.gov.ua/fuel/control/uk/publish/category?cat_id=104126 6 http://www.menr.gov.ua/ 7 http://www.menr.gov.ua/content/article/8328 8 http://www.menr.gov.ua/content/category/142 9 http://www.menr.gov.ua/content/category/143
PROMITHEAS-4: “Knowledge transfer and research
needs for preparing mitigation/adaptation policy portfolios”
21
protection11, ecological control 12, National Action Plan for 2012 for implementation of the economic reforms program for 2010-2014 "Prosperous Society, Competitive Economy, Effective Country"13. Under the “Normative Base” branch the visitors can find internal normative acts of MENR14, Laws of Ukraine on Environmental15, Resolutions of Cabinet of Ministers of Ukraine16 and Internation legislation on environmental17. There is no English version of the web-site.
- State Agency for Energy Efficiency and Energy Conservation (SAEEEC) 18 (former National Agency for Efficient Use of Energy Resources). It is a dedicated to energy efficiency institution (UNECE, 2013). More specifically, it is a central executive body, that supports implementation of state policy for the efficient use of energy resources,
energy saving, RES and alternative fuels. There is no branch for climate change issues. Reports and plans19 can be found under the branch “Activities”. Also the 2009 National Report about Implementation of the Energy Efficiency State Policy20 is under the “National Report” branch.
- State Environmental Investment Agency of Ukraine (NEIA)21
is the central executive body guided and coordinated by the Minister of Environmental Protection of Ukraine under the governance of the Cabinet of Ministers of Ukraine. NEIA has responsibilities for the regulation of anthropogenic adverse negative impact on climate change; to execute the provisions set in the UNFCCC and implement the mechanisms of the Kyoto Protocol including implementation of GHGs mitigation projects,
attracting investments for environmental protection. The climate change issue is under “Activities”, but with general information. Also under this branch information can be found about projects of targeted
environmental (green) investments22 and Joint Implementation projects23. Archive24 provides access to the following documents: Cancun materials, JI projects, National Communications, National Inventories, National Registry and other documents.
- The National Electricity Regulation Commission of Ukraine25 (NERC) is the state
regulatory body for the electricity sector. One of the main tasks of NERC is to implement the pricing and tariff policy in the power sector. The general principles of establishing energy tariffs are determined by Article 17 of the Law “On Electricity Sector” of 1997. No branch for climate change issues. There is no English version of the web-site.
- Agency for Rational Energy Use and Ecology (ARENA-ECO) was a leading Ukrainian non-profit research and project development organization providing services aimed at
10 http://www.menr.gov.ua/content/category/146 11 http://www.menr.gov.ua/content/category/147 12 http://www.menr.gov.ua/content/category/45 13 http://www.menr.gov.ua/content/category/320 14 http://www.menr.gov.ua/content/category/291 15 http://www.menr.gov.ua/content/article/181 16 http://www.menr.gov.ua/content/article/6049 17 http://www.menr.gov.ua/content/article/6051 18 http://saee.gov.ua/en/ 19 http://saee.gov.ua/plani-ta-zviti 20 http://dl.dropboxusercontent.com/u/64565343/nationalreport%20energy%20efficiency_2009.pdf 21 http://www.seia.gov.ua 22 http://www.seia.gov.ua/seia/control/main/uk/publish/category/625869 23 http://www.seia.gov.ua/seia/control/main/uk/publish/category/626220 24 http://www.seia.gov.ua/seia/control/main/uk/doccatalog/list 25 http://www.nerc.gov.ua/
PROMITHEAS-4: “Knowledge transfer and research
needs for preparing mitigation/adaptation policy portfolios”
22
the improvement of fuel and energy efficiency and environmental protection (UNECE, 2010). However, today there is no official web-site or other information can be found.
The Ministries of Economy, Finance, Coal Industry, Industry Policy, Regional Development and Building, Housing and Communal Services, Transport and Communications, Agrarian Policy and Education and Science are also involved in the Ukainian energy policy up to a certain degree, but less compared to the two aforementioned ministries (UNECE, 2010). There is no dedicated agency or institution for the development of RES (UNECE, 2010). This task was assigned to the SAEEEC, but this entity has institutional priorities regarding the promotion of energy efficiency (UNECE, 2010).
The assigned grades are: BAU - 6, OPT - 5 and PES -6. The OPT policy mixture requires a more experienced implementation network so as to promote RES. The current one can not support it.
For administrative feasibility — further strengthening of administrative capacity at all levels of the country and coordination between the authorities requires particular attention under the BAU scenario (CEC, 2009). Delays have been observed in other relevanet areas such as that of sustainable development, since the Ministry of Environmental Protection delayed in preparing and adopting the National Environment Strategy (which will serve also as the Strategy for Sustainable Development)(CEC, 2009). The draft was proposed to the Rada in 2009, but only recently the country adopted a National Environmental Strategy for 2020 and a National Action Plan to protect the environment on-going from 2011 to 201526(CEC, 2009) 27. Furthermeore, the feed-in tariff for RES is in place since 2008, but the coefficients for the calculation of prices were published only in spring 2009 (UNECE, 2010). This policy instrument still needs time for realizing if it is fully effective and make the necessary modifications. The legal framework for the energy sector in general and particularly that referring to energy efficiency and RES is complex and partly fragmented, partly outdated (UNECE, 2010).
Another issue is the low coordination which is indicative in the following observations. The potential for emissions reduction is presented in all submitted National Communications to UNFCCC, in a study by the National Aviation University and a few assessments by international organisations (Martyniuk Andriy, Ogarenko Yulia, 2012). The problem is that each one of these documents has different results since estimates are based on different methodologies and assumptions (Martyniuk Andriy, Ogarenko Yulia, 2012).
There does not seem to be coordination between the entities responsible for the national energy and climate change policy. The Ukrainian Energy Strategy until 2030 focuses on the need to reduce dependency on fuel imports, but the proposed investments mainly focus on further development of traditional fuels (coal, nuclear power) rather than on reducing domestic energy consumption and increasing deployment of RES (UNECE, 2010). The same strategy contains targets for energy efficiency and RES, but these targets are rather ambitious (50% reduction of energy intensity and share of 19% of RES in primary energy supply) and, in absence of an implementation plan, it is not clear how these targets will be achieved (UNECE, 2010). Ukraine does not regularly review its RES strategy targets as these are defined in the Energy Strategy of Ukraine 2030 (OECD, 2012).
Administrative procedures are a significant barrier to RES growth (OECD, 2012). Investors need to deal with six or more government agencies and institutions so as to comply with permitting procedures (OECD, 2012). This process requires time, increases the risk
26 http://euukrainecoop.com/2013/02/04/environment/ 27 These initiatives aim to bring Ukrainian environmental policy closer to EU standards. The EU pledged 35 million € through a Sector Budget Support Programme (SBS) to support the National Strategy and to assist the Ukrainain Ministry of Ecology and Natural Resources in better protection of the national environment.
PROMITHEAS-4: “Knowledge transfer and research
needs for preparing mitigation/adaptation policy portfolios”
23
levels for businesses and increase the possibility for corruption (OECD, 2012). Consequently, investment costs for domestic and foreign investors are increased and producers are exposed to a high level of operational risk, since the decision to give players access to the electricity market and grant the green tariff is postponed until after the plant is built (OECD, 2012).
Adimistrative issues are related to gaps in the legislation. NERC provides green tariffs to projects that have fulfilled the required documentation (EBRD/GEF, 2011). NERC has found some difficulties in defining those tariffs when the involved input fuel was biomass, since in the Law of Electricity there is no coefficient defined for electricity produced from the biomass of animal origin (biogas from animal origin) (EBRD/GEF, 2011).
The situation will worsen in the case of an OPT policy mixture due to its increased demands in coordination and preparations. For PES the siyuation is almost the same as in BAU. The grades are: for BAU – 4, for OPT -3 and for PES-4.
For financial feasibility – The governmental sources of financing are the State (national) Budget and local budgets at all levels (UNECE, 2010). So far, no funds are assigned for the development of RES (UNECE, 2010). Budgets/ funds for energy saving measures/ investments have been inadequate (Ministry of Strategy and Finance, the Republic of Korea, 2010). The deterioration of the district heating systems is linked with the lack of financial resources of the Ukrainian municipal administrations (UNECE, 2010).
In 2005-2006 the Government allocated approximately 800 million UAH (equivalent to 160 million USD) including local budgets, to implement measures envisaged by the Comprehensive State Programme of Energy Saving (CSPES) of Ukraine and the Programme of State Support of Development of Alternative and Renewable Energy Sources and Small Hydropower and Thermal Power (UNECE, 2010). However, the Comprehensive State Program of Energy Saving was 60% underfunded (Ministry of Strategy and Finance, the Republic of Korea, 2010). The funding covered only 33,1% of the amount planned in 1997 for the whole period of the programme, which accounted for 30 billion UAH (equivalent with 6.5 billion USD), including 640 million UAH (130 million USD) from the state budget to compensate for budget increases due to inflation (Ministry of Strategy and Finance, the Republic of Korea, 2010). In 2008, the Ukrainian State Budget allocated 13 million UAH for energy saving measures, while in 2009 20 million UAH were allocated (UNECE, 2010). In 2010, actually only an amount of 9,9 billion UAH (about 2,1 billion USD) was allocated for implementing the CSPES energy efficiency program planned by the NERC (Ministry of Strategy and Finance, the Republic of Korea, 2010).
Ukraine intends to invest 30 billion USD or 6 billion USD (about 3,3% of GDP in 2008) per year, over the time period 2009-2014 for energy saving measures (Ministry of Strategy and Finance, the Republic of Korea, 2010). 25% of these investments will be financed by the state budget using revenues from emissions trading, surcharges on thermal power plants, funds financed by industries and foreign investments (Ministry of Strategy and Finance, the Republic of Korea, 2010). That is why it is important for Ukraine to create a business-friendly environment to attract enough foreign investments in energy saving projects (Ministry of Strategy and Finance, the Republic of Korea, 2010).
In early 2008, the Government established the State Energy Conservation Fund as a budgetary fund for financing energy efficiency improvements (UNECE, 2010). Its main aim is to provide financing for energy saving projects through the facilitation of interest loan payments, mainly in the state sector (UNECE, 2010). The revenues of the fund come from penalties collected from companies that are not using energy efficiently (UNECE, 2010).
The financial resources for implementing the Ukrainian climate change policy are from:
- International sources
PROMITHEAS-4: “Knowledge transfer and research
needs for preparing mitigation/adaptation policy portfolios”
24
� BSTDB: In the next years BSTDB will support the implementation of governmental programs and priorities, while responding to market demand. Particulalrly, the bank will support the development of energy infrastructure, including energy efficiency though projects (BSTDB, 2011). The Bank will seek projects contributing to rehabilitation of the existing energy transport and storage infrastructure and are designed to expand existing export capacities (BSTDB, 2011). It will also support projects designed to improve regional energy transport and handling infrastructure. The Bank will explore opportunities for: i) projects in oil and gas downstream, (ie expansion of retail networks, upgrading of oil refinery and petrochemical facilities by improving their product quality or the environmental acceptability of refined products); ii) upgrading, modernization and/or expansion of energy infrastructure that facilitate power generation, transmission, distribution and sale. This may include green-field start-ups or the renovation of existing power capacities in Ukraine; iii) RES projects such as solar, wind and hydropower (BSTDB, 2011).
� World Bank: The Bank provides financial support for sustainable solutions regarding energy efficiency through a credit line, namely the Energy Efficiency Project, 200 million US$, approved by the Board in May 2011. This project provides access to long-term financing for municipalities and industrial enterprises specifically for projects linked with commercially viable energy efficiency investments. (World Bank, 2012b). The Bank cooperates with Ukraine in the framework of mechanisms, such as the Carbon Partnership Facility (with capitalization of five billion USD) with its two structural units: Carbon Assets Development Fund and Carbon Fund, and the Climate Investment Funds (Strategic Climate Fund and Clean Technology Fund) (UNECE, 2010).
Additionally the World Bank is setting up a credit line with sub-lending by financial intermediaries targeting for medium-large industrial and municipal energy efficiency projects. Project criteria, other thresholds and project pipeline are under elaboration. The financial mechanism that is under consideration is a credit line supported by two additional concessional instruments: 1) Partial Credit Guarantee from the Clean Technology Fund for municipal borrowers; 2) Green Investment Scheme - compensation for GHG emissions from AAU sales in cooperation with the Ukrainian Government (UNECE, 2010).
� EBRD: It supports energy efficiency investments in Ukraine. The total amount of EBRD investments in Ukraine is approximately one billion USD, with 20-30% of this amount allocated for energy efficiency projects (UNECE, 2010). It intends to implement the Ukraine Energy Efficiency Programme-2 (UKEEP-2) after the success of the already existing 100 million EUR UKEEP programme for energy efficiency and RES projects (up to five million USD) (UNECE, 2010). The EBRD works with four to five local Ukrainian banks (UNECE, 2010). The applied interest rate of the EBRD is 5%, which is the LIBOR rate plus 3%. EBRD is implementing also the Sustainable Energy Initiative, for energy efficiency, RES and carbon financing (UNECE, 2010). The EBRD signed an agreement in 2011 worth of 200 million EUR over a period of 15 years to reconstruct 21 units at six of Ukrhydroenergo’s hydropower plants by 2017 (OECD, 2012). This initiative will not only boost capacity by over 80MW, but it will also increase the equipment’s lifespan by 30 to 40 years (OECD, 2012).
� Neighbourhood Investment Facility (NIF) (under the European Neighbourhood
and Partnership Instrument). The facility has allocated a substantial amount for
PROMITHEAS-4: “Knowledge transfer and research
needs for preparing mitigation/adaptation policy portfolios”
25
the country for efficiency improvements in the electricity infrastructure and the development of RES policies (CEC, 2009). More specifically, three projects in Ukraine were approved in 2008, committing 6,6 million EUR in technical assistance, expected to leverage 608 million EUR in loans of European Finance Institutions in the transport energy and social sector. (CEC, 2009). The country benefits also from cooperation activities financed under the ENPI multi-country (including the Neighbourhood Investment Facility) and regional programmes and is eligible under the ENPI Cross Border Cooperation component.
� United States Agency for International Development (USAID): It approved financing (one million USD) for the implementation of energy efficiency projects in the industrial sector. According to the Bank Forum Commerzbank Group, this financing was not fruitful, since the requirements of USAID towards the applicants were too restrictive (UNECE, 2010).
- National sources
� GIS revenues could contribute to reduce transport emissions by: i) Promotion of the use of bio-fuels or energy-efficient public transport, possibly in cooperation with stakeholders from the agriculture or forestry sectors. Ukraine hosts biofuel projects but building biofuel supply systems requires large initial capital investments. GIS revenues could support price guarantees on biofuels or provide financial assistance to investors in early project development. ii) Discontinue modal shift from rail and water to road and air transport by introducing high-speed trains as alternative to short-distance flights. iii) Stimulate fuel switch from oil-based fuels to natural gas-based fuels (ie in busses). iv) Promotion of energy efficient motors in electricity- and fossil fuel-based transport. v) Promote consumer behaviour change—more passengers per vehicle; walking and cycling; and economical vehicle operation. (World Bank, 2006)-GIS
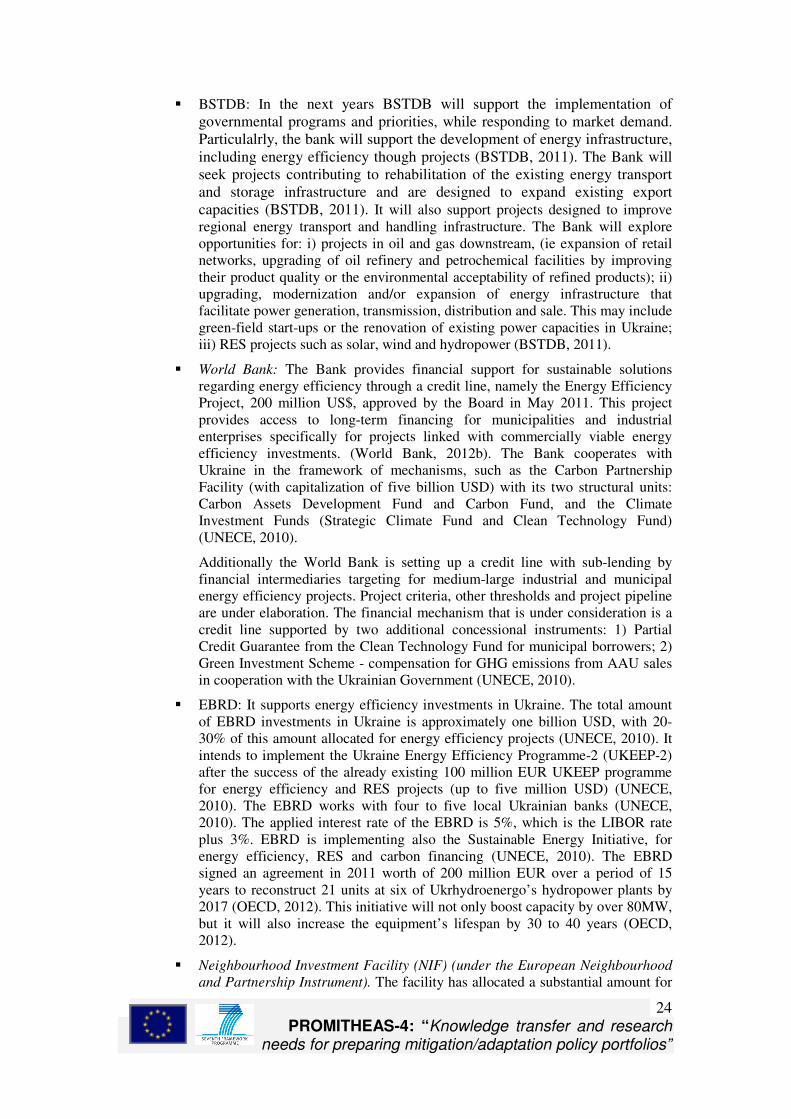
The scenarios are graded with BAU – 6 (due the low performance so far under this sub-criterion), OPT and PES with 7 (because the created momentum improves their performance under this sub-criterion).
PROMITHEAS-4: “Knowledge transfer and research
needs for preparing mitigation/adaptation policy portfolios”
26
Figure 4: Feasibility of implementation.
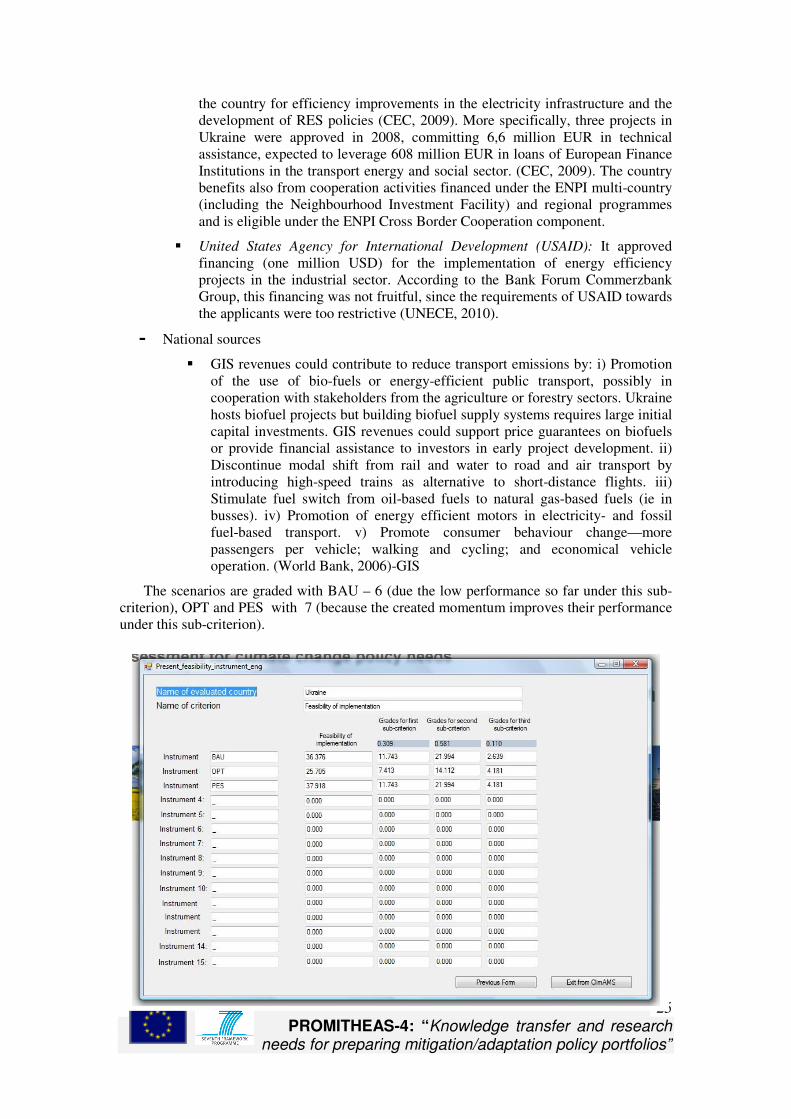
The overall final score for each policy portfolio is presented in the below figure:
Figure 5: Final grades.
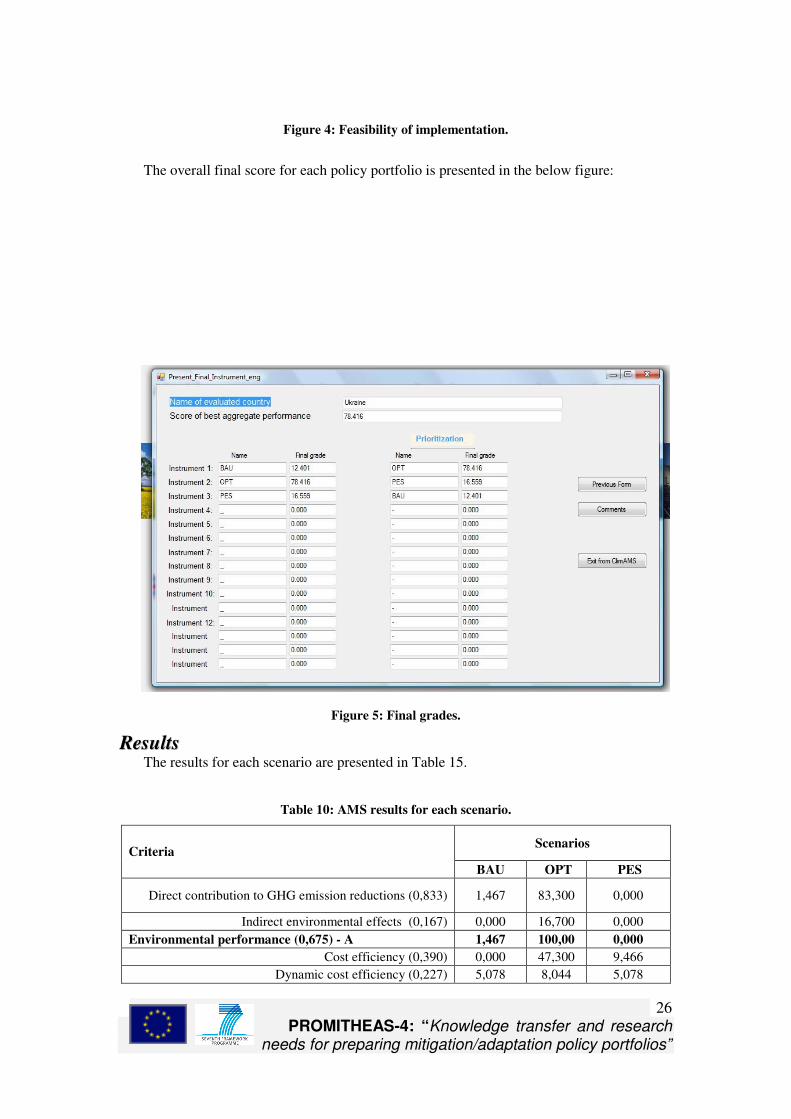
RReessuullttss The results for each scenario are presented in Table 15.
Table 10: AMS results for each scenario.
Scenarios Criteria
BAU OPT PES
Direct contribution to GHG emission reductions (0,833) 1,467 83,300 0,000
Indirect environmental effects (0,167) 0,000 16,700 0,000
Environmental performance (0,675) - A 1,467 100,00 0,000
Cost efficiency (0,390) 0,000 47,300 9,466
Dynamic cost efficiency (0,227) 5,078 8,044 5,078
PROMITHEAS-4: “Knowledge transfer and research
needs for preparing mitigation/adaptation policy portfolios”
27
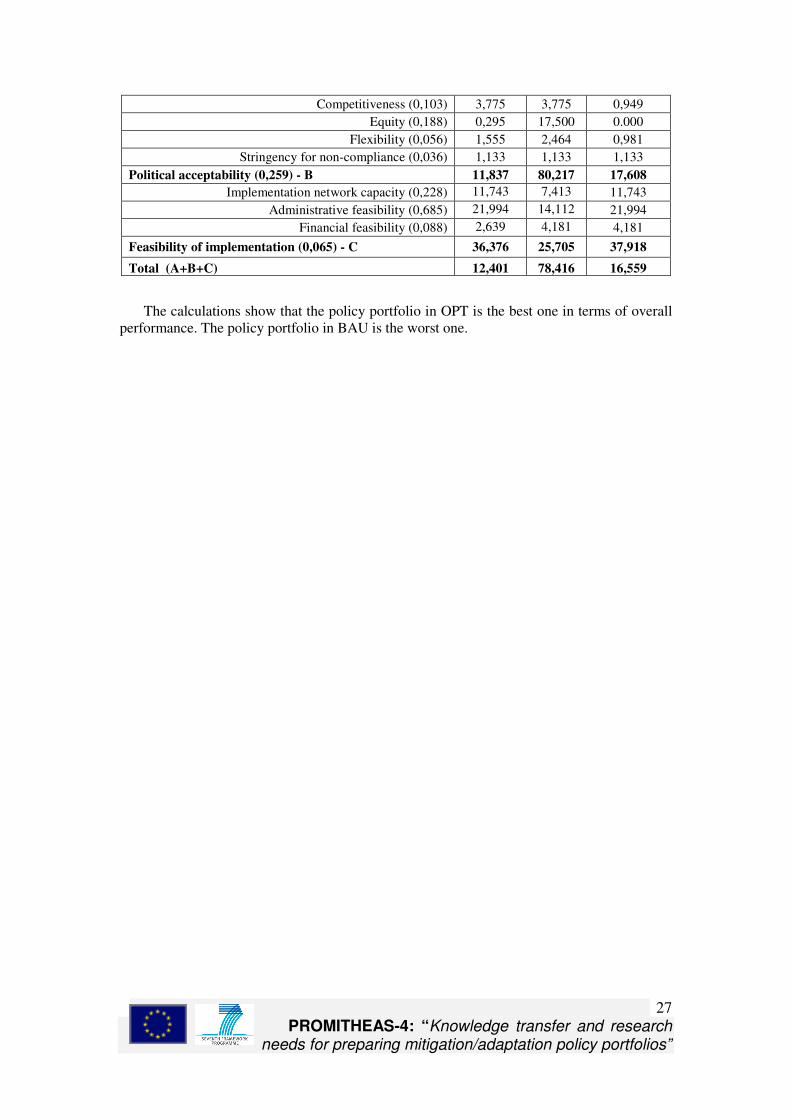
Competitiveness (0,103) 3,775 3,775 0,949
Equity (0,188) 0,295 17,500 0.000
Flexibility (0,056) 1,555 2,464 0,981
Stringency for non-compliance (0,036) 1,133 1,133 1,133
Political acceptability (0,259) - B 11,837 80,217 17,608
Implementation network capacity (0,228) 11,743 7,413 11,743
Administrative feasibility (0,685) 21,994 14,112 21,994
Financial feasibility (0,088) 2,639 4,181 4,181
Feasibility of implementation (0,065) - C 36,376 25,705 37,918
Total (A+B+C) 12,401 78,416 16,559
The calculations show that the policy portfolio in OPT is the best one in terms of overall performance. The policy portfolio in BAU is the worst one.
PROMITHEAS-4: “Knowledge transfer and research
needs for preparing mitigation/adaptation policy portfolios”
28
RReeffeerreenncceess
Christiane Egger, Reinhold Priewasser, Michaela Kloiber , Lucia Bezáková, Nils Borg , Dominique Bourges, Peter Schilken, 2012. SURVEY REPORT-Progress in energy efficiency policies in the EU Member States - the experts perspective, Findings from the Energy Efficiency Watch Project. Available at: http://www.energy-efficiency-watch.org/fileadmin/eew_documents/EEW2/EEW_Survey_Report.pdf
Deloitte, 2012. Industry overview – Renewable energy in Ukraine. Available at: http://investukraine.com/wp-content/uploads/2012/06/Renewable-energy-in-Ukraine_230_230_WWW.pdf
EBRD/GEF, 2011. Assistance to the National Energy Regulatory Commission of Ukraine: Regulatory Support Programme - TCS ID: 29084, Subtask I: Full implementation of the existing Green Tariff Law and Methodology. Available at: http://www.uself.com.ua/fileadmin/documents/Task_1_Final_Report_eng.pdf Energy Community Regulatory Board, 2011. Promotion of Electricity produced from Renewable Energy Sources in the Energy Community. Available at: http://www.energy-community.org/pls/portal/docs/1284180.PDF
Ernest & Young, 2012. Renewable energy country attractiveness indices. Issue 34, August 2012. Available at: http://www.ey.com/Publication/vwLUAssets/Renewable_energy_country_attractiveness_indices_-_August_2012/$FILE/Renewable_energy_country_attractiveness_indices_Aug_2012.pdf
European Commission, Directorate-General for Agriculture and Rural Development, 2009. The Agricultural Sector and Trade in Ukraine. Available at: http://s3.amazonaws.com/zanran_storage/ec.europa.eu/ContentPages/97872053.pdf
Konidari P. and Mavrakis D., 2006. Multi-criteria evaluation of climate policy interactions. Journal of Multi-Criteria Decision Analysis 14, pp 35 – 53.
Konidari P. and Mavrakis D., 2007. A multi-criteria evaluation method for climate change mitigation policy instruments. Energy Policy 35, pp 6235-6257.
Ministry of Strategy and Finance, the Republic of Korea, 2010. Energy Efficiency Improvement and New and Renewable Energy Development Strategies for Ukraine. The document was prepared for The Government of Ukraine. The National Agency of Ukraine on Ensuring of Efficient Use of Energy Resources Management (NAER) also cooperated for its preparation. Available at: www.kier-wind.org and http://www.google.gr/url?sa=t&rct=j&q=&esrc=s&frm=1&source=web&cd=1&ved=0CC4QFjAA&url=http%3A%2F%2Fwww.kier-wind.org%2Fbd%2Fdownload.php%3F%26bbs_id%3Ddata%26page%3D%26type%3D1%26doc_num%3D67%26PHPSESSID%3D59c9dae40d07ca647adadef1fdbf074a&ei=KnGPUaHhIKe60QWDv4D4DA&usg=AFQjCNF-0oGwT6UcdQDaG4ZzOn7io1hB6w&sig2=2s8DqFWzZf2dJCGpEgMyzQ&bvm=bv.46340616,d.d2k OECD, 2012. Attracting Investment in Renewable Energy in Ukraine. Available at: http://www.oecd.org/countries/ukraine/UkraineRenewableEnergy.pdf The National Ecological Centre of Ukraine, 2012. The integrity of JI projects in Ukraine. Available at: http://en.necu.org.ua/files/2012/11/JIUkrainian_IntegrityStudy_en.pdf Trypolska Galyna, 2012. Feed-in tariff in Ukraine: The only driver of renewables’ industry growth? Energy Policy 45, pp. 645-653 http://ec.europa.eu/europeaid/documents/aap/2012/af_aap_2012_ukr_p2.pdf Donors - http://publicfinance.undp.sk/en/show/449C6E63-F203-1EE9-BD97A5F6C21E0F2A
http://ec.europa.eu/economy_finance/publications/publication12678_en.pdf

PROMITHEAS-4: “Knowledge transfer and research
needs for preparing mitigation/adaptation policy portfolios”
29
http://www.switzerland-ge.com/schweiz/export/de/filefield-private/files/41878/field_blog_public_files/8625 http://www.oecd.org/tad/agricultural-policies/34031855.pdf

PROMITHEAS-4: “Knowledge transfer and research
needs for preparing mitigation/adaptation policy portfolios”
30
CCOONNCCLLUUSSIIOONNSS This report concerns the development and assessment of three (3) climate change
mitigation and adaptation policy scenarios for Ukraine. Each of them is characterized by a different policy portfolio and is named after it as Business As Usual (BAU), Optimistic (OPT) and Pessimistic (PES).
All scenarios take into consideration the following national objectives: i) 0% reduction by 2012 of its GHG emissions compared to those of base year 1990; ii) contribution of biomass to the total primary energy consumption by 5% in 2020 and 10% in 2030, including 10% target for the share of biofuels in transport by 2020.
According to the “Report on demonstrable progress under the Kyoto Protocol” prepared by the Ministry of Environmental Protection of Ukraine in 2006, the emission forecasts for 2012 indicated that the level of emissions of year 1990 will not be exceeded.
BAU scenario
The BAU scenario concerns the time evolution of the already implemented mitigation and adaptation policy instruments (set into force before 31 December 2010) in Ukraine until the year 2050 and serves as the reference against which the outcomes of the other scenarios are compared.
The currently implemented Ukrainian mitigation policy has four main components: i) penetration of RES in the gross final energy consumption, ii) support to increase energy efficiency; iii) GHG emission reductions through JI and iv) selling of AAUs though the GIS. Concerning the adaptation policy, there are no implemented policy instruments.
According to the outcomes of the model Long range Energy Alternatives Planning System (LEAP) for the BAU scenario in 2020 the GHG28 emissions are increased compared to those of year 200529 by almost 65%. The RES share in the transport sector for year 2020 is 5% (due to the absence of supportive mechanisms) and in electricity generation 0%.
OPT scenario
The Optimistic scenario concerns the time evolution of an enhanced mitigation/adaptation policy portfolio that Ukraine will implement during the time interval 2011 - 2050. This enhanced policy portfolio takes into account the policy instruments adopted after 1st January 2011 as well as plans of the country and supports: i) the introduction of efficient technologies in almost all sectors targeting to the maximum reduction of GHG emissions through the maximum exploitation of the potential of the country in energy efficiency and renewable energy sources and ii) the necessary infrastructure for the adaptation of the country towards the minimum – in size and extent - expected climate change impacts.
The policy portfolio of this scenario includes a wider range of policy instruments compared to those that synthesize the BAU scenario. Performance standards, financial policy instruments (subsidies and grants), dissemination policy instruments (awareness campaigns and seminars) are proposed for the main economic national sectors. Adaptation policy instruments are foreseen for the water, agricultural and forestry sector.
Based on the outcomes of the LEAP model for the OPT scenario, GHG emissions in Ukraine will increase by 51% in 2020 compared to those of year 2005. The share of RES in
28 For biofuels the amount of air pollutant were not available in LEAP for all branches. 29 GHG emission sources which are taken into consideration in this study do not include the “Oil transformation” sector due to missing data. Due to this lack of data there is difference between the official historical data for GHG emissions and those calculated by the LEAP model.
PROMITHEAS-4: “Knowledge transfer and research
needs for preparing mitigation/adaptation policy portfolios”
31
the transport sector in 2020 will be 4,7% (biofuels), and 11,2% in electricity production. The final energy consumption in 2020 will be reduced by 5% compared to that of BAU for the same year.
PES scenario
The Pessimistic scenario concerns the time evolution of a mitigation/adaptation policy portfolio that the country will implement up to 2050 without exploiting fully the national potential in energy efficiency and renewable energy sources and by facing the worse expected impacts of climate change, taking into account the policy instruments adopted after 1st January 2011.
This scenario assumes less ambitious mitigation policy by limiting the possible technological options only to a selected number of sectors with the highest energy efficiency potential and the most promising for the country types of RES. The scenario considers the implementation of all policies approved (existing or planned) policies, but no additional policies apart from in line with the EU climate change policy and the country priorities.
According to the outcomes of the LEAP model for the PES scenario, GHG emissions in Ukraine will increase by 65% compared to those of year 2005. The share of RES in the transport sector in 2020 will be 2,4% and in the electricity generation it will be 7,35%. The final energy consumption in 2020 will reduced by 2% compared to compared to that of BAU for the same year.
Assessment outcomes30
Using the multicriteria method AMS, the three (3) policy portfolios were assessed against their environmental performance (amount of GHG emissions and secondary environmental effects), political acceptability (attitude of the involved entities (target groups) towards the relevant policy portfolio) and feasibility of implementation (applicability of the policy portfolio from the point of the governmental and national pertinent entities).
The PES scenario has the largest amount of GHG emissions, followed very closely by the BAU scenario.
The policy portfolio of the OPT scenario has the best performance in political acceptability since it is the most cost effective for the target groups (residential, industrial, energy and transport sectors) compared to the other two policy portfolios. It offers a fair distribution of the “climate change” burden among the respective sectors and allows the economic sectors to be more competitive. It offers more flexibility for the target groups in complying with their obligations under the specific policy portfolio.
The performance of the three scenarios under the third criterion is better for BAU and PES and worse for OPT. The country has established an implementation network that is not able to adjust properly its activities under a more strict policy portfolio like that of OPT compared to the BAU one. The country will receive the necessary funds for the implementation of its supportive policy instruments for RES and energy efficiency.
It is worth mentioning that the performance of BAU and PES are very close. Even if the PES scenario has more climate change policy instruments compared to BAU, its performance in delivering GHG emission reductions is the same due to the increased share of coal and the reduced use of natural gas.
Given the above, the mitigation/adaptation policy portfolio which characterizes the Optimistic scenario is the one that allows the achievement of most goals of the climate change policy of Ukraine. Nevertheless, the success of this policy portfolio requires the
30 The assessment outcomes depend on the level of expertise of the person who makes the assessment as well as the degree of justification concerning the sub-criteria.
PROMITHEAS-4: “Knowledge transfer and research
needs for preparing mitigation/adaptation policy portfolios”
32
encouragement of business investments in RES and energy efficiency projects, the continuation of the demonstated effectiveness of the implementation network and a more stringent frame for non-compliance.
In this report, the component of adaptation in climate change policy is not fully developed since the country hasn’t set an adequate framework to reduce its vulnerability to climate change. Moreover, the design and assessment of relevant policy instruments require data related to the frequency of extreme events, water resources and use, low-income groups, biodiversity, the health sector, etc., which are not available at the moment.
Concluding, the scenarios of this report were developed under the same assumptions for the evolution of GDP and population for the period 2011-2050. In order to perceive the performance and applicability of the three (3) policy portfolios, the report should include six (6) more scenarios with the combinations “low population growth – high GDP growth” and “high population growth-low GDP growth”, according to the socioeconomic frameworks presented in the IPCC pathways (new generation of IPCC scenarios).


![L+# * ($# ! * $ * #& # * *' # $* *(+#% )€¦ · = lim [ ( ) − ] = lim + − 4 + 4 − 4 + 4 − = + − 4 + 4 − ( − 4 + 4 ) − 4 + 4 = lim 5 − 8 + 4 − 4 + 4 = ∞ ∞](https://img.pdfslide.tips/doc/110x75/5f483e2f6fe8343e605bd54f/l-lim-a-lim-a-4-4.jpg)