Embed Size (px)
Citation preview

1
زةـــغــالمية بــة اإلسـعــــامــالج
The Islamic University of Gaza
ياــــــــات العلــــادة الدراســــعم High Studies Deanery
ةـــــــــــندســــــة الهـــــــــــــكليـ Faculty of Engineering
ةـــــة المدنيـــدســـــم الهنـــــقس Civil Engineering Department
تأهيلو تصميم برنامج آتــالمنش Design and Rehabilitation of Structures
Properties of Concrete Mixes with Waste Glass
Submitted by:
Abdullah A. Siam
(2007/634)
Supervised by:
Dr. Mamoun Al-Qedra
Dr. Mohammed Arafa
A Thesis Submitted in Partial Fulfillment of the Requirement for the
Degree of Master of Science in Civil Engineering
Rehabilitation and Design of Structures
1432هـ - 2011م
B-1
ABSTRACT
The quantities of waste glass in Gaza Strip have been increasing significantly without being
recycled increasing the risk to public health due to the scarcity of land area. This growing
problem of waste glass in the Gaza Strip can be alleviated if new disposal options other than
landfill can be found. The main goal is to investigate the possibility to improve the
compressive strength over a range of glass percentages. Waste glass is the least expensive of
all the concrete constituents and is much less expensive than natural aggregates and sand,
thus the idea is to replace as much of the natural aggregates and sand as possible to save
money and to reduce the amount of disposable wastes, as well, but care has to be taken in
order not to weaken the concrete by adding too much glass.
Therefore, samples of the most common waste glass materials in Gaza Strip were collected
and crushed to be included in concrete as a partial occupant in the concrete mix replacing fine
and coarse aggregates, and then a standard series of: 72 slump tests, 144 mass density tests,
144 compressive strength tests, 18 pull-out tests, 18 flexural tests, and 18 splitting tensile
tests were conducted.
The output results obtained from this laboratory program showed reliable data points and
promising further research horizons. For concrete mixed with coarse waste glass as a partial
occupant instead of coarse aggregates, the optimum value of coarse waste glass to be used
within the concrete mix with a water-cement ratio of 0.4 was determined as about 0.265, and
the corresponding expected 28-days hardened concrete compressive strength was about 385
kg/cm2 compared with 300 kg/cm
2. For concrete mixed with fine waste glass as a partial
occupant instead of fine aggregates, the optimum value of fine waste glass to be used within
the concrete mix with a water-cement ratio of 0.4 was estimated as almost 0.195, and the
corresponding expected 28-days hardened concrete compressive strength was almost 400
kg/cm2.
Finally, for concrete mixes containing the optimal portion of coarse or fine waste glass, it was
concluded that there was negligible effects on the poll-out strength, considerable
enhancement of the flexural strength, and slight reduction of the splitting tensile strength of
the mix.

B-2
البحث ةصالخ إن كميات زجاج النفايات في قطاع غزة في از دياد مستمر دون إعادة تصنيع مما يزيد من مخاطر ىا عمى الصحة العامة نظرا لندرة مساحة األر اضي. ويمكن التغمب عمى ىذه المشكمة المتنامية من زجاج النفايات في قطاع غزة
إذا كان من الممكن العثور عمى خيارات جديدة عدا المجوء لمكبات النفايات. واليدف الرئيسي ىو إلى التحقق من إمكانية إدراج زجاج النفايات ضمن مكونات الخرسانة بنسب معينة ألن زجاج النفايات ىو األقل كمفة من جميع
المكونات األخرى، وبالتالي فإن الفكرة ىي إحاللو بدل قدر من الركام والرمال الطبيعية قدر اإلمكان لتوفير المال والحد من كمية النفايات الواجب التخمص منيا.
لذلك ، تم جمع عينات من مواد زجاج النفايات األكثر شيوعا في قطاع غزة وسحقيا بأحجام مختمفة ليتم تضمينيا في الخرسانة، ثم تم إجراء سمسمة من االختبارات القياسية: 72 فحص ىبوط، 144 فحص الكثافة، 144 فحص
قوة الضغط، 18 فحص سحب حديد التسميح، 18 فحص اإلنثناء، و 18 فحص االنفصام.
وأظيرت النتائج التي تم الحصول عمييا من الخرسانة المحتوية عمى زجاج النفايات الخشن بوصفو المكون الجزئي البديل عن الركام الخشن )الحصمة(، فإن النسبة المثمى من زجاج النفايات الخشن داخل الخرسانة مع
نسبة الماء لإلسمنت 0.4 تم تحديدىا بحوالي 0.265 و كانت قوة كسر الخرسانة بعد 28 يوما من صبيا نحو .2كجم/سم 300مقارنة بقوة كسر 2جم/سمك 385
في حين أظيرت النتائج التي تم الحصول عمييا من الخرسانة المحتوية عمى زجاج النفايات الناعم بوصفو
المكون الجزئي البديل عن الركام الناعم )الرمل(، فإن النسبة المثمى من زجاج النفايات الناعم داخل الخرسانة مع نسبة الماء لإلسمنت 0.4 تم تحديدىا بحوالي 0.195 و كانت قوة كسر الخرسانة بعد 28 يوما من صبيا نحو
400 كجم/سم2.
وأخيرا، لمخرسانة المحتوية عمى النسب المثمى من الزجاج الخشن أو الناعم: لم يالحظ تأثير ممموس عمى قوة سحب حديد التسميح، ولوحظ تحسن ممموس في قوة مقاومة االنثناء، وسجل انخفاض طفيف عمى قوة مقاومة
االنفصام.
B-3
DEDICATION
This research study is humbly dedicated to my beloved family:
my parents, my wife, my son, Abdulaziz, and my daughter, Raghad
B-4
ACKNOWLEDGMENT
The author would like to express his deepest gratitude and appreciation to Dr. Mamoun
Alqedra and Dr. Mohamed Arafa, for their unconditional guidance, patience, and
encouragement throughout the phases of this research study.
In addition, the author would like to extend his sincere gratitude and appreciation to Eng.
Ahmad Alkurd and Mr. Tahseen Shehada within the staff of the soil and materials testing
laboratory at the Islamic University in Gaza for their outstanding efforts during the
experimental phase of this research study.

B-5
CHAPTER ONE: INTRODUCTION ...................................................................................... 1
1.1 BACKGROUND ................................................................................................ 1
1.2 PROBLEM STATEMENT ...................................................................................
............................................................................................................ 2
1.3 AIM AND OBJECTIVES .....................................................................................
............................................................................................................ 3
1.4 RESEARCH METHODOLGY .......................................................................... 4
1.5 THESIS LAYOUT.............................................................................................. 4
CHAPTER TWO: LITERATURE REVIEW ............................................................................
............................................................................................................ 5
2.1 INTRODUCTION .............................................................................................. 5
2.2 CONCRETE COMPOSITE MATERIALS ........................................................ 5
2.2.1 Water ........................................................................................................... 6
2.2.2 Cement ......................................................................................................... 7
2.2.3 Aggregates ................................................................................................... 7
2.3 WASTE GLASS ................................................................................................. 8
2.4 PREVIOUS STUDIES...................................................................................... 11
2.5 CONCLDING REMARKS ..................................................................................... 19
CHAPTER THREE: EXPERIMENTAL PROGRAM .................................................. 02
3.1 INTRODUCTION ............................................................................................ 02
3.2 PROPERTIES OF AGGREGATES ................................................................. 01
3.3 WASTE GLASS ............................................................................................... 04
3.4 TESTING PROGRAM ..................................................................................... 08
3.4.1 Pull Out Strength ....................................................................................... 08
3.4.2 Flextural Stength ....................................................................................... 09
3.4.3 Splitting Strength ....................................................................................... 09
3.5 CONCRETE JOB MIXES ................................................................................ 09
CHAPTER FOUR: LABORATORY TESTING RESULTS AND DATA ANALYSES
.......................................................................................................... 43
4.1 INTRODUCTION ............................................................................................ 34
4.2 TESTING PROGRAM RESULTS ................................................................... 34
4.3 EFFECT OF REPLACING WASTE GLASS ON CONCRETE DENSITY .... 38
4.3.1 CORSE Waste Glass ................................................................................ 38
4.3.2 FINE Waste Glass ..................................................................................... 40
4.4 EFFECT OF REPLACING WASTE GLASS ON CONCRETE
WORKABILITY .............................................................................. 41
4.4.1 CORSE Waste Glass ................................................................................ 41
4.4.2 FINE Waste Glass ..................................................................................... 41
4.5 EFFECT OF REPLACING WASTE GLASS ON CONCRETE
COMPRESSIVE STRENGTH ......................................................... 44
4.5.1 CORSE Waste Glass ................................................................................ 47
4.5.2 FINE Waste Glass ..................................................................................... 47
4.6 OPTIMAL WASTE GLASS CONTENT IN CONCRETE MIXES ................. 48
4.7 EFFECT OF WASTE GLASS ON PULL OUT STRENGTH .......................... 50
4.7.1 CORSE Waste Glass ................................................................................ 52
4.7.2 FINE Waste Glass ..................................................................................... 55
B-6
4.8 EFFECT OF WASTE GLASS ON FLEXURAL STRENGTH ........................ 55
4.8.1 CORSE Waste Glass ................................................................................ 57
4.8.2 FINE Waste Glass ..................................................................................... 57
4.9 EFFECT OF WASTE GLASS ON SPLITTING STRENGTH ......................... 57
4.9.1 CORSE Waste Glass ................................................................................ 60
4.9.2 FINE Waste Glass ..................................................................................... 60
CHAPTER FIVE: SUMMARY AND CONCLUSIONS ................................................ 20
5.1 SUMMARY ...................................................................................................... 60
5.2 CONCLUSIONS .............................................................................................. 60
5.2.1 CORSE Waste Glass ................................................................................ 62
5.2.2 FINE Waste Glass ..................................................................................... 63
5.3 FUTURE STUDY ............................................................................................ 64
REFERENCES .......................................................................................................... 25
APPENDIX A .......................................................................................................... 67

B-7
LIST OF FIGURES
Figure 3.1: Sample of the natural coarse aggregate for concrete mix ............................ 21
Figure 3.2: Samples of the natural medium and fine aggregate for concrete mix. ......... 21
Figure 3.3: Grain size distribution curve of coarse aggregates ....................................... 23
Figure 3.4: Grain size distribution curve of fine aggregates ........................................... 04
Figure 3.5: Waste glass materials as collected before crushing and sieving .................. 05
Figure 3.6: Crushing of waste glass to coarse and fine sizes ......................................... 25
Figure 3.7: Grain size distribution of coarse waste glass................................................ 06
Figure 3.8: Grain size distribution of fine waste glass.................................................... 07
Figure 4.1: Concrete density of coarse waste glass in the mix ....................................... 39
Figure 4.2: Concrete density vs. water cement ratio ....................................................... 39
Figure 4.3: Relation of concrete density with fine W.G percentage of several w/c raio 40
Figure 4.4: Concrete mass density vs. water cement ratio. ............................................. 41
Figure 4.5: Slump test results vs. portion of coarse waste glass in the fresh mix .......... 40
Figure 4.6: Slump test results vs. water cement ratio ..................................................... 40
Figure 4.7 Slump test results vs. portion of fine waste glass in the fresh mix ................ 43
Figure 4.8: Slump test results vs. water cement ratio ..................................................... 43
Figure 4.9: Typical testing cube after fauilure for determining concrete compressive
strength ...................................................................................................... 44
Figure 4.10: 7-Days concrete compressive strength vs. portion of coarse waste glass in
the mix ....................................................................................................... 45
Figure 4.11: 28-Days concrete compressive strength vs. portion of coarse waste glass in
the mix ....................................................................................................... 46
Figure 4.12: Concrete compressive strength vs. portion of coarse waste glass in mix ... 46
Figure 4.13: 7-Days concrete compressive strength vs. portion of fine waste glass in the
mix ............................................................................................................. 47
Figure 4.14: 28-Days concrete compressive strength vs. portion of fine waste glass in
the mix ....................................................................................................... 48
Figure 4.15: Concrete compressive strength vs. portion of fine waste glass in the mix . 49
Figure 4.16: Preparation of pull-out testing specimens .................................................. 52
Figure 4.17: Hardened poll-out testing specimens ......................................................... 53
Figure 4.18: Poll-out testing apparatus and procedure ................................................... 53
Figure 4.19: Illustration of poll-out testing specimen after failure ................................. 54
Figure 4.20: Flexural strength testing apparatus ............................................................. 56
Figure 4.21: Illustration of flexural strength testing specimen after failure ................... 56
Figure 4.22: Hardened splitting strength testing specimens ........................................... 58
Figure 4.23: Splitting strength-testing apparatus ............................................................ 59
Figure 4.24: Illustration of splitting strength-testing specimens after failure ................. 59

B-8
LIST OF TABLES
Table 2.1: Approximate compositions and the corresponding uses of various common
forms of glass ................................................................................................... 9
Table 3.1: Summary of sieve analysis data for coarse aggregates .................................. 22
Table 3.2: Summary of sieve analysis data for fine aggregates ...................................... 23
Table 3.3: Summary of sieve analysis data for coarse waste glass. ................................ 26
Table 3.4: Summary of sieve analysis data for fine waste glass ..................................... 27
Table 3.5: Experimental testing program of concrete with coarse waste glass .............. 30
Table 3.6: Experimental testing program of concrete with fine waste glass .................. 30
Table 3.7: Specific Gravities of Concrete Mix Raw Components for B 300 ................. 31
Table 3.8: Concrete Job Mix for B 300 with w/c = 0.4 and Waste Glass = zero ........... 31
Table 3.9: Concrete Job Mix for B 300 with w/c = 0.5 and Waste Glass = zero ........... 32
Table 3.10: Concrete Job Mix for B 300 with w/c = 0.6 and Waste Glass = zero ......... 32
Table 4.1: Mass density and workability values with several coarse waste glass content
........................................................................................................................ 35
Table 4.2: Compressive strength of concrete with several coarse waste glass content...36
Table 4.3: Mass density and workability values with several fine waste glass content . 37
Table 4.4: Compressive strength of concrete with several fine waste glass content ..... 38
Table 4.5: Summary of the 7-days comprehensive strengths for concrete mix with
different portions of coarse waste glass and a water-cement ratio of 0.4 ...... 49
Table 4.6: Summary of the 28-days comprehensive strengths for concrete mix with
different portions of coarse waste glass and a water-cement ratio of 0.4 ...... 50
Table 4.7: Summary of the 7-days comprehensive strengths for concrete mix with
different portions of fine waste glass and a water-cement ratio of 0.4 .......... 50
Table 4.8: Summary of the 28-days comprehensive strengths for concrete mix with
different portions of fine waste glass and a water-cement ratio of 0.4 .......... 51
Table 4.9: Summary of the pull-out strength results with coarse waste glass content ... 54
Table 4.10: Summary of the pull-out strength results with fine waste glass content ..... 55
Table 4.11: Summary of the flexural strength results with coarse waste glass content.. 57
Table 4.12: Summary of the flexural strength results with fine waste glass content...... 58
Table 4.13: Summary of the splitting strength results with coarse waste glass content 60
Table 4.14: Summary of the splitting strength results with fine waste glass content .... 61
1
CHAPTER ONE
INTRODUCTION
1.1 Background
Solid wastes are substances and masses resulted by the various human activities that have to
be dumped. Solid waste materials usually include industrial waste, medical waste, and
domestic waste. In particular, construction waste is the output result of construction and
destruction, rehabilitation, repair, removal of existing structures, and installations. This waste
is composed of sand, stone, gravel, tiles, ceramic, marble, glass, aluminum, wood, plastic,
paper, paints, plumbing pipes, electric parts and asbestos, and other materials.
One of the main environmental concerns regarding the landfills in the Gaza Strip area is the
very limited area available in both their current and future count number and their individual
capacity and efficiency of usage. This concern was considerably increased and extremely
highlighted especially after the comprehensive aggression on Gaza Strip in December 2008
that lasted for 23 days and resulted in numerous masses of industrial and constructional
wastes. [1]
The quantities of waste glass in the Gaza Strip have been increasing significantly without
being recycled increasing the risk to public health due to the scarcity of land area. This
growing problem of waste glass in the Gaza Strip can be alleviated if new disposal options
other than landfill can be found. [2]
It was estimated during the year 2005 by Palestinian Central Bureau of Statistics (PCBS) that
the total average daily solid waste produced in the Gaza Strip is 1,006 ton/day. Waste
production was 0.7-1.0 kg/c/d, waste density at collection points was 0.4 kg/l, and growing at
an estimated rate of 4.0% per year. In 2008, the PCBS revealed from the data analysis that the
paper and cartons were ranked first among the separated solid waste components, with 22.2%
of the economic and domestic establishments in the Palestinian Territory, followed by
medical waste, including sharp, radioactive, and infected wastes with 21.7%, and Glass and
Metal with 17.9% [2].
2
Solid waste in Gaza Strip mainly consists of household wastes, building debris, agricultural
wastes, industrial wastes, medical wastes, workshops wastes, and other waste materials. Out
of the solid waste, it is estimated that 79.81%, of the household solid waste consist of organic
material, sand 7.21%, plastic and rubber 5.02%, cloth 1,9%, Glass 0.85%, Metals 2.22% and
Carton 2.02% [2].
1.2 Problem Statement
Many studies have been emerging worldwide highlighting the reuse of waste glass in
construction technology, such as [3-9]. The idea is that the glass can be used as an aggregate
in the concrete mix by replacing some of the natural aggregates such as gravel and sand.
Thus, the possible benefits are as follows: less glass is thrown away saving landfill space, the
use of fewer natural aggregates (which are the components of concrete) saving our natural
resources and less labor is used by not shipping raw materials from distant places to where
glass is available saving time and money. The unfavorable properties of concrete include a
relatively weak tensile strength as compared to it compressive strength and the ability to form
cracks in unpredictable areas.
Along with steel bars as internal reinforcement, the cracks can be controlled to some degree,
and unlike other building materials like steel and plastic, concrete is not a uniform material
due to the fact that it contains a ratio of gravel and sand, thus failure mode or location of the
failure is unpredictable. In general, clear, green or brown bottles including juice, soft drink
and sauce bottles, glass jars and other containers are among the sources of waste glass
materials in many areas all over the world.
In the Gaza Strip the main component of waste glass is clear pure glass originating from
reconstruction and rehabilitation processes. Other types of waste glass such as ceramic plates,
light globes, mirrors, medical or laboratory glass, and grocery glasses are not within the
concern of this research study, and the clear spread glass is used as a waste glass material.
There has been an increasing significant interest in the development of concrete mixes with
waste glass, besides, recycling waste glass as an aggregate is effective for environmental
3
conservation and economical advantage. Therefore, samples of the most common waste glass
materials in the Gaza Strip were collected and crushed to be included in concrete as a partial
occupant in the concrete mix replacing fine and coarse aggregates, and a basic experimental
study on the physical and mechanical properties of concrete containing waste glass was
carried out [2].
1.3 Aim and Objectives
This research focuses on studying the effect of waste glass on the properties of concrete
mixtures as a partial replacement of fine aggregates, and coarse aggregates. The successful
use of waste glass will aid in reducing the environmental and health problems related to the
disposal of waste glass and the scarcity of land area needed for disposal.
Within the scope of this study, the main goal is to investigate the possibility to improve the
compressive strength over a range of glass percentages. Waste glass is the least expensive of
all concrete constituents and is much less expensive than natural aggregates and sand, thus
the idea is to replace as much of the natural aggregates and sand as possible to save money
and to reduce the amount of disposable wastes, as well, but care has to be taken in order not
to weaken the concrete by adding too much glass.
The main objective of this research is to study the effect of waste glass on the properties of
concrete mixes as a partial replacement of fine aggregate and coarse aggregate. This objective
can be achieved through the following objectives:
Identify the effects of adding waste glass on the fresh properties of concrete mixes
such as workability by slump measures.
Study the influence of waste glass on hardened properties of concrete mixes such as:
density and compressive strength, pull out strength, flexural strength and splitting
resistance.
Determine the optimum waste glass content to be added as a partial replacement of
fine aggregate and coarse aggregate.
4
1.4 Research Methodology
The following tasks are to be carried out in order to achieve the research objectives:
Collecting the required information and documents related to the waste glass .
Visiting the Gaza City Glaziers to obtain related information and collect samples.
Undertaking a comprehensive literature review on relevant subjects focused on the
usage of waste glass in construction field.
Developing an adequate experimental program to study the use of waste glass in
concrete mixtures as explained in section 3.1.
Analyzing the experimental output test results to draw conclusions.
1.5 Thesis Layout
Following this introduction, Chapter 2 presents a general literature overview for studying the
use of waste glass materials as fine and coarse aggregates in engineering practice. These
research studies highlighted the properties of the waste glass itself and the behavior of
concrete mixes contacting different portions of waste glass.
Chapter 3 demonstrates the employed descriptive variables in the experimental testing
program considering the properties of fresh and hardened concrete. These descriptive
variables start with the different raw components of concrete, then the sieve analyses, the
concrete job mix, the test results for fresh concrete, the density and the compressive strength
of hardened concrete mixes. This chapter ends with a detailed list of the different portions of
fine and coarse waste glass used in the concrete mixes.
Chapter 4 aims to clarify the essentials of concrete compressive strength analysis and the
methodology followed to highlight the usefulness of considering waste glass materials as a
main component within the concrete mix. Proper treatment of uncertainties within the data
analysis process required understanding the sources of errors for the targeted end point.
Finally, a comprehensive summary of this research study, its major conclusions, and
recommendations for future areas of study are presented in Chapter 5.

5
CHAPTER TWO
LITERATURE REVIEW
2.1 Introduction
Glass is one of the oldest man-made materials. It is produced in many forms such as
packaging or container glass, flat glass, and bulb glass, all of which have a limited life in their
manufactured forms and therefore need to be recycled so as to be reusable in order to avoid
environmental problems that would be created if they were to be stockpiled or sent to
landfills. The construction industry has shown great gains in the recycling of industrial by-
products and waste, including waste glass materials.
Quantities of waste glass have been rising rapidly during the recent decades due to the high
increase in industrialization and the considerable improvement in the standards of living, but
unfortunately, the majority of these waste quantities are not being recycled but rather
abandoned causing certain serious problems such as the waste of natural resources and
environmental pollution [2].
Recycling of this waste by converting it to aggregate components could save landfill space
and also reduce the demand for extraction of natural raw material for construction activities.
Herein is a quick review for some of the previous research studies concerned with the waste
glass as an aggregate material, but from different points of view and perspectives.
2.2 Concrete Composite Materials
This section summarizes the properties of all the components used in the various concrete
mixes. Concrete is a structural material that contains some simple elements but when mixed
with water would form a rock like material. Concrete mix is comprised of coarse aggregates
usually gravel, fine aggregates usually sand, cement, water, and any necessary additives.
Concrete possesses many favorable properties as a structural material, among which are its
high compressive strength and its property as a fire-resistant element to a considerable extent.
6
The unfavorable properties include a relatively weak tensile strength as compared to its
compressive strength and the ability to form cracks in unpredictable areas. With steel bars as
internal reinforcement, the cracks can be controlled to some degree. Unlike other building
materials such as steel and plastic, concrete is not a uniform material due to the fact that it
contains a ratio of gravel and sand, thus failure mode or location of the failure is
unpredictable.
Due the nature of concrete, concrete has an ability to have its recipe changed or altered to
meet situational needs. Thus, if a job calls for high strength, lightweight or weather resistant
concrete, its recipe is available or a custom one can be devised. Concrete has three main
components when it's freshly mixed and they are water, cement and aggregates. Water is
needed to begin the hydration process for the concrete and after four weeks of curing until
full potential strength of the concrete can be achieved [10].
2.2.1 Water
Water is one of the most important elements in concrete production. Water is needed to begin
the hydration process by reacting with the cement to produce concrete. There has to be a
sufficient amount of water available so that the reaction can take its full course but if too
much water is added, this will in fact decrease the strength of the concrete. The water-cement
ratio is an important concept because other than the recipe for the concrete mix, the amount
of water used would also determine its finial strength [18].
In more details, if too little water were added, there would not be enough water available to
finish the reaction, thus some of the cement would harden and bond with other dry cement
shorting the hydration process. On the other hand, if too much water were added then while
the cement is undergoing hydration the cement would be in a slurry solution, and the
probability of cement bonding with aggregates would decrease. And as a result, when the
hydration process is completed, the cement content would still be in a slurry solution and
with no strength.
The type of water that can be used to mix concrete must be potable which is essentially has
neither noticeable taste nor odor. Basically, water containing less than 2000 ppm of total
7
dissolved solids can be used. Thus the type of water that was used to mix concrete throughout
the testing program was normal tap water with attention paid for not including impurities.
2.2.2 Cement
There are currently more than eight types of cement that are used under specific conditions.
Cement is a very important part of the concrete because it is the cement, which gives the
concrete its strengths. Because of the importance of cement, the ASTM has set guide lines to
follow for the make-up of cement. For experimental program of this research study, normal
Portland Cements Type I was used.
Water is the element that is used to begin the hydration reaction where cement reacts with the
water to produce a rock like substance. The reaction is also exothermic, where heat is
released in the chemical reactions. This is an important fact because in very large structure
like concrete dams, the heat released can pose a potential problem.
When the chemical reaction has reached the end, the initial cement past is transformed into a
substance, which has tremendous strength. But using too much cement in concrete is
expensive, and thus aggregates would take the place of cement without reducing its strength
and reduce the cost. In the engineering practice in Palestine, the dominating range of water-
cement ratios in the concrete mix process is between 0.4 up to 0.6. For this research, three
different categories for water-cement ratios were used during testing phase: 0.4, 0.5, and 0.6.
2.2.3 Aggregates
Aggregates are broken down into two main categories, which are coarse and fine aggregates.
Coarse aggregates in general are larger than 2 mm in diameter and fine aggregates are
defined to be smaller than 2 mm. Aggregates that are used in concrete have to pass the
standards set in ASTM. The economics part of concrete is to use as little cement as possible
and still obtain the required strength. Thus, when concrete is formed, the coarse aggregates
with its large volume would make up a large portion of the concrete. The fine aggregates
would fill in the voids created form the coarse aggregate and reduce the amount of cement
required.
8
If only coarse aggregates are used then there would be voids between the particles and the
voids created would be filled with cement paste. Thus fine aggregates are used to fill those
voids. In essence, the goal is to produce a concrete mixture that has the least amount of void
spaces thus using less cement paste to fill the voids between the particles. When fresh
aggregates are used to mix concrete, the aggregates themselves also contain some moisture
either from water condensing on the particles or the aggregates was washed in some way with
water. Accordingly, there are four distinct states that the aggregates can be in [14].
Oven dry aggregates would absorb water to fill its own internal voids and in doing so would
reduce the water cement ratio. If this occurs, then the hydration process is not permitted to
continue and the strength of the concrete mix would be reduced by a considerable amount.
Air dry aggregates would absorb some water but not to an extraneous degree like the oven
dry aggregates. The surface would appear dry and thus some water is absorbed and reduces
the water cement ratio. Thus the strength of the concrete is reduced by a small amount.
Saturated dry surface aggregates have their internal voids fill with water and thus cannot
absorb any more water. These aggregates would keep the water cement ratio constant and the
concrete would retain its full strength.
Aggregates have their internal voids and surface area saturated with water. Instead of
absorbing water, the aggregates would add water to the mixture and in doing so; the water
cement ratio is increased, decreasing the strength of the concrete. For this research the water
content for the aggregates was prepared under the saturated surface dried (SSD) condition in
order to avoid any possible over or under estimation of water content due to moisture
absorption by the mixed aggregates, and also to guarantee the true efficiency of the different
water-cement ratios used for preparing the concrete mix.
2.3 Waste Glass
Theoretically, glass is a fully recyclable material; it can be recycled without any loss of
quality. There are many examples of successful recycling of waste glass: as a cullet in glass
production, as raw material for the production of abrasives, in sand-blasting, as a pozzolanic
additive, in road beds, pavement and parking lots, as raw materials to produce glass pellets or
9
beads used in reflective paint for highways, to produce fiberglass, and as fractionators for
lighting matches and firing ammunition [10]. Waste glass can also be produced from empty
glass bottles and pots, and come in several distinct colors containing common liquids and
other substances. This waste glass is usually crushed into small pieces that resemble the sizes
of gravels and sands. Therefore - as an alternative - there is a potential to partially replace the
concrete mix aggregate with waste glass due to the lack of natural recourses in Gaza Strip.
In its original form, glass comes as a balanced combination from three main raw natural
materials: sand, silica, and limestone, in addition to a certain percentage of recycled waste
glass utilized in the manufacturing process. The glass recycling process produces a crushed
glass product called "cullet", which is often mixed with virgin glass materials to produce new
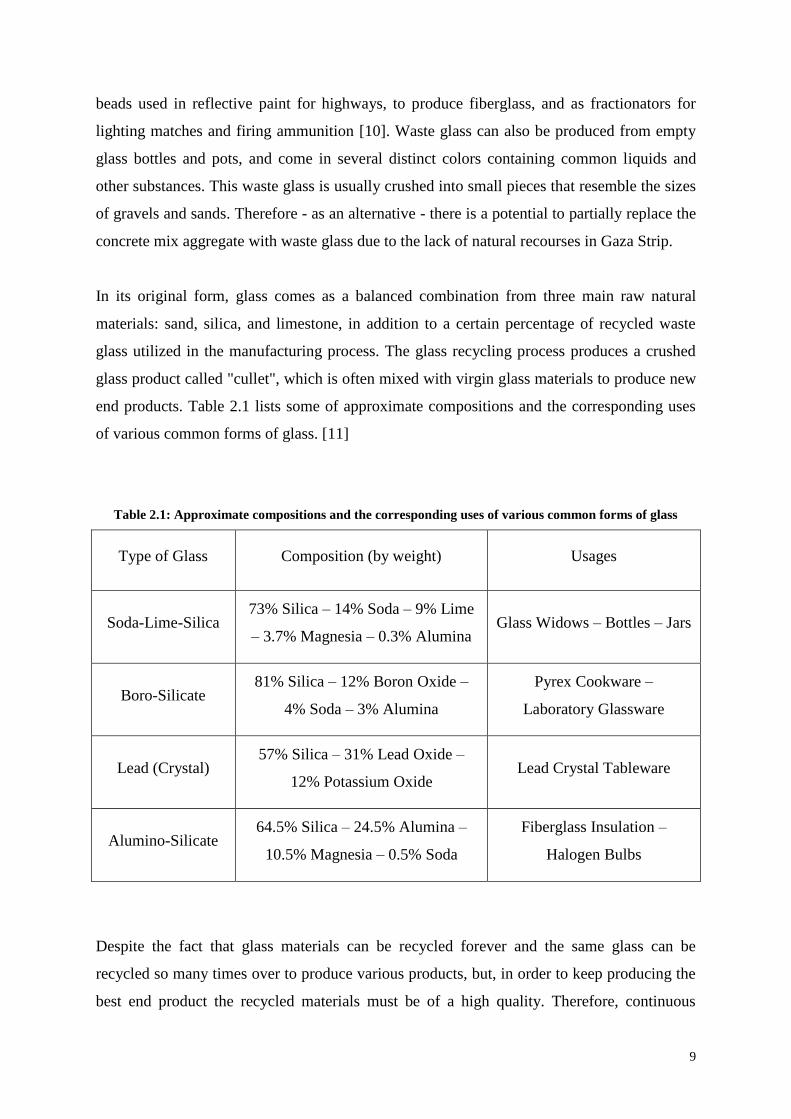
end products. Table 2.1 lists some of approximate compositions and the corresponding uses
of various common forms of glass. [11]
Table 2.1: Approximate compositions and the corresponding uses of various common forms of glass
Type of Glass Composition (by weight) Usages
Soda-Lime-Silica 73% Silica – 14% Soda – 9% Lime
– 3.7% Magnesia – 0.3% Alumina Glass Widows – Bottles – Jars
Boro-Silicate 81% Silica – 12% Boron Oxide –
4% Soda – 3% Alumina
Pyrex Cookware –
Laboratory Glassware
Lead (Crystal) 57% Silica – 31% Lead Oxide –
12% Potassium Oxide Lead Crystal Tableware
Alumino-Silicate 64.5% Silica – 24.5% Alumina –
10.5% Magnesia – 0.5% Soda
Fiberglass Insulation –
Halogen Bulbs
Despite the fact that glass materials can be recycled forever and the same glass can be
recycled so many times over to produce various products, but, in order to keep producing the
best end product the recycled materials must be of a high quality. Therefore, continuous
10
residual amounts of waste glass resulting from construction deteriorations, domestic and
medical disposals, and industrial output junk materials are still cumulating and hence need to
be land filled or reused in concrete mixes as a partial substitute for coarse aggregates and/or
fine aggregates. [12]
Technically, glasses are usually manufactured in the form of tubes, rods, hollow vessels and a
variety of special shapes, as well as flat glass and granulate for use mainly in chemistry,
laboratory technology, pharmaceuticals, optoelectronics, various domestic uses, and
household appliance technology. For the purposes of classification, the multitude of technical
glasses can be roughly arranged in four main groups, according to their oxide composition (in
weight percent).
Borosilicate glasses is the first main category with the presence of substantial amounts of
silica (SiO2) and boric oxide (B2O3 > 8%) as glass network formers. The amount of boric
oxide affects the glass properties in a particular way. Apart from the highly resistant varieties
(B2O3 ≤ 13%) there are others that – due to the different way in which the boric oxide is
incorporated into the structural network – have only low chemical resistance (B2O3 > 15%).
Secondly, the Alkaline-earth aluminosilicate glasses are free of alkali oxides and contain 15 –
25% Al2O3, 52 – 60% SiO2, and about 15% alkaline earths. Very high transformation
temperatures and softening points are typical features. Main fields of application are glass
bulbs for halogen lamps, display glasses, high-temperature thermometers, thermally and
electrically highly loadable film resistors and combustion tubes.
Alkali-lead silicate glasses are the third main category and such glasses typically contain over
10% lead oxide (PbO). Lead glasses containing 20–30% PbO, 54–58% SiO2 and about 14%
alkalis are highly insulating and therefore of great importance in electrical engineering. They
are used in lamp stems and lead oxide is also of great importance as an X-ray protective
component (radiation shielding glass and cathode ray tube components).
The last category is the oldest glass type and nominally the Alkali alkaline-earth silicate
glasses (soda-lime glasses). It comprises flat glasses (window glass) and container glasses,
which are produced in large batches. Such glasses contain about 15% alkali (usually Na2O),
13 – 16% alkaline earths (CaO+MgO), 0–2% Al2O3 and about 71% SiO2. Variants of the
11
basic composition can also contain significant amounts of BaO with reduced alkali and
alkaline-earth content [13].
2.4 Previous Studies
Meyer et al. [4] discussed the various steps that need to be taken by recyclers to collect the
glass, separate it from the other materials, clean it and crush it to obtain the appropriate
grading to meet the specifications for specific applications as aggregate in concrete, either in
commodity products, with the only objective being to utilize as much glass as possible, or in
value-added products that make full use of the physical and esthetic properties of color-sorted
crushed glass.
The potential applications are basically limitless, and it is expected that commercial
production of specialty glass concrete products will have a major impact on the economics of
glass recycling throughout the United States.
Zainab and Enas [7] investigated the properties of concretes containing waste glass as fine
aggregate. The strength properties and the alkali silica reaction (ASR) expansion were
analyzed in terms of waste glass content. An overall quantity of 80 kg of crushed waste glass
was partially replacing sand at 10%, 15%, and 20% within a 900 kg of concrete mixes. The
results proved 80% pozzolanic strength activity given by waste glass after 28 days.
The flexural strength and compressive strength of specimens with 20% waste glass content
were 10.99% and 4.23%, respectively, higher than the ordinary control specimen results at 28
days. The mortar bar tests showed that the fine crushed waste glass helped reduce expansion
of concrete by 66% as compared with the ordinary control mix.
Topçu and Canbaz [5] considered waste glass as coarse aggregates in the concrete mix. The
effects of waste glass on workability and strength of the concrete with fresh and hardened
concrete tests were analyzed. As a result of the study conducted, waste glass was determined
not to have a significant effect upon the workability of the concrete and only slightly in the
reduction of its strength.
12
Waste glass cannot be used as aggregate without taking into account its ASR properties. As
for cost analysis, it was determined to lower the cost of concrete productions. This study
considered the fact that waste glass could be used in the concrete as coarse aggregates
without the need for a high cost or rigorous energy.
Topçu et al. [6] stated in their study that the use of waste glass or glass cullet (GC) as
concrete aggregate is becoming more widespread each day because of the increase in
resource efficiency. Recycling of wastes is very important for sustainable development.
When glass is used as aggregate in concrete or mortar, expansions and internal stresses occur
due to an ASR. Furthermore, rapid loss in durability is generally observed due to extreme
crack formation and an increase in permeability.
It is necessary to use some kind of chemical or mineral admixture to reduce crack formation.
In their study, mortar bars were produced by using three different colors of glass in four
different quantities as fine aggregate by weight, and the effects of these glass aggregates on
ASR were investigated, corresponding to ASTM C-1260. Additionally, in order to reduce the
expansions of mortars, 10% and 20% fly ash (FA) as mineral admixture and 1% and 2%
Li2CO3 as chemical admixture were incorporated by weight in the cement and their effects on
expansion are examined. It was observed that among white (WG), green (GG) and brown
glass (BG) aggregates, WG aggregate causes the greatest expansion.
In addition, it was recorded that concrete mix expansion increases with an increase in amount
of glass. According to the test results, it was seen that over 20% FA and 2% Li2CO3
replacements are required to produce mortars which have expansion values below the 0.2%
critical value when exposed to ASR. However, usages of these admixtures reduce expansions
occurring because of ASR.
Kou and Poon [8] investigated the effects of recycled glass cullet on fresh and hardened
properties of self-compacting concrete. Recycled glass was used to replace river sand (in
proportions of 10%, 20% and 30%), and 10 mm granite (5%, 10% and 15%) in making the
self-compacting concrete mixes.
The experimental results showed that the slump flow, blocking ratio, air content of the
recycled glass self-compacting concrete mixes increased with increasing recycled glass
13
content. The results revealed that the compressive strength, tensile splitting strength and static
modulus of elasticity of the recycled glass self-compacting concrete mixes were decreased
with an increase in recycled glass aggregate content. Moreover, the drying shrinkage of the
recycled glass self-compacting concrete mixes decreased when the recycled glass content
increased.
Saccani and Bignozzi [9] studied the ASR expanding behavior of different types of glass
which was derived from cullet with different chemical composition. The glass reactivity was
determined in different alkaline solutions based on sodium and/or calcium hydroxide to
simulate concrete environment. The expansion of mortar containing different amounts of the
investigated glass as fine aggregate has been carried out in different conditions.
An attempt to link the behavior to the solubility and chemical reactivity of the glass was
proposed along with the hereafter conclusions. The main conclusions from their experimental
research study carried out can be as follows: i) glass chemical composition strongly
influences the expansion behavior of mortar samples containing cullet as aggregate.
In view of glass recycle broadening, expanding compositions should be determined and
selective procedures introduced for the treatment of post-consumer glass; ii) the investigated
experimental conditions highlight that the lead-silicate glass (CR) always leads to critical
expanding conditions for the relevant mortar samples; iii) a direct correlation between glass
solubility and mortar expansion has been underlined and a buffering effect of Ca2+ towards
glass solubility has been confirmed.
The solubility process involves homogeneous network dissolution in the CR glass, whereas
detaching layers are formed in all the other glass types. The solubility of boro–silicate glass
(BS-A) is strongly influenced by the presence of Fe, Ba and Ti oxides; and iv) ASR gel
compositions, as determined by the energy dispersive X-ray spectroscopy (EDS), depend on
chemical composition of the original glass used as aggregate. The electrical charge and
dimension of the ions in the gel are important parameters in determining its characteristics,
such as the swelling capacity.
Federico and Chidiac [14] investigated the incorporation of waste bottle glass into concrete
mixes as a supplementary cementing material and concluded that the pozzolanic properties of

14
waste glass as an ASR are related to particle size and percent addition. In addition, lithium
additives control ASR expansion; however, the mechanism of this control has yet to be
defined.
Idir et al. [15] stated that the demand for recycled glass has considerably decreased in recent
years, particularly for mixed glass. Glass is cheaper to store than to recycle, as conditioners
require expenses for the recycling process. In order to provide a sustainable solution to glass
storage, a potential and incentive way would be to reuse this type of glass in concretes.
Depending on the size of the glass particles used in concrete, two antagonistic behaviors can
be observed: alkali–silica reaction, which involves negative effects, and pozzolanic reaction,
improving the properties of concrete. Their work dealt with the use of fine particles of glass
and glass aggregates in mortars, either separately or combined.
Two parameters based on standardized tests were studied: pozzolanic assessment by
mechanical tests on mortar samples and alkali-reactive aggregate characteristics and fines
inhibitor evaluations by monitoring of dimensional changes. It is shown that there is no need
to use glass in the form of fines since no swelling due to alkali–silica reaction is recorded
when the diameter of the glass grains is less than 1 mm.
Fine glass powders having specific surface areas within the range from (180 to 540) m2/kg
reduced the expansions of mortars subjected to ASR, especially when glass aggregates of
diameters larger than 1 mm are used. This study aimed to evaluate the preventive role of
pozzolanic glass fines in counteracting the deleterious effect of alkali-reactive glass
aggregates. It has been shown that in his study that the use of both types of glass particles is
pertinent.
The main results were: i) only glass classes of more than 1 mm gave expansions related to
ASR; ii) the use of glass fines led to the reduction of mortar expansion due to coarse
particles; moreover, fines increased the compressive strength of mortars; and iii) no excessive
crushing of glass fines was needed since the quantity of fines was the main parameter
controlling the reduction of expansion due to coarse glass aggregates. It is thus preferable to
use 40% of class C5 (D50 of 120 µm) rather than 20% of class C8 (D50 of 8 µm).
15
Caijun and Keren [16] reviewed the three possible uses of waste glasses in production of
cement and concrete, where their results can be summarized as follows: Firstly, the use of
waste glasses as concrete aggregates has a slight negative effect on the workability, strength
and freezing-thawing resistance of cement concrete. However, the main concern is expansion
and cracking of the concrete containing glass aggregates. It needs to control the pH of the
system below 12 in order to prevent potential corrosion of glass aggregates and expansion of
the concrete, which may be achieved by the replacement of Portland cement with pozzolanic
materials such as fly ash, silica fume and meta-kaolin,
Secondly, waste glasses cans be used as raw materials for cement production as siliceous
sources. However, it will increase the liquid content in the clinker, results in the formation of
some Na-compounds and increase in the alkali content in the cement. The effect will be
dependent on the amount of waste glass used. If the percentage of waste glass used in the raw
materials is low, the effects can be very minimal.
Finally, ground glass powders exhibit very good pozzolanic reactivity and can be used as
cement replacement. As expected, its pozzolanic reactivity increases as its finesses increase.
Alkalis in the glass powder can cause alkali-aggregate reaction and expansion if aggregates
are alkali-reactive. Results from ASTM C-1260 testing indicate that the alkali–aggregate
reaction expansion decreases as glass replacement increases, and will be under the deleterious
limit if the glass replacement is 50% or more. The combined use of other supplementary
cementing materials such as coal fly ash, ground blast furnace slag and meta-kaolin can also
decrease the expansion from alkali–aggregate reaction. Lithium salt can be a very effective
additive to prevent the alkali–aggregate reaction expansion of concrete containing glass
powders.
Wang [17] studied the recycling of discarded liquid crystal display (LCD) glass into concrete
(LCDGC) when replacing a portion of the usual river sand by sand prepared from discarded
LCD glass. Three different mix designs were regulated by the ACI method and categorized as
(fc28 = 21, 28, and 35 MPa) with 0%, 20%, 40%, 60%, and 80% LCD glass sand replacements
investigated; their engineering properties were determined. Test results revealed that, when
compared to the design slump of 15 cm, the 20% glass sand concrete for the three different
mix designs kept good slump and slump flow.
16
In addition, a slump loss ranging from 7 to 11 cm was observed for specimens with 60% and
80% glass sand replacement for the design strengths of 28 and 35 MPa. The compressive
strengths of the concrete with glass sand replacement were higher than the design strengths.
Moreover, the durability of the concrete with 20% glass sand replacement was better than
that of the control group.
Surface resistivity for specimens with different amounts of LCD glass sand replacement was
also higher than that in the control group for mid to long curing ages. The sulfate attack in
concrete with different amounts of glass sand replacement caused less weight loss than in the
control group. Moderate chloride ion penetration was observed for glass sand concrete.
Furthermore, the measured ultrasonic pulse velocities for LCD glass sand concrete specimens
were higher than 4100 m/s, which qualified these specimens as good concrete. OM and SEM
indicate that the dense C–S–H gel hydrate was produced at the interface between the glass
sand and cement paste. The test results indicate that the addition of 20% LCD glass sand to
concrete satisfies the slump requirements and improves the strength and durability of
concrete. This suggests that LCD glass sand can potentially be used as a recycled material in
concrete applications.
Palmquist [18] made use of glass, in crushed or cullet form, as another type of recycled
material, as an aggregate in concrete. This recycled material has been studied in concrete
masonry blocks, and tests on concrete with glass aggregate, including workability,
permeability, and shear strength, have been performed to determine the suitability of the
material in construction. Glass aggregates in comparison to natural aggregates are stiff with
high elastic moduli, but the smooth flat surfaces of the crushed glass cause the bond between
the glass and the cement paste to be poor. As a result, the compressive strength of the
concrete with glass aggregate is lower than the concrete with natural aggregate.
Another factor, which lowers compressive strength and causes excessive lateral expansion, is
the strong reaction between alkali cement and the reactive silica in glass. However, the elastic
modulus of concrete with glass aggregate is higher than the concrete with natural aggregate
due to the high elastic modulus of the glass aggregate as compared to the modulus of the
natural aggregate.
17
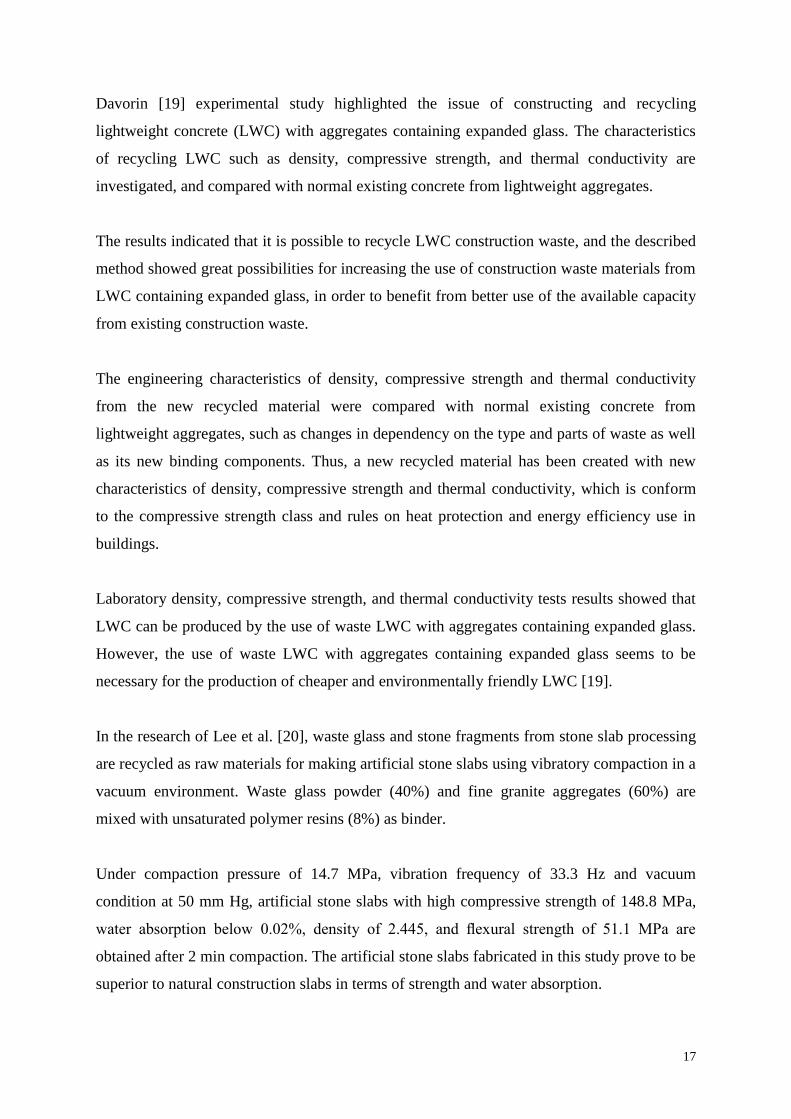
Davorin [19] experimental study highlighted the issue of constructing and recycling
lightweight concrete (LWC) with aggregates containing expanded glass. The characteristics
of recycling LWC such as density, compressive strength, and thermal conductivity are
investigated, and compared with normal existing concrete from lightweight aggregates.
The results indicated that it is possible to recycle LWC construction waste, and the described
method showed great possibilities for increasing the use of construction waste materials from
LWC containing expanded glass, in order to benefit from better use of the available capacity
from existing construction waste.
The engineering characteristics of density, compressive strength and thermal conductivity
from the new recycled material were compared with normal existing concrete from
lightweight aggregates, such as changes in dependency on the type and parts of waste as well
as its new binding components. Thus, a new recycled material has been created with new
characteristics of density, compressive strength and thermal conductivity, which is conform
to the compressive strength class and rules on heat protection and energy efficiency use in
buildings.
Laboratory density, compressive strength, and thermal conductivity tests results showed that
LWC can be produced by the use of waste LWC with aggregates containing expanded glass.
However, the use of waste LWC with aggregates containing expanded glass seems to be
necessary for the production of cheaper and environmentally friendly LWC [19].
In the research of Lee et al. [20], waste glass and stone fragments from stone slab processing
are recycled as raw materials for making artificial stone slabs using vibratory compaction in a
vacuum environment. Waste glass powder (40%) and fine granite aggregates (60%) are
mixed with unsaturated polymer resins (8%) as binder.
Under compaction pressure of 14.7 MPa, vibration frequency of 33.3 Hz and vacuum
condition at 50 mm Hg, artificial stone slabs with high compressive strength of 148.8 MPa,
water absorption below 0.02%, density of 2.445, and flexural strength of 51.1 MPa are
obtained after 2 min compaction. The artificial stone slabs fabricated in this study prove to be
superior to natural construction slabs in terms of strength and water absorption.

18
Park [21] et al. reported that the quantities of waste glass have been on the rise in recent years
due to an increase in industrialization and the rapid improvement in the standard of living.
Unfortunately, the majority of waste glass is not being recycled but rather abandoned, and is
therefore the cause of certain serious problems such as the waste of natural resources and
environmental pollution.
For these reasons, this study has been conducted through basic experimental research in order
to analyze the possibilities of recycling waste glasses (crushed waste glasses from Korea such
as amber, emerald green, flint, and mixed glass) as fine aggregates for concrete. Test results
of fresh concrete show that both slump and compacting factors are decreased due to angular
grain shape and that air content is increased due to the involvement of numerous small-sized
particles that are found in waste glasses.
In addition the compressive, tensile and flexural strengths of concrete have been shown to
decrease when the content of waste glass is increased. In conclusion, the results of this study
indicate that emerald green waste glass when used below 30% in mixing concrete is practical
along with usage of 10% SBR latex. In addition, the content of waste glasses below 30% is
practical along with usage of a pertinent admixture that is necessary to obtain workability and
air content.
Hong [22] et al. investigated and stated that the increasing awareness of glass recycling
speeds up inspections on the use of waste glass with different forms in various fields. One of
its significant contributions is to the construction field where the waste glass was reused for
value-added concrete production. Literature survey indicates that the use of waste glass as
aggregates in concrete was first reported over 50 years ago.
The concomitant ASR by using glass in concrete and its unique aesthetic properties have
been investigated since then. However, no complete solution to ASR has been found and the
application of glass in architectural concrete still needs improving.
Laboratory experiments were conducted in the University of Sheffield to further explore the
use of waste glass as coarse and fine aggregates for both ASR alleviation as well as the
decorative purpose in concrete. Their research presented mainly the latter aspect, in which
study, both fresh and hardened properties of architectural concrete were tested.
19
Results demonstrated that the use of waste glass as aggregate facilitates the development of
concrete towards a high architectural level besides its high performances, thereafter, the
increasing market in industry.
2.5 Concluding Remarks
The previous studies showed that lot of efforts have been done for investigating the effect of
using waste glass materials as a component in the concrete mix, but all of them are trying to
conform the situation and the relevant specifications in their local areas. This research aims to
implement a similar task but with applying the available locally used materials.
20
CHAPTER THREE
EXPERIMENTAL PROGRAM
3.1 Introduction
The experimental program for this research study is primarily concerned with investigating
the potential usefulness of using waste glass in the concrete mixes. Currently, the waste glass
generated in Gaza Strip is treated like any other solid waste material and thrown away into
the dump areas. Waste glass usually is produced from empty glass containers and different
construction and reconstruction remains and waste materials. The waste glass is to be crushed
into small pieces that resemble the size of gravel and sand. Then the crushed glass is mixed
into fresh concrete and then observing the effect of recycled crushed glass on the compressive
properties of concrete.
The idea is that the glass can be used as an aggregate in the concrete mix by replacing some
of the natural aggregates such as gravel and sand. Thus, the possible benefits are as follows:
less glass is thrown away saving landfill space, besides the use of fewer natural aggregates as
main components of concrete mixes would save time and money. The experimental program
of the current research was carried out to explore the effect of using crushed waste glass as an
aggregate component in the fresh concrete mixes on the compressive properties of hardened
concrete following the testing procedure specifications from The American Standard of
Testing Materials (ASTM).
All materials used in this study are locally available. Portland cement is to be used in this
investigation with the fine aggregate as desert originated natural sand of 4.75 mm maximum
particle diameter, with 20%, 40%, and 60% of fine crushed waste glass as a partial
replacement for fine aggregate. In addition to the natural crushed stone aggregate with a
maximum size of 20 mm, coarse crushed waste glass is to be used in this work as a portion of
20%, 40%, and 60% for the coarse aggregates. The concrete mixes are to be cured for 7 days
and 28 days testing.
21
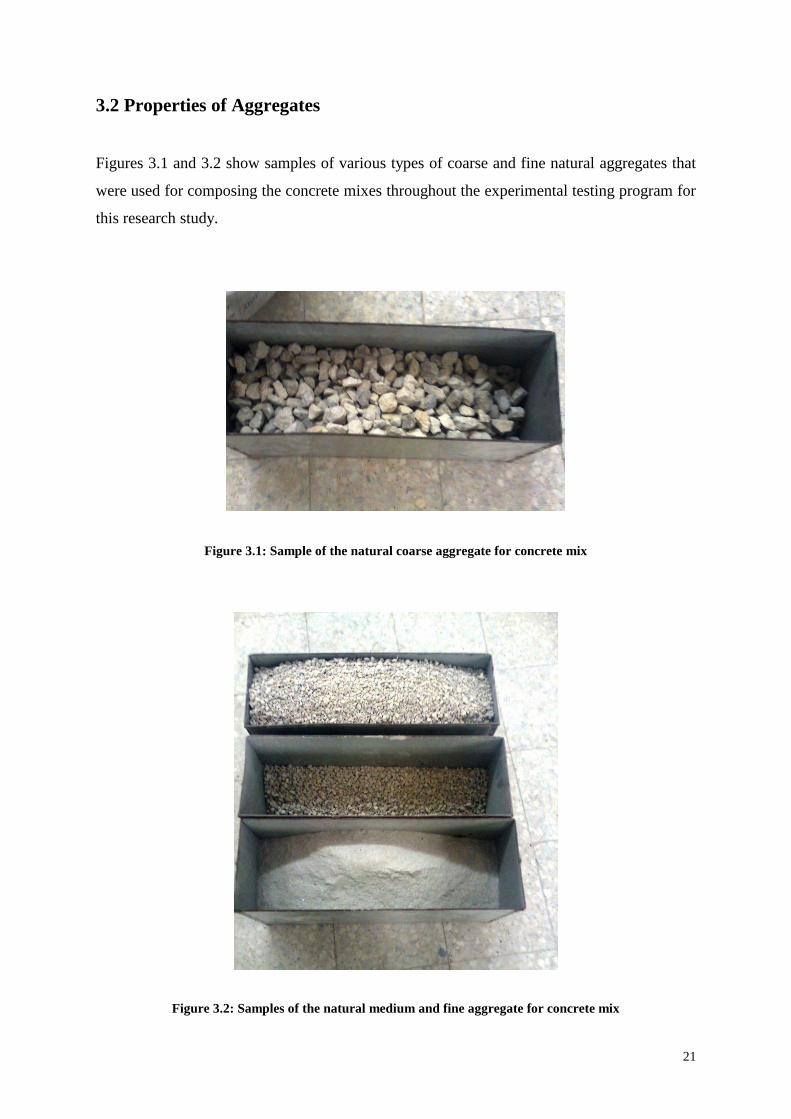
3.2 Properties of Aggregates
Figures 3.1 and 3.2 show samples of various types of coarse and fine natural aggregates that
were used for composing the concrete mixes throughout the experimental testing program for
this research study.
Figure 3.1: Sample of the natural coarse aggregate for concrete mix
Figure 3.2: Samples of the natural medium and fine aggregate for concrete mix
22
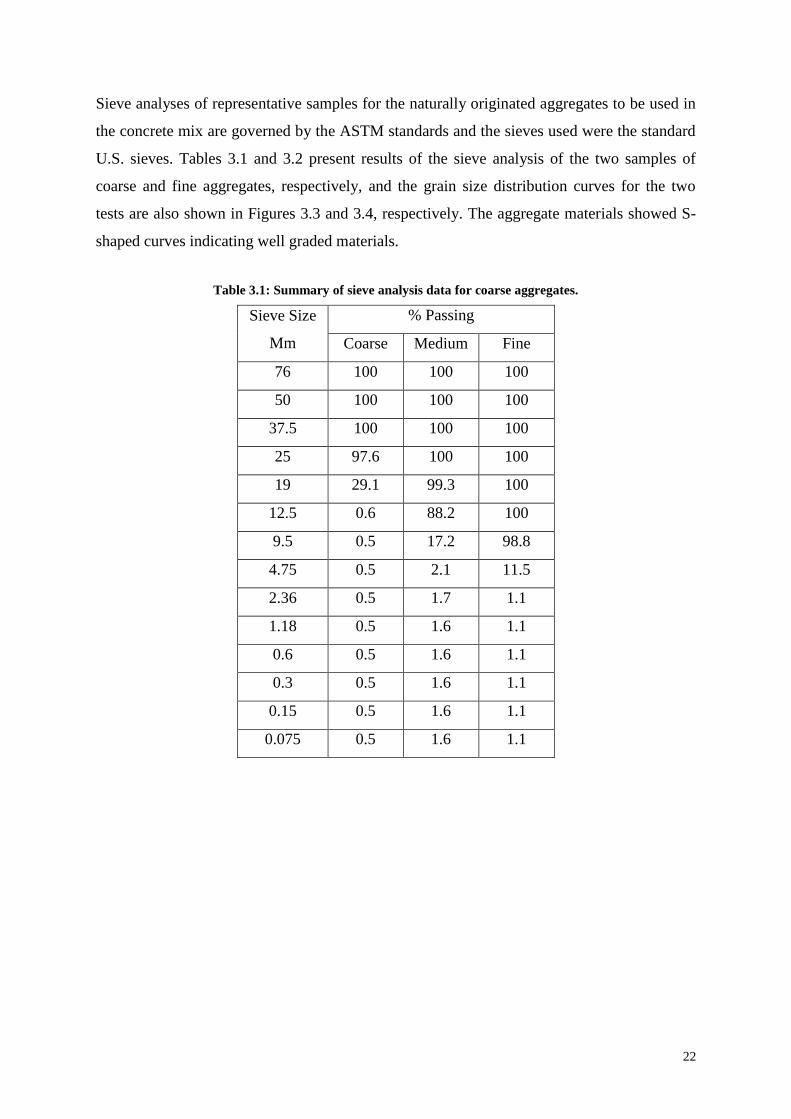
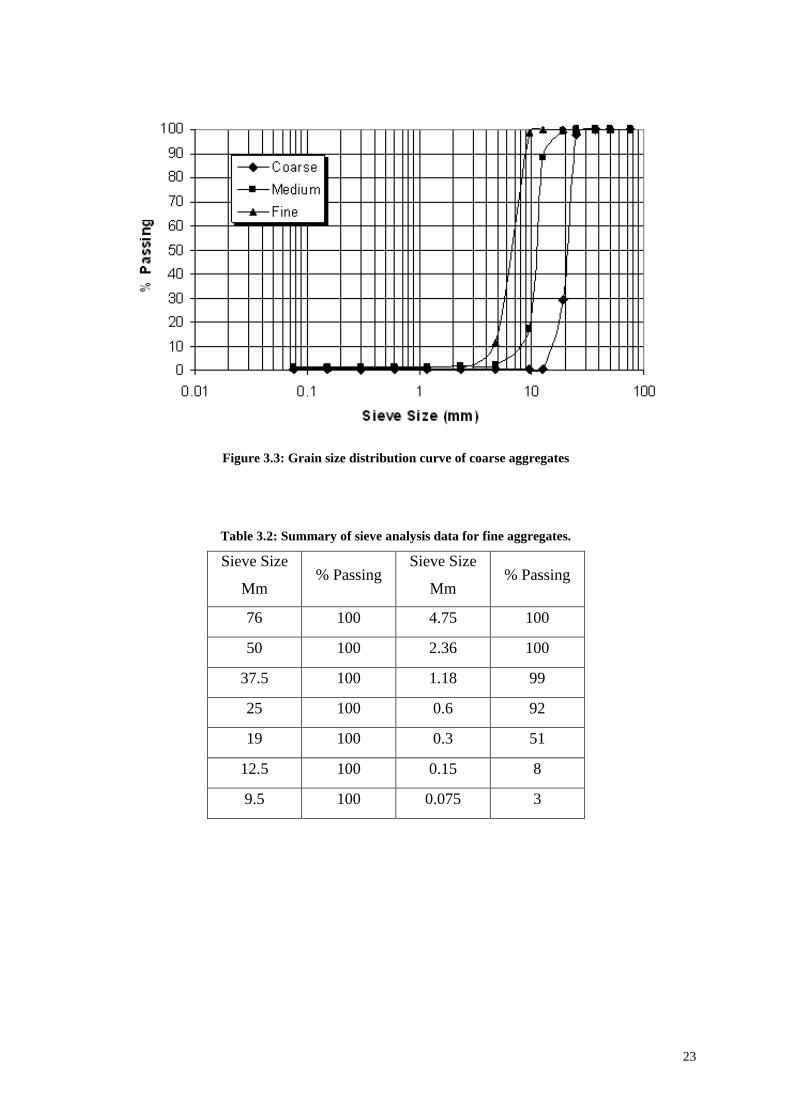
Sieve analyses of representative samples for the naturally originated aggregates to be used in
the concrete mix are governed by the ASTM standards and the sieves used were the standard
U.S. sieves. Tables 3.1 and 3.2 present results of the sieve analysis of the two samples of
coarse and fine aggregates, respectively, and the grain size distribution curves for the two
tests are also shown in Figures 3.3 and 3.4, respectively. The aggregate materials showed S-
shaped curves indicating well graded materials.
Table 3.1: Summary of sieve analysis data for coarse aggregates.
Sieve Size
Mm
% Passing
Coarse Medium Fine
76 100 100 100
50 100 100 100
37.5 100 100 100
25 97.6 100 100
19 29.1 99.3 100
12.5 0.6 88.2 100
9.5 0.5 17.2 98.8
4.75 0.5 2.1 11.5
2.36 0.5 1.7 1.1
1.18 0.5 1.6 1.1
0.6 0.5 1.6 1.1
0.3 0.5 1.6 1.1
0.15 0.5 1.6 1.1
0.075 0.5 1.6 1.1
23
Figure 3.3: Grain size distribution curve of coarse aggregates
Table 3.2: Summary of sieve analysis data for fine aggregates.
Sieve Size
Mm % Passing
Sieve Size
Mm % Passing
76 100 4.75 100
50 100 2.36 100
37.5 100 1.18 99
25 100 0.6 92
19 100 0.3 51
12.5 100 0.15 8
9.5 100 0.075 3
24
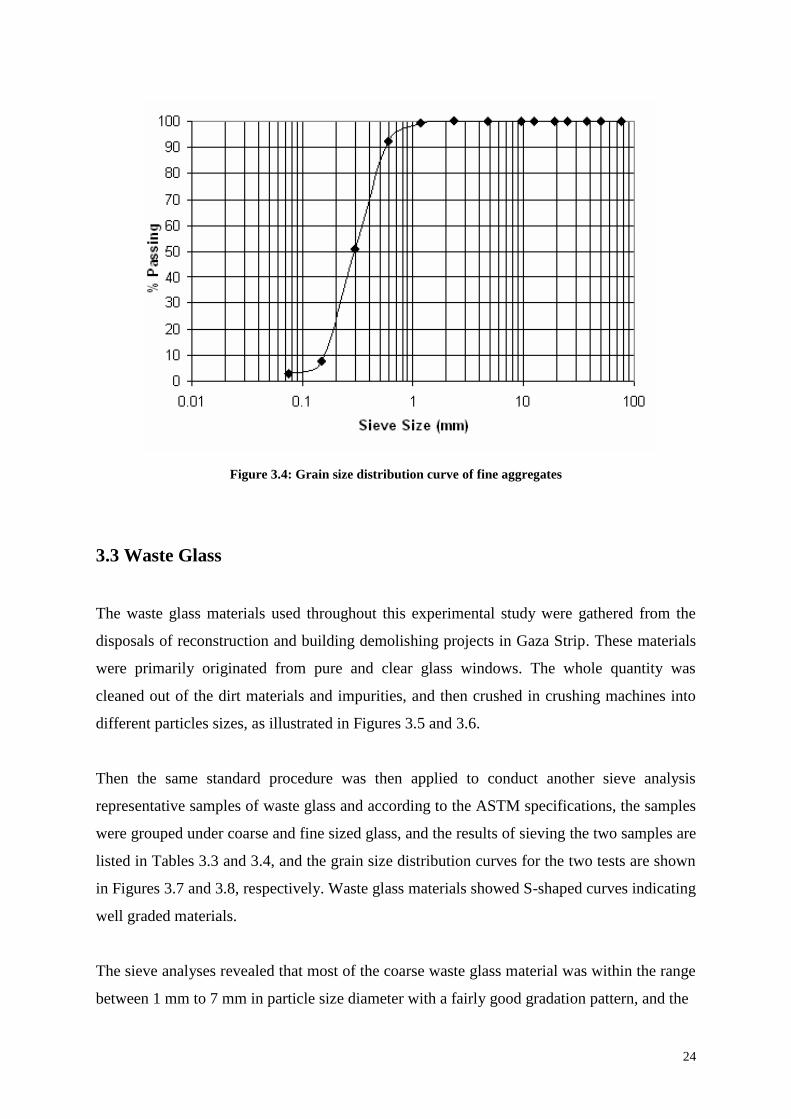
Figure 3.4: Grain size distribution curve of fine aggregates
3.3 Waste Glass
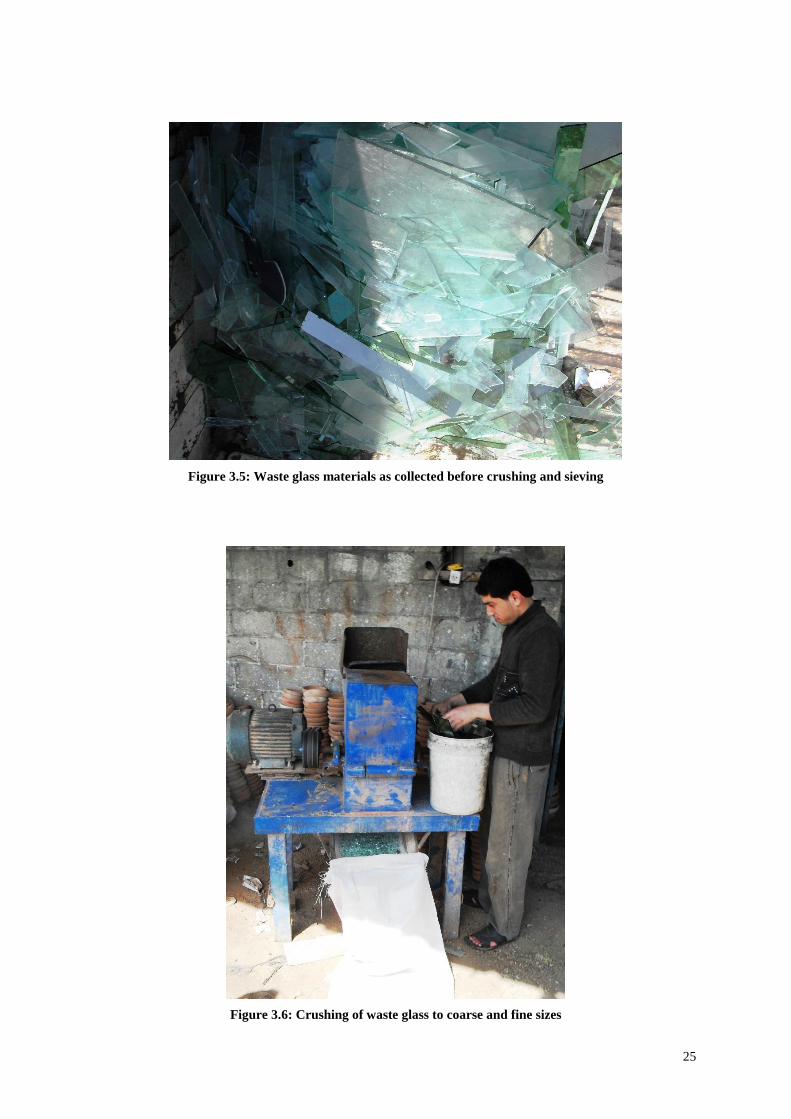
The waste glass materials used throughout this experimental study were gathered from the
disposals of reconstruction and building demolishing projects in Gaza Strip. These materials
were primarily originated from pure and clear glass windows. The whole quantity was
cleaned out of the dirt materials and impurities, and then crushed in crushing machines into
different particles sizes, as illustrated in Figures 3.5 and 3.6.
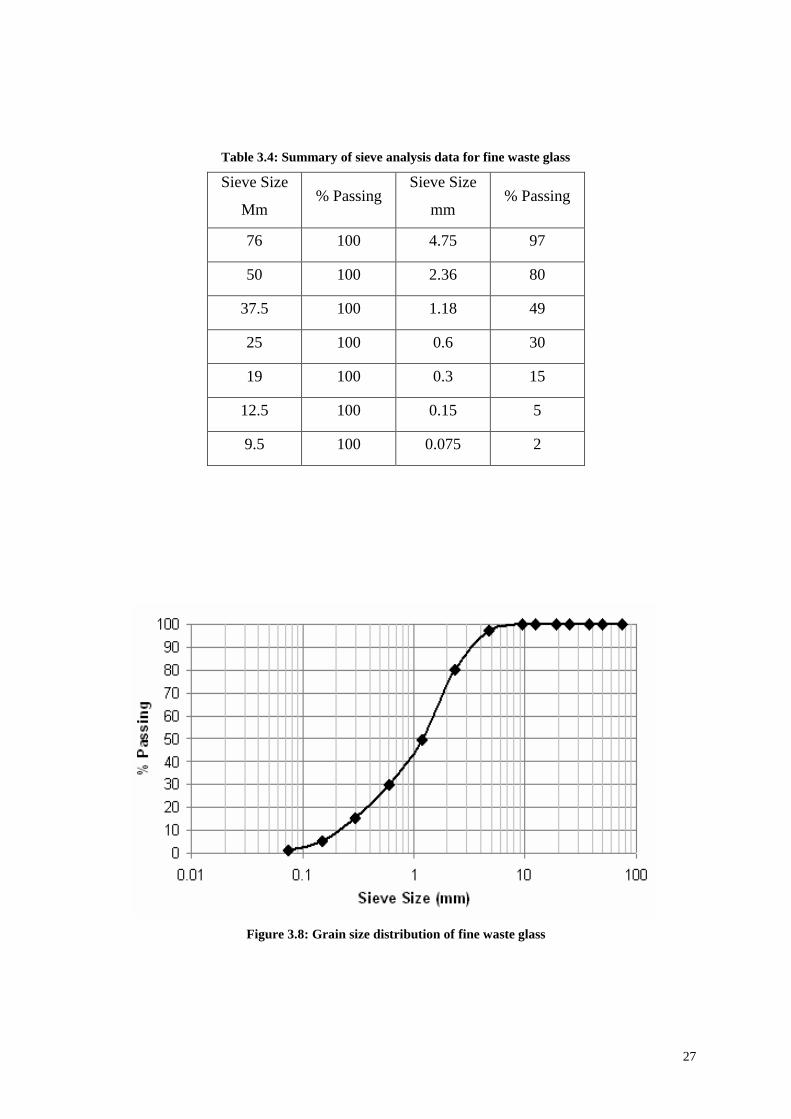
Then the same standard procedure was then applied to conduct another sieve analysis
representative samples of waste glass and according to the ASTM specifications, the samples
were grouped under coarse and fine sized glass, and the results of sieving the two samples are
listed in Tables 3.3 and 3.4, and the grain size distribution curves for the two tests are shown
in Figures 3.7 and 3.8, respectively. Waste glass materials showed S-shaped curves indicating
well graded materials.
The sieve analyses revealed that most of the coarse waste glass material was within the range
between 1 mm to 7 mm in particle size diameter with a fairly good gradation pattern, and the
25
Figure 3.5: Waste glass materials as collected before crushing and sieving
Figure 3.6: Crushing of waste glass to coarse and fine sizes

26
nominal maximum particle size diameter was 9.5 mm. While for fine waste glass materials,
the analyses showed that most of the coarse waste glass material was within the range
between 0.2 mm to 2.5 mm in particle size diameter with a very good gradation pattern, and
the nominal maximum particle size diameter was 4.75 mm.
Table 3.3: Summary of sieve analysis data for coarse waste glass
Sieve Size
Mm % Passing
Sieve Size
Mm % Passing
76 100 4.75 72
50 100 2.36 30
37.5 100 1.18 12
25 100 0.6 5
19 100 0.3 2
12.5 99 0.15 1
9.5 95 0.075 0
Figure 3.7: Grain size distribution of coarse waste glass
27
Table 3.4: Summary of sieve analysis data for fine waste glass
Sieve Size
Mm % Passing
Sieve Size
mm % Passing
76 100 4.75 97
50 100 2.36 80
37.5 100 1.18 49
25 100 0.6 30
19 100 0.3 15
12.5 100 0.15 5
9.5 100 0.075 2
Figure 3.8: Grain size distribution of fine waste glass
28
3.4 Testing Program
For the testing program, a series of 144 standard compressive tests were conducted with
variable controlling factors: water-cement ratio, coarse waste glass content, and fine waste
glass content. The reference testing samples for comparison purposes were the B300 Portland
Cement Type I mix with no waste glass content, and all the tests were done for 7-days
compressive strength and 28-days compressive strength accompanied by a slump flow test for
each case sample. Tables 3.5 and 3.6 summarize the entire testing plan conducted within this
research, and note that each group in this list comprises of 3 samples for conducting the
compressive strength and the slump tests.
The main idea behind subdividing each testing group into 3 samples is to ensure the optimum
level of credibility for the output data points, and to create a real margin of excluding
extremely odd data points so as to reach a higher level of representative data base for the
analysis phase. Some of the test results were rejected for being highly abnormal, and the tests
were repeated for these samples under the categorized parameters.
A total number of 198 testing data points was used after controlling the compiled testing
cases from data quality and completeness points of views, Reasons lying for filtering out
some of the data points were as: i) samples with improper treating and/or testing procedures,
and ii) tests with very abnormal outcomes.
Then, the testing program will continue but with focusing only on the two mixes with optimal
output results. An extra series of 54 tests will be conducted for determining the pull out
strength, the flexural strength, and the splitting resistance for the two optimal concrete mixes.
3.4.1 Pull-out strength
This test method follows the ASTM C-900-06 procedure and covers the determination of the
pullout strength of hardened concrete by measuring the force required to pull an embedded 12
mm diameter corrugated steel bar inserted into fresh concrete mix specimen. This test method
does not provide statistical procedures to estimate other strength properties.

29
3.4.2 Flexural strength
The flexural test measures the force required to bend a beam under three point loading
conditions. The data is often used to select materials for parts that will support loads without
flexing. Flexural modulus is used as an indication of a material’s stiffness when flexed. This
test method follows the ASTM D-790 procedure where the 10×10×50 cm3 hardened concrete
specimen lies on two 40 cm apart supporting spans and the load is applied to the center by the
loading nose producing three points bending at a specified rate till failure.
3.4.3 Splitting strength
The splitting tensile strength test is used in the design of structural concrete members to
evaluate the shear resistance provided by concrete and to determine the development length
of the steel reinforcement. This test method follows the ASTM C-496 procedure where the
cylindrical hardened concrete specimens with 15 cm diameter and 30 cm length are loaded
longitudinally till failure.
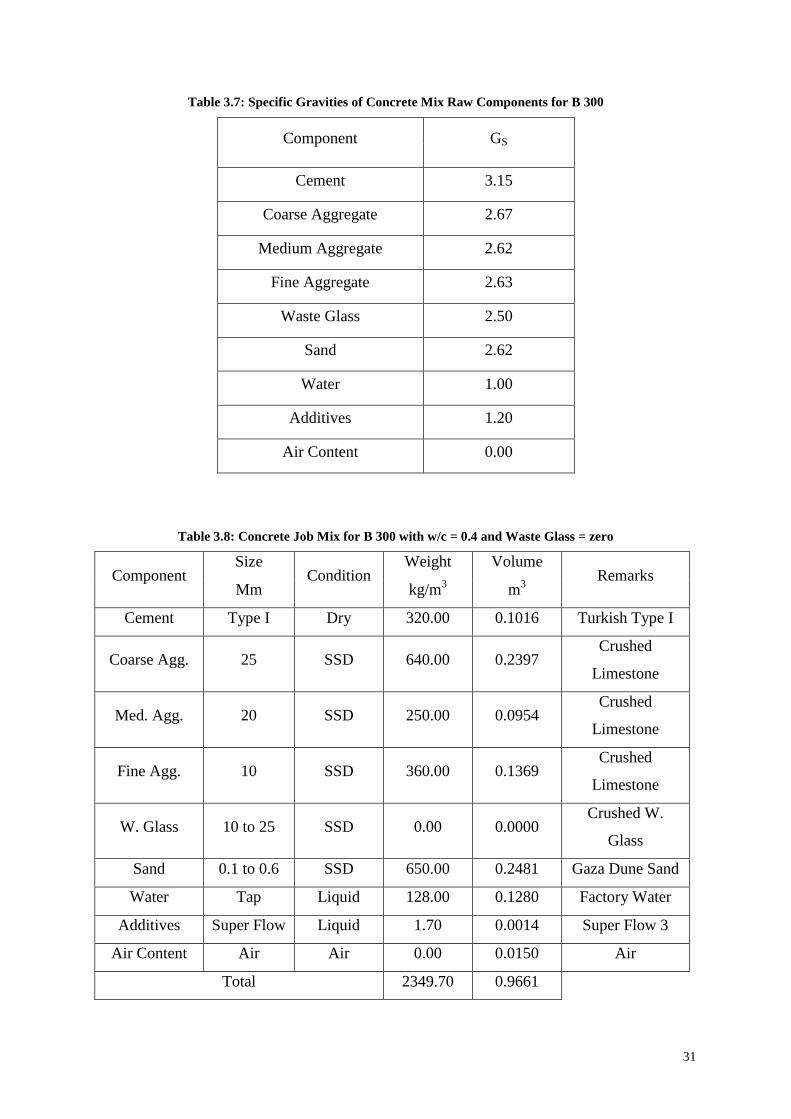
3.5 Concrete Job Mixes
Throughout the laboratory program of this research, the standard B300 concrete mix was
used as a reference for testing the glass-free concrete mixes, and then for determining the
various job mixes listed in Table 3.5 and Table 3.6 with varying the contents of coarse and
fine waste glass, respectively. Table 3.7 lists the specific gravities of all the raw components
of the concrete mixes for this testing program. This is an important starting step for
determining the mass of fine and coarse waste glass to be included in the concrete mix
according to the assigned portion of waste glass for each testing trial.
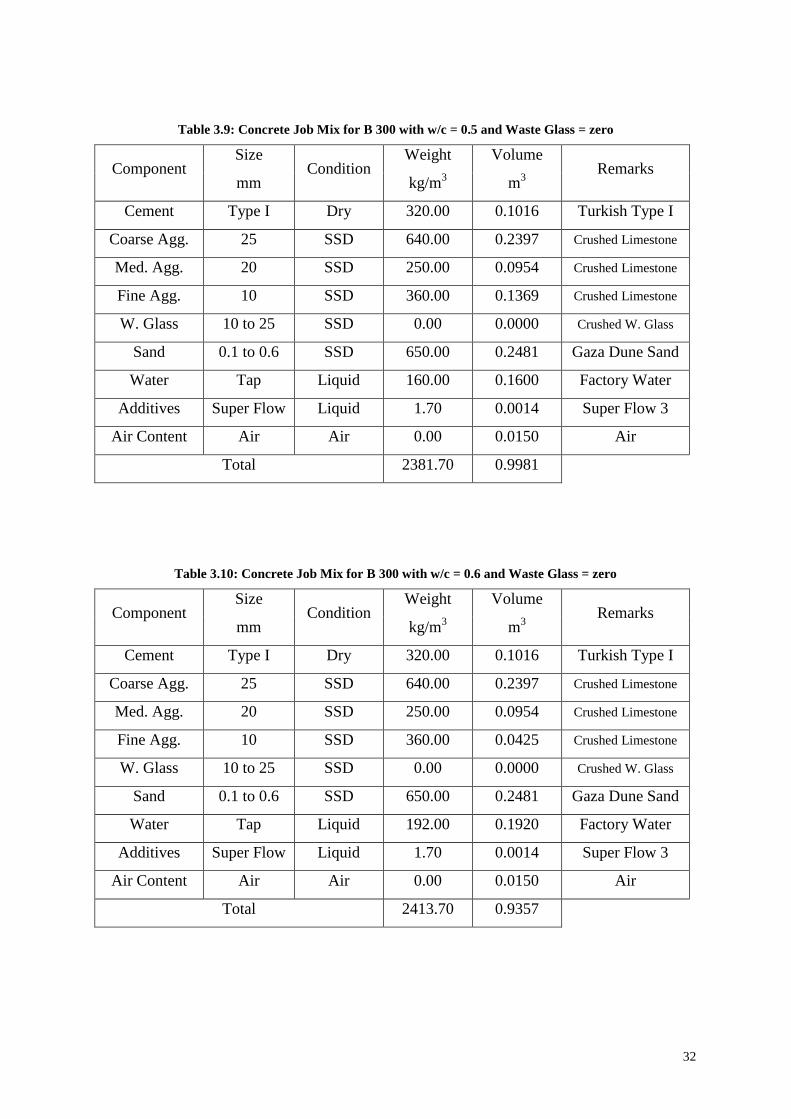
Then Tables 3.8, 3.9, and 3.10 respectively summarize the mix properties of the standard B-
300 concrete job mix without any waste glass content for three various water/cement ratios.
These ratios are meant to cover the most widely applicable in the engineering practice in
Gaza Strip, which is from 0.4 up to 0.6. It should be mentioned that these job mixes were as
per the approved standards and specifications of ASTM C136 and ASTM C 33-03.

30
Table 3.5: Experimental testing program of concrete with coarse waste glass
Group # w/c Coarse
Waste Glass
GC4-0
0.4
0.0
GC4-2 0.2
GC4-4 0.4
GC4-6 0.6
GC5-0
0.5
0.0
GC5-2 0.2
GC5-4 0.4
GC5-6 0.6
GC6-0
0.6
0.0
GC6-2 0.2
GC6-4 0.4
GC6-6 0.6
Table 3.6: Experimental testing program of concrete with fine waste glass
Group # w/c Fine Waste
Glass
GF4-0
0.4
0.0
GF4-2 0.2
GF4-4 0.4
GF4-6 0.6
GF5-0
0.5
0.0
GF5-2 0.2
GF5-4 0.4
GF5-6 0.6
GF6-0
0.6
0.0
GF6-2 0.2
GF6-4 0.4
GF6-6 0.6
31
Table 3.7: Specific Gravities of Concrete Mix Raw Components for B 300
Component GS
Cement 3.15
Coarse Aggregate 2.67
Medium Aggregate 2.62
Fine Aggregate 2.63
Waste Glass 2.50
Sand 2.62
Water 1.00
Additives 1.20
Air Content 0.00
Table 3.8: Concrete Job Mix for B 300 with w/c = 0.4 and Waste Glass = zero
Component Size
Condition Weight Volume
Remarks Mm kg/m
3 m
3
Cement Type I Dry 320.00 0.1016 Turkish Type I
Coarse Agg. 25 SSD 640.00 0.2397 Crushed
Limestone
Med. Agg. 20 SSD 250.00 0.0954 Crushed
Limestone
Fine Agg. 10 SSD 360.00 0.1369 Crushed
Limestone
W. Glass 10 to 25 SSD 0.00 0.0000 Crushed W.
Glass
Sand 0.1 to 0.6 SSD 650.00 0.2481 Gaza Dune Sand
Water Tap Liquid 128.00 0.1280 Factory Water
Additives Super Flow Liquid 1.70 0.0014 Super Flow 3
Air Content Air Air 0.00 0.0150 Air
Total 2349.70 0.9661
32
Table 3.9: Concrete Job Mix for B 300 with w/c = 0.5 and Waste Glass = zero
Component Size
Condition Weight Volume
Remarks mm kg/m
3 m
3
Cement Type I Dry 320.00 0.1016 Turkish Type I
Coarse Agg. 25 SSD 640.00 0.2397 Crushed Limestone
Med. Agg. 20 SSD 250.00 0.0954 Crushed Limestone
Fine Agg. 10 SSD 360.00 0.1369 Crushed Limestone
W. Glass 10 to 25 SSD 0.00 0.0000 Crushed W. Glass
Sand 0.1 to 0.6 SSD 650.00 0.2481 Gaza Dune Sand
Water Tap Liquid 160.00 0.1600 Factory Water
Additives Super Flow Liquid 1.70 0.0014 Super Flow 3
Air Content Air Air 0.00 0.0150 Air
Total 2381.70 0.9981
Table 3.10: Concrete Job Mix for B 300 with w/c = 0.6 and Waste Glass = zero
Component Size
Condition Weight Volume
Remarks mm kg/m
3 m
3
Cement Type I Dry 320.00 0.1016 Turkish Type I
Coarse Agg. 25 SSD 640.00 0.2397 Crushed Limestone
Med. Agg. 20 SSD 250.00 0.0954 Crushed Limestone
Fine Agg. 10 SSD 360.00 0.0425 Crushed Limestone
W. Glass 10 to 25 SSD 0.00 0.0000 Crushed W. Glass
Sand 0.1 to 0.6 SSD 650.00 0.2481 Gaza Dune Sand
Water Tap Liquid 192.00 0.1920 Factory Water
Additives Super Flow Liquid 1.70 0.0014 Super Flow 3
Air Content Air Air 0.00 0.0150 Air
Total 2413.70 0.9357
33
After that in Appendix A, Tables A.1 through A.9 show various mix combinations for the
same concrete mix but with several coarse waste glass contents for the previously assigned
water/cement ratios. For each waste glass portion, the idea was to replace the stated portion
as part of the coarse aggregates in the concrete mix, with maintaining the total volume of the
coarse aggregates and the coarse waste glass in the mix as a constant amount.
Finally and also in Appendix A, Tables A.10 through A.18 show various mix combinations
for the same concrete mix but this time with several fine waste glass contents, and also for the
previously assigned water/cement ratios. For each fine glass portion, the stated portion was
replaced as part of the fine aggregates in the concrete mix, but with maintaining the total
volume of the fine aggregates including the fine waste glass in the mix as a constant amount.
34
CHAPTER 4
LABORATORY TESTING RESULTS AND DATA ANALYSES
4.1 Introduction
This main aim of this chapter is to obtain the fresh concrete workability and the hardened
concrete compressive strength as the essentials for the analyses following the methodology
targeting to highlight the usefulness of considering waste glass materials as a main
component within the concrete mix. Proper treatment of uncertainties within the data analysis
process required understanding the sources of errors for determining the final output results.
It is worthy to mention that for the sake of simplicity, some of the variables that may actually
influence the hardened concrete compressive strength such as: various combinations of both
coarse and fine waste glass within the concrete mix, the effect of different admixtures on
concrete mixes containing waste glass, and the effect of waste glass material type and
properties on the engineering properties of concrete, etc. are not considered within the scope
of this research study, since those excluded variables may act as sources of errors for the
resulting predictions and recommendations.
4.2 Testing program results
According to the experimental testing program set previously, the final output results for 24
different sample groups regarding slump values for fresh concrete and mass densities for
hardened concrete are listed in Tables 4.1 and 4.3.
Moreover, the final output results for all the sample groups are listed in Tables 4.2 and 4.4
with 7-days compressive strengths for hardened concrete and 28-days compressive strengths
for hardened concrete outcome results for each testing group. The following sections will
analysis comprehensively all obtained results.
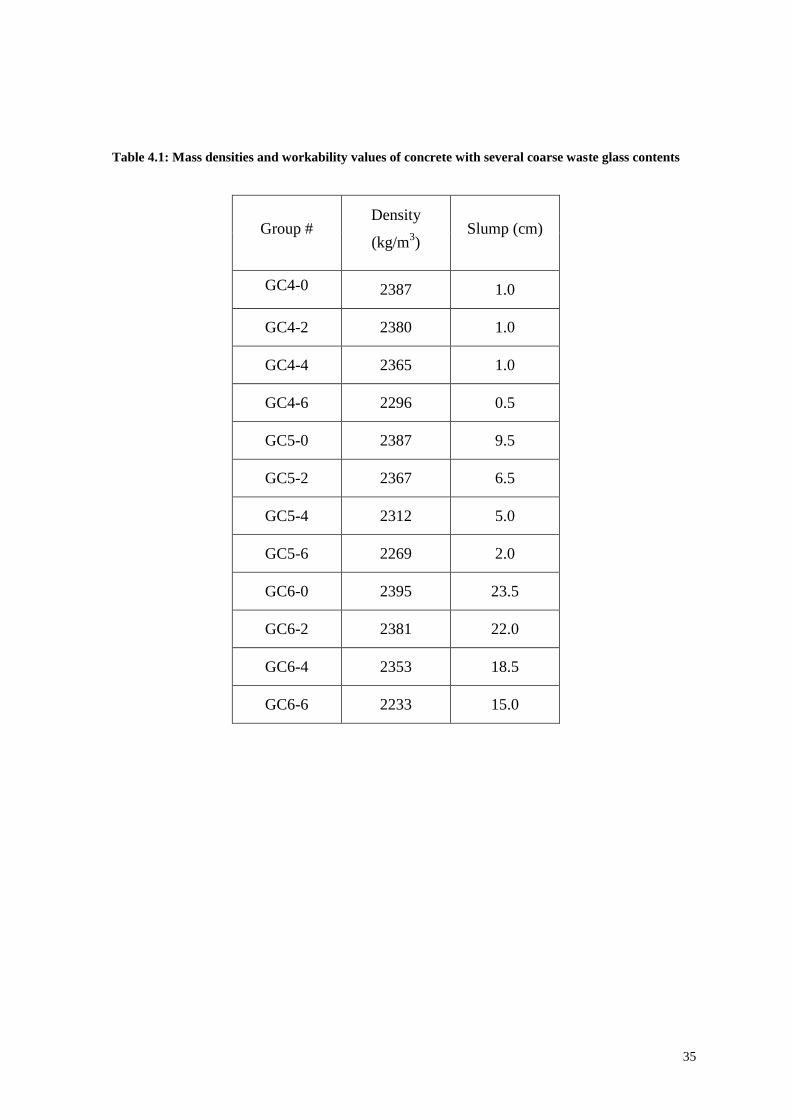
35
Table 4.1: Mass densities and workability values of concrete with several coarse waste glass contents
Group # Density
(kg/m3)
Slump (cm)
GC4-0 2387 1.0
GC4-2 2380 1.0
GC4-4 2365 1.0
GC4-6 2296 0.5
GC5-0 2387 9.5
GC5-2 2367 6.5
GC5-4 2312 5.0
GC5-6 2269 2.0
GC6-0 2395 23.5
GC6-2 2381 22.0
GC6-4 2353 18.5
GC6-6 2233 15.0
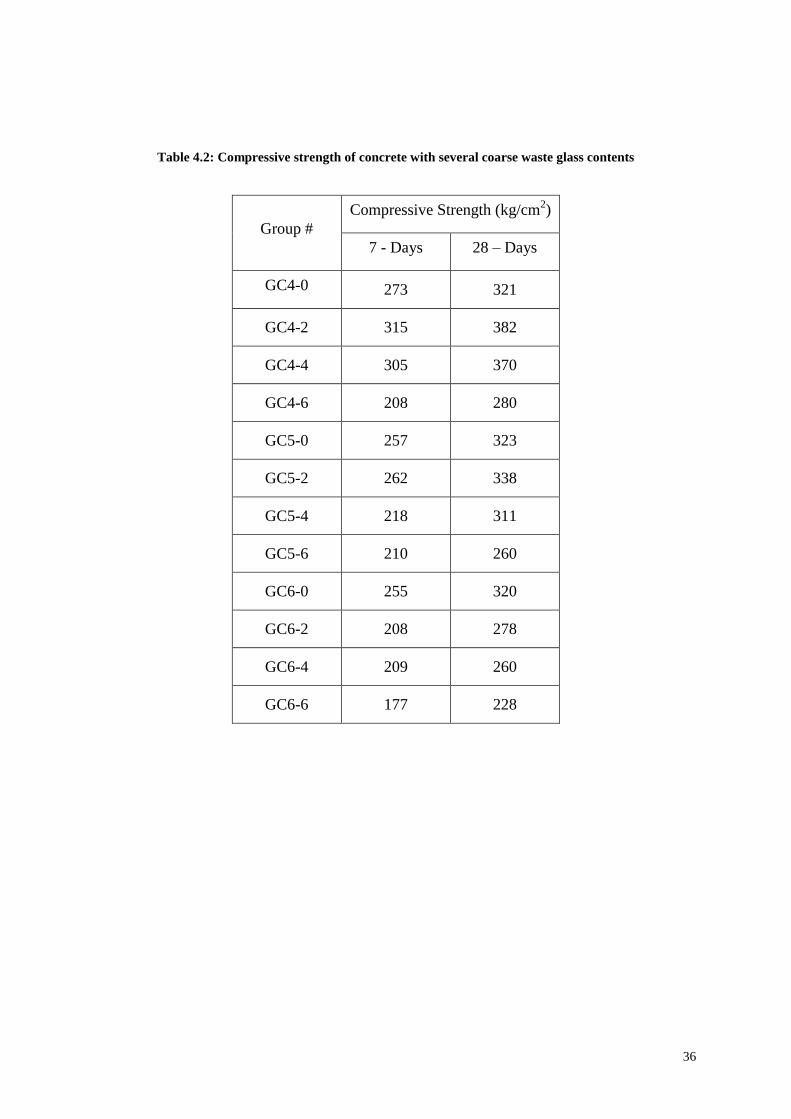
36
Table 4.2: Compressive strength of concrete with several coarse waste glass contents
Group #
Compressive Strength (kg/cm2)
7 - Days 28 – Days
GC4-0 273 321
GC4-2 315 382
GC4-4 305 370
GC4-6 208 280
GC5-0 257 323
GC5-2 262 338
GC5-4 218 311
GC5-6 210 260
GC6-0 255 320
GC6-2 208 278
GC6-4 209 260
GC6-6 177 228
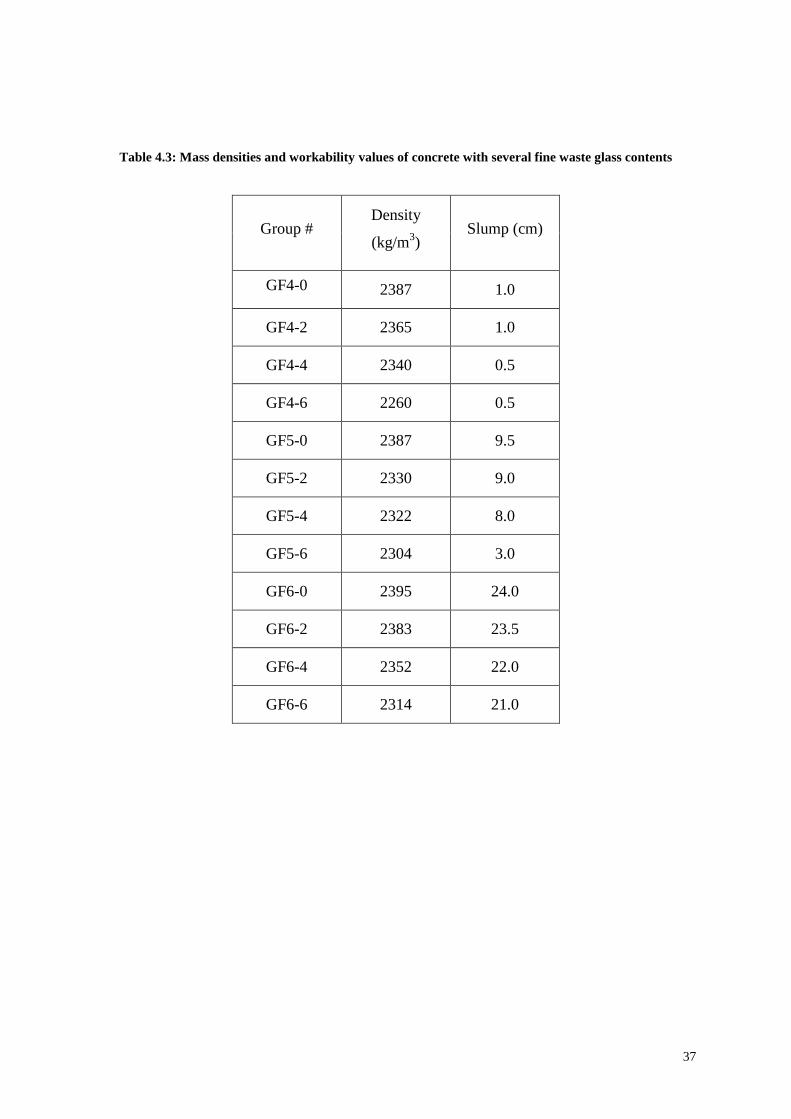
37
Table 4.3: Mass densities and workability values of concrete with several fine waste glass contents
Group # Density
(kg/m3)
Slump (cm)
GF4-0 2387 1.0
GF4-2 2365 1.0
GF4-4 2340 0.5
GF4-6 2260 0.5
GF5-0 2387 9.5
GF5-2 2330 9.0
GF5-4 2322 8.0
GF5-6 2304 3.0
GF6-0 2395 24.0
GF6-2 2383 23.5
GF6-4 2352 22.0
GF6-6 2314 21.0

38
Table 4.4: Compressive strength of concrete with several fine waste glass contents
Group #
Compressive Strength (kg/cm2)
7 - Days 28 - Days
GF4-0 273 321
GF4-2 301 399
GF4-4 241 319
GF4-6 190 304
GF5-0 257 323
GF5-2 241 318
GF5-4 233 302
GF5-6 228 300
GF6-0 255 320
GF6-2 205 275
GF6-4 212 265
GF6-6 193 232
4.3 Effect of replacing waste glass on concrete density
4.3.1 Coarse waste glass
Figures 4.1 and 4.2 illustrate the effect of coarse waste glass content into the concrete mix on
the mass density of the hardened concrete for different water cements ratios. As a general
outcome, it can be easily noticed that concrete mass density was inversely affected by the
increase of water cement ratio. More specifically, for the concrete with water cement ratio of
0.6, the concrete mass density decreased when the portion of coarse waste glass exceeded 0.4.
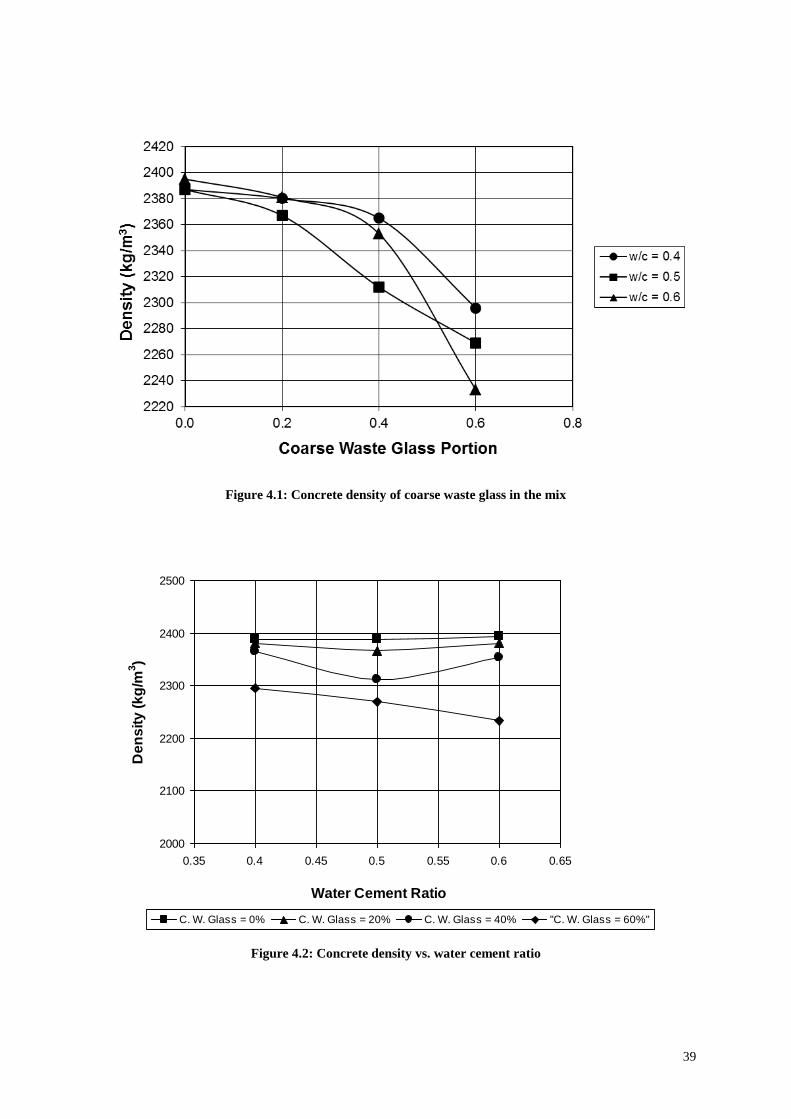
39
Figure 4.1: Concrete density of coarse waste glass in the mix
2000
2100
2200
2300
2400
2500
0.35 0.4 0.45 0.5 0.55 0.6 0.65
Water Cement Ratio
De
ns
ity
(k
g/m
3)
C. W. Glass = 0% C. W. Glass = 20% C. W. Glass = 40% "C. W. Glass = 60%"
Figure 4.2: Concrete density vs. water cement ratio
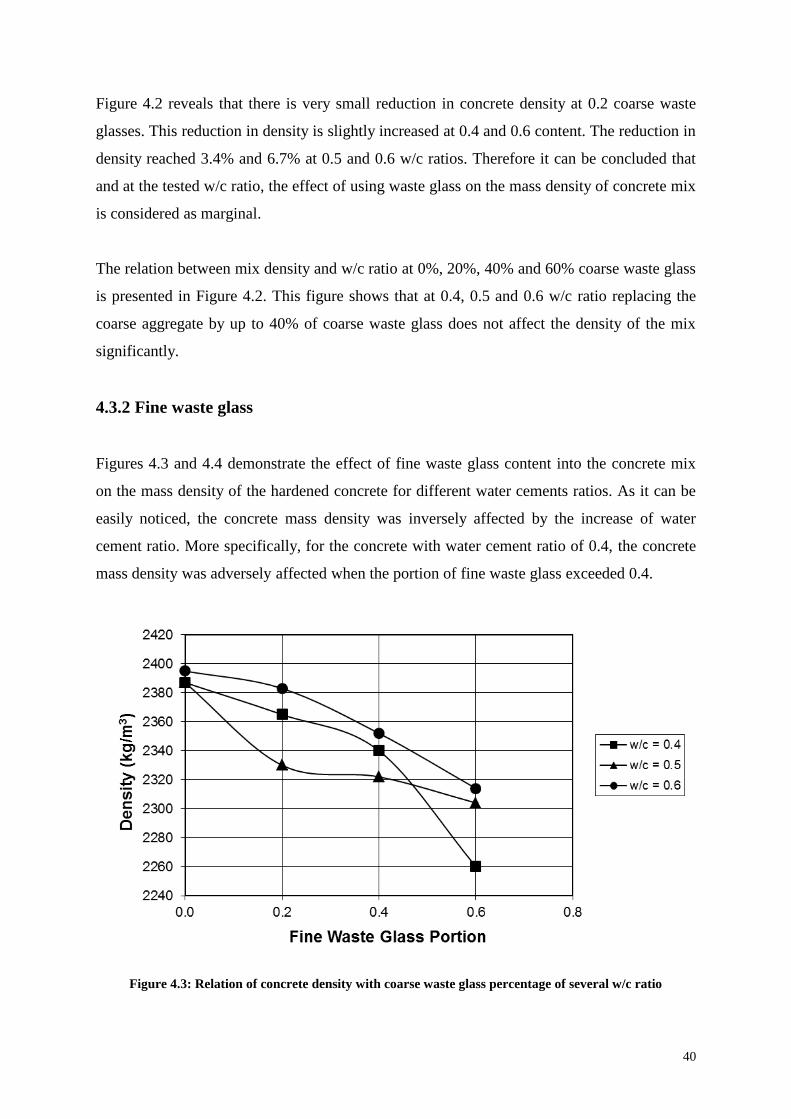
40
Figure 4.2 reveals that there is very small reduction in concrete density at 0.2 coarse waste
glasses. This reduction in density is slightly increased at 0.4 and 0.6 content. The reduction in
density reached 3.4% and 6.7% at 0.5 and 0.6 w/c ratios. Therefore it can be concluded that
and at the tested w/c ratio, the effect of using waste glass on the mass density of concrete mix
is considered as marginal.
The relation between mix density and w/c ratio at 0%, 20%, 40% and 60% coarse waste glass
is presented in Figure 4.2. This figure shows that at 0.4, 0.5 and 0.6 w/c ratio replacing the
coarse aggregate by up to 40% of coarse waste glass does not affect the density of the mix
significantly.
4.3.2 Fine waste glass
Figures 4.3 and 4.4 demonstrate the effect of fine waste glass content into the concrete mix
on the mass density of the hardened concrete for different water cements ratios. As it can be
easily noticed, the concrete mass density was inversely affected by the increase of water
cement ratio. More specifically, for the concrete with water cement ratio of 0.4, the concrete
mass density was adversely affected when the portion of fine waste glass exceeded 0.4.
Figure 4.3: Relation of concrete density with coarse waste glass percentage of several w/c ratio

41
2000
2100
2200
2300
2400
2500
0.35 0.4 0.45 0.5 0.55 0.6 0.65
Water Cement Ratio
De
ns
ity
(k
g/m
3)
F. W. Glass = 0% F. W. Glass = 20% F. W. Glass = 40% F. W. Glass = 60%
Figure 4.4: Concrete mass density vs. water cement ratio
4.4 Effect of replacing waste glass on concrete workability
4.4.1 Coarse waste glass
Figures 4.5 and 4.6 illustrate the effect of coarse waste glass content respectively into the
concrete mix on the workability of the fresh concrete mix expressed as the slump flow rate
for different water-cement ratios. The data interpretation was done on two different bases: the
waste glass content; and the mixing water cement ratio.
4.4.2 Fine waste glass
The effect of fine waste glass content into the concrete mix on the workability of the fresh
concrete mix expressed as the slump flow rate for different water-cement ratios, as shown in
Figures 4.7 and 4.8. The data interpretation was done on two different bases: the waste glass
content, and the mixing water cement ratio. As it can be seen, the fresh concrete workability
is inversely affected by the increase of water-cement ratio.
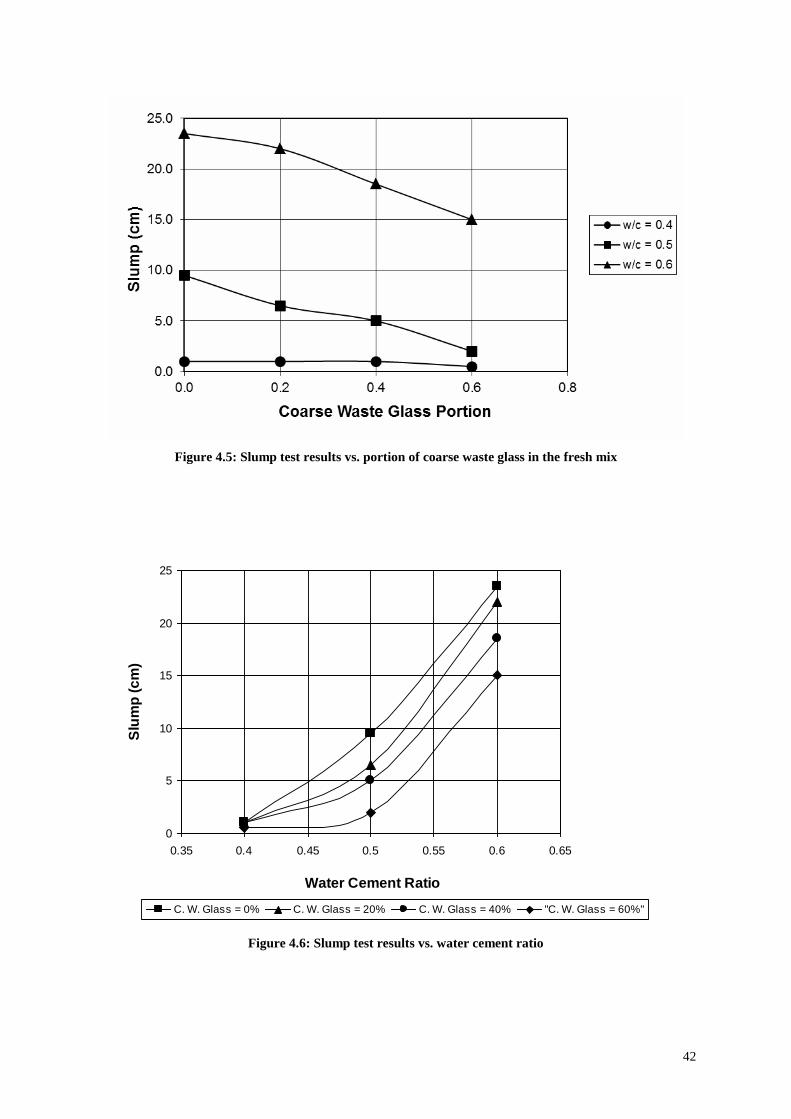
42
Figure 4.5: Slump test results vs. portion of coarse waste glass in the fresh mix
0
5
10
15
20
25
0.35 0.4 0.45 0.5 0.55 0.6 0.65
Water Cement Ratio
Slu
mp
(c
m)
C. W. Glass = 0% C. W. Glass = 20% C. W. Glass = 40% "C. W. Glass = 60%"
Figure 4.6: Slump test results vs. water cement ratio
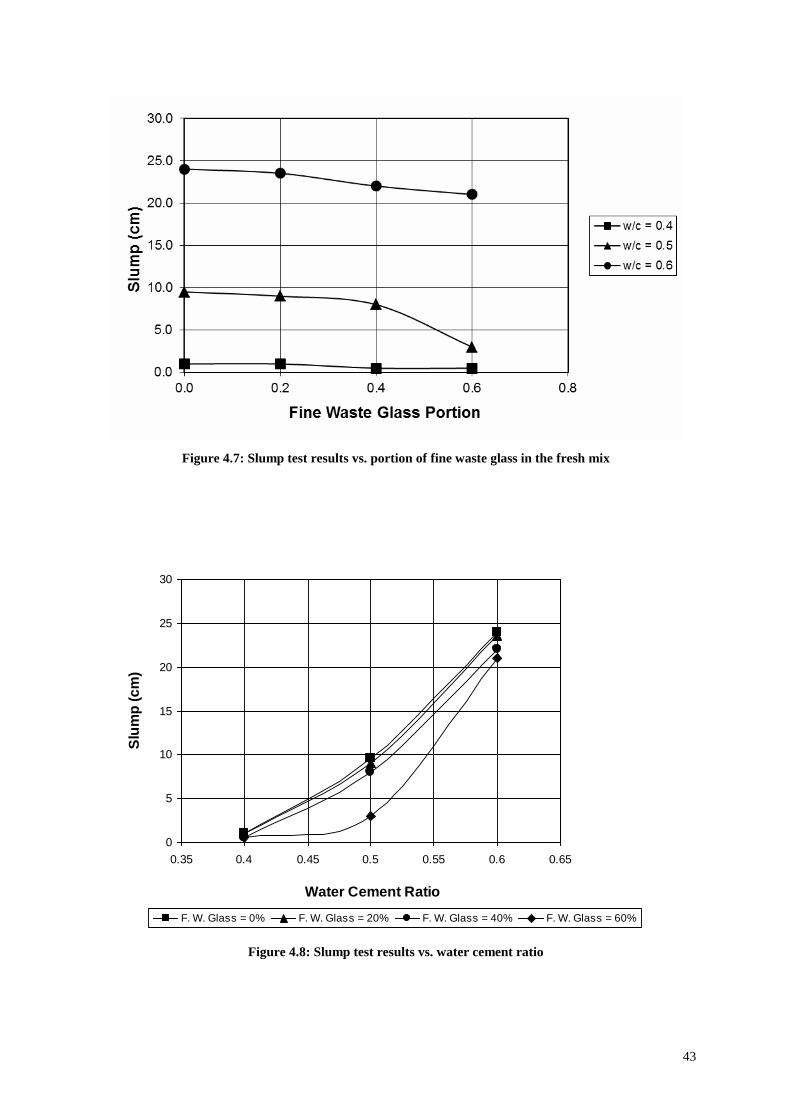
43
Figure 4.7: Slump test results vs. portion of fine waste glass in the fresh mix
0
5
10
15
20
25
30
0.35 0.4 0.45 0.5 0.55 0.6 0.65
Water Cement Ratio
Slu
mp
(c
m)
F. W. Glass = 0% F. W. Glass = 20% F. W. Glass = 40% F. W. Glass = 60%
Figure 4.8: Slump test results vs. water cement ratio
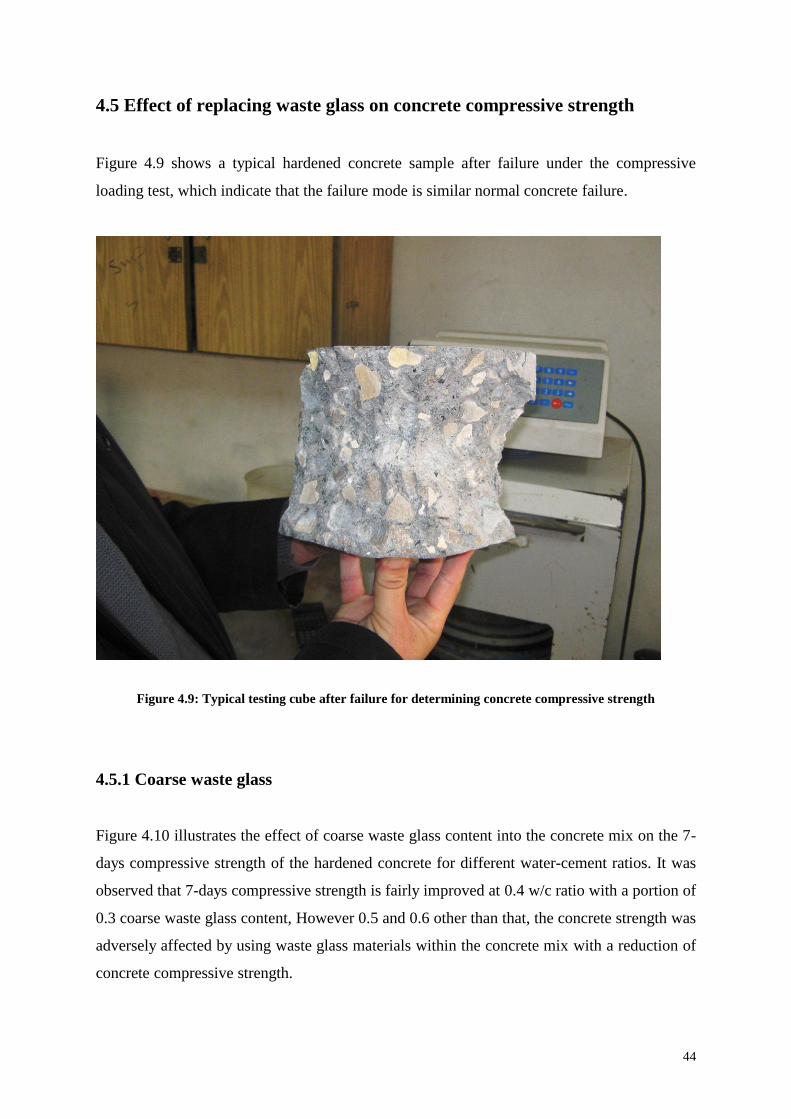
44
4.5 Effect of replacing waste glass on concrete compressive strength
Figure 4.9 shows a typical hardened concrete sample after failure under the compressive
loading test, which indicate that the failure mode is similar normal concrete failure.
Figure 4.9: Typical testing cube after failure for determining concrete compressive strength
4.5.1 Coarse waste glass
Figure 4.10 illustrates the effect of coarse waste glass content into the concrete mix on the 7-
days compressive strength of the hardened concrete for different water-cement ratios. It was
observed that 7-days compressive strength is fairly improved at 0.4 w/c ratio with a portion of
0.3 coarse waste glass content, However 0.5 and 0.6 other than that, the concrete strength was
adversely affected by using waste glass materials within the concrete mix with a reduction of
concrete compressive strength.
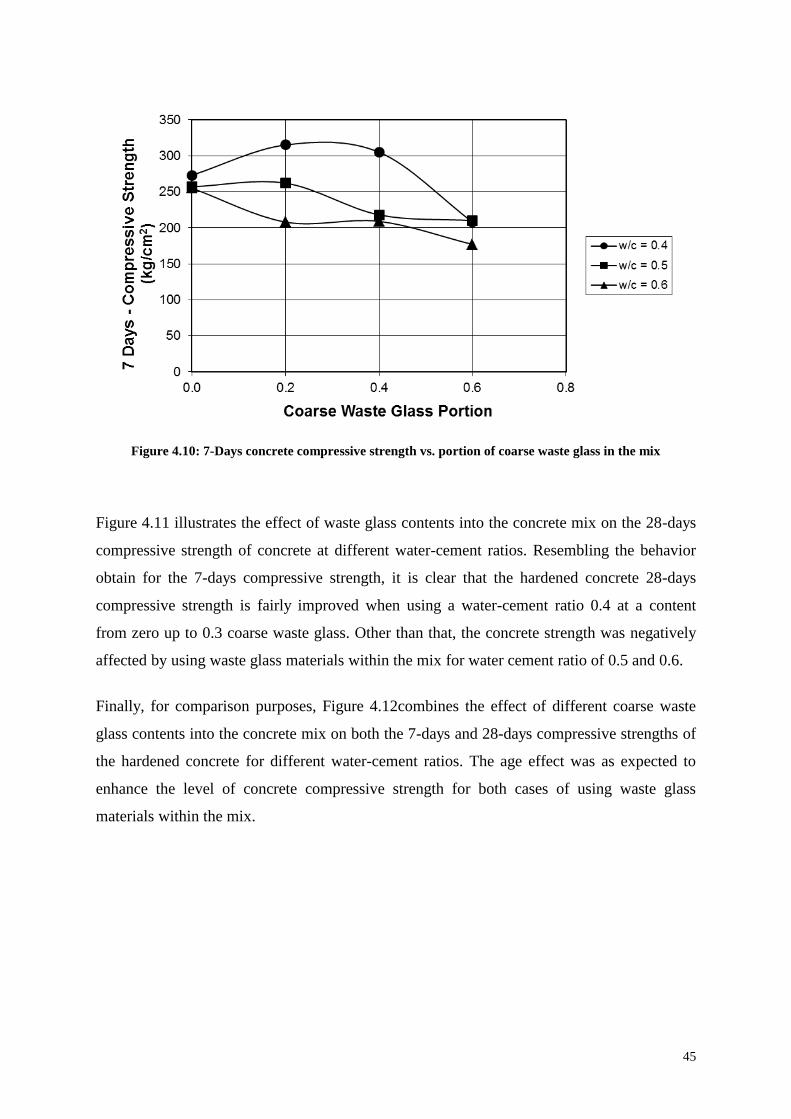
45
Figure 4.10: 7-Days concrete compressive strength vs. portion of coarse waste glass in the mix
Figure 4.11 illustrates the effect of waste glass contents into the concrete mix on the 28-days
compressive strength of concrete at different water-cement ratios. Resembling the behavior
obtain for the 7-days compressive strength, it is clear that the hardened concrete 28-days
compressive strength is fairly improved when using a water-cement ratio 0.4 at a content
from zero up to 0.3 coarse waste glass. Other than that, the concrete strength was negatively
affected by using waste glass materials within the mix for water cement ratio of 0.5 and 0.6.
Finally, for comparison purposes, Figure 4.12combines the effect of different coarse waste
glass contents into the concrete mix on both the 7-days and 28-days compressive strengths of
the hardened concrete for different water-cement ratios. The age effect was as expected to
enhance the level of concrete compressive strength for both cases of using waste glass
materials within the mix.
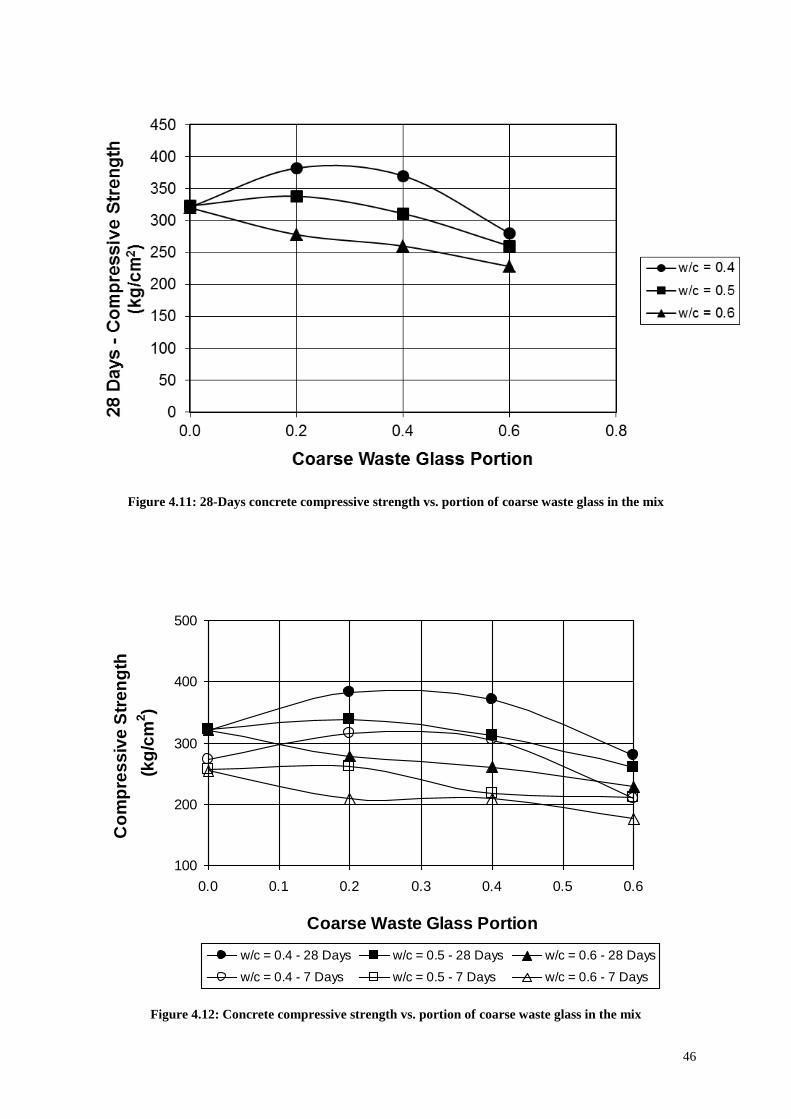
46
Figure 4.11: 28-Days concrete compressive strength vs. portion of coarse waste glass in the mix
Figure 4.12: Concrete compressive strength vs. portion of coarse waste glass in the mix
100
200
300
400
500
0.0 0.1 0.2 0.3 0.4 0.5 0.6
Coarse Waste Glass Portion
Co
mp
res
siv
e S
tre
ng
th
(kg
/cm
2)
w/c = 0.4 - 28 Days w/c = 0.5 - 28 Days w/c = 0.6 - 28 Days
w/c = 0.4 - 7 Days w/c = 0.5 - 7 Days w/c = 0.6 - 7 Days
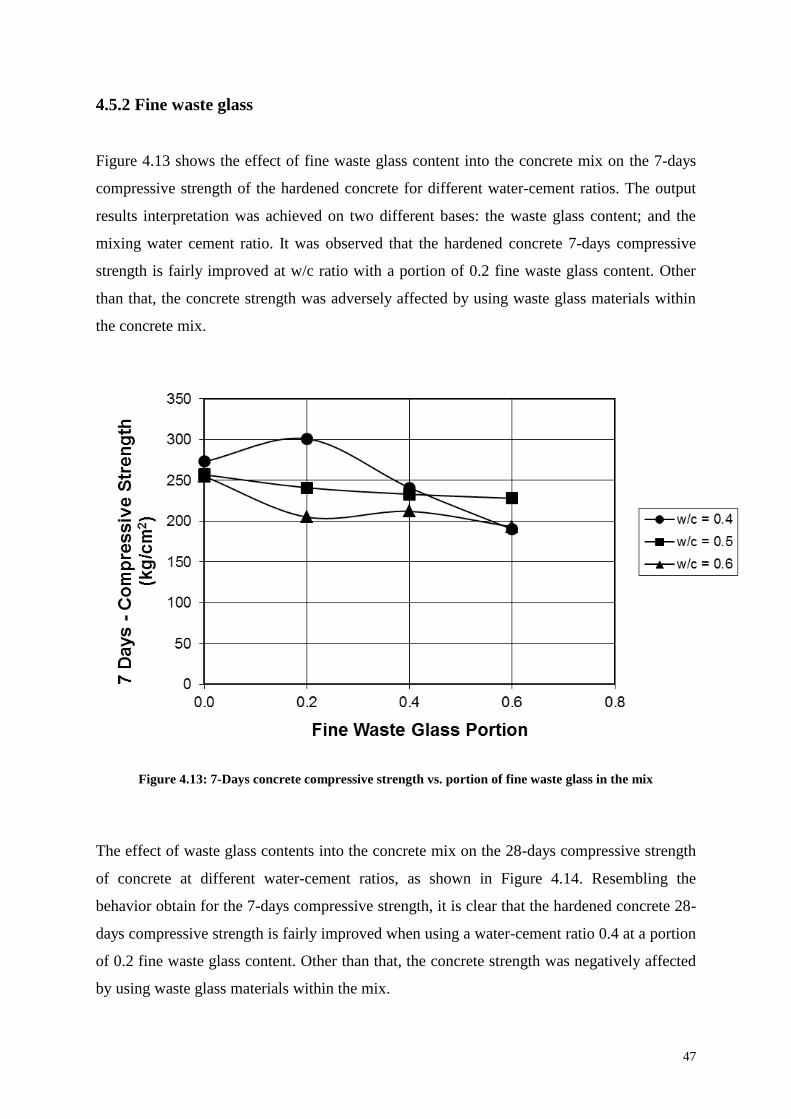
47
4.5.2 Fine waste glass
Figure 4.13 shows the effect of fine waste glass content into the concrete mix on the 7-days
compressive strength of the hardened concrete for different water-cement ratios. The output
results interpretation was achieved on two different bases: the waste glass content; and the
mixing water cement ratio. It was observed that the hardened concrete 7-days compressive
strength is fairly improved at w/c ratio with a portion of 0.2 fine waste glass content. Other
than that, the concrete strength was adversely affected by using waste glass materials within
the concrete mix.
Figure 4.13: 7-Days concrete compressive strength vs. portion of fine waste glass in the mix
The effect of waste glass contents into the concrete mix on the 28-days compressive strength
of concrete at different water-cement ratios, as shown in Figure 4.14. Resembling the
behavior obtain for the 7-days compressive strength, it is clear that the hardened concrete 28-
days compressive strength is fairly improved when using a water-cement ratio 0.4 at a portion
of 0.2 fine waste glass content. Other than that, the concrete strength was negatively affected
by using waste glass materials within the mix.
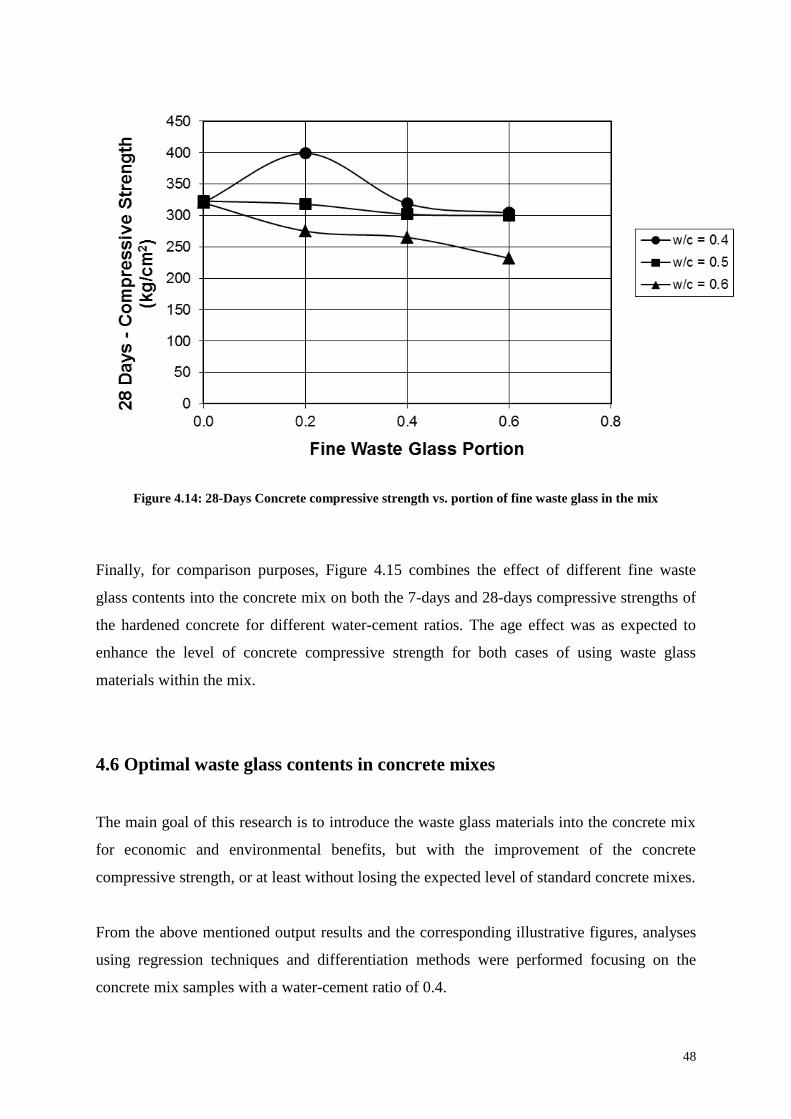
48
Figure 4.14: 28-Days Concrete compressive strength vs. portion of fine waste glass in the mix
Finally, for comparison purposes, Figure 4.15 combines the effect of different fine waste
glass contents into the concrete mix on both the 7-days and 28-days compressive strengths of
the hardened concrete for different water-cement ratios. The age effect was as expected to
enhance the level of concrete compressive strength for both cases of using waste glass
materials within the mix.
4.6 Optimal waste glass contents in concrete mixes
The main goal of this research is to introduce the waste glass materials into the concrete mix
for economic and environmental benefits, but with the improvement of the concrete
compressive strength, or at least without losing the expected level of standard concrete mixes.
From the above mentioned output results and the corresponding illustrative figures, analyses
using regression techniques and differentiation methods were performed focusing on the
concrete mix samples with a water-cement ratio of 0.4.

49
Figure 4.15: Concrete compressive strength vs. portion of fine waste glass in the mix
Table 4.5 summarizes the testing outcomes for the 7-days category for coarse waste glass,
while Table 4.6 summarizes the testing outcomes for the 28-days category for coarse waste
glass, respectively.
Table 4.5: Summary of the 7-days comprehensive strengths for concrete mix with different portions of
coarse waste glass and a water-cement ratio of 0.4
Group # Coarse Waste Glass 7-Days Compressive
Strength (kg/cm2)
1 0.0 273
2 0.2 315
3 0.4 305
4 0.6 208
100
200
300
400
500
0.0 0.1 0.2 0.3 0.4 0.5 0.6
Fine Waste Glass Portion
Co
mp
res
siv
e S
tre
ng
th
(kg
/cm
2)
w/c = 0.4 - 28 Days w/c = 0.5 - 28 Days w/c = 0.6 - 28 Days
w/c = 0.4 - 7 Days w/c = 0.5 - 7 Days w/c = 0.6 - 7 Days
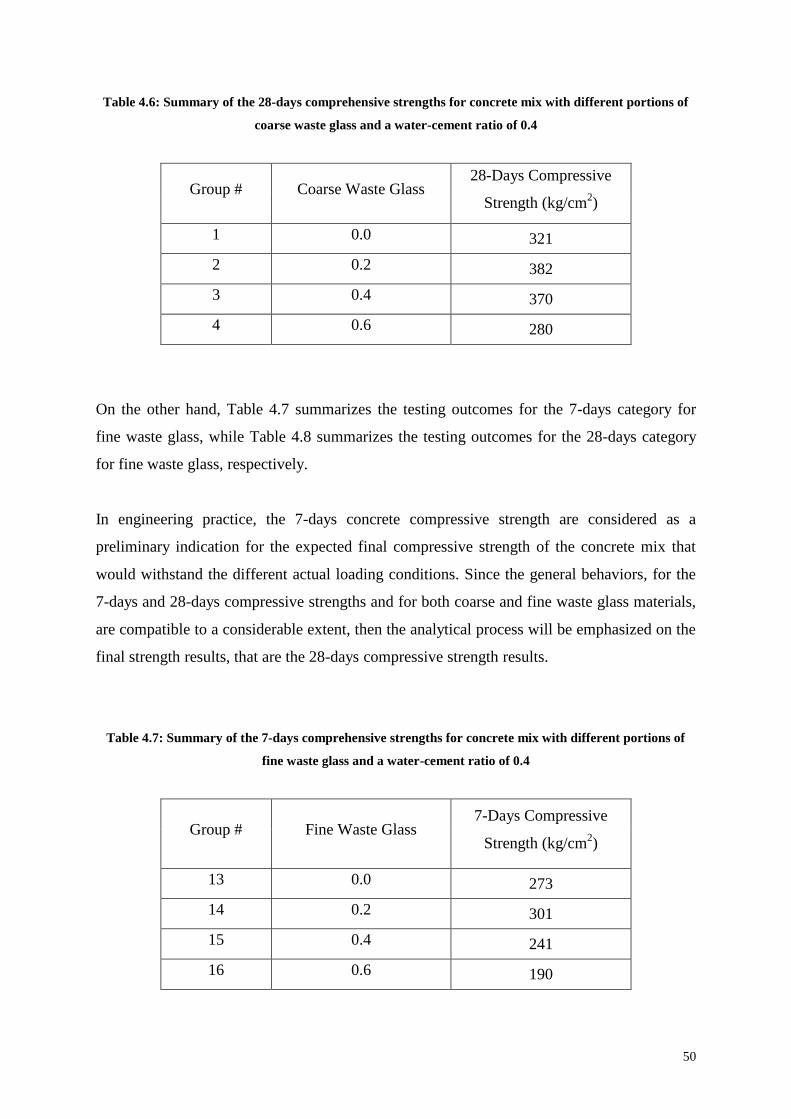
50
Table 4.6: Summary of the 28-days comprehensive strengths for concrete mix with different portions of
coarse waste glass and a water-cement ratio of 0.4
Group # Coarse Waste Glass 28-Days Compressive
Strength (kg/cm2)
1 0.0 321
2 0.2 382
3 0.4 370
4 0.6 280
On the other hand, Table 4.7 summarizes the testing outcomes for the 7-days category for
fine waste glass, while Table 4.8 summarizes the testing outcomes for the 28-days category
for fine waste glass, respectively.
In engineering practice, the 7-days concrete compressive strength are considered as a
preliminary indication for the expected final compressive strength of the concrete mix that
would withstand the different actual loading conditions. Since the general behaviors, for the
7-days and 28-days compressive strengths and for both coarse and fine waste glass materials,
are compatible to a considerable extent, then the analytical process will be emphasized on the
final strength results, that are the 28-days compressive strength results.
Table 4.7: Summary of the 7-days comprehensive strengths for concrete mix with different portions of
fine waste glass and a water-cement ratio of 0.4
Group # Fine Waste Glass 7-Days Compressive
Strength (kg/cm2)
13 0.0 273
14 0.2 301
15 0.4 241
16 0.6 190

51
Table 4.8: Summary of the 28-days comprehensive strengths for concrete mix with different portions of
fine waste glass and a water-cement ratio of 0.4
Group # Fine Waste Glass 28-Days Compressive
Strength (kg/cm2)
13 0.0 321
14 0.2 399
15 0.4 319
16 0.6 304
For concrete mixed with coarse waste glass as a partial occupant instead of coarse aggregates,
and by referring to the data listed in Table 4.6, mathematical nonlinear regression and some
numerical analysis methods were employed to conclude that the optimum value of coarse
waste glass to be used within the concrete mix with a water-cement ratio of 0.4 was
determined as about 0.265, and the corresponding expected 28-days hardened concrete
compressive strength was about 385 kg/cm2.
On the other hand, for concrete mixed with fine waste glass as a partial occupant instead of
fine aggregates, and by referring to the data listed in Table 4.8, the same mathematical
analytical procedure was followed to conclude that the optimum value of fine waste glass to
be used within the concrete mix with a water-cement ratio of 0.4 was estimated as almost
0.195, and the corresponding expected 28-days hardened concrete compressive strength was
almost 400 kg/cm2.
The obtained optimum waste glass concrete proportion were used to implement the second
phase of the testing program comprises testing waste glass concrete mix for pullout strength
splitting strength, and flexural strength. The next sections focus only on the mixes with the
two optimum value of waste and fine waste glass to be used, that were determine and
discussed in the previous section. The behavior of these two optimal mixes is to be more
highlighted by conducting pull-out tests, flexural tests, and splitting tests on three different
groups of B-300 hardened concrete mix with a water-cement ratio of 0.4: free of waste glass
content, coarse waste glass content of 0.265, and fine waste glass content of 0.195.
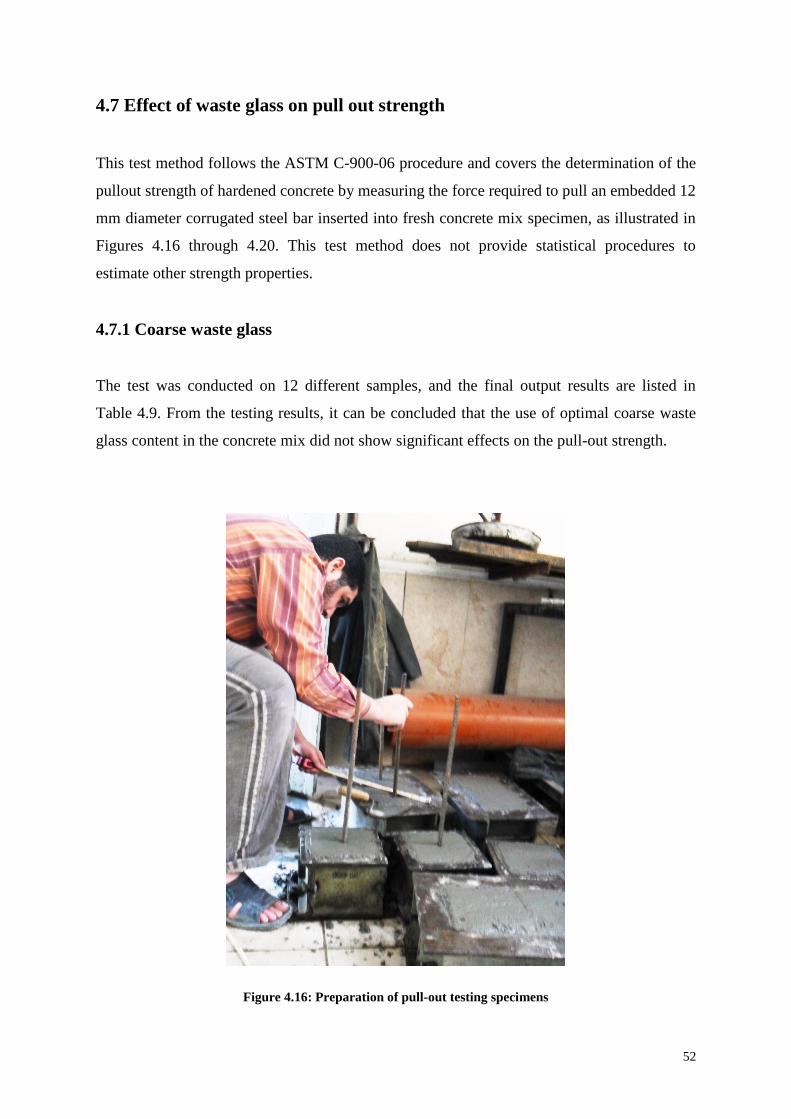
52
4.7 Effect of waste glass on pull out strength
This test method follows the ASTM C-900-06 procedure and covers the determination of the
pullout strength of hardened concrete by measuring the force required to pull an embedded 12
mm diameter corrugated steel bar inserted into fresh concrete mix specimen, as illustrated in
Figures 4.16 through 4.20. This test method does not provide statistical procedures to
estimate other strength properties.
4.7.1 Coarse waste glass
The test was conducted on 12 different samples, and the final output results are listed in
Table 4.9. From the testing results, it can be concluded that the use of optimal coarse waste
glass content in the concrete mix did not show significant effects on the pull-out strength.
Figure 4.16: Preparation of pull-out testing specimens
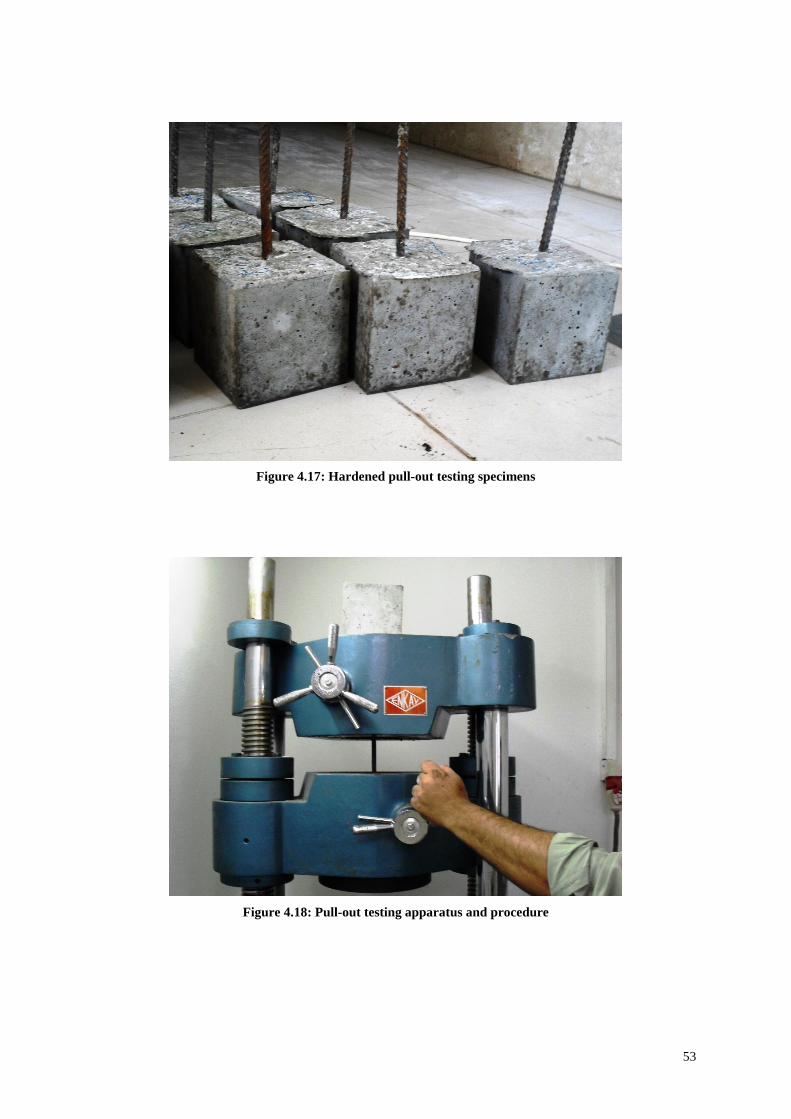
53
Figure 4.17: Hardened pull-out testing specimens
Figure 4.18: Pull-out testing apparatus and procedure

54
Figure 4.19: Illustration of pull-out testing specimen after failure
Table 4.9: Summary of the pull-out strength results with coarse waste glass content
Group # Sample #
Pull-out Strength (kN)
7 - Days 28 - Days
G4-0
1 40.3 54.0
2 38.3 56.8
3 40.8 55.1
Average 39.8 55.3
GC4-0.265
1 39.3 54.7
2 34.4 54.4
3 38.2 52.9
Average 37.3 54.0
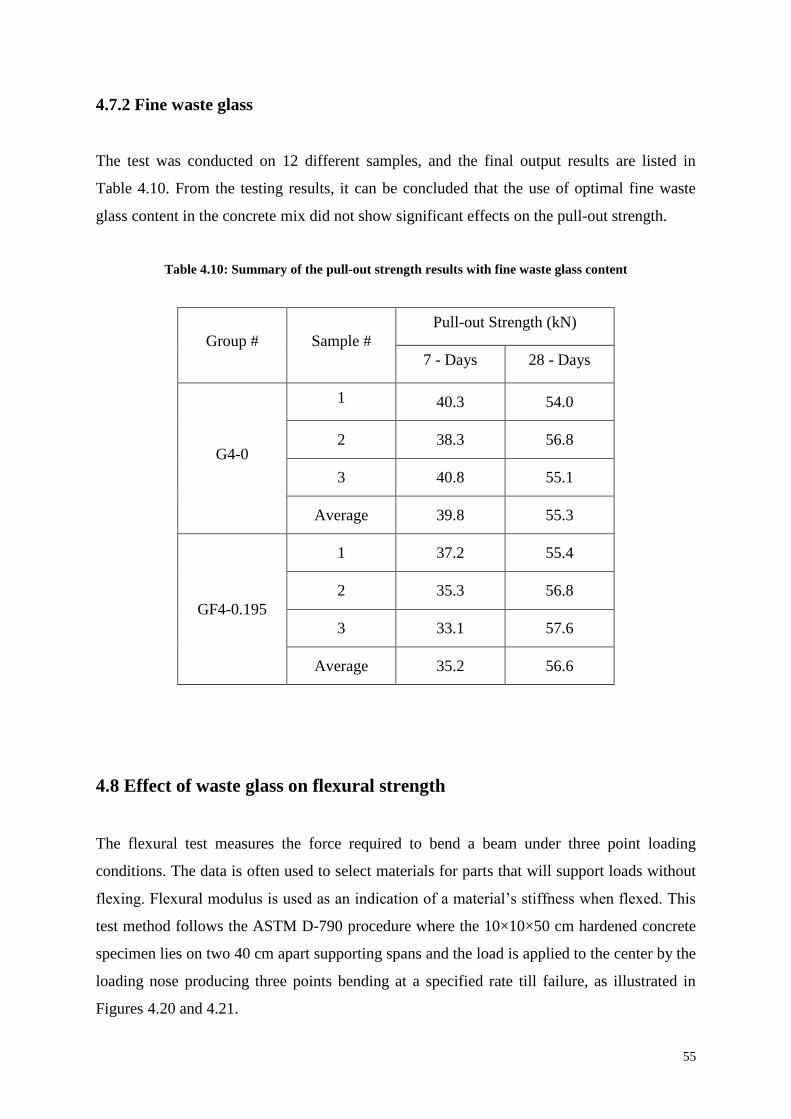
55
4.7.2 Fine waste glass
The test was conducted on 12 different samples, and the final output results are listed in
Table 4.10. From the testing results, it can be concluded that the use of optimal fine waste
glass content in the concrete mix did not show significant effects on the pull-out strength.
Table 4.10: Summary of the pull-out strength results with fine waste glass content
Group # Sample #
Pull-out Strength (kN)
7 - Days 28 - Days
G4-0
1 40.3 54.0
2 38.3 56.8
3 40.8 55.1
Average 39.8 55.3
GF4-0.195
1 37.2 55.4
2 35.3 56.8
3 33.1 57.6
Average 35.2 56.6
4.8 Effect of waste glass on flexural strength
The flexural test measures the force required to bend a beam under three point loading
conditions. The data is often used to select materials for parts that will support loads without
flexing. Flexural modulus is used as an indication of a material’s stiffness when flexed. This
test method follows the ASTM D-790 procedure where the 10×10×50 cm hardened concrete
specimen lies on two 40 cm apart supporting spans and the load is applied to the center by the
loading nose producing three points bending at a specified rate till failure, as illustrated in
Figures 4.20 and 4.21.
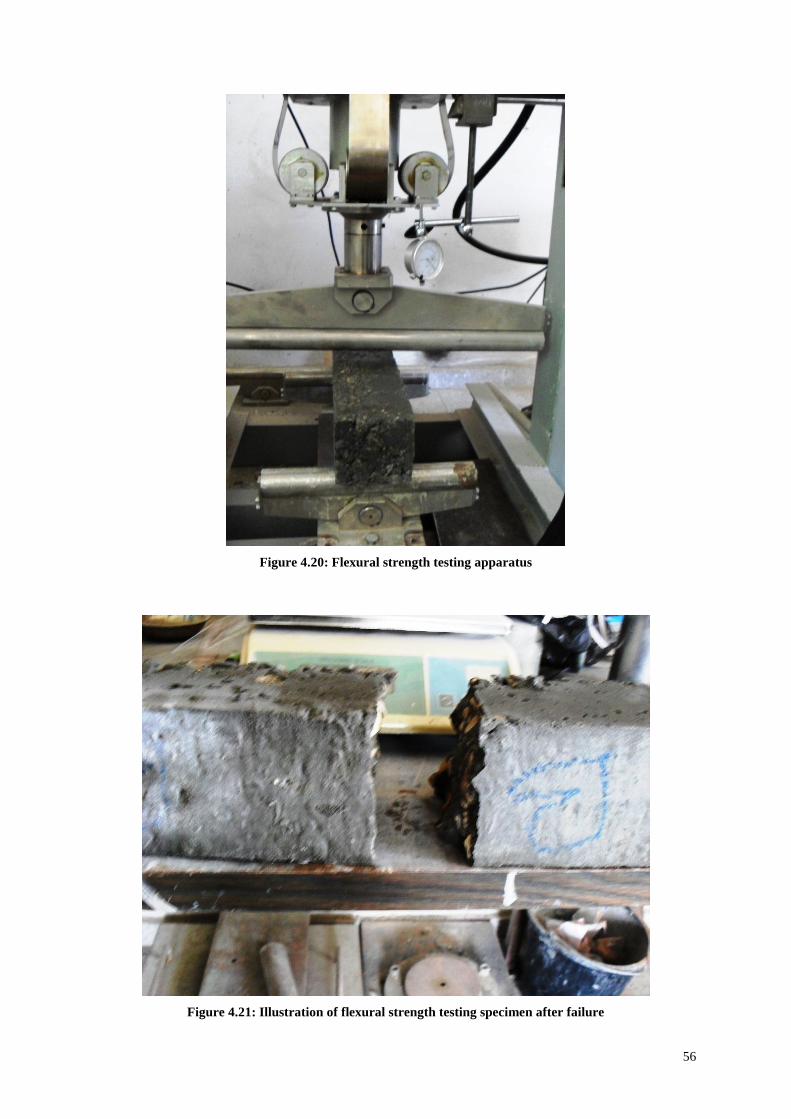
56
Figure 4.20: Flexural strength testing apparatus
Figure 4.21: Illustration of flexural strength testing specimen after failure
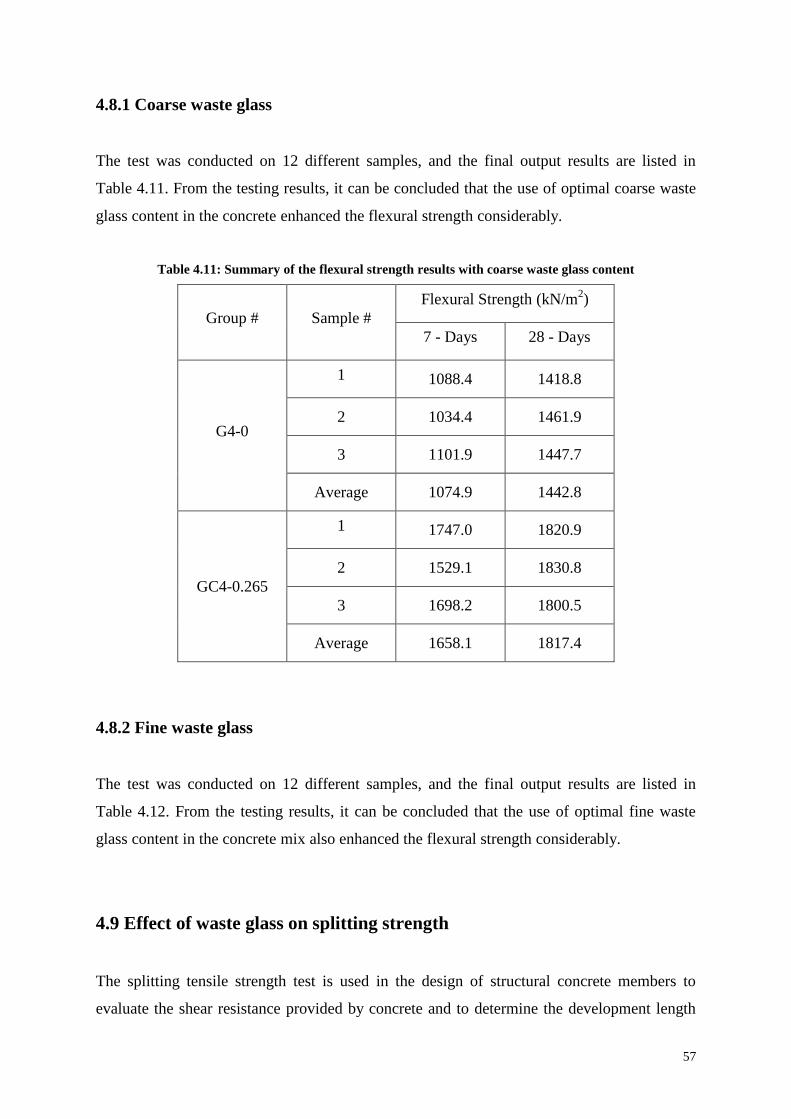
57
4.8.1 Coarse waste glass
The test was conducted on 12 different samples, and the final output results are listed in
Table 4.11. From the testing results, it can be concluded that the use of optimal coarse waste
glass content in the concrete enhanced the flexural strength considerably.
Table 4.11: Summary of the flexural strength results with coarse waste glass content
Group # Sample #
Flexural Strength (kN/m2)
7 - Days 28 - Days
G4-0
1 1088.4 1418.8
2 1034.4 1461.9
3 1101.9 1447.7
Average 1074.9 1442.8
GC4-0.265
1 1747.0 1820.9
2 1529.1 1830.8
3 1698.2 1800.5
Average 1658.1 1817.4
4.8.2 Fine waste glass
The test was conducted on 12 different samples, and the final output results are listed in
Table 4.12. From the testing results, it can be concluded that the use of optimal fine waste
glass content in the concrete mix also enhanced the flexural strength considerably.
4.9 Effect of waste glass on splitting strength
The splitting tensile strength test is used in the design of structural concrete members to
evaluate the shear resistance provided by concrete and to determine the development length

58
of the steel reinforcement. This test method follows the ASTM C-496 procedure where the
cylindrical hardened concrete specimens with 15 cm diameter and 30 cm length are loaded
longitudinally till failure, as illustrated in Figures 4.22 through Figure 4.24.
Table 4.12: Summary of the flexural strength results with fine waste glass content
Group # Sample #
Flexural Strength (kN/m2)
7 - Days 28 – Days
G4-0
1 1088.4 1418.8
2 1034.4 1461.9
3 1101.9 1447.7
Average 1074.9 1442.8
GF4-0.195
1 1588.4 1888.3
2 1545.0 1846.6
3 1594.0 1821.1
Average 1575.8 1852.0
Figure 4.22: Hardened splitting strength testing specimens

59
Figure 4.23: Splitting strength testing apparatus
Figure 4.24: Illustration of splitting strength testing specimens after failure
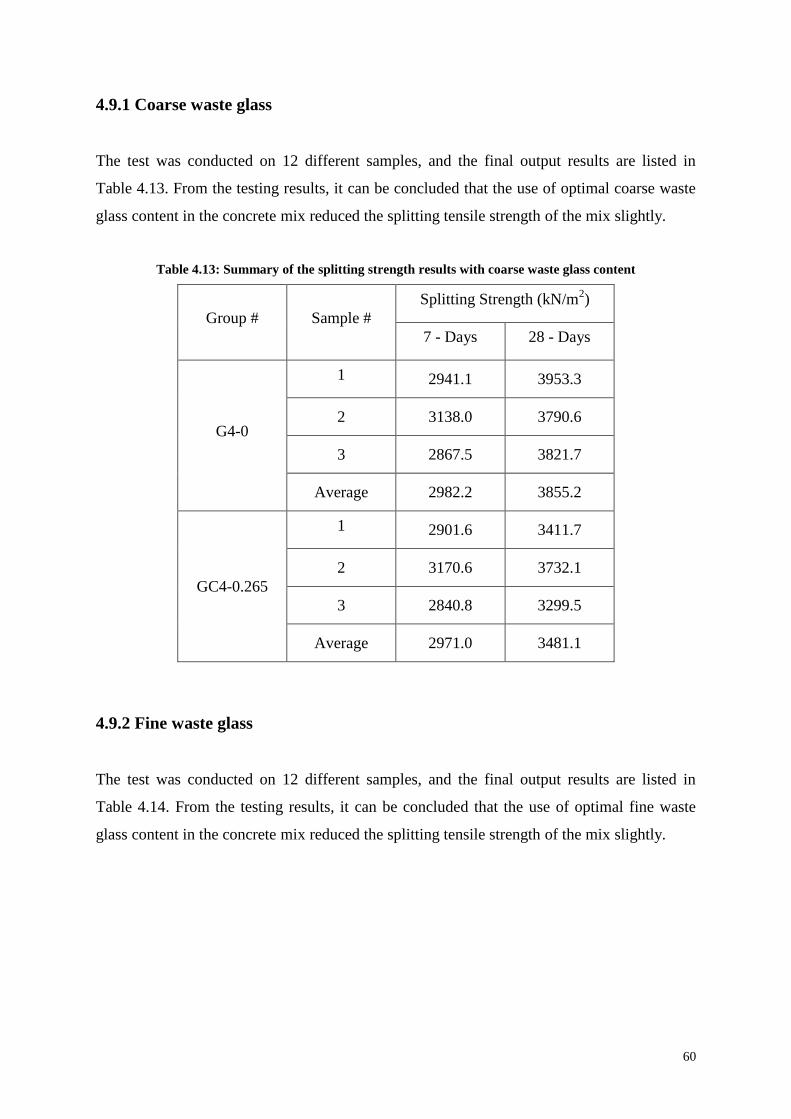
60
4.9.1 Coarse waste glass
The test was conducted on 12 different samples, and the final output results are listed in
Table 4.13. From the testing results, it can be concluded that the use of optimal coarse waste
glass content in the concrete mix reduced the splitting tensile strength of the mix slightly.
Table 4.13: Summary of the splitting strength results with coarse waste glass content
Group # Sample #
Splitting Strength (kN/m2)
7 - Days 28 - Days
G4-0
1 2941.1 3953.3
2 3138.0 3790.6
3 2867.5 3821.7
Average 2982.2 3855.2
GC4-0.265
1 2901.6 3411.7
2 3170.6 3732.1
3 2840.8 3299.5
Average 2971.0 3481.1
4.9.2 Fine waste glass
The test was conducted on 12 different samples, and the final output results are listed in
Table 4.14. From the testing results, it can be concluded that the use of optimal fine waste
glass content in the concrete mix reduced the splitting tensile strength of the mix slightly.
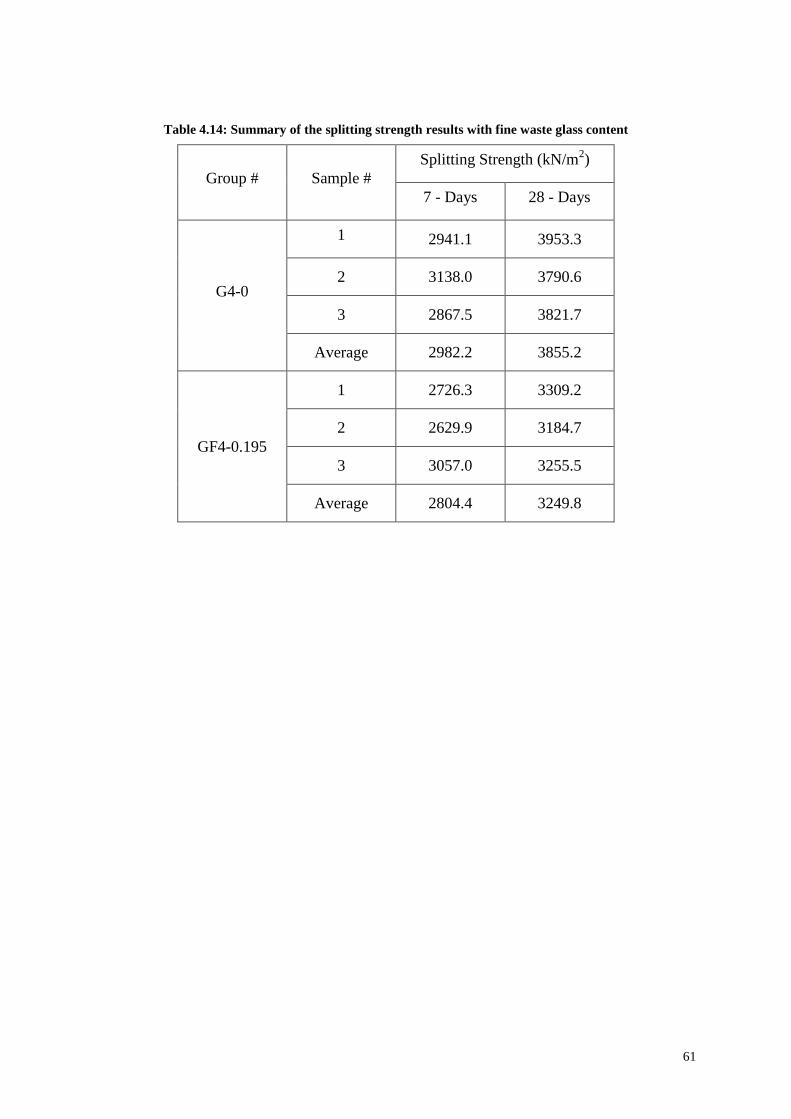
61
Table 4.14: Summary of the splitting strength results with fine waste glass content
Group # Sample #
Splitting Strength (kN/m2)
7 - Days 28 - Days
G4-0
1 2941.1 3953.3
2 3138.0 3790.6
3 2867.5 3821.7
Average 2982.2 3855.2
GF4-0.195
1 2726.3 3309.2
2 2629.9 3184.7
3 3057.0 3255.5
Average 2804.4 3249.8
62
CHAPTER FIVE
SUMMARY AND CONCLUSIONS
5.1 Summary
The primary objective of this research was to study the effect of waste glass content on the
properties of concrete mixes when added as a partial replacement of fine aggregate and
coarse aggregate. This objective was achieved through the following:
1) Identifying the effects of adding waste glass on the fresh properties of concrete mixes,
2) Studying the influence of waste glass on the hardened concrete properties.
3) Determining the optimum waste glass content to be included within the concrete mix
as a partial replacement of fine aggregate and coarse aggregate.
4) Focusing on the concrete mixes with optimal waste glass contents by testing their pull
out strength, flexural strength, and splitting resistance.
These targets were reached by conducting a standard series of: slump, mass density,
compressive strength, pull out strength, flexural strength and splitting resistance tests. The
output results obtained from this laboratory program showed reliable data points and
promising further research horizons.
5.2 Conclusions
The following conclusions can be highlighted from the output of this research and can be
summarized as follows:
5.2.1 Coarse waste glass
As a general outcome, it was noticed that the concrete mass density was decreased by
the increase of water cement ratio. More specifically, for the concrete with water
cement ratio of 0.6, the concrete mass density decreased when the portion of coarse
waste glass exceeded 0.4.
63
The output results revealed that using coarse waste glass within the concrete mix lead
to a considerable reduction in the mix workability for water cement ratios 0.5 and 0.6.
Also, it was noticed that the coarse waste glass content almost did not affect the
workability of the concrete mix at water cement ratio of 0.4.
For concrete mixed with coarse waste glass as a partial occupant instead of coarse
aggregates, some numerical analysis methods were employed to conclude that the
optimum value of coarse waste glass to be used within the concrete mix with a water-
cement ratio of 0.4 was determined as about 0.265, and the corresponding expected
28-days hardened concrete compressive strength was about 385 kg/cm2.
For concrete mixes containing the optimal portion of coarse waste glass content, it
was concluded that there was negligible effects on the pull-out strength, considerable
enhancement of the flexural strength, and slight reduction of the splitting tensile
strength of the mix.
5.2.2 Fine waste glass
It was concluded that the concrete mass density was inversely affected by the increase
of water cement ratio. In more specific manner, for the concrete with water cement
ratio of 0.4, the concrete mass density was adversely affected when the portion of
coarse waste glass exceeded 0.4.
The output results revealed that using fine waste glass within the concrete mix lead to
a comparatively slight reduction in the mix workability for water cement ratios 0.5
and 0.6. Also, it was noticed that the coarse waste glass content almost did not affect
the workability of the concrete mix at water cement ratio of 0.4.
For concrete mixed with fine waste glass as a partial occupant instead of fine
aggregates, the same mathematical analytical procedure was followed to conclude that
the optimum value of fine waste glass to be used within the concrete mix with a
water-cement ratio of 0.4 was estimated as almost 0.195, and the corresponding
expected 28-days hardened concrete compressive strength was almost 400 kg/cm2.
64
For concrete mixes containing the optimal portion of fine waste glass, it was
concluded that there was negligible effects on the pull-out strength, considerable
enhancement of the flexural strength, and slight reduction of the splitting tensile
strength of the mix.
5.3 Future study
It is recommended for future studies for extending this research to a wider perspective in
order to be able to consider more parameters and different combinations of parameters
governing the effect on the behavior and engineering properties of fresh and hardened
concrete containing different types and sizes of waste glass materials. This new research
project is aiming to examine the results of this study, considering this phase as a threshold for
exploring the facts in a more powerful and accurate manner.
65
REFERENCES
[1] Work Team, “Pollution caused by solid waste, rubble, and construction debris is a serious
threat to the sea and the shore of the Gaza Strip”, Ocha, 2009.
[2] Husni Al-Najar, “Solid waste management in the Gaza Strip Case Study” Ministry of
Health, Gaza, 2005.
[3] Shayan, A. and Xu, A., “Value-added utilization of waste glass in concrete”, Vermont
South, Victoria, 3133, Australia, 11 July 2003.
[4] Meyer, C., Egosi, N., and Andela, C., “Concrete with Waste Glass as Aggregate”
International Symposium Concrete Technology Unit of ASCE and University of Dundee,
March 19-20, 2001.
[5] Topçu, I. and Canbaz, M., “Properties of concrete containing waste glass”, Cement and
Concrete Research Journal, Vol. 34, pp. 267 – 274, 2004.
[6] Topçu, I, Boğa, A., and Bilir, T., “Alkali-silica reactions of mortars produced by using
waste glass as fine aggregate and admixtures such as fly ash and Li2CO3”, Waste
Management, Vol. 28, pp. 878 – 884, June 2007.
[7] Ismail, Z. and Al-Hashmi, E., “Recycling of waste glass as a partial replacement for fine
aggregate in concrete”, Journal of Waste Management, Vol. 29, pp. 655-659, 2009.
[8] Kou, S. and Poon, C., “Properties of self-compacting concrete prepared with recycled
glass aggregate”, Cement and Concrete Composites Journal, Vol. 31, pp. 107 – 113, 2009.
[9] Saccani, A. and Bignozzi, M., “ASR expansion behavior of recycled glass fine aggregates
in concrete” Cement and Concrete Research, Vol. 40, pp. 531 – 536, 2010.
[10] Shi, C. and Zheng, K., “A review on the use of waste glasses in the production of cement
and concrete”, Resources, Conservation, and Recycling, Vol. 52, pp. 234-247, 2007.
[11] "Explaining the physics of everyday life", www.howeverythingworks.org , Dec., 2010.
[12] Schott Group, “Physical and Technical Properties of Glasses”, Technical Report, Mainz –
Germany, October 2007.
66
[13] CSIRO Manufacturing and Infrastructure Technology, www.cmit.csiro.au , Dec., 2010.
[14] Federico, L. and Chidiac, S., “Waste glass as a supplementary cementitious material in
concrete: Critical review of treatment methods” Cement & Concrete Composites, Vol. 31,
pp. 606–610, 13 February 2009.
[15] Idir, R., Cyr, M., and Tagnit-Hamou, A., “Use of fine glass as ASR inhibitor in glass-
aggregate mortars” Construction and Building Materials, Vol. 24, pp. 1309–1312, July
2010.
[16] Caijun, S. and Keren, Z., A., “A review on the use of waste glasses in the production of
cement and concrete” The Journal of Resources, Conservation, and Recycling, Vol. 52,
pp. 234–247, May 2007.
[17] Her-Yung Wang, “A study on the effects of LCD glass sand on the properties of
concrete”, Waste Management, Vol. 29, pp. 335–341, May 2008.
[18] Shane Palmquist, “Compressive behavior of concrete with recycled aggregates”, Ph.D.
Thesis, TUFTS University, May 2003.
[19] Kralj Davorin, “Experimental study of recycling lightweight concrete with aggregates
containing expanded glass”, Process Safety and Environmental Protection, Vol. 87, pp.
267-273, March 2009.
[20] Lee, M., Ko, C., Chang, F., Lo, L., Lin, J., Shan, M., and Lee, J., “Artificial stone slab
production using waste glass, stone fragments, and vacuum vibratory compaction”,
Cement and Concrete Composites, Vol. 30, pp. 583-587, April 2008.
[21] Park, S., , Lee, B., and Kim, J., “Studies on mechanical properties of concrete containing
waste glass aggregate”, Cement and Concrete Research, Vol. 34, pp. 2181-2189, February
2004.
[22] Hong, L., Huiying, B., and Ewan, A., “Use of waste glass as aggregate in concrete”, 7th
UK CARE Annual General Meeting, UK Chinese Association of Resources and
Environment, Greenwich, 15 September 2007.

67
Appendix A

68
Table A.1: Concrete Job Mix for B 300 with w/c = 0.4 and Waste Glass = 0.2 - Coarse
Concrete Mix Design B 300
w/c 0.4
Coarse Waste Glass 0.2 ← Coarse Aggregate
Component Size
Condition Weight Volume
Remarks mm kg/m
3 m
3
Cement Type I Dry 320.00 0.1016 Turkish Type I
Coarse Agg. 25 SSD 640.00 0.2397 Crushed Limestone
Med. Agg. 20 SSD 250.00 0.0954 Crushed Limestone
Fine Agg. 10 SSD 111.78 0.0425 Crushed Limestone
W. Glass 10 to 25 SSD 236.00 0.0944 Crushed W. Glass
Sand 0.1 to 0.6 SSD 650.00 0.2481 Gaza Dune Sand
Water Tap Liquid 128.00 0.1280 Factory Water
Additives Super Flow Liquid 1.70 0.0014 Super Flow 3
Air Content Air Air 0.00 0.0150 Air
Total 2337.48 0.9661

69
Table A.2: Concrete Job Mix for B 300 with w/c = 0.4 and Waste Glass = 0.4 - Coarse
Concrete Mix Design B 300
w/c 0.4
Coarse Waste Glass 0.4 ← Coarse Aggregate
Component Size
Condition Weight Volume
Remarks mm kg/m
3 m
3
Cement Type I Dry 320.00 0.1016 Turkish Type I
Coarse Agg. 25 SSD 640.00 0.2397 Crushed Limestone
Med. Agg. 20 SSD 113.97 0.0435 Crushed Limestone
Fine Agg. 10 SSD 0.00 0.0000 Crushed Limestone
W. Glass 10 to 25 SSD 472.00 0.1888 Crushed W. Glass
Sand 0.1 to 0.6 SSD 650.00 0.2481 Gaza Dune Sand
Water Tap Liquid 128.00 0.1280 Factory Water
Additives Super Flow Liquid 1.70 0.0014 Super Flow 3
Air Content Air Air 0.00 0.0150 Air
Total 2325.67 0.9661

70
Table A.3: Concrete Job Mix for B 300 with w/c = 0.4 and Waste Glass = 0.6 - Coarse
Concrete Mix Design B 300
w/c 0.4
Coarse Waste Glass 0.6 ← Coarse Aggregate
Component Size
Condition Weight Volume
Remarks mm kg/m
3 m
3
Cement Type I Dry 320.00 0.1016 Turkish Type I
Coarse Agg. 25 SSD 504.10 0.1888 Crushed Limestone
Med. Agg. 20 SSD 0.00 0.0000 Crushed Limestone
Fine Agg. 10 SSD 0.00 0.0000 Crushed Limestone
W. Glass 10 to 25 SSD 708.00 0.2832 Crushed W. Glass
Sand 0.1 to 0.6 SSD 650.00 0.2481 Gaza Dune Sand
Water Tap Liquid 128.00 0.1280 Factory Water
Additives Super Flow Liquid 1.70 0.0014 Super Flow 3
Air Content Air Air 0.00 0.0150 Air
Total 2311.80 0.9661

71
Table A.4: Concrete Job Mix for B 300 with w/c = 0.5 and Waste Glass = 0.2 - Coarse
Concrete Mix Design B 300
w/c 0.5
Coarse Waste Glass 0.2 ← Coarse Aggregate
Component Size
Condition Weight Volume
Remarks mm kg/m
3 m
3
Cement Type I Dry 320.00 0.1016 Turkish Type I
Coarse Agg. 25 SSD 640.00 0.2397 Crushed Limestone
Med. Agg. 20 SSD 250.00 0.0954 Crushed Limestone
Fine Agg. 10 SSD 111.78 0.0425 Crushed Limestone
W. Glass 10 to 25 SSD 236.00 0.0944 Crushed W. Glass
Sand 0.1 to 0.6 SSD 650.00 0.2481 Gaza Dune Sand
Water Tap Liquid 160.00 0.1600 Factory Water
Additives Super Flow Liquid 1.70 0.0014 Super Flow 3
Air Content Air Air 0.00 0.0150 Air
Total 2369.48 0.9981
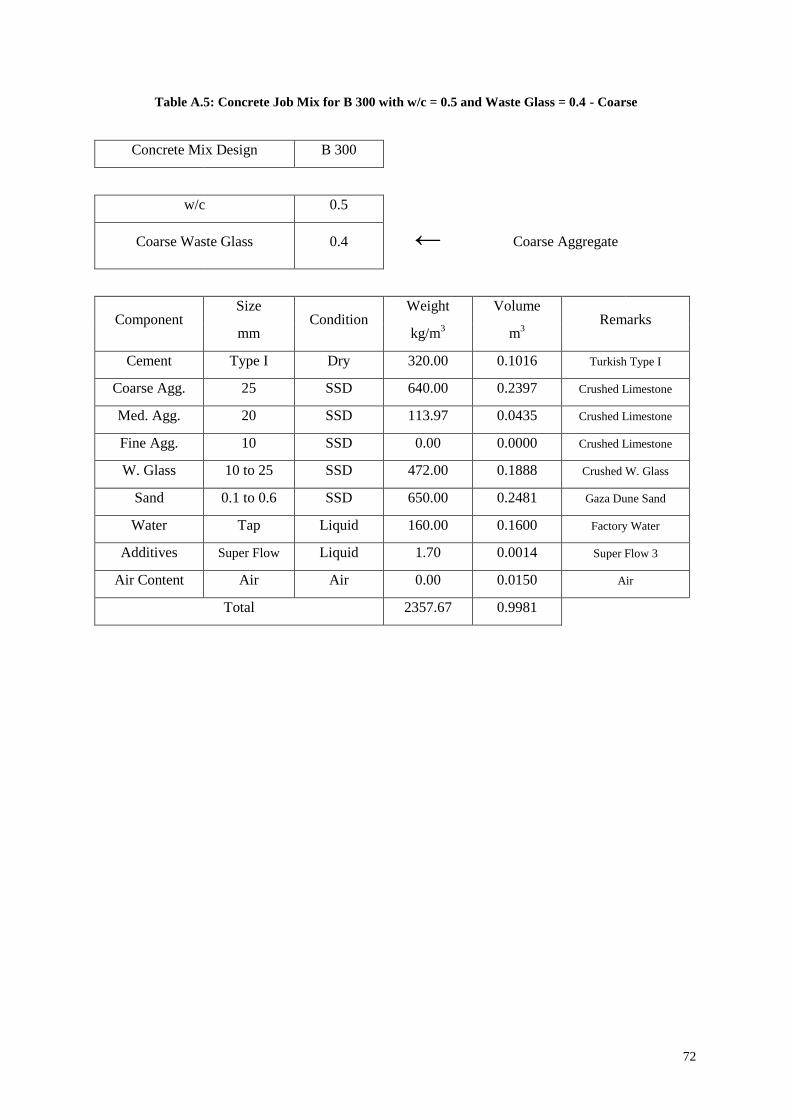
72
Table A.5: Concrete Job Mix for B 300 with w/c = 0.5 and Waste Glass = 0.4 - Coarse
Concrete Mix Design B 300
w/c 0.5
Coarse Waste Glass 0.4 ← Coarse Aggregate
Component Size
Condition Weight Volume
Remarks mm kg/m
3 m
3
Cement Type I Dry 320.00 0.1016 Turkish Type I
Coarse Agg. 25 SSD 640.00 0.2397 Crushed Limestone
Med. Agg. 20 SSD 113.97 0.0435 Crushed Limestone
Fine Agg. 10 SSD 0.00 0.0000 Crushed Limestone
W. Glass 10 to 25 SSD 472.00 0.1888 Crushed W. Glass
Sand 0.1 to 0.6 SSD 650.00 0.2481 Gaza Dune Sand
Water Tap Liquid 160.00 0.1600 Factory Water
Additives Super Flow Liquid 1.70 0.0014 Super Flow 3
Air Content Air Air 0.00 0.0150 Air
Total 2357.67 0.9981

73
Table A.6: Concrete Job Mix for B 300 with w/c = 0.5 and Waste Glass = 0.6 - Coarse
Concrete Mix Design B 300
w/c 0.5
Coarse Waste Glass 0.6 ← Coarse Aggregate
Component Size
Condition Weight Volume
Remarks mm kg/m
3 m
3
Cement Type I Dry 320.00 0.1016 Turkish Type I
Coarse Agg. 25 SSD 504.10 0.1888 Crushed Limestone
Med. Agg. 20 SSD 0.00 0.0000 Crushed Limestone
Fine Agg. 10 SSD 0.00 0.0000 Crushed Limestone
W. Glass 10 to 25 SSD 708.00 0.2832 Crushed W. Glass
Sand 0.1 to 0.6 SSD 650.00 0.2481 Gaza Dune Sand
Water Tap Liquid 160.00 0.1600 Factory Water
Additives Super Flow Liquid 1.70 0.0014 Super Flow 3
Air Content Air Air 0.00 0.0150 Air
Total 2343.80 0.9981

74
Table A.7: Concrete Job Mix for B 300 with w/c = 0.6 and Waste Glass = 0.2 - Coarse
Concrete Mix Design B 300
w/c 0.6
Coarse Waste Glass 0.2 ← Coarse Aggregate
Component Size
Condition Weight Volume
Remarks mm kg/m
3 m
3
Cement Type I Dry 320.00 0.1016 Turkish Type I
Coarse Agg. 25 SSD 640.00 0.2397 Crushed Limestone
Med. Agg. 20 SSD 250.00 0.0954 Crushed Limestone
Fine Agg. 10 SSD 111.78 0.0425 Crushed Limestone
W. Glass 10 to 25 SSD 236.00 0.0944 Crushed W. Glass
Sand 0.1 to 0.6 SSD 650.00 0.2481 Gaza Dune Sand
Water Tap Liquid 192.00 0.1920 Factory Water
Additives Super Flow Liquid 1.70 0.0014 Super Flow 3
Air Content Air Air 0.00 0.0150 Air
Total 2401.48 1.0301

75
Table A.8: Concrete Job Mix for B 300 with w/c = 0.6 and Waste Glass = 0.4 - Coarse
Concrete Mix Design B 300
w/c 0.6
Coarse Waste Glass 0.4 ← Coarse Aggregate
Component Size
Condition Weight Volume
Remarks mm kg/m
3 m
3
Cement Type I Dry 320.00 0.1016 Turkish Type I
Coarse Agg. 25 SSD 640.00 0.2397 Crushed Limestone
Med. Agg. 20 SSD 113.97 0.0435 Crushed Limestone
Fine Agg. 10 SSD 0.00 0.0000 Crushed Limestone
W. Glass 10 to 25 SSD 472.00 0.1888 Crushed W. Glass
Sand 0.1 to 0.6 SSD 650.00 0.2481 Gaza Dune Sand
Water Tap Liquid 192.00 0.1920 Factory Water
Additives Super Flow Liquid 1.70 0.0014 Super Flow 3
Air Content Air Air 0.00 0.0150 Air
Total 2389.67 1.0301

76
Table A.9: Concrete Job Mix for B 300 with w/c = 0.6 and Waste Glass = 0.6 - Coarse
Concrete Mix Design B 300
w/c 0.6
Coarse Waste Glass 0.6 ← Coarse Aggregate
Component Size
Condition Weight Volume
Remarks mm kg/m
3 m
3
Cement Type I Dry 320.00 0.1016 Turkish Type I
Coarse Agg. 25 SSD 504.10 0.1888 Crushed Limestone
Med. Agg. 20 SSD 0.00 0.0000 Crushed Limestone
Fine Agg. 10 SSD 0.00 0.0000 Crushed Limestone
W. Glass 10 to 25 SSD 708.00 0.2832 Crushed W. Glass
Sand 0.1 to 0.6 SSD 650.00 0.2481 Gaza Dune Sand
Water Tap Liquid 192.00 0.1920 Factory Water
Additives Super Flow Liquid 1.70 0.0014 Super Flow 3
Air Content Air Air 0.00 0.0150 Air
Total 2375.80 1.0301
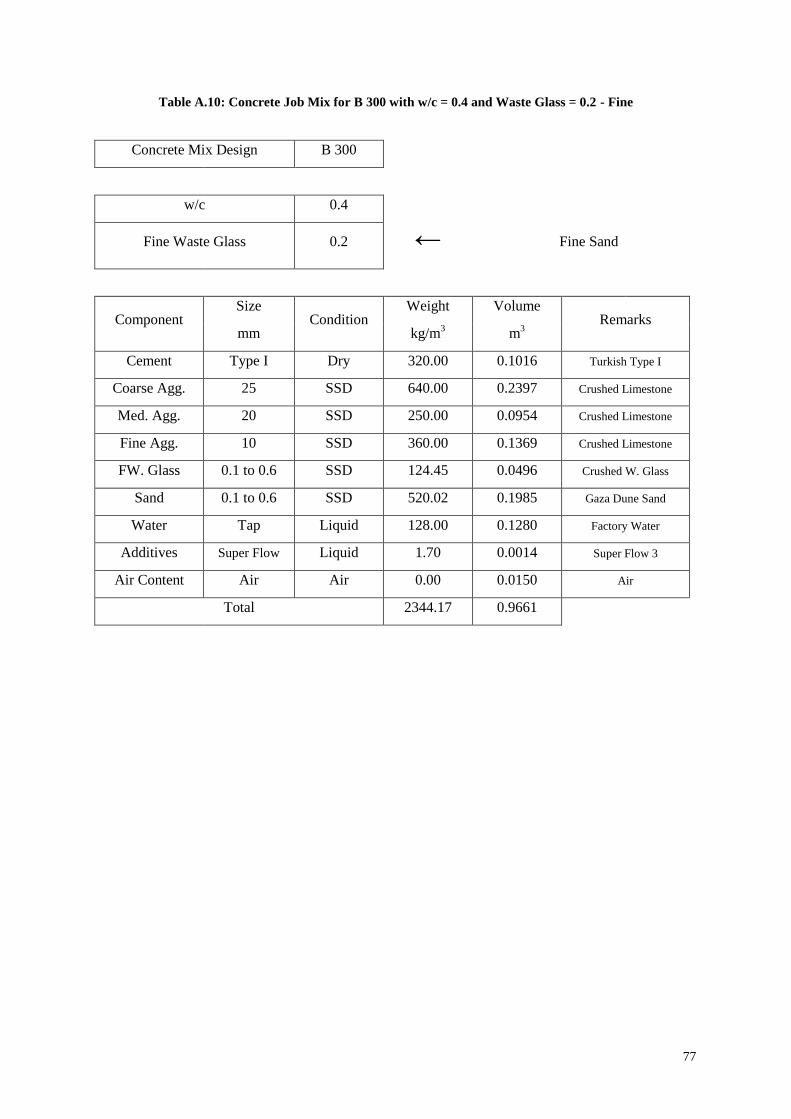
77
Table A.10: Concrete Job Mix for B 300 with w/c = 0.4 and Waste Glass = 0.2 - Fine
Concrete Mix Design B 300
w/c 0.4
Fine Waste Glass 0.2 ← Fine Sand
Component Size
Condition Weight Volume
Remarks mm kg/m
3 m
3
Cement Type I Dry 320.00 0.1016 Turkish Type I
Coarse Agg. 25 SSD 640.00 0.2397 Crushed Limestone
Med. Agg. 20 SSD 250.00 0.0954 Crushed Limestone
Fine Agg. 10 SSD 360.00 0.1369 Crushed Limestone
FW. Glass 0.1 to 0.6 SSD 124.45 0.0496 Crushed W. Glass
Sand 0.1 to 0.6 SSD 520.02 0.1985 Gaza Dune Sand
Water Tap Liquid 128.00 0.1280 Factory Water
Additives Super Flow Liquid 1.70 0.0014 Super Flow 3
Air Content Air Air 0.00 0.0150 Air
Total 2344.17 0.9661

78
Table A.11: Concrete Job Mix for B 300 with w/c = 0.4 and Waste Glass = 0.4 - Fine
Concrete Mix Design B 300
w/c 0.4
Fine Waste Glass 0.4 ← Fine Sand
Component Size
Condition Weight Volume
Remarks mm kg/m
3 m
3
Cement Type I Dry 320.00 0.1016 Turkish Type I
Coarse Agg. 25 SSD 640.00 0.2397 Crushed Limestone
Med. Agg. 20 SSD 250.00 0.0954 Crushed Limestone
Fine Agg. 10 SSD 360.00 0.1369 Crushed Limestone
FW. Glass 0.1 to 0.6 SSD 248.90 0.0992 Crushed W. Glass
Sand 0.1 to 0.6 SSD 390.01 0.1489 Gaza Dune Sand
Water Tap Liquid 128.00 0.1280 Factory Water
Additives Super Flow Liquid 1.70 0.0014 Super Flow 3
Air Content Air Air 0.00 0.0150 Air
Total 2338.61 0.9661

79
Table A.12: Concrete Job Mix for B 300 with w/c = 0.4 and Waste Glass = 0.6 - Fine
Concrete Mix Design B 300
w/c 0.4
Fine Waste Glass 0.6 ← Fine Sand
Component Size
Condition Weight Volume
Remarks mm kg/m
3 m
3
Cement Type I Dry 320.00 0.1016 Turkish Type I
Coarse Agg. 25 SSD 640.00 0.2397 Crushed Limestone
Med. Agg. 20 SSD 250.00 0.0954 Crushed Limestone
Fine Agg. 10 SSD 360.00 0.1369 Crushed Limestone
FW. Glass 0.1 to 0.6 SSD 373.34 0.1489 Crushed W. Glass
Sand 0.1 to 0.6 SSD 260.01 0.0992 Gaza Dune Sand
Water Tap Liquid 128.00 0.1280 Factory Water
Additives Super Flow Liquid 1.70 0.0014 Super Flow 3
Air Content Air Air 0.00 0.0150 Air
Total 2333.05 0.9661

80
Table A.13: Concrete Job Mix for B 300 with w/c = 0.5 and Waste Glass = 0.2 - Fine
Concrete Mix Design B 300
w/c 0.5
Fine Waste Glass 0.2 ← Fine Sand
Component Size
Condition Weight Volume
Remarks mm kg/m
3 m
3
Cement Type I Dry 320.00 0.1016 Turkish Type I
Coarse Agg. 25 SSD 640.00 0.2397 Crushed Limestone
Med. Agg. 20 SSD 250.00 0.0954 Crushed Limestone
Fine Agg. 10 SSD 360.00 0.1369 Crushed Limestone
FW. Glass 0.1 to 0.6 SSD 124.45 0.0496 Crushed W. Glass
Sand 0.1 to 0.6 SSD 520.02 0.1985 Gaza Dune Sand
Water Tap Liquid 192.00 0.1920 Factory Water
Additives Super Flow Liquid 1.70 0.0014 Super Flow 3
Air Content Air Air 0.00 0.0150 Air
Total 2408.17 1.0301
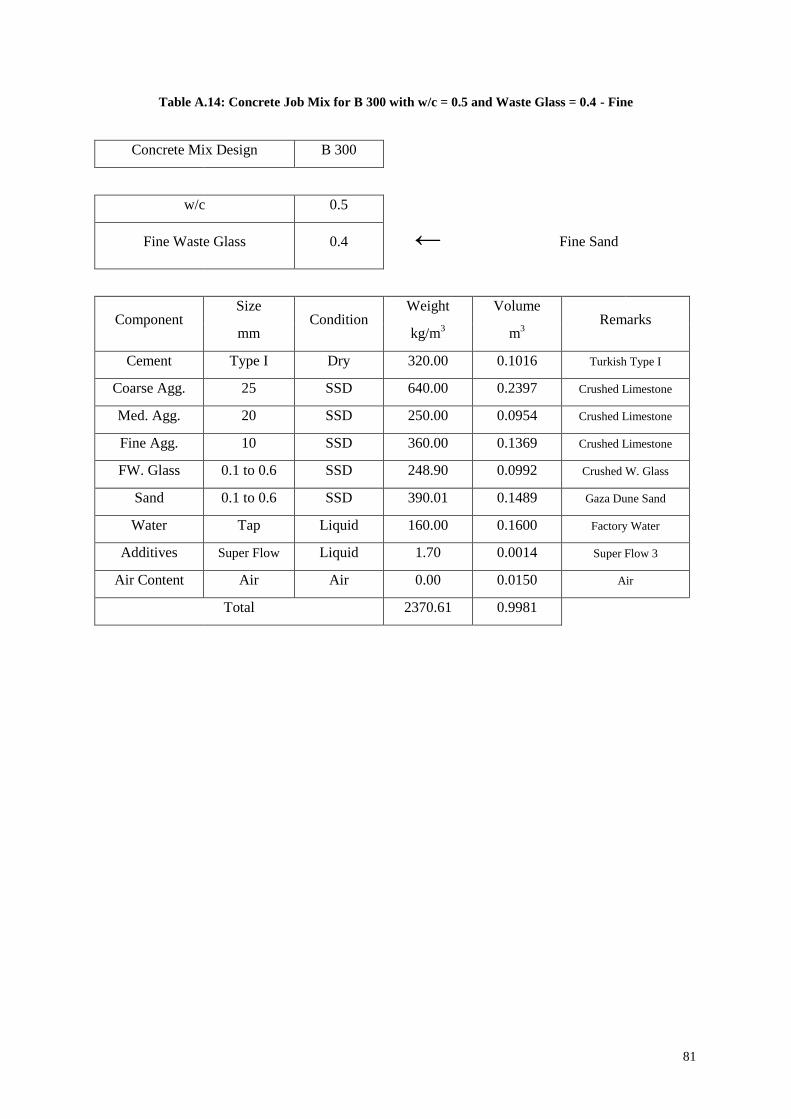
81
Table A.14: Concrete Job Mix for B 300 with w/c = 0.5 and Waste Glass = 0.4 - Fine
Concrete Mix Design B 300
w/c 0.5
Fine Waste Glass 0.4 ← Fine Sand
Component Size
Condition Weight Volume
Remarks mm kg/m
3 m
3
Cement Type I Dry 320.00 0.1016 Turkish Type I
Coarse Agg. 25 SSD 640.00 0.2397 Crushed Limestone
Med. Agg. 20 SSD 250.00 0.0954 Crushed Limestone
Fine Agg. 10 SSD 360.00 0.1369 Crushed Limestone
FW. Glass 0.1 to 0.6 SSD 248.90 0.0992 Crushed W. Glass
Sand 0.1 to 0.6 SSD 390.01 0.1489 Gaza Dune Sand
Water Tap Liquid 160.00 0.1600 Factory Water
Additives Super Flow Liquid 1.70 0.0014 Super Flow 3
Air Content Air Air 0.00 0.0150 Air
Total 2370.61 0.9981

82
Table A.15: Concrete Job Mix for B 300 with w/c = 0.5 and Waste Glass = 0.6 - Fine
Concrete Mix Design B 300
w/c 0.5
Fine Waste Glass 0.6 ← Fine Sand
Component Size
Condition Weight Volume
Remarks mm kg/m
3 m
3
Cement Type I Dry 320.00 0.1016 Turkish Type I
Coarse Agg. 25 SSD 640.00 0.2397 Crushed Limestone
Med. Agg. 20 SSD 250.00 0.0954 Crushed Limestone
Fine Agg. 10 SSD 360.00 0.1369 Crushed Limestone
FW. Glass 0.1 to 0.6 SSD 373.34 0.1489 Crushed W. Glass
Sand 0.1 to 0.6 SSD 260.01 0.0992 Gaza Dune Sand
Water Tap Liquid 160.00 0.1600 Factory Water
Additives Super Flow Liquid 1.70 0.0014 Super Flow 3
Air Content Air Air 0.00 0.0150 Air
Total 2365.05 0.9981

83
Table A.16: Concrete Job Mix for B 300 with w/c = 0.6 and Waste Glass = 0.2 - Fine
Concrete Mix Design B 300
w/c 0.6
Fine Waste Glass 0.2 ← Fine Sand
Component Size
Condition Weight Volume
Remarks mm kg/m
3 m
3
Cement Type I Dry 320.00 0.1016 Turkish Type I
Coarse Agg. 25 SSD 640.00 0.2397 Crushed Limestone
Med. Agg. 20 SSD 250.00 0.0954 Crushed Limestone
Fine Agg. 10 SSD 360.00 0.1369 Crushed Limestone
FW. Glass 0.1 to 0.6 SSD 124.45 0.0496 Crushed W. Glass
Sand 0.1 to 0.6 SSD 520.02 0.1985 Gaza Dune Sand
Water Tap Liquid 192.00 0.1920 Factory Water
Additives Super Flow Liquid 1.70 0.0014 Super Flow 3
Air Content Air Air 0.00 0.0150 Air
Total 2408.17 1.0301

84
Table A.17: Concrete Job Mix for B 300 with w/c = 0.6 and Waste Glass = 0.4 - Fine
Concrete Mix Design B 300
w/c 0.6
Fine Waste Glass 0.4 ← Fine Sand
Component Size
Condition Weight Volume
Remarks mm kg/m
3 m
3
Cement Type I Dry 320.00 0.1016 Turkish Type I
Coarse Agg. 25 SSD 640.00 0.2397 Crushed Limestone
Med. Agg. 20 SSD 250.00 0.0954 Crushed Limestone
Fine Agg. 10 SSD 360.00 0.1369 Crushed Limestone
FW. Glass 0.1 to 0.6 SSD 248.90 0.0992 Crushed W. Glass
Sand 0.1 to 0.6 SSD 390.01 0.1489 Gaza Dune Sand
Water Tap Liquid 192.00 0.1920 Factory Water
Additives Super Flow Liquid 1.70 0.0014 Super Flow 3
Air Content Air Air 0.00 0.0150 Air
Total 2402.61 1.0301

85
Table A.18: Concrete Job Mix for B 300 with w/c = 0.6 and Waste Glass = 0.6 - Fine
Concrete Mix Design B 300
w/c 0.6
Fine Waste Glass 0.6 ← Fine Sand
Component Size
Condition Weight Volume
Remarks mm kg/m
3 m
3
Cement Type I Dry 320.00 0.1016 Turkish Type I
Coarse Agg. 25 SSD 640.00 0.2397 Crushed Limestone
Med. Agg. 20 SSD 250.00 0.0954 Crushed Limestone
Fine Agg. 10 SSD 360.00 0.1369 Crushed Limestone
FW. Glass 0.1 to 0.6 SSD 373.34 0.1489 Crushed W. Glass
Sand 0.1 to 0.6 SSD 260.01 0.0992 Gaza Dune Sand
Water Tap Liquid 192.00 0.1920 Factory Water
Additives Super Flow Liquid 1.70 0.0014 Super Flow 3
Air Content Air Air 0.00 0.0150 Air
Total 2397.05 1.0301