Embed Size (px)
Citation preview

M Münchener RückMunich Re Group
Munich Re GroupQuarterly Report
2/2001

SUPERVISORY BOARD / BOARD OF MANAGEMENT
Supervisory Board
Ulrich Hartmann (Chairman)
Board of Management
Dr. Hans-Jürgen Schinzler (Chairman)
Dr. Wolf Otto Bauer
Dr. Nikolaus von Bomhard
Clement Booth
Dr. Heiner Hasford
Stefan Heyd
Christian Kluge
Dr. Detlef Schneidawind
Dr. Jörg Schneider
Dr. Hans-Wilmar von Stockhausen
Karl Wittmann
CONTENTS
1
TO OUR SHAREHOLDERS 2
OVERALL ECONOMIC DEVELOPMENT 4
BUSINESS EXPERIENCE IN THE FIRST HALF-YEAR 2001 5– Reinsurance– Primary insurance– Asset management
PROSPECTS 11
FINANCIAL STATEMENTS FOR THE FIRST HALF-YEAR 2001 12
IMPORTANT DATES 28
PAGE

TO OUR SHAREHOLDERS
2
To our shareholders
Dear Shareholders,
In this interim report we wish to inform you aboutthe business performance of the Munich Re Groupin the first half-year 2001.
The most important event in this period was ouragreement with Allianz to continue the restructur-ing of shareholdings in which both Munich Re andAllianz are involved. We informed you in detailabout the far-reaching changes connected withthis agreement at the beginning of April and onseveral occasions since, the most recent beingMunich Re’s AGM on 18th July.
An important part of the overall transaction wasMunich Re’s offer to ERGO shareholders to ex-change their shares for Munich Re stock at a ratioof 2:1. This attractive offer, which included a cashcomponent, met with an excellent response fromthe ERGO shareholders. Between 21st May and19th July more than 90% of the outstandingshares were submitted to us for exchange. Thismeans that in future Munich Re will have a 91.7%holding in ERGO Versicherungsgruppe, while ourcooperation partner, the HVB Group, will hold afurther 5%.
The Munich Re Group and the HVB Group willwork together even more closely in future. Already VICTORIA, one of the members of theERGO Group, is present with its products in all the branches of HypoVereinsbank and also on the website of DAB bank, which belongs to theHVB Group. Eight project committees are current-ly in the process of closely examining all furtheropportunities for collaboration in Germany andabroad – ranging from the exclusive cooperationbetween ERGO and HVB in marketing massbusiness to the joint development of customizedcapital-market products or project financing. Thefield of asset management is of substantial signifi-cance as well. In this area we already have a jointsubsidiary, FondsServiceBank, which specializes inthe management of deposits. Since its launch on2nd January, FSB has succeeded in increasing thenumber of deposits by 20% to 240,000. Furtherprojects will follow.
Overall economic conditions deteriorated world-wide in the first half of 2001. The world economyis slowing down; a string of bad news from com-panies is depressing the climate, also in the cap-ital markets.
Given this difficult environment, the Munich ReGroup did very well in the first six months of thebusiness year. Compared to the first half-year2000, our premium income rose by 12.1% to€17.1bn. The result after tax increased from€652m* to €1,298m. This improvement stemspredominantly from the switch we made in thefirst quarter to a less deferred valuation of ourshares in Allianz, a change we explained in ourreport for that quarter.
Our premium income from reinsurance grew by16.1% to €10.1bn. In many markets we have been able to improve prices and conditions andoptimize our portfolio, but it will take some timebefore these improvements make themselves fullyfelt in our results. The combined ratio for the firsthalf-year remained almost unchanged at 110.3%;excluding claims arising from natural catastrophesit was 108.0%.
Our primary insurers continue to develop verypositively and wrote gross premiums of €7.8bn,or 8.3% more than in the previous year. Thisgrowth is to a large extent attributable to theforeign acquisitions made last year, especiallyBayerische Vita, Milan. But we also succeeded inexpanding our premium volume in the highlycompetitive German market.
* Special funds in which we hold the majority of units wereconsolidated for the first time as at 31st December 2000. We have not adjusted the figures for the first-half year 2000,cf. the notes on page 24.

TO OUR SHAREHOLDERS
3
Investments increased by 3.9% to €165.6bn. Theinvestment result was up on last year, taking intoaccount the less deferred valuation of our sharesin Allianz mentioned above. In the first half-year2000, the high price levels prevailing on the stockmarkets had led to our taking substantial profits.So far this year we have held back owing to theweak state of the stock markets – and also with aview to the fact that sales of shares will be tax-free in Germany as from 2002.
If there is no worsening of the general economicenvironment, especially as regards the capitalmarkets, and the claims situation does notdeteriorate, our net result for 2001 will again show double-digit growth.
Given these prerequisites, we again expect to beable to pay our shareholders a dividend of €1.25per share for the business year 2001.
Yours sincerely,
OVERALL ECONOMIC DEVELOPMENT
4
Overall economic development
– Slowdown in global growth
– Financial markets looking to stabilize
The global economy cooled in the first half of 2001. Growth slowedespecially markedly in industrial production and world trade. Accordingto provisional figures, annualized and seasonally adjusted economicgrowth in the US fell to 0.7% in the second quarter – the lowest levelsince the first quarter of 1993. In Europe, too, important economic datawas disappointing and trend indicators became more gloomy, althoughgrowth remained above the US level.
Inflation was unexpectedly high, especially in the eurozone. However, the signs point to this being only a temporary rise. Thus commodityprices are generally tending to ease and growth in the money supply isdecelerating.
In view of the noticeable slowdown in world economic activity, thecentral banks have gradually lowered interest rates. The US FederalReserve has reduced its key rates by a total of 300 basis points since thebeginning of the year. The second quarter also saw further interest ratereductions in the UK and Switzerland, whilst the European Central Banklowered its key rates by 25 basis points in May.
The performance of the capital markets has clearly been shaped by thenegative macroeconomic developments. The bond markets followed thistrend, generally easing in the second quarter. Yields on ten-year govern-ment bonds increased considerably from their March low, but in July arenewed bout of economic pessimism cause them to fall again.
On the foreign exchange markets, the US dollar continued its upwardtrend in the second quarter. In July it tested the record highs it hadachieved against the euro last autumn. The Japanese yen also lostfurther ground against the greenback. After the dollar went back abovethe threshold of 90 cents per euro in the last few weeks, however, ex-pectations of a trend reversal in favour of the euro have been growing.
Overall economic development in the coming months will be mainlyinfluenced by the US economy. Unexpectedly weak development in the second half of the year would further aggravate the risks for theworld economy and the capital markets and could particularly impairdevelopment in the emerging markets of Asia and Latin America and ofindividual other countries.
Business experience in the first half-year 2001
There are various reasons why the quarterly results of insurance com-panies, including Munich Re, are not a reliable indicator for the results ofthe business year as a whole. Losses from natural catastrophes and othermajor losses burden disproportionally the result of the reporting period in which they occur. Late reported claims for major loss events can alsolead to substantial fluctuations in individual quarterly results. Moreover,gains and losses on the disposal of investments are accounted for in thequarter in which the investments are sold.
REINSURANCE
– Reinsurance group continues on growth course
– Successful round of renewals for 2001: prices and conditions
considerably improved
– Combined ratio: upward trend of recent years broken
In our reinsurance treaty renewals in the first half of 2001, we succeededin achieving further price increases and improving conditions – gratifying-ly without losing desirable business in the process. On the contrary, wewere even able to grow our business in important markets like Japan.
The terms of trade in many reinsurance markets are appreciably bettertoday than a year ago but are still far from the required technical levels.In individual cases prices have reached risk-commensurate levels, espe-cially for covers affected by losses from natural catastrophes in the lastfew years; but in a whole range of markets, terms and conditions stillrequire further improvement. We are continuing to do our utmost torestore business as a whole to an appropriate level of profitability and,with this in mind, critically examine every client account.
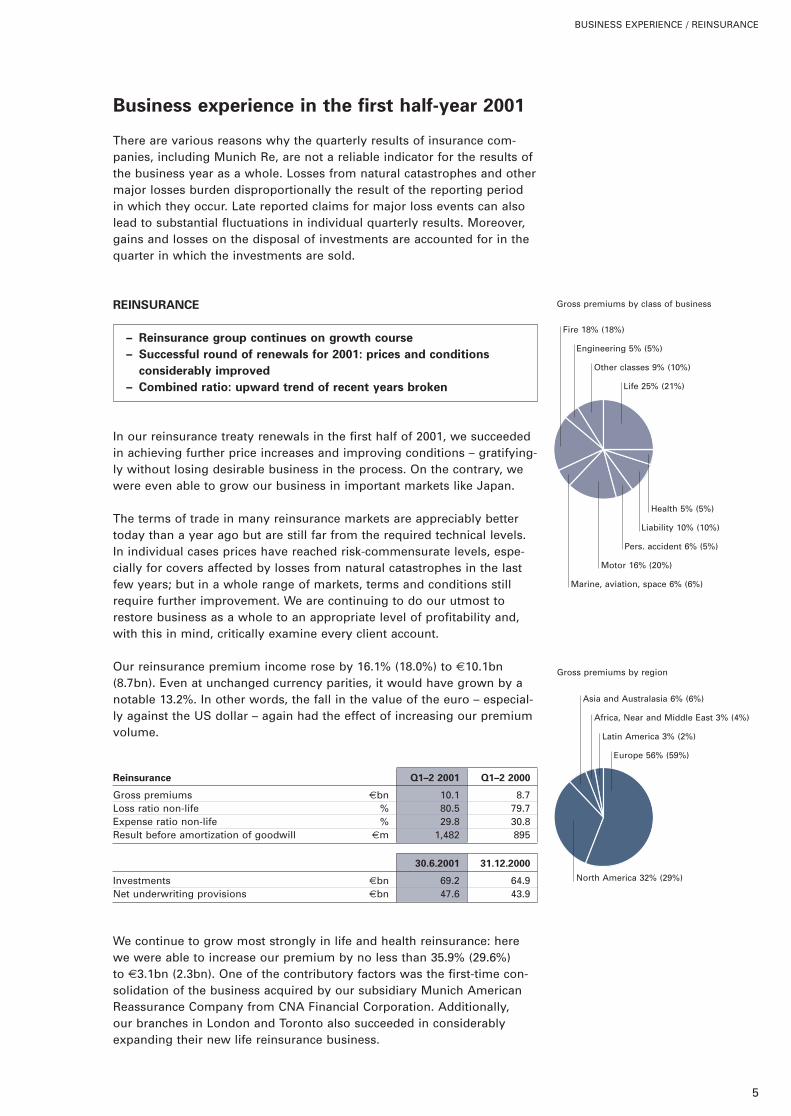
Our reinsurance premium income rose by 16.1% (18.0%) to €10.1bn(8.7bn). Even at unchanged currency parities, it would have grown by anotable 13.2%. In other words, the fall in the value of the euro – especial-ly against the US dollar – again had the effect of increasing our premiumvolume.
Reinsurance Q1–2 2001 Q1–2 2000
Gross premiums €bn 10.1 8.7Loss ratio non-life % 80.5 79.7Expense ratio non-life % 29.8 30.8Result before amortization of goodwill €m 1,482 895
30.6.2001 31.12.2000
Investments €bn 69.2 64.9Net underwriting provisions €bn 47.6 43.9
We continue to grow most strongly in life and health reinsurance: herewe were able to increase our premium by no less than 35.9% (29.6%) to €3.1bn (2.3bn). One of the contributory factors was the first-time con-solidation of the business acquired by our subsidiary Munich AmericanReassurance Company from CNA Financial Corporation. Additionally, our branches in London and Toronto also succeeded in considerablyexpanding their new life reinsurance business.
BUSINESS EXPERIENCE / REINSURANCE
5
Gross premiums by region
Europe 56% (59%)
North America 32% (29%)
Africa, Near and Middle East 3% (4%)
Asia and Australasia 6% (6%)
Latin America 3% (2%)
Life 25% (21%)
Health 5% (5%)
Liability 10% (10%)
Pers. accident 6% (5%)
Motor 16% (20%)
Marine, aviation, space 6% (6%)
Other classes 9% (10%)
Engineering 5% (5%)
Fire 18% (18%)
Gross premiums by class of business

BUSINESS EXPERIENCE / REINSURANCE
6
In property-casualty reinsurance we recorded premium growth of 9.2%(13.4%) to €7.0bn (6.4bn). The combined ratio, which had risen markedlyin each of the last few years, was 110.3% (110.5%); excluding naturalcatastrophe losses, it amounted to 108.0% (108.1%). In the first quarter2001 the respective figures were 112.1% and 110.4%.
Our Group reinsurers’ result for the first half-year before amortization ofgoodwill totalled €1,482m (895m) and their contribution to the result after tax €1,208m (527m). The result for the current year was positivelyinfluenced by the less deferred valuation of our shares in Allianz, whichcompensated for the fall in realized capital gains.
PRIMARY INSURANCE
– Good premium growth
– Results remain at a high level
– Marketing of pension-reform products gets off to a good start
As part of our agreement with Allianz to restructure shareholdings invarious jointly held companies, we also restructured our cooperation with banks, and in future ERGO will work together exclusively with theHVB Group throughout Germany.
The HVB Group is our partner of choice. Against the background of Ger-man pension reform in particular, both ERGO and the HVB Group willbenefit from appreciable expansion of the business they market for eachother. The cooperation in Germany will be extended to other Europeanmarkets in which both groups operate.
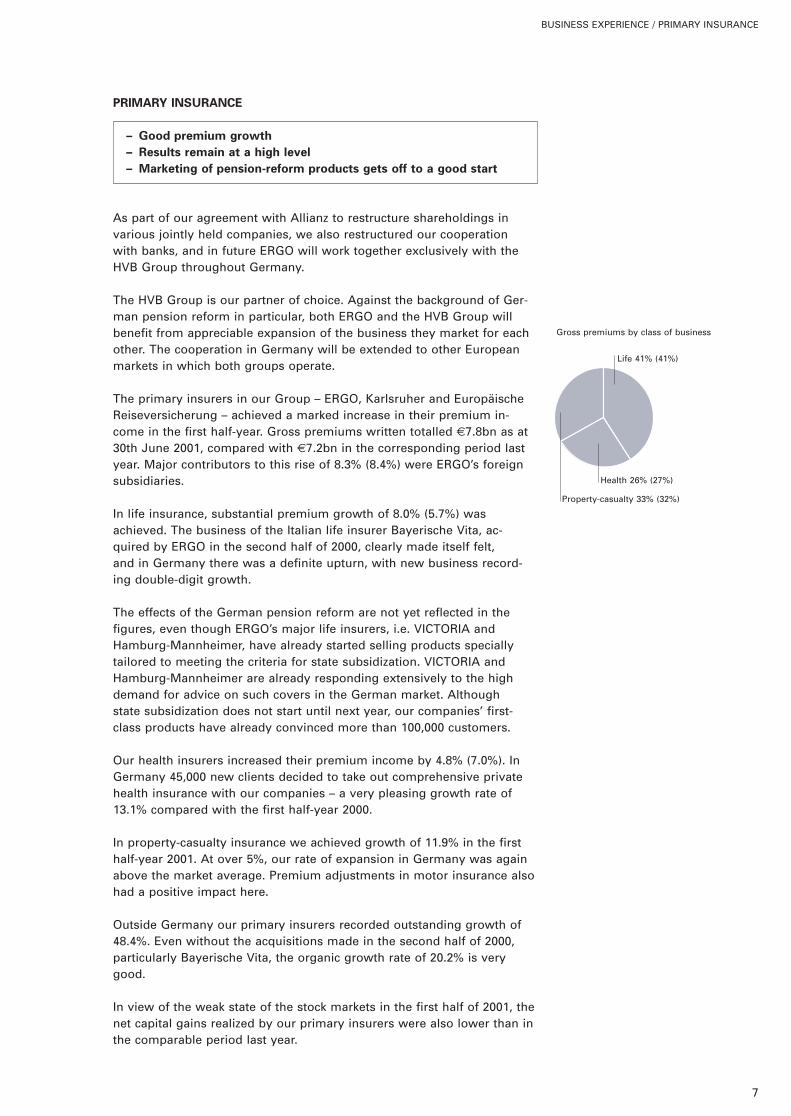
The primary insurers in our Group – ERGO, Karlsruher and EuropäischeReiseversicherung – achieved a marked increase in their premium in-come in the first half-year. Gross premiums written totalled €7.8bn as at30th June 2001, compared with €7.2bn in the corresponding period lastyear. Major contributors to this rise of 8.3% (8.4%) were ERGO’s foreignsubsidiaries.
In life insurance, substantial premium growth of 8.0% (5.7%) wasachieved. The business of the Italian life insurer Bayerische Vita, ac-quired by ERGO in the second half of 2000, clearly made itself felt, and in Germany there was a definite upturn, with new business record-ing double-digit growth.
The effects of the German pension reform are not yet reflected in thefigures, even though ERGO’s major life insurers, i.e. VICTORIA andHamburg-Mannheimer, have already started selling products speciallytailored to meeting the criteria for state subsidization. VICTORIA andHamburg-Mannheimer are already responding extensively to the highdemand for advice on such covers in the German market. Although state subsidization does not start until next year, our companies’ first-class products have already convinced more than 100,000 customers.
Our health insurers increased their premium income by 4.8% (7.0%). InGermany 45,000 new clients decided to take out comprehensive privatehealth insurance with our companies – a very pleasing growth rate of13.1% compared with the first half-year 2000.
In property-casualty insurance we achieved growth of 11.9% in the firsthalf-year 2001. At over 5%, our rate of expansion in Germany was againabove the market average. Premium adjustments in motor insurance alsohad a positive impact here.
Outside Germany our primary insurers recorded outstanding growth of48.4%. Even without the acquisitions made in the second half of 2000,particularly Bayerische Vita, the organic growth rate of 20.2% is verygood.
In view of the weak state of the stock markets in the first half of 2001, thenet capital gains realized by our primary insurers were also lower than inthe comparable period last year.
BUSINESS EXPERIENCE / PRIMARY INSURANCE
7
Life 41% (41%)
Property-casualty 33% (32%)
Health 26% (27%)
Gross premiums by class of business
BUSINESS EXPERIENCE / PRIMARY INSURANCE
8
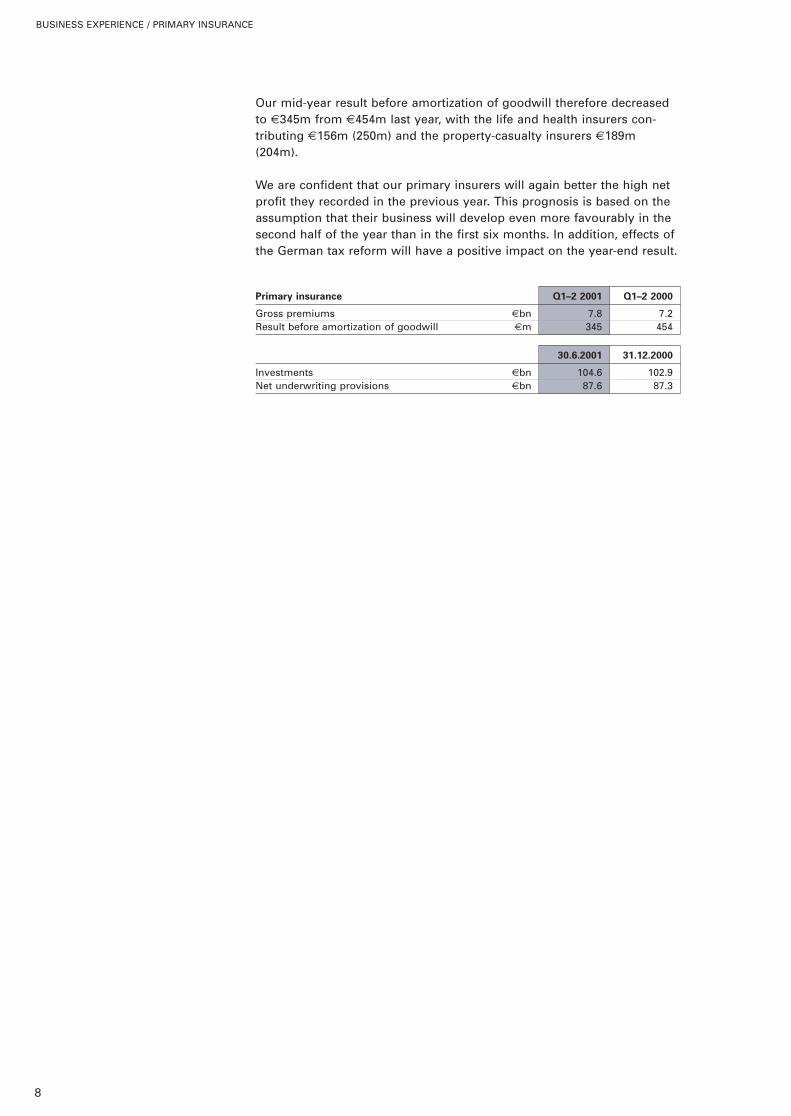
Our mid-year result before amortization of goodwill therefore decreasedto €345m from €454m last year, with the life and health insurers con-tributing €156m (250m) and the property-casualty insurers €189m(204m).
We are confident that our primary insurers will again better the high netprofit they recorded in the previous year. This prognosis is based on theassumption that their business will develop even more favourably in thesecond half of the year than in the first six months. In addition, effects ofthe German tax reform will have a positive impact on the year-end result.
Primary insurance Q1–2 2001 Q1–2 2000
Gross premiums €bn 7.8 7.2Result before amortization of goodwill €m 345 454
30.6.2001 31.12.2000
Investments €bn 104.6 102.9Net underwriting provisions €bn 87.6 87.3
BUSINESS EXPERIENCE / ASSET MANAGEMENT
9
ASSET MANAGEMENT
– Advantage taken of opportunities to buy into the stock markets
– Shifting of investments in bonds
– Realized capital gains distinctly lower
In the first half of 2001 the downward trend on the international stockmarkets continued. Not only did the telecoms and technology sectorsenter a depressed phase: the broader-based indices also fell worldwide,albeit to differing extents. The market did not start to settle down untilmid-April. With our asset manager, MEAG, we adhered to a long-terminvestment policy oriented towards stocks and real assets; where pricesfell, we expanded existing investments in shares and established newpositions. Our careful choice of individual stocks and sectors, plus thestrengthening of our equity investments outside Europe, protected usagainst the effects of major price losses.
The bond markets did not show much movement in the first half of 2001.The general yield level only altered slightly in the first half of the year,although the difference between yields on short and long terms in-creased. Given the low yields, our investment in the bond markets hasbeen restrained, focusing on the gradual expansion of our positions incorporate bonds and asset-backed securities. We see these products as a sound way of increasing the regular income from our fixed-interestsecurities.
The regional spread of our real estate portfolio was enhanced throughinvestments in Paris and Singapore. We intend to continue this inter-national diversification over the further course of the year.
A clear development was apparent on the foreign currency markets: the US dollar showed a steady upward trend against the euro and aslightly more volatile one against the yen, so that by mid-year it hadreached its respective highs in relation to both currencies. We are able toview such developments on the foreign currency markets with relativeequanimity, however, thanks to our policy of matching our underwritingcommitments with assets in the same or similar currencies.
With our active asset management in MEAG, we aim to significantlyenhance the yield on our investments in the long term with only verylittle increase in the investment risk. Our systematic investment process,our stringent risk controlling and the early-warning system we haveestablished Group-wide enable us also to exploit so far untapped invest-ment opportunities with strict consideration of the overall risk.
BUSINESS EXPERIENCE / ASSET MANAGEMENT
10
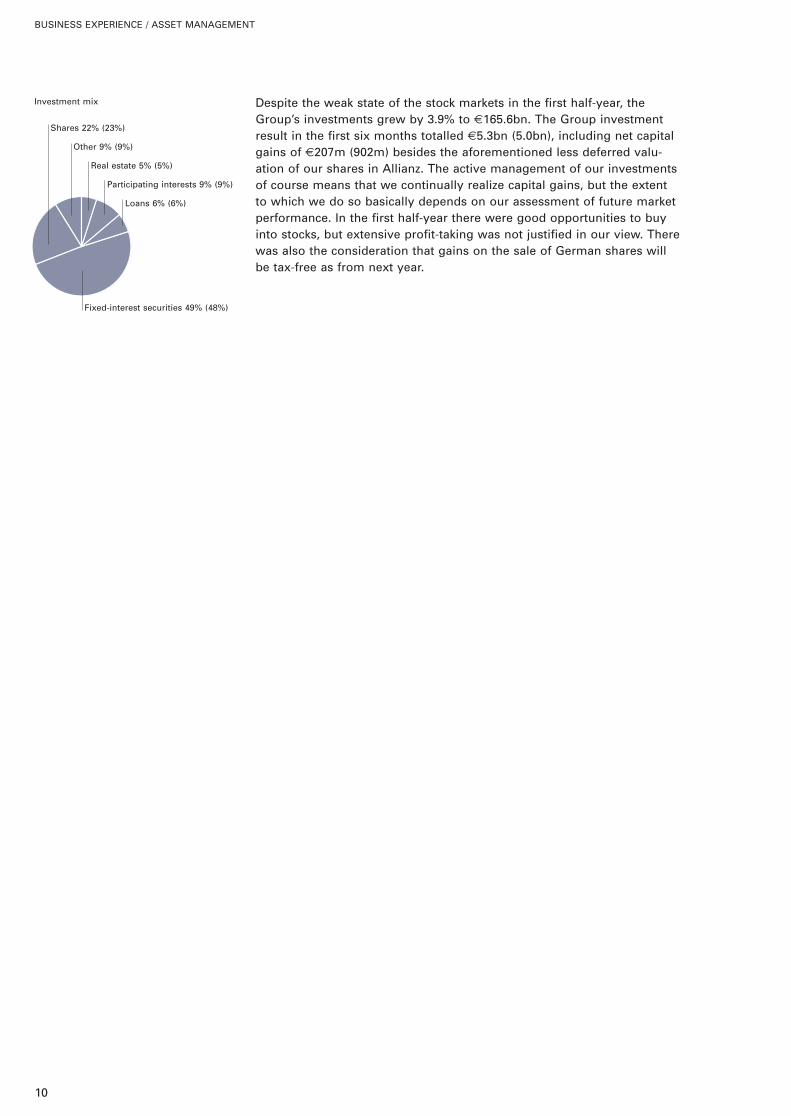
Despite the weak state of the stock markets in the first half-year, theGroup’s investments grew by 3.9% to €165.6bn. The Group investmentresult in the first six months totalled €5.3bn (5.0bn), including net capitalgains of €207m (902m) besides the aforementioned less deferred valu-ation of our shares in Allianz. The active management of our investmentsof course means that we continually realize capital gains, but the extentto which we do so basically depends on our assessment of future marketperformance. In the first half-year there were good opportunities to buyinto stocks, but extensive profit-taking was not justified in our view. Therewas also the consideration that gains on the sale of German shares willbe tax-free as from next year.
Investment mix
Participating interests 9% (9%)
Fixed-interest securities 49% (48%)
Loans 6% (6%)
Real estate 5% (5%)
Other 9% (9%)
Shares 22% (23%)

11
Prospects
– Strong growth again in reinsurance and primary insurance
– Basis created for marked improvement in reinsurance underwriting
result
– Investment result likely to be distinctly lower than last year
– Further relief as a consequence of the tax reform
– Another increase in the Group result expected
For the whole business year 2001, at unchanged currency parities, wecurrently expect Group premium income to reach €34bn (31bn).
Among the reinsurers in the Group, life business is the main driver ofgrowth. Here the acquisition of CNA Financial Corporation’s life reinsur-ance business by our subsidiary Munich American Reassurance Companywill have a considerable impact. We will, however, also be able to expandour life business in the UK and Canada at an above-average rate. Higherprices and larger market shares will increase our gross premium incomein non-life business as well. If claims costs from natural catastrophes andother major losses are within the normal range for the rest of 2001, ourcombined ratio will fall appreciably below the level of the first half-year.
Our premium growth in primary insurance in the current year will exceedthat of the business year 2000. In particular, life insurance premiums willreceive a strong boost from the first-time consolidation of Bayerische Vita for a full business year. In line with our objectives, the proportion of non-German business will therefore increase substantially.
Provided the general economic environment does not worsen, especiallyas regards the capital markets, and the claims situation does not deterior-ate, our profit for 2001 should again show double-digit growth. Adjustedto eliminate exceptional factors, both our operating result and our resultfor the year should then follow on from the very large profit of last year.
Given these prerequisites, we again expect to be able to pay our share-holders a dividend of €1.25 for the business year 2001.
Munich, 30th August 2001
The Board of Management
PROSPECTS
31.12.2000 Change
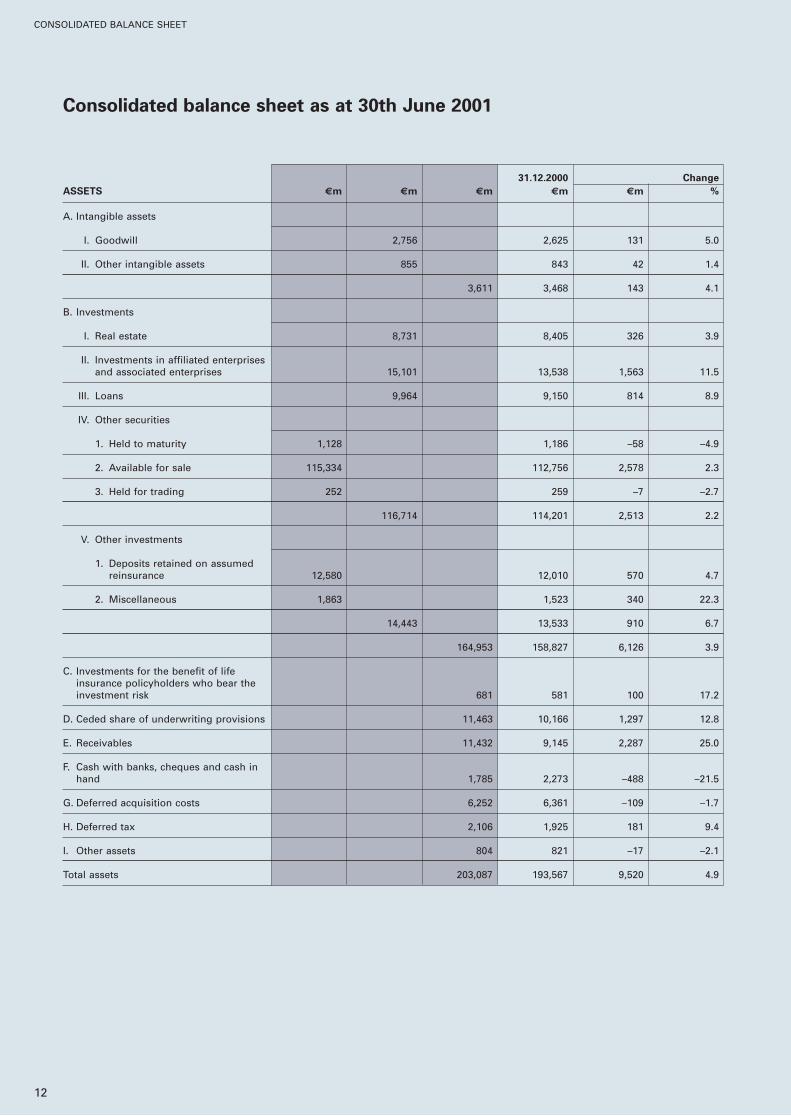
ASSETS €m €m €m €m €m %
A. Intangible assets
I. Goodwill 2,756 2,625 131 5.0
II. Other intangible assets 855 843 42 1.4
3,611 3,468 143 4.1
B. Investments
I. Real estate 8,731 8,405 326 3.9
II. Investments in affiliated enterprisesand associated enterprises 15,101 13,538 1,563 11.5
III. Loans 9,964 9,150 814 8.9
IV. Other securities
1. Held to maturity 1,128 1,186 –58 –4.9
2. Available for sale 115,334 112,756 2,578 2.3
3. Held for trading 252 259 –7 –2.7
116,714 114,201 2,513 2.2
V. Other investments
1. Deposits retained on assumedreinsurance 12,580 12,010 570 4.7
2. Miscellaneous 1,863 1,523 340 22.3
14,443 13,533 910 6.7
164,953 158,827 6,126 3.9
C. Investments for the benefit of lifeinsurance policyholders who bear theinvestment risk 681 581 100 17.2
D. Ceded share of underwriting provisions 11,463 10,166 1,297 12.8
E. Receivables 11,432 9,145 2,287 25.0
F. Cash with banks, cheques and cash inhand 1,785 2,273 –488 –21.5
G. Deferred acquisition costs 6,252 6,361 –109 –1.7
H. Deferred tax 2,106 1,925 181 9.4
I. Other assets 804 821 –17 –2.1
Total assets 203,087 193,567 9,520 4.9
12
CONSOLIDATED BALANCE SHEET
Consolidated balance sheet as at 30th June 2001

31.12.2000 Change
EQUITY AND LIABILITIES €m €m €m €m %
A. Shareholders’ equity
I. Issued capital and capital reserve 3,165 3,165 – –
II. Revenue reserves 12,025 9,174 2,851 31.1
III. Other reserves 8,306 9,513 –1,207 –12.7
IV. Consolidated profit 1,298 1,750 –452 –25.8
24,794 23,602 1,192 5.1
B. Minority interests 2,129 2,354 –225 –9.6
C. Gross underwriting provisions
I. Unearned premiums 5,854 5,376 478 8.9
II. Provision for future policy benefits 87,189 82,944 4,245 5.1
III. Provision for outstanding claims 34,413 31,248 3,165 10.1
IV. Other underwriting provisions 19,241 21,541 –2,300 –10.7
146,697 141,109 5,588 4.0
D. Gross underwriting provisions for life insurance policies where the investment risks is borne by thepolicyholders 504 583 –79 –13.6
E. Other accrued liabilities 2,529 3,061 –532 –17.4
F. Liabilities
I. Notes and debentures 1,905 1,793 112 6.2
II. Other liabilities 19,511 16,237 3,274 20.2
21,416 18,030 3,386 18.8
G. Deferred tax liabilities 4,907 4,780 127 2.7
H. Other deferred items 111 48 63 >100.0
Total equity and liabilities 203,087 193,567 9,520 4.9
13
CONSOLIDATED BALANCE SHEET
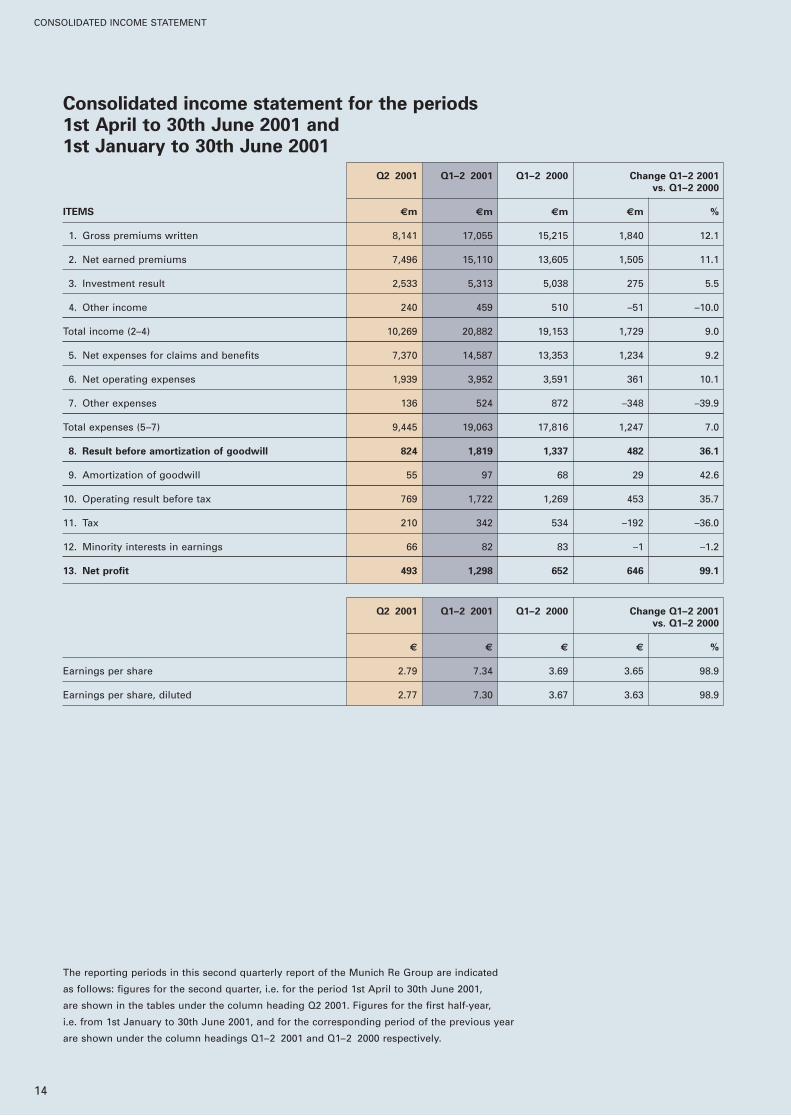
Consolidated income statement for the periods1st April to 30th June 2001 and1st January to 30th June 2001
CONSOLIDATED INCOME STATEMENT
14
Q2 2001 Q1–2 2001 Q1–2 2000 Change Q1–2 2001
vs. Q1–2 2000
ITEMS €m €m €m €m %
1. Gross premiums written 8,141 17,055 15,215 1,840 12.1
2. Net earned premiums 7,496 15,110 13,605 1,505 11.1
3. Investment result 2,533 5,313 5,038 275 5.5
4. Other income 240 459 510 –51 –10.0
Total income (2–4) 10,269 20,882 19,153 1,729 9.0
5. Net expenses for claims and benefits 7,370 14,587 13,353 1,234 9.2
6. Net operating expenses 1,939 3,952 3,591 361 10.1
7. Other expenses 136 524 872 –348 –39.9
Total expenses (5–7) 9,445 19,063 17,816 1,247 7.0
8. Result before amortization of goodwill 824 1,819 1,337 482 36.1
9. Amortization of goodwill 55 97 68 29 42.6
10. Operating result before tax 769 1,722 1,269 453 35.7
11. Tax 210 342 534 –192 –36.0
12. Minority interests in earnings 66 82 83 –1 –1.2
13. Net profit 493 1,298 652 646 99.1
Q2 2001 Q1–2 2001 Q1–2 2000 Change Q1–2 2001
vs. Q1–2 2000
€ € € € %
Earnings per share 2.79 7.34 3.69 3.65 98.9
Earnings per share, diluted 2.77 7.30 3.67 3.63 98.9
The reporting periods in this second quarterly report of the Munich Re Group are indicated
as follows: figures for the second quarter, i.e. for the period 1st April to 30th June 2001,
are shown in the tables under the column heading Q2 2001. Figures for the first half-year,
i.e. from 1st January to 30th June 2001, and for the corresponding period of the previous year
are shown under the column headings Q1–2 2001 and Q1–2 2000 respectively.
Q1–2 2000
€m €m
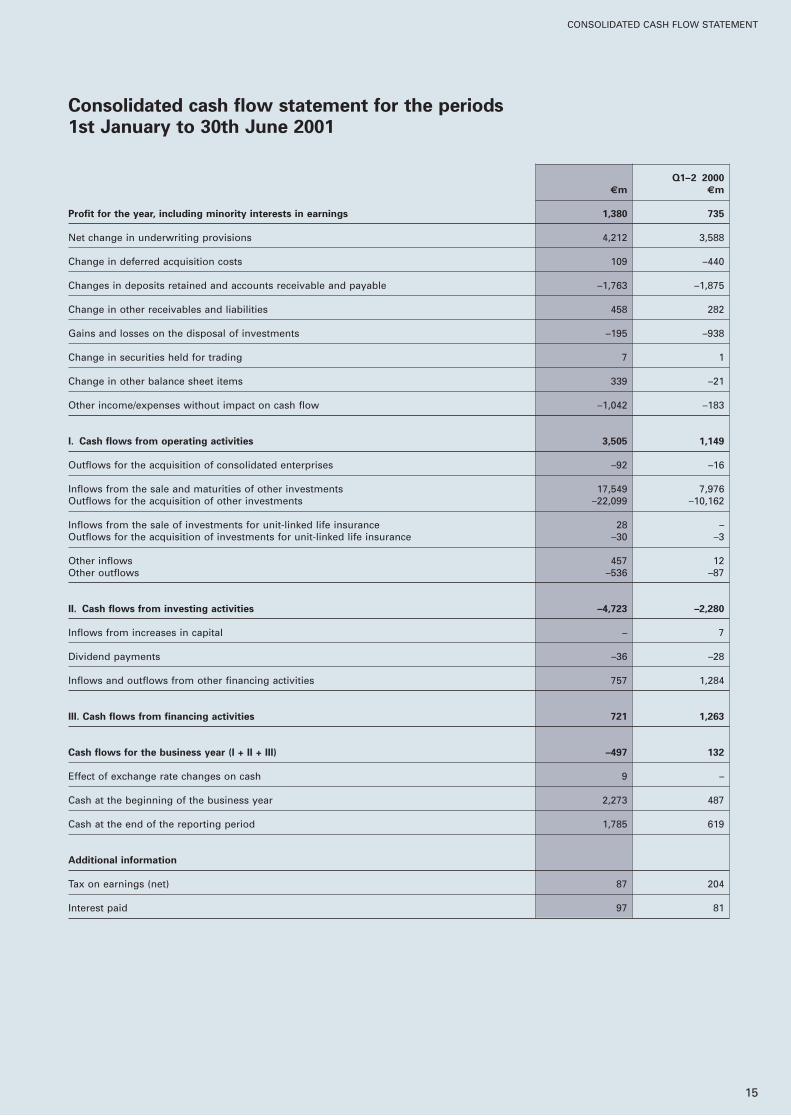
Profit for the year, including minority interests in earnings 1,380 735
Net change in underwriting provisions 4,212 3,588
Change in deferred acquisition costs 109 –440
Changes in deposits retained and accounts receivable and payable –1,763 –1,875
Change in other receivables and liabilities 458 282
Gains and losses on the disposal of investments –195 –938
Change in securities held for trading 7 1
Change in other balance sheet items 339 –21
Other income/expenses without impact on cash flow –1,042 –183
I. Cash flows from operating activities 3,505 1,149
Outflows for the acquisition of consolidated enterprises –92 –16
Inflows from the sale and maturities of other investments 17,549 7,976Outflows for the acquisition of other investments –22,099 –10,162
Inflows from the sale of investments for unit-linked life insurance 28 –Outflows for the acquisition of investments for unit-linked life insurance –30 –3
Other inflows 457 12Other outflows –536 –87
II. Cash flows from investing activities –4,723 –2,280
Inflows from increases in capital – 7
Dividend payments –36 –28
Inflows and outflows from other financing activities 757 1,284
III. Cash flows from financing activities 721 1,263
Cash flows for the business year (I + II + III) –497 132
Effect of exchange rate changes on cash 9 –
Cash at the beginning of the business year 2,273 487
Cash at the end of the reporting period 1,785 619
Additional information
Tax on earnings (net) 87 204
Interest paid 97 81
15
CONSOLIDATED CASH FLOW STATEMENT
Consolidated cash flow statement for the periods1st January to 30th June 2001
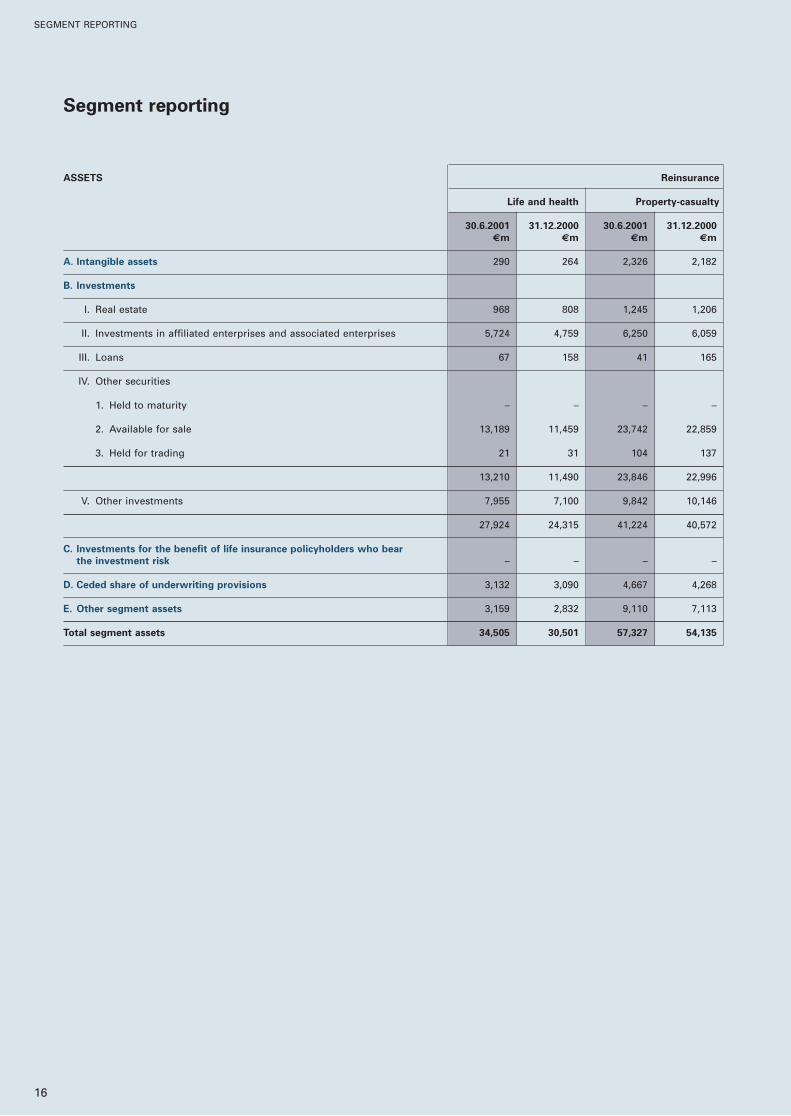
ASSETS Reinsurance
Life and health Property-casualty
30.6.2001 31.12.2000 30.6.2001 31.12.2000
€m €m €m €m
A. Intangible assets 290 264 2,326 2,182
B. Investments
I. Real estate 968 808 1,245 1,206
II. Investments in affiliated enterprises and associated enterprises 5,724 4,759 6,250 6,059
III. Loans 67 158 41 165
IV. Other securities
1. Held to maturity – – – –
2. Available for sale 13,189 11,459 23,742 22,859
3. Held for trading 21 31 104 137
13,210 11,490 23,846 22,996
V. Other investments 7,955 7,100 9,842 10,146
27,924 24,315 41,224 40,572
C. Investments for the benefit of life insurance policyholders who bear
the investment risk – – – –
D. Ceded share of underwriting provisions 3,132 3,090 4,667 4,268
E. Other segment assets 3,159 2,832 9,110 7,113
Total segment assets 34,505 30,501 57,327 54,135
16
Segment reporting
SEGMENT REPORTING
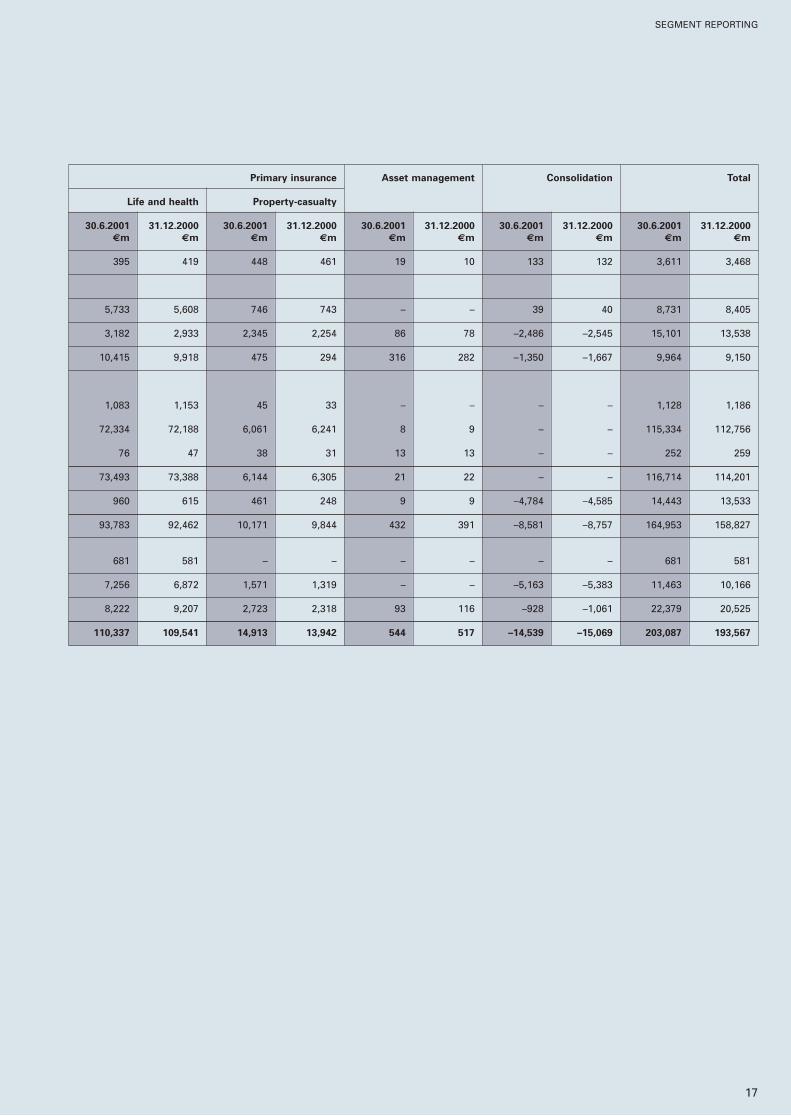
Primary insurance Asset management Consolidation Total
Life and health Property-casualty
30.6.2001 31.12.2000 30.6.2001 31.12.2000 30.6.2001 31.12.2000 30.6.2001 31.12.2000 30.6.2001 31.12.2000
€m €m €m €m €m €m €m €m €m €m
395 419 448 461 19 10 133 132 3,611 3,468
5,733 5,608 746 743 – – 39 40 8,731 8,405
3,182 2,933 2,345 2,254 86 78 –2,486 –2,545 15,101 13,538
10,415 9,918 475 294 316 282 –1,350 –1,667 9,964 9,150
1,083 1,153 45 33 – – – – 1,128 1,186
72,334 72,188 6,061 6,241 8 9 – – 115,334 112,756
76 47 38 31 13 13 – – 252 259
73,493 73,388 6,144 6,305 21 22 – – 116,714 114,201
960 615 461 248 9 9 –4,784 –4,585 14,443 13,533
93,783 92,462 10,171 9,844 432 391 –8,581 –8,757 164,953 158,827
681 581 – – – – – – 681 581
7,256 6,872 1,571 1,319 – – –5,163 –5,383 11,463 10,166
8,222 9,207 2,723 2,318 93 116 –928 –1,061 22,379 20,525
110,337 109,541 14,913 13,942 544 517 –14,539 –15,069 203,087 193,567
17
SEGMENT REPORTING
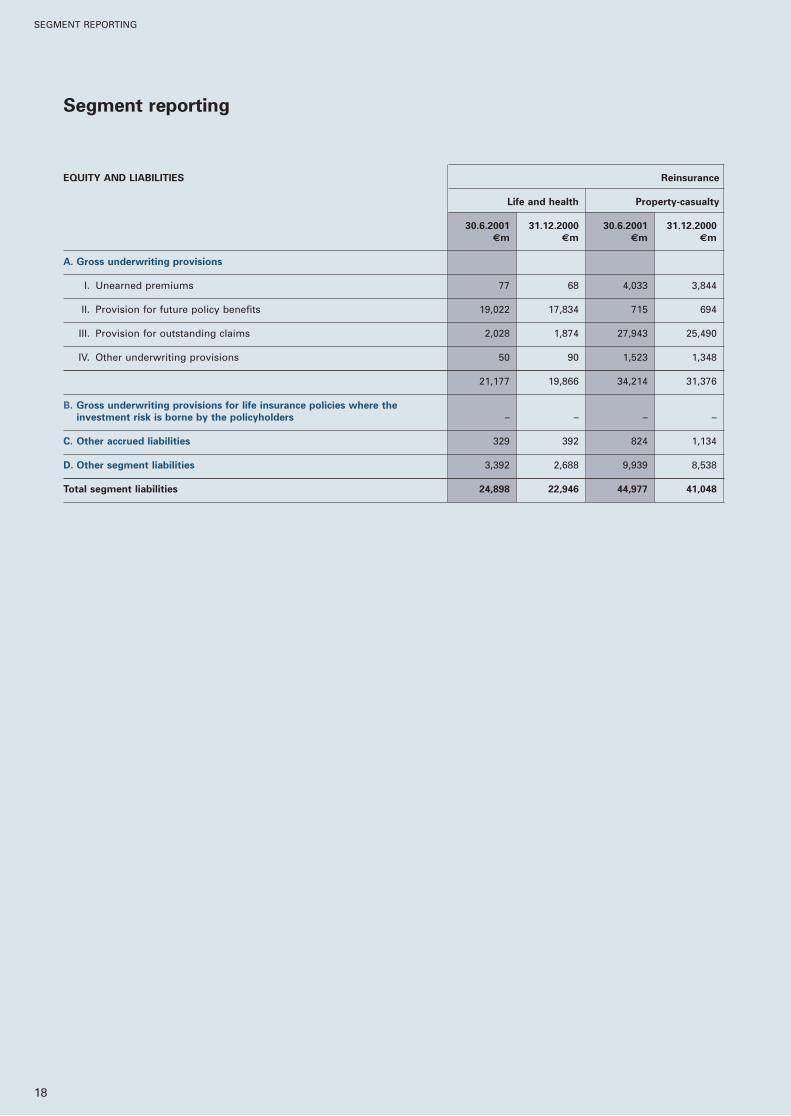
EQUITY AND LIABILITIES Reinsurance
Life and health Property-casualty
30.6.2001 31.12.2000 30.6.2001 31.12.2000
€m €m €m €m
A. Gross underwriting provisions
I. Unearned premiums 77 68 4,033 3,844
II. Provision for future policy benefits 19,022 17,834 715 694
III. Provision for outstanding claims 2,028 1,874 27,943 25,490
IV. Other underwriting provisions 50 90 1,523 1,348
21,177 19,866 34,214 31,376
B. Gross underwriting provisions for life insurance policies where the
investment risk is borne by the policyholders – – – –
C. Other accrued liabilities 329 392 824 1,134
D. Other segment liabilities 3,392 2,688 9,939 8,538
Total segment liabilities 24,898 22,946 44,977 41,048
18
Segment reporting
SEGMENT REPORTING
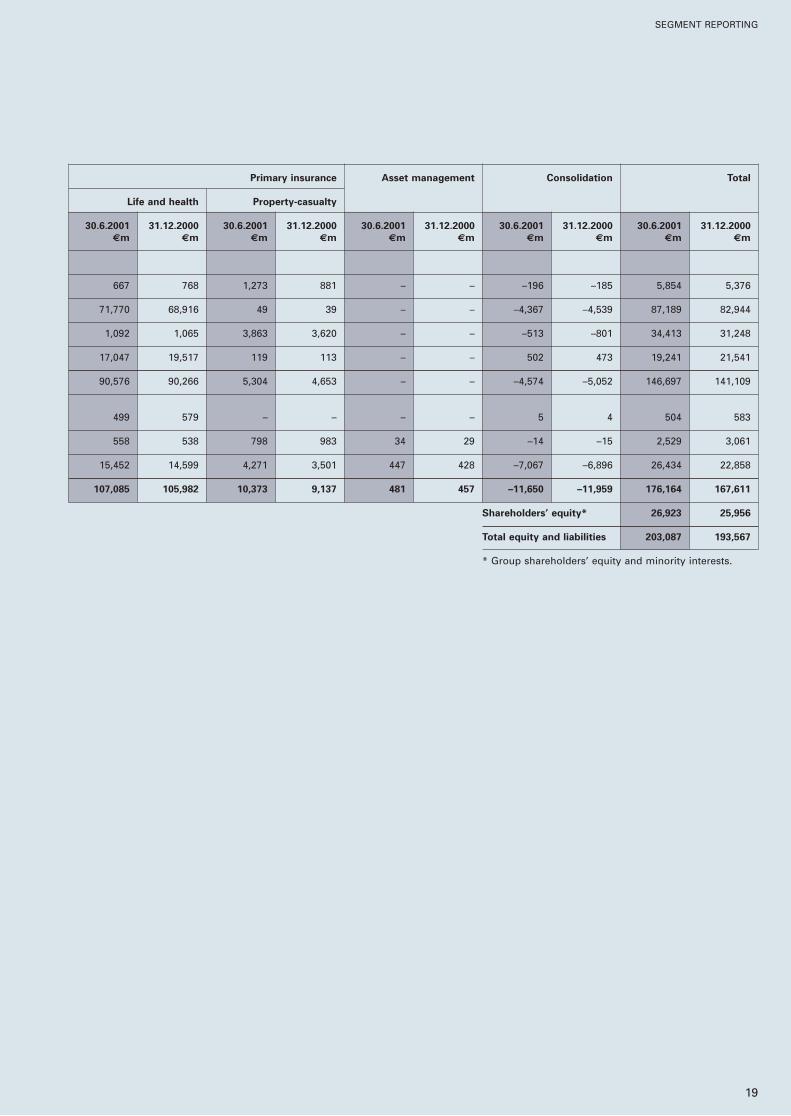
Primary insurance Asset management Consolidation Total
Life and health Property-casualty
30.6.2001 31.12.2000 30.6.2001 31.12.2000 30.6.2001 31.12.2000 30.6.2001 31.12.2000 30.6.2001 31.12.2000
€m €m €m €m €m €m €m €m €m €m
667 768 1,273 881 – – –196 –185 5,854 5,376
71,770 68,916 49 39 – – –4,367 –4,539 87,189 82,944
1,092 1,065 3,863 3,620 – – –513 –801 34,413 31,248
17,047 19,517 119 113 – – 502 473 19,241 21,541
90,576 90,266 5,304 4,653 – – –4,574 –5,052 146,697 141,109
499 579 – – – – 5 4 504 583
558 538 798 983 34 29 –14 –15 2,529 3,061
15,452 14,599 4,271 3,501 447 428 –7,067 –6,896 26,434 22,858
107,085 105,982 10,373 9,137 481 457 –11,650 –11,959 176,164 167,611
Shareholders’ equity* 26,923 25,956
Total equity and liabilities 203,087 193,567
* Group shareholders’ equity and minority interests.
19
SEGMENT REPORTING
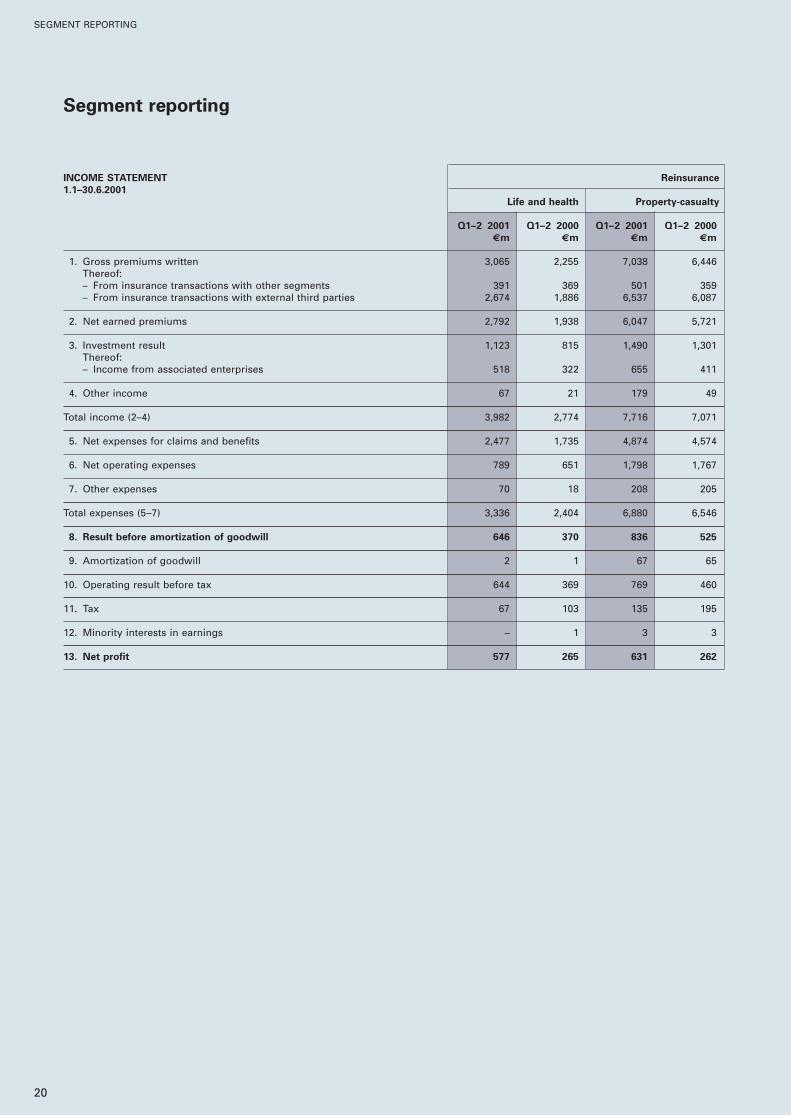
INCOME STATEMENT Reinsurance
1.1–30.6.2001
Life and health Property-casualty
Q1–2 2001 Q1–2 2000 Q1–2 2001 Q1–2 2000
€m €m €m €m
1. Gross premiums written 3,065 2,255 7,038 6,446Thereof:– From insurance transactions with other segments 391 369 501 359– From insurance transactions with external third parties 2,674 1,886 6,537 6,087
2. Net earned premiums 2,792 1,938 6,047 5,721
3. Investment result 1,123 815 1,490 1,301Thereof:– Income from associated enterprises 518 322 655 411
4. Other income 67 21 179 49
Total income (2–4) 3,982 2,774 7,716 7,071
5. Net expenses for claims and benefits 2,477 1,735 4,874 4,574
6. Net operating expenses 789 651 1,798 1,767
7. Other expenses 70 18 208 205
Total expenses (5–7) 3,336 2,404 6,880 6,546
8. Result before amortization of goodwill 646 370 836 525
9. Amortization of goodwill 2 1 67 65
10. Operating result before tax 644 369 769 460
11. Tax 67 103 135 195
12. Minority interests in earnings – 1 3 3
13. Net profit 577 265 631 262
20
SEGMENT REPORTING
Segment reporting
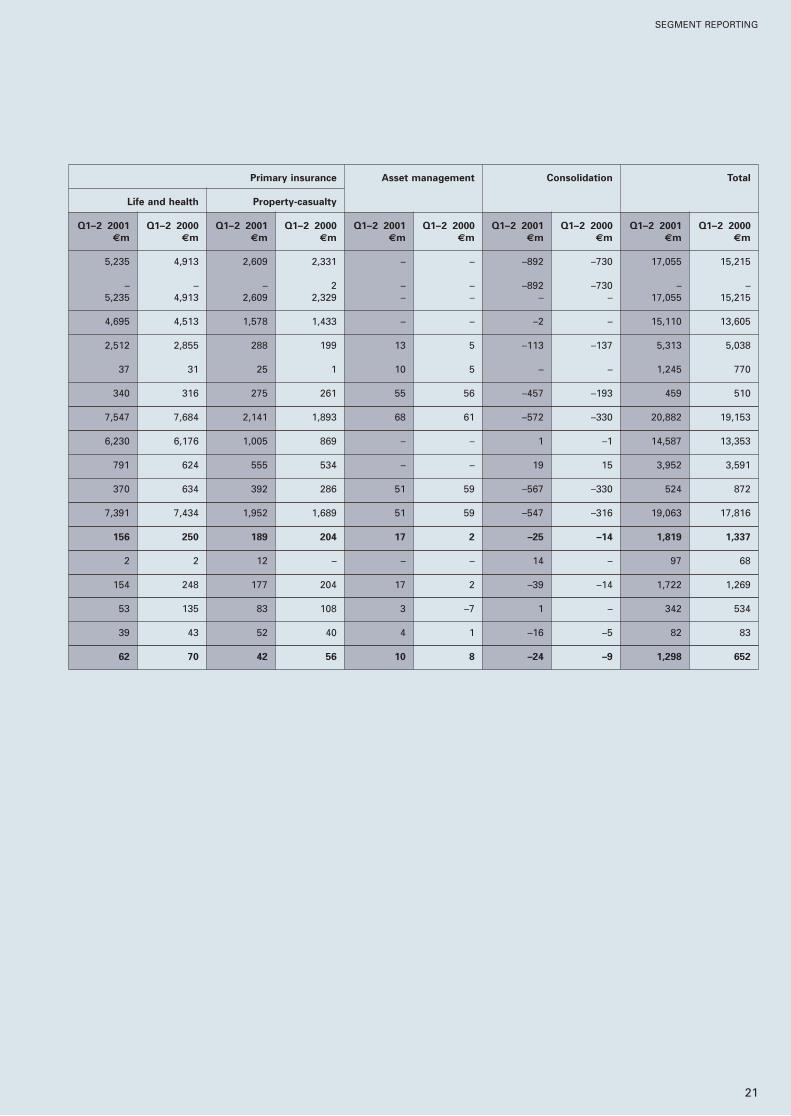
Primary insurance Asset management Consolidation Total
Life and health Property-casualty
Q1–2 2001 Q1–2 2000 Q1–2 2001 Q1–2 2000 Q1–2 2001 Q1–2 2000 Q1–2 2001 Q1–2 2000 Q1–2 2001 Q1–2 2000
€m €m €m €m €m €m €m €m €m €m
5,235 4,913 2,609 2,331 – – –892 –730 17,055 15,215
– – – 2 – – –892 –730 – –5,235 4,913 2,609 2,329 – – – – 17,055 15,215
4,695 4,513 1,578 1,433 – – –2 – 15,110 13,605
2,512 2,855 288 199 13 5 –113 –137 5,313 5,038
37 31 25 1 10 5 – – 1,245 770
340 316 275 261 55 56 –457 –193 459 510
7,547 7,684 2,141 1,893 68 61 –572 –330 20,882 19,153
6,230 6,176 1,005 869 – – 1 –1 14,587 13,353
791 624 555 534 – – 19 15 3,952 3,591
370 634 392 286 51 59 –567 –330 524 872
7,391 7,434 1,952 1,689 51 59 –547 –316 19,063 17,816
156 250 189 204 17 2 –25 –14 1,819 1,337
2 2 12 – – – 14 – 97 68
154 248 177 204 17 2 –39 –14 1,722 1,269
53 135 83 108 3 –7 1 – 342 534
39 43 52 40 4 1 –16 –5 82 83
62 70 42 56 10 8 –24 –9 1,298 652
21
SEGMENT REPORTING
SEGMENT REPORTING
22
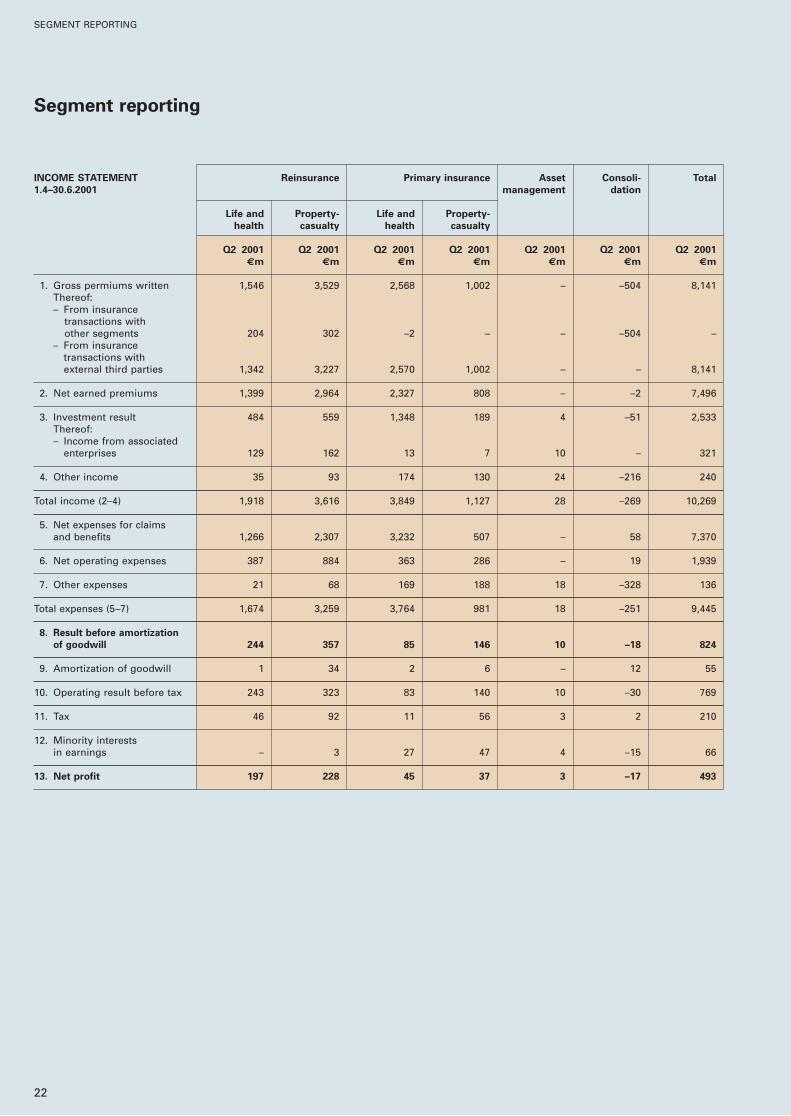
Segment reporting
INCOME STATEMENT Reinsurance Primary insurance Asset Consoli- Total
1.4–30.6.2001 management dation
Life and Property- Life and Property-
health casualty health casualty
Q2 2001 Q2 2001 Q2 2001 Q2 2001 Q2 2001 Q2 2001 Q2 2001
€m €m €m €m €m €m €m
1. Gross permiums written 1,546 3,529 2,568 1,002 – –504 8,141Thereof:– From insurance
transactions withother segments 204 302 –2 – – –504 –
– From insurancetransactions withexternal third parties 1,342 3,227 2,570 1,002 – – 8,141
2. Net earned premiums 1,399 2,964 2,327 808 – –2 7,496
3. Investment result 484 559 1,348 189 4 –51 2,533Thereof:– Income from associated
enterprises 129 162 13 7 10 – 321
4. Other income 35 93 174 130 24 –216 240
Total income (2–4) 1,918 3,616 3,849 1,127 28 –269 10,269
5. Net expenses for claimsand benefits 1,266 2,307 3,232 507 – 58 7,370
6. Net operating expenses 387 884 363 286 – 19 1,939
7. Other expenses 21 68 169 188 18 –328 136
Total expenses (5–7) 1,674 3,259 3,764 981 18 –251 9,445
8. Result before amortization
of goodwill 244 357 85 146 10 –18 824
9. Amortization of goodwill 1 34 2 6 – 12 55
10. Operating result before tax 243 323 83 140 10 –30 769
11. Tax 46 92 11 56 3 2 210
12. Minority interests in earnings – 3 27 47 4 –15 66
13. Net profit 197 228 45 37 3 –17 493
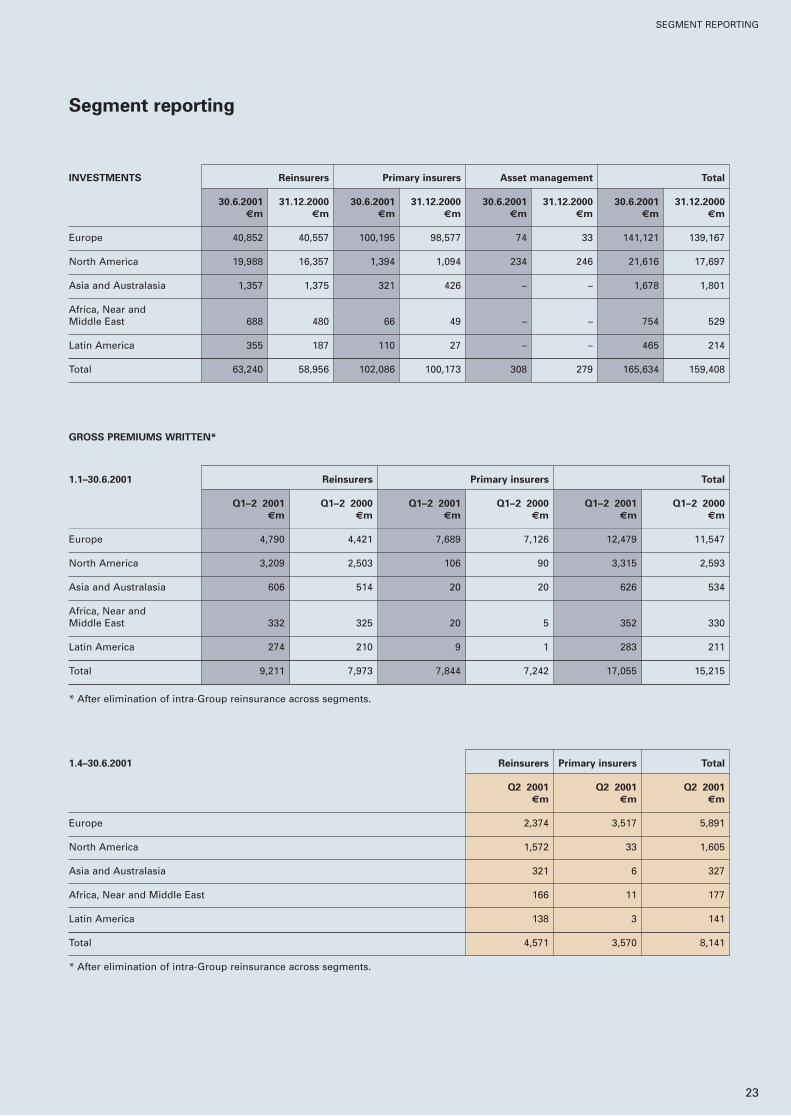
1.4–30.6.2001 Reinsurers Primary insurers Total
Q2 2001 Q2 2001 Q2 2001
€m €m €m
Europe 2,374 3,517 5,891
North America 1,572 33 1,605
Asia and Australasia 321 6 327
Africa, Near and Middle East 166 11 177
Latin America 138 3 141
Total 4,571 3,570 8,141
* After elimination of intra-Group reinsurance across segments.
1.1–30.6.2001 Reinsurers Primary insurers Total
Q1–2 2001 Q1–2 2000 Q1–2 2001 Q1–2 2000 Q1–2 2001 Q1–2 2000
€m €m €m €m €m €m
Europe 4,790 4,421 7,689 7,126 12,479 11,547
North America 3,209 2,503 106 90 3,315 2,593
Asia and Australasia 606 514 20 20 626 534
Africa, Near andMiddle East 332 325 20 5 352 330
Latin America 274 210 9 1 283 211
Total 9,211 7,973 7,844 7,242 17,055 15,215
* After elimination of intra-Group reinsurance across segments.
INVESTMENTS Reinsurers Primary insurers Asset management Total
30.6.2001 31.12.2000 30.6.2001 31.12.2000 30.6.2001 31.12.2000 30.6.2001 31.12.2000
€m €m €m €m €m €m €m €m
Europe 40,852 40,557 100,195 98,577 74 33 141,121 139,167
North America 19,988 16,357 1,394 1,094 234 246 21,616 17,697
Asia and Australasia 1,357 1,375 321 426 – – 1,678 1,801
Africa, Near andMiddle East 688 480 66 49 – – 754 529
Latin America 355 187 110 27 – – 465 214
Total 63,240 58,956 102,086 100,173 308 279 165,634 159,408
SEGMENT REPORTING
23
Segment reporting
GROSS PREMIUMS WRITTEN*
Notes
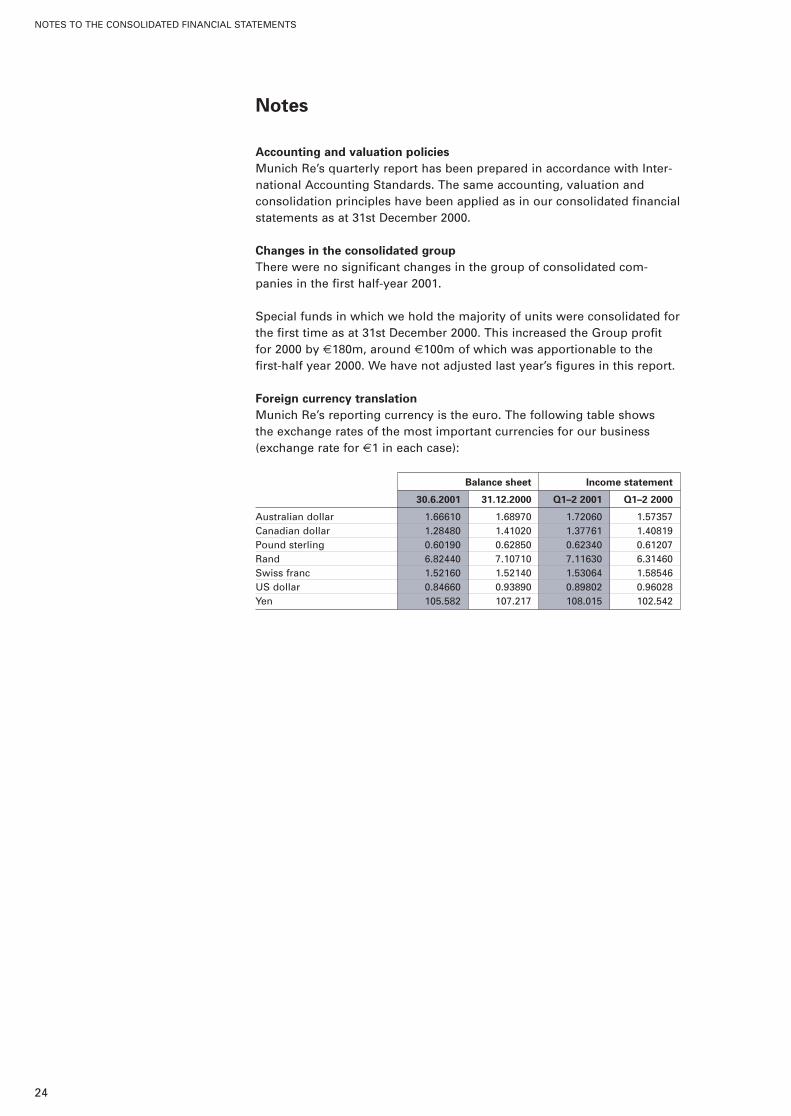
Accounting and valuation policies
Munich Re’s quarterly report has been prepared in accordance with Inter-national Accounting Standards. The same accounting, valuation and consolidation principles have been applied as in our consolidated financialstatements as at 31st December 2000.
Changes in the consolidated group
There were no significant changes in the group of consolidated com-panies in the first half-year 2001.
Special funds in which we hold the majority of units were consolidated forthe first time as at 31st December 2000. This increased the Group profitfor 2000 by €180m, around €100m of which was apportionable to thefirst-half year 2000. We have not adjusted last year’s figures in this report.
Foreign currency translation
Munich Re’s reporting currency is the euro. The following table shows the exchange rates of the most important currencies for our business(exchange rate for €1 in each case):
Balance sheet Income statement
30.6.2001 31.12.2000 Q1–2 2001 Q1–2 2000
Australian dollar 1.66610 1.68970 1.72060 1.57357Canadian dollar 1.28480 1.41020 1.37761 1.40819Pound sterling 0.60190 0.62850 0.62340 0.61207Rand 6.82440 7.10710 7.11630 6.31460Swiss franc 1.52160 1.52140 1.53064 1.58546US dollar 0.84660 0.93890 0.89802 0.96028Yen 105.582 107.217 108.015 102.542
NOTES TO THE CONSOLIDATED FINANCIAL STATEMENTS
24
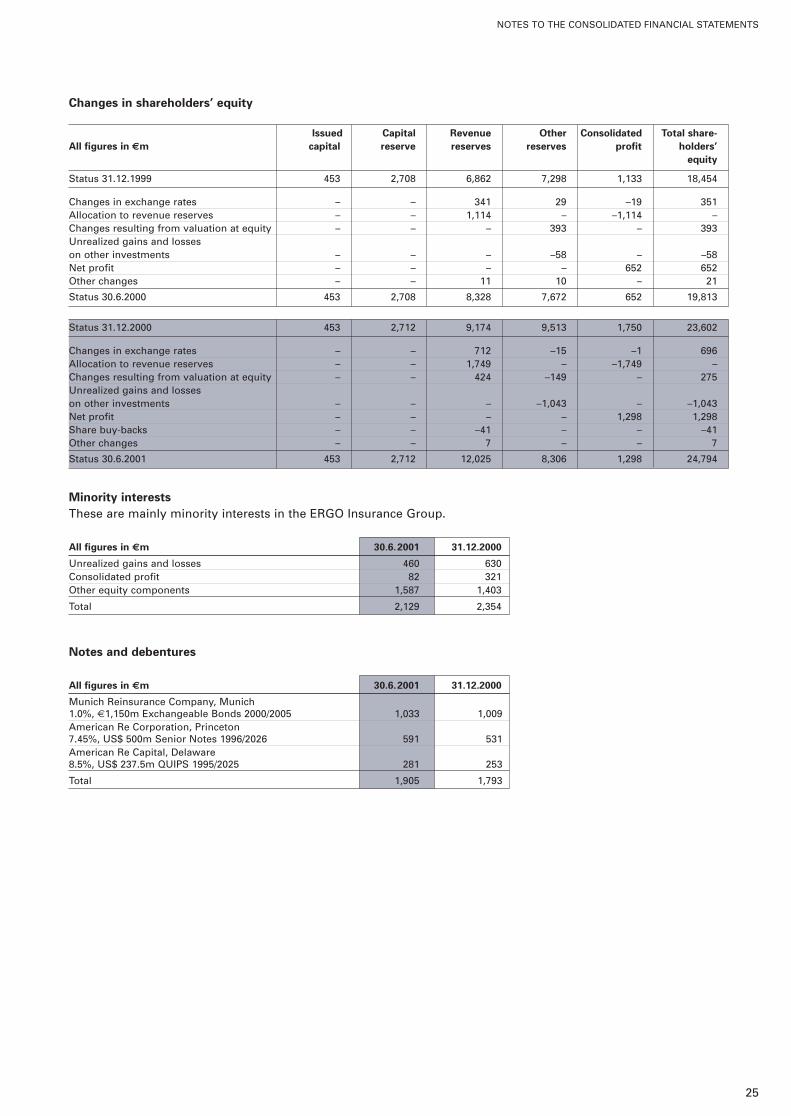
Changes in shareholders’ equity
Issued Capital Revenue Other Consolidated Total share-
All figures in €m capital reserve reserves reserves profit holders’
equity
Status 31.12.1999 453 2,708 6,862 7,298 1,133 18,454
Changes in exchange rates – – 341 29 –19 351Allocation to revenue reserves – – 1,114 – –1,114 –Changes resulting from valuation at equity – – – 393 – 393Unrealized gains and losses on other investments – – – –58 – –58Net profit – – – – 652 652Other changes – – 11 10 – 21
Status 30.6.2000 453 2,708 8,328 7,672 652 19,813
Status 31.12.2000 453 2,712 9,174 9,513 1,750 23,602
Changes in exchange rates – – 712 –15 –1 696Allocation to revenue reserves – – 1,749 – –1,749 –Changes resulting from valuation at equity – – 424 –149 – 275Unrealized gains and losses on other investments – – – –1,043 – –1,043Net profit – – – – 1,298 1,298Share buy-backs – – –41 – – –41Other changes – – 7 – – 7
Status 30.6.2001 453 2,712 12,025 8,306 1,298 24,794
Minority interests
These are mainly minority interests in the ERGO Insurance Group.
All figures in €m 30.6.2001 31.12.2000
Unrealized gains and losses 460 630Consolidated profit 82 321Other equity components 1,587 1,403
Total 2,129 2,354
Notes and debentures
All figures in €m 30.6.2001 31.12.2000
Munich Reinsurance Company, Munich1.0%, €1,150m Exchangeable Bonds 2000/2005 1,033 1,009American Re Corporation, Princeton7.45%, US$ 500m Senior Notes 1996/2026 591 531American Re Capital, Delaware8.5%, US$ 237.5m QUIPS 1995/2025 281 253
Total 1,905 1,793
NOTES TO THE CONSOLIDATED FINANCIAL STATEMENTS
25
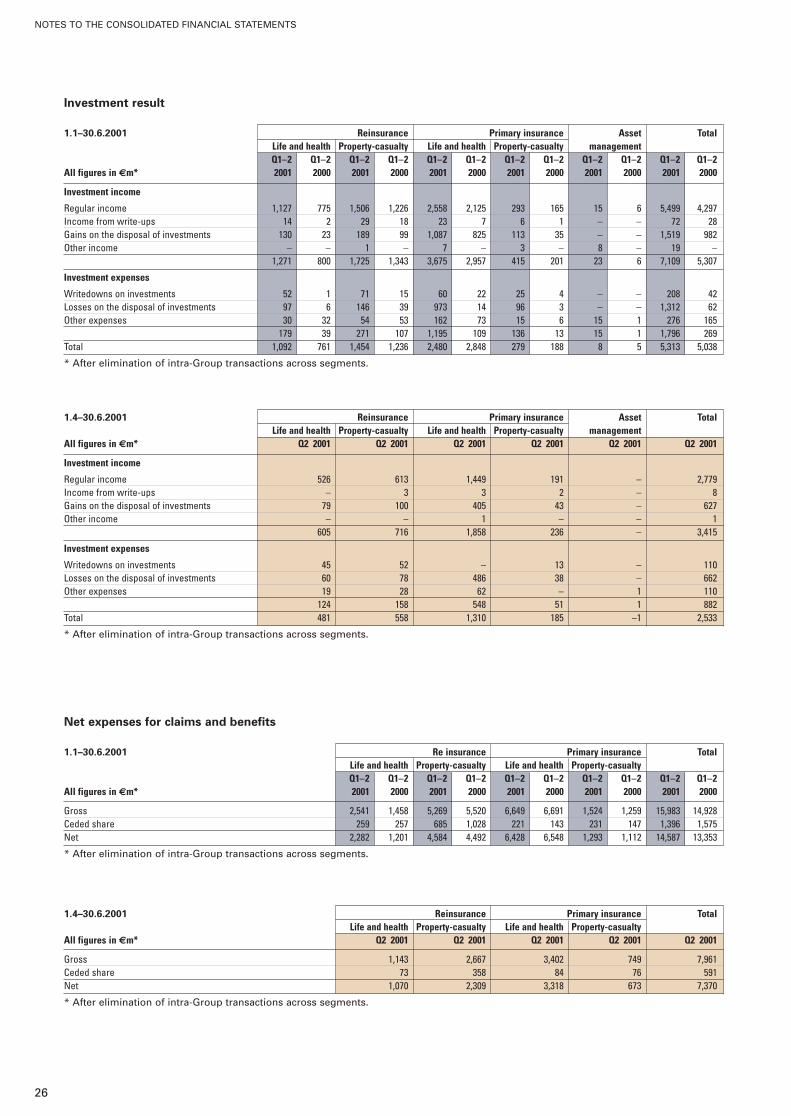
1.4–30.6.2001 Reinsurance Primary insurance TotalLife and health Property-casualty Life and health Property-casualty
All figures in €m* Q2 2001 Q2 2001 Q2 2001 Q2 2001 Q2 2001
Gross 1,143 2,667 3,402 749 7,961Ceded share 73 358 84 76 591Net 1,070 2,309 3,318 673 7,370
* After elimination of intra-Group transactions across segments.
1.4–30.6.2001 Reinsurance Primary insurance Asset TotalLife and health Property-casualty Life and health Property-casualty management
All figures in €m* Q2 2001 Q2 2001 Q2 2001 Q2 2001 Q2 2001 Q2 2001
Investment income
Regular income 526 613 1,449 191 – 2,779Income from write-ups – 3 3 2 – 8Gains on the disposal of investments 79 100 405 43 – 627Other income – – 1 – – 1
605 716 1,858 236 – 3,415
Investment expenses
Writedowns on investments 45 52 – 13 – 110Losses on the disposal of investments 60 78 486 38 – 662Other expenses 19 28 62 – 1 110
124 158 548 51 1 882Total 481 558 1,310 185 –1 2,533
* After elimination of intra-Group transactions across segments.
Net expenses for claims and benefits
1.1–30.6.2001 Re insurance Primary insurance TotalLife and health Property-casualty Life and health Property-casualtyQ1–2 Q1–2 Q1–2 Q1–2 Q1–2 Q1–2 Q1–2 Q1–2 Q1–2 Q1–2
All figures in €m* 2001 2000 2001 2000 2001 2000 2001 2000 2001 2000
Gross 2,541 1,458 5,269 5,520 6,649 6,691 1,524 1,259 15,983 14,928Ceded share 259 257 685 1,028 221 143 231 147 1,396 1,575Net 2,282 1,201 4,584 4,492 6,428 6,548 1,293 1,112 14,587 13,353
* After elimination of intra-Group transactions across segments.
Investment result
1.1–30.6.2001 Reinsurance Primary insurance Asset TotalLife and health Property-casualty Life and health Property-casualty managementQ1–2 Q1–2 Q1–2 Q1–2 Q1–2 Q1–2 Q1–2 Q1–2 Q1–2 Q1–2 Q1–2 Q1–2
All figures in €m* 2001 2000 2001 2000 2001 2000 2001 2000 2001 2000 2001 2000
Investment income
Regular income 1,127 775 1,506 1,226 2,558 2,125 293 165 15 6 5,499 4,297Income from write-ups 14 2 29 18 23 7 6 1 – – 72 28Gains on the disposal of investments 130 23 189 99 1,087 825 113 35 – – 1,519 982Other income – – 1 – 7 – 3 – 8 – 19 –
1,271 800 1,725 1,343 3,675 2,957 415 201 23 6 7,109 5,307
Investment expenses
Writedowns on investments 52 1 71 15 60 22 25 4 – – 208 42Losses on the disposal of investments 97 6 146 39 973 14 96 3 – – 1,312 62Other expenses 30 32 54 53 162 73 15 6 15 1 276 165
179 39 271 107 1,195 109 136 13 15 1 1,796 269Total 1,092 761 1,454 1,236 2,480 2,848 279 188 8 5 5,313 5,038
* After elimination of intra-Group transactions across segments.
NOTES TO THE CONSOLIDATED FINANCIAL STATEMENTS
26
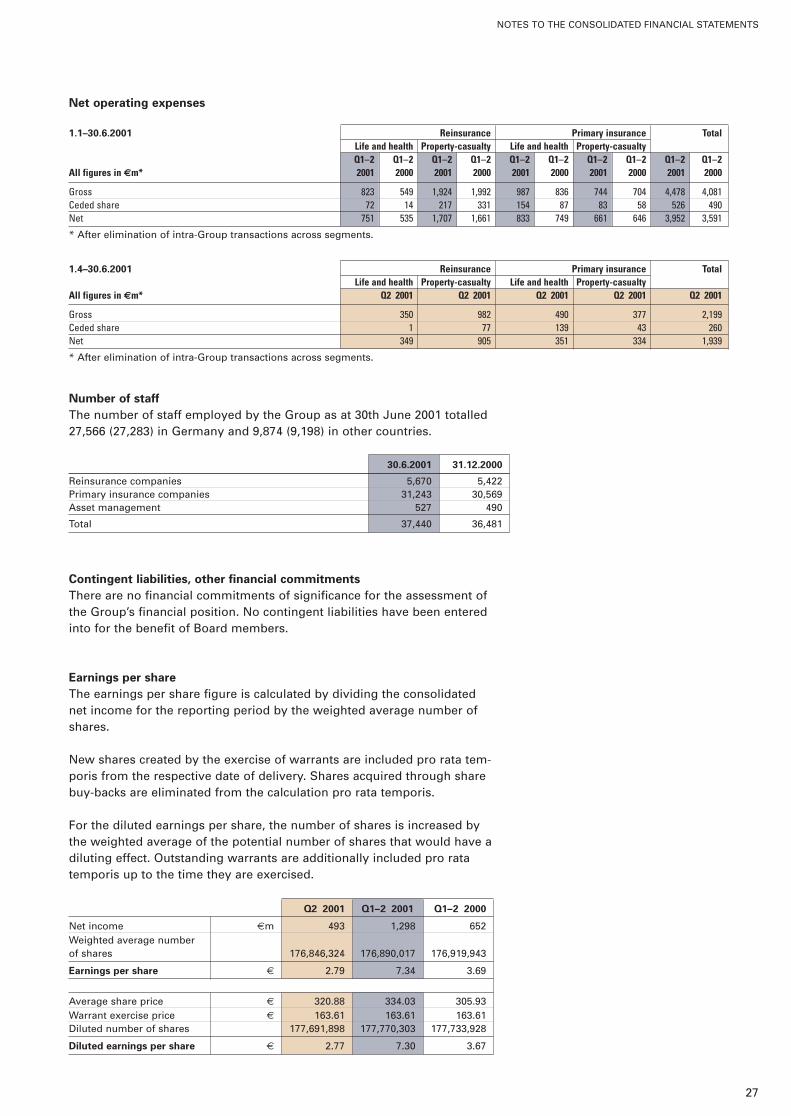
1.4–30.6.2001 Reinsurance Primary insurance TotalLife and health Property-casualty Life and health Property-casualty
All figures in €m* Q2 2001 Q2 2001 Q2 2001 Q2 2001 Q2 2001
Gross 350 982 490 377 2,199Ceded share 1 77 139 43 260Net 349 905 351 334 1,939
* After elimination of intra-Group transactions across segments.
Net operating expenses
1.1–30.6.2001 Reinsurance Primary insurance TotalLife and health Property-casualty Life and health Property-casualtyQ1–2 Q1–2 Q1–2 Q1–2 Q1–2 Q1–2 Q1–2 Q1–2 Q1–2 Q1–2
All figures in €m* 2001 2000 2001 2000 2001 2000 2001 2000 2001 2000
Gross 823 549 1,924 1,992 987 836 744 704 4,478 4,081Ceded share 72 14 217 331 154 87 83 58 526 490Net 751 535 1,707 1,661 833 749 661 646 3,952 3,591
* After elimination of intra-Group transactions across segments.
27
NOTES TO THE CONSOLIDATED FINANCIAL STATEMENTS
Number of staff
The number of staff employed by the Group as at 30th June 2001 totalled 27,566 (27,283) in Germany and 9,874 (9,198) in other countries.
30.6.2001 31.12.2000
Reinsurance companies 5,670 5,422Primary insurance companies 31,243 30,569Asset management 527 490
Total 37,440 36,481
Contingent liabilities, other financial commitments
There are no financial commitments of significance for the assessment ofthe Group’s financial position. No contingent liabilities have been enteredinto for the benefit of Board members.
Earnings per share
The earnings per share figure is calculated by dividing the consolidatednet income for the reporting period by the weighted average number ofshares.
New shares created by the exercise of warrants are included pro rata tem-poris from the respective date of delivery. Shares acquired through sharebuy-backs are eliminated from the calculation pro rata temporis.
For the diluted earnings per share, the number of shares is increased bythe weighted average of the potential number of shares that would have adiluting effect. Outstanding warrants are additionally included pro ratatemporis up to the time they are exercised.
Q2 2001 Q1–2 2001 Q1–2 2000
Net income €m 493 1,298 652Weighted average numberof shares 176,846,324 176,890,017 176,919,943
Earnings per share € 2.79 7.34 3.69
Average share price € 320.88 334.03 305.93Warrant exercise price € 163.61 163.61 163.61Diluted number of shares 177,691,898 177,770,303 177,733,928
Diluted earnings per share € 2.77 7.30 3.67
IMPORTANT DATES
28
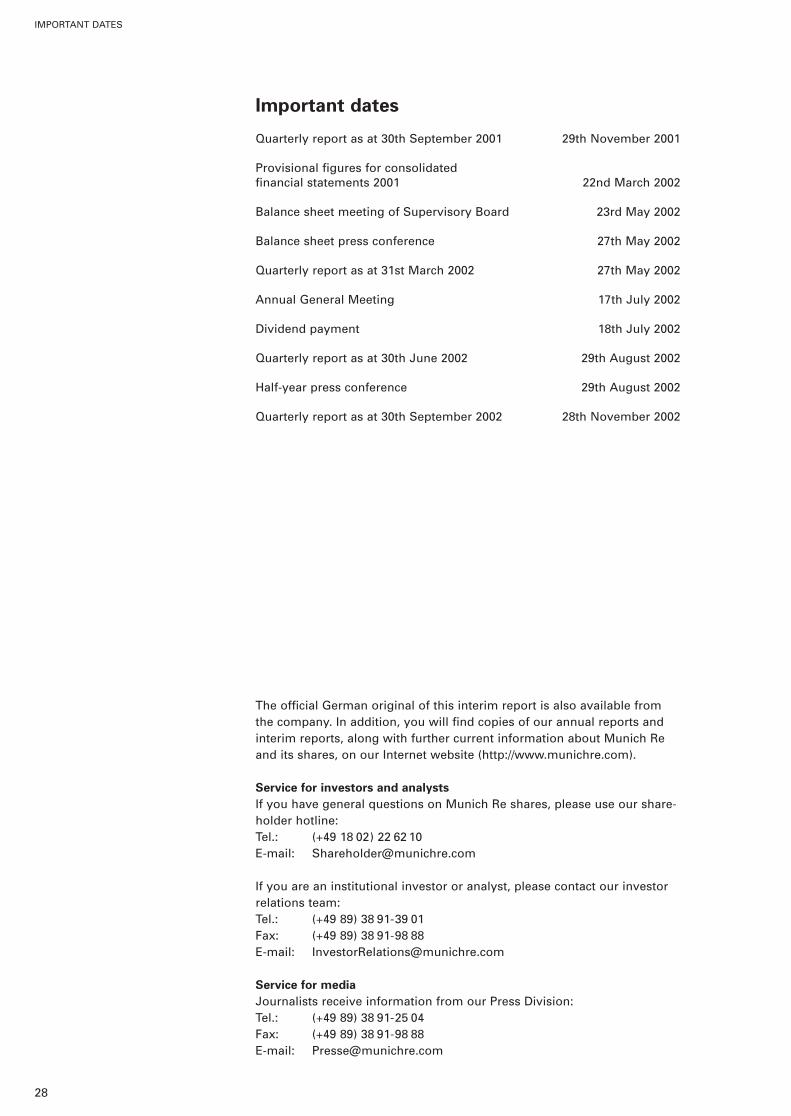
Important dates
Quarterly report as at 30th September 2001 29th November 2001
Provisional figures for consolidatedfinancial statements 2001 22nd March 2002
Balance sheet meeting of Supervisory Board 23rd May 2002
Balance sheet press conference 27th May 2002
Quarterly report as at 31st March 2002 27th May 2002
Annual General Meeting 17th July 2002
Dividend payment 18th July 2002
Quarterly report as at 30th June 2002 29th August 2002
Half-year press conference 29th August 2002
Quarterly report as at 30th September 2002 28th November 2002
The official German original of this interim report is also available fromthe company. In addition, you will find copies of our annual reports andinterim reports, along with further current information about Munich Reand its shares, on our Internet website (http://www.munichre.com).
Service for investors and analysts
If you have general questions on Munich Re shares, please use our share-holder hotline:Tel.: (+49 18 02) 22 62 10E-mail: [email protected]
If you are an institutional investor or analyst, please contact our investorrelations team:Tel.: (+49 89) 38 91-39 01Fax: (+49 89) 38 91-98 88E-mail: [email protected]
Service for media
Journalists receive information from our Press Division:Tel.: (+49 89) 38 91-25 04Fax: (+49 89) 38 91-98 88E-mail: [email protected]

© August 2001Münchener Rückversicherungs-GesellschaftKöniginstrasse 10780802 MünchenGermanyTel.: (0 89) 38 91- 0Fax: (0 89) 39 90 56http://www.munichre.comOrder number: 302-02988