Embed Size (px)
Citation preview
SILESIAN UNIVERSITY OF TECHNOLOGY GLIWICE 2020
ORGANIZATION & MANAGEMENT
SCIENTIFIC QUARTERLY
No. 1(49)
PATRONAT
Rada Naukowa
Przewodnicząca Rady Naukowej
Prof. dr hab. Agata STACHOWICZ-STANUSCH, Polska
Honorowi członkowie
Mary C. GENTILE, USA
Prof. James A.F. STONER, USA
Prof. Andrzej KARBOWNIK, Polska
Prof. Charles WANKEL, USA
Członkowie
Prof. Wolfgang AMANN, USA
Prof. dr hab. Mariusz BRATNICKI, Polska
Prof. Manuela BRUSONI, Włochy
Prof. Jan BRZÓSKA, Polska
Prof. Sergey D. BUSHUYEV, Ukraina
Prof. Helena DESIVILYASYNA, Izrael
Prof. Hans Krause HANSEN, Dania
Dr hab. Izabela JONEK-KOWALSKA, Polska
Prof. Matthias KLEINHAMPEL, Argentyna
Dr hab. inż. Lilla KNOP, Polska
Prof. Gianluigi MANGIA, Włochy
Prof. Adela McMURRAY, Australia
Dr hab. Radosław MIŚKIEWICZ, Polska
Prof. Kenneth MØLBJERG-JØRGENSEN, Dania
Prof. dr hab. Maria NOWICKA-SKOWRON, Polska
Prof. Nikos PASSAS, USA
Prof. Stanislav POLOUČEK, Republika Czeska
Prof. Pedro RIESGO, Hiszpania
Dr hab. Agnieszka SITKO-LUTEK, Polska
Prof. Marco TAVANTI, USA
Prof. Marian TUREK, Polska
Prof. Radha RANI SHARMA, Indie
Dr hab. inż. Radosław WOLNIAK, Polska
Dr hab. Krzysztof ZAMASZ, Polska
Komitet Redakcyjny
Redaktor Naczelny – dr hab. inż. Krzysztof WODARSKI
Zastępca Redaktora Naczelnego – prof. dr hab. Agata STACHOWICZ-STANUSCH, dr inż. Aneta ALEKSANDER
Sekretarz Redakcji – mgr Anna HORZELA, mgr Monika STĘPIEŃ, mgr Alina BROL
Sekretarz ds. promocji – dr hab. inż. Jolanta BIJAŃSKA
Redaktor wydawniczy – mgr Andrzej SMOGULSKI
Redaktor statystyczny – dr Anna MĘCZYŃSKA
Redakcja językowa – GROY TRANSLATIONS
Redaktorzy tematyczni
Prof. dr hab. inż. Józef BENDKOWSKI
Prof. dr hab. inż. Małgorzata GABLETA
Dr hab. inż. Izabela JONEK-KOWALSKA
Prof. dr hab. inż. Andrzej KARBOWNIK
Prof. dr hab. inż. Jerzy LEWANDOWSKI
Prof. dr hab. Krystyna LISIECKA
Dr hab. inż. Magdalena PICHLAK
Prof. dr hab. inż. Jan STACHOWICZ
http://oamquarterly.polsl.pl/
http://www.polsl.pl/Wydzialy/ROZ/Strony/Kwartalnik_Naukowy.aspx
email: [email protected]
ISSN 1899-6116
DOI: 10.29119/1899-6116.2020.49
Wersją pierwotną Kwartalnika Naukowego „Organizacja i Zarządzanie” jest wersja papierowa
CONTENTS
1. Achilleas BARLAS, Yeoryios STAMBOULIS, Alkiviadis VLEIORAS –
The role of user engagement in electronic word-of-mouth and online performance … 5
2. Yanina DYMITROWSKA – Effectiveness of a national resource fund
in counteracting the resource curse …………………………………………………… 23
3. Bożena GAJDZIK – Consumption of steel in Poland – quantity analysis in time ….. 41
4. Tomasz GRZEGORCZYK – A company’s proactive marketing orientation
in the high-tech sector ………………………………………………………………… 57
5. Jarosław JAMROZY, Krzysztof WODARSKI, Barbara SORYCHTA-
WOJSCZYK – The research of project maturity in mining service enterprises
in Poland ……………………………………………………………………………… 71
6. Anna MAZIARCZYK – Global financial crises, profitability and outsourcing
in industrial companies in Poland …………………………………………………….. 87
7. Katarzyna PIWOWAR-SULEJ – Human resource management in the context
of Industry 4.0 ………………………………………………………………………… 103
8. Bartosz SOBOTKA – Support for delocalisation processes by local authorities
with a view to sustainable development ……………………………………………… 115
9. Aleksandra SYNOWIEC – Global competence: a prerequisite for a global labor
market and a challenge for education ………………………………………………… 129
10. Olga ZWARDOŃ-KUCHCIAK, Agnieszka LIPIŃSKA-GROBELNY –
Personnel selection methods and the employee's labour market ……………………... 139

Scientific Quarterly “Organization and Management”, 2020, Vol. 1, No. 49; DOI: 10.29119/1899-6116.2020.49.1 www.oamquarterly.polsl.pl
THE ROLE OF USER ENGAGEMENT IN ELECTRONIC 1
WORD-OF-MOUTH AND ONLINE PERFORMANCE 2
Achilleas BARLAS1*, Yeoryios STAMBOULIS2, and Alkiviadis VLEIORAS3 3
1 University of Thessaly, Department of Economics; [email protected], ORCID: 0000-0002-8266-0138 4 2 University of Thessaly, Department of Economics; [email protected], ORCID: 0000-0003-0122-4404 5
3 University of Thessaly, Department of Economics; [email protected], ORCID: 0000-0001-8150-5948 6 * Correspondence author 7
Abstract: Being a member of social media channels involves the use of many engagement 8
activities, including reposting content, commenting on posts and expressing interest. Online 9
user engagement has been proposed to encourage various positively-valenced interactions 10
between consumers and online brands, with electronic Word-Of-Mouth being one of the most 11
significant. Despite the extensive research that has been carried out in the field of social media, 12
the number of quantitative studies exploring the effects of the various factors that affect the 13
performance of a social media channel is still limited. This study examines the relationship 14
between online user engagement and eWOM, also addressing the effects on user interaction 15
advertisement results. The data set was provided by a large YouTube music channel and, 16
in contrast with other similar studies, the data extracted from YouTube analytics that represent 17
actual user values. All insights were selected from a 6-year period. During this time, almost 500 18
music videos were uploaded. In total, 83 831 subscribers were included in the data set. 19
Statistical analyses showed that user engagement significantly affects eWOM. Accordingly, 20
the role of eWOM in organic results, such as views and number of subscribers, was verified. 21
Finally, a significant mediating role of eWOM in the relationship between user engagement and 22
advertisement results was reported. The results of the current study are highly important for 23
administrators of social media video channels, as they provide enough information on how to 24
develop their promotional strategy and how to best manage the content they want to upload. 25
Keywords: Social Media, eWOM, YouTube, User Engagement. 26
1. Introduction 27
The rise of the Internet has created online forums, social media and communities which 28
have increased the scope and implications of electronic Word-of-Mouth (eWoM) for customers 29
and firms (Dwyer, 2007; Kozinets et al., 2010; Malthouse et al., 2013). The technological 30
advances presented by social networking and the sites of firms result in more access to massive 31
audiences, with the possibility of identifying and establishing regular, direct and customised 32
interactions (Tahir M. Nisar et al., 2018). The resulting interactions, participation and sharing 33
6 A. Barlas, Y. Stamboulis, A. Vleioras
have led to several changes in the way market agents view and use technology, as well as 1
provide new innovative methods for selling products and services (Dellarocas, 2003; Spaulding, 2
2010). While it is one thing to simply read or follow a social media post, making the decision 3
to publicly contribute your reaction or opinion in response to the post indicates that 4
an individual is more invested, aware and attentive (i.e. more engaged) with the content. 5
This ability to act, interact and co-create online, as a key characteristic of online media, 6
distinguishes it from other media platforms (Ksiazek et al., 2016). These researchers theorise 7
a continuum of engagement, from exposure to interactivity, where more (quantity) and better 8
(quality) ways to interact with content and with other users indicate deeper engagement. 9
Given the possibility that consumers now directly interact with companies on social media, 10
several important theoretical and empirical questions arise: What happens if consumers engage 11
with a company on social media, such as commenting on its Facebook posts? Does it make 12
a financial difference if consumers leave positive or negative comments on a company’s social 13
media posts? How can a company tell that its social media marketing is working? (Yoon et al., 14
2018). In general, it is important for a company with a social media channel to understand how 15
the user engages with the content and if all this leads to positive word-of-mouth and the creation 16
of new users and impressions. 17
YouTube is one of the largest media platforms used for music and video sharing. 18
Researchers have examined a diverse set of consequences of eWoM, e.g. brand purchase 19
probability (East, Hammond, and Lomax, 2008), a tendency to recommend (Liu, 2006), 20
involvement (Muniz, and O’Guinn, 2001), product adoption (Algesheimer, and Wangenheim, 21
2006; Thompson and Sinha, 2008) and feedback on products and services (Grégoire, Laufer, 22
and Tripp, 2010; Hennig-Thurau, 2004). Similarly, several studies have examined the 23
antecedents of eWoM, e.g. affective characteristics of the message (Berger, and Milkman, 24
2012), relational factors (Chu, and Kim, 2011) and individual traits (Mowen, Park, and Zablah, 25
2007). The main objective of the current study is to examine the relationship between online 26
user engagement and eWOM, also addressing the effects on user interaction advertisement 27
results. Most of the existing literature has used either qualitative data (e.g. online texts) or 28
questionnaires for their research. In contrast, in the current study, the data set has been extracted 29
from original YouTube insights and represents objective values. 30
At the beginning, the paper examines the current state of research in the field of User 31
Engagement and eWOM. In terms of the research method, a data set was extracted from original 32
YouTube insights, so as to construct variables that represent the three main constructs: user 33
engagement, eWOM and performance. After filtering the raw data set that came from YouTube 34
insights, six main variables were extracted. eWOM (Shares), Engagement (Likes and 35
Comments), Subscribers, Views and Ad Impressions have been put into the data set. Linear, 36
multiple and regression with a mediation effect have been used as models to examine the role 37
of both eWOM and Engagement and confirm the main hypothesis that eWOM grows 38
exponentially when affected by the engagement a user has with the content. Moreover, it has 39
The role of user engagement… 7
been hypothesised that eWOM plays a significant role as a predictor in the number of 1
subscribers and video views and as a mediator between User Engagement and the number of 2
Advertisements Impressions. After confirming the initial hypotheses, the managerial 3
implications the research has in a social media strategy and other organisations have been 4
acknowledged, and future research topics, such as examining various combinations of social 5
media channels, have been proposed. 6
2. Literature Review 7
2.1. Brand and community engagement 8
Brand engagement, as described by Mollen and Wilson (2010), is divided into consumer 9
engagement: “the cognitive and affective commitment to an active relationship with the brand 10
as personified by the website or other computer-mediated entities designed to communicate 11
brand value”; and online brand engagement, which is far more expressive than online 12
involvement, as it involves an interactive relationship between the customer and the product 13
that he/she engages with. 14
By focusing on the user-brand engagement and how the brand marketing strategy affects 15
customer behaviour, a theory states that engagement is an alignment between the customer and 16
the goals of the firm (Van Doorn et al., 2010). Depicting this in the media industry, engagement 17
is the willingness of both the brand and the fan of the brand to promote a positive feeling about 18
a product. Brands with increased equity are more likely to accommodate higher levels of 19
engagement (Van Doorn et al., 2010). High customer engagement can support brands to attract 20
new customers and keep old customers (Wangenheim, and Bayón, 2007). Community 21
engagement refers to the positive perceptions and feedback of members to their participation in 22
activities held by the community (Algesheimer, Dholakia, and Herrmann, 2005). Such activities 23
include both online activities (shares, likes, etc.) and offline activities (meeting in the physical 24
world). Engagement in “a specialised, non-geographically bound, online community, based on 25
social communications and relationships among a brand’s consumers” (De Valck et al., 2009) 26
could be considered as an important area of research, since the nature of online communities 27
has still not been fully documented. 28
2.2. Social Media Engagement 29
In social media, engagement is a measure of an individual’s cognitive response, personal or 30
emotional connection and/or actions (Li, Berens, and de Maertelaere, 2013). After creating 31
a social media post, engagement can occur in various ways (shares, likes, comments), 32
contributing to the positive effect of a brand’s product. Studies found a significant and positive 33
8 A. Barlas, Y. Stamboulis, A. Vleioras
relationship between a firm’s social media marketing strategies and users’ consumption and 1
contribution of engagement, indicating the importance of social media marketing efforts in 2
engaging users online (Mishra, 2019). 3
Acquiring user interest is vital for companies to expand their customer base, but it is also 4
important to build up long-term “user loyalty” in order to prevent current customers from 5
becoming dissatisfied and leaving (Kwon, and Wen, 2010). When interacting with customers 6
over the Internet, Ryan and Jones (2012) suggest effective social media marketing is based on 7
subtle consumer engagement and “leaving the sledgehammer approach to product promotion at 8
home”. This is mainly the result of successful customer care instead of forced advertising. 9
Social media can assist in the the humanisation of a brand by connecting the product with 10
customers and giving it a greater personality (Ellison, Steinfield, and Lampe, 2007). 11
This is important, as social media is effective due to its two-way communication (Grieve et al., 12
2013). Chaffey and Ellis-Chadwick (2012) have also addressed the policy of brands that 13
motivate social media users to express themselves and the success in using the wisdom of the 14
crowd to answer their business problems. 15
Social media allows brands to discover exactly what customers are interested in and then 16
use this information to tailor their products and services in order to meet those needs 17
(Chen, Lu, Wang, Zhao, and Li, 2013; Choi, and Bazarova, 2015). They can be defined as the 18
“umbrella term for the web-based software and services that allow users to come together online 19
and exchange, discuss, communicate and participate in any form of social interaction” 20
(Ryan, and Jones, 2012) and is one of the central features of Web 2.0, allowing for greater 21
interaction between groups of people over the Internet (Chen et al., 2013; Cheung et al., 2011; 22
Choi, and Bazarova, 2015). The emergence of social media has dramatically influenced 23
marketing practices. Conventional, well-established marketing practices are not highly 24
influential anymore and, in many cases, can backfire on a firm (Fournier, and Avery, 2011; 25
Hennig-Thurau, Hofacker, and Bloching, 2013). Therefore, there is an ever-increasing need for 26
updating the understanding of social media and to further develop knowledge which suits the 27
imperatives of marketing in social media environments (Hennig-Thurau et al., 2013). One main 28
challenge for marketers has been to see how their efforts can pay off and how their social media 29
activities can influence important brand related variables (Hoffman, and Fodor, 2010). 30
Being a member of social media communities involves the use of various expressive 31
activities, including posting content by oneself, reposting content from others, commenting on 32
others’ posts and messaging with others. 33
The content, valence and volume of conversations about a brand or a topic among 34
consumers can be a good proxy for their preferences and hence a predictor of important 35
performance variables, such as sales or the performance of a brand (Asur, and Huberman, 2010; 36
Kumar, Bhaskaran, Mirchandani, and Shah, 2013; Sonnier, McAlister, and Rutz, 2011). 37
Word-of-mouth (Kumar et al., 2013), positive and neutral comments (Sonnier et al., 2011) and 38
The role of user engagement… 9
the volume of content about a brand (Asur, and Huberman, 2010) are the main factors that affect 1
them the most. 2
User behaviour can be categorised depending on the amount of content that someone 3
produces during his interaction with a community. Past studies have indicated that posting 4
frequency, the timing of posting, message modality and message appeal may influence the 5
effectiveness of content management. In contrast to advertising on traditional media, such as 6
TV, which mainly aims to increase exposure, the marketing practice on social media often has 7
dual goals: generating business exposure and managing brand relationship with consumers. 8
2.3. WoM and eWoM 9
Word-Of-mouth (WOM) has a major influence on consumer purchase decisions, especially 10
in the case of new products for which awareness needs to be created and product information 11
must be distributed on the consumer side (Engel, Kegerreis, and Blackwell, 1969; Katz, and 12
Lazarsfeld, 1955; Mahajan, Muller, and Kerin, 1984). Particularly in experience goods like 13
music, WOM has been tagged as the most crucial element of long-term success and is of 14
minimal cost (De Vany, and Walls, 1999; Tirunillai, and Tellis, 2012). 15
Electronic Word-Of-Mouth (eWOM) has long been considered an influential marketing 16
instrument (Bickart, and Schindler, 2001; Kumar, and Benbasat, 2006; Zhang, Craciun, and 17
Shin, 2010). Consumers search for information posted by previous customers in order to make 18
themselves comfortable before purchasing products or services (Pitta, and Fowler, 2005). 19
The Internet has provided several appropriate platforms for eWOM, such as blogs, discussion 20
forums, review websites, shopping websites and, lastly, social media websites (Cheung, and 21
Thadani, 2012). Previous studies have found the influence of eWOM via these sources on the 22
purchasing intentions of consumers (Bickart, and Schindler, 2001; Chan, and Ngai, 2011; Park, 23
Lee, and Han, 2007; See-To, and Ho, 2014). 24
People are now able to exchange opinions and experiences about products or services with 25
their friends and acquaintances on social media (Chu, and Kim, 2011; Kozinets, de Valck, 26
Wojnicki, and Wilner, 2010). This reduced anonymity has the potential to make eWOM 27
information more trustworthy and reliable (Chu, and Choi, 2011; Wallace, Walker, Lopez, and 28
Jones, 2009). Indeed, since conversations in social media frequently refer to brands (Wolny, 29
and Mueller, 2013), they are naturally influential on the purchasing intentions of consumers 30
(Wang, Yu, and Wei, 2012). However, it is difficult to envisage all eWOM information as being 31
influential on these intentions. Owing to the vast amount of information which consumers are 32
exposed to, they need to critique and screen the information before using it. 33
The effects of electronic Word-Of-Mouth (eWOM) in virtual brand communities may also 34
be significant (De Valck et al., 2009), as recommendations can occur at virtually no cost and 35
spread rapidly, both within and beyond the virtual brand community. Chatterjee’s (2001) 36
findings support the applicability of specific WOM dynamics of traditional, offline contexts in 37
online environments. For instance, consumers are more likely to search for, and accept, 38
10 A. Barlas, Y. Stamboulis, A. Vleioras
especially negative eWOM when they lack information and experience (Richins, and Bloch, 1
1991). Chevalier and Mayzlin (2006) also report that the number of readers of online book 2
reviews may affect book sales, with negative reviews having a larger detrimental effect on sales 3
than positive reviews. However, since positive eWOM is an important determinant of purchase 4
intention (Farzin, and Fattahi, 2018), examining the triggers of positive eWOM calls for focused 5
attention on more research. 6
Online channels now allow people to widely share their opinions and experiences on 7
products through self-created content, with full geographical and temporal freedom (Jansen 8
et al., 2009). Different studies have dealt with the motivations behind user contributions and 9
have linked them to the wish to enhance influence and status, as well as the intention to help 10
other members of a community by offering meaningful input (Hennig-Thurau et al., 2004). 11
Research has further shown the tremendous influence of user-generated content (UGC) on 12
consumer decision-making. Findings provide evidence that consumers tend to prefer product 13
reviews from peers compared to reviews from professionals (Dellarocas, Zhang, and Awad, 14
2007; Smith, Menon, and Sivakumar, 2005). 15
Numerous studies have investigated the impact of eWOM on product sales in various 16
contexts. Most of the current studies have examined the triggers to use eWOM in social media, 17
either conceptually (Sijoria et al., 2018, 2019) or by using consumer surveys and opinions 18
(Sijoria et al., 2019). Preliminary focus has been placed on assessing the effects of volume, 19
valence and dispersion of UGC on consumer decisions. The volume describes the amount of 20
generated content, whereas valence deals with the sentiment of this content (positive or 21
negative). Dispersion is related to the variance across all generated content regarding a specific 22
product/topic. Findings in the movie industry seem to be contradictory, where some studies find 23
valence to be the most influential driver for the success of a movie instead of volume when 24
focusing on the sequential product rollout typical for the entertainment industry (Chintagunta, 25
Gopinath, and Venkataraman, 2010). The positive correlation between user and critic ratings is 26
also rather low, encouraging the intention to investigate the impact of user-generated opinions 27
instead of those by professionals (Dellarocas et al., 2007). Previous studies in the creative 28
industry point towards a positive effect of the volume of eWOM on product sales (Duan, Gu, 29
and Whinston, 2008; Yong, 2006). The increase of awareness through the high presence of 30
a topic in online media positively affects sales. This relationship has been mostly addressed by 31
looking at the volume of reviews about a product. Some recent studies limit this positive effect 32
of eWOM volume, claiming there is no significant relationship or sales do explain volume and 33
not the other way round (Jungho, and Byung-Do, 2013; Roschk, and Große, 2013). These 34
studies suggest that volume can only influence the success of niche items, for which there is 35
a higher need to create awareness, and this effect is only present in the first week after the 36
release of a movie. 37
38
The role of user engagement… 11
2.4. The role of user engagement in eWoM 1
Consumer engagement with eWOM communication refers to customer behaviours that 2
“go beyond transactions and may be specifically defined as a customer’s behavioural 3
manifestations that have a brand or firm focus, beyond purchase, resulting from motivational 4
drivers” (Van Doorn et al., 2010, p. 254). This encompasses participation in eWOM-related 5
activities, including initiating and sharing brand reviews, recommendations and referrals 6
(Van Doorn et al., 2010). Such activities are derived through consumers’ co-creation of value 7
to self and others and inspire consumer experience (Brodie et al., 2011; Liou et al., 2016). 8
This experience positively affects user engagement with eWoM, with its effects differentiating 9
across communities for products and services and across their influence on ‘likes’ and 10
‘comments’ (Rossmann, Ranjan, Sugathan, 2016). 11
Taking an integrative approach, engagement was recently proposed to encompass various 12
positively-valenced interactions between consumers and brands on three dimensions: cognitive, 13
emotional and behavioural (Hollebeek, Glynn, and Brodie, 2014). The cognitive dimension 14
refers to the level of brand-related thought processing and elaboration in a consumer/brand 15
interaction. The emotional dimension relates to the extent of a desirable brand-related effect in 16
a consumer/brand interaction. The behavioural brand engagement dimension accounts for the 17
consumer activation process and refers to the time spent and effort invested by consumers 18
during their brand-related activities (Hollebeek et al., 2014). In regard to digital social media, 19
the behavioural dimension of consumer engagement with eWOM is of special interest, because 20
SNS facilitates immediate and virtually costless engagement activities. Consumer engagement 21
with eWOM on social media entails social interaction through receiving, commenting, liking 22
or passing along product-related information to their social connections (Interactive 23
Advertising Bureau, 2009). This often involves the consumer action of sharing experiences with 24
others. This may result in a significant social benefit to consumers – the reinforcement of social 25
relationships (Van Doorn et al., 2010). In general, it is hypothesised that content that creates 26
user interaction, such as likes and shares, leads to eWOM. Each user, due to these actions, 27
spreads his or her state to their network of friends and contacts. 28
2.5. The effect of eWoM on performance 29
As a rule, there is a push relation between positive comments, credibility and purchase 30
intentions. A positive comment has a positive impact on credibility and influences purchase 31
intention (Chih et al., 2013). The customers’ positive eWOM is relevant to their brand 32
purchases observed through sales performance (e.g. Babić et al., 2016; East et al., 2008; 33
Pescher, Reichhart, and Spann, 2014). Similarly, the customers’ negative eWOM is relevant to 34
their retention performance, such as service disconnections (e.g. Vázquez-Casielles, Suárez- 35
Álvarez, and del Río-Lanza, 2013). Xue and Phelps (2004) found that the eWOM platform to 36
which a review is posted (an independent online forum versus a corporate website), by itself, 37
12 A. Barlas, Y. Stamboulis, A. Vleioras
did not influence brand attitudes. In the current study, it is hypothesised that content shared 1
from users (eWOM) increases the number of posts views, as well as the number of subscribers, 2
due to new visits. Finally, the eWOM could potentially enhance the income from advertisement 3
due to the increasing of advertisement views (impressions). 4
3. Method 5
The data was obtained by using the insights of a YouTube music channel and represents 6
actual inputs from user interaction. All insights were selected from a 6-year period. During this 7
time, almost 500 music videos were uploaded. The channel administrators provided all the 8
necessary authorisation to use the current data set. 9
3.1. The channel 10
Data was obtained from a YouTube channel specialising in electronic music, featuring 11
songs from producers from all over the world, but mainly from South Africa. It began activity 12
in 2011 and, at the time of writing, has uploaded more than 3 000 videos with more than 13
190 000 subscribers and 125 000 000 views. 14
3.2. Procedure and Data set 15
After receiving the appropriate authorisation from channel’s administrators, an Excel file 16
containing the raw data from the channel’s insights was delivered to the researchers. 17
The data set was cleaned of any unnecessary variables. The new data set consisted of the 18
following variables: Views, Ad Impressions (as shown by the YouTube algorithm), Likes, 19
Shares, Comments and Subscribers. Comments and Likes were considered as User Engagement 20
variables, while Shares represented the eWoM variable. For the needs of the study, the data set 21
with inputs from 242 (N = 242) different country cases was selected. In total, 83 831 subscribers 22
were included in the data. The final data set was then extracted into an SPSS statistics package. 23
4. Results 24
Simple linear regression analysis was conducted to predict (H1) the variability of electronic 25
WoM based on the contribution of user engagement. Multiple regression analysis was 26
conducted to examine (Η2) the variability of several subscribers and video views based on the 27
contribution of eWoM. Finally, linear regression analysis with the mediation effect was 28
conducted to examine (Η3) the variability of Advertisements Impressions based on the 29
The role of user engagement… 13
contribution of user engagement by examining the mediation effect of eWoM. Regression 1
analyses where obtained as the more appropriate to assess any significant prediction of the 2
dependent variables (eWOM and performance metrics) from the independent ones 3
(User Engagement and eWOM), as well as exploring the mediating prediction effect of eWOM. 4
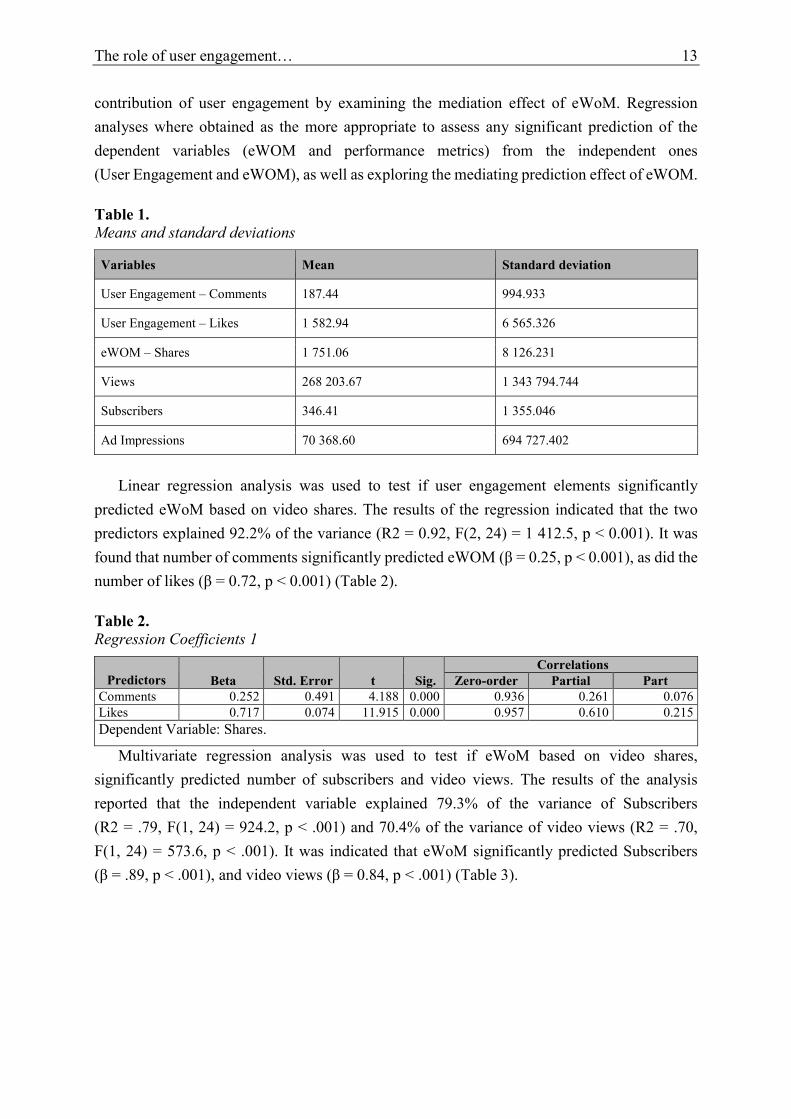
Table 1. 5 Means and standard deviations 6
Variables Mean Standard deviation
User Engagement – Comments 187.44 994.933
User Engagement – Likes 1 582.94 6 565.326
eWOM – Shares 1 751.06 8 126.231
Views 268 203.67 1 343 794.744
Subscribers 346.41 1 355.046
Ad Impressions 70 368.60 694 727.402
7
Linear regression analysis was used to test if user engagement elements significantly 8
predicted eWoM based on video shares. The results of the regression indicated that the two 9
predictors explained 92.2% of the variance (R2 = 0.92, F(2, 24) = 1 412.5, p < 0.001). It was 10
found that number of comments significantly predicted eWOM (β = 0.25, p < 0.001), as did the 11
number of likes (β = 0.72, p < 0.001) (Table 2). 12
Table 2. 13 Regression Coefficients 1 14
Predictors Beta Std. Error t Sig.
Correlations
Zero-order Partial Part
Comments 0.252 0.491 4.188 0.000 0.936 0.261 0.076
Likes 0.717 0.074 11.915 0.000 0.957 0.610 0.215
Dependent Variable: Shares.
Multivariate regression analysis was used to test if eWoM based on video shares, 15
significantly predicted number of subscribers and video views. The results of the analysis 16
reported that the independent variable explained 79.3% of the variance of Subscribers 17
(R2 = .79, F(1, 24) = 924.2, p < .001) and 70.4% of the variance of video views (R2 = .70, 18
F(1, 24) = 573.6, p < .001). It was indicated that eWoM significantly predicted Subscribers 19
(β = .89, p < .001), and video views (β = 0.84, p < .001) (Table 3). 20
21
14 A. Barlas, Y. Stamboulis, A. Vleioras
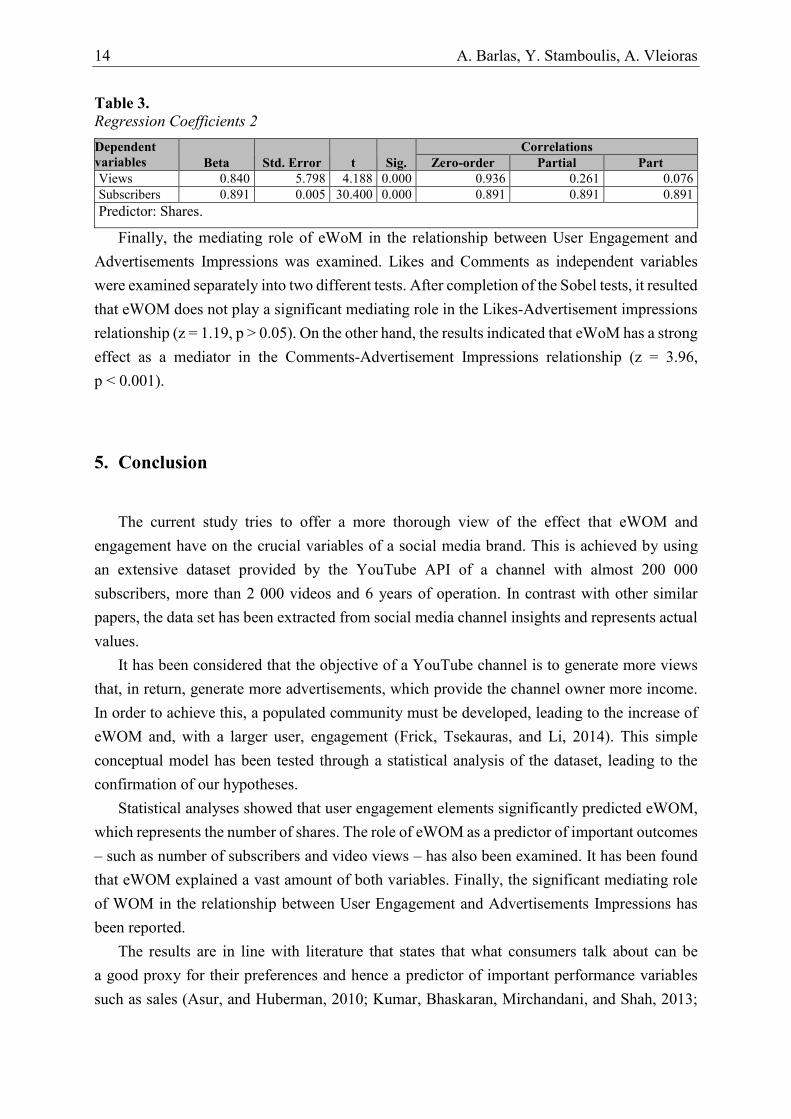
Table 3. 1 Regression Coefficients 2 2
Dependent
variables Beta Std. Error t Sig.
Correlations
Zero-order Partial Part
Views 0.840 5.798 4.188 0.000 0.936 0.261 0.076
Subscribers 0.891 0.005 30.400 0.000 0.891 0.891 0.891
Predictor: Shares.
Finally, the mediating role of eWoM in the relationship between User Engagement and 3
Advertisements Impressions was examined. Likes and Comments as independent variables 4
were examined separately into two different tests. After completion of the Sobel tests, it resulted 5
that eWOM does not play a significant mediating role in the Likes-Advertisement impressions 6
relationship (z = 1.19, p > 0.05). On the other hand, the results indicated that eWoM has a strong 7
effect as a mediator in the Comments-Advertisement Impressions relationship (z = 3.96, 8
p < 0.001). 9
5. Conclusion 10
The current study tries to offer a more thorough view of the effect that eWOM and 11
engagement have on the crucial variables of a social media brand. This is achieved by using 12
an extensive dataset provided by the YouTube API of a channel with almost 200 000 13
subscribers, more than 2 000 videos and 6 years of operation. In contrast with other similar 14
papers, the data set has been extracted from social media channel insights and represents actual 15
values. 16
It has been considered that the objective of a YouTube channel is to generate more views 17
that, in return, generate more advertisements, which provide the channel owner more income. 18
In order to achieve this, a populated community must be developed, leading to the increase of 19
eWOM and, with a larger user, engagement (Frick, Tsekauras, and Li, 2014). This simple 20
conceptual model has been tested through a statistical analysis of the dataset, leading to the 21
confirmation of our hypotheses. 22
Statistical analyses showed that user engagement elements significantly predicted eWOM, 23
which represents the number of shares. The role of eWOM as a predictor of important outcomes 24
– such as number of subscribers and video views – has also been examined. It has been found 25
that eWOM explained a vast amount of both variables. Finally, the significant mediating role 26
of WOM in the relationship between User Engagement and Advertisements Impressions has 27
been reported. 28
The results are in line with literature that states that what consumers talk about can be 29
a good proxy for their preferences and hence a predictor of important performance variables 30
such as sales (Asur, and Huberman, 2010; Kumar, Bhaskaran, Mirchandani, and Shah, 2013; 31
The role of user engagement… 15
Sonnier et al., 2011). Many researchers showed that spreading WOM (Kumar et al., 2013), 1
positive and neutral comments (Sonnier et al., 2011) and the volume of content about a brand 2
(Asur, and Huberman, 2010) enhance the sales and performance of a brand. Consumer 3
involvement with brand-related user-generated content enhances brand equity (Christodoulides, 4
Jevons, and Bonhomme, 2012), and involvement in co-creation of value enhances the transfer 5
of WOM and purchase intentions (See-To, and Ho, 2014). Finally, the current research 6
outcomes support the findings of Rossmann et al. (2016), who reported that user engagement 7
has a positive effect on eWOM for various brands. 8
6. Managerial implications 9
The results of the current study are highly important for companies or artists in the field of 10
social media promotion, as they provide the interested parties with enough information on how 11
to develop their promotion strategy and how to best manage the content they want to upload. 12
Videos (or content in general) should create the need for the user (or client) to interact with the 13
content or post. This leads to a larger number of likes, shares and comments, and then to 14
an augmented number of views and thus advertisements. 15
7. Future Research 16
The results of the current study should not be generalised, as they represent insights only 17
from a specific music YouTube channel. Users could possibly engage and interact in a different 18
way through other social media platforms (such as Facebook or Instagram). The research on 19
the subject could be expanded by analysing the effect that sponsored posts have on the content. 20
This would enhance the ability to understand how paid promotion works on social media and 21
would provide a better understanding on how the advertiser could meet the KPIs set. 22
Furthermore, another point of interest could be an examination of the relationship between two 23
social media platforms. Do the social media communities of the same brand interact with each 24
other, and what is their correlation? With the rise and fall of various social media platforms, 25
it is difficult for a brand to maintain its interest in all their platforms, so there should be a more 26
insightful approach on brand community management. 27
28
16 A. Barlas, Y. Stamboulis, A. Vleioras
References 1
1. Algesheimer, R., and Wangenheim, F.V. (2006). A network based approach to customer 2
equity management. Journal of Relationship Marketing, 5(1), 39-57. doi: https://doi.org/ 3
10.1300/J366v05n01_04. 4
2. Algesheimer, R., Dholakia, U.M., and Herrmann, A. (2005). The social influence of brand 5
community: Evidence from European car clubs. Journal of marketing, 69(3), 19-34. 6
doi: 10.1300/J366v05n01_04. 7
3. Asur, S., and Huberman, B.A. (2010, August). Predicting the future with social media. 8
Proceedings of the 2010 IEEE/WIC/ACM International Conference on Web Intelligence 9
and Intelligent Agent Technology-Volume 01. IEEE Computer Society, (pp. 492-499). doi: 10
10.1109/WI-IAT.2010.63. 11
4. Babić Rosario, A., Sotgiu, F., De Valck, K., and Bijmolt, T. H. (2016). The effect of 12
electronic word of mouth on sales: A meta-analytic review of platform, product, and metric 13
factors. Journal of Marketing Research, 53(3), 297-318. doi: 10.1509/jmr.14.0380. 14
5. Berger, J., and Milkman, K.L. (2012). What makes online content viral? Journal of 15
marketing research, 49(2), 192-205. doi: 10.1509%2Fjmr.10.0353. 16
6. Bickart, B., and Schindler, R.M. (2001). Internet forums as influential sources of consumer 17
information. Journal of interactive marketing, 15(3), 31-40. doi: 10.1002/dir.1014. 18
7. Brodie, R.J., Hollebeek, L.D., Jurić, B., and Ilić, A. (2011). Customer engagement: 19
Conceptual domain, fundamental propositions, and implications for research. Journal of 20
service research, 14(3), 252-271. doi: 10.1177%2F1094670511411703. 21
8. Chan, Y.Y., and Ngai, E.W. (2011). Conceptualising electronic word of mouth activity: 22
An input-process-output perspective. Marketing Intelligence and Planning, 29(5), 488-516. 23
doi: 10.1108/02634501111153692. 24
9. Chatterjee, P. (2001) Online Reviews: Do Consumers Use Them? Advances in Consumer 25
Research, 28, 129-133. 26
10. Chen, A., Lu, Y., Wang, B., Zhao, L., and Li, M. (2013). What drives content creation 27
behavior on SNSs? A commitment perspective. Journal of Business Research, 66(12), 28
2529-2535. doi: 10.1016/j.jbusres.2013.05.045. 29
11. Cheung, C.M., and Thadani, D.R. (2012). The impact of electronic word-of-mouth 30
communication: A literature analysis and integrative model. Decision support systems, 31
54(1), 461-470. doi:10.1016/j.dss.2012.06.008. 32
12. Cheung, C.M., Chiu, P.Y., and Lee, M.K. (2011). Online social networks: Why do students 33
use facebook? Computers in Human Behavior, 27(4), 1337-1343. doi: 10.1016/ 34
j.chb.2010.07.028. 35
13. Chevalier, J.A., and Mayzlin, D. (2006). The effect of word of mouth on sales: Online book 36
reviews. Journal of marketing research, 43(3), 345-354. doi: 10.1509%2Fjmkr.43.3.345. 37
The role of user engagement… 17
14. Chih, W.H., Wang, K.Y., Hsu, L.C., and Huang, S.C. (2013). Investigating electronic word-1
of-mouth effects on online discussion forums: the role of perceived positive electronic 2
word-of-mouth review credibility. Cyberpsychology, Behavior, and Social Networking, 3
16(9), 658-668. doi: 10.1089/cyber.2012.0364. 4
15. Chintagunta, P.K., Gopinath, S., and Venkataraman, S. (2010). The effects of online user 5
reviews on movie box office performance: Accounting for sequential rollout and 6
aggregation across local markets. Marketing Science, 29(5), 944-957. doi:10.1287/ 7
mksc.1100.0572. 8
16. Choi, Y.H., and Bazarova, N.N. (2015). Self-disclosure characteristics and motivations in 9
social media: Extending the functional model to multiple social network sites. Human 10
Communication Research, 41(4), 480-500. doi: 10.1111/hcre.12053. 11
17. Christodoulides, G., Jevons, C., and Bonhomme, J. (2012). Memo to marketers: 12
Quantitative evidence for change: How user-generated content really affects brands. 13
Journal of advertising research, 52(1), 53-64. doi: 10.2501/JAR-52-1-053-064. 14
18. Chu, S.C., and Choi, S.M. (2011). Electronic word-of-mouth in social networking sites: 15
A cross-cultural study of the United States and China. Journal of Global Marketing, 24(3), 16
263-281. doi: 10.1080/08911762.2011.592461. 17
19. Chu, S.C., and Kim, Y. (2011). Determinants of consumer engagement in electronic word-18
of-mouth (eWOM) in social networking sites. International Journal of Advertising, 30(1), 19
47-75. doi: 10.2501/IJA-30-1-047-075. 20
20. De Valck, K., Van Bruggen, G.H., and Wierenga, B. (2009). Virtual communities: 21
A marketing perspective. Decision support systems, 47(3), 185-203. doi: 10.1016/ 22
j.dss.2009.02.008. 23
21. De Vany, A., and Walls, W.D. (1999). Uncertainty in the movie industry: Does star power 24
reduce the terror of the box office? Journal of cultural economics, 23(4), 285-318. 25
doi: 10.1023/A:1007608125988. 26
22. Dellarocas, C. (2003). The digitization of word of mouth: promise and challenges of online 27
feedback mechanisms. Management Science, 49(10), 1407-1424. doi: 10.1287/mnsc. 28
49.10.1407.17308. 29
23. Dellarocas, C., Zhang, X.M., and Awad, N.F. (2007). Exploring the value of online product 30
reviews in forecasting sales: The case of motion pictures. Journal of Interactive Marketing, 31
21(4), 23-45. doi:10.1002/dir.20087. 32
24. Duan, W., Gu, B., and Whinston, A.B. (2008). Do online reviews matter? An empirical 33
investigation of panel data. Decision support systems, 45(4), 1007-1016. doi: 10.1016/ 34
j.dss.2008.04.001. 35
25. Dwyer, P. (2007). Measuring the value of electronic word of mouth and its impact in 36
consumer communities. Journal of Interactive Marketing, 21(2), 63-79. doi: 10.1016/ 37
j.ijresmar.2008.04.001. 38
18 A. Barlas, Y. Stamboulis, A. Vleioras
26. East, R., Hammond, K., and Lomax, W. (2008). Measuring the impact of positive and 1
negative word of mouth on brand purchase probability. International journal of research in 2
marketing, 25(3), 215-224. doi: 10.1016/j.ijresmar.2008.04.001. 3
27. Ellis-Chadwick, F., and Chaffey, D. (2012). Digital Marketing: Strategy, Implementation 4
and Practice. Pearson. 5
28. Ellison, N.B., Steinfield, C., and Lampe, C. (2007). The benefits of Facebook “friends:” 6
Social capital and college students’ use of online social network sites. Journal of computer-7
mediated communication, 12(4), 1143-1168. doi: 10.1111/j.1083-6101.2007.00367.x. 8
29. Engel, J.F., Kegerreis, R.J., and Blackwell, R.D. (1969). Word-of-mouth communication 9
by the innovator. Journal of Marketing, 33(3), 15-19. doi: 10.1177%2F00222429 10
6903300303. 11
30. Farzin, M., and Fattahi, M. (2018). eWOM through social networking sites and impact on 12
purchase intention and brand image in Iran. Journal of Advances in Management Research, 13
15(2), 541-553. doi: 10.1108/JAMR-05-2017-0062. 14
31. Fournier, S., and Avery, J. (2011). The uninvited brand. Business horizons, 54(3), 193-207. 15
doi: 10.1016/j.bushor.2011.01.001. 16
32. Frick, T., Tsekauras, D., and Li, T. (2014). The times they are a-changin: Examining the 17
impact of social media on music album sales and piracy. In Annual Meeting of the Academy 18
of Management, Philadelphia, PA. doi: 10.5465/ambpp.2014.16984abstract. 19
33. Grégoire, Y., Laufer, D., and Tripp, T.M. (2010). A comprehensive model of customer 20
direct and indirect revenge: Understanding the effects of perceived greed and customer 21
power. Journal of the Academy of Marketing Science, 38(6), 738-758. doi: 10.1007/s11747-22
009-0186-5. 23
34. Grieve, R., Indian, M., Witteveen, K., Tolan, G.A., and Marrington, J. (2013). Face-to-face 24
or Facebook: Can social connectedness be derived online? Computers in human behavior, 25
29(3), 604-609. doi: 10.1016/j.chb.2012.11.017. 26
35. Hennig-Thurau, T., Gwinner, K.P., Walsh, G., and Gremler, D.D. (2004). Electronic word-27
of-mouth via consumer-opinion platforms: what motivates consumers to articulate 28
themselves on the internet?. Journal of interactive marketing, 18(1), 38-52. doi: 10.1002/ 29
dir.10073. 30
36. Hennig-Thurau, T., Hofacker, C.F., and Bloching, B. (2013). Marketing the pinball way: 31
understanding how social media change the generation of value for consumers and 32
companies. Journal of Interactive Marketing, 27(4), 237-241. doi: 10.1016/ 33
j.intmar.2013.09.005. 34
37. Hoffman, D.L., and Fodor, M. (2010). Can you measure the ROI of your social media 35
marketing? MIT Sloan management review, 52(1), 41. 36
38. Hollebeek, L.D., Glynn, M.S., and Brodie, R.J. (2014). Consumer brand engagement in 37
social media: Conceptualization, scale development and validation. Journal of interactive 38
marketing, 28(2), 149-165. doi:10.1016/j.intmar.2013.12.002. 39
The role of user engagement… 19
39. Jansen, B.J., Zhang, M., Sobel, K., and Chowdury, A. (2009). Twitter power: Tweets as 1
electronic word of mouth. Journal of the American society for information science and 2
technology, 60(11), 2169-2188. doi: 10.1002/asi.21149. 3
40. Katz, E., Lazarsfeld, P.F., and Roper, E. (2017). Personal influence: The part played by 4
people in the flow of mass communications. Routledge. doi: 10.4324/9781315126234. 5
41. Kozinets, R.V., De Valck, K., Wojnicki, A.C., and Wilner, S.J. (2010). Networked 6
narratives: Understanding word-of-mouth marketing in online communities. Journal of 7
Marketing, 74(2), 71-89. doi: 10.1509%2Fjm.74.2.71. 8
42. Ksiazek, T.B., Peer, L., and Lessard, K. (2016). User engagement with online news: 9
Conceptualizing interactivity and exploring the relationship between online news videos 10
and user comments. New Media & Society, 18(3), 502-520. doi: 10.1177/ 11
1461444814545073. 12
43. Kumar, N., and Benbasat, I. (2006). Research note: the influence of recommendations and 13
consumer reviews on evaluations of websites. Information Systems Research, 17(4), 14
425-439. doi: 10.1287/isre.1060.0107. 15
44. Kumar, V., Bhaskaran, V., Mirchandani, R., and Shah, M. (2013). Practice prize winner—16
creating a measurable social media marketing strategy: increasing the value and ROI of 17
intangibles and tangibles for hokey pokey. Marketing Science, 32(2), 194-212. 18
doi: 10.1287/mksc.1120.0768. 19
45. Kwon, O., and Wen, Y. (2010). An empirical study of the factors affecting social network 20
service use. Computers in human behavior, 26(2), 254-263. doi: 10.1016/j.chb. 21
2009.04.011. 22
46. Li, T., Berens, G., and de Maertelaere, M. (2013). Corporate Twitter channels: The impact 23
of engagement and informedness on corporate reputation. International Journal of 24
Electronic Commerce, 18(2), 97-126. doi:10.2753/JEC1086-4415180204. 25
47. Liou, D.K., Chih, W.H., Yuan, C.Y., and Lin, C.Y. (2016). The study of the antecedents of 26
knowledge sharing behavior: The empirical study of Yambol online test community. 27
Internet Research, 26(4), 845-868. doi: 10.1108/IntR-10-2014-0256. 28
48. Liu, Y. (2006). Word of mouth for movies: Its dynamics and impact on box office revenue. 29
Journal of Marketing, 70(3), 74-89. doi:10.1509%2Fjmkg.70.3.074. 30
49. Mahajan, V., Muller, E., and Kerin, R.A. (1984). Introduction strategy for new products 31
with positive and negative word-of-mouth. Management Science, 30(12), 1389-1404. 32
doi: 10.1287/mnsc.30.12.1389. 33
50. Malthouse, E.C., Haenlein, M., Skiera, B., Wege, E., and Zhang, M. (2013). Managing 34
customer relationships in the social media era: Introducing the social CRM house. Journal 35
of Interactive Marketing, 27(4), 270-280. doi: 10.1016/j.intmar.2013.09.008. 36
51. Mishra, A.S. (2019). Antecedents of consumers’ engagement with brand-related content on 37
social media. Marketing Intelligence & Planning, 37(4), 386-400. doi:10.1108/MIP-04-38
2018-0130. 39
20 A. Barlas, Y. Stamboulis, A. Vleioras
52. Mollen, A., and Wilson, H. (2010). Engagement, telepresence and interactivity in online 1
consumer experience: Reconciling scholastic and managerial perspectives. Journal of 2
business research, 63(9-10), 919-925. doi: 10.1016/j.jbusres.2009.05.014. 3
53. Mowen, J.C., Park, S., and Zablah, A. (2007). Toward a theory of motivation and 4
personality with application to word-of-mouth communications. Journal of business 5
research, 60(6), 590-596. doi: 10.1016/j.jbusres.2006.06.007. 6
54. Muniz, A.M., and O'guinn, T.C. (2001). Brand community. Journal of consumer research, 7
27(4), 412-432. doi:10.1086/319618. 8
55. Nisar, T.M., Prabhakar, G., Ilavarasan, P.V. and Baabdullah, A.M. (2019). Up the ante: 9
electronic word of mouth and its effects on firm reputation and performance. Journal of 10
Retailing and Consumer Services, 53. doi.org:10.1016/j.jretconser.2018.12.010. 11
56. Park, D.H., Lee, J., and Han, I. (2007). The effect of on-line consumer reviews on consumer 12
purchasing intention: The moderating role of involvement. International journal of 13
electronic commerce, 11(4), 125-148. doi: 10.2753/JEC1086-4415110405. 14
57. Pescher, C., Reichhart, P., and Spann, M. (2014). Consumer decision-making processes in 15
mobile viral marketing campaigns. Journal of interactive marketing, 28(1), 43-54. 16
doi: 10.1016/j.intmar.2013.08.001. 17
58. Pitta, D.A., and Fowler, D. (2005). Internet community forums: an untapped resource for 18
consumer marketers. Journal of Consumer Marketing, 22(5), 265-274. doi: 10.1108/ 19
07363760510611699. 20
59. Richins, M.L., and Bloch, P.H. (1991). Post-purchase product satisfaction: Incorporating 21
the effects of involvement and time. Journal of Business Research, 23(2), 145-158. 22
doi: 10.1016/0148-2963(91)90025-S. 23
60. Roschk, H., and Grosse, S. (2013). Talking about films: Word-of-mouth behavior and the 24
network of success determinants of motion pictures. Journal of Promotion Management, 25
19(3), 299-316. doi: 10.1080/10496491.2013.770810. 26
61. Rossmann, A., Ranjan, K.R., and Sugathan, P. (2016). Drivers of user engagement in 27
eWoM communication. Journal of Services Marketing, 30(5), 541-553. doi:10.1108/JSM-28
01-2015-0013. 29
62. Ryan, D. (2016). Understanding digital marketing: marketing strategies for engaging the 30
digital generation. Kogan Page Publishers. 31
63. See-To, E.W., and Ho, K.K. (2014). Value co-creation and purchase intention in social 32
network sites: The role of electronic Word-of-Mouth and trust–A theoretical analysis. 33
Computers in Human Behavior, 31, 182-189. doi: 10.1016/j.chb.2013.10.013. 34
64. Sijoria, C., Mukherjee, S., and Datta, B. (2018). Impact of the antecedents of eWOM on 35
CBBE. Marketing Intelligence & Planning, 36(5), 528-542. doi:10.1108/MIP-10-2017-36
0221. 37
The role of user engagement… 21
65. Sijoria, C., Mukherjee, S., and Datta, B. (2019). Impact of the antecedents of electronic 1
word of mouth on consumer based brand equity: a study on the hotel industry. Journal of 2
Hospitality Marketing & Management, 28(1), 1-27. doi:10.1080/19368623.2018.1497564. 3
66. Smith, D., Menon, S., and Sivakumar, K. (2005). Online peer and editorial 4
recommendations, trust, and choice in virtual markets. Journal of interactive marketing, 5
19(3), 15-37. doi: 10.1002/dir.20041. 6
67. Sonnier, G.P., McAlister, L., and Rutz, O.J. (2011). A dynamic model of the effect of online 7
communications on firm sales. Marketing Science, 30(4), 702-716. doi: 10.1287/ 8
mksc.1110.0642. 9
68. Spaulding, T.J. (2010). How can virtual communities create value for business? Electronic 10
Commerce Research and Applications, 9, 38-49. doi:10.1016/j.elerap.2009.07.004. 11
69. Thompson, S.A., and Sinha, R.K. (2008). Brand communities and new product adoption: 12
The influence and limits of oppositional loyalty. Journal of marketing, 72(6), 65-80. 13
doi:10.1509%2Fjmkg.72.6.065. 14
70. Tirunillai, S., and Tellis, G.J. (2012). Does chatter really matter? Dynamics of user-15
generated content and stock performance. Marketing Science, 31(2), 198-215. doi:10.1287/ 16
mksc.1110.0682. 17
71. Van Doorn, J., Lemon, K.N., Mittal, V., Nass, S., Pick, D., Pirner, P., and Verhoef, P.C. 18
(2010). Customer engagement behavior: Theoretical foundations and research directions. 19
Journal of service research, 13(3), 253-266. doi: 10.1177%2F1094670510375599. 20
72. Vázquez-Casielles, R., Suárez-Álvarez, L., and Del Rio-Lanza, A.B. (2013). The word of 21
mouth dynamic: How positive (and negative) WOM drives purchase probability: 22
An analysis of interpersonal and non-interpersonal factors. Journal of Advertising 23
Research, 53(1), 43-60. doi: 10.2501/JAR-53-1-043-060. 24
73. Wallace, D., Walker, J., Lopez, T., and Jones, M. (2009). Do word of mouth and advertising 25
messages on social networks influence the purchasing behavior of college students? Journal 26
of Applied Business Research, 25(1), 101-9. doi:10.19030/jabr.v25i1.1052. 27
74. Wang, X., Yu, C., and Wei, Y. (2012). Social media peer communication and impacts on 28
purchase intentions: A consumer socialization framework. Journal of interactive marketing, 29
26(4), 198-208. doi:10.1016/j.intmar.2011.11.004. 30
75. Wangenheim, F.V., and Bayón, T. (2007). The chain from customer satisfaction via word-31
of-mouth referrals to new customer acquisition. Journal of the Academy of Marketing 32
Science, 35(2), 233-249. doi:10.1007/s11747-007-0037-1. 33
76. Wolny, J., and Mueller, C. (2013). Analysis of fashion consumers’ motives to engage in 34
electronic word-of-mouth communication through social media platforms. Journal of 35
Marketing Management, 29(5-6), 562-583. doi: 10.1080/0267257X.2013.778324. 36
77. Xue, F., and Phelps, J.E. (2004). Internet-facilitated consumer-to-consumer 37
communication: The moderating role of receiver characteristics. International journal of 38
internet marketing and advertising, 1(2), 121-136. doi: 10.1504/IJIMA.2004.004016. 39

22 A. Barlas, Y. Stamboulis, A. Vleioras
78. Yoon, G., Li, C., Ji, Y., North, M., Hong, C., and Liu, J. (2018). Attracting Comments: 1
Digital Engagement Metrics on Facebook and Financial Performance. Journal of 2
Advertising, 47(1), 24-37. doi: 10.1080/00913367.2017.1405753. 3
79. Zhang, J.Q., Craciun, G., and Shin, D. (2010). When does electronic word-of-mouth matter? 4
A study of consumer product reviews. Journal of Business Research, 63(12), 1336-1341. 5
doi: 10.1016/j.jbusres.2009.12.011. 6
Scientific Quarterly “Organization and Management”, 2020, Vol. 1, No. 49; DOI: 10.29119/1899-6116.2020.49.2 www.oamquarterly.polsl.pl
EFFECTIVENESS OF A NATIONAL RESOURCE FUND 1
IN COUNTERACTING THE RESOURCE CURSE 2
Yanina DYMITROWSKA 3
Poznań University of Economics and Business, Department of Macroeconomics and Development Research; 4 [email protected], ORCID: 0000-0002-2772-5971 5
Abstract: The objective of this article is to identify indicators that allow for assessing the 6
effectiveness of resource funds in the context of the resource curse occurrence in countries rich 7
in natural resources. At particular stages of the study, several research tasks were also carried 8
out, which made it possible to achieve the goal – the concept of the resource fund was 9
conceptualised, the types and functions of the fund were presented, the individual objectives of 10
creating funds were assigned to the symptoms of the resource curse, the concept of the resource 11
fund was referred to the sovereign wealth funds, and a system resource fund operates was also 12
introduces. 13
Keywords: resource fund, resource curse, economic development, resource rich countries, 14
Sovereign Wealth Fund. 15
1. Introduction 16
The development issues of countries rich in natural resources1 are important and actual, 17
because many wealthy economies struggle with a resource curse2. The paradox of plenty is 18
a phenomenon of achieving worse results of economic development by countries specialising 19
in the extraction and export of natural resources compared to countries whose resources are 20
negligible, which commonly occurs (i.a. Auty, 2001; Sachs, and Warner, 2001; Neumayer, 21
2004; Bulte et al., 2005; Arezki, and van der Ploeg, 2007; Dymitrowska, 2015). In recent years, 22
due to the fall and volatility of prices of strategically important natural resources, such as oil 23
and natural gas, the problem is becoming more and more serious. The resource curse is not 24
1 In this study, a country rich in natural resources is treated unambiguously with the concept of a country
specialising in the extraction and export of natural resources and a country whose economy is based on the
extraction and export of natural resources. At the same time, it is assumed that a country rich in natural resources
is a country in which one of these conditions is met: the average annual revenues of the mining industry
(in % of GDP) exceed 25%, or 25% of the average annual exports are natural resources. More on this subject in:
Dymitrowska, 2015, p. 50. 2 Other common nomenclature in literature – paradox of plenty, curse of natural resources, curse of wealth.
24 Y. Dymitrowska
a law, but a strong tendency seen in many, but not all, countries exporting natural resources. 1
Botswana, Chile, Indonesia, Malaysia, United Arab Emirates, Canada and Australia are 2
mentioned in literature as countries that managed to avoid the curse (e.g. Auty, 1993; Sarraf, 3
and Jiwanji, 2001; Acemoglu et al., 2001; Rasiah, and Shari, 2001; Fasano, 2002; Wright, and 4
Czelusta, 2002; Larsen, 2005; Stevens, 2003a, 2003b; Stijns, 2005; Dymitrowska, 2015). 5
Norway is the undisputed leader in the ranking of beneficiaries of abundance of natural 6
resources. Based on an analysis of the economic policies used in these countries, some tools 7
can be identified as important in counteracting the resource curse. One of the measures is the 8
active policy of the National Resources Fund (NRF). 9
Many forms of funds have been created in recent years, and some countries have benefited 10
significantly from their creation. An often-mentioned fund as an example of great success is the 11
Government Pension Fund Global of Norway (i.a. Mikesell, 1997; Usui, 1997; Fasano, 2000; 12
Frankel, 2010). At the same time, it should be noted that in many developing countries, natural 13
resource funds have poor efficiency (e.g. Davis et al., 2001). Therefore, scientists’ opinions on 14
the importance of natural resource funds for the economic development of countries rich in 15
natural resources are divided. Some researchers pay attention to the fact that the tasks carried 16
out by the fund can be effectively performed through active state fiscal policy (e.g. Davis et al., 17
2001; Ossowski et al., 2008), and the resource fund, as one of the national stabilisation tools, 18
is characterised by weak efficiency. Others (e.g. Devlin, and Lewen, 2002; Shabsigh, and Ilahi, 19
2007; Bagattini, 2011; Asik, 2017) see a positive relation between the activity of the NRF and 20
counteracting the paradox of plenty. Still others question the possibility of using the tool 21
effectively in those poorest countries rich in natural resources (e.g. Dymitrowska, 2015). 22
There is also no unanimity as to the methodology for assessing the effectiveness of funds. 23
Due to the use of different assessment criteria and divergent interpretations of the concept of 24
the natural resource fund, the research results are ambiguous. In addition, it should be noted 25
that the funds created in individual exporters of natural resources differ in terms of their 26
functions, and the assumptions of the fund’s activities change over time. There is no generally 27
accepted rule regarding the method of creation and management of the NRF enabling its 28
effective functioning. Therefore, a significant research gap is visible in the field of issues related 29
to the national natural resource fund and assessment of the fund’s effectiveness in counteracting 30
the resource curse. 31
The main goal of this study is to distinguish indicators that allow for assessing the 32
effectiveness of natural resource funds in the context of the resource curse in countries rich in 33
natural resources. To achieve the goal, a number of research tasks have also been defined. 34
These include: conceptualisation of the concept of an NRF, an indication of the types and 35
functions of the fund, linking the individual tasks of the fund with signs of the resource curse, 36
referring the concept of the NRF to sovereign wealth funds and presenting a system resource 37
fund operates. 38
Effectiveness of a national resource fund… 25
The article consists of three parts, preceded by an introduction, and is summarised by main 1
conclusions. The initial part presents the essence of the natural resource fund in the context of 2
the paradox of plenty. Critical analysis of current scientific achievements has allowed the author 3
to organise issues related to the NRF. The concept of the fund was also conceptualised. 4
The motives for creating the fund and its types were described. Additionally, a general scheme 5
describing how the fund functions was proposed. The second part analyses various 6
methodologies and research results regarding the assessment of the effectiveness of an NRF in 7
countries rich in natural resources. The last part refers to individual functions of the resource 8
fund to the symptoms of the resource curse and presents the author’s list of indicators relevant 9
for assessing the effectiveness of natural resource funds in relation to individual functions and 10
the tasks performed by them. 11
The study is theoretical. To prepare the article, foreign literature in English was mostly 12
used. Materials provided by international organisations (including the World Bank, 13
International Monetary Fund, International Forum of Sovereign Wealth Funds, Natural 14
Resource Governance Institute, International Forum of Sovereign Wealth Funds) were also 15
used. 16
2. Essence of the National Resource Fund 17
One of the main reasons for the resource curse in countries rich in natural resources is the 18
volatility of commodity prices. In a situation where a country’s economy is heavily dependent 19
on revenues from their exports of natural resources, any sharp change in the price on the 20
international natural resources market causes a collapse on the domestic market. It is 21
noteworthy that the rapid increase in commodity prices also negatively affects the economic 22
situation of their exporting country, contributing to the emergence of a Dutch disease and 23
resource curse in the long run3. 24
The first NRFs4 were created to stabilise the situation in a country rich in natural resources 25
and to create a kind of buffer between changes on the global and domestic market. Therefore, 26
in literature on the subject (Asik, 2017; Sugawara, 2017), the term stabilisation fund is often 27
used to refer to the NRF. The stabilising function of the natural resource fund is implemented 28
by setting a price limit for exported resources. If the price exceeds a certain threshold, the excess 29
3 Dutch disease is a phenomenon involving the reduction of competitiveness, both in the country and abroad (and
ultimately bankruptcy), of domestic enterprises from sectors not related to the dynamically developing mining
industry, leading to a quasi-recession and dependence of the country’s economy on the production and export of
natural resources (Corden and Neary, 1982). This is one of the main endogenous macroeconomic causes of the
resource curse. A detailed mechanism of action of the Dutch disease and resource curse was presented, among
others, in (Dymitrowska, 2015). 4 The first natural resource fund was established in 1953 in Kuwait (Sugawara, 2014).
26 Y. Dymitrowska
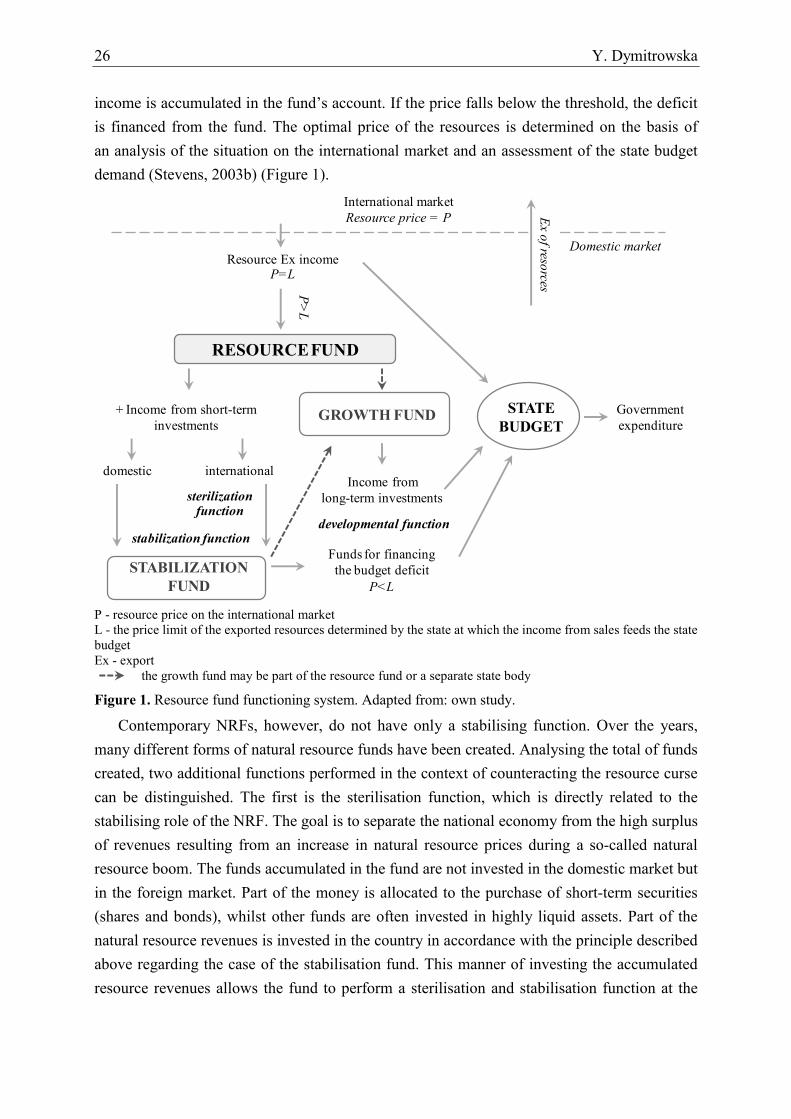
income is accumulated in the fund’s account. If the price falls below the threshold, the deficit 1
is financed from the fund. The optimal price of the resources is determined on the basis of 2
an analysis of the situation on the international market and an assessment of the state budget 3
demand (Stevens, 2003b) (Figure 1). 4
5 P - resource price on the international market 6
L - the price limit of the exported resources determined by the state at which the income from sales feeds the state 7
budget 8
Ex - export 9
the growth fund may be part of the resource fund or a separate state body 10
Figure 1. Resource fund functioning system. Adapted from: own study. 11
Contemporary NRFs, however, do not have only a stabilising function. Over the years, 12
many different forms of natural resource funds have been created. Analysing the total of funds 13
created, two additional functions performed in the context of counteracting the resource curse 14
can be distinguished. The first is the sterilisation function, which is directly related to the 15
stabilising role of the NRF. The goal is to separate the national economy from the high surplus 16
of revenues resulting from an increase in natural resource prices during a so-called natural 17
resource boom. The funds accumulated in the fund are not invested in the domestic market but 18
in the foreign market. Part of the money is allocated to the purchase of short-term securities 19
(shares and bonds), whilst other funds are often invested in highly liquid assets. Part of the 20
natural resource revenues is invested in the country in accordance with the principle described 21
above regarding the case of the stabilisation fund. This manner of investing the accumulated 22
resource revenues allows the fund to perform a sterilisation and stabilisation function at the 23
International market
Resource price = P
Resource Ex incomeP=L
P>
L
+ Income from short-term
investments
domestic international
stabilization function
Income from
long-term investments
Funds for financing
the budget deficit
P<L
STATE
BUDGET
Government
expenditure
developmental function
Ex o
f resorces
sterilizationfunction
Domestic market
RESOURCE FUND
GROWTH FUND
STABILIZATION
FUND
Effectiveness of a national resource fund… 27
same time, as it guarantees the quick recovery of money in the event of a drop in the prices of 1
natural resources and for covering the deficit created (Figure 1). 2
In recent years, among countries rich in natural resources, there is a trend to create a new 3
form of the fund that has a development function (in other words, long-term saving or saving) 4
(BRSP, 2006, p. 27). The so-called growth fund can only be part of the resource fund or 5
constitute an independent state body. The development function consists in allocating part or 6
all of the revenues from the sale of resources accumulated in the fund for long-term investments 7
in diversified foreign assets so that both present and future generations can benefit from the 8
national wealth (Figure 1). In the case of the growth fund and other forms of NRFs, it is 9
recommended to spend the least amount of export revenues in the country. An extreme case is 10
the allocation of only profits generated as a result of the fund’s long-term investment activities 11
to finance domestic investments. A radical form of the growth fund was used, for example, 12
in Norway, where the Government Pension Fund Global is one of the most profitable and 13
effective funds in the world. The long-term savings function, however, requires the formation 14
of appropriate institutional, political and social conditions in the country. Social phenomena, 15
such as a rent seeking, for example, often occurring in countries rich in natural resources, 16
can be a significant obstacle to the fund’s successful operation. In addition, the use of the 17
Norwegian form of the fund in the poorest countries seems impossible. It is difficult to convince 18
the citizens of a country that is lacking, for example, drinking water and food to set aside money 19
earned on the sale of resources for future generations. Often, such countries are not prepared to 20
create a fund due to the lack of an appropriate institutional framework and unstable political 21
situation. However, it should be noted that the growth fund as an element of a policy of the 22
national resource fund may constitute a so-called “window of opportunity”, enabling 23
diversification of the economy. Over time, the country may change its position on the 24
international market from an exporter of natural resources to an exporter of financial capital. 25
Reducing the level of dependence of economic development on the resource industry is one of 26
the main tasks to counter the resource curse. 27
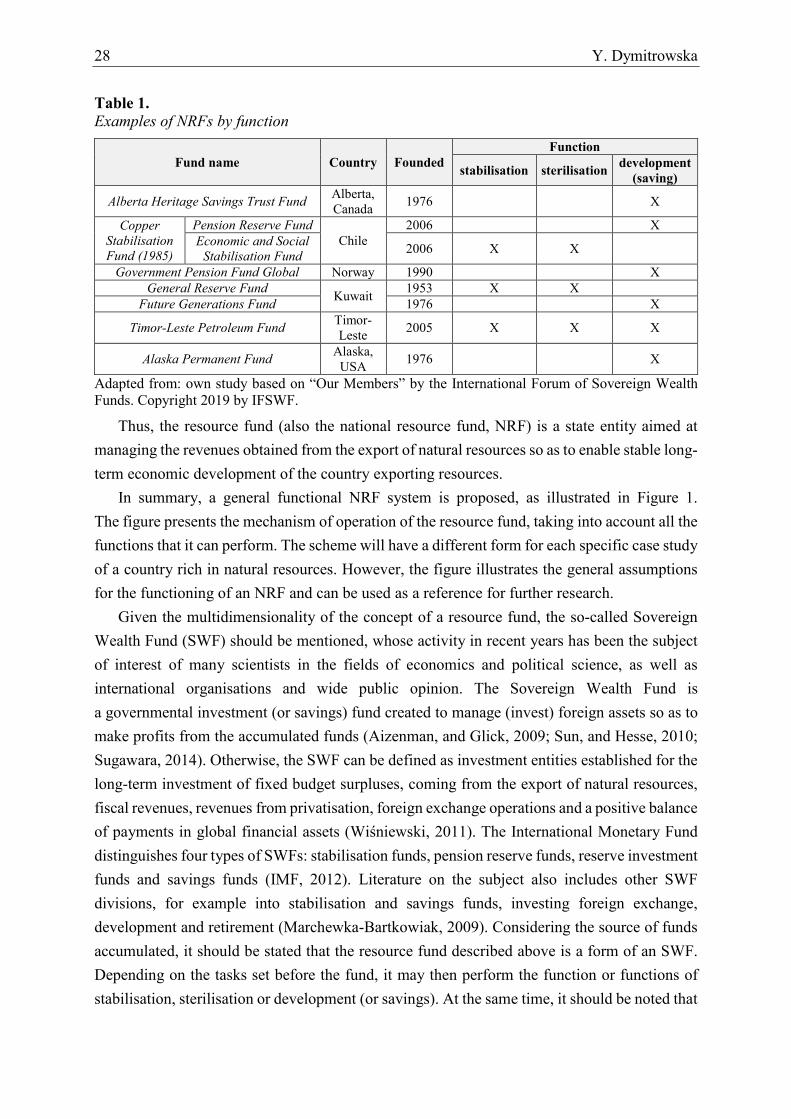
Table 1 presents examples of NRFs in accordance with their function/s. 28
From the information contained in Table 1, it follows that there is no one universal template 29
for a resource fund. The common feature of an NRF is, however, the fact that the owner and 30
entity managing the fund is the state, and the funds that are accumulated come from the sale of 31
natural resources. This is why it is appropriate to use the term resource fund, which is a multi-32
faceted term that combines both the concept of a stabilisation fund (including a sterilisation 33
function) and a growth fund. The term national resource fund is also appropriate due to the state 34
form of the fund and the domestic nature of natural resources. 35
36
28 Y. Dymitrowska
Table 1. 1 Examples of NRFs by function 2
Fund name Country Founded
Function
stabilisation sterilisation development
(saving)
Alberta Heritage Savings Trust Fund Alberta,
Canada 1976 X
Copper
Stabilisation
Fund (1985)
Pension Reserve Fund
Chile
2006 X
Economic and Social
Stabilisation Fund 2006 X X
Government Pension Fund Global Norway 1990 X
General Reserve Fund Kuwait
1953 X X
Future Generations Fund 1976 X
Timor-Leste Petroleum Fund Timor-
Leste 2005 X X X
Alaska Permanent Fund Alaska,
USA 1976 X
Adapted from: own study based on “Our Members” by the International Forum of Sovereign Wealth 3 Funds. Copyright 2019 by IFSWF. 4
Thus, the resource fund (also the national resource fund, NRF) is a state entity aimed at 5
managing the revenues obtained from the export of natural resources so as to enable stable long-6
term economic development of the country exporting resources. 7
In summary, a general functional NRF system is proposed, as illustrated in Figure 1. 8
The figure presents the mechanism of operation of the resource fund, taking into account all the 9
functions that it can perform. The scheme will have a different form for each specific case study 10
of a country rich in natural resources. However, the figure illustrates the general assumptions 11
for the functioning of an NRF and can be used as a reference for further research. 12
Given the multidimensionality of the concept of a resource fund, the so-called Sovereign 13
Wealth Fund (SWF) should be mentioned, whose activity in recent years has been the subject 14
of interest of many scientists in the fields of economics and political science, as well as 15
international organisations and wide public opinion. The Sovereign Wealth Fund is 16
a governmental investment (or savings) fund created to manage (invest) foreign assets so as to 17
make profits from the accumulated funds (Aizenman, and Glick, 2009; Sun, and Hesse, 2010; 18
Sugawara, 2014). Otherwise, the SWF can be defined as investment entities established for the 19
long-term investment of fixed budget surpluses, coming from the export of natural resources, 20
fiscal revenues, revenues from privatisation, foreign exchange operations and a positive balance 21
of payments in global financial assets (Wiśniewski, 2011). The International Monetary Fund 22
distinguishes four types of SWFs: stabilisation funds, pension reserve funds, reserve investment 23
funds and savings funds (IMF, 2012). Literature on the subject also includes other SWF 24
divisions, for example into stabilisation and savings funds, investing foreign exchange, 25
development and retirement (Marchewka-Bartkowiak, 2009). Considering the source of funds 26
accumulated, it should be stated that the resource fund described above is a form of an SWF. 27
Depending on the tasks set before the fund, it may then perform the function or functions of 28
stabilisation, sterilisation or development (or savings). At the same time, it should be noted that 29
Effectiveness of a national resource fund… 29
NRFs play a key role in Sovereign Wealth Funds, and their impact on the global financial 1
market is significant (Urban, 2017). According to data from the Sovereign Wealth Fund 2
Institute, the total assets of all SWFs in the world are approx. USD 7.912 billion, of which over 3
half are NRFs (SWFI, 2019). 4
3. The issue of assessing the effectiveness of NRFs in literature 5
Due to the significant impact of SWFs, in particular resource funds, on global financial 6
markets and because of their growing importance in the global economy, Sovereign Wealth 7
Funds are the subject of interest of many scientists (e.g. Devlin, and Lewin, 2005; Aizenman, 8
and Glick, 2009; Marchewka-Bartkowiak, 2009; Sun, and Hesse, 2010; Bagattini, 2011; 9
Balding, 2012; Barma, 2012; Sugawara, 2014; Asik, 2017; Urban, 2017). Part of the research 10
was focused on analysing the effectiveness of NRFs in the category of counteracting the 11
resource curse (including Fasano, 2000; Devlin, and Titman, 2004; Devlin, and Lewin, 2005; 12
Shabsigh, and Ilahi, 2007; Ossowski et al., 2008; Barma et al., 2012; Sugawara, 2014; 13
Dymitrowska, 2015; Asik, 2017). 14
In most of the work devoted to NRF issues, the effectiveness of the fund’s stabilisation 15
function is primarily examined. The methodology adopted in individual studies is varied, which 16
affects the differences in the results presented. Some studies focused on case studies of 17
individual countries, while others used data from a number of resource-rich countries. 18
For example, Fasano (2000) analysed six rich regions (Norway, Chile, Venezuela, Kuwait, 19
Oman and Alaska (USA)), assessing the effectiveness of NRFs based on an analysis of the 20
effectiveness of the isolation of domestic expenditure from export revenues of natural 21
resources. It was found that the results differ depending on the specific case of the country, 22
the adopted principles of the fund’s operation and the quality of the NRF policy. The importance 23
of the resource fund as a means of stabilising government spending in the group of resource-24
rich countries was also assessed in the work of Davis et al. (2001). The presented results are 25
not conclusive. While analysing the effectiveness of the stabilisation function of NRFs, 26
some researchers (e.g. Clemente et al., 2002; Merlevede et al., 2009) took into account, apart 27
from the manner of shaping government spending, the general stabilisation of the economic 28
situation in the country. Crain and Devlin (2002), analysing data on 71 countries in the years 29
1970-2000, took into account the level of government spending, as well as economic and 30
demographic results obtained in the studied economies. The positive impact of NRFs on 31
reducing the volatility of economic development, especially in countries specialising in oil 32
exports, was confirmed. Shabsigh and Ilahi (2007) also took into account changes in inflation 33
and the real exchange rate. The survey results confirm the negative impact of funds on the level 34
of the indicators analysed. In the work of Ossowski et al. (2008), three measures of fiscal results 35
30 Y. Dymitrowska
of the state were used: primary balance excluding results of the oil industry, increase in 1
government expenditure and ratio between changes in government expenditure and oil prices. 2
The results of the study are not conclusive. Attention was, however, paid to the importance of 3
institutional conditions (including stability of the political situation, level of corruption and rent 4
seeking) for effective operation of the NRF policy. It was found that the higher the quality of 5
institutions created in the country, the more stable the country’s economic situation. 6
The importance of the institutional framework under the issue of effective operation of 7
stabilisation funds was also highlighted in the study by Frankel, Vegh and Vuletin (2012). 8
Bagattini (2011) analysed 12 countries with functioning resource funds for the years 9
1992-2007 taking into account the indicator based on six variables: level and change in the 10
general budget balance, level and change in the budget balance without the participation of the 11
natural resource industry, change in non-resource revenues and change in public debt. 12
The presented results confirmed the effectiveness of NRFs as a means of counteracting the 13
instability of fiscal policy and the increase in the level of public debt. At work, as in the case of 14
Ossowski et al. (2008) and Frankel, Vegha and Vuletina (2012), attention was drawn to the 15
essence of political stability in the country and the quality of fund management, including 16
transparency and responsible operation of the NRF. 17
Sugawara (2014) set the main goal of his study to determine the importance of the 18
stabilisation fund in reducing the volatility of expenditure in countries rich in natural resources. 19
As a result of the analysis of 68 countries over a 25-year period, he found that the countries in 20
which the stabilisation fund was created are characterised by greater stability of government 21
spending. He also found that there was a negative relationship between the fund’s operation 22
and the lack of stability in total expenditure. In addition to assessing changes in government 23
expenditure and total expenditure, the study took into account the following categories: 24
the structure of the economy, economic management, the financial market and the political 25
institution. 26
Asik (2017) focused his attention on analysing the impact of funds on levelling the 27
instability of the economic situation in a resource-rich country and filling the counter-cyclical 28
nature of the state’s fiscal policy. After conducting the study, based on data from 29 countries 29
specialising in the export of crude oil for the years 1980-2012, he presented a conclusion 30
confirming the effectiveness of NRFs. The concept of efficiency referred to the degree of fiscal 31
countercyclicality, taking into account the goal of smoothing fiscal revenues and expenses by 32
creating a savings tool in the form of a resource fund. The following indicators were taken into 33
account: volatility of the level of real household consumption, real government expenditure, 34
as well as gross capital investment. An additional analysis was also carried out taking into 35
account the assessment of the premises for the creation of an NRF and the importance of the 36
institutional framework formed. An important proposal was also made to assess the nature of 37
changes in government spending. It was found that it is important to analyse whether the trend 38
of changes in spending is constant and does not depend on changes on the global natural 39
Effectiveness of a national resource fund… 31
resources market rather than assessing whether expenses are at a constant level, as economic 1
growth, often associated with increased state investment, is high in countries with significant 2
developmental demand. According to the author, it is important not to stop the increase in state 3
spending, but to maintain a stable trend of their changes. 4
When analysing literature on the subject of assessing the effectiveness of NRFs, 5
two documents developed in recent years should be mentioned. The first is the so-called 6
Santiago Principles. In 2009, due to the growing attention paid to SWF activities, a group of 7
23 leading global sovereign investors created the International Forum of Sovereign Wealth 8
Funds, a global non-profit organisation of sovereign wealth funds involved in cooperation and 9
strengthening SWF communities through dialogue, research and self-evaluation. During the 10
Summit in Chile in September 2008, the Forum, in cooperation with international institutions 11
such as the G20, the International Monetary Fund and the US Department of the Treasury, 12
distinguished 24 general principles and practices (Santiago Principles) that form the basis of 13
an effective SWF. The proposed rules are aimed at promoting good management, cost-14
effectiveness, transparency and prudent investment practices of the fund. The Santiago 15
Principles are guidelines that should be followed by the management board of an SWF in order 16
to maintain a stable global financial system, proper risk control and a sound fund management 17
structure (IWG, 2008). The proposed document contains rules regarding the operation of 18
Sovereign Wealth Funds. However, due to the fact that a significant part of SWFs are resource 19
funds, it is justified to include the Santiago Principles in the overall assessment of NRF 20
effectiveness. 21
As part of the analysis of the measures of the effectiveness of resource funds, the Natural 22
Resource Charter presented by the Natural Resource Governance Institute (NRGI, 2019) should 23
also be mentioned. The Charter is a set of principles developed upon the initiative of the 24
International Monetary Fund and the World Bank by a group of independent practitioners and 25
academic staff for governments and societies of countries rich in natural resources. 26
The document provides guidance on how to best use the opportunities created by the extraction 27
of resources for economic development. The assumptions presented in the Natural Resources 28
Charter concern the general principles of conducting a state’s economic policy aimed at 29
counteracting the resource curse. As with the Santiago Principles, they can, however, be useful 30
in assessing the effectiveness of NRFs in countries rich in natural resources. 31
Analysing literature on the subject devoted to the issue of the effectiveness of resource funds 32
in counteracting the resource curse, it should be confirmed that the results presented are 33
inconclusive, the adopted methodological assumptions are not uniform, and NRFs are often 34
evaluated solely in terms of fulfilling the stabilising function. Most studies mention the paradox 35
of plenty, but superficially, focusing primarily on the volatility of commodity prices and the 36
increase in budget spending as the main reasons for its occurrence. The resource curse is, 37
however, a complex and multidimensional phenomenon. It is important to refer individual 38
functions of the resource fund to the main symptoms of the paradox and then to determine the 39
indicators for assessing the effectiveness of an NRF. 40
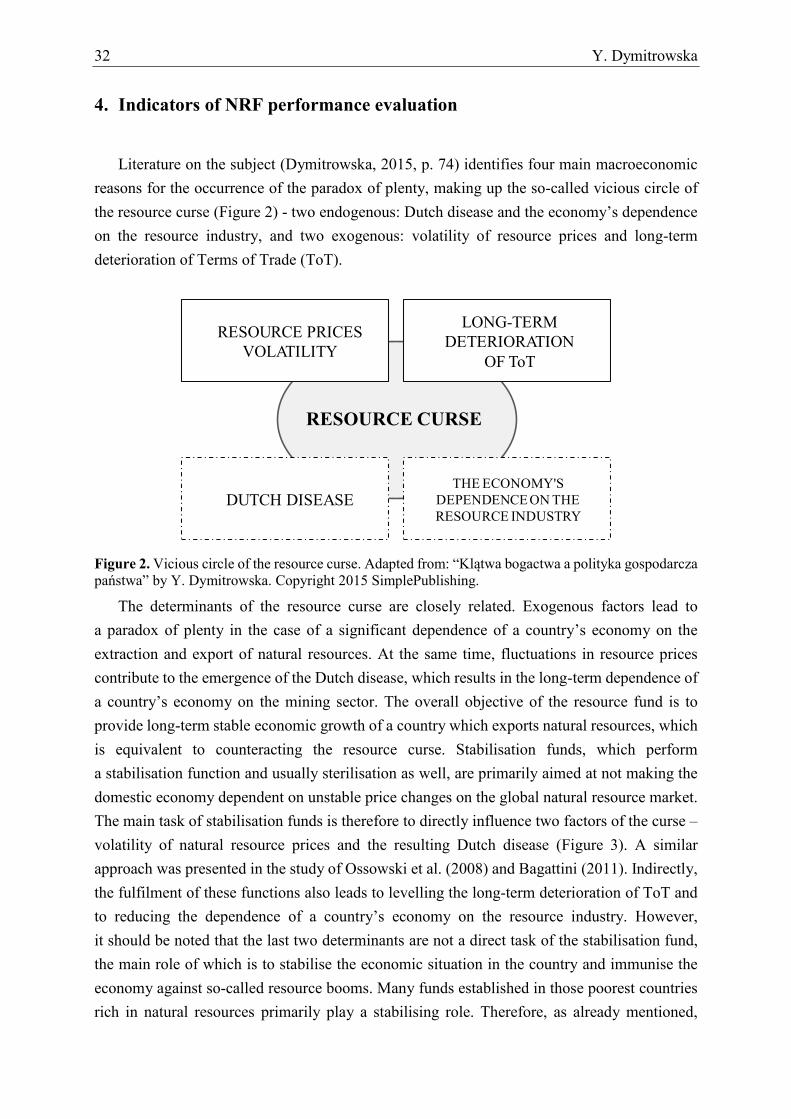
32 Y. Dymitrowska
4. Indicators of NRF performance evaluation 1
Literature on the subject (Dymitrowska, 2015, p. 74) identifies four main macroeconomic 2
reasons for the occurrence of the paradox of plenty, making up the so-called vicious circle of 3
the resource curse (Figure 2) - two endogenous: Dutch disease and the economy’s dependence 4
on the resource industry, and two exogenous: volatility of resource prices and long-term 5
deterioration of Terms of Trade (ToT). 6
7
8
Figure 2. Vicious circle of the resource curse. Adapted from: “Klątwa bogactwa a polityka gospodarcza 9 państwa” by Y. Dymitrowska. Copyright 2015 SimplePublishing. 10
The determinants of the resource curse are closely related. Exogenous factors lead to 11
a paradox of plenty in the case of a significant dependence of a country’s economy on the 12
extraction and export of natural resources. At the same time, fluctuations in resource prices 13
contribute to the emergence of the Dutch disease, which results in the long-term dependence of 14
a country’s economy on the mining sector. The overall objective of the resource fund is to 15
provide long-term stable economic growth of a country which exports natural resources, which 16
is equivalent to counteracting the resource curse. Stabilisation funds, which perform 17
a stabilisation function and usually sterilisation as well, are primarily aimed at not making the 18
domestic economy dependent on unstable price changes on the global natural resource market. 19
The main task of stabilisation funds is therefore to directly influence two factors of the curse – 20
volatility of natural resource prices and the resulting Dutch disease (Figure 3). A similar 21
approach was presented in the study of Ossowski et al. (2008) and Bagattini (2011). Indirectly, 22
the fulfilment of these functions also leads to levelling the long-term deterioration of ToT and 23
to reducing the dependence of a country’s economy on the resource industry. However, 24
it should be noted that the last two determinants are not a direct task of the stabilisation fund, 25
the main role of which is to stabilise the economic situation in the country and immunise the 26
economy against so-called resource booms. Many funds established in those poorest countries 27
rich in natural resources primarily play a stabilising role. Therefore, as already mentioned, 28
„„KLĄTWA BOGACTWA”
NIESTABILNOSĆ
CEN SUROWCÓW
DŁUGOTERMINOWE
POGARSZANIE SIĘ TOT
„CHOROBA
HOLENDERSKA”
UZALEŻNIENIE GOSPODARKI
OD BRANŻY SUROWCOWEJ
RESOURCE CURSE
RESOURCE PRICES
VOLATILITY
LONG-TERM
DETERIORATION
OF ToT
DUTCH DISEASETHE ECONOMY'S
DEPENDENCE ON THE
RESOURCE INDUSTRY
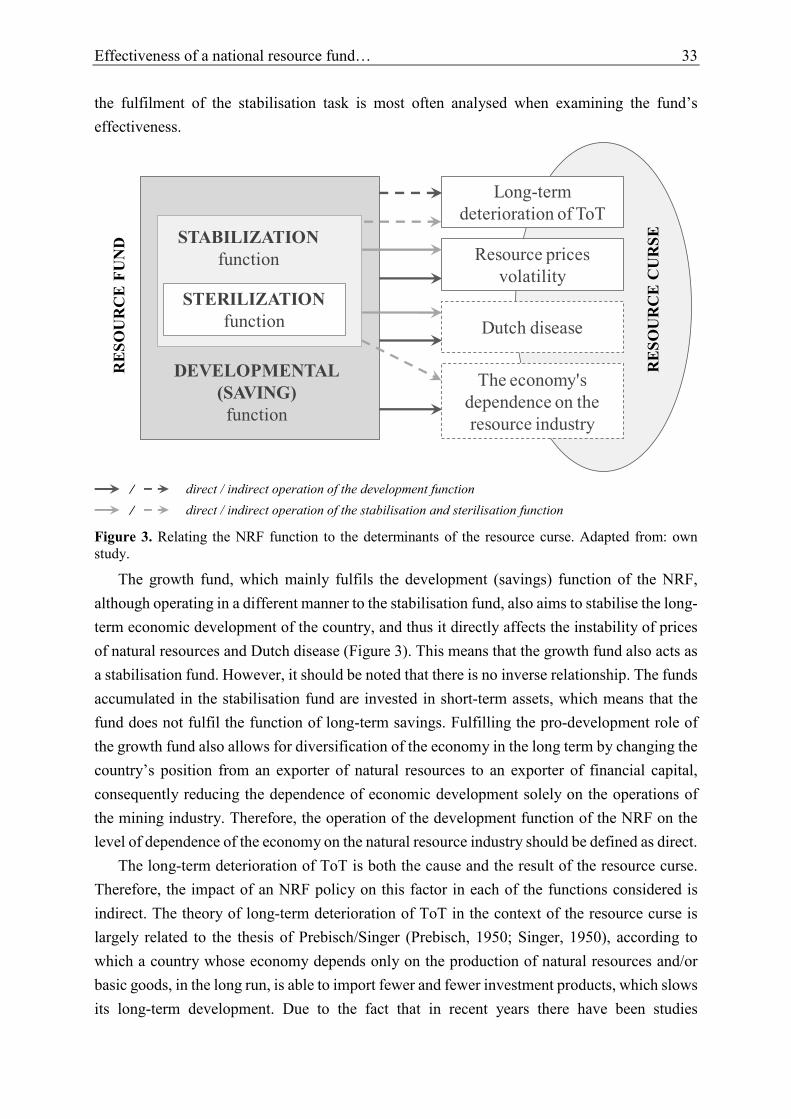
Effectiveness of a national resource fund… 33
the fulfilment of the stabilisation task is most often analysed when examining the fund’s 1
effectiveness. 2
3
/ direct / indirect operation of the development function 4
/ direct / indirect operation of the stabilisation and sterilisation function 5
Figure 3. Relating the NRF function to the determinants of the resource curse. Adapted from: own 6 study. 7
The growth fund, which mainly fulfils the development (savings) function of the NRF, 8
although operating in a different manner to the stabilisation fund, also aims to stabilise the long-9
term economic development of the country, and thus it directly affects the instability of prices 10
of natural resources and Dutch disease (Figure 3). This means that the growth fund also acts as 11
a stabilisation fund. However, it should be noted that there is no inverse relationship. The funds 12
accumulated in the stabilisation fund are invested in short-term assets, which means that the 13
fund does not fulfil the function of long-term savings. Fulfilling the pro-development role of 14
the growth fund also allows for diversification of the economy in the long term by changing the 15
country’s position from an exporter of natural resources to an exporter of financial capital, 16
consequently reducing the dependence of economic development solely on the operations of 17
the mining industry. Therefore, the operation of the development function of the NRF on the 18
level of dependence of the economy on the natural resource industry should be defined as direct. 19
The long-term deterioration of ToT is both the cause and the result of the resource curse. 20
Therefore, the impact of an NRF policy on this factor in each of the functions considered is 21
indirect. The theory of long-term deterioration of ToT in the context of the resource curse is 22
largely related to the thesis of Prebisch/Singer (Prebisch, 1950; Singer, 1950), according to 23
which a country whose economy depends only on the production of natural resources and/or 24
basic goods, in the long run, is able to import fewer and fewer investment products, which slows 25
its long-term development. Due to the fact that in recent years there have been studies 26
STABILIZATION
function
STERILIZATION
function
DEVELOPMENTAL
(SAVING)
function
RE
SO
UR
CE
FU
ND
Long-term
deterioration of ToT
Resource prices
volatility
Dutch disease
The economy's
dependence on the
resource industry
RE
SO
UR
CE
CU
RS
E
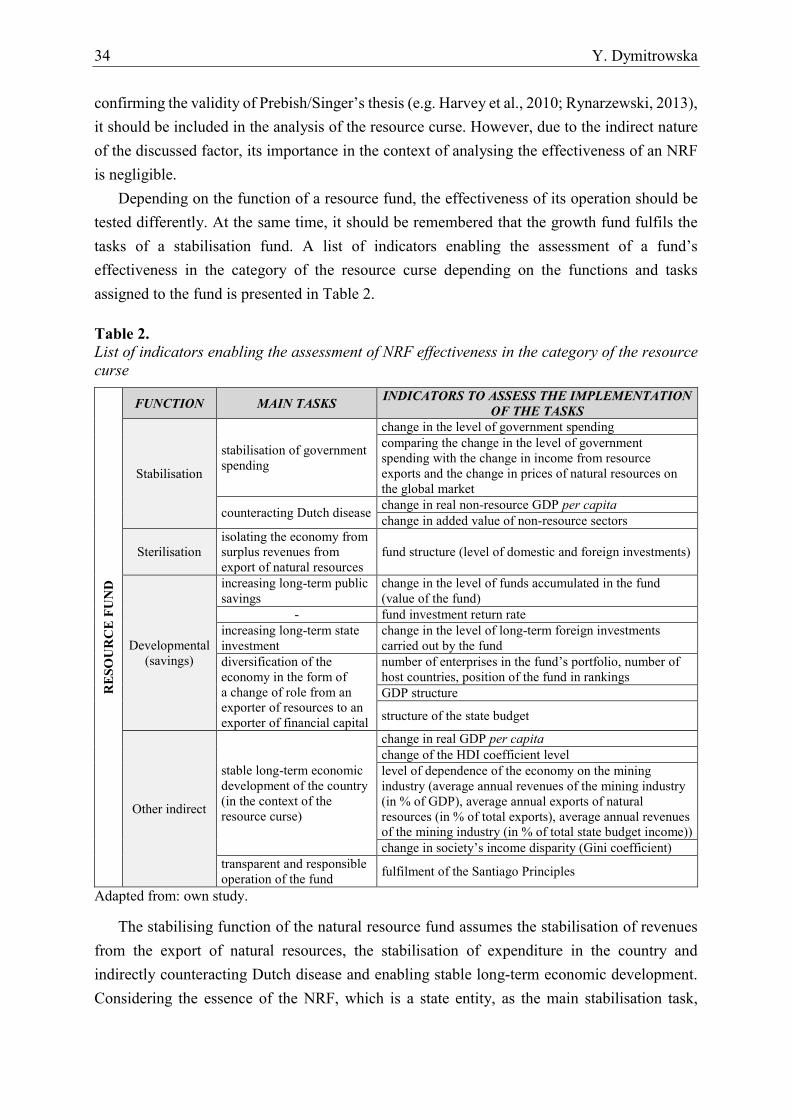
34 Y. Dymitrowska
confirming the validity of Prebish/Singer’s thesis (e.g. Harvey et al., 2010; Rynarzewski, 2013), 1
it should be included in the analysis of the resource curse. However, due to the indirect nature 2
of the discussed factor, its importance in the context of analysing the effectiveness of an NRF 3
is negligible. 4
Depending on the function of a resource fund, the effectiveness of its operation should be 5
tested differently. At the same time, it should be remembered that the growth fund fulfils the 6
tasks of a stabilisation fund. A list of indicators enabling the assessment of a fund’s 7
effectiveness in the category of the resource curse depending on the functions and tasks 8
assigned to the fund is presented in Table 2. 9
Table 2. 10 List of indicators enabling the assessment of NRF effectiveness in the category of the resource 11
curse 12
RE
SO
UR
CE
FU
ND
FUNCTION MAIN TASKS INDICATORS TO ASSESS THE IMPLEMENTATION
OF THE TASKS
Stabilisation
stabilisation of government
spending
change in the level of government spending
comparing the change in the level of government
spending with the change in income from resource
exports and the change in prices of natural resources on
the global market
counteracting Dutch disease change in real non-resource GDP per capita
change in added value of non-resource sectors
Sterilisation
isolating the economy from
surplus revenues from
export of natural resources
fund structure (level of domestic and foreign investments)
Developmental
(savings)
increasing long-term public
savings
change in the level of funds accumulated in the fund
(value of the fund)
- fund investment return rate
increasing long-term state
investment
change in the level of long-term foreign investments
carried out by the fund
diversification of the
economy in the form of
a change of role from an
exporter of resources to an
exporter of financial capital
number of enterprises in the fund’s portfolio, number of
host countries, position of the fund in rankings
GDP structure
structure of the state budget
Other indirect
stable long-term economic
development of the country
(in the context of the
resource curse)
change in real GDP per capita
change of the HDI coefficient level
level of dependence of the economy on the mining
industry (average annual revenues of the mining industry
(in % of GDP), average annual exports of natural
resources (in % of total exports), average annual revenues
of the mining industry (in % of total state budget income))
change in society’s income disparity (Gini coefficient)
transparent and responsible
operation of the fund fulfilment of the Santiago Principles
Adapted from: own study. 13
The stabilising function of the natural resource fund assumes the stabilisation of revenues 14
from the export of natural resources, the stabilisation of expenditure in the country and 15
indirectly counteracting Dutch disease and enabling stable long-term economic development. 16
Considering the essence of the NRF, which is a state entity, as the main stabilisation task, 17
Effectiveness of a national resource fund… 35
it is necessary to specify the stabilisation of budget expenditure so that the budget can be made 1
independent of changes in the level of income from resource exports and from prices of natural 2
resources on the global market. An indicator enabling the assessment of the implementation of 3
the stabilisation task is the change in the level of government spending. It is reasonable to 4
simultaneously adopt the assumption presented by Asik (2017) about the importance of stability 5
of government spending, rather than maintaining its constant level. Developing countries are 6
characterised by rapid economic growth, often associated with increasing state investment. 7
Therefore, it is important that the fiscal policy of the state is stable and balanced and that the 8
trend in shaping government spending does not show any breakdowns occurring on the global 9
natural resource market. When analysing the effectiveness of the fund’s countercyclical 10
operation, it is important to compare the change in the level of government spending with the 11
change in income from resource exports and the change in prices of natural resources on the 12
global market. 13
Dutch disease is one of the main macroeconomic endogenous causes of the resource curse. 14
At the same time, it is the first alarming symptom resulting from the lack of stability in the 15
international commodity market. Therefore, in the context of the stabilisation function 16
performed by the fund, it is important to assess the occurrence of signs of the disease in the 17
country. Due to the fact that the phenomenon discussed relates to the takeover of the dominant 18
role on the domestic market by the mining industry and a decrease in competitiveness, 19
a reduction of activity level and often the bankruptcy of enterprises from other industries with 20
a simultaneous increase in real GDP in the country by universal indicators enabling assessment 21
of the appearance of the Dutch disease, there is a change in real non-resource GDP per capita 22
and a change in the added value of non-resource sectors. The above-mentioned indicators make 23
it possible to estimate whether domestic income is driven exclusively by the mining industry or 24
also by the development of other industries. At the same time, it should be noted that the 25
expected result is not necessarily an increase in the indices presented, but no sharp decline. 26
An analysis of non-resource GDP per capita and the change in the added value of non-resource 27
sectors allows for a preliminary assessment of the occurrence of Dutch disease5. 28
The NRF sterilisation function is directly related to the stabilisation task and consists in 29
increasing the resistance of the national economy to the consequences of natural resource 30
booms. Assessment of the sterilisation task can be done by analysing the fund structure. 31
The greater the share of foreign investment in NRF activities, the more the sterilisation function 32
is fulfilled. 33
When analysing the effectiveness of the growth fund, all the aforementioned indicators 34
should be taken into account. In addition, the fund is designed to increase long-term public 35
savings and increase long-term state investment. Assessment of the achievement of the set goals 36
5 In order to carry out more detailed research, a number of additional indicators can be used, presented for example
in the study (Dymitrowska, 2015, p. 75).
36 Y. Dymitrowska
can be made through a detailed analysis of the state and the international position of the fund 1
by estimating the value of the fund and the change in the level of accumulated funds over time, 2
the rate of return on the fund’s investments and the degree of long-term foreign investments 3
implemented. Enabling the diversification of the economy by changing the role of the country 4
on the international market from an exporter of natural resources to an exporter of financial 5
capital can be assessed by analysing the number of enterprises in the growth fund portfolio and 6
the number of host countries, as well as estimating the position of the NRF in the international 7
rankings of the largest SWFs in the world. 8
The policy of the national resource fund assumes a direct impact on the level of state 9
expenditure and the occurrence of Dutch disease and, in the case of the growth fund, also on 10
reducing the economy’s dependence on the mining industry. Due to the fact that the fund does 11
not actually play a strict role in the context of any further economic policy pursued by the state, 12
long-term economic development should be included in the additional indirect objectives of the 13
NRF. In the context of the resource curse when assessing the economic development of 14
countries specialising in the export of natural resources, apart from the indicators distinguished 15
in the analysis of Dutch disease, one should take into account the change in real GDP per capita, 16
the change in the HDI ratio, the level of dependence of the economy on the mining industry 17
(based on the average annual revenues of the mining industry (in % of GDP), the average annual 18
exports of natural resources (in % of total exports), the average annual revenues of the mining 19
industry (in % of total state budget income)) and any change in the society’s income disparity 20
(based on the Gini coefficient). 21
When analysing the effectiveness of NRFs in literature on the subject, the importance of 22
transparent and responsible operation of the fund is often emphasised. Therefore, when 23
assessing the fund’s effectiveness, it is important to evaluate its performance in this category. 24
The level of good management, transparency and prudent investment practices of the fund can 25
be determined by comparing the NRF operating standards with the Santiago Principles. 26
5. Conclusions 27
The natural resource fund is a tool of a state’s economic policy, consisting in the creation 28
of a state entity aimed at managing revenues from the export of natural resources in such a way 29
as to enable stable, long-term economic development of a country exporting resources. Due to 30
the state form of the fund and the national nature of natural resources, an appropriate name is 31
also the national resource fund. In the case of resource-rich countries, enabling sustainable 32
economic development is tantamount to counteracting the resource curse, consisting in slower 33
economic development in countries specialising in the export of natural resources compared to 34
countries whose resources are scarce. 35
Effectiveness of a national resource fund… 37
The main function performed by the NRF is a stabilising function, which is aimed at 1
separating the domestic economy from unstable changes taking place on the global natural 2
resource market. The stabilisation function also consists in creating a so-called buffer retaining 3
significant revenues from the export of natural resources before their massive inflow into the 4
country, leading to Dutch disease and the resource curse in the long run. The NRF sterilisation 5
function further strengthens the protective effect by investing accumulated funds on foreign 6
markets. The two NRF functions presented are closely related. 7
The most advanced form of the natural resource fund is the growth fund, which, apart from 8
stabilising and sterilising functions, also takes on the task of long-term savings. All funds 9
collected from the sale of natural resources are allocated for long-term investments on foreign 10
markets. The country uses only profits generated by the fund’s activities. The growth fund may 11
be part of the NRF, under which the funds are divided between the stabilisation and growth 12
fund or a separate state body. An extreme approach is to establish only a pro-development form 13
of the fund, as was done e.g. in Norway. In the poorest countries specialising in the extraction 14
and export of natural resources, this solution seems to have little effect, although the results of 15
the research are not clear. Due to the emergence of new funds from developing countries on the 16
international NRF market, e.g. the East Timor Oil Fund, the issue of the efficiency of the 17
operation of natural resource funds in the poorest countries should be subjected to detailed 18
analysis as part of future research. It should also be noted that the growth fund has a stabilising 19
function, but there is no inverse relationship. The creation of a long-term savings fund also 20
provides the opportunity to diversify the economy by changing the country’s role in the long 21
term from a natural resources exporter to a financial capital exporter. 22
National natural resource funds are a form of sovereign wealth funds, but they play a key 23
role within the SWF. The importance of NRFs on the global financial market is constantly 24
growing, so the problem of their effective operation is important both from the point of view of 25
the interest of natural resource exporters and the stability of the global economy. The results of 26
empirical research devoted to assessing the effectiveness of the functioning of funds are not 27
explicit. As part of the analyses, different research assumptions are adopted, and various 28
efficiency measures are used. The key goal of this study was to distinguish indicators that allow 29
for assessing the effectiveness of natural resource funds in the context of the resource curse in 30
countries rich in natural resource deposits. The indicators identified on the basis of a thorough 31
analysis of literature on the subject, depending on the functions and tasks assigned to the fund, 32
are presented in Table 2. The presented measures have practical significance. They can be used 33
in further research aimed at assessing the effectiveness of NRFs in both the group of countries 34
rich in natural resources and in individual case studies. An additional cognitive value of the 35
article is the system of natural resource funds presented in Figure 1, as well as the reference of 36
individual NRF functions to the determinants of the resource curse (Figure 3). 37
38 Y. Dymitrowska
References 1
1. Acemoglu, D., Johnson, S., and Robinson, A. (2001). The colonial origins of comparative 2
development: an empirical investigation. American Economic Review, 91. 3
2. Aizenman, J., and Glick, R. (2009). Sovereign Wealth Funds: Stylized Facts about their 4
Determinants and Governance. International Finance, 12/3. 5
3. Arezki, R., and Van der Ploeg, F. (2007). Can the natural resource curse be turned into a 6
blessing? The role of trade policies and institutions. CEPR Discussion Paper, 6225. 7
4. Auty, R.M. (1993). Sustaining Development In Mineral Economies: The Resource Curse 8
Thesis. London: Routledge. 9
5. Auty, R.M. (2001). Resource abundance and economic development. Oxford: Oxford 10
University Press. 11
6. Bagattini, G.Y. (2011). The Political Economy of Stabilisation Funds: Measuring their 12
Success in Resource-Dependent Countries. Brighton: Institute of Development Studies, 13
University of Sussex, IDS Working Paper, 356. 14
7. Barma, N.H., Kaiser, K., Le, T.M. and Viñuela, L. (2012). Rents to Riches? The Political 15
Economy of Natural Resource-Led Development. Washington D.C.: World Bank. 16
8. BRSP (2006). Meeting the Challenge of the Resource Curse. International Experiences in 17
Managing the Risks and Realising the Opportunities of Non-Renewable Natural Resource 18
Revenue Management. London: Programme on Business and Development Performance, 19
United Nations Development Programme, Overseas Development Institute. 20
9. Bulte, E., Damania, R., and Deacon, R. (2005). Resource Intensity, Institutions, and 21
Development. World Development, Elsevier, 33. 22
10. Clemente, L., Faris, R., and Puente, A. (2002). Natural Resource Dependence, Volatility 23
and Economic Performance in Venezuela: The Role of a Stabilization Fund. Cambridge: 24
Andean Competitiveness Project Working Paper, Center for International Development, 25
Harvard University. 26
11. Corden, W.M., and Neary, J.P. (1982). Booming sector and de-industrialization in a small 27
open economy. Economic Journal, 92. 28
12. Crain, W.M., and Devlin, J. (2002). Nonrenewable Resource Funds: A Red Herring for 29
Fiscal Stability? Washington D.C.: World Bank, Draft working paper. 30
13. Davis, J., Ossowski, R., Daniel, J., and Barnett, S. (2001). Stabilization and savings funds 31
for non-renewable resources. International Monetary Fund, Occasional paper, 205. 32
14. Devlin, J., and Lewin, M. (2005). Managing Oil Booms and Busts in Developing Countries. 33
In: J. Aizenman, and B. Pinto (Eds.), Managing Economic Volatility and Crises: 34
A Practitioner’s Guide. New York: Cambridge University Press. 35
15. Dymitrowska, Y. (2015). "Klątwa bogactwa" a polityka gospodarcza państwa. Poznań: 36
SimplePublishing. 37
Effectiveness of a national resource fund… 39
16. Fasano, U. (2000). Review of the Experience with Oil Stabilization and Savings Funds in 1
Selected Countries. Washington D.C.: International Monetary Fund, IMF Working Paper, 2
00/112. 3
17. Fasano, U. (2002). With open economy and sound policies, U.A.E. has turned oil “curse" 4
into a blessing. IMF Survey, 31. 5
18. Frankel, J. (2010). The Natural Resource Curse: A Survey. Cambridge: Harvard 6
Environmental Economics Program, Discussion Papers, 21, Harvard Kennedy School, 7
Harvard University. 8
19. Frankel, J., Vegh, C., and Vuletin, G. (2012). On Graduation from Fiscal Procyclicality. 9
Journal of Development Economics, 100/1. 10
20. Harvey, D.I., Kellard, N.M., Madsen, J.B., and Wohar M.E. (2010). The Prebisch-Singer 11
Hypothesis: Four Centuries of Evidence. The Review of Economics and Statistics, 92. 12
21. IFSWF (2019). International Forum of Sovereign Wealth Funds, Our Members. Available 13
online https://www.ifswf.org/our-members, 19.09.2019. 14
22. IMF (2012). Global Financial Stability Report: The Quest for Lasting Stability. Washington 15
D.C.: World Economic and Financial Surveys, International Monetary Fund. 16
23. IWG (2008). Sovereign Wealth Funds Generally Accepted Principles and Practices 17
„Santiago Principles”. International Working Group of Sovereign Wealth Funds. 18
24. Krueger, A. (1974). The Political Economy of the Rent-Seeking Society. American 19
Economic Review, American Economic Association, 64. 20
25. Larsen, E.R. (2005). Are rich countries immune to the resource curse? Evidence from 21
Norway’s management of its oil riches. Resources Policy, Elsevier, 30. 22
26. Marchewka-Bartkowiak, K. (2009). Państwowe fundusze stabilizacyjne – problem czy 23
szansa na długoterminowe równoważenie budżetu państwa. In: A. Szewczuk (Ed.), Finanse 24
2009 – Teoria i praktyka, Finanse publiczne, I. Szczecin: Wydawnictwo Naukowe 25
Uniwersytetu Szczecińskiego. 26
27. Merlevede, B., Schoors, K., and Van Aarle, B. (2009). Russia from Bust to Boom and Back: 27
Oil Price, Dutch Disease and Stabilisation Fund. Comparative Economic Studies, 51/2. 28
28. Mikesell, R.F. (1997). Explaining the resource curse, with special reference to mineral 29
exporting countries. Resource Policy, 23. 30
29. Neumayer, E. (2004). Does the “Resource Curse" Hold for Growth in Genuine Income as 31
Well? World Development, Elsevier, 32. 32
30. NRGI (2019). Natural Resource Governance Institute, Natural Resource Charter. 33
Available online https://resourcegovernance.org/approach/natural-resource-charter, 34
19.09.2019. 35
31. Ossowski, R., Villafuerte, M., Medas, P.A., and Thomas, T. (2008). Managing the Oil 36
Revenue Boom: The Role of Fiscal Institutions. Washington D.C.: International Monetary 37
Fund, IMF Occasional Paper, 260. 38
32. Prebisch, R. (1950). The economic development of Latin America and its principal 39
problems. New York: United Nations, Lake Success. 40
40 Y. Dymitrowska
33. Rasiah, R., and Shari, I. (2001). Market, government and Malaysia’s new economic policy. 1
Cambridge Journal of Economics, 25. 2
34. Rynarzewski, T. (2013). Refleksje o dylematach wpływu handlu zagranicznego na rozwój 3
gospodarczy krajów słabo zaawansowanych ekonomicznie. Studia Oeconomica 4
Posnaniensia, 1. 5
35. Sachs, J.D., and Warner, A.M. (2001). Natural Resources and Economic Development. 6
The curse of natural resources. European Economic Review, Elsevier, 45. 7
36. Sarraf, M. and Jiwanji, M. (2001). Beating the resource curse: the case of Botswana. 8
Environmental Economics Series, 83/291. 9
37. Shabsigh, G., and Ilahi, N. (2007). Looking Beyond the Fiscal: Do Oil Funds Bring 10
Macroeconomic Stability? Washington, D.C.: International Monetary Fund, IMF Working 11
Paper, 07/96. 12
38. Singer, H.W. (1950). The distribution of gains between investing and borrowing countries. 13
American Economic Review, 40. 14
39. Stevens, P. (2003a). Resource Impact: Curse or Blessing? A literature survey. Dundee: 15
Centre for Energy, Petroleum and Mineral Law and Policy, University of Dundee. 16
40. Stevens, P. (2003b). Resource Impact: A curse or a blessing? Dundee: Centre for Energy, 17
Petroleum and Mineral Law and Policy, University of Dundee. 18
41. Stijns, J. (2005). Natural resource abundance and economic growth revisited. Resources 19
Policy, Elsevier, 30. 20
42. Sugawara, N. (2014). From Volatility to Stability in Expenditure: Stabilization Funds in 21
Resource-Rich Countries. Washington, D.C.: International Monetary Fund, IMF Working 22
Paper, WP/14/43. 23
43. Sun, T., and Hesse, H. (2010). Sovereign Wealth Funds and Financial Stability: An Event-24
Study Analysis. In: S.D. Udaibir, A. Mazarei, and H. van der Hoorn (Eds.), Economics of 25
Sovereign Wealth Funds: Issues for Policymakers. Washington D.C.: International 26
Monetary Fund. 27
44. SWFI (2019). Top 81 Largest Sovereign Wealth Fund Rankings by Total Assets, 28
Sovereign Wealth Fund Institute, Fund Rankings, SWF, Available online 29
https://www.swfinstitute.org/fund-rankings/sovereign-wealth-fund, 19.08.2019. 30
45. Urban, D. (2017). Państwowe Fundusze Majątkowe. Pomiędzy krajową gospodarką 31
a globalnymi rynkami finansowymi. Łódź: Wydawnictwo Uniwersytetu Łódzkiego. 32
46. Usui, N. (1997). Dutch disease and policy adjustments to the oil boom: a comparative study 33
of Indonesia and Mexico. Resources Policy, 23. 34
47. Wiśniewski, P. (2011). Ekspansja państwowych funduszy majątkowych a nowy 35
protekcjonizm inwestycyjny w gospodarce światowej. Część I. Definicja, klasyfikacja oraz 36
istotność SWF w gospodarce światowej. Warszawa: Studia I Prace Kolegium Zarządzania 37
i Finansów SFH, Zeszyt Naukowy nr 111, SGH. 38
48. Wright, G., and Czelutsa, J. (2002). Resource-based economic growth, past and present. 39
Stanford University. 40
Scientific Quarterly “Organization and Management”, 2020, Vol. 1, No. 49; DOI: 10.29119/1899-6116.2020.49.3 www.oamquarterly.polsl.pl
CONSUMPTION OF STEEL IN POLAND – 1
QUANTITY ANALYSIS IN TIME 2
Bożena GAJDZIK 3
Silesian University of Technology, Katowice; [email protected], ORCID: 0000-0002-0408-1691 4
Abstract: The steel market in Poland has increased over the last few years in the market 5
economy. Domestic steel producers manufacture more crude steel and steel products. 6
The consumption of steel increases more and more every year. The value of shipments from 7
the Polish steel sector account for approx. 3% of industrial production. The Polish economy 8
uses and processes over 8 million tonnes of steel (apparent consumption of crude steel/semi-9
products) yearly (average volume of steel consumption from 2000 to 2017). The largest user of 10
crude steel is metal good, but the largest user of finished steel products is construction (more 11
than 40%), followed by: machinery industry (15%), automotive (about 12%), transport 12
equipment (4%), home appliances industry (3.5%) and other industry sectors, e.g. electrical 13
equipment, electronics. Changes in domestic steel consumption are presented in the paper. 14
The publication presents the historical trends and forecasts of quantity (volume) of steel 15
consumption. The analysis of steel intensity was realised on the basis of apparent consumption 16
of steel in device on: semi-products and finished steel products. Realised analysis is the base 17
for building of scenarios of steel production by particular sectors of industry in Poland. 18
Keywords: enterprise transformation, Industry 4.0, heat treatment process. 19
1. Introduction 20
The industry sector processes and consumes many materials. Steel is a basic structural 21
material, with a very wide range of applications. The functioning of the steel sector is strategic 22
for economies in many countries. Steel intensity is a basic measure of the processing and use 23
(consumption) of steel in industry. Steel intensity tests are carried out for a set settlement period. 24
In the analysis of steel intensity (steel internist) should be taken into account the balance of 25
foreign trade. The basic scope of the analysis is apparent steel use. Steel intensity analysis is 26
prepared in quantitative, numerical (physical, natural units) or value (price) terms. The subject 27
scope of the analyses may relate to crude steel as semi-products or finished steel products. 28
The time range of steel intensity analysis can be past (historical) or future (predictive). 29
The analysis also uses indicators: the amount or value of steel consumed per unit of GDP or per 30
one inhabitant of a given country. The World Steel Association proposed a method for 31
42 B. Gajdzik
calculating the actual consumption of steel based on the following indicators: SWIP – Steel 1
Weighted Industrial Production and TSU – True Steel Use (Worldsteel, 2012; 2017). 2
In Poland, a popular method of measuring steel consumption is apparent steel use calculated as 3
steel production minus export plus import. The scope of the apparent steel use analysis can be 4
implemented and presented in relation to semi-products (crude steel) but steel products 5
(finished steel products) in device on long and flat products and tube. When analysing steel 6
consumption in the economy, it is assumed that there is an impact of input-output flows of steel 7
products on the final level of consumption. The methodology avoids double or multiple 8
classification of the amount of steel consumption by individual market participants is constantly 9
improved (Worldsteel, 2012). Final steel consumption is also affected by the level of stocks of 10
steel products at the end user. Analysing this phenomenon, you can encounter the following 11
problems. In addition, the trend of apparent consumption of steel is overlapped by periodic 12
fluctuations caused by the economic situation (such fluctuations may cause an increase or 13
decrease in apparent consumption of steel in the analysed period). 14
The level of steel consumption is analysed by global and European steel organisations 15
(e.g. World Steel Association, Eurofer, Eurostat). The scope of analysis varies for 16
environments, and it is handled by economists, politicians, scientists and others. In Central and 17
Eastern European countries, for many years, the topic of steel consumption has been analysed 18
in relation to changes in the economy after the transformation from a centrally controlled 19
economy to a market economy. This scope of analysis can be found in publications, among 20
others, by employees of the Institute of Iron Metallurgy (Szulc, 2014; Szulc, Garbarz, Paduch, 21
2011) and university staff (Kardas, 2010). During the transition, the theme of steel consumption 22
was also carried out by foreign authors in the field of changes in their countries (e.g. Morariu, 23
and Bostan, 2012; Bostan, and Onofrei, 2012). The topic of steel consumption is a part of 24
research in assessing the situation of the economy, e.g. in the case of the Central Statistical 25
Office and the Polish Steel Association. The scope of the analysis of steel consumption is 26
carried out on the basis of individual economies (Rębiasz, Garbarz, and Szulc, 2004; Rębiasz, 27
2003), the European economy (Eurofer & Oxford Economics, February 2018) and the global 28
economy (Worldsteel & Oxford Economics, May 2019). 29
2. Resources and methods 30
A time series was used to analyse steel consumption in Poland as a function of time. 31
The analysis performed was based on empirical data: steel production (million tonnes) and 32
apparent consumption of steel (million tonnes) from 2000 to 2017. The data used is presented 33
in Table 1. The empirical data is from the Polish Steel Association in Katowice. On the basis 34
of empirical data, historical trends of steel intensity (apparent consumption of steel) in Poland 35
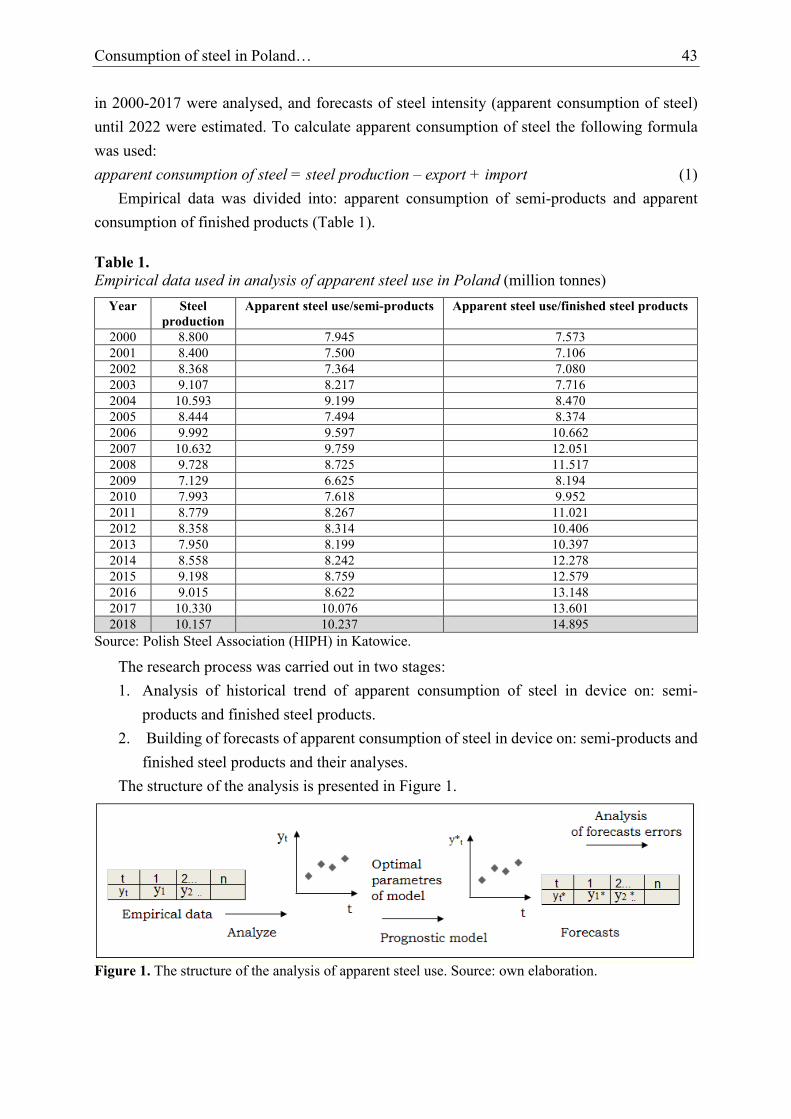
Consumption of steel in Poland… 43
in 2000-2017 were analysed, and forecasts of steel intensity (apparent consumption of steel) 1
until 2022 were estimated. To calculate apparent consumption of steel the following formula 2
was used: 3
apparent consumption of steel = steel production – export + import (1) 4
Empirical data was divided into: apparent consumption of semi-products and apparent 5
consumption of finished products (Table 1). 6
Table 1. 7 Empirical data used in analysis of apparent steel use in Poland (million tonnes) 8
Year Steel
production
Apparent steel use/semi-products Apparent steel use/finished steel products
2000 8.800 7.945 7.573
2001 8.400 7.500 7.106
2002 8.368 7.364 7.080
2003 9.107 8.217 7.716
2004 10.593 9.199 8.470
2005 8.444 7.494 8.374
2006 9.992 9.597 10.662
2007 10.632 9.759 12.051
2008 9.728 8.725 11.517
2009 7.129 6.625 8.194
2010 7.993 7.618 9.952
2011 8.779 8.267 11.021
2012 8.358 8.314 10.406
2013 7.950 8.199 10.397
2014 8.558 8.242 12.278
2015 9.198 8.759 12.579
2016 9.015 8.622 13.148
2017 10.330 10.076 13.601
2018 10.157 10.237 14.895
Source: Polish Steel Association (HIPH) in Katowice. 9
The research process was carried out in two stages: 10
1. Analysis of historical trend of apparent consumption of steel in device on: semi-11
products and finished steel products. 12
2. Building of forecasts of apparent consumption of steel in device on: semi-products and 13
finished steel products and their analyses. 14
The structure of the analysis is presented in Figure 1. 15
16 Figure 1. The structure of the analysis of apparent steel use. Source: own elaboration. 17
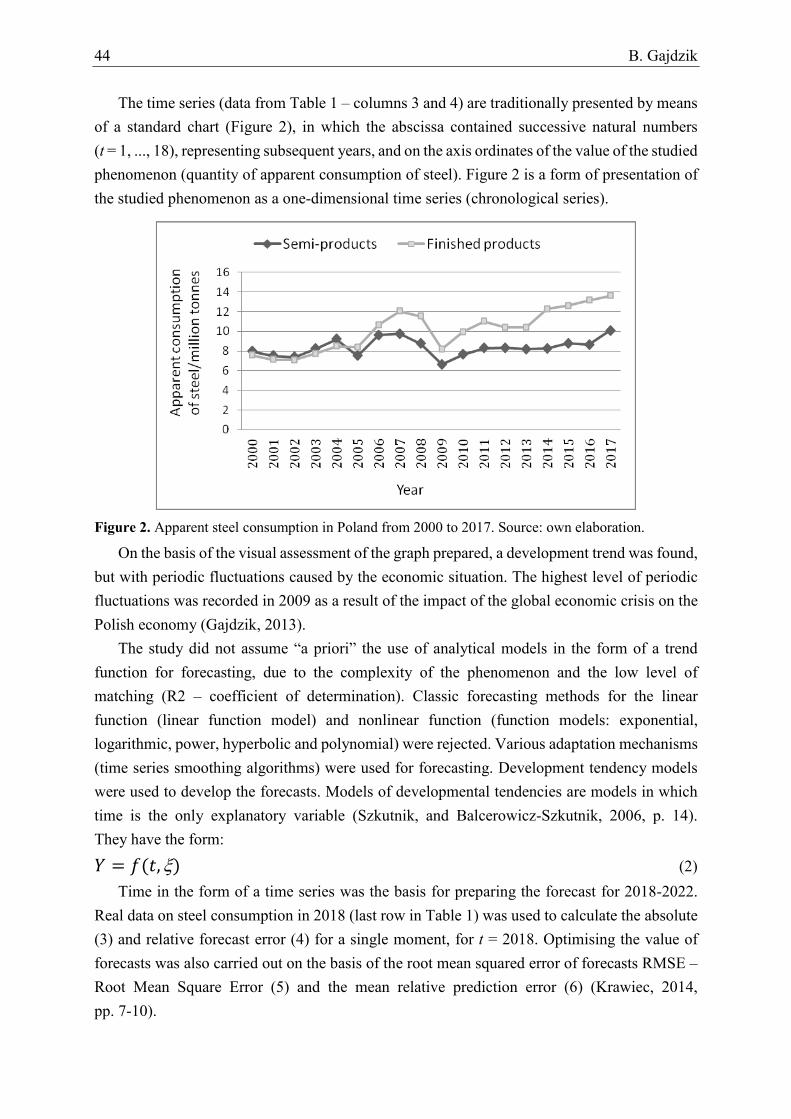
44 B. Gajdzik
The time series (data from Table 1 – columns 3 and 4) are traditionally presented by means 1
of a standard chart (Figure 2), in which the abscissa contained successive natural numbers 2
(t = 1, ..., 18), representing subsequent years, and on the axis ordinates of the value of the studied 3
phenomenon (quantity of apparent consumption of steel). Figure 2 is a form of presentation of 4
the studied phenomenon as a one-dimensional time series (chronological series). 5
6
Figure 2. Apparent steel consumption in Poland from 2000 to 2017. Source: own elaboration. 7
On the basis of the visual assessment of the graph prepared, a development trend was found, 8
but with periodic fluctuations caused by the economic situation. The highest level of periodic 9
fluctuations was recorded in 2009 as a result of the impact of the global economic crisis on the 10
Polish economy (Gajdzik, 2013). 11
The study did not assume “a priori” the use of analytical models in the form of a trend 12
function for forecasting, due to the complexity of the phenomenon and the low level of 13
matching (R2 – coefficient of determination). Classic forecasting methods for the linear 14
function (linear function model) and nonlinear function (function models: exponential, 15
logarithmic, power, hyperbolic and polynomial) were rejected. Various adaptation mechanisms 16
(time series smoothing algorithms) were used for forecasting. Development tendency models 17
were used to develop the forecasts. Models of developmental tendencies are models in which 18
time is the only explanatory variable (Szkutnik, and Balcerowicz-Szkutnik, 2006, p. 14). 19
They have the form: 20
𝑌 = 𝑓(𝑡, ) (2) 21
Time in the form of a time series was the basis for preparing the forecast for 2018-2022. 22
Real data on steel consumption in 2018 (last row in Table 1) was used to calculate the absolute 23
(3) and relative forecast error (4) for a single moment, for t = 2018. Optimising the value of 24
forecasts was also carried out on the basis of the root mean squared error of forecasts RMSE – 25
Root Mean Square Error (5) and the mean relative prediction error (6) (Krawiec, 2014, 26
pp. 7-10). 27
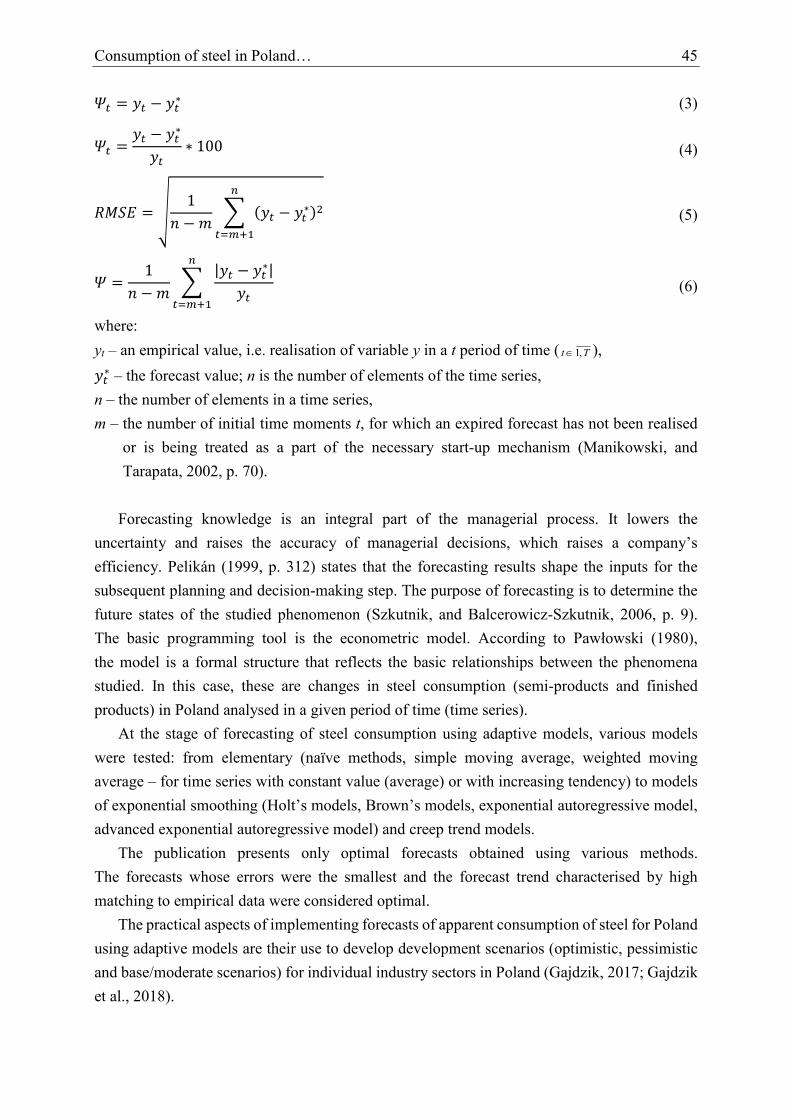
Consumption of steel in Poland… 45
𝛹𝑡 = 𝑦𝑡 − 𝑦𝑡∗ (3) 1
𝛹𝑡 =𝑦𝑡 − 𝑦𝑡
∗
𝑦𝑡∗ 100 (4)
𝑅𝑀𝑆𝐸 = √1
𝑛 −𝑚∑ (𝑦𝑡 − 𝑦𝑡
∗)2𝑛
𝑡=𝑚+1
(5)
𝛹 =1
𝑛 −𝑚∑
|𝑦𝑡 − 𝑦𝑡∗|
𝑦𝑡
𝑛
𝑡=𝑚+1
(6)
where: 2
yt – an empirical value, i.e. realisation of variable y in a t period of time ( 1,t T ), 3
𝑦𝑡∗ – the forecast value; n is the number of elements of the time series, 4
n – the number of elements in a time series, 5
m – the number of initial time moments t, for which an expired forecast has not been realised 6
or is being treated as a part of the necessary start-up mechanism (Manikowski, and 7
Tarapata, 2002, p. 70). 8
9
Forecasting knowledge is an integral part of the managerial process. It lowers the 10
uncertainty and raises the accuracy of managerial decisions, which raises a company’s 11
efficiency. Pelikán (1999, p. 312) states that the forecasting results shape the inputs for the 12
subsequent planning and decision-making step. The purpose of forecasting is to determine the 13
future states of the studied phenomenon (Szkutnik, and Balcerowicz-Szkutnik, 2006, p. 9). 14
The basic programming tool is the econometric model. According to Pawłowski (1980), 15
the model is a formal structure that reflects the basic relationships between the phenomena 16
studied. In this case, these are changes in steel consumption (semi-products and finished 17
products) in Poland analysed in a given period of time (time series). 18
At the stage of forecasting of steel consumption using adaptive models, various models 19
were tested: from elementary (naïve methods, simple moving average, weighted moving 20
average – for time series with constant value (average) or with increasing tendency) to models 21
of exponential smoothing (Holt’s models, Brown’s models, exponential autoregressive model, 22
advanced exponential autoregressive model) and creep trend models. 23
The publication presents only optimal forecasts obtained using various methods. 24
The forecasts whose errors were the smallest and the forecast trend characterised by high 25
matching to empirical data were considered optimal. 26
The practical aspects of implementing forecasts of apparent consumption of steel for Poland 27
using adaptive models are their use to develop development scenarios (optimistic, pessimistic 28
and base/moderate scenarios) for individual industry sectors in Poland (Gajdzik, 2017; Gajdzik 29
et al., 2018). 30
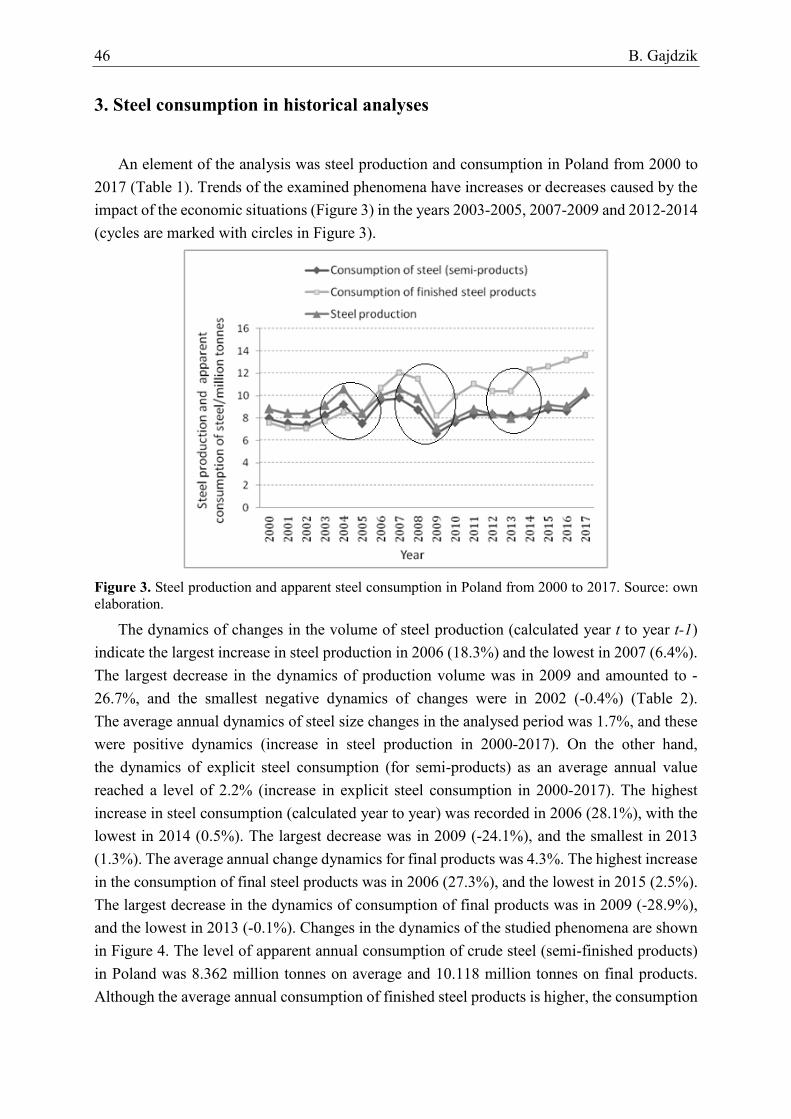
46 B. Gajdzik
3. Steel consumption in historical analyses 1
An element of the analysis was steel production and consumption in Poland from 2000 to 2
2017 (Table 1). Trends of the examined phenomena have increases or decreases caused by the 3
impact of the economic situations (Figure 3) in the years 2003-2005, 2007-2009 and 2012-2014 4
(cycles are marked with circles in Figure 3). 5
6
Figure 3. Steel production and apparent steel consumption in Poland from 2000 to 2017. Source: own 7 elaboration. 8
The dynamics of changes in the volume of steel production (calculated year t to year t-1) 9
indicate the largest increase in steel production in 2006 (18.3%) and the lowest in 2007 (6.4%). 10
The largest decrease in the dynamics of production volume was in 2009 and amounted to -11
26.7%, and the smallest negative dynamics of changes were in 2002 (-0.4%) (Table 2). 12
The average annual dynamics of steel size changes in the analysed period was 1.7%, and these 13
were positive dynamics (increase in steel production in 2000-2017). On the other hand, 14
the dynamics of explicit steel consumption (for semi-products) as an average annual value 15
reached a level of 2.2% (increase in explicit steel consumption in 2000-2017). The highest 16
increase in steel consumption (calculated year to year) was recorded in 2006 (28.1%), with the 17
lowest in 2014 (0.5%). The largest decrease was in 2009 (-24.1%), and the smallest in 2013 18
(1.3%). The average annual change dynamics for final products was 4.3%. The highest increase 19
in the consumption of final steel products was in 2006 (27.3%), and the lowest in 2015 (2.5%). 20
The largest decrease in the dynamics of consumption of final products was in 2009 (-28.9%), 21
and the lowest in 2013 (-0.1%). Changes in the dynamics of the studied phenomena are shown 22
in Figure 4. The level of apparent annual consumption of crude steel (semi-finished products) 23
in Poland was 8.362 million tonnes on average and 10.118 million tonnes on final products. 24
Although the average annual consumption of finished steel products is higher, the consumption 25
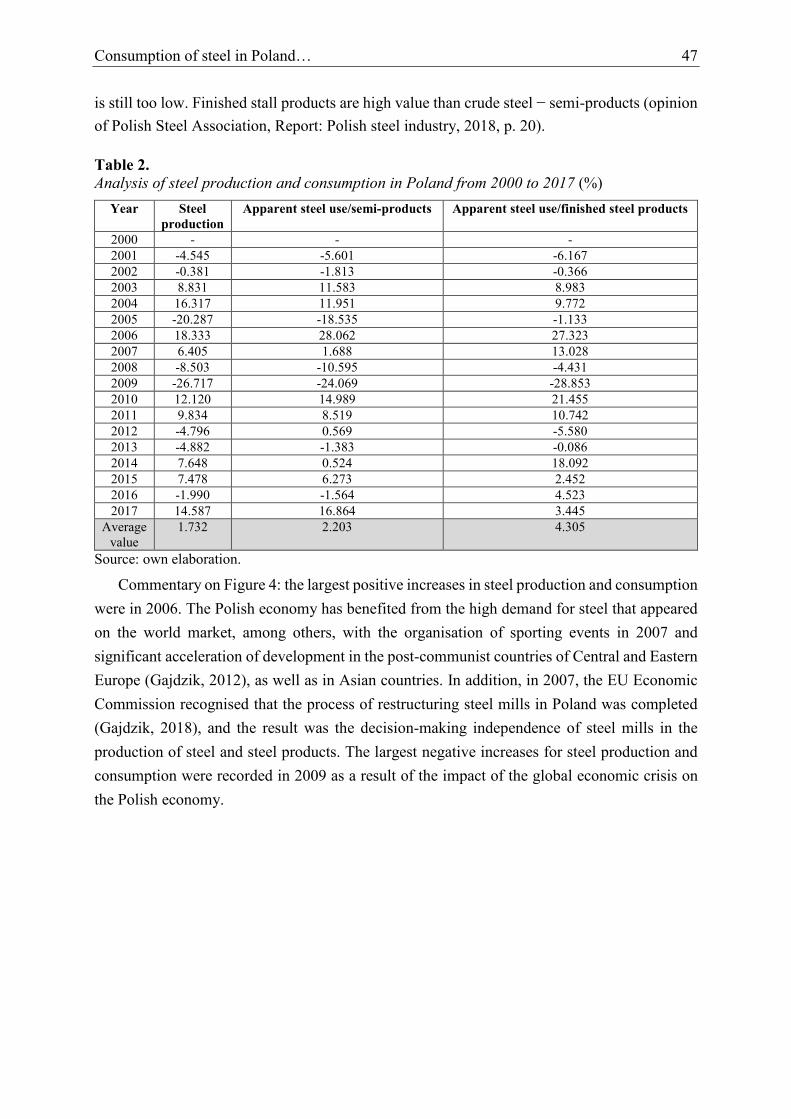
Consumption of steel in Poland… 47
is still too low. Finished stall products are high value than crude steel − semi-products (opinion 1
of Polish Steel Association, Report: Polish steel industry, 2018, p. 20). 2
Table 2. 3 Analysis of steel production and consumption in Poland from 2000 to 2017 (%) 4
Year Steel
production
Apparent steel use/semi-products Apparent steel use/finished steel products
2000 - - -
2001 -4.545 -5.601 -6.167
2002 -0.381 -1.813 -0.366
2003 8.831 11.583 8.983
2004 16.317 11.951 9.772
2005 -20.287 -18.535 -1.133
2006 18.333 28.062 27.323
2007 6.405 1.688 13.028
2008 -8.503 -10.595 -4.431
2009 -26.717 -24.069 -28.853
2010 12.120 14.989 21.455
2011 9.834 8.519 10.742
2012 -4.796 0.569 -5.580
2013 -4.882 -1.383 -0.086
2014 7.648 0.524 18.092
2015 7.478 6.273 2.452
2016 -1.990 -1.564 4.523
2017 14.587 16.864 3.445
Average
value
1.732 2.203 4.305
Source: own elaboration. 5
Commentary on Figure 4: the largest positive increases in steel production and consumption 6
were in 2006. The Polish economy has benefited from the high demand for steel that appeared 7
on the world market, among others, with the organisation of sporting events in 2007 and 8
significant acceleration of development in the post-communist countries of Central and Eastern 9
Europe (Gajdzik, 2012), as well as in Asian countries. In addition, in 2007, the EU Economic 10
Commission recognised that the process of restructuring steel mills in Poland was completed 11
(Gajdzik, 2018), and the result was the decision-making independence of steel mills in the 12
production of steel and steel products. The largest negative increases for steel production and 13
consumption were recorded in 2009 as a result of the impact of the global economic crisis on 14
the Polish economy. 15
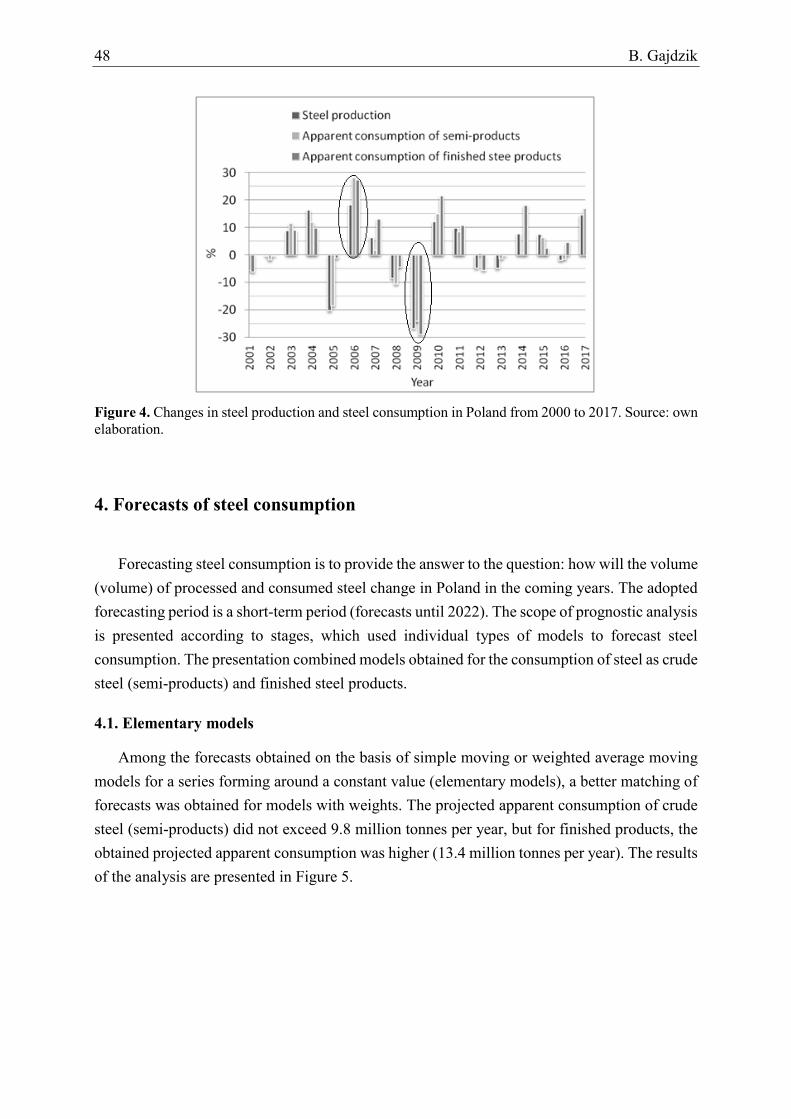
48 B. Gajdzik
1
Figure 4. Changes in steel production and steel consumption in Poland from 2000 to 2017. Source: own 2 elaboration. 3
4. Forecasts of steel consumption 4
Forecasting steel consumption is to provide the answer to the question: how will the volume 5
(volume) of processed and consumed steel change in Poland in the coming years. The adopted 6
forecasting period is a short-term period (forecasts until 2022). The scope of prognostic analysis 7
is presented according to stages, which used individual types of models to forecast steel 8
consumption. The presentation combined models obtained for the consumption of steel as crude 9
steel (semi-products) and finished steel products. 10
4.1. Elementary models 11
Among the forecasts obtained on the basis of simple moving or weighted average moving 12
models for a series forming around a constant value (elementary models), a better matching of 13
forecasts was obtained for models with weights. The projected apparent consumption of crude 14
steel (semi-products) did not exceed 9.8 million tonnes per year, but for finished products, the 15
obtained projected apparent consumption was higher (13.4 million tonnes per year). The results 16
of the analysis are presented in Figure 5. 17
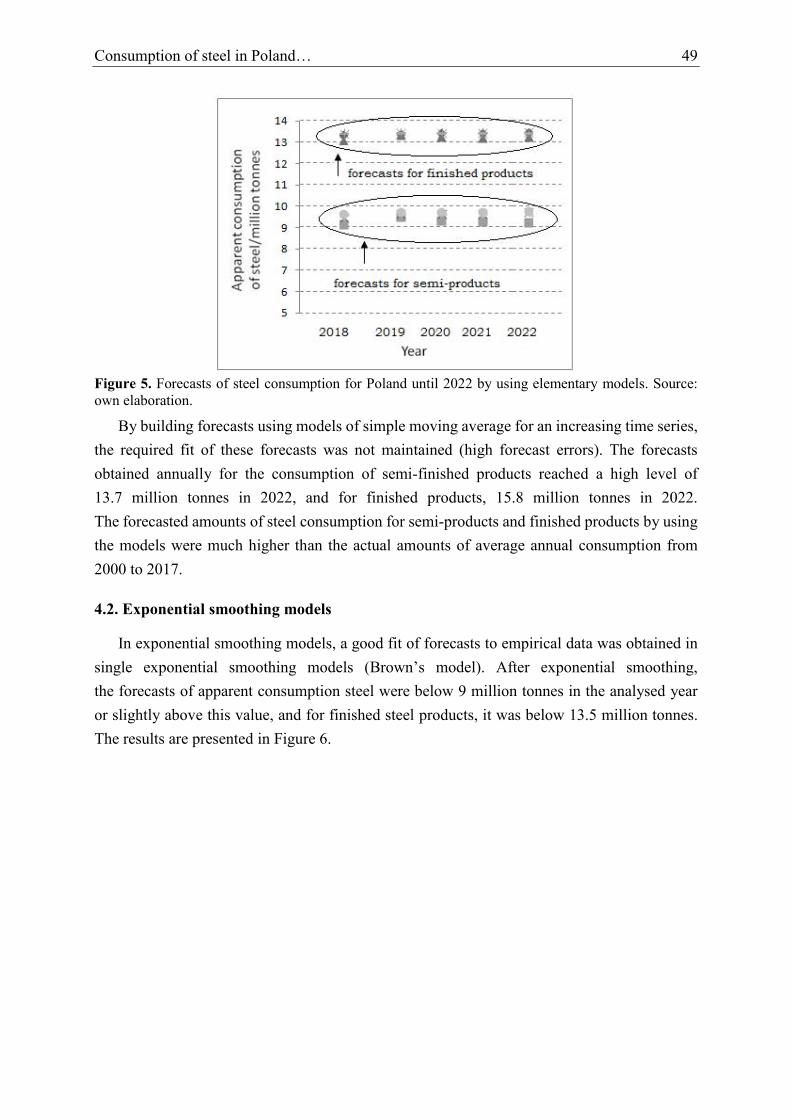
Consumption of steel in Poland… 49
1 Figure 5. Forecasts of steel consumption for Poland until 2022 by using elementary models. Source: 2 own elaboration. 3
By building forecasts using models of simple moving average for an increasing time series, 4
the required fit of these forecasts was not maintained (high forecast errors). The forecasts 5
obtained annually for the consumption of semi-finished products reached a high level of 6
13.7 million tonnes in 2022, and for finished products, 15.8 million tonnes in 2022. 7
The forecasted amounts of steel consumption for semi-products and finished products by using 8
the models were much higher than the actual amounts of average annual consumption from 9
2000 to 2017. 10
4.2. Exponential smoothing models 11
In exponential smoothing models, a good fit of forecasts to empirical data was obtained in 12
single exponential smoothing models (Brown’s model). After exponential smoothing, 13
the forecasts of apparent consumption steel were below 9 million tonnes in the analysed year 14
or slightly above this value, and for finished steel products, it was below 13.5 million tonnes. 15
The results are presented in Figure 6. 16
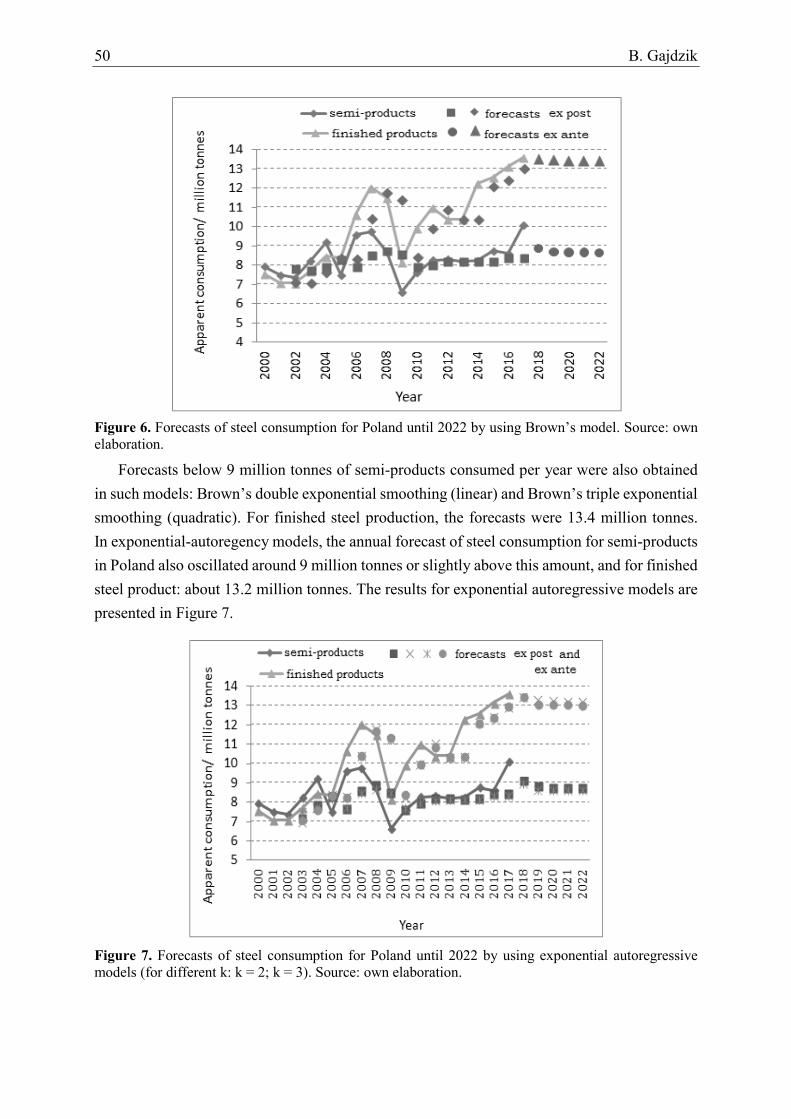
50 B. Gajdzik
1
Figure 6. Forecasts of steel consumption for Poland until 2022 by using Brown’s model. Source: own 2 elaboration. 3
Forecasts below 9 million tonnes of semi-products consumed per year were also obtained 4
in such models: Brown’s double exponential smoothing (linear) and Brown’s triple exponential 5
smoothing (quadratic). For finished steel production, the forecasts were 13.4 million tonnes. 6
In exponential-autoregency models, the annual forecast of steel consumption for semi-products 7
in Poland also oscillated around 9 million tonnes or slightly above this amount, and for finished 8
steel product: about 13.2 million tonnes. The results for exponential autoregressive models are 9
presented in Figure 7. 10
11
Figure 7. Forecasts of steel consumption for Poland until 2022 by using exponential autoregressive 12 models (for different k: k = 2; k = 3). Source: own elaboration. 13
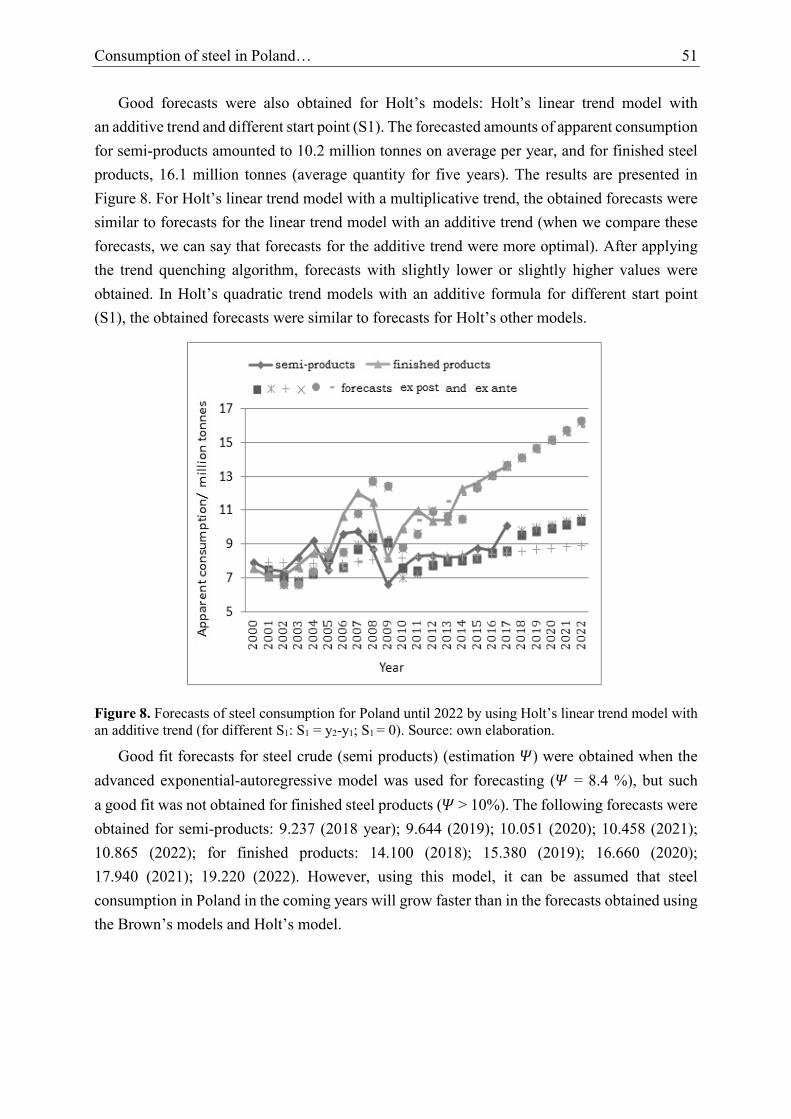
Consumption of steel in Poland… 51
Good forecasts were also obtained for Holt’s models: Holt’s linear trend model with 1
an additive trend and different start point (S1). The forecasted amounts of apparent consumption 2
for semi-products amounted to 10.2 million tonnes on average per year, and for finished steel 3
products, 16.1 million tonnes (average quantity for five years). The results are presented in 4
Figure 8. For Holt’s linear trend model with a multiplicative trend, the obtained forecasts were 5
similar to forecasts for the linear trend model with an additive trend (when we compare these 6
forecasts, we can say that forecasts for the additive trend were more optimal). After applying 7
the trend quenching algorithm, forecasts with slightly lower or slightly higher values were 8
obtained. In Holt’s quadratic trend models with an additive formula for different start point 9
(S1), the obtained forecasts were similar to forecasts for Holt’s other models. 10
11
Figure 8. Forecasts of steel consumption for Poland until 2022 by using Holt’s linear trend model with 12 an additive trend (for different S1: S1 = y2-y1; S1 = 0). Source: own elaboration. 13
Good fit forecasts for steel crude (semi products) (estimation 𝛹) were obtained when the 14
advanced exponential-autoregressive model was used for forecasting (𝛹 = 8.4 %), but such 15
a good fit was not obtained for finished steel products (𝛹 > 10%). The following forecasts were 16
obtained for semi-products: 9.237 (2018 year); 9.644 (2019); 10.051 (2020); 10.458 (2021); 17
10.865 (2022); for finished products: 14.100 (2018); 15.380 (2019); 16.660 (2020); 18
17.940 (2021); 19.220 (2022). However, using this model, it can be assumed that steel 19
consumption in Poland in the coming years will grow faster than in the forecasts obtained using 20
the Brown’s models and Holt’s model. 21
22
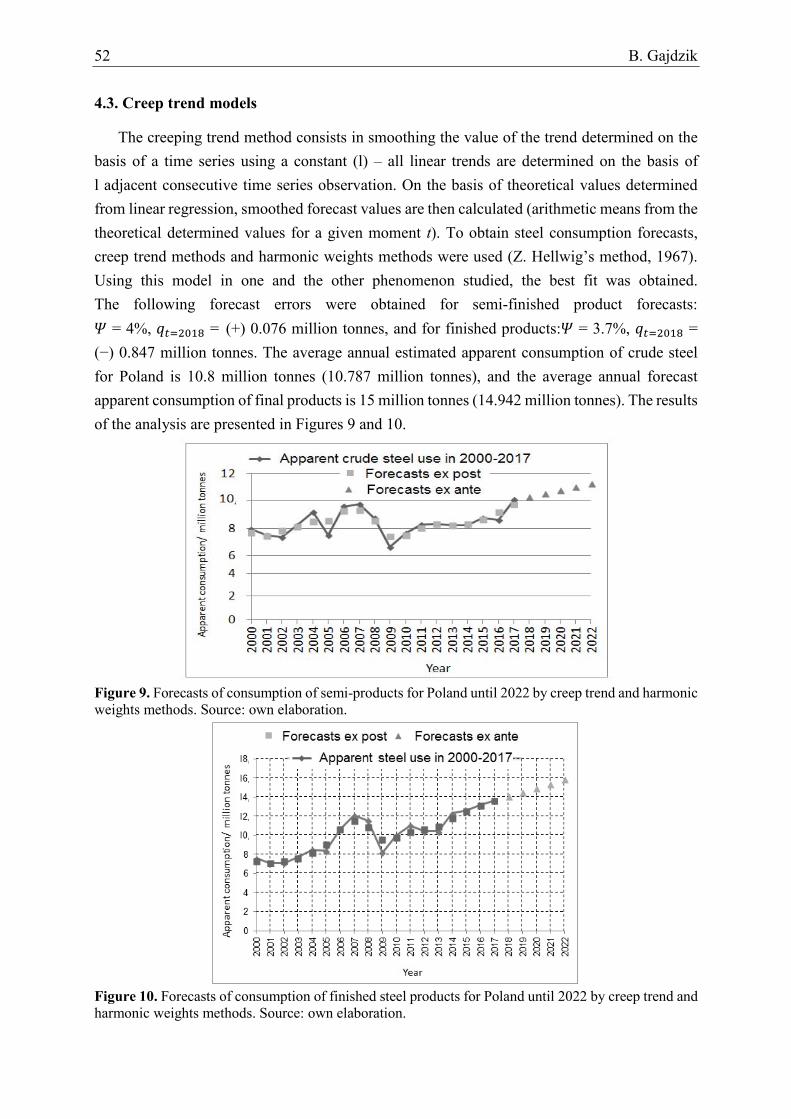
52 B. Gajdzik
4.3. Creep trend models 1
The creeping trend method consists in smoothing the value of the trend determined on the 2
basis of a time series using a constant (l) – all linear trends are determined on the basis of 3
l adjacent consecutive time series observation. On the basis of theoretical values determined 4
from linear regression, smoothed forecast values are then calculated (arithmetic means from the 5
theoretical determined values for a given moment t). To obtain steel consumption forecasts, 6
creep trend methods and harmonic weights methods were used (Z. Hellwig’s method, 1967). 7
Using this model in one and the other phenomenon studied, the best fit was obtained. 8
The following forecast errors were obtained for semi-finished product forecasts: 9
𝛹 = 4%, 𝑞𝑡=2018 = (+) 0.076 million tonnes, and for finished products:𝛹 = 3.7%, 𝑞𝑡=2018 = 10
(−) 0.847 million tonnes. The average annual estimated apparent consumption of crude steel 11
for Poland is 10.8 million tonnes (10.787 million tonnes), and the average annual forecast 12
apparent consumption of final products is 15 million tonnes (14.942 million tonnes). The results 13
of the analysis are presented in Figures 9 and 10. 14
15 Figure 9. Forecasts of consumption of semi-products for Poland until 2022 by creep trend and harmonic 16 weights methods. Source: own elaboration. 17
18 Figure 10. Forecasts of consumption of finished steel products for Poland until 2022 by creep trend and 19 harmonic weights methods. Source: own elaboration. 20
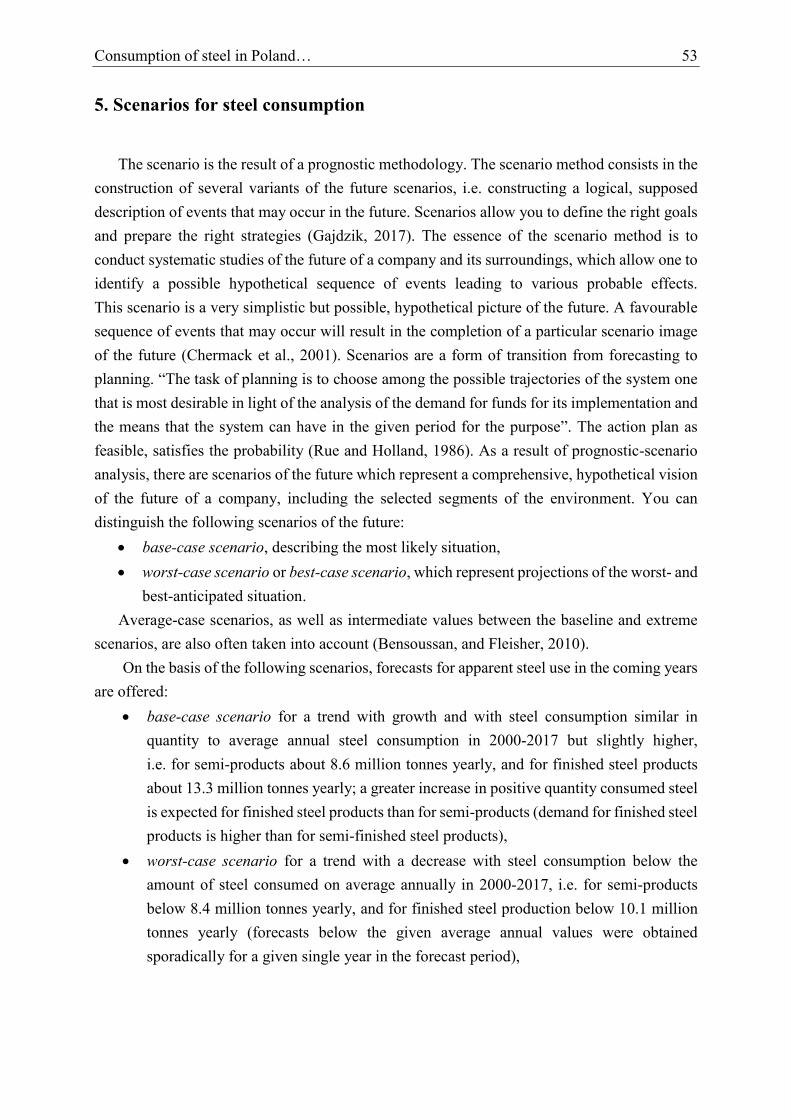
Consumption of steel in Poland… 53
5. Scenarios for steel consumption 1
The scenario is the result of a prognostic methodology. The scenario method consists in the 2
construction of several variants of the future scenarios, i.e. constructing a logical, supposed 3
description of events that may occur in the future. Scenarios allow you to define the right goals 4
and prepare the right strategies (Gajdzik, 2017). The essence of the scenario method is to 5
conduct systematic studies of the future of a company and its surroundings, which allow one to 6
identify a possible hypothetical sequence of events leading to various probable effects. 7
This scenario is a very simplistic but possible, hypothetical picture of the future. A favourable 8
sequence of events that may occur will result in the completion of a particular scenario image 9
of the future (Chermack et al., 2001). Scenarios are a form of transition from forecasting to 10
planning. “The task of planning is to choose among the possible trajectories of the system one 11
that is most desirable in light of the analysis of the demand for funds for its implementation and 12
the means that the system can have in the given period for the purpose”. The action plan as 13
feasible, satisfies the probability (Rue and Holland, 1986). As a result of prognostic-scenario 14
analysis, there are scenarios of the future which represent a comprehensive, hypothetical vision 15
of the future of a company, including the selected segments of the environment. You can 16
distinguish the following scenarios of the future: 17
base-case scenario, describing the most likely situation, 18
worst-case scenario or best-case scenario, which represent projections of the worst- and 19
best-anticipated situation. 20
Average-case scenarios, as well as intermediate values between the baseline and extreme 21
scenarios, are also often taken into account (Bensoussan, and Fleisher, 2010). 22
On the basis of the following scenarios, forecasts for apparent steel use in the coming years 23
are offered: 24
base-case scenario for a trend with growth and with steel consumption similar in 25
quantity to average annual steel consumption in 2000-2017 but slightly higher, 26
i.e. for semi-products about 8.6 million tonnes yearly, and for finished steel products 27
about 13.3 million tonnes yearly; a greater increase in positive quantity consumed steel 28
is expected for finished steel products than for semi-products (demand for finished steel 29
products is higher than for semi-finished steel products), 30
worst-case scenario for a trend with a decrease with steel consumption below the 31
amount of steel consumed on average annually in 2000-2017, i.e. for semi-products 32
below 8.4 million tonnes yearly, and for finished steel production below 10.1 million 33
tonnes yearly (forecasts below the given average annual values were obtained 34
sporadically for a given single year in the forecast period), 35
54 B. Gajdzik
best-case scenario for a trend with strong growth of steel consumption for crude steel 1
and semi-products above 9 million tonnes yearly, and for finished steel products above 2
13 million tonnes yearly (in the first years), and from 15 to 16 million tonnes in 2022. 3
6. Conclusions 4
Based on the analysis of development trends of the models of apparent consumption of steel 5
in Poland in 2000-2017 and the estimated forecasts of apparent consumption of steel until 2022, 6
the following conclusions were drawn: 7
the trend of apparent consumption of steel is not a linear function; there is a decrease or 8
increase in demand for steel in the economy in specific periods, 9
average annual apparent consumption of crude steel in Poland in 2000-2017 was 10
8.362 million tonnes, and average annual apparent consumption of steel products was 11
10.118 million tonnes, 12
in many used forecasting models, forecasts of apparent consumption of crude steel for 13
Poland did not exceed a level of 9 million tonnes yearly until 2022, but forecasts of 14
apparent consumption of finished steel products were higher in particular models: 15
13 million tonnes yearly and more, 16
projections at a level lower than 9 million tonnes of crude steel consumed annually can 17
be considered as the baseline scenario for the Polish steel industry, and projections at 18
a level lower than 13 million tonnes of finished steel products consumed annually can 19
be considered as the baseline scenario for the Polish steel industry, 20
development trends of apparent consumption of finished steel products is characterised 21
by higher growth than apparent consumption of semi-products, which indicates the 22
development of the steel market in Poland. 23
Optimistic scenarios of steel consumption in Poland should be analysed together with the 24
level of utilisation of production capacity in the industry – such analysis will be carried out by 25
the author of the paper in further research. 26
References 27
1. Bensoussan, B., Fleisher, C.S. (2010). Financial Times Guide to Analysis for Managers: 28
Effective Planning Tools & Techniques. Harlow: Prentice-Hall. 29
2. Bostan, I., Onofrei, M. (2012). The economic analysis of the evolution of Romanian ferrous 30
metallurgy. Metalurgija, 4(51), 518-550. 31
Consumption of steel in Poland… 55
3. Chermack, T.J., Lynham, S.A., and Ruona, W.E.A. (2001). A Review of Scenario Planning 1
Literature. Futures Research Quarterly, 17(2), 7-31. 2
4. Gajdzik, B. (2012). Restrukturyzacja przedsiębiorstw w warunkach destabilizacji otoczenia 3
na przykładzie branży hutniczej. Warszawa: Difin. 4
5. Gajdzik, B. (2013). Changes of action strategies in metallurgical enterprises in time of 5
economic crisis. Metalurgija, 5(52), 569-572. 6
6. Gajdzik, B. (2017). The predictive scenario analysis in a business model: Variants of 7
possible steel production trajectories and efficiency in Poland. In: M. Jabłoński (ed.), 8
Strategic performance management. Management science – theory and applications. 9
New concepts and contermproray trends (pp. 235-252). New York: Nova Science 10
Publishers, Inc., Chapter 15. 11
7. Gajdzik, B. (2018). Porestrukturyzacyjne modele funkcji produkcji dla przemysłu 12
hutniczego z prognozami i scenariuszami zmian w wielkości produkcji stali. Gliwice: 13
Wydawnictwo Politechniki Śląskiej. 14
8. Gajdzik, B., Gawlik, R., Skoczypiec, S. (2018). Forecasting-Scenario-Heuristic method 15
proposal for assessment of feasibility of steel production scenarios in Poland – Managerial 16
implications for production engineering. Archives of Civil and Mechanical Engineering, 17
18, 1651. 18
9. Indirect trade in steel. Definitions, methodology and applications (April, 2012). World Steel 19
Association (worldsteel). Accessed: www.worldsteel.org. 20
10. Kardas, M., Szulc, W. (2010). Restrukturyzacja sektora stalowego w Polsce. Prace IMŻ 21
Gliwice, 1, 220-227. 22
11. Krawiec, S, (2014). Adaptacyjne modele wygładzania wykładniczego jako instrument 23
prognozowania krótkoterminowego zjawisk ilościowych. Gliwice: The Silesian Univeristy 24
of Technology. 25
12. Manikowski, A., Tarapata, Z. (2002). Prognozowanie i Symulacja Rozwoju Przedsiębiorstw 26
[Foresight and simulation of development of enterprises]. Warsaw: Druktur. 27
13. Morariu, A., Bostan, I. (2012). Trends in personal and productivity associated with the steel 28
industry in the Romanian economy. Metalurgija, (51)4, 551-554. 29
14. Pawłowski, Z. (1980). Statystyka matematyczna. Warszawa: PWN. 30
15. Pelikán, E. (1999). Principles of Forecasting — A Short Overview. SOFSEM’99: 31
Theory and Practice of Informatics, Proceedings of SOFSEM 1999 Conference, Milovy, 32
Czech Republic, November 27-December 4. In: J. Pavelka, G. Tel, M. Bartosek (Eds.), 33
Lecture Notes in Computer Science, 1725. Berlin: Springer-Verlag, 311-327. 34
16. Polish steel industry – report (2018). Katowice: Polish Steel Association, 20. 35
17. Rębiasz, B. (2003). Analiza stalochłonności PKB w Polsce w latach 1992-2001. 36
Gospodarka Materiałowa i Logistyka, 1, 15-18. 37
56 B. Gajdzik
18. Rębiasz, B., Garbarz, B., Szulc, W. (2004). Wpływ dynamiki i struktury rozwoju 1
gospodarczego Polski na krajowe zużycie stalowych wyrobów hutniczych. Hutnik-2
Wiadomości Hutnicze, 9(71), 454-458. 3
19. Rue, L.W., Holland, P.G. (1986). Strategic Management. Concepts and Experiences. 4
New York: McGraw-Hill Inc., 430-432. 5
20. Steel Statistical Yearbook 2017. World Steel Association. Available online: 6
www.worldsteel.org/internet-2017/steel-by-topic/statistics/steel-statistical-yearbook-.html, 7
5 December 2017. 8
21. Szkutnik, W., Balcerowicz-Szkutnik, M. (2006). Wstęp do metod ekonometrycznych. 9
Metody i zadania. Katowice: Wyższa Szkoła Zarządzania im. gen. Jerzego Ziętka. 10
22. Szulc, W. (2014). Transformacja polskiego hutnictwa do gospodarki wolnorynkowej. Prace 11
Instytutu Metalurgii Żelaza. Gliwice. 12
23. Szulc, W., Garbarz, B., Paduch, J. (2011). Przebieg i wyniki restrukturyzacji sektora 13
stalowego w Polsce. Prace IMŻ w Gliwicach, 4, 40-51. 14
24. The impact of the European steel industry on the EU economy (February, 2018). Eurofer & 15
Oxford Economics, www.eurofer.be. 16
25. The Role of Steel Manufacturing in the Global Economy (May, 2019). Worldsteel & Oxford 17
Economics, www.worldsteel.org. 18
Scientific Quarterly “Organization and Management”, 2020, Vol. 1, No. 49; DOI: 10.29119/1899-6116.2020.49.4 www.oamquarterly.polsl.pl
A COMPANY’S PROACTIVE MARKETING ORIENTATION 1
IN THE HIGH-TECH SECTOR 2
Tomasz GRZEGORCZYK 3
Department of International Management, Poznan University of Economics and Business; 4 [email protected], ORCID: 0000-0002-4286-5753 5
Abstract: This paper links the characteristics of new product development in the high-tech 6
sector with the marketing orientation of the firm, especially in its proactive form. The purpose 7
of the paper is to define the characteristics of competition and innovation creation in the high-8
tech B2C sector and assess whether the marketing orientation of the enterprise may be 9
an answer to those characteristics. Creating innovation in the high-tech sector is difficult due to 10
technological and market (consumer) uncertainty, as well as competitive volatility. 11
This significantly increases the risk of market failure of new products, especially in the case of 12
radical innovations. The way firms may counteract this risk is to adopt a market orientation. 13
Particularly important is its proactive dimension, which involves researching and anticipating 14
future and latent consumer needs. Firms developing new products in the high-tech sector should 15
pursue the proactive marketing orientation and consequently focus on the latent and future 16
consumer needs. Methods stemming from future studies and foresight might be useful in 17
achieving this goal. The methodology used in the paper was the selective literature review in 18
the area of new product development in the high technology sector and marketing orientation 19
of the firm. 20
Keywords: new product development, high-tech sector, marketing orientation, consumer 21
orientation. 22
1. Introduction 23
Most innovations are created in the high-tech sector. The process of their creation is 24
characterised by specific conditions, as is the character of competing in this sector. 25
High technologies mean the newest, most advanced technologies, which e.g. include robotics, 26
nanotechnology or aviation technologies. High-tech companies “are involved in the design, 27
development and marketing of new products and/or innovative production processes through 28
the systematic application of scientific and technical knowledge” (Hecker, 2005, pp. 57-72). 29
Research and development (R&D) departments play a key role in these companies, allowing 30
them to create radical product innovations in opposition to imitative innovations, which are 31
more common in other industries (OECD, 2005, p. 37). 32
58 T. Grzegorczyk
Mick and Fournier point out that high technologies create a paradox for consumers, because 1
they generate both positive and negative emotions that can lead to conflict and fear (1998). 2
Therefore, one cannot be sure of the adoption of technologically innovative products by 3
consumers. This may indicate the need for the company to adopt a marketing orientation. 4
The purpose of this selective literature review is to define the characteristics of competition 5
and innovation creation in the high-tech B2C sector and to evaluate whether the marketing 6
orientation of an enterprise may be an answer to these characteristics, and if so, then how? 7
2. Methods 8
This paper is a selective literature review in the area of new product development in the 9
high technology sector and the marketing orientation of a firm. A selective approach was chosen 10
due to the aim of this study. The following databases were searched: Emerald, ProQuest, Wiley 11
Online Library, Taylor & Francis and ScienceDirect, as well as Google and Google Scholar. 12
The following phrases were used: “high-tech sector characteristics”, “high-tech competition”, 13
“marketing orientation”, “consumer uncertainty”. In order to obtain more relevant publications, 14
the search concentrated on specific criteria: language – English or Polish, refined by categories 15
– management or economics or business, timespan – 1980-2020. Publications which focused 16
on the characteristics of competing in the high-tech B2C (business-to-consumer) sector and 17
proactive and responsive marketing orientation in this sector were selected. 18
3. The characteristics of competing in the high-tech sector 19
The consumer goods market in high-tech industries is one of the most dynamically 20
developing in the world (Wiechoczek, 2016, p. 231). High-tech industries are characterised by 21
special features that make competing particularly demanding, although potentially very 22
profitable. The specificity of the high-tech sector consists primarily of volatility and 23
multidimensional uncertainty among enterprises and consumers. 24
3.1. High-tech sector volatility 25
The competitive volatility of the high technology sector means that companies cannot be 26
sure with whom (the variability of competition), with which products (the variability of the 27
subject of competition) and with what methods (variability of the business strategy) they will 28
compete against even in the near future (Mohr, Sengupta, and Slater 2010, p. 11). 29
A company’s proactive marketing orientation… 59
Among others, this is a result of the convergence - the linking of various technology 1
industries. An example is the smartphone, which is the successor to a traditional mobile phone, 2
which unexpectedly became dangerous competition for portable game consoles. Moreover, 3
rivals from other industries are often more unpredictable in introducing new business models. 4
An example is the introduction of Skype, which allows one to make free Internet calls around 5
the world, which surprised rivals basing their income on long-distance calls. 6
3.2. Firms’ uncertainty in the high-tech sector 7
There is uncertainty on the side of entrepreneurs as to the time needed to introduce 8
technologically advanced products to the market (Mohr, Sengupta and Slater, 2010, pp. 14-15). 9
The time it takes to achieve this is usually longer than for other products. Postponing the market 10
premiere of a product has a negative impact on the satisfaction of the consumers, who can opt 11
for a product offered by competitors. Furthermore, due to technological developments, neither 12
the producer nor the consumer can be certain how long a given technology will remain in use 13
and when it will become obsolete. Moreover, the market for advanced technologies is often 14
regulated by the government and international organisations, which further increases the 15
uncertainty of doing business (Viardot, 2004, pp. 21-23). In order to remain competitive in the 16
high-tech sector, a constant ability to introduce innovations is necessary as a consequence of 17
a shorter product life cycle. For example, Moore’s (Intel’s founder) law says that processor 18
performance doubles every 18 months without raising the prices (Moore, 1965). To maintain 19
this pace, it is necessary to conduct continuous, intensive research. The associated high 20
expenditure on R&D is another feature of this sector, in which the automotive industry excels 21
(Viardot, 2004, pp. 17-19). The development of the high-tech sector is also affected by the 22
phenomenon of knowledge spillover. This means that technological advances in one area 23
influence other branches. Therefore, companies should carefully monitor the state of knowledge 24
not only in their industry, but also in others. Another phenomenon is the merger of technologies, 25
i.e. combining previously different areas of technical knowledge, which increases the 26
uncertainty of this sector. An example is the success of NEC, whose president predicted 27
a merger of the IT sector with telecommunications (Klincewicz, 2016, p. 116). Technological 28
uncertainty is also increasing, as many high-technology products incorporate not one 29
technology, but several technologies (Dhebar, 2016). 30
The high-tech sector is particularly susceptible to the network effect, meaning that the more 31
popular a given product or service is, the greater its value for consumers (Hirynyawipada, and 32
Paswan, 2006, p. 187). A direct network effect occurs when the value of a product or service 33
increases with the number of users, as exemplified by the telephone in the first half of the 34
20th century (Fisher, and Oberholzer-Gee, 2013, p. 162). If the market was not sufficiently 35
saturated with this once technologically advanced device, it would prove to be not very useful 36
for its initial buyers. In turn, the indirect network effect is based on complementary goods that 37
increase the value of the basic product and vice versa. A computer with software is a good 38

60 T. Grzegorczyk
example. The network effect is associated with the need to follow market standards, 1
e.g. in the field of interfaces. The increase in product compatibility with other consumer devices 2
increases its perceived value. Table 1. shows industries ranked by the level of uncertainty. Apart 3
from agriculture, all of them belong to the high-tech sector. 4
Table 1. 5 Industries ranked by the level of uncertainty 6
7
Source: Dyer et al., 2014. 8
3.3. Consumer uncertainty in the high-tech sector 9
The market uncertainty of the high technology sector is manifested as uncertainty about 10
a product’s value for the consumer, as well as a consumer’s future needs. The rate at which the 11
technology spreads is unknown, as well as is the associated difficulty in assessing the size of 12
the market (Moriarty, and Kosnik, 1989, p. 8). Kline and Rosenberg point out that the more 13
innovative a new product is and the more significant changes it introduces, the greater the 14
uncertainty associated with it (1986, p. 276). The sources of uncertainty can also be divided 15
according to economic (e.g. income), socio-demographic (e.g. age, gender and education), 16
cultural (e.g. religion) and psychological (e.g. personality) consumer factors (Tkaczyk, and 17
Awdziej, 2009). 18
Technological uncertainty in the high-tech market encapsulates, among others, uncertainty 19
as to whether an innovative product will work properly and, as a result, if it will meet the 20
consumer’s expectations (Mohr, Sengupta, and Slater, 2010, pp. 14-15). Moreover, in the case 21
of technologically advanced products, there is a widespread belief that there is a greater risk of 22
failure, which may raise concerns regarding the possibility and cost of repairs. Consumers may 23
also wonder if such a product will act as promised by the manufacturer, for example in terms 24
of its usability, performance and reliability (Sarin, Sego, and Chanvarasuth, 2003, pp. 71-72). 25
It is the functional dimension of the uncertainty that has a particularly negative impact on the 26
intention to adopt products from the high-tech sector (Ziamou, and Ratneshwar, 2002, pp. 341-27
342). Consumers may also be concerned about their ability to use a technologically advanced 28
product, as well as about the uncertainty related to the lack of understanding of the mechanism 29
of its operation. This is becoming more and more common nowadays, as the number of new 30
A company’s proactive marketing orientation… 61
technologies and their complexity is growing rapidly (Philips, and Hallman, 2013, pp. 741-1
742). Technology literacy and especially IT literacy play a role in the degree of technological 2
uncertainty. However, even for tech savvy consumers, the principle of a high-tech product’s 3
operation may not be presumed due to the protection of the intellectual property of the company 4
(Hall, Bachor, and Matos, 2014, p. 413). In addition, features such as durability and reliability 5
are revealed only in the process of use, and they are consequently difficult to evaluate before 6
buying. The consumer may, therefore, be worried about whether such a technologically 7
complex product will break down and whether, in the event of a failure, it can be easily repaired, 8
and if so, whether such repairs will be quick and inexpensive. Another key issue is the fear of 9
the physical consequences of a possible malfunction. 10
The magnitude of consumer uncertainty depends on the high-tech product. The more 11
consumers have experience in using a particular product, the less risk is perceived (Frąckiewicz, 12
2009, p. 222). Naturally, for new types of high-tech products, there is very little chance that 13
consumers have any experience in their use. Moreover, consumers may be uncertain as to which 14
consumer needs the given technology fulfils (Mohr, Sengupta, and Slater, 2010, pp. 12-13). 15
Another issue is the short lifespan of technologically advanced products, which, combined with 16
the high purchase price and rapid depreciation of value, increases the purchase risk perceived 17
by the consumer. In addition, consumer needs are changing, which, combined with the desire 18
to have the latest products, increases the risk of purchase. Consumers also face the risk that 19
their product will be replaced by another technological market standard (Sarin, Sego, and 20
Chanvarasuth, 2003, p. 72). For example, in 2007, two different types of high definition DVD 21
players were introduced to the market: Sony Blu-Ray and Toshiba HD-DVD. The movie 22
purchased by the consumer could only be compatible with one of these two types of players. 23
Consumers’ doubts as to which of these formats would become dominant effectively 24
discouraged them from making purchase decisions, which resulted in a significant slowdown 25
of the diffusion rate of these technologies (Mohr, Sengupta, and Slater, 2010, p. 12). Ultimately, 26
the Blu-Ray format displaced HD-DVD, and customers who chose the latter player had to 27
reconcile with the fact that from 2008, they were not able to watch new films on their device. 28
Therefore, industrial standards play a role in either reducing consumer risk (when they are 29
introduced) or increasing consumer risk (when they are lacking). All in all, due to such the large 30
and multidimensional role of uncertainty in the high-tech sector, all actions aimed at reducing 31
this are of particular importance. 32
Most companies offering technologically advanced products have a marketing 33
communication strategy aimed at increasing the acceptance of their products by decreasing the 34
associated risks (Philips, and Hallman, 2013, p. 739). Enterprises use various strategies to 35
reduce perceived technological risk. An example is offering products as part of a bundle, which 36
includes products considered safe (because of a known brand or popularity) and products 37
considered risky due to unknown, advanced technology (Sarin, Sego, and Chanvarasuth, 2003). 38
Manufacturers can also take a number of formal and legal measures to reduce the risk perceived 39
62 T. Grzegorczyk
by the consumer. These include, for example, the manufacturer’s legal liability for damages 1
caused by the product (product liability), granting the right to return the product or providing 2
a guarantee (Taranko, and de Pourbaix, 2009, p. 184). Furthermore, in the case of applied 3
artificial intelligence, such as medical assistive devices (IBM’s Watson, Fraunher IPA’s 4
Care-O-bot 3, AiCure) and autonomous vehicles (BMW, Daimler, Deutsche Bahn), trust in the 5
manufacturer (of both hardware and software) is especially important in reducing the 6
consumer’s uncertainty (Hengstler et al., 2016). 7
4. Proactive and responsive marketing orientation in the high-tech sector 8
Initially, competition in the high-tech sector was mainly based on the fast and simultaneous 9
introduction of radical and incremental innovations (Mohr, Sengupta, and Slater, 2010). 10
At present, however, this approach is no longer sufficient due to hypercompetition (D’Aveni, 11
1997). Companies are forced to seek sources of competitive advantage elsewhere, in particular 12
in marketing activity (Wiechoczek, 2016, p. 231). The marketing orientation of high-tech 13
enterprises results in better new product performance, as well as the overall higher effectiveness 14
of the company (Im and Workman, 2004). Marketing orientation means collecting, sharing and 15
using market information (about consumers, consumer trends or competition) in order to make 16
better strategic decisions, including the process of developing a new product (Mohr, Sengupta, 17
and Slater, 2010, p. 4). Marketing orientation allows for the reduction of uncertainty for 18
a company. This approach underlines that it is important to develop products tailored to the 19
specific expectations of customers. This is possible thanks to the enterprise’s understanding of 20
the clients’ needs, with whom it maintains relations in order to determine the core values that 21
will be expected in the future (Wiśniewski, 2016, p. 325). 22
The process of developing a new product is usually divided into the following stages: idea 23
search, evaluation and selection of ideas, concept development and testing, marketing strategy 24
preparation, business analysis, product development, market tests and commercialisation. 25
According to Armstrong and Kotler, customers play a key role in searching for an idea, and 26
they are the most important source for this (2012, p. 363). The cited authors note, however, that, 27
especially in the case of technologically advanced products, companies cannot be limited to the 28
needs of consumers, and sources of ideas for innovation should be diverse. Wiechoczek (2015) 29
also draws attention to the limited role of consumers as a source of ideas for innovations in the 30
high technology sector. 31
However, at other stages, such as concept testing or market testing, consumer participation 32
is essential. The results of empirical research indicate that consumer-focused marketing 33
orientation is conducive to the creation of radical, novel innovations (Lukas, and Ferrell, 2000). 34
Thus, less imitative innovations are created (“me-too innovation”). However, in the case of 35
A company’s proactive marketing orientation… 63
enterprises focused more on researching the activities of competition, this relationship is 1
inverse. This underlines the importance of research on the determinants of the acceptance of 2
innovations by consumers. 3
Consumers are becoming a more important innovation resource (Tidd, and Schweitzer, 4
2018). Companies must decide whether to concentrate on existing customers and markets or on 5
new customers and markets (Lamore, Berkowitz, and Farrington, 2013). Marketing orientation 6
can be divided into responsive and proactive (Narver, Slater, and MacLachlan, 2004). 7
In the case of the former, the company primarily focuses on current consumers and their 8
existing, expressed needs. Responsive orientation is also characterised as being market demand 9
driven, meaning that the marketing department identifies new product opportunities and 10
communicates with R&D to develop innovative solutions to expressed customer needs 11
(Lamore, Berkowitz, and Farrington, 2013). However, this strategy has disadvantages, 12
including a limitation of innovation. That is why Mohr, Sengupta and Slater are in favour of 13
a proactive marketing orientation, which is based on attempts to predict and meet the latent and 14
future needs of consumers (2010, p. 107). This is regarded as invention driven, meaning that 15
the R&D departments search for innovative solutions. When latent needs are not met by 16
consumers, there is no sign of dissatisfaction or any other response. However, when a company 17
manages to discover such a need and satisfy this, it often gains a loyal customer. 18
Despite the above, in the case of radical innovations, the cooperation between the R&D 19
department and the marketing department is particularly important – even at the initial stages 20
of product development. This is due to the fact that the applications of a new technology may 21
be too numerous or unexpected by the consumer (Mohr, Sengupta, and Slater, 2010, p. 122). 22
Jointly defining the industry and the market in which the product will compete and setting 23
expectations and priorities increase the chances of success in sales. The findings of empirical 24
research confirm that new products of enterprises in which the marketing and R&D departments 25
work closely together more often achieve success (Mohr, Sengupta, and Slater, 2010, p. 121). 26
Lamore, Berkowitz and Farrington (2013) showed that a high degree of synergy is developed 27
between the R&D and marketing department when the focus is on future market needs. 28
Proactive market orientation exhibits a positive relationship with market performance, while 29
responsive market orientation does not. Moreover, responsive customer orientation diminishes 30
the ability to reduce product-related uncertainties at the fuzzy front end of innovation (meaning 31
the early stages of innovation creation) (Schweitzer et al., 2018). 32
Some studies reach for even more detailed methods of analysis. For example, Im and 33
Workman divided the aspect of product innovation in the high-tech sector into its novelty and 34
relevance (2004, p. 115). Novelty is measured as the degree to which new products are unique 35
and different from the competition, and relevance – as the degree to which they are seen as 36
impactful and useful to consumers. The results show that if a company cooperates closely with 37
consumers during product development, relevant products are more often created. However, 38
when a company focuses on observing competition as part of its marketing orientation, it more 39
64 T. Grzegorczyk
often creates novel products. It also turns out that the commercial significance of the product is 1
related more to the relevance dimension, which confirms the importance of consumer research 2
of products at the research and development stage (Im, and Workman, 2004, p. 127). 3
Narver et al. (2004) hypothesised that both forms of market orientation would be positively 4
linked with the success of a new product, with proactive market orientation exhibiting a greater 5
impact. Their results show that proactive market orientation indeed exhibited a positive 6
relationship, while responsive market orientation exhibited a negative relationship with the 7
success of a new product. Moreover, the creation of gradual innovations is helped by responsive 8
marketing orientation, while the formation of radical innovations – proactive marketing 9
orientation (Atuahene-Gima, Slater, and Olson, 2005). In addition, a proactive strategy can lead 10
to a market structure redefined by value innovation and by creating a “blue ocean” where there 11
is no competition at all (Chan Kim, and Mauborgne, 2005). Such attempts are generally very 12
risky, which is why a proactive marketing orientation allows for a reduction of the increased 13
risk. The actions that lead to this are primarily market research on future, non-existent products, 14
observation of consumer habits or cooperation with active users (Sundbo, 1998, p. 152; Mohr, 15
Sengupta, and Slater, 2010, p. 107). This allows for the creation of products with the features 16
and functionalities desired by consumers. 17
Different views are also present in literature. Von Hippel states that the average user of 18
today’s products has no experience with the products of the future (1984). Goldenberg and 19
Mazursky believe that consumer research is an effective method to learn about product 20
strengths and weaknesses, match new products to customer needs or forecast product success 21
and sales, but it is no longer a source of ideas for future radical product innovations (2005, 22
pp. 14-15). This stays in accordance with the findings that the role of the marketing department 23
(responsible for understanding the needs of customers) is increasing along with the time left to 24
the market debut of a new product (Mohr, Sengupta, and Slater, 2010, p. 122). In addition, 25
many ground-breaking innovations are initiated under the supply-push innovation model 26
(Markides, 2006, pp. 22-23). 27
5. Future research 28
This paper has linked the characteristics of innovation creation in the high-tech industry 29
with the marketing orientation of a firm, pointing out the usefulness of proactive marketing 30
orientation. Nevertheless, there still exists a need to reconfirm such a causal connection, 31
as existing research is scarce. 32
Moreover, there are still many other unanswered questions. For example, one could research 33
if there are particular high-tech industries which benefit more from a proactive orientation. 34
Another question arises – are there particular high-tech industries which possibly benefit, 35
A company’s proactive marketing orientation… 65
differently than the majority of the high-tech sector, from a passive marketing orientation? 1
If yes, why is this? 2
Furthermore, if proactive marketing orientation focuses on future and latent consumer 3
needs, is an invention push coming solely from the R&D department really sufficient? 4
There are ways of studying both latent and future consumer needs. For example, latent attitudes 5
can be measured by the Implicit Association Test (Maison, 2004). When it comes to future 6
attitudes, there is a wide array of methods stemming from future studies and strategic foresight, 7
which may allow one to predict the possible future and latent needs of consumers. These are 8
e.g. the scenario method, Delphi method (e.g. Merfeld et al., 2019) or trend analysis. 9
Other methods, such as studying consumers’ technology acceptance of as yet non-existing 10
products, strategic workshops, co-designing (Mencarini et al., 2019) and design thinking 11
methods (e.g. Micheli et al., 2019) may also be helpful. Another source of information is 12
Big Data, which, paired with data science, allows one to gain deep insight into consumer 13
attitudes and behaviour (Erevelles et al., 2016). Therefore, exploring the popularity of these 14
methods for new product development in the high-tech sector, as well as the relation of their 15
introduction with the success of a new product, is suggested. 16
6. Summary 17
The technological advancement of a product is not in itself desirable by the market (Kline, 18
and Rosenberg, 1986, p. 278). The value of a product for a consumer is created by the difference 19
between advantages and cost (Viardot, 2004, pp. 5-6). In addition, the significant role of 20
cooperation in developing innovations (especially radical ones) between the marketing 21
department and the R&D department should be emphasised. Unexpectedly, the importance of 22
this cooperation rises with the increase in the degree of advancement of innovation and 23
uncertainty of the environment (Mohr, Sengupta, Slater, 2010, p. 122). 24
Creating innovation in the high-tech sector is also difficult due to technological and market 25
uncertainty, as well as competitive volatility. This significantly increases the risk of market 26
failure, especially in the case of radical innovations. The way to counteract this risk may be to 27
adopt a market orientation, as it allows one to reduce the sector’s uncertainty. Particularly 28
important is its proactive dimension, which involves researching and anticipating future and 29
latent consumer needs, as well as in the context of new innovative products that are under 30
development. This assumes cooperation with consumers, including research on consumer 31
attitudes towards an innovative product already at the stage of its development, i.e. before it 32
reaches the market. While proactive market orientation exhibits a positive relationship with 33
market performance, responsive market orientation does not. Moreover, responsive customer 34
66 T. Grzegorczyk
orientation diminishes the ability to reduce product-related uncertainties at the early stages of 1
innovation creation. 2
Novel directions of future research are indicated, and among them are methods aimed 3
at lowering uncertainty: the scenario method, Delphi method, trend analysis, studying 4
consumers’ technology acceptance of as yet non-existing products, strategic workshops, 5
co-designing, design thinking methods, as well Big Data analysis. 6
References 7
1. Tidd, J., Schweitzer, F. (2018). Innovation heroes: Understanding customers as a valuable 8
innovation resource. In: J. Tidd, J.R. Bessant (eds.), Managing Innovation. Integrating 9
Technological, Market and Organizational Change, 1-295. https://doi.org/10.1142/q0158. 10
2. Dhebar, A. (2016). Bringing new high-technology products to market: Six perils awaiting 11
marketers. Business Horizons, 59(6), 713-722. 12
3. Mencarini, E., Leonardi, C., Cappelletti, A., Giovanelli, D., De Angeli, A., & Zancanaro, 13
M. (2019). Co-designing wearable devices for sports: The case study of sport climbing. 14
International Journal of Human Computer Studies, 124(July 2018), 26-43. https://doi.org/ 15
10.1016/j.ijhcs.2018.10.005. 16
4. Schweitzer, F., Palmié, M., & Gassmann, O. (2018). Beyond listening: the distinct effects 17
of proactive versus responsive customer orientation on the reduction of uncertainties at the 18
fuzzy front end of innovation. R&D Management, 48(5), 534-551. https://doi.org/10.1111/ 19
radm.12252. 20
5. Armstrong, G., Kotler, P. (2012). Marketing. Wprowadzenie. Warszawa: Pearson Education 21
Inc. 22
6. Atuahene-Gima, K., Slater, S.F., and Olson, E.M. (2005). The Contingent Value of 23
Responsive and Proactive Market Orientations for New Product Program Performance, 24
Journal of Product Innovation Management, 22, 464-482. 25
7. Chan Kim, W., and Mauborgne, R. (2005). Strategia błękitnego oceanu: jak stworzyć wolną 26
przestrzeń rynkową i sprawić, by konkurencja stała się nieistotna. Warszawa: 27
Wydawnictwo MT Biznes. 28
8. D'Aveni, R.A., and Gunther, R.E. (1994). Hypercompetition: Managing the dynamics of 29
strategic maneuvering. New York: The Free Press. 30
9. Dyer, J., Furr, N., Lefrandt, C. (2014). The industries plagued by most the most uncertainty. 31
Harvard Business Review, hbr.org. 32
10. Erevelles, S., Fukawa, N., & Swayne, L. (2016). Big Data consumer analytics and the 33
transformation of marketing. Journal of Business Research, 69(2), 897-904. https://doi.org/ 34
10.1016/j.jbusres.2015.07.001. 35
A company’s proactive marketing orientation… 67
11. Fisher, W.W., and Oberholzer-Gee, F. (2013). Strategic Management of Intellectual 1
Property: An Integrated Approach, California Management Review, 55(4), 157-184. 2
12. Frąckiewicz, E. (2009). Ryzyko cyfrowe nabywcy – pojęcie i znaczenie. In: L. Garbarski, 3
J. Tkaczyk (eds.), Kontrowersje wokół marketingu w Polsce. Niepewność i zaufanie 4
a zachowania nabywców (pp. 220-229). Warszawa: Wydawnictwo Akademickie 5
i Profesjonalne. 6
13. Goldenberg, J., and Mazursky, D. (2002). Creativity in product innovation. Cambridge: 7
Cambridge University Press. 8
14. Hall, J., Bachor, V., and Matos, S. (2014). The impact of stakeholder heterogeneity on risk 9
perceptions in technological innovation. Technovation, 34(8), 410-419. http://doi.org/ 10
10.1016/j.technovation.2013.12.002. 11
15. Hecker, D.E. (2005). High-technology employment: NCAIS based update. Monthly Labor 12
Review, June. 13
16. Hengstler, M., Enkel, E., & Duelli, S. (2016). Applied artificial intelligence and trust – 14
The case of autonomous vehicles and medical assistance devices. Technological 15
Forecasting and Social Change, 105, 105-120. https://doi.org/10.1016/j.techfore. 16
2015.12.014. 17
17. Hirunyawipada, T., and Paswan, K. (2006). Consumer innovativeness and perceived risk: 18
Implications for high technology product adoption. Journal of Consumer Marketing, 23(4), 19
182-198. http://doi.org/10.1108/07363760610674310. 20
18. https://doi.org/10.1016/j.bushor.2016.08.006. 21
19. Im, S., and Workman, J.P. (2004). Market Orientation, Creativity, and New Product 22
Performance in High-Technology Firms A. Journal of Marketing, 68, 114-132. 23
http://doi.org/10.1509/jmkg.68.2.114.2778. 24
20. Klincewicz, K. (2016). Zarządzanie technologiami – perspektywa organizacji-25
użytkownika. In: K. Klincewicz (ed.), Zarządzanie, organizacje i organizowanie – przegląd 26
perspektyw teoretycznych (pp. 110-123), Warszawa: Wydawnictwo Naukowe Wydziału 27
Zarządzania Uniwersytetu Warszawskiego. 28
21. Kline, S., and Rosenberg, N. (1986). An overview of innovation. In: R. Landau, 29
N. Rosenberg (eds.), The Positive Sum Strategy. Harnessing Technology for Economic 30
Growth. Washington: National. Academy Press. 31
22. Lamore, P.R., Berkowitz, D., and Farrington, P.A. (2013). Proactive/responsive market 32
orientation and marketing – Research and development integration. Journal of Product 33
Innovation Management, 30(4), 695-711. https://doi.org/10.1111/jpim.12024. 34
23. Lukas, B.A., and Ferrell, O.C. (2000). The effect of product orientation on product 35
innovation, Journal of the Academy of Marketing Science, 28(2). 36
24. Maison, D. (2004). Utajone postawy konsumenckie. Sopot: GWP. 37
68 T. Grzegorczyk
25. Markides, C. (2006). Disruptive Innovation: In Need of Better Theory. Business-Model 1
Innovation. Harvard Business Review, 23, 19-25. http://doi.org/10.1111/j.1540-5885. 2
2005.00177.x. 3
26. Merfeld, K., Wilhelms, M.P., Henkel, S., and Kreutzer, K. (2019). Carsharing with shared 4
autonomous vehicles: Uncovering drivers, barriers and future developments – A four-stage 5
Delphi study. Technological Forecasting and Social Change, 144(March), 66-81. 6
https://doi.org/10.1016/j.techfore.2019.03.012. 7
27. Micheli, P., Wilner, S.J.S., Bhatti, S.H., Mura, M., and Beverland, M.B. (2019). Doing 8
Design Thinking: Conceptual Review, Synthesis, and Research Agenda. Journal of Product 9
Innovation Management, 36(2), 124-148. https://doi.org/10.1111/jpim.12466. 10
28. Mick, D.G., and Fournier, S. (1998). Paradoxes of Technology: Consumer Cognizance, 11
Emotions, and Coping Strategies, Journal of Consumer Research, 25(2), 123-143. 12
doi: 10.1086/209531. 13
29. Mohr, J., Sengupta, S., and Slater, S. (2010). Marketing of high-technology products and 14
innovations. New Jersey: Pearson Education Inc. 15
30. Moore, G.E. (1965). Cramming More Components Onto Integrated Circuits, Electronics, 16
April 19, 1965. Electronics, 38(8), 82-85. 17
31. Moriarty, R.T., Kosnik, T.J. (1989). High-tech marketing: concepts, continuity, and change. 18
MIT Sloan Management Review, 30(4). 19
32. Narver, J.C., Slater, S.F., and MacLachlan, D.L. (2004). Responsive and proactive market 20
orientation and new-product success. Journal of Product Innovation Management, 21(5), 21
334-347. https://doi.org/10.1111/j.0737-6782.2004.00086.x. 22
33. Organization for Economic Cooperation and Development and Statistical Office of the 23
European Communities (2005). The measurement of scientific and technological activities: 24
guidelines for collecting and interpreting innovation. Oslo Manual. Paris: OECD 25
Publishing. 26
34. Philips, D., Hallman, W. (2013). Consumer Risk Perceptions and Marketing Strategy: 27
The Case of Genetically Modified Food. Psychology & Marketing, 30(9), DOI: 10.1002/ 28
mar.20642. 29
35. Sarin, S., Sego, T., and Chanvarasuth, N. (2003). Strategic use of bundling for reducing 30
consumers’ perceived risk associated with the purchase of new high-tech products. Journal 31
of Marketing Theory and Practice, 11(3). 32
36. Sundbo, J. (1998). The Theory of Innovation. Entrepreneurs, Technology and Strategy. 33
Northhampton: Edward Elgar. 34
37. Taranko, T., de Pourbaix, P. (2009). Niepewność w zachowaniach konsumentów i sposoby 35
jej ograniczenia. In: L. Garbarski, J. Tkaczyk (eds.), Kontrowersje wokół marketingu 36
w Polsce. Niepewność i zaufanie a zachowania nabywców (pp. 175-186). Warszawa: 37
Wydawnictwo Akademickie i Profesjonalne. 38
A company’s proactive marketing orientation… 69
38. Tkaczyk, J., Awdziej, M. (2009). Istota i kategorie niepewności w odniesieniu do 1
nabywców. In: L. Garbarski, J. Tkaczyk (eds.), Kontrowersje wokół marketingu w Polsce. 2
Niepewność i zaufanie a zachowania nabywców (pp. 52-60). Warszawa: Wydawnictwo 3
Akademickie i Profesjonalne. 4
39. Viardot, E. (2004). Successful Marketing Strategy for High-Tech Firms. Boston: Artech 5
House. 6
40. Von Hippel, E. (1984). Novel Product Concepts from Lead User: Segmenting Users by 7
Experience. Marketing Science Institute Working Paper, Report No. 84-109. 8
41. Wiechoczek, J. (2015). Źródła innowacji produktowych w sektorze wytwórców dóbra 9
zaawansowanych technicznie, Logistyka, 2. 10
42. Wiechoczek, J. (2016). Tendencje w rozwoju marketingu mobilnego producentów dóbr 11
zaawansowanych technologicznie. Studia Ekonomiczne. Zeszyty Naukowe Uniwersytetu 12
Ekonomicznego w Katowicach, 254. 13
43. Wiśniewski, P. (2016). Marketing – relacja wymiany wartości. In: K. Klincewicz (ed.), 14
Zarządzanie, organizacje i organizowanie – przegląd perspektyw teoretycznych. 15
Warszawa: Wydawnictwo Naukowe Wydziału Zarządzania Uniwersytetu Warszawskiego. 16
44. Ziamou, P., and Ratneshwar, S. (2002). Promoting Consumer Adoption of High-17
Technology Products: Is More Information Always Better? Journal of Consumer 18
Psychology, 12(4), 341-351. http://doi.org/10.1207/S15327663JCP1204_0. 19

Scientific Quarterly “Organization and Management”, 2020, Vol. 1, No. 49; DOI: 10.29119/1899-6116.2020.49.5 www.oamquarterly.polsl.pl
THE RESEARCH OF PROJECT MATURITY IN MINING SERVICE
ENTERPRISES IN POLAND
Jarosław JAMROZY1, Krzysztof WODARSKI2*, Barbara SORYCHTA-WOJSCZYK3
1 Remagum Sp. z o.o. Sp.k., Mysłowice; [email protected] 2 Silesian University of Technology, Faculty of Organization and Management, Zabrze;
[email protected]., ORCID: 0000-0002-4725-1064 3 Silesian University of Technology, Faculty of Organization and Management, Zabrze;
[email protected]., ORCID: 0000-0002-5237-8908
* Correspondence author
Abstract: Project maturity is the ability of an organisation to effectively select a project
portfolio in such a way that the execution of these projects contributes to the objectives and
strategy of the organisation and the ability to apply professional project management techniques
and tools in order to achieve high quality project products, repeatability of successes and avoid
failure in forthcoming projects. The article presents the results of preliminary survey research
aiming to assess the degree of maturity in project management in the scope of methods and
tools, human resources, environment and knowledge management. The research was conducted
in mining service enterprises in Poland.
Keywords: project management, project maturity, mining service enterprise.
1. Project maturity of an organisation
The maturity of an organisation can be regarded as the organisation's ability to effectively
manage projects. The Project Management Institute may also define an organisation's project
maturity as the ability to select projects whose implementation leads to the achievement of the
organisation's objectives (PMI, 2008). According to the Software Engineering Institute
(OGC, 2007), this is the level of development of an organisation in relation to project
management or the organisation's willingness to implement projects. An interesting definition
is given by J. Schlichter (Wyrozębski, Juchniewicz, Matelski, 2012), treating this concept
as the ability of an organisation to identify project success factors and prevent project problems.
Therefore, in literature on the subject, the term "project maturity of an organisation" is defined
in a number of different ways. Many definitions emphasise the different criteria that
an organisation has to meet in order to be defined as mature. This means that the process of

72 J. Jamrozy, K. Wodarski, B. Sorychta-Wojsczyk
reaching maturity is related to improving skills until they are fully achieved in various
dimensions: economic, social or biological (Juchniewicz, 2009).
Kerzner (Kerzner, 2005) defines maturity as "the degree of development of a system and
processes that are inherently repetitive and likely to be successful in future projects. However,
the repeatability of systems and processes does not guarantee success, but only increases its
chances". This signifies that as the level of project maturity increases, the organisation achieves
a higher degree of excellence, reflecting its development.
Project maturity is an organisation's ability to effectively select a project portfolio in such
a way that the implementation of these projects supports the organisation's objectives and
strategy, as well as its ability to use professional project management techniques and tools in
order to achieve high quality project products, repeatability of successes and avoid failures in
upcoming projects (Juchniewicz, 2012).
Project Management Maturity Models are used to measure an organisation's project
maturity. The maturity model is defined as a structured set of elements describing specific
aspects of an organisation's maturity, which also helps to define and understand processes in
the organisation. The maturity model often includes a common terminology, a common vision
and structure for setting priorities for improvement actions. The most common universal
models nowadays are:
Organisational Project Management Maturity Model (OPM3) (PMI, 2008),
Prince 2 Maturity Model (OGC, 2007),
Project Management Maturity Model (PMI, 2008),
Project Management Process Maturity Model – PM2 (PMI, 2008),
Project Management Maturity Model – ProMMM (Kerzner, 2005),
Strategic Project Management Maturity Model (Schott, Campana, 2005; Grundy,
Brown, 2002).
Project Maturity Models can be divided into two groups. The first group of models (which
includes, among others, Prince2 Maturity Model, Kerzner Project Management Maturity
Model, OGC Project Management Maturity Model and PM Solutions Project Management
Maturity Model) involves assigning an organisation to one of several levels of project maturity
(usually five), and these are of a static and dynamic nature. The second group comprises models
that do not determine the level of maturity of the organisation but use them to assess individual
areas of project management in the organisation. The result of the assessment is mostly
expressed in percentages and points. This group includes the Organisational Project
Management Maturity Model (OPM3) and all other related models, most often developed by
consulting companies based on OPM3.
For the purpose of this article, the model proposed by Spałek (Spałek, 2013) was used,
in which the degree of maturity in project management should be assessed in the following four
key areas:
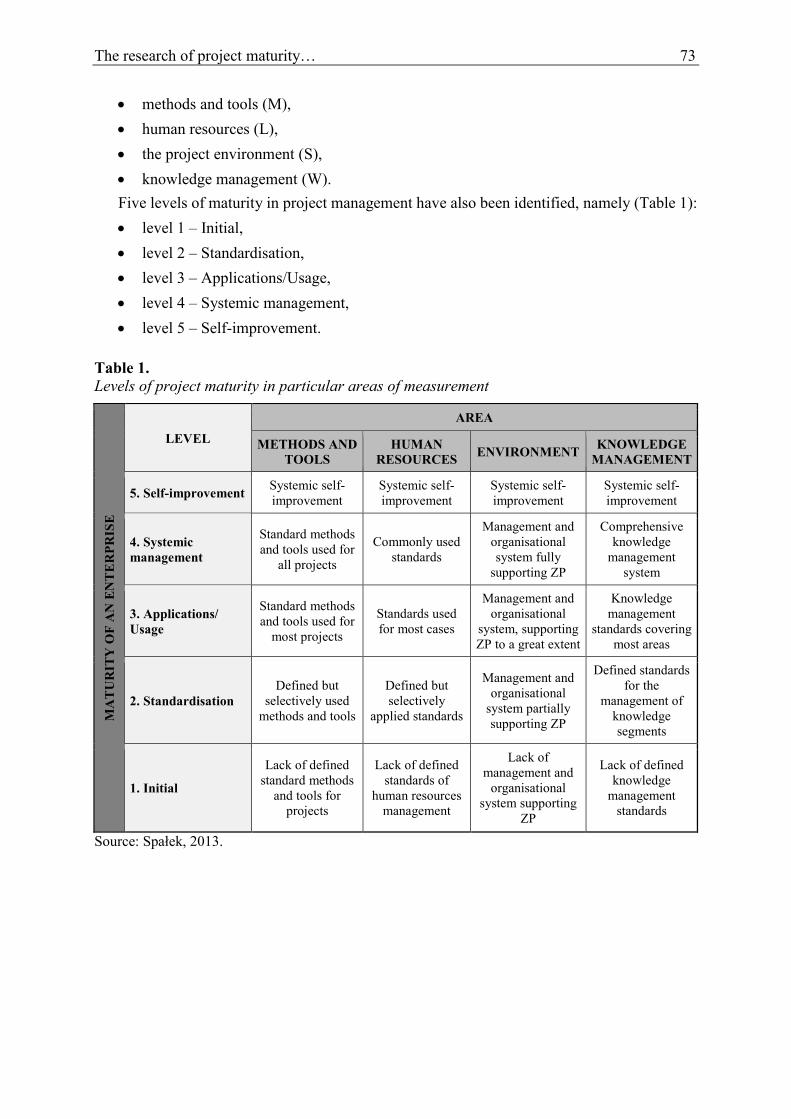
The research of project maturity… 73
methods and tools (M),
human resources (L),
the project environment (S),
knowledge management (W).
Five levels of maturity in project management have also been identified, namely (Table 1):
level 1 – Initial,
level 2 – Standardisation,
level 3 – Applications/Usage,
level 4 – Systemic management,
level 5 – Self-improvement.
Table 1.
Levels of project maturity in particular areas of measurement
MA
TU
RIT
Y O
F A
N E
NT
ER
PR
ISE
LEVEL
AREA
METHODS AND
TOOLS
HUMAN
RESOURCES ENVIRONMENT
KNOWLEDGE
MANAGEMENT
5. Self-improvement Systemic self-
improvement
Systemic self-
improvement
Systemic self-
improvement
Systemic self-
improvement
4. Systemic
management
Standard methods
and tools used for
all projects
Commonly used
standards
Management and
organisational
system fully
supporting ZP
Comprehensive
knowledge
management
system
3. Applications/
Usage
Standard methods
and tools used for
most projects
Standards used
for most cases
Management and
organisational
system, supporting
ZP to a great extent
Knowledge
management
standards covering
most areas
2. Standardisation
Defined but
selectively used
methods and tools
Defined but
selectively
applied standards
Management and
organisational
system partially
supporting ZP
Defined standards
for the
management of
knowledge
segments
1. Initial
Lack of defined
standard methods
and tools for
projects
Lack of defined
standards of
human resources
management
Lack of
management and
organisational
system supporting
ZP
Lack of defined
knowledge
management
standards
Source: Spałek, 2013.
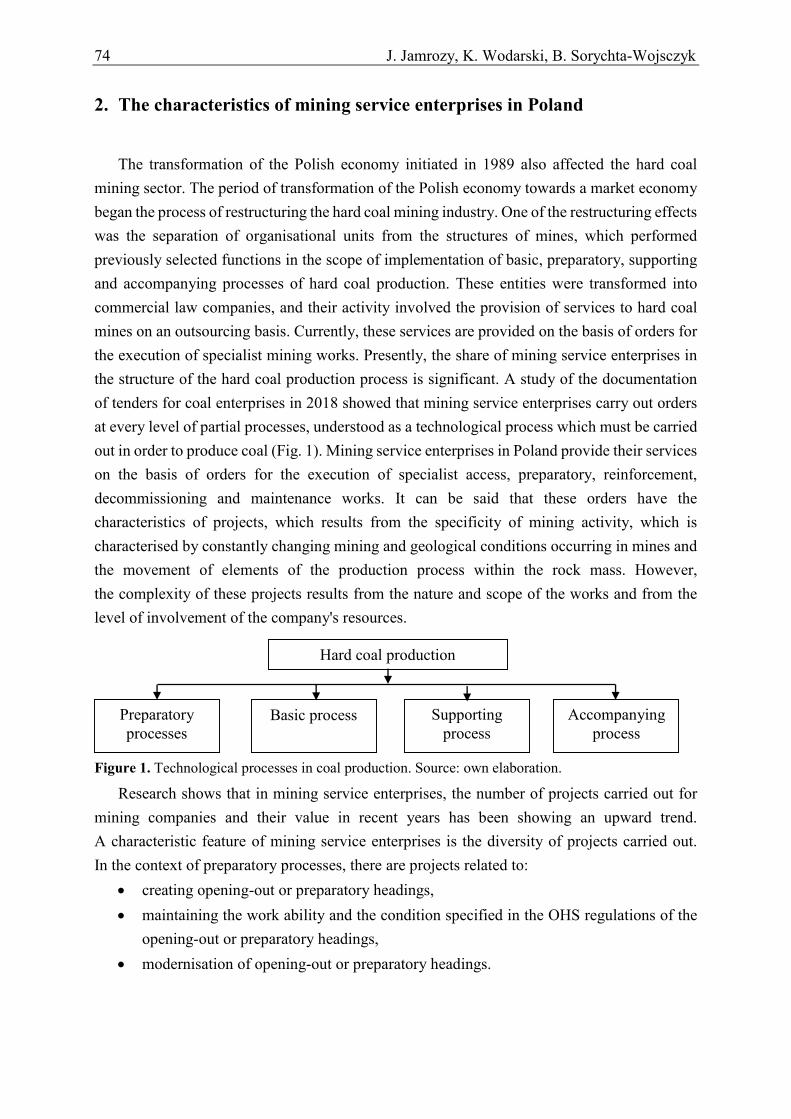
74 J. Jamrozy, K. Wodarski, B. Sorychta-Wojsczyk
2. The characteristics of mining service enterprises in Poland
The transformation of the Polish economy initiated in 1989 also affected the hard coal
mining sector. The period of transformation of the Polish economy towards a market economy
began the process of restructuring the hard coal mining industry. One of the restructuring effects
was the separation of organisational units from the structures of mines, which performed
previously selected functions in the scope of implementation of basic, preparatory, supporting
and accompanying processes of hard coal production. These entities were transformed into
commercial law companies, and their activity involved the provision of services to hard coal
mines on an outsourcing basis. Currently, these services are provided on the basis of orders for
the execution of specialist mining works. Presently, the share of mining service enterprises in
the structure of the hard coal production process is significant. A study of the documentation
of tenders for coal enterprises in 2018 showed that mining service enterprises carry out orders
at every level of partial processes, understood as a technological process which must be carried
out in order to produce coal (Fig. 1). Mining service enterprises in Poland provide their services
on the basis of orders for the execution of specialist access, preparatory, reinforcement,
decommissioning and maintenance works. It can be said that these orders have the
characteristics of projects, which results from the specificity of mining activity, which is
characterised by constantly changing mining and geological conditions occurring in mines and
the movement of elements of the production process within the rock mass. However,
the complexity of these projects results from the nature and scope of the works and from the
level of involvement of the company's resources.
Figure 1. Technological processes in coal production. Source: own elaboration.
Research shows that in mining service enterprises, the number of projects carried out for
mining companies and their value in recent years has been showing an upward trend.
A characteristic feature of mining service enterprises is the diversity of projects carried out.
In the context of preparatory processes, there are projects related to:
creating opening-out or preparatory headings,
maintaining the work ability and the condition specified in the OHS regulations of the
opening-out or preparatory headings,
modernisation of opening-out or preparatory headings.
Hard coal production
Preparatory
processes
Basic process Supporting
process
Accompanying
process
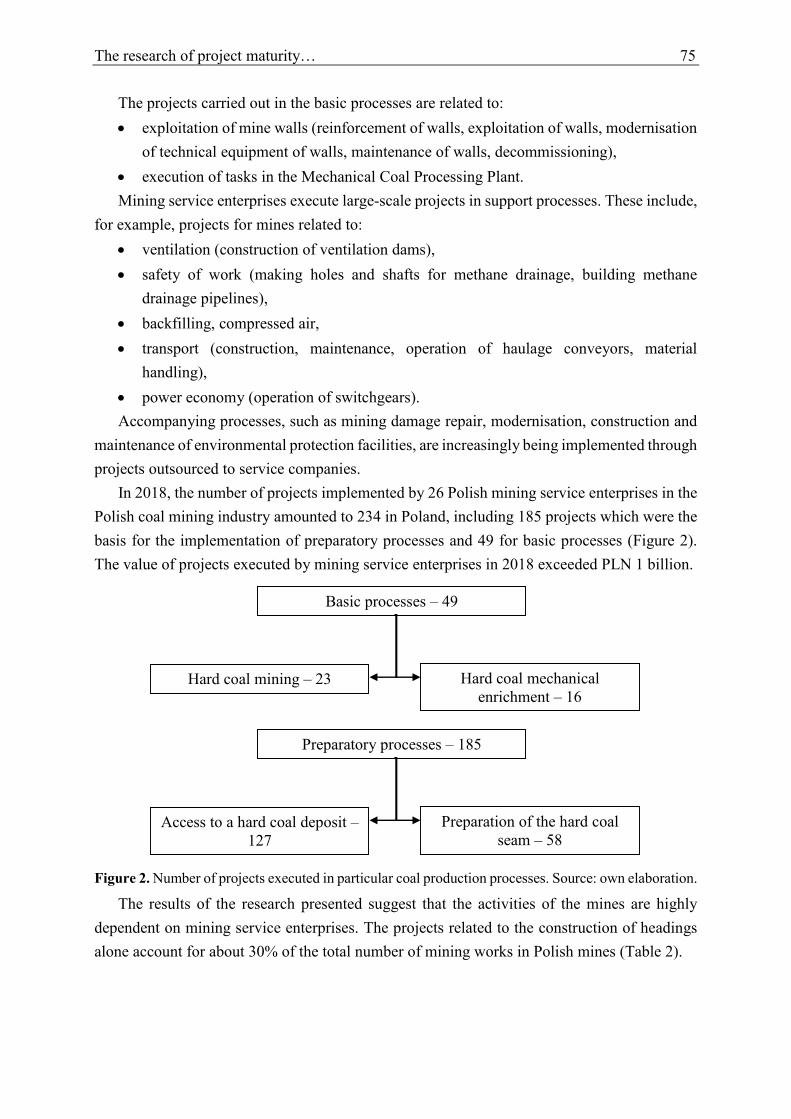
The research of project maturity… 75
The projects carried out in the basic processes are related to:
exploitation of mine walls (reinforcement of walls, exploitation of walls, modernisation
of technical equipment of walls, maintenance of walls, decommissioning),
execution of tasks in the Mechanical Coal Processing Plant.
Mining service enterprises execute large-scale projects in support processes. These include,
for example, projects for mines related to:
ventilation (construction of ventilation dams),
safety of work (making holes and shafts for methane drainage, building methane
drainage pipelines),
backfilling, compressed air,
transport (construction, maintenance, operation of haulage conveyors, material
handling),
power economy (operation of switchgears).
Accompanying processes, such as mining damage repair, modernisation, construction and
maintenance of environmental protection facilities, are increasingly being implemented through
projects outsourced to service companies.
In 2018, the number of projects implemented by 26 Polish mining service enterprises in the
Polish coal mining industry amounted to 234 in Poland, including 185 projects which were the
basis for the implementation of preparatory processes and 49 for basic processes (Figure 2).
The value of projects executed by mining service enterprises in 2018 exceeded PLN 1 billion.
Figure 2. Number of projects executed in particular coal production processes. Source: own elaboration.
The results of the research presented suggest that the activities of the mines are highly
dependent on mining service enterprises. The projects related to the construction of headings
alone account for about 30% of the total number of mining works in Polish mines (Table 2).
Basic processes – 49
Hard coal mining – 23 Hard coal mechanical
enrichment – 16
Preparatory processes – 185
Access to a hard coal deposit –
127
Preparation of the hard coal
seam – 58
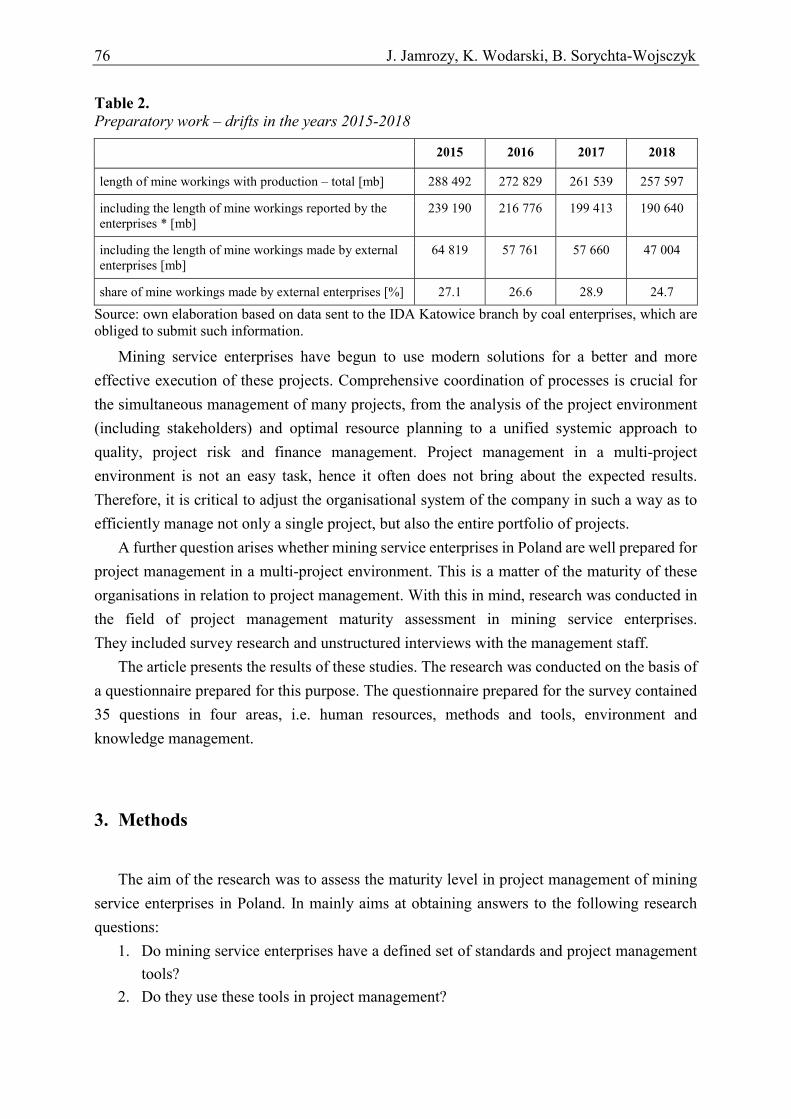
76 J. Jamrozy, K. Wodarski, B. Sorychta-Wojsczyk
Table 2.
Preparatory work – drifts in the years 2015-2018
2015 2016 2017 2018
length of mine workings with production – total [mb] 288 492 272 829 261 539 257 597
including the length of mine workings reported by the
enterprises * [mb] 239 190 216 776 199 413 190 640
including the length of mine workings made by external
enterprises [mb] 64 819 57 761 57 660 47 004
share of mine workings made by external enterprises [%] 27.1 26.6 28.9 24.7
Source: own elaboration based on data sent to the IDA Katowice branch by coal enterprises, which are
obliged to submit such information.
Mining service enterprises have begun to use modern solutions for a better and more
effective execution of these projects. Comprehensive coordination of processes is crucial for
the simultaneous management of many projects, from the analysis of the project environment
(including stakeholders) and optimal resource planning to a unified systemic approach to
quality, project risk and finance management. Project management in a multi-project
environment is not an easy task, hence it often does not bring about the expected results.
Therefore, it is critical to adjust the organisational system of the company in such a way as to
efficiently manage not only a single project, but also the entire portfolio of projects.
A further question arises whether mining service enterprises in Poland are well prepared for
project management in a multi-project environment. This is a matter of the maturity of these
organisations in relation to project management. With this in mind, research was conducted in
the field of project management maturity assessment in mining service enterprises.
They included survey research and unstructured interviews with the management staff.
The article presents the results of these studies. The research was conducted on the basis of
a questionnaire prepared for this purpose. The questionnaire prepared for the survey contained
35 questions in four areas, i.e. human resources, methods and tools, environment and
knowledge management.
3. Methods
The aim of the research was to assess the maturity level in project management of mining
service enterprises in Poland. In mainly aims at obtaining answers to the following research
questions:
1. Do mining service enterprises have a defined set of standards and project management
tools?
2. Do they use these tools in project management?
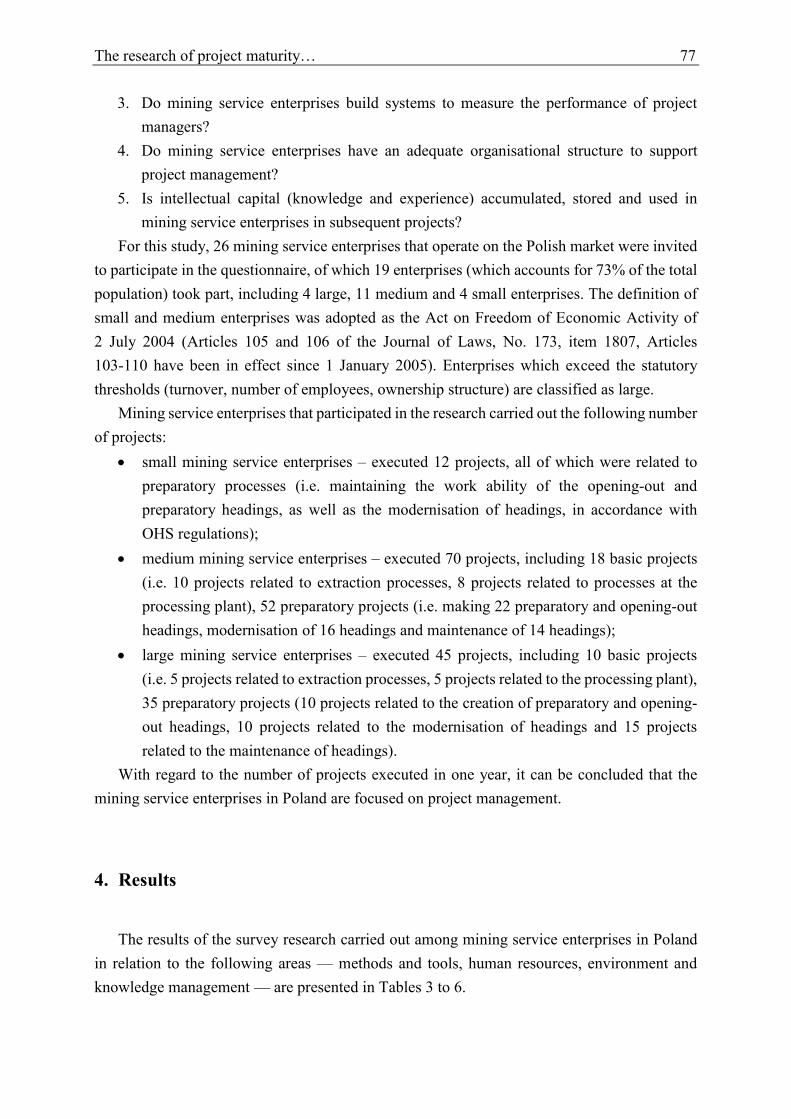
The research of project maturity… 77
3. Do mining service enterprises build systems to measure the performance of project
managers?
4. Do mining service enterprises have an adequate organisational structure to support
project management?
5. Is intellectual capital (knowledge and experience) accumulated, stored and used in
mining service enterprises in subsequent projects?
For this study, 26 mining service enterprises that operate on the Polish market were invited
to participate in the questionnaire, of which 19 enterprises (which accounts for 73% of the total
population) took part, including 4 large, 11 medium and 4 small enterprises. The definition of
small and medium enterprises was adopted as the Act on Freedom of Economic Activity of
2 July 2004 (Articles 105 and 106 of the Journal of Laws, No. 173, item 1807, Articles
103-110 have been in effect since 1 January 2005). Enterprises which exceed the statutory
thresholds (turnover, number of employees, ownership structure) are classified as large.
Mining service enterprises that participated in the research carried out the following number
of projects:
small mining service enterprises – executed 12 projects, all of which were related to
preparatory processes (i.e. maintaining the work ability of the opening-out and
preparatory headings, as well as the modernisation of headings, in accordance with
OHS regulations);
medium mining service enterprises – executed 70 projects, including 18 basic projects
(i.e. 10 projects related to extraction processes, 8 projects related to processes at the
processing plant), 52 preparatory projects (i.e. making 22 preparatory and opening-out
headings, modernisation of 16 headings and maintenance of 14 headings);
large mining service enterprises – executed 45 projects, including 10 basic projects
(i.e. 5 projects related to extraction processes, 5 projects related to the processing plant),
35 preparatory projects (10 projects related to the creation of preparatory and opening-
out headings, 10 projects related to the modernisation of headings and 15 projects
related to the maintenance of headings).
With regard to the number of projects executed in one year, it can be concluded that the
mining service enterprises in Poland are focused on project management.
4. Results
The results of the survey research carried out among mining service enterprises in Poland
in relation to the following areas — methods and tools, human resources, environment and
knowledge management — are presented in Tables 3 to 6.
78 J. Jamrozy, K. Wodarski, B. Sorychta-Wojsczyk
5. Discussion
The discussion of the survey research results was conducted for the areas of methods and
tools, human resources, environment and knowledge management.
The area of methods and tools
The survey research showed that 90% of the enterprises participating in the research
(i.e. 17 mining service enterprises) have an established project management policy, including
all medium and large mining service enterprises. This policy is established in 50% of the small
mining service enterprises. The examined enterprises have defined methods and tools and apply
them in most projects; this is the case in 74% of enterprises. However, it should be noted that
100% of medium and large enterprises use methods and tools for project management and adapt
them to the needs of individual projects (i.e. 45% of medium and 75% of large enterprises use
project management methods and tools). However, only 25% of small mining service
enterprises use project management methods and tools. All surveyed medium and large
enterprises have a common, defined language to describe the activities and results in the project,
and only 25% of small enterprises have a common and well-defined language to describe the
activities and results in the project.
In the scope of methods and tools, the project maturity of medium and large mining service
enterprises should be evaluated at level 3 (Applications/Usage), which implies the use of
standard methods and tools in most projects. However, for small mining service enterprises,
the project maturity here is at level 1 (Initial). In other words, the small mining service
enterprises do not have defined standard methods and tools for project management.
The area of human resources
The conducted research indicates that 84% of enterprises have a quality management
system certified by an external organisation, i.e. all medium and large enterprises, but only one
small mining service enterprise. With regard to the existence of qualified project managers,
79% of enterprises have such employees, while all large enterprises and 91% of medium
enterprises, and only 25% of small enterprises, have such employees. In 92% of large
enterprises, there are systems ensuring adequate competences and professional development of
managers and people assigned to projects, while in medium and small mining service
enterprises, this is only true in 45% and 25% of cases, respectively.
In small mining service enterprises, the project maturity was assessed at level 1 (Initial).
This is due to the fact that they do not have defined standards of human resources management.
In medium mining service enterprises, the project maturity was assessed at level 2
(Standardisation). This means the application of selectively defined standards. In large mining
service enterprises, the project maturity was assessed at level 3 (Applications/Usage), where
human resources management standards are applied in most projects.
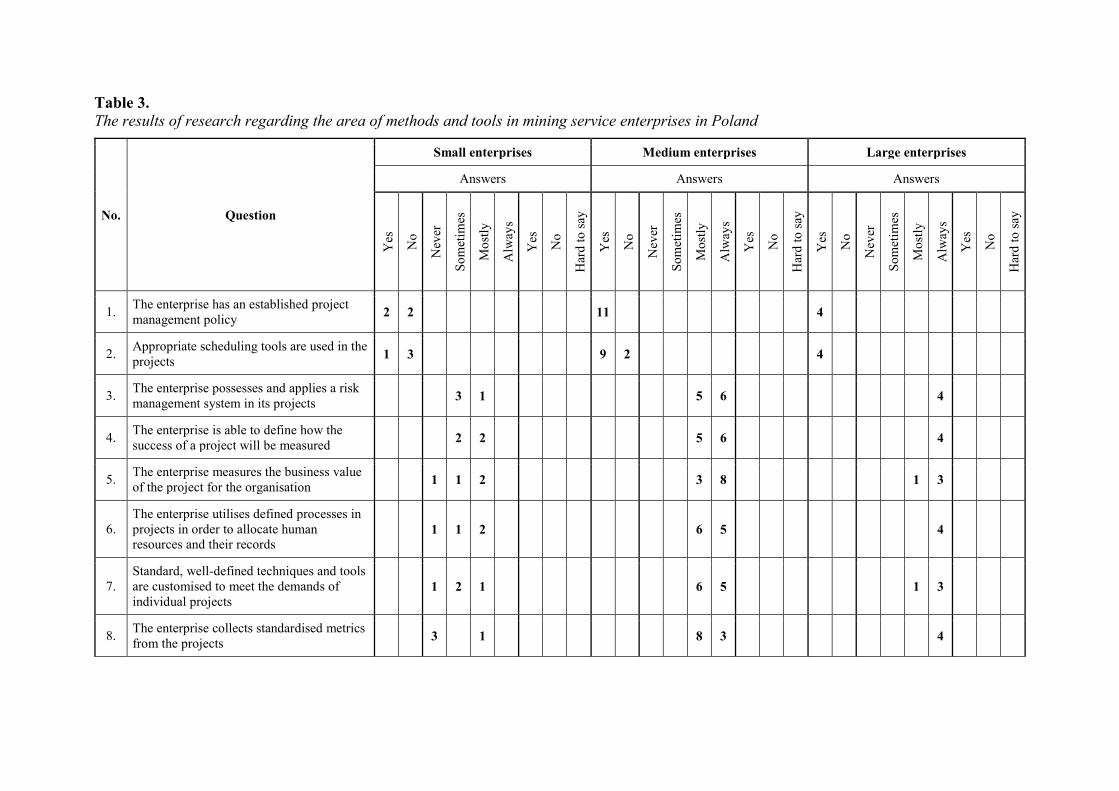
Table 3.
The results of research regarding the area of methods and tools in mining service enterprises in Poland
No. Question
Small enterprises Medium enterprises Large enterprises
Answers Answers Answers
Yes
No
Nev
er
So
met
imes
Mo
stly
Alw
ays
Yes
No
Har
d t
o s
ay
Yes
No
Nev
er
So
met
imes
Mo
stly
Alw
ays
Yes
No
Har
d t
o s
ay
Yes
No
Nev
er
So
met
imes
Mo
stly
Alw
ays
Yes
No
Har
d t
o s
ay
1. The enterprise has an established project
management policy 2 2 11 4
2. Appropriate scheduling tools are used in the
projects 1 3 9 2 4
3. The enterprise possesses and applies a risk
management system in its projects 3 1 5 6 4
4. The enterprise is able to define how the
success of a project will be measured 2 2 5 6 4
5. The enterprise measures the business value
of the project for the organisation 1 1 2 3 8 1 3
6.
The enterprise utilises defined processes in
projects in order to allocate human
resources and their records 1 1 2 6 5 4
7.
Standard, well-defined techniques and tools
are customised to meet the demands of
individual projects 1 2 1 6 5 1 3
8. The enterprise collects standardised metrics
from the projects 3 1 8 3 4
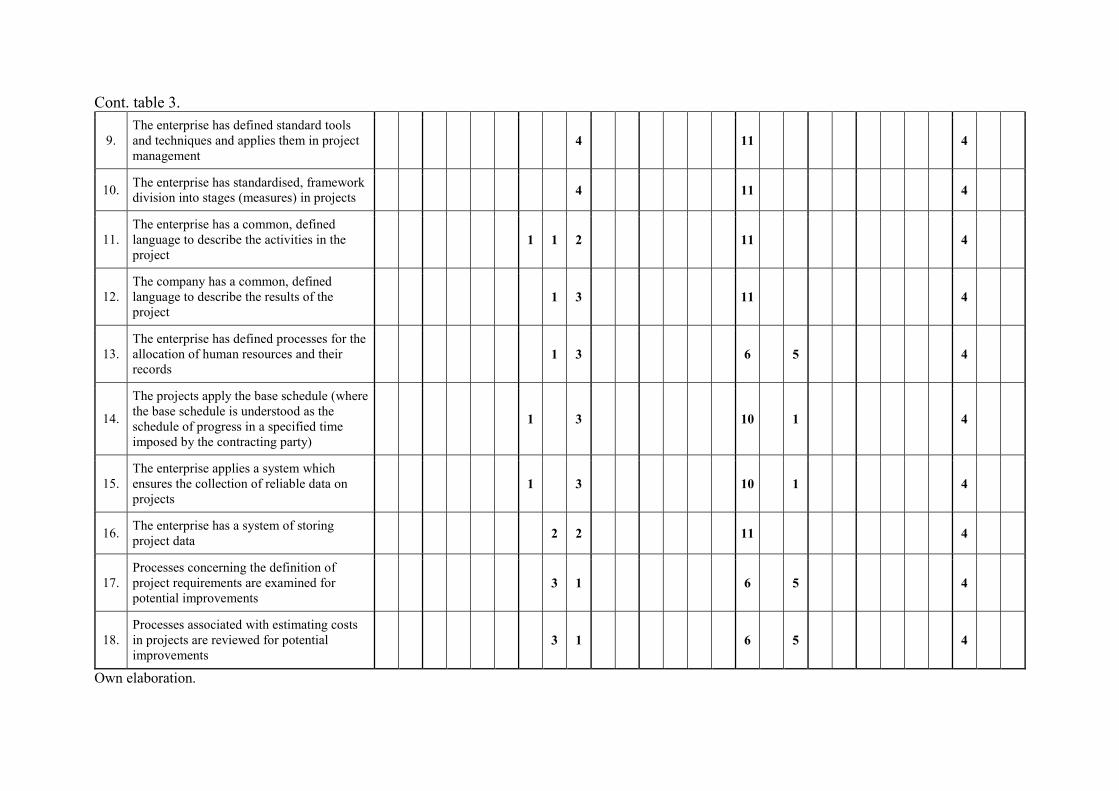
Cont. table 3.
9.
The enterprise has defined standard tools
and techniques and applies them in project
management 4 11 4
10. The enterprise has standardised, framework
division into stages (measures) in projects 4 11 4
11.
The enterprise has a common, defined
language to describe the activities in the
project 1 1 2 11 4
12.
The company has a common, defined
language to describe the results of the
project 1 3 11 4
13.
The enterprise has defined processes for the
allocation of human resources and their
records 1 3 6 5 4
14.
The projects apply the base schedule (where
the base schedule is understood as the
schedule of progress in a specified time
imposed by the contracting party)
1 3 10 1 4
15.
The enterprise applies a system which
ensures the collection of reliable data on
projects 1 3 10 1 4
16. The enterprise has a system of storing
project data 2 2 11 4
17.
Processes concerning the definition of
project requirements are examined for
potential improvements 3 1 6 5 4
18.
Processes associated with estimating costs
in projects are reviewed for potential
improvements 3 1 6 5 4
Own elaboration.
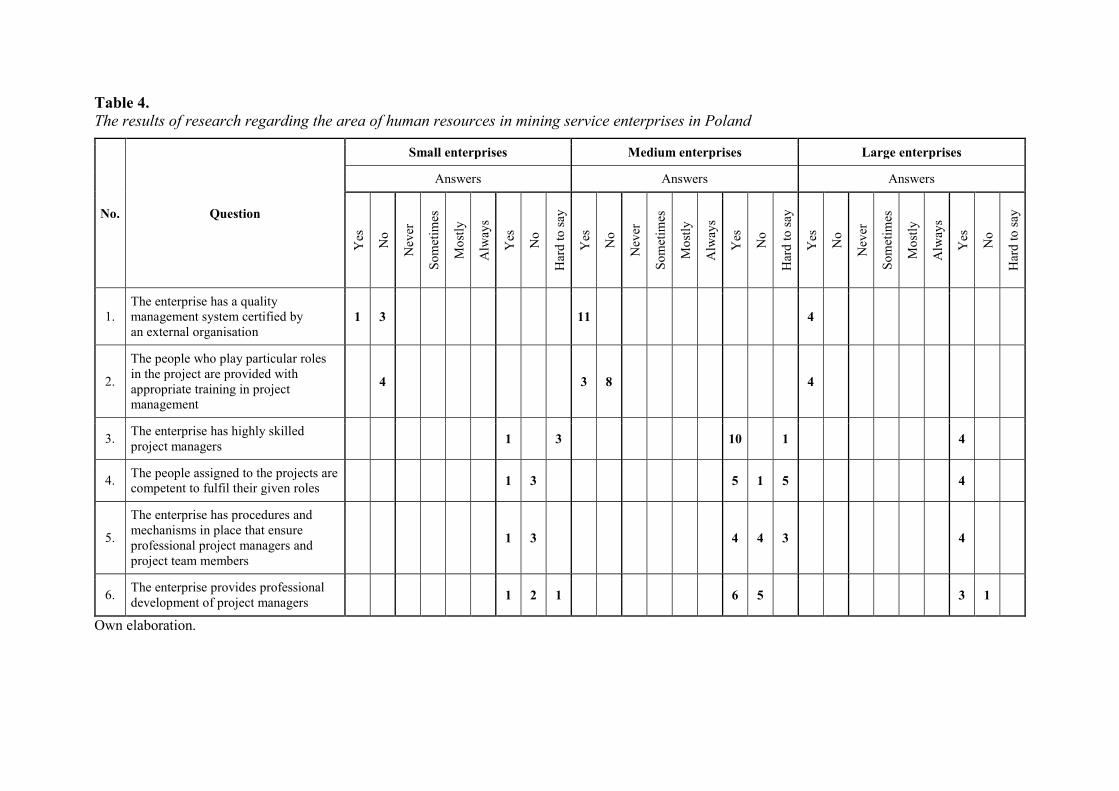
Table 4.
The results of research regarding the area of human resources in mining service enterprises in Poland
No. Question
Small enterprises Medium enterprises Large enterprises
Answers Answers Answers
Yes
No
Nev
er
So
met
imes
Mo
stly
Alw
ays
Yes
No
Har
d t
o s
ay
Yes
No
Nev
er
So
met
imes
Mo
stly
Alw
ays
Yes
No
Har
d t
o s
ay
Yes
No
Nev
er
So
met
imes
Mo
stly
Alw
ays
Yes
No
Har
d t
o s
ay
1.
The enterprise has a quality
management system certified by
an external organisation 1 3 11 4
2.
The people who play particular roles
in the project are provided with
appropriate training in project
management
4 3 8 4
3. The enterprise has highly skilled
project managers 1 3 10 1 4
4. The people assigned to the projects are
competent to fulfil their given roles 1 3 5 1 5 4
5.
The enterprise has procedures and
mechanisms in place that ensure
professional project managers and
project team members
1 3 4 4 3 4
6. The enterprise provides professional
development of project managers 1 2 1 6 5 3 1
Own elaboration.

Table 5.
The results of research regarding the area of environment in mining service enterprises in Poland
No. Question
Small enterprises Medium enterprises Large enterprises
Answers Answers Answers
Yes
No
Nev
er
So
met
imes
Mo
stly
Alw
ays
Yes
No
Har
d t
o s
ay
Yes
No
Nev
er
So
met
imes
Mo
stly
Alw
ays
Yes
No
Har
d t
o s
ay
Yes
No
Nev
er
So
met
imes
Mo
stly
Alw
ays
Yes
No
Har
d t
o s
ay
1.
Definitions of project aims
(except for time, cost and scope)
include clearly distinguished
strategic goals
1 3 4 5 2 1 3
2. The enterprise is aware of how
valuable the project is 1 3 10 1 4
3.
The enterprise applies project
management to achieve the
organisation's business objectives 4 9 2 4
4.
The enterprise is well aware of
how valuable project
management is 1 1 2 10 1 4
5. The enterprise has a well-defined
vision of project management 1 1 2 9 2 4
Own elaboration.
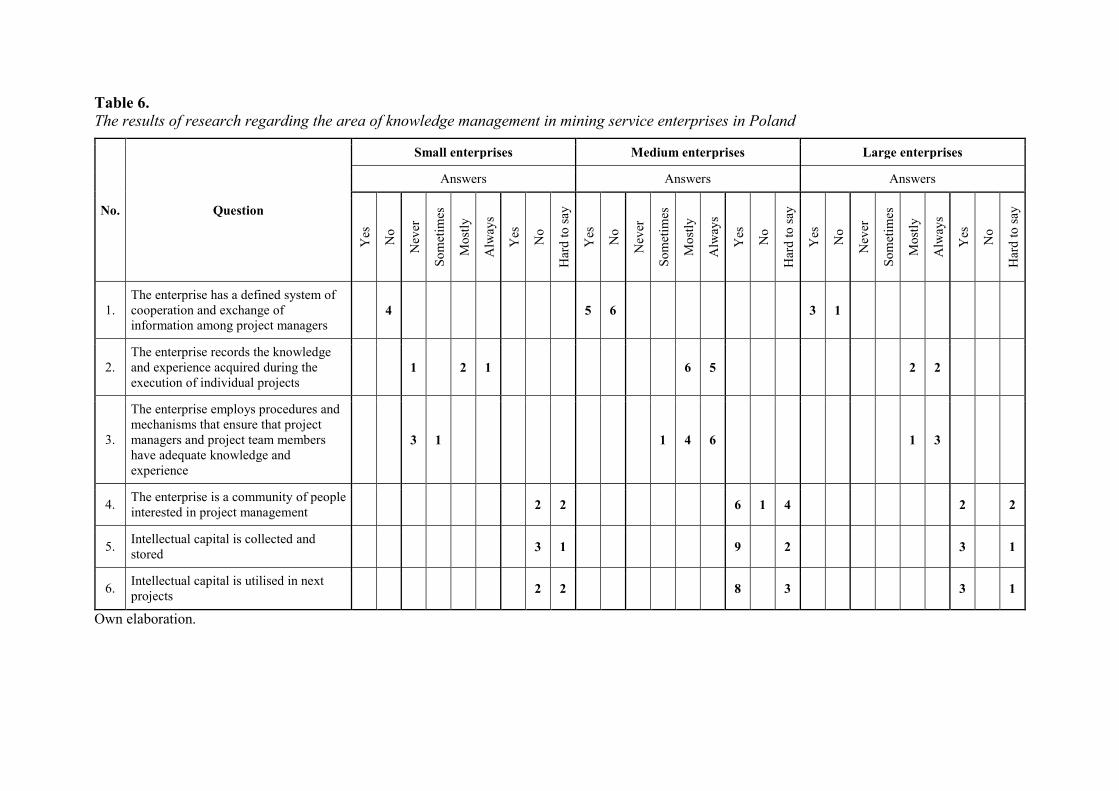
Table 6.
The results of research regarding the area of knowledge management in mining service enterprises in Poland
No. Question
Small enterprises Medium enterprises Large enterprises
Answers Answers Answers
Yes
No
Nev
er
So
met
imes
Mo
stly
Alw
ays
Yes
No
Har
d t
o s
ay
Yes
No
Nev
er
So
met
imes
Mo
stly
Alw
ays
Yes
No
Har
d t
o s
ay
Yes
No
Nev
er
So
met
imes
Mo
stly
Alw
ays
Yes
No
Har
d t
o s
ay
1.
The enterprise has a defined system of
cooperation and exchange of
information among project managers 4 5 6 3 1
2.
The enterprise records the knowledge
and experience acquired during the
execution of individual projects 1 2 1 6 5 2 2
3.
The enterprise employs procedures and
mechanisms that ensure that project
managers and project team members
have adequate knowledge and
experience
3 1 1 4 6 1 3
4. The enterprise is a community of people
interested in project management 2 2 6 1 4 2 2
5. Intellectual capital is collected and
stored 3 1 9 2 3 1
6. Intellectual capital is utilised in next
projects 2 2 8 3 3 1
Own elaboration.
84 J. Jamrozy, K. Wodarski, B. Sorychta-Wojsczyk
The area of the environment
The research conducted shows that only 37% of enterprises define project objectives
(except for time, cost and scope), which include clearly identified strategic objectives.
Only 63% of medium-sized enterprises have such project objectives. 79% of the enterprises are
conscious of the value of the project for the organisation. Only 75% of small enterprises are not
aware of the value of the project. In 68% of the enterprises, project management is used to
achieve the business objectives of the organisation; this is the case for 100% of large mining
service enterprises. However, project management for business purposes is not used in all small
mining service enterprises. In 79% of the researched mining service enterprises, there is
a general awareness of the value of project management. Only 25% of small enterprises have
such awareness. 73.6% of mining service enterprises have a defined vision of project
management. There is no defined project management vision for 75% of small enterprises.
Project maturity in the area of project environment is diversified in mining service
enterprises and has been assessed as follows:
in small mining service enterprises at level 1 (Initial), as they do not have a management
or organisational system to support project management,
in medium mining service enterprises at level 2 (Standardisation), as these organisations
have management and organisational systems that partially support project
management,
in large mining service enterprises at level 3 (Applications/Usage), where these systems
are mainly used for project management.
The area of knowledge management
The conducted research shows that only 42% of mining service enterprises have a defined
system of cooperation and flow of information among project managers. 45% of medium
enterprises and 75% of large enterprises have a defined system. There is no such system in
small mining service enterprises. In 94% of mining service enterprises, including all large and
medium enterprises, and only 25% of small enterprises, the knowledge and experience gained
during the execution of individual projects is recorded. In 73.6% of enterprises, procedures and
mechanisms are applied that ensure that project managers and project team members have the
appropriate knowledge and experience, while in no small enterprise are such procedures
applied. In only 42% of mining service enterprises is there a community of people interested in
project management. In small mining service enterprises, there is no such community.
In medium enterprises, this is 50%, and 55% in large enterprises. In 63% of the researched
enterprises, intellectual capital is gathered and stored. And only 57.8% of mining service
enterprises ensure professional development of project managers, while this is 75% in large
enterprises, 73% in medium enterprises and 0% in small enterprises.
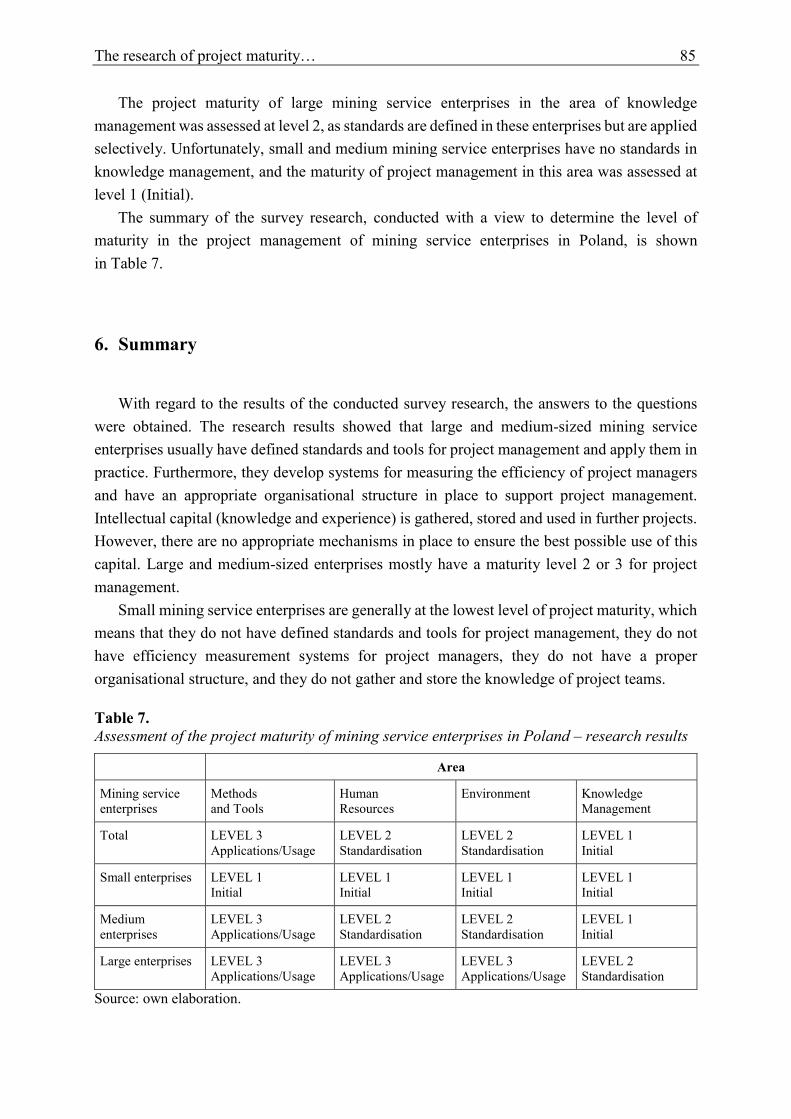
The research of project maturity… 85
The project maturity of large mining service enterprises in the area of knowledge
management was assessed at level 2, as standards are defined in these enterprises but are applied
selectively. Unfortunately, small and medium mining service enterprises have no standards in
knowledge management, and the maturity of project management in this area was assessed at
level 1 (Initial).
The summary of the survey research, conducted with a view to determine the level of
maturity in the project management of mining service enterprises in Poland, is shown
in Table 7.
6. Summary
With regard to the results of the conducted survey research, the answers to the questions
were obtained. The research results showed that large and medium-sized mining service
enterprises usually have defined standards and tools for project management and apply them in
practice. Furthermore, they develop systems for measuring the efficiency of project managers
and have an appropriate organisational structure in place to support project management.
Intellectual capital (knowledge and experience) is gathered, stored and used in further projects.
However, there are no appropriate mechanisms in place to ensure the best possible use of this
capital. Large and medium-sized enterprises mostly have a maturity level 2 or 3 for project
management.
Small mining service enterprises are generally at the lowest level of project maturity, which
means that they do not have defined standards and tools for project management, they do not
have efficiency measurement systems for project managers, they do not have a proper
organisational structure, and they do not gather and store the knowledge of project teams.
Table 7.
Assessment of the project maturity of mining service enterprises in Poland – research results
Area
Mining service
enterprises
Methods
and Tools
Human
Resources
Environment Knowledge
Management
Total LEVEL 3
Applications/Usage
LEVEL 2
Standardisation
LEVEL 2
Standardisation
LEVEL 1
Initial
Small enterprises LEVEL 1
Initial
LEVEL 1
Initial
LEVEL 1
Initial
LEVEL 1
Initial
Medium
enterprises
LEVEL 3
Applications/Usage
LEVEL 2
Standardisation
LEVEL 2
Standardisation
LEVEL 1
Initial
Large enterprises LEVEL 3
Applications/Usage
LEVEL 3
Applications/Usage
LEVEL 3
Applications/Usage
LEVEL 2
Standardisation
Source: own elaboration.
86 J. Jamrozy, K. Wodarski, B. Sorychta-Wojsczyk
References
1. Grundy, T., Brown, L. (2002). Strategic Project Management – Creating Organizational
Breakthroughs. Cornvall: Thomson.
2. http://sjsi.org/slowo/model-dojrzalosci/, 07.01.2018.
3. Juchniewicz, M. (2009). Dojrzałość projektowa organizacji. Warszawa: Biblioteka Project
Managera.
4. Juchniewicz, M. (2009). Dojrzałość projektowa organizacji i jej zastosowanie
w zarządzaniu. Przegląd Organizacji, 7-8.
5. Juchniewicz, M. (2016). Osiąganie doskonałości w realizacji projektów przy wykorzystaniu
modelu dojrzałości projektowej. In: E. Trocki, E. Bukłaha, Zarządzanie projektami –
wyzwania i wyniki badań. Warszawa: Wydawnictwo SGH.
6. Kerzner, H. (2005). Advanced Project Management. Gliwice: Helion.
7. Managing Successful Programmes (2007). Norwich: Office of Government Commerce,
The Stationery Office.
8. Project Management Body of Knowledge (2008). Project Management Institute.
9. Schott, E., Campana, Ch. (2005). Strategisches Projektmanagement. Berlin-Heidelberg:
Springer Verlag.
10. Spałek, S. (2013). Dojrzałość przedsiębiorstwa w zarządzaniu projektami. Gliwice:
Wydawnictwo Politechniki Śląskiej.
11. Spałek, S. (2015). Granice inwestycyjne zwiększania stopnia dojrzałości w zarządzaniu
projektami. In: W.R. Knosala, Innowacje w zarządzaniu i inżynierii produkcji, Tom I.
Opole: Oficyna Wydawnicza Polskiego Towarzystwa Zarządzania Produkcją.
12. Spałek, S., Karbownik, A. (2014). Rekomendacje dla zwiększenia stopnia dojrzałości
w zarządzaniu projektami w przedsiębiorstwach przemysłu maszynowego w Polsce.
Przegląd Organizacji, 9.
13. Strojny, J. (2012). Innowacyjność i kreatywność w rozwiązywaniu problemów biznesowych.
Rzeszów: Politechnika Rzeszowska.
14. Strojny, J. (2019). Orientacja procesowo-projektowa organizacji samorządu lokalnego.
Wymiary, poziomy dojrzałości, determinanty oraz efekty w zakresie rozwoju lokalnego.
Rzeszów: Oficyna Wydawnicza Politechniki Rzeszowskiej.
15. Wyrozębski, M., Juchniewicz, M., Matelski, W. (2012). Wiedza, dojrzałość, ryzyko
w zarządzaniu projektami. Wyniki badań. Warszawa: Oficyna Wydawnicza Szkoła Główna
Handlowa.
Scientific Quarterly “Organization and Management”, 2020, Vol. 1, No. 49; DOI: 10.29119/1899-6116.2020.49.6 www.oamquarterly.polsl.pl
GLOBAL FINANCIAL CRISES, PROFITABILITY 1
AND OUTSOURCING IN INDUSTRIAL COMPANIES IN POLAND 2
Anna MAZIARCZYK 3
Faculty of Economics, Maria Skłodowska-Curie University, Lublin, Poland; 4 [email protected], ORCID: 0000-0001-7213-0961 5
Abstract: The purpose of the article was to determine whether there is a relationship between 6
the use of outsourcing and profitability in industry depending on time. The research sample 7
consisted of 200 enterprises operating on the Polish market. The study covered the years 8
2000-2018. The study was divided into 2 parts. It turned out that during the financial crisis, 9
profitability is significantly lower in the case of return on assets. During the crisis, industrial 10
companies were on the verge of profitability and deficit. The average level of return on assets 11
during the crisis was significantly lower than before and after the crisis. Given the return on 12
equity and return on sales, the planned contrast turned out to be statistically insignificant. 13
It should be noted that there is a certain limitation in the interpretation of results, because 14
external services also consist of services that are not outsourced, e.g. banking services. 15
In addition, there is agreement that with the increase in the use of services of external suppliers 16
(leading to an increase in the cost of external services), the profitability of sales decreases. 17
The study does not allow one to draw a conclusion about the existence of a relationship between 18
the use of outsourcing in industrial companies and profitability. 19
Keywords: financial crisis, profitability, outsourcing, industrial companies. 20
1. Introduction 21
Increasingly, companies are deciding to implement outsourcing. Large competition 22
encourages the search for interesting forms of enterprise financial management. Outsourcing is 23
becoming a fashionable management tool. In economics, the term 'outsourcing' is used to show 24
the participation of external sources in the development of a company. This paper refers to 25
a company that used its internal resources (Aalders, 2001). In other words, it is a transfer of 26
managerial responsibility to a third party. The service contract is binding (Lysons, 2003). 27
The decision to implement outsourcing is dictated by the reduction of costs. This is 28
indicated, among others, by Dunford (2000). He claims that the primary task of outsourcing is 29
to focus the company on its core activities and reduce costs. All activities that the company may 30
delegate should be left to an external expert (Dunford, 2000). In addition, quality is an important 31
88 A. Maziarczyk
factor that customers pay attention to. Therefore, care for the quality of products and services 1
improves the quality of the entire company. According to Kakabadse (2003), outsourcing is 2
a way to provide the best quality for products and services. Delegating certain activities to 3
experts increases the quality of the product. Outsourcing is one of the important elements of the 4
strategy of companies in Europe and the US (Kakabadse, 2003). 5
The article consists of five parts. The following section discusses the problem, given the 6
popularity of outsourcing and its impact on the profitability of foreign enterprises. The second 7
part presents the research sample and its short characteristics. The next part is a description of 8
the research methodology with a detailed explanation of the possibility of using statistical tests. 9
The results are then described. The last section draws conclusions for Polish industrial 10
companies. 11
2. Profitability, outsourcing and financial crisis – literature review 12
Many scientists have already conducted research on the profitability of companies. 13
There are also many studies on outsourcing and business operations during the financial crisis 14
(2006-2009). Despite this, few researchers combined these two aspects related to a company. 15
Noah Mwelu did a study on a sample of 80 manufacturing companies in Uganda before the 16
financial crisis. The study determined the level of profitability impacts on outsourcing in 17
Uganda. The author indicates that there is a strong and significant relationship between 18
outsourcing and profitability. Despite this, outsourcing is not yet clear enough to affect the 19
profitability levels of manufacturing companies in this country (Mwelu and Moya, 2014). 20
Görg and Hanley (2004) investigated the relationship between outsourcing and profitability 21
for the electronics sector in Ireland before the financial crisis. The study concerned 22
manufacturing and service activities – a sample of 215 companies. They stated that large 23
companies use outsourcing of materials and services. For small businesses, outsourcing services 24
is not so straightforward (Görg, and Hanley, 2004). 25
In turn, Kimura (2002) presents a different approach to the role of outsourcing. He claims 26
that those with weak activities are more likely to use external experts. The study was conducted 27
on a sample of companies from the machine-building sector in Japan before the financial crisis. 28
The author concludes that companies with high profits do not use outsourcing. Weak companies 29
(low surplus in sales and low value added to sales) are more likely to use subcontractors. 30
The author concludes that companies that do not get involved obtain the highest profits 31
(Kimura, 2002). 32
Juma’h and Wood studied the business results of outsourcing companies. It was concluded 33
that profitability and liquidity decrease over the years with outsourcing. In turn, the increase in 34
profitability and liquidity increases when companies resign from outsourcing services 35
Global financial crises, profitability and outsourcing… 89
(Juma’h, and Wood, 2000). Maziarczyk comes to other conclusions (2020). A survey was 1
conducted on a sample of companies from Poland, and the aim of the study was to check the 2
impact of outsourcing on the productivity of companies in the period 2010-2018. It was 3
concluded that as outsourcing increases, the productivity of Polish industrial companies 4
increases. In addition, it has been proven that outsourcing will positively affect the entire 5
country by improving Gross Domestic Product (Maziarczyk, 2020). Performance research in 6
connection with outsourcing was also conducted. Findings show that companies that have 7
distorted their production structure show higher growth, while companies using the 8
verticalisation strategy achieved better results in terms of debt ratio (Calabrese, and Erbetta, 9
2005). 10
Agburu, Anza, Iyortsuun (2017) argue that small and medium-sized companies, like large 11
organisations, outsource services. In their research, they list a number of outsourcing factors. 12
These factors led to an increase in the profitability of small and medium enterprises. The study 13
covered the period of both the crisis and after the crisis. However, the authors did not distinguish 14
this factor (Agburu, Anza, Iyortsuun, 2017). 15
Isaksson and Lantz (2015) studied outsourcing strategies among small manufacturing 16
companies. The authors do not state what period the study covered. It is only known that the 17
data was taken from the annual data from 2011. However, we can guess that the study was 18
about post-crisis data for a sample of 700 small (less than 50 employees) manufacturing 19
companies in Sweden. They mainly studied the relationship between outsourcing and return on 20
investment (ROI) and return on capital (ROE). However, this study did not show the impact of 21
these outsourcing strategies on SME profitability (Isaksson, and Lantz, 2015). 22
Further studies were conducted by Edvardsson and Teitsdóttir. The purpose of their research 23
was to analyse the use of outsourcing in the services sector after the collapse of banking. 24
They compared the results of Icelandic companies from 2009 and 2013. The authors state that 25
outsourcing has not increased, but some SMEs have begun outsourcing IT and human resource 26
management to a greater extent. It is emphasised that there is little research on SMEs in the 27
aftermath of the financial crisis (Edvardsson, and Teitsdóttir, 2015), 28
K. Denčić-Mihajlov (2014) examined how companies from Serbia adapt to the conditions 29
of the financial crisis. The sample included 108 non-financial companies. The author states that 30
larger and smoother companies achieve higher profitability. The effectiveness of assets and the 31
possibility of growth proved to be important for determining profitability as a return on assets. 32
The study points to the urgent need to improve business performance during the crisis. 33
The conclusions of the study concern only the period of the financial crisis. The author indicates 34
that it is worth analysing profitability before the crisis, during the crisis and after the crisis 35
(Denčić-Mihajlov, 2014). 36
Speaking about the benefits of outsourcing, the article seeks to check how outsourcing 37
affects the profitability of industrial companies in Polish conditions during the financial crisis, 38
as well as before and after it. There are studies based on a combination of outsourcing and 39
90 A. Maziarczyk
profitability, but this is new for Polish conditions. The article brings new information about the 1
relationship between the profitability of Polish industrial companies and outsourcing. A review 2
of literature shows that there is no research on the relationship between outsourcing and the 3
profitability of Polish enterprises during the crisis. It is worth paying attention to research on 4
this subject. 5
The financial crisis of 2007-2009 occurred as a result of the credit crisis in 2006. Specialists 6
say the beginning took place in the US housing market, and the general decline in property 7
prices caused stress on loans (Benmelech, and Dlugosz, 2009). 8
The 2007-2009 financial crisis is commonly considered the worst crisis since the Great 9
Depression of the 1930s, which turned out to be a massive shock for enterprises. The crisis 10
caused a sharp fall in share prices and more expensive loans, which largely affected the financial 11
situation of companies. The global financial system was at risk of collapse by rescuing 12
uninsured large financial institutions (Brunnermeier, and Pedersen, 2009). 13
According to specialists, the economic crisis of 2007-2009 initially bypassed the Polish 14
economy. Dangers were sought in high state debt and a large share of imports in domestic 15
production. As it turned out, Poland was also affected by the effects of the global crisis. 16
The value of the Polish currency (Polish zloty) was significantly reduced as a result of 17
a speculative attack, and enterprises began to have financial problems with currency options. 18
Despite this, Poland was positively assessed when taking into account other economies during 19
the crisis. The largest effect for Poland was the reduction of the deposit interest rate from 20
4.5% to 2.00%1. 21
3. Sample 22
The purpose of the article was to check whether the use of outsourcing in Polish industrial 23
companies affects their profitability over time. Companies that are listed on the Warsaw Stock 24
Exchange were analysed. Due to the specifics of the study, the research sample covered 25
200 companies that operate in the industrial sector. 26
The sample was based on data provided by the Notoria database from 2018. This database 27
contains the financial statements of Polish companies. The choice of the sample that was 28
ultimately analysed was as follows: firstly, from the pool of all companies, industrial companies 29
were chosen, as the study concerns only this sector. This was done on the basis of descriptions 30
of the characteristics of individual companies also available in this database. Due to the need 31
for accurate calculations from the sample, companies were then selected for which all data 32
needed to calculate the profitability ratios and the data needed to determine outsourcing were 33
1 Experts say that the increase in GDP was caused by an increase in net exports and an increase in total consumption
[http://nbp.pl/ home.aspx? f = / / daily /, Forsal.pl].
Global financial crises, profitability and outsourcing… 91
provided. The study concerned the period 2000-2018. In this way, a database consisting of 1
annual data for 200 companies from Poland was optained, which consists of companies from 2
many different industries. 3
4. Methodology 4
Data from the study was processed using a statistical program. There are three types of 5
variables throughout the analysis: dependent, independent and grouping variables. A detailed 6
list of all variables is provided in Table 1. The data of the research part and research hypotheses 7
refers to individual variables, which will be listed later. 8
Table 1 9 All descriptions of variables used in this analysis 10
Variables Description
Dependent variables
Return on assets (ROA)
Return on equity (ROE)
Return on sales (ROS)
Net profit divided by total assets multiplied by 100
Net profit divided by equity capital multiplied by 100
Net profit divided by sales revenues multiplied by 100
Independent variables
outsourcing
external services divide by sales revenues
(external services include costs that are not outsourced; therefore,
identifying outsourcing as a foreign service is an optimistic approach)
Source: own study. 11
Three indicators were used to determine the profitability of companies – return on assets, 12
return on equity and return on sales. As it is believed that one indicator does not give 13
an objective picture of the situation, 3 indicators to measure profitability were used. Depending 14
on individual parts of the study, profitability becomes dependent and once independent. 15
The value of outsourcing was determined on the basis of the relationship of external services to 16
sales transactions (external services divided by sales revenues). The value of outsourcing was 17
defined on the basis of the value of external services, which are part of the generic cost system. 18
There is a certain limitation in the interpretation of results, because external services also consist 19
of services that are not outsourced, e.g. banking services. At the beginning, I compared the 20
profitability ratios among (ROA, ROE, ROS) or different indicators give the same result before 21
the crisis, during the crisis and after the crisis. Therefore, the first (preliminary) hypothesis is 22
put forward: 23
H1 a): the average level of ROA profitability changes over time. 24
H1 b): the average level of ROE profitability changes over time. 25
H1 c): the average level of ROS profitability changes over time. 26
27
92 A. Maziarczyk
The dependent variables used in this part of the study were data on profitable companies 1
(depending on the hypothesis, this was ROA, ROE, ROS). The variables were divided into three 2
periods. Thus, all variables are: ROA before the crisis, ROA during the crisis, ROA after the 3
crisis, ROE before the crisis, ROE during the crisis, ROE after the crisis and ROS before the 4
crisis, ROS during the crisis, ROS after the crisis. This part of the study did not require 5
independent variables. In order to verify whether the hypotheses (H1a, H1b, H1c) are true and 6
whether it can be stated that the indicators give the same result before the crisis, during the 7
crisis and after the crisis, analysis of variance with repeated measurements was used. Repeated 8
measurement means that the variable has been tested many times. In the study, multiple 9
measurements of the same variables at intervals were made. In this case, time is an intra-object 10
factor. The greatest benefit of the ANOVA test with repeated measurements is the reduction of 11
individual differences, i.e. the variation between variables in different groups (Niewiarowski, 12
2013). We can use this test, because the assumptions are met. The variables have a distribution 13
close to normal, the variances of the distribution of variables are equal, and the fulfilment of 14
the sphericity assumption (no correlation between successive measurements). In addition, 15
the analysis was supplemented with contrast analysis. 16
The ratio of external services to sales transactions were then compared. Whether the same 17
result was available before, during and after the crisis was also checked. Therefore, one should 18
hypothesise: 19
H2: The average level of outsourcing varies over time. 20
The dependent variables used in this part of the study were the data on outsourcing 21
companies, i.e. the ratio of external services to sales revenues. The variables were divided into 22
three periods. Thus, all variables are: outsourcing before the crisis, outsourcing during the crisis 23
and outsourcing after the crisis. This part of the study did not require independent variables. 24
In order to verify whether the H2 hypothesis is true and whether it can be stated that the 25
indicators give the same result before the crisis, during the crisis and after the crisis, analysis of 26
variance with repeated measurements was used. The possibility of using the test confirms the 27
fulfilment of the assumptions for this test, i.e. the variables have a distribution similar to normal, 28
the variances of the distribution of variables are equal, the fulfilment of the assumption of 29
sphericity. 30
The next step was to check whether outsourcing before, during and after the crisis is related 31
to profitability in these periods. Profitability was defined using three indicators: ROA, ROE, 32
ROS. The following hypotheses were checked: 33
H3: a) there is a relationship between pre-crisis ROA and outsourcing. 34
H3: b) there is a relationship between ROA during a crisis and outsourcing. 35
H3: c) there is a relationship between post-crisis ROA and outsourcing. 36
H4: a) there is a relationship between pre-crisis ROE and outsourcing. 37
H4: b) there is a relationship between ROE during a crisis and outsourcing. 38
H4: c) there is a relationship between ROE after crisis and outsourcing. 39
Global financial crises, profitability and outsourcing… 93
H5: a) there is a relationship between pre-crisis ROS and outsourcing. 1
H5: b) there is a relationship between ROS during a crisis and outsourcing. 2
H5: c) there is a relationship between post-crisis ROS and outsourcing. 3
The dependent variables used in this part of the study were data on profitable companies 4
(depending on the hypothesis, this was ROA, ROE, ROS). The independent variable was the 5
use of outsourcing, which was defined as the value of external services. In order to verify 6
whether the hypotheses (H3, H4, H5) are true and whether it can be concluded that there is 7
a significant relationship between outsourcing and the profitability of industry before the crisis, 8
during the crisis and after the crisis, the Pearson correlation test was used. The possibility of 9
using the test is confirmed by the fact that the variables have a distribution close to normal 10
(sample greater than 100 observations). 11
After analysing the correlation, a regression analysis was then performed. This study was 12
done to determine the degree of impact of outsourcing of certain activities in a company on the 13
level of profitability in industrial companies in Poland. Whether it is possible to predict the 14
level of profitability based on outsourcing was also checked. A general straight line regression 15
model was created: 16
𝑌 = 𝛽0 + 𝛽1𝑋 + 𝜖
Where: 17
Y – dependent variable (profitability). 18
X – independent variable (outsourcing). 19
β0, β1 – structural parameters of the model. 20
ϵ - random component. 21
22
We accept this mathematical formula. It contains relationships between variables and the 23
assumption of random processes affecting the results of individual measurements. We use the 24
least squares method to determine a line (y = b0 + b1 * x) that fits to our linear regression model. 25
5. Result and their analysis 26
When analysing the use of outsourcing by Polish industrial companies, one can expect 27
differentiation. The share of funds allocated by entities to the services of external suppliers 28
differ depending on the industry sector. Therefore, the value of external services for the entire 29
sample of 200 industrial enterprises was averaged over a given period. (copy) Before the 30
2000-2005 crisis, the 2006-2009 crisis and after the crisis 2010-2018. The study led to such 31
results: 32
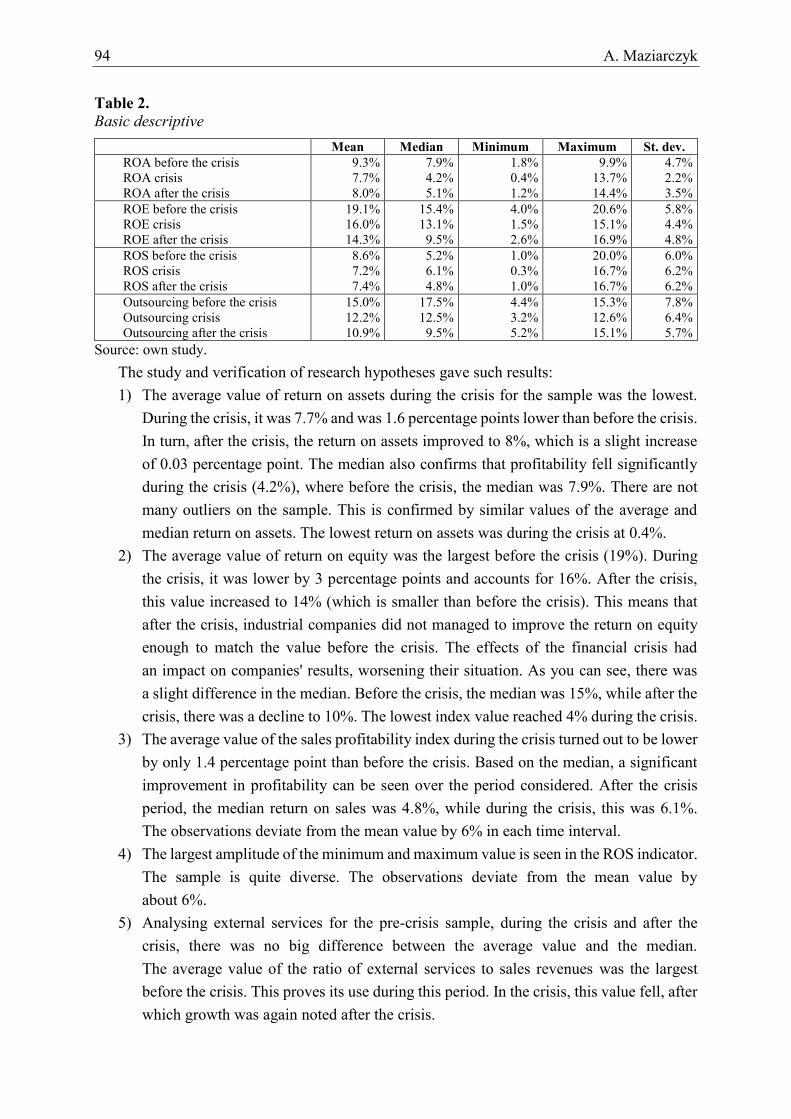
94 A. Maziarczyk
Table 2. 1 Basic descriptive 2
Mean Median Minimum Maximum St. dev.
ROA before the crisis
ROA crisis
ROA after the crisis
9.3%
7.7%
8.0%
7.9%
4.2%
5.1%
1.8%
0.4%
1.2%
9.9%
13.7%
14.4%
4.7%
2.2%
3.5%
ROE before the crisis
ROE crisis
ROE after the crisis
19.1%
16.0%
14.3%
15.4%
13.1%
9.5%
4.0%
1.5%
2.6%
20.6%
15.1%
16.9%
5.8%
4.4%
4.8%
ROS before the crisis
ROS crisis
ROS after the crisis
8.6%
7.2%
7.4%
5.2%
6.1%
4.8%
1.0%
0.3%
1.0%
20.0%
16.7%
16.7%
6.0%
6.2%
6.2%
Outsourcing before the crisis
Outsourcing crisis
Outsourcing after the crisis
15.0%
12.2%
10.9%
17.5%
12.5%
9.5%
4.4%
3.2%
5.2%
15.3%
12.6%
15.1%
7.8%
6.4%
5.7%
Source: own study. 3
The study and verification of research hypotheses gave such results: 4
1) The average value of return on assets during the crisis for the sample was the lowest. 5
During the crisis, it was 7.7% and was 1.6 percentage points lower than before the crisis. 6
In turn, after the crisis, the return on assets improved to 8%, which is a slight increase 7
of 0.03 percentage point. The median also confirms that profitability fell significantly 8
during the crisis (4.2%), where before the crisis, the median was 7.9%. There are not 9
many outliers on the sample. This is confirmed by similar values of the average and 10
median return on assets. The lowest return on assets was during the crisis at 0.4%. 11
2) The average value of return on equity was the largest before the crisis (19%). During 12
the crisis, it was lower by 3 percentage points and accounts for 16%. After the crisis, 13
this value increased to 14% (which is smaller than before the crisis). This means that 14
after the crisis, industrial companies did not managed to improve the return on equity 15
enough to match the value before the crisis. The effects of the financial crisis had 16
an impact on companies' results, worsening their situation. As you can see, there was 17
a slight difference in the median. Before the crisis, the median was 15%, while after the 18
crisis, there was a decline to 10%. The lowest index value reached 4% during the crisis. 19
3) The average value of the sales profitability index during the crisis turned out to be lower 20
by only 1.4 percentage point than before the crisis. Based on the median, a significant 21
improvement in profitability can be seen over the period considered. After the crisis 22
period, the median return on sales was 4.8%, while during the crisis, this was 6.1%. 23
The observations deviate from the mean value by 6% in each time interval. 24
4) The largest amplitude of the minimum and maximum value is seen in the ROS indicator. 25
The sample is quite diverse. The observations deviate from the mean value by 26
about 6%. 27
5) Analysing external services for the pre-crisis sample, during the crisis and after the 28
crisis, there was no big difference between the average value and the median. 29
The average value of the ratio of external services to sales revenues was the largest 30
before the crisis. This proves its use during this period. In the crisis, this value fell, after 31
which growth was again noted after the crisis. 32
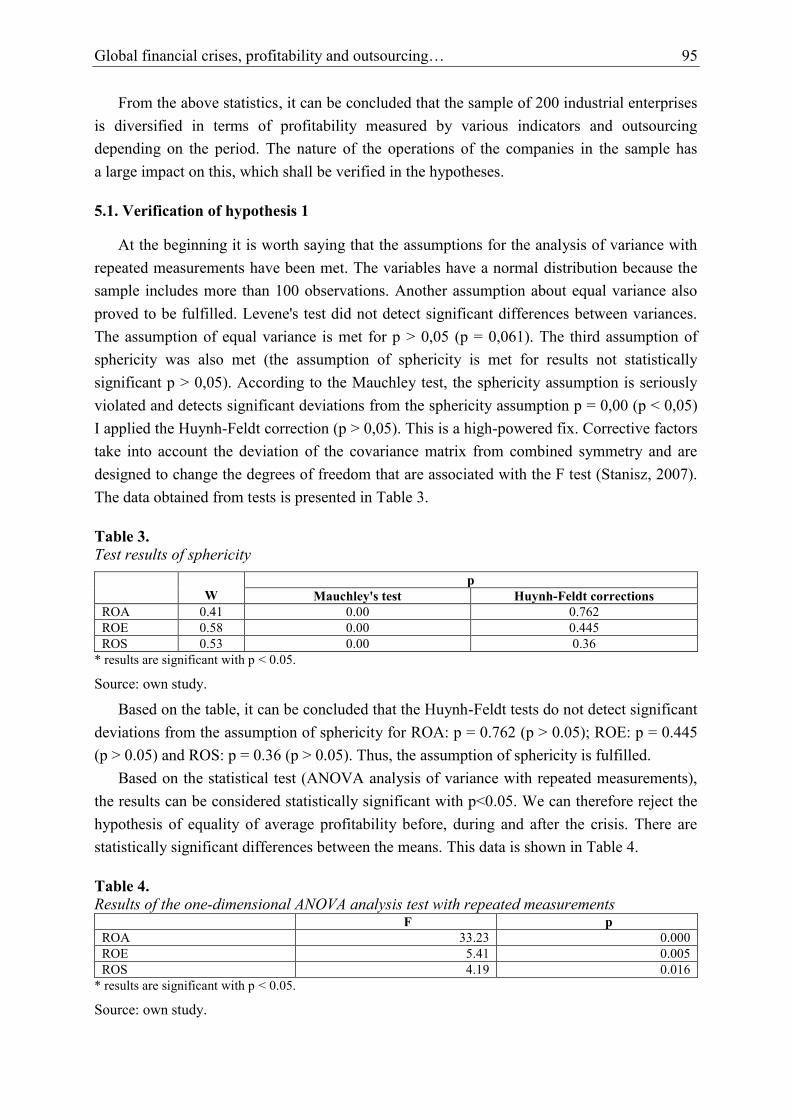
Global financial crises, profitability and outsourcing… 95
From the above statistics, it can be concluded that the sample of 200 industrial enterprises 1
is diversified in terms of profitability measured by various indicators and outsourcing 2
depending on the period. The nature of the operations of the companies in the sample has 3
a large impact on this, which shall be verified in the hypotheses. 4
5.1. Verification of hypothesis 1 5
At the beginning it is worth saying that the assumptions for the analysis of variance with 6
repeated measurements have been met. The variables have a normal distribution because the 7
sample includes more than 100 observations. Another assumption about equal variance also 8
proved to be fulfilled. Levene's test did not detect significant differences between variances. 9
The assumption of equal variance is met for p > 0,05 (p = 0,061). The third assumption of 10
sphericity was also met (the assumption of sphericity is met for results not statistically 11
significant p > 0,05). According to the Mauchley test, the sphericity assumption is seriously 12
violated and detects significant deviations from the sphericity assumption p = 0,00 (p < 0,05) 13
I applied the Huynh-Feldt correction (p > 0,05). This is a high-powered fix. Corrective factors 14
take into account the deviation of the covariance matrix from combined symmetry and are 15
designed to change the degrees of freedom that are associated with the F test (Stanisz, 2007). 16
The data obtained from tests is presented in Table 3. 17
Table 3. 18 Test results of sphericity 19
W
p
Mauchley's test Huynh-Feldt corrections
ROA 0.41 0.00 0.762
ROE 0.58 0.00 0.445
ROS 0.53 0.00 0.36
* results are significant with p < 0.05. 20
Source: own study. 21
Based on the table, it can be concluded that the Huynh-Feldt tests do not detect significant 22
deviations from the assumption of sphericity for ROA: p = 0.762 (p > 0.05); ROE: p = 0.445 23
(p > 0.05) and ROS: p = 0.36 (p > 0.05). Thus, the assumption of sphericity is fulfilled. 24
Based on the statistical test (ANOVA analysis of variance with repeated measurements), 25
the results can be considered statistically significant with p<0.05. We can therefore reject the 26
hypothesis of equality of average profitability before, during and after the crisis. There are 27
statistically significant differences between the means. This data is shown in Table 4. 28
Table 4. 29 Results of the one-dimensional ANOVA analysis test with repeated measurements 30
F p
ROA 33.23 0.000
ROE 5.41 0.005
ROS 4.19 0.016
* results are significant with p < 0.05. 31
Source: own study. 32
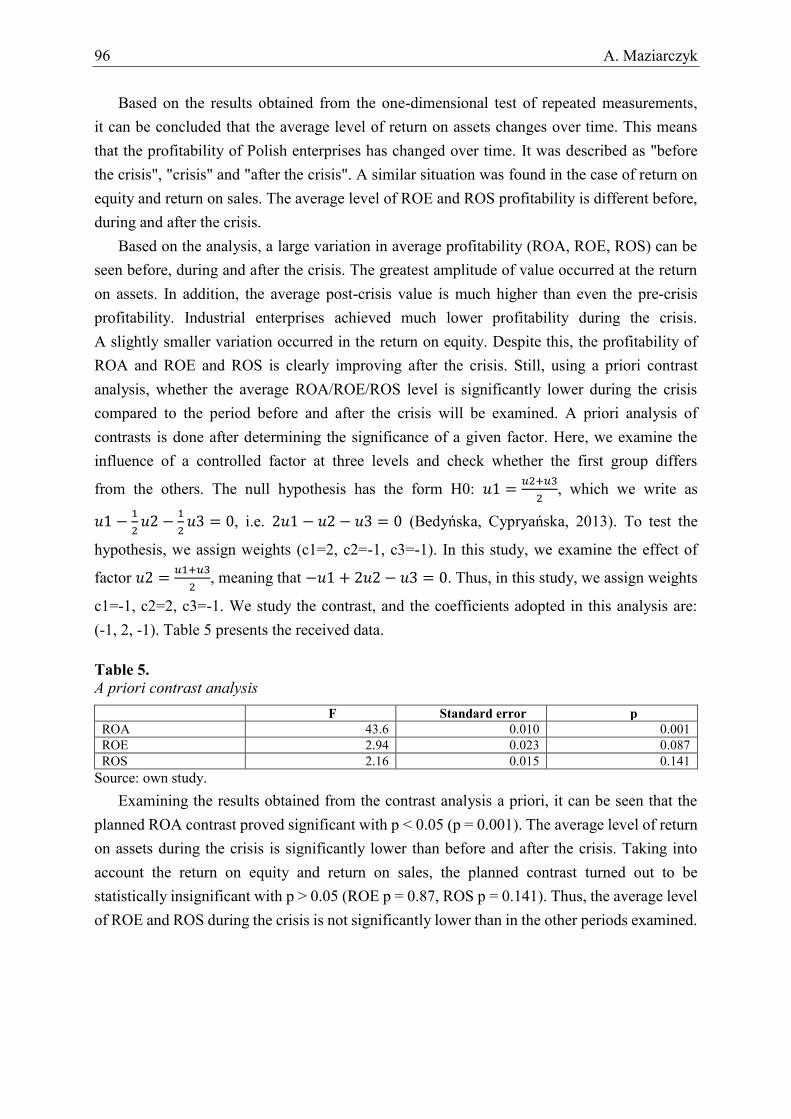
96 A. Maziarczyk
Based on the results obtained from the one-dimensional test of repeated measurements, 1
it can be concluded that the average level of return on assets changes over time. This means 2
that the profitability of Polish enterprises has changed over time. It was described as "before 3
the crisis", "crisis" and "after the crisis". A similar situation was found in the case of return on 4
equity and return on sales. The average level of ROE and ROS profitability is different before, 5
during and after the crisis. 6
Based on the analysis, a large variation in average profitability (ROA, ROE, ROS) can be 7
seen before, during and after the crisis. The greatest amplitude of value occurred at the return 8
on assets. In addition, the average post-crisis value is much higher than even the pre-crisis 9
profitability. Industrial enterprises achieved much lower profitability during the crisis. 10
A slightly smaller variation occurred in the return on equity. Despite this, the profitability of 11
ROA and ROE and ROS is clearly improving after the crisis. Still, using a priori contrast 12
analysis, whether the average ROA/ROE/ROS level is significantly lower during the crisis 13
compared to the period before and after the crisis will be examined. A priori analysis of 14
contrasts is done after determining the significance of a given factor. Here, we examine the 15
influence of a controlled factor at three levels and check whether the first group differs 16
from the others. The null hypothesis has the form H0: 𝑢1 =𝑢2+𝑢3
2, which we write as 17
𝑢1 −1
2𝑢2 −
1
2𝑢3 = 0, i.e. 2𝑢1 − 𝑢2 − 𝑢3 = 0 (Bedyńska, Cypryańska, 2013). To test the 18
hypothesis, we assign weights (c1=2, c2=-1, c3=-1). In this study, we examine the effect of 19
factor 𝑢2 =𝑢1+𝑢3
2, meaning that −𝑢1 + 2𝑢2 − 𝑢3 = 0. Thus, in this study, we assign weights 20
c1=-1, c2=2, c3=-1. We study the contrast, and the coefficients adopted in this analysis are: 21
(-1, 2, -1). Table 5 presents the received data. 22
Table 5. 23 A priori contrast analysis 24
F Standard error p
ROA 43.6 0.010 0.001
ROE 2.94 0.023 0.087
ROS 2.16 0.015 0.141
Source: own study. 25
Examining the results obtained from the contrast analysis a priori, it can be seen that the 26
planned ROA contrast proved significant with p < 0.05 (p = 0.001). The average level of return 27
on assets during the crisis is significantly lower than before and after the crisis. Taking into 28
account the return on equity and return on sales, the planned contrast turned out to be 29
statistically insignificant with p > 0.05 (ROE p = 0.87, ROS p = 0.141). Thus, the average level 30
of ROE and ROS during the crisis is not significantly lower than in the other periods examined. 31
32
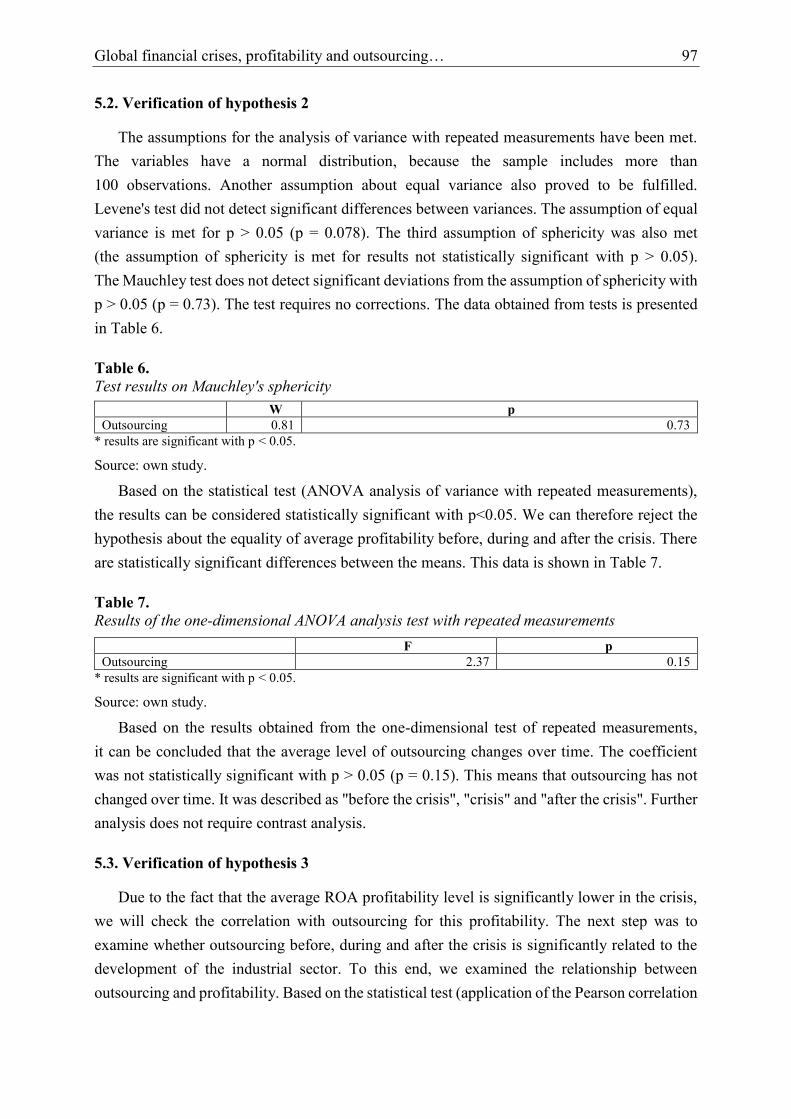
Global financial crises, profitability and outsourcing… 97
5.2. Verification of hypothesis 2 1
The assumptions for the analysis of variance with repeated measurements have been met. 2
The variables have a normal distribution, because the sample includes more than 3
100 observations. Another assumption about equal variance also proved to be fulfilled. 4
Levene's test did not detect significant differences between variances. The assumption of equal 5
variance is met for p > 0.05 (p = 0.078). The third assumption of sphericity was also met 6
(the assumption of sphericity is met for results not statistically significant with p > 0.05). 7
The Mauchley test does not detect significant deviations from the assumption of sphericity with 8
p > 0.05 (p = 0.73). The test requires no corrections. The data obtained from tests is presented 9
in Table 6. 10
Table 6. 11
Test results on Mauchley's sphericity 12
W p
Outsourcing 0.81 0.73
* results are significant with p < 0.05. 13
Source: own study. 14
Based on the statistical test (ANOVA analysis of variance with repeated measurements), 15
the results can be considered statistically significant with p<0.05. We can therefore reject the 16
hypothesis about the equality of average profitability before, during and after the crisis. There 17
are statistically significant differences between the means. This data is shown in Table 7. 18
Table 7. 19 Results of the one-dimensional ANOVA analysis test with repeated measurements 20
F p
Outsourcing 2.37 0.15
* results are significant with p < 0.05. 21
Source: own study. 22
Based on the results obtained from the one-dimensional test of repeated measurements, 23
it can be concluded that the average level of outsourcing changes over time. The coefficient 24
was not statistically significant with p > 0.05 (p = 0.15). This means that outsourcing has not 25
changed over time. It was described as "before the crisis", "crisis" and "after the crisis". Further 26
analysis does not require contrast analysis. 27
5.3. Verification of hypothesis 3 28
Due to the fact that the average ROA profitability level is significantly lower in the crisis, 29
we will check the correlation with outsourcing for this profitability. The next step was to 30
examine whether outsourcing before, during and after the crisis is significantly related to the 31
development of the industrial sector. To this end, we examined the relationship between 32
outsourcing and profitability. Based on the statistical test (application of the Pearson correlation 33
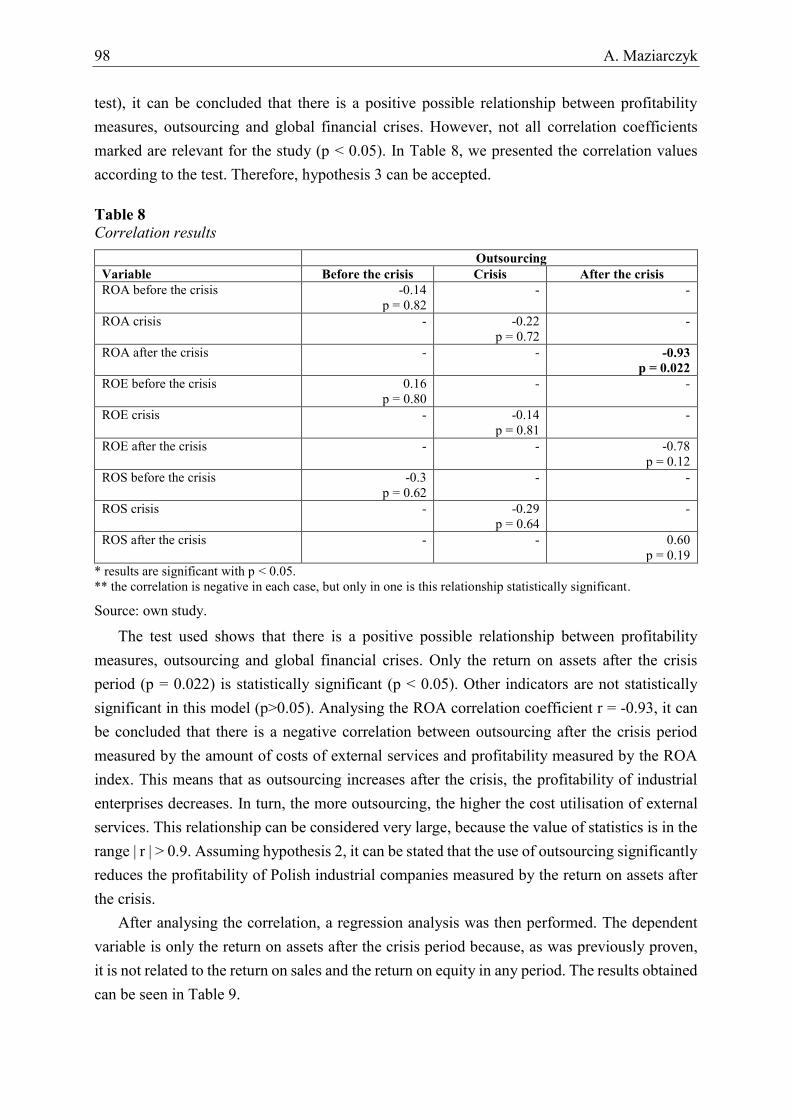
98 A. Maziarczyk
test), it can be concluded that there is a positive possible relationship between profitability 1
measures, outsourcing and global financial crises. However, not all correlation coefficients 2
marked are relevant for the study (p < 0.05). In Table 8, we presented the correlation values 3
according to the test. Therefore, hypothesis 3 can be accepted. 4
Table 8 5 Correlation results 6
Outsourcing
Variable Before the crisis Crisis After the crisis
ROA before the crisis -0.14
p = 0.82
- -
ROA crisis - -0.22
p = 0.72
-
ROA after the crisis - - -0.93
p = 0.022
ROE before the crisis 0.16
p = 0.80
- -
ROE crisis - -0.14
p = 0.81
-
ROE after the crisis - - -0.78
p = 0.12
ROS before the crisis -0.3
p = 0.62
- -
ROS crisis - -0.29
p = 0.64
-
ROS after the crisis - - 0.60
p = 0.19
* results are significant with p < 0.05. 7 ** the correlation is negative in each case, but only in one is this relationship statistically significant. 8
Source: own study. 9
The test used shows that there is a positive possible relationship between profitability 10
measures, outsourcing and global financial crises. Only the return on assets after the crisis 11
period (p = 0.022) is statistically significant (p < 0.05). Other indicators are not statistically 12
significant in this model (p>0.05). Analysing the ROA correlation coefficient r = -0.93, it can 13
be concluded that there is a negative correlation between outsourcing after the crisis period 14
measured by the amount of costs of external services and profitability measured by the ROA 15
index. This means that as outsourcing increases after the crisis, the profitability of industrial 16
enterprises decreases. In turn, the more outsourcing, the higher the cost utilisation of external 17
services. This relationship can be considered very large, because the value of statistics is in the 18
range | r | > 0.9. Assuming hypothesis 2, it can be stated that the use of outsourcing significantly 19
reduces the profitability of Polish industrial companies measured by the return on assets after 20
the crisis. 21
After analysing the correlation, a regression analysis was then performed. The dependent 22
variable is only the return on assets after the crisis period because, as was previously proven, 23
it is not related to the return on sales and the return on equity in any period. The results obtained 24
can be seen in Table 9. 25
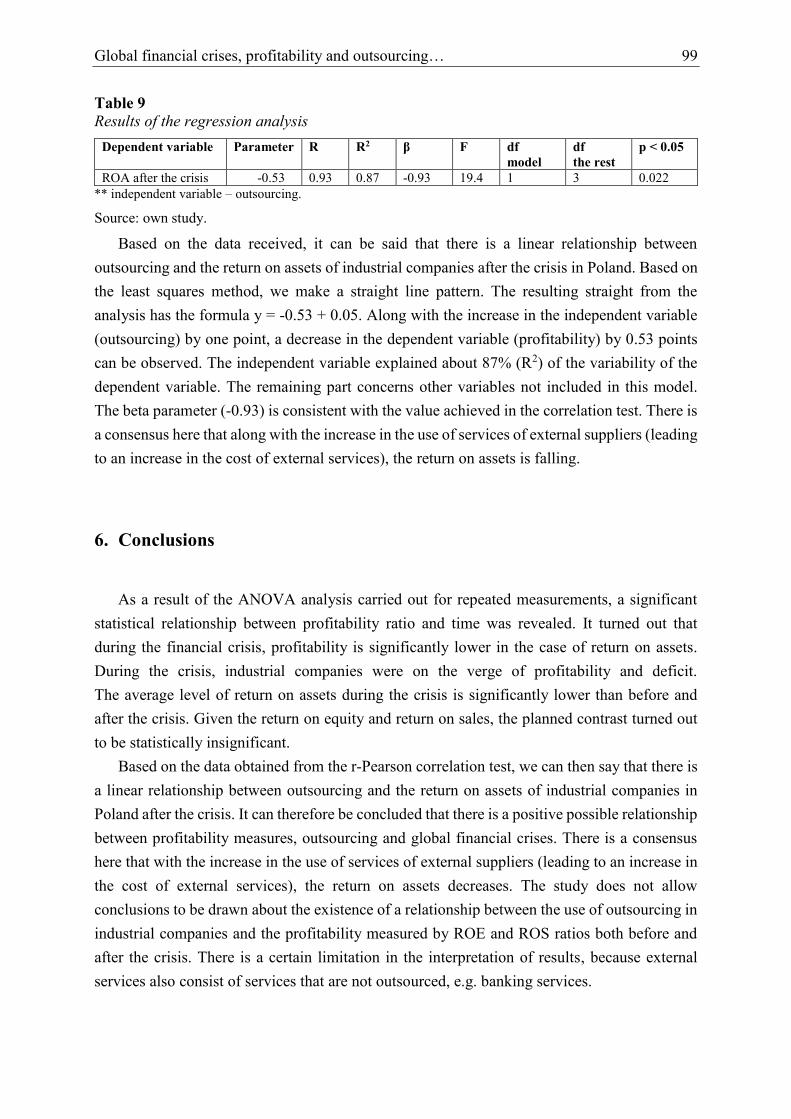
Global financial crises, profitability and outsourcing… 99
Table 9 1 Results of the regression analysis 2
Dependent variable Parameter R R2 β F df
model
df
the rest
p < 0.05
ROA after the crisis -0.53 0.93 0.87 -0.93 19.4 1 3 0.022
** independent variable – outsourcing. 3
Source: own study. 4
Based on the data received, it can be said that there is a linear relationship between 5
outsourcing and the return on assets of industrial companies after the crisis in Poland. Based on 6
the least squares method, we make a straight line pattern. The resulting straight from the 7
analysis has the formula y = -0.53 + 0.05. Along with the increase in the independent variable 8
(outsourcing) by one point, a decrease in the dependent variable (profitability) by 0.53 points 9
can be observed. The independent variable explained about 87% (R2) of the variability of the 10
dependent variable. The remaining part concerns other variables not included in this model. 11
The beta parameter (-0.93) is consistent with the value achieved in the correlation test. There is 12
a consensus here that along with the increase in the use of services of external suppliers (leading 13
to an increase in the cost of external services), the return on assets is falling. 14
6. Conclusions 15
As a result of the ANOVA analysis carried out for repeated measurements, a significant 16
statistical relationship between profitability ratio and time was revealed. It turned out that 17
during the financial crisis, profitability is significantly lower in the case of return on assets. 18
During the crisis, industrial companies were on the verge of profitability and deficit. 19
The average level of return on assets during the crisis is significantly lower than before and 20
after the crisis. Given the return on equity and return on sales, the planned contrast turned out 21
to be statistically insignificant. 22
Based on the data obtained from the r-Pearson correlation test, we can then say that there is 23
a linear relationship between outsourcing and the return on assets of industrial companies in 24
Poland after the crisis. It can therefore be concluded that there is a positive possible relationship 25
between profitability measures, outsourcing and global financial crises. There is a consensus 26
here that with the increase in the use of services of external suppliers (leading to an increase in 27
the cost of external services), the return on assets decreases. The study does not allow 28
conclusions to be drawn about the existence of a relationship between the use of outsourcing in 29
industrial companies and the profitability measured by ROE and ROS ratios both before and 30
after the crisis. There is a certain limitation in the interpretation of results, because external 31
services also consist of services that are not outsourced, e.g. banking services. 32
100 A. Maziarczyk
As part of the study, there were other issues worth considering. Since we already know what 1
the relationship between the profitability of industrial companies and outsourcing is, it is worth 2
checking how outsourcing affects other financial issues of enterprises, including the liquidity 3
and indebtedness of Polish enterprises during and after the crisis. According to research, 4
the Polish industry uses outsourcing to a lesser extent than services. The question is whether 5
outsourcing is a solution for modern industrial enterprises? This question is left to the 6
researchers, as it is worth conducting research not only in Poland, but also in other countries. 7
We note a significant impact of outsourcing on the profitability of service companies and 8
recommend conducting an in-depth analysis of outsourcing in this sector. 9
References 10
1. Aalders, R. (2001). The IT Outsourcing Guide. Chichester: Wiley, 37. 11
2. Agburu, J.I., Anza, N.C., Iyortsuun, A.S. (2017). Effect of outsourcing strategies on the 12
performance of small and medium scale enterprises (SMEs). Journal of Global 13
Entrepreneurship Research, DOI: 10.1186/s40497-017-0084-0. 14
3. Bedyńska, S., Niewiarowski, J., Cypryańska, M. (2013). Analiza wariancji-integracja 15
zagadnień. S. Bedyńska, M. Cypryańka (eds.). Warszawa: SEDNO, 227. 16
4. Benmelech, E., Dlugosz, J. (2009). The credit rating crisis. NBER Macroeconomics Annual, 17
24, 161-207. 18
5. Brunnermeier, M., Pedersen, L. (2009). Market liquidity and funding liquidity. Review of 19
Financial Studies, 22, 2201-2238. 20
6. Calabrese, G., Erbetta, F. (2005). Outsourcing and firm performance: Evidence from Italian 21
automotive suppliers. International Journal of Automotive Technology and Management, 22
5, 4, DOI: 10.1504/IJATM.2005.008585. 23
7. Denčić-Mihajlo, K. (2014). Profitability during the financial crisis evidence from the 24
regulated capital market in Serbia. South-Eastern Europe Journal of Economics, 7-33. 25
8. Dunford, R. (2000). Key challenges in the search for the effective management of 26
knowledge in management consulting firms. Journal of Knowledge Management, 27
4, 4, 295-300. 28
9. Edvardsson, I., and Teitsdóttir, U. (2015). Outsourcing and financial crisis: evidence from 29
Icelandic service SMEs. Employee Relations, 37, 1, 30-47. DOI: 10.1108/ER-11-2013-30
0168. 31
10. Görg, H., Hanley, A. (2004). Does Outsourcing Increase Profitability? Discussion Paper 32
series. IZA DP, 1372. 33
Global financial crises, profitability and outsourcing… 101
11. Juma’h, A., Wood, D. (2000). Outsourcing implications on companies profitability and 1
liquidity: a sample of UK companies. Work Study, 49, 7, 265-275. DOI:10.1108/ 2
00438020010350220. 3
12. Kakabadse, A., Kakabadse, N. (2003). Outsourcing best practice: transformational and 4
transactional considerations. Journal of Corporate Transformation, 10, 1. 5
13. Kimura, F. (2002). Subcontracting and the performance of small and medium firms in 6
Japan. Small Business Economics, 18, 163-175. 7
14. Lantz, I.A. (2015). Outsourcing strategies and their impact on financial performance in 8
small manufacturing firms in Sweden. International Journal of Business and Finance 9
Research, 9, 4. 10
15. Lysons, K., Gillinham, M. (2003). Purchasing and Supply Chain Management. Prentice 11
Hall, 351. 12
16. Maziarczyk, A. (2020). Impact of outsourcing on the productivity of Polish industrial 13
enterprises. The Małopolska School of Economics in Tarnów Research Papers Collection, 14
45, 1, 41-52. DOI: 10.25944/znmwse.2020.01.4152. 15
17. Mwelu, N., Moya, M.B. (2014). Outsourcing practices and profitability levels of 16
manufacturing firms in Uganda. European Journal of Business and Management, 6, 19. 17
18. Niewiarowski, J. (2013), Schematy wewnątrzgrupowe. Statystyczny drogowskaz. 18
Praktyczne wprowadzenie do wariancji. S. Bedyńska, M. Cypryańska (eds.). Warszawa: 19
SEDNO, 107-108. 20
19. Notoria Serwis, https://ir.notoria.pl/. 21
20. Stanisz, A. (2007). Przystępny kurs statystyki II, Kraków: StatSoft, 41. 22

Scientific Quarterly “Organization and Management”, 2020, Vol. 1, No. 49; DOI: 10.29119/1899-6116.2020.49.7 www.oamquarterly.polsl.pl
HUMAN RESOURCE MANAGEMENT IN THE CONTEXT 1
OF INDUSTRY 4.0 2
Katarzyna PIWOWAR-SULEJ 3
Wroclaw University of Economics, Komandorska 118/120, 53-345 Wroclaw, Poland; 4 [email protected], ORCID: 0000-0002-4627-4344 5
Abstract: The purpose of the article is to answer the following research question: What will 6
change in particular elements of Human Resource Management be in the context of Industry 7
4.0? To achieve the defined purpose, literature studies and empirical research (based on focus 8
group interviews with HR specialists) were used. Such HRM issues as the future of jobs, 9
competencies required from employees and technological progress in HRM are discussed in 10
the subject literature. The paper indicates the need to analyze changes in relation to particular 11
elements of HRM and different groups of employees. It also presents some controversial 12
scenarios of HRM’s future and indicates directions for further research. 13
Keywords: human resource management, Industry 4.0, Fourth Industrial Revolution. 14
1. Introduction 15
Something that most clearly distinguishes modernity from all preceding periods is the 16
unbelievable dynamism (Giddens, 2001). Nowadays, we are dealing with a truly energized era 17
of change in the world of technology introduced by the Industrial Revolution 4.0. The Fourth 18
Industrial Revolution is a concept regarding the use of automation and both data processing and 19
exchange, as well as the implementation of various new technologies that allow the creation of 20
so-called cyber-physical systems and changes in manufacturing processes. It also concerns the 21
digitization of production, where devices and technological systems are connected with each 22
other, including via the Internet, and where large amounts of production data are analyzed. 23
We can consider Industry 4.0 to be a conceptual aggregate that includes a number of new 24
technologies – including the Internet of Things, cloud computing, Big Data analysis and 25
artificial intelligence, as well as incremental printing, augmented reality or cooperating robots 26
(Mychlewicz, and Piątek, 2017). 27
When one compares it with previous Industrial Revolutions, one can find dramatic 28
differences between the fourth Industrial Revolution and the other three. In its scale, scope and 29
complexity, the transformation will be unlike anything humankind has experienced before. 30
104 K. Piwowar-Sulej
The Fourth Industrial Revolution is “not merely a prolongation of the Third Industrial 1
Revolution, but rather a new and distinct revolution” (NICVA, 2019, p. 4). It is introducing 2
technologies that blur the lines between the physical, digital and biological spheres across all 3
sectors. Technologies like artificial intelligence, nanotechnology, quantum computing, 4
synthetic biology and robotics will all drastically supersede any digital progress made in the 5
past 60 years and create realities that were previously unthinkable. Such profound realities will 6
disrupt and change the business model of each and every industry (Hinton, 2018). 7
These changes apply to everyday life and ways of performing work. This because 8
organizational systems do not exist without humans (Latham, 2017). Therefore, managing 9
people (human resources management, HRM) can be considered the key management area. 10
This includes such activities as recruitment and selection, training and development, 11
HR appraisal (HR performance management), renumeration (compensation management) and 12
HR flow (career management). 13
As Whysall, Owtram and Brittain (2019, p. 118) state, “the speed of technological change 14
brought about by Industry 4.0 had created a significant gap between current capability of 15
employees and the rapidly evolving requirements of their roles, prompting a need to consider 16
new and more effective approaches to human resources development”. The authors focused on 17
engineers treated as knowledge workers. But one can state that there are more challenges in 18
HRM related to Industry 4.0 than simply training and developing employees. They can be 19
discussed after they are divided into the particular HR activities mentioned above. 20
The purpose of the article is to answer the following research question: What will change 21
in particular elements of Human Resource Management be like in the context of Industry 4.0? 22
To achieve the defined purpose, literature studies and empirical research were used. The project 23
is financed by the Ministry of Science and Higher Education in Poland under the programme 24
"Regional Initiative of Excellence" 2019 - 2022 project number 015/RID/2018/19 total funding 25
amount 10 721 040,00 PLN. 26
2. Research methods 27
The first research method that was used for the purpose of this article is literature studies. 28
In a literature review, researchers describe, evaluate and clarify what is already known about 29
the research area. The author used a stand-alone review (Easterby-Smith, Thorpe, and Jackson, 30
2015), in order to provide an overview and synthesis. A review of subject literature was carried 31
out by analyzing the databases available in the Library of the Wroclaw University of Economics 32
(including Web of Science and Scopus). Such keywords as “The Fourth Industrial Revolution”, 33
“Industry 4.0” and “Technological Innovation” were used in combination with “Human 34
Resource Management” and “Labor Market”. The focus was placed on academic papers 35

Human resource management in the context of Industry 4.0 105
(in Polish and English). Additionally, the author used the Google search engine in order to find 1
business reports and articles about the analyzed phenomena. 2
The second research method was focus group interview. This method is rarely used by 3
Polish researchers. Its most common application is in the area of marketing research 4
(Drapikowska, Palczewska, 2013). The applied method involves acquiring qualitative data 5
during an informal discussion on a specific topic, between selected persons. This conversation 6
must relate to situations, objects or information that are known to the respondents (Litosseliti, 7
2005, p. 13). In accordance with Drapikowska & Palczewska (2013, p. 74), in all definitions of 8
a focus group interview it is emphasized that: 9
a) the group is small (from 6 to 10 people) and is relatively homogeneous, 10
b) the group is an informal gathering that has been deliberately chosen, 11
c) the group is run by a qualified moderator who uses certain methods and practices in 12
order to obtain the respondents’ true opinions, 13
d) the focus group does not produce quantitative information, 14
e) the purpose of a focus group interview is to record all the behaviors that accompany the 15
respondents’ answers. 16
The main advantages of the focus group technique are the relatively short time needed to 17
gather relevant information and the opportunity to observe the dynamics of participants' 18
attitudes and interaction between them. 19
In accordance with the methodological guidelines, three interviews focused on the same 20
group of respondents, consisting of six people (HR specialists) were carried out in June and 21
July 2019. The interviews were more than four hours long. This means that the author used 22
extended, mini focus group interviews with experts. The study was conducted – in accordance 23
with the British style, in natural conditions, and the author of this article played the role of 24
moderator. The natural environment, i.e., the moderator’s home, stimulated the openness of 25
respondents. 26
Due to methodological shortcomings, including the unrepresentativeness of the sample, 27
the value of a focus group interview has been repeatedly questioned. However, it was found 28
that this method may prove to be very useful during the conceptualization phase of any study, 29
and through its application, the researcher may get help in formulating hypotheses, research 30
problems or conducting a pilot study (Drapikowska, Palczewska, 2013). Focus group 31
interviewing offers an opportunity to explore issues that are not well understood or where there 32
is little prior research on the topic (Nyumba, et al., 2018), as in the case of Poland. The detailed 33
purpose of the interviews was to collect information about the expected changes in HRM 34
activities related to the above-mentioned HRM elements. It is worth mentioning that different 35
reports show that achieving the level of the Third Industrial Revolution is still a challenge for 36
Poland (Iwański, and Gracel, 2016; Siemens, 2016; Low Business Quality, 2018). Therefore, 37
it is valuable to discover how Polish HR specialists perceive the changes. 38
106 K. Piwowar-Sulej
3. Results of literature studies 1
The problems and influence of the Fourth Industrial Revolution are being touched on up in 2
the subject literature. The existing publications usually focus only on development of modern 3
technologies and on some aspects of technological changes. Liao et al. (2017) state that in 4
current research, attention has been paid to the concept of IT integration (e.g., vertical, 5
company-wide and horizontal connection of IT systems). It is clear that standardization of 6
processes and resource productivity are the areas that attract most of the research efforts. 7
The analysis of journal databases indicates that the creation of demand for labor is the most 8
frequently discussed problem, combining technological innovation with the labor market. 9
Publications often list innovation as one of many factors influencing the demand for labor. 10
It is worth mentioning that J. M. Keynes described technological unemployment as 11
unemployment caused by the discovery of ways to economize the use of labor outrunning the 12
pace at which new uses for labor can be found (for more see: Rifkin, 1995). In different reports 13
one can find that the number of jobs for unqualified people will be reduced in the future, 14
whereas the demand for highly competent people should increase (Piwowar-Sulej, 2018). 15
According to McKinsey, due to the vast advancements in automation, up to 375 million workers 16
may need to change their occupational category and up to 800 million individuals may be 17
displaced by automation by 2030 (Hinton, 2018). However, publications from the last ten years, 18
more often than in the literature published earlier, focus on a positive approach to the 19
“technology – labor market” relationships. For example, Ugur, Churchill and Solomon (2018) 20
discuss the correlation of technological innovation on employment, showing that the impact of 21
innovation on employment growth is positive, if small and highly non-uniform. Furthermore, 22
Degryse (2016) points out that there are also less qualified jobs with the least risk of automation, 23
e.g., social workers and hairdressers. 24
Moreover, one can find three alternative scenarios of the technological impact on the future 25
workforce (McGowan, 2018). In scenario one, automation will act as an optimizer. Ideally, 26
robotics or artificial intelligence will serve two purposes: to expand the enterprise and to serve 27
the workforce. If companies use automation and advanced data for these ends, Industry 4.0 will 28
optimize the future of work, to improve rather than replace employment conditions and 29
opportunities. Therefore, the subjects of academic interest cover such HRM issues as preparing 30
employees for new challenges related to the technological changes (Piwowar-Sulej, 2018a; 31
Whysall, Owtram, and Brittain, 2019). Employers should, hence, focus on the competencies 32
required to achieve their business objectives so as to remain competitive and agile, and this 33
requires them to ensure their employees undergo the necessary training to fill these competency 34
gaps. In addition, employees need to acquire competencies “on demand” in order to adapt to 35
their changing roles and responsibilities (Hinton, 2018). 36
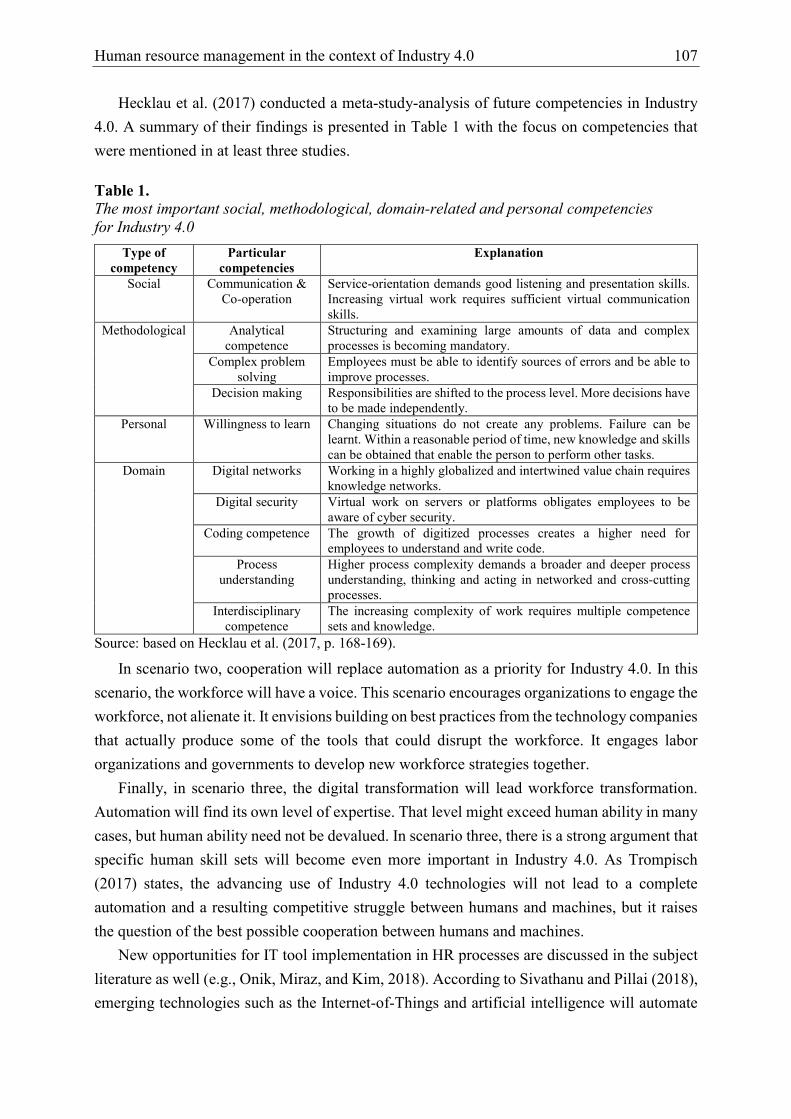
Human resource management in the context of Industry 4.0 107
Hecklau et al. (2017) conducted a meta-study-analysis of future competencies in Industry 1
4.0. A summary of their findings is presented in Table 1 with the focus on competencies that 2
were mentioned in at least three studies. 3
Table 1. 4 The most important social, methodological, domain-related and personal competencies 5
for Industry 4.0 6
Type of
competency
Particular
competencies
Explanation
Social Communication &
Co-operation
Service-orientation demands good listening and presentation skills.
Increasing virtual work requires sufficient virtual communication
skills.
Methodological Analytical
competence
Structuring and examining large amounts of data and complex
processes is becoming mandatory.
Complex problem
solving
Employees must be able to identify sources of errors and be able to
improve processes.
Decision making Responsibilities are shifted to the process level. More decisions have
to be made independently.
Personal Willingness to learn Changing situations do not create any problems. Failure can be
learnt. Within a reasonable period of time, new knowledge and skills
can be obtained that enable the person to perform other tasks.
Domain Digital networks Working in a highly globalized and intertwined value chain requires
knowledge networks.
Digital security Virtual work on servers or platforms obligates employees to be
aware of cyber security.
Coding competence The growth of digitized processes creates a higher need for
employees to understand and write code.
Process
understanding
Higher process complexity demands a broader and deeper process
understanding, thinking and acting in networked and cross-cutting
processes.
Interdisciplinary
competence
The increasing complexity of work requires multiple competence
sets and knowledge.
Source: based on Hecklau et al. (2017, p. 168-169). 7
In scenario two, cooperation will replace automation as a priority for Industry 4.0. In this 8
scenario, the workforce will have a voice. This scenario encourages organizations to engage the 9
workforce, not alienate it. It envisions building on best practices from the technology companies 10
that actually produce some of the tools that could disrupt the workforce. It engages labor 11
organizations and governments to develop new workforce strategies together. 12
Finally, in scenario three, the digital transformation will lead workforce transformation. 13
Automation will find its own level of expertise. That level might exceed human ability in many 14
cases, but human ability need not be devalued. In scenario three, there is a strong argument that 15
specific human skill sets will become even more important in Industry 4.0. As Trompisch 16
(2017) states, the advancing use of Industry 4.0 technologies will not lead to a complete 17
automation and a resulting competitive struggle between humans and machines, but it raises 18
the question of the best possible cooperation between humans and machines. 19
New opportunities for IT tool implementation in HR processes are discussed in the subject 20
literature as well (e.g., Onik, Miraz, and Kim, 2018). According to Sivathanu and Pillai (2018), 21
emerging technologies such as the Internet-of-Things and artificial intelligence will automate 22
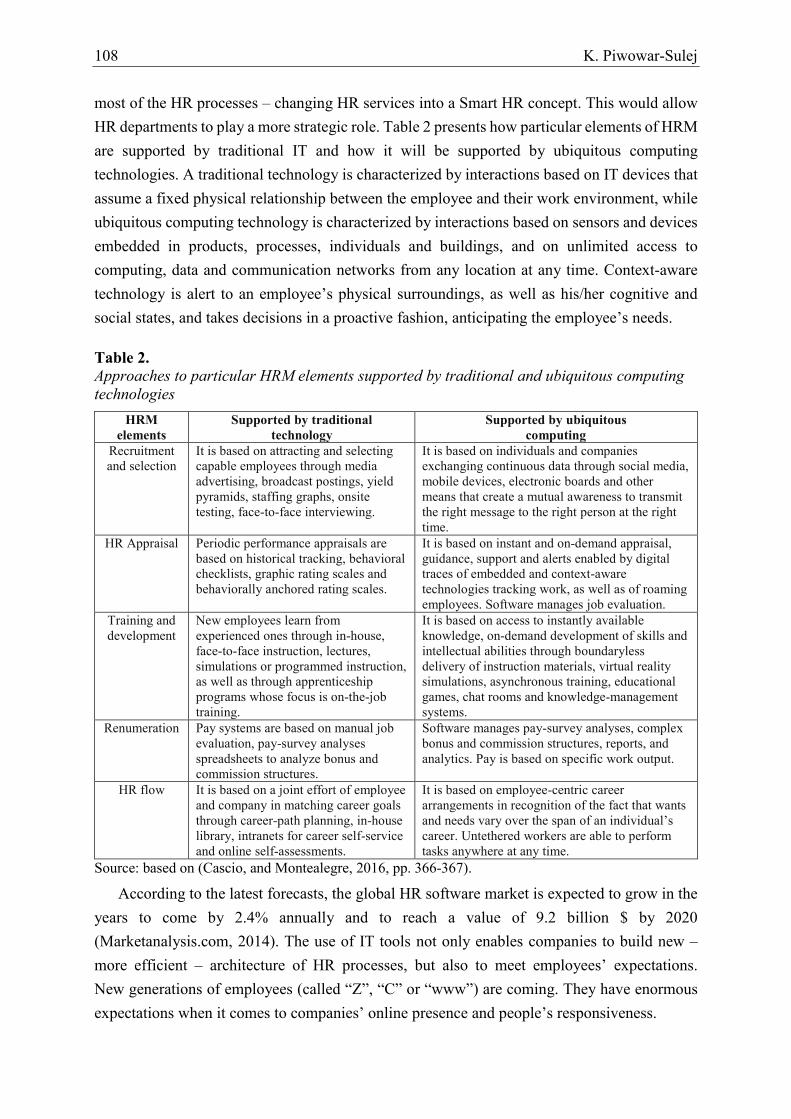
108 K. Piwowar-Sulej
most of the HR processes – changing HR services into a Smart HR concept. This would allow 1
HR departments to play a more strategic role. Table 2 presents how particular elements of HRM 2
are supported by traditional IT and how it will be supported by ubiquitous computing 3
technologies. A traditional technology is characterized by interactions based on IT devices that 4
assume a fixed physical relationship between the employee and their work environment, while 5
ubiquitous computing technology is characterized by interactions based on sensors and devices 6
embedded in products, processes, individuals and buildings, and on unlimited access to 7
computing, data and communication networks from any location at any time. Context-aware 8
technology is alert to an employee’s physical surroundings, as well as his/her cognitive and 9
social states, and takes decisions in a proactive fashion, anticipating the employee’s needs. 10
Table 2. 11 Approaches to particular HRM elements supported by traditional and ubiquitous computing 12
technologies 13
HRM
elements
Supported by traditional
technology
Supported by ubiquitous
computing
Recruitment
and selection
It is based on attracting and selecting
capable employees through media
advertising, broadcast postings, yield
pyramids, staffing graphs, onsite
testing, face-to-face interviewing.
It is based on individuals and companies
exchanging continuous data through social media,
mobile devices, electronic boards and other
means that create a mutual awareness to transmit
the right message to the right person at the right
time.
HR Appraisal Periodic performance appraisals are
based on historical tracking, behavioral
checklists, graphic rating scales and
behaviorally anchored rating scales.
It is based on instant and on-demand appraisal,
guidance, support and alerts enabled by digital
traces of embedded and context-aware
technologies tracking work, as well as of roaming
employees. Software manages job evaluation.
Training and
development
New employees learn from
experienced ones through in-house,
face-to-face instruction, lectures,
simulations or programmed instruction,
as well as through apprenticeship
programs whose focus is on-the-job
training.
It is based on access to instantly available
knowledge, on-demand development of skills and
intellectual abilities through boundaryless
delivery of instruction materials, virtual reality
simulations, asynchronous training, educational
games, chat rooms and knowledge-management
systems.
Renumeration Pay systems are based on manual job
evaluation, pay-survey analyses
spreadsheets to analyze bonus and
commission structures.
Software manages pay-survey analyses, complex
bonus and commission structures, reports, and
analytics. Pay is based on specific work output.
HR flow It is based on a joint effort of employee
and company in matching career goals
through career-path planning, in-house
library, intranets for career self-service
and online self-assessments.
It is based on employee-centric career
arrangements in recognition of the fact that wants
and needs vary over the span of an individual’s
career. Untethered workers are able to perform
tasks anywhere at any time.
Source: based on (Cascio, and Montealegre, 2016, pp. 366-367). 14
According to the latest forecasts, the global HR software market is expected to grow in the 15
years to come by 2.4% annually and to reach a value of 9.2 billion $ by 2020 16
(Marketanalysis.com, 2014). The use of IT tools not only enables companies to build new – 17
more efficient – architecture of HR processes, but also to meet employees’ expectations. 18
New generations of employees (called “Z”, “C” or “www”) are coming. They have enormous 19
expectations when it comes to companies’ online presence and people’s responsiveness. 20
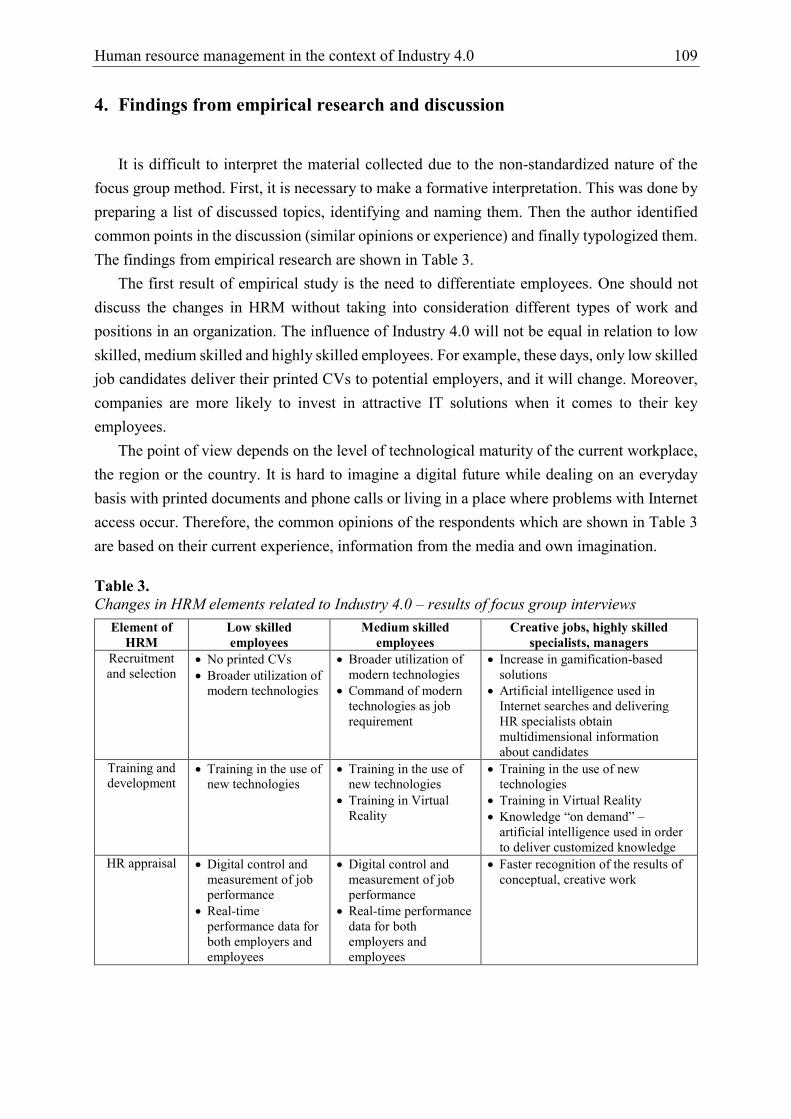
Human resource management in the context of Industry 4.0 109
4. Findings from empirical research and discussion 1
It is difficult to interpret the material collected due to the non-standardized nature of the 2
focus group method. First, it is necessary to make a formative interpretation. This was done by 3
preparing a list of discussed topics, identifying and naming them. Then the author identified 4
common points in the discussion (similar opinions or experience) and finally typologized them. 5
The findings from empirical research are shown in Table 3. 6
The first result of empirical study is the need to differentiate employees. One should not 7
discuss the changes in HRM without taking into consideration different types of work and 8
positions in an organization. The influence of Industry 4.0 will not be equal in relation to low 9
skilled, medium skilled and highly skilled employees. For example, these days, only low skilled 10
job candidates deliver their printed CVs to potential employers, and it will change. Moreover, 11
companies are more likely to invest in attractive IT solutions when it comes to their key 12
employees. 13
The point of view depends on the level of technological maturity of the current workplace, 14
the region or the country. It is hard to imagine a digital future while dealing on an everyday 15
basis with printed documents and phone calls or living in a place where problems with Internet 16
access occur. Therefore, the common opinions of the respondents which are shown in Table 3 17
are based on their current experience, information from the media and own imagination. 18
Table 3. 19
Changes in HRM elements related to Industry 4.0 – results of focus group interviews 20
Element of
HRM
Low skilled
employees
Medium skilled
employees
Creative jobs, highly skilled
specialists, managers
Recruitment
and selection No printed CVs
Broader utilization of
modern technologies
Broader utilization of
modern technologies
Command of modern
technologies as job
requirement
Increase in gamification-based
solutions
Artificial intelligence used in
Internet searches and delivering
HR specialists obtain
multidimensional information
about candidates
Training and
development Training in the use of
new technologies
Training in the use of
new technologies
Training in Virtual
Reality
Training in the use of new
technologies
Training in Virtual Reality
Knowledge “on demand” –
artificial intelligence used in order
to deliver customized knowledge
HR appraisal Digital control and
measurement of job
performance
Real-time
performance data for
both employers and
employees
Digital control and
measurement of job
performance
Real-time performance
data for both
employers and
employees
Faster recognition of the results of
conceptual, creative work
21
22
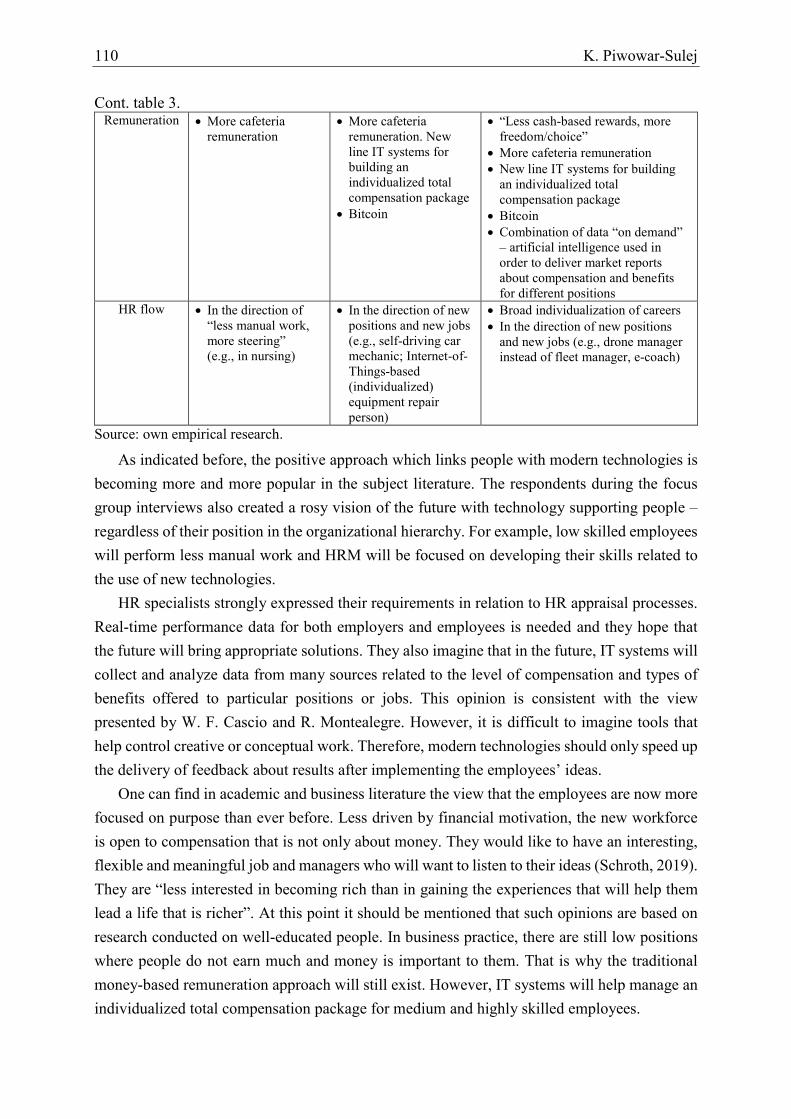
110 K. Piwowar-Sulej
Cont. table 3. 1 Remuneration More cafeteria
remuneration
More cafeteria
remuneration. New
line IT systems for
building an
individualized total
compensation package
Bitcoin
“Less cash-based rewards, more
freedom/choice”
More cafeteria remuneration
New line IT systems for building
an individualized total
compensation package
Bitcoin
Combination of data “on demand”
– artificial intelligence used in
order to deliver market reports
about compensation and benefits
for different positions
HR flow In the direction of
“less manual work,
more steering”
(e.g., in nursing)
In the direction of new
positions and new jobs
(e.g., self-driving car
mechanic; Internet-of-
Things-based
(individualized)
equipment repair
person)
Broad individualization of careers
In the direction of new positions
and new jobs (e.g., drone manager
instead of fleet manager, e-coach)
Source: own empirical research. 2
As indicated before, the positive approach which links people with modern technologies is 3
becoming more and more popular in the subject literature. The respondents during the focus 4
group interviews also created a rosy vision of the future with technology supporting people – 5
regardless of their position in the organizational hierarchy. For example, low skilled employees 6
will perform less manual work and HRM will be focused on developing their skills related to 7
the use of new technologies. 8
HR specialists strongly expressed their requirements in relation to HR appraisal processes. 9
Real-time performance data for both employers and employees is needed and they hope that 10
the future will bring appropriate solutions. They also imagine that in the future, IT systems will 11
collect and analyze data from many sources related to the level of compensation and types of 12
benefits offered to particular positions or jobs. This opinion is consistent with the view 13
presented by W. F. Cascio and R. Montealegre. However, it is difficult to imagine tools that 14
help control creative or conceptual work. Therefore, modern technologies should only speed up 15
the delivery of feedback about results after implementing the employees’ ideas. 16
One can find in academic and business literature the view that the employees are now more 17
focused on purpose than ever before. Less driven by financial motivation, the new workforce 18
is open to compensation that is not only about money. They would like to have an interesting, 19
flexible and meaningful job and managers who will want to listen to their ideas (Schroth, 2019). 20
They are “less interested in becoming rich than in gaining the experiences that will help them 21
lead a life that is richer”. At this point it should be mentioned that such opinions are based on 22
research conducted on well-educated people. In business practice, there are still low positions 23
where people do not earn much and money is important to them. That is why the traditional 24
money-based remuneration approach will still exist. However, IT systems will help manage an 25
individualized total compensation package for medium and highly skilled employees. 26
Human resource management in the context of Industry 4.0 111
Some of the above-presented opinions are new and controversial. For example, the use of 1
Bitcoin (cryptocurrency, a form of electronic cash) in the area of compensation management 2
needs first of all to have its legitimacy. In turn, established artificial intelligence used in Internet 3
searches and providing HR specialists with information about highly skilled candidates raises 4
ethical concerns. 5
5. Conclusions 6
The subject literature provides a number of descriptions of the new reality, addressing 7
various aspects of the incoming changes, including issues related to HRM. The future of jobs, 8
the competencies required from employees and technological progress in HRM are being 9
discussed. This article contributes to the knowledge about specific conditions of HRM in 10
modern enterprises. It focuses on activities related to particular HRM elements and employees 11
with different qualifications. 12
The paper also provides some practical implications. Having in mind the above presented 13
ethical issues, it is worth emphasizing that not only the rapid development of IT, but also 14
managers (including HR professionals) have influence on the shape and pace of changes – 15
in the local and global scale (especially in global corporations). They should be well prepared 16
for changes and aware of the advantages and disadvantages of applying different solutions. 17
Furthermore, they should take into account, as indicated in this study, the level of technological 18
maturity of the current workplaces, the region or the country and differences between 19
qualifications. 20
The author is aware of the limitations resulting from the methodology of this research. 21
However, the presented findings suggest directions for future research. The need occurs to 22
discuss HRM changes whilst taking into account other differentiators of employees, 23
e.g., organization of their work (individual vs. team work; traditional vs. tele-employees) and 24
type of employment (traditional employment vs. contract with freelancers). Moreover, such 25
factors as the legal system and culture play an important role in this area. It would also be 26
interesting to conduct comparative research with HR specialists from different countries. 27
28
112 K. Piwowar-Sulej
References 1
1. Degryse, Ch. (2016). Digitalisation of the economy and its impact on labour markets, 2
Brussels: European Trade Union Institute. 3
2. Drapikowska, B., and Palczewska, M. (2013). Zogniskowany wywiad grupowy oraz 4
techniki projekcyjne jako przykłady jakościowych empirycznych metod badawczych 5
stosowanych w naukach społecznych, Obronność. Zeszyty Naukowe Wydziału Zarządzania 6
i Dowodzenia Akademii Obrony Narodowej, 3(7), 71-86. 7
3. Easterby-Smith, M., Thorpe, R., and Jackson, P.R. (2015). Management and Business 8
Research. London: Sage Publication. 9
4. Giddens, A. (2001). Nowoczesność i tożsamość. „Ja” i społeczeństwo w epoce późnej 10
nowoczesności. Warszawa: PWN. 11
5. Hecklau, F. et al. (2017). Human Resources Management: Meta-Study – Analysis of Future 12
Competences in Industry 4.0. Proceedings of the International Conference on Intellectual 13
Capital, Knowledge Management & Organizational Learning, 163-174. 14
6. Hinton, S. (2018). How The Fourth Industrial Revolution Is Impacting The Future of Work, 15
Forbes, Oct 19, Retrieved from https://www.forbes.com/sites/theyec/2018/10/19/how-the-16
fourth-industrial-revolution-is-impacting-the-future-of-work/#7de0ddeb65a7, 2019.07.15. 17
7. Latham, J. (2019). Without people organizational system don’t exist. http://johnlatham.me/ 18
psychology-stakeholders, 2019.07.20. 19
8. Law Business Quality (2018). Druzgocący raport: czwarta rewolucja przemysłowa ominęła 20
polskie fabryki?, http://magazynlbq.pl/druzgocacy-raport-czwarta-rewolucja-21
przemyslowa-ominela-polskie-fabryki/, 2019.07.13. 22
9. Liao, Y. et al. (2017). Past, present and future of Industry 4.0 – a systematic literature review 23
and research agenda proposal. International Journal of Production Research, 55(12), 3609-24
3629. doi: 10.1080/00207543.2017.1308576. 25
10. Litosseliti, L. (2005). Using focus groups in research, Cornwall: MPG Books Ltd. 26
11. MarketAnalysis.com (2014). Human Resources (HR) Software Market Forecast 2015-27
2020, Tabular Analysis (2014), http://www.marketanalysis.com/?p=338, 2019.07.01. 28
12. McGowan, R. (2018). Here are 3 alternative visions for the future of work. World Economic 29
Forum, 18 Dec. 2018, Retrieved from https://www.weforum.org/agenda/2018/12/ 30
alternative-future-work-opportunity-fear-industry/, 2019.07.11. 31
13. Mychlewicz, C., and Piątek, Z. Od Industry 4.0 do Smart Factory, Poradnik menedżera 32
i inżyniera. Retrieved from https://publikacje.siemens-info.com/pdf/76/Od%20Industry 33
%204.0%20do%20Smart%20Factory.pdf , 2019.06.28. 34
14. NICVA (2019). The Impacts of the Fourth Industrial Revolution on Jobs and the Future of 35
the Third Sector, https://www.nicva.org/sites/default/files/d7content/attachments-articles/ 36
the_impact_of_the_4th_industrial_revolution_on_jobs_and_the_sector.pdf, 2019.07.12. 37
Human resource management in the context of Industry 4.0 113
15. Nyumba, T.O., Wilson, K., Derrick, Ch.J., and Mukherjee, N. (2018). The use of focus 1
group discussion methodology: Insights from two decades of application in conservation, 2
Methods in Ecology and Evolution, 9, 20-32, doi:10.1111/2041-210X.12860. 3
16. Onik, M.M.H., Miraz, M.H., and Kim, C.S. (2018). A recruitment and human resource 4
management technique using Blockchain technology for Industry 4.0. Proceedings of the 5
Smart Cities Symposium (SCS-2018), 11-16, doi: 10.1049/cp.2018.1371. 6
17. Piwowar-Sulej, K. (2018). Human Resources Management in the Industrial Revolution 4.0: 7
General and Polish Perspective. Double-blind peer-reviewed proceedings of the 8
international scientific conference Hradec Economic Days, 8(2), 179-187. 9
18. Piwowar-Sulej, K. (2018a). Employee 4.0 from the competitive perspective. Studia i Prace 10
WNEiZ US, 52/3, 121-129, doi: 10.18276/sip.2018.52/3-12. 11
19. Rifkin, J. (1995). The End of Work: The Decline of the Global Labour Force and the Dawn 12
of the Post-market Era. New York: Putnam Publishing Group. 13
20. Schroth, H. (2019). Are You Ready for Gen Z in the Workplace? California Management 14
Review, 61(3), 5-18. 15
21. Siemens (2016). Smart Industry Polska 2016. Raport z badań, Retrieved from 16
https://publikacje.siemensinfo.com/pdf/123/Raport%20Smart%20Industry%20Polska%2017
2016.pdf, 2019.07.12. 18
22. Sivathanu, B., and Pillai, R. (2018). Smart HR 4.0 – how industry 4.0 is disrupting HR. 19
Human Resource Management International Digest, 26(4), 7-11. 20
23. Trompisch, P. (2017). Industrie 4.0 und die Zukunft der Arbeit [The implications of 21
Industry 4.0 on the future of work]. Elektrotechnik und Informationstechnik, 134(7), 370-22
373. 23
24. Ugur, M., Churchill, S.A,. and Solomon, E. (2018). Technological innovation and 24
employment in derived labour demand models: a hierarchical meta-regression analysis. 25
Journal Of Economic Surveys, 32(1), 50-82, doi: 10.1111/joes.12187. 26
25. Whysall, Z., Owtram, M., and Brittain, S. (2019). The new talent management challenges 27
of Industry 4.0. Journal of Management Development, 38(2), 118-129, doi:10.1108/JMD-28
06-2018-0181. 29

Scientific Quarterly “Organization and Management”, 2020, Vol. 1, No. 49; DOI: 10.29119/1899-6116.2020.49.8 www.oamquarterly.polsl.pl
SUPPORT FOR DELOCALISATION PROCESSES BY LOCAL 1
AUTHORITIES WITH A VIEW TO SUSTAINABLE DEVELOPMENT 2
Bartosz SOBOTKA 3
Faculty of Social Sciences, The University College of Enterprise and Administration in Lublin; 4 [email protected], ORCID: 0000-0002-0393-3645 5
Abstract: Most of humankind live in cities. They therefore play a central role in development 6
processes. Local authorities, through their efforts to attract external investors, try to actively 7
strengthen these processes. Nowadays, it is important for development to be sustainable, both 8
in terms of the environment and citizenship. This article presents the delocalisation processes 9
from three perspectives: the company, the place where the processes are located (i.e. country, 10
region or municipality) and the inhabitant (social capital). The processes are subject to investor 11
acceptance. This win-win strategy, which benefits all three parties, will become the common 12
feature of all delocalisation investment projects which involve the use of available human 13
resources at the place of investment. At present, more invaluable than the low labour cost is the 14
quality of human/social capital, both in context of adaptation to the needs of a specific 15
entrepreneur and one expressed by social and civic awareness. The author defines the theory of 16
stakeholders as the key determinant that should guide municipalities in attracting investors and 17
implementing a sustainable development strategy. Additionally, the paper uses the method of 18
analysis of the literature on the subject, legal documents and available reports. 19
Keywords: delocalisation processes, local development, sustainable development, human 20
capital, building partnerships. 21
1. Introduction 22
Development, including economic development, has become its own goal over the last 23
several decades. Successive industrial revolutions have blackened humanity on the course of 24
development. Progress has undoubtedly brought much good to mankind, but unfortunately it 25
has also had negative consequences, such as the location of the settlement or the diseases the 26
effect the inhabitants. Therefore, for several decades, development has been combined with the 27
issues of sustainable development, which is supposed to be understood as the shaping of reality 28
in such a way that the needs of the present generation can be satisfied without compromising 29
the chances of future generations to satisfy them. 30
116 B. Sobotka
Thus, delocalisation processes should be looked at from a new perspective. Traditionally, 1
this phenomenon has two perspectives: companies that apply these processes and the places 2
where the given processes are located, i.e. the location (country, region or municipality that 3
accepts the investment). Topical literature suggests that there are a lot of works that describe 4
and study these phenomena in a precise way; however, they usually focus on only one 5
perspective. 6
Many works contain an analysis of the discussed phenomena only from the point of view 7
of the company. This knowledge is essential in the process of making business decisions. 8
For example, C.K. Prahalad and G. Hamel indicate, with the help of key competence concepts, 9
which processes can/should be outsourced. They state that companies should focus on those 10
areas that determine their competitive advantage, while others should be separated from the 11
structure and transferred to other entities (Prahalad, & Hamel, 1990). 12
A model of offshoring and outsourcing explaining the choice of a specific organisational 13
form of production fragmentation containing a set of factors, including elements related to 14
costs, resources, monopoly advantage, learning and organisational strategy, is proposed by 15
M.J. Radło (Radło, 2013). 16
M. Greaver presents a methodology for the implementation of outsourcing projects based 17
on seven steps: planning; strategic implications study; cost analysis and execution; supplier 18
selection and the negotiation of conditions and transfer of relationship management resources 19
(Greaver, 1999). 20
M. Power et al. describe the methodology of outsourcing implementation in companies in 21
seven similar stages, in the context of a repetitive relationship management cycle. Their work 22
has a very practical dimension. It contains many examples and guidelines for managers 23
implementing outsourcing strategies (Power et al., 2006). 24
Within the framework of the localisation perspective (in municipalities), a lot of research 25
has been carried out analysing the importance of local authorities in the process of localisation 26
selection by enterprises, emphasising their positive effects (Devereux et al., 2007, pp. 413-435; 27
Barrios et al., 2006, pp. 81-107; Domański, 2001; Kraszewski, 2001; Dziemianowicz, 2008). 28
However, in a majority of these cases, the studies relate to investments already implemented 29
and not potential investments. This is due to the selection of a location. Until the location is 30
revealed, this is not so much information constituting a company secret as an individualised 31
unique process within the framework. Therefore, it can be assumed that the representatives of 32
a given location do not have knowledge of the detailed criteria which constitute the basis for 33
the decision on the choice of location. For this reason, among others, specialists cannot agree 34
on the links between the decisions of companies on the choice of location in offshoring and 35
outsourcing processes and the activities of local governments in attracting investors. However, 36
the issue of supporting delocalisation processes by local authorities is well recognised and 37
presented in many works. 38
Support for delocalisation processes… 117
The Handbook for Promoting Foreign Direct Investment in Medium-Size, Low-Budget 1
Cities in Emerging Markets, published in 2009, as a result of research conducted by the Earth 2
Institute of Columbia University in New York as part of The Millennium Cities Initiative 3
(MCI), which is one of the Millennium Development Goals initiatives established by the United 4
Nations, is considered to be of particular importance. It presents, in a comprehensive way, 5
the mechanisms for building a system of acquiring investments at the local level. Under this 6
system, special attention is paid to the proactive acquisition of investors through 7
individualisation of an offer dedicated to a specific enterprise (Handbook…, 2009). 8
Moreover, a well-known approach is the acquiring of investors for municipalities written 9
by W. Jarczewski. In a comprehensive way, he presents the system of local authorities' 10
influence on the investors' location decisions and conditions of particular pro-investment 11
activities, as well as the importance of local authorities' activity in the process of location 12
selection by enterprises. It states that it is not individual activities carried out by the municipality 13
that contribute to supporting the entrepreneurs' decisions on the choice of a particular location, 14
but the implementation of the whole pro-investment system, including a number of components 15
(Jarczewski, 2012). 16
On the other hand, this new perspective related to sustainable development also applies to 17
the resident. It seems that the win-win strategy is the key determinant to be followed by 18
municipalities. Companies carry out the processes of outsourcing and offshoring mainly due to 19
the basic objective of economics, i.e. profit maximisation. On the other hand, local authorities 20
take actions aimed at attracting investors who create new jobs for the benefit of the region, 21
increase tax revenues and ensure their re-election, while the inhabitants are a passive component 22
of these processes (in the context of direct influence on decision making). The key to the success 23
of the relationship created between investors and public authorities should not only be mutual 24
understanding of each other's interests but should also including residents as active participants 25
in this process. 26
A certain proposal in this respect may be to create a system of acquiring investors beneficial 27
for all parties. The most important element of which should be an individualised investment 28
offer from a given municipality for a specific investor, tailored to its needs based on optimal 29
location criteria, as defined by the entrepreneur. However, such a situation is rare due to the 30
fact, as noted above, that the process of selecting a location by an enterprise is unique for each 31
investment project. 32
On the other hand, a common feature of all investment projects involving offshoring and 33
outsourcing is the use of human resources at the place of investment. Currently, what counts 34
more than the low cost of employees is their quality in terms of adaptation to the needs of 35
a particular entrepreneur. This quality manifests itself primarily as social capital. 36
It is generally accepted that social capital is the basis of civil society, which is characterised 37
by the self-awareness of its members of the needs of that community and the desire to meet 38
them, resulting in interest and responsibility for the affairs of that community. 39
118 B. Sobotka
A low level of social capital affects the small number of ties that exist between people. 1
This results in fewer people knowing each other, and even if people do know each other, they 2
will not trust each other. The result of this situation is a lack of joint or individual action aimed 3
at improving life in the community. On the other hand, a high level of social capital occurs 4
when people have and create good relations with other members of the community, trusting 5
each other and collectively undertaking actions aimed at improving living conditions. 6
In economic terms, a high level of social capital translates into easier negotiations, lower 7
transaction costs, reduction of corruption, the spread of knowledge, the development of civil 8
institutions (the third sector) in the context of the control of public authorities, as well as the 9
favouring of long-term investments (Fukuyama, 2013, p. 169). 10
It is also worth noting that the quality of social capital has a very strong impact on the self-11
awareness of residents in the context of education, including the need for further education, 12
which directly translates into greater employee efficiency. 13
Therefore, an element of a system beneficial for the three parties (entrepreneurs, 14
municipalities and inhabitants) may be building partnerships for pro-investment activities in 15
a given municipality, especially in the area of education and building social capital. 16
This text has been prepared on the basis of available literature, results of market research 17
carried out by professional institutions, legal regulations, as well as on the basis of the author's 18
own observations and experience gained in his professional work in a unit dealing with 19
acquiring and servicing investors in the local government and in an advisory and training 20
organisation preparing staff for the needs of entrepreneurs. 21
2. The influence of decision makers on the location processes of companies 22
Although the classical approach to location theory does not take into account the role of 23
local authorities in influencing location factors, we have been observing an increase in the 24
activity of local authorities in promoting their municipalities for several years. These activities 25
include both tourism and economic dimensions. In particular, the latter dimension begins to 26
play a leading role in activities undertaken by local governments. The flagship motto of 27
politicians around the world is to create new jobs. 28
On the one hand, the influence of local decision makers on business location decisions 29
cannot be overestimated, as according to the location criteria, local authority activities generally 30
take up distant places in terms of their importance. On the other hand, when deciding between 31
two similar locations (similar location parameters, infrastructure, etc.), the influence of local 32
authorities can be significant. 33
34
Support for delocalisation processes… 119
It is also worth noting that the role of local authorities is different, depending both on the 1
size of a given local government community and on the investment sector. Usually, in small 2
municipalities, it is much easier to obtain investment areas by a self-government, mainly due 3
to their price. It is assumed that such municipalities address their investment offer preferably to 4
investors from the production sector and their influence on possible location decisions, which 5
is much greater than that of authorities of large cities of so-called metropolises. This is due to 6
the fact that large cities themselves are attractive for the location of business mostly in the 7
service sector (agglomeration effect). The dynamic development of the BPO/IT/SSC (Shared 8
Service Centre) sector in Poland is by no means due to the local government. The examples of 9
Kraków and Warsaw prove this best. Both these cities do not have an active policy in terms of 10
attracting investments from this sector, and yet it is in these cities that the sector is concentrated 11
in Poland. The natural state of affairs is the development of infrastructure and social capital in 12
large cities needed for modern services. The existence of convenient road and air transport, 13
the possession of educated human resources (the status of academic cities) and the functioning 14
of a large office space market are features of all metropolises around the world. 15
3. Strategic approach - a vision of local development 16
A feature of the 20th and 21st centuries is the processes associated with the decentralisation 17
of power. It is assumed that the closer the power is to the citizens, the more effectively 18
individual policies (understood as comprehensive programmes concerning particular areas of 19
inhabitants' lives) can be implemented for a given community. Decentralisation also entails 20
equipping the lower levels of public administration with instruments to carry out their tasks. 21
Of course, it is crucial here to provide the local authority with financial means with which it 22
can carry out its tasks for the benefit of the local community. The consequence of this 23
phenomenon is the way in which these tasks are performed, i.e. management. It is worth noting 24
that over the last few decades, the very term of local community management has evolved. 25
Initially, it meant administration and carrying out tasks commissioned from central authorities; 26
nowadays, it means policymaking and management. This new scope of management is 27
particularly important in the case of direct elections of mayors and municipality leaders. 28
They have a strong directive to implement this policy after elections (Fukuyama, 2013, p. 169). 29
The key of all actions is a precisely defined goal, corresponding to a certain vision. Without 30
a set objective, it is very difficult to implement activities such as attracting investors. The basic 31
factor in this area is time and consistency of action. The vision of the development of the place 32
where the municipality is to be located in a certain period of time obviously results from internal 33
and external conditions. It is difficult to imagine the construction of an office park complex 34
attracting investors from the research and development sector in a municipality with 2000 35
120 B. Sobotka
inhabitants, 100 kilometres away from a bigger city centre. On the other hand, the vision of 1
creating a 200-ha logistics park near the eastern border of Poland in a municipality where there 2
is a 20% unemployment rate is more realistic, assuming the existence of, or plans to build, 3
an international road transport route in this area. The latter vision, with the use of appropriate 4
tools and determination of local authorities, is possible to achieve. One of the conditions for its 5
implementation is to prepare a strategic document (Kondratenko et al., 2020). 6
It should be noted at this point that there is not an unlimited number of external investors; 7
therefore, it is not possible to fill all investment areas with them. This means that not all 8
municipalities which have defined their strategic vision will achieve success through their 9
actions. On the other hand, activities aimed at improving the investment climate may also result 10
in the release of enormous energy among local entrepreneurs. Of course, according to the theory 11
of foreign direct investment, external investors create new jobs directly and indirectly (through 12
the multiplier effect), and thanks to them, the level of domestic investment increases, they bring 13
know-how, increase productivity and provide access to new technologies and innovations. 14
However, these phenomena can also occur thanks to local entrepreneurs. The simplest example 15
of actions taken by local authorities to build an investment offer for external investors is the 16
adaptation of education in local educational institutions to the labour market. These actions are 17
also beneficial for local entrepreneurs, as economic development, and therefore social welfare, 18
depends on the level of competence of employees (Skupiak, 2013). 19
To sum up, it should be stressed that, nowadays, the coordination and development area is 20
of great importance in formulating a vision, as it creates a network of partnerships within 21
a given municipality. Investment processes are increasingly complex, and both national and 22
global economies are determined by interdependencies. The sum of resources of all 23
municipality stakeholders allows for the building of a better strategy. The more stakeholders in 24
the municipality involved in creating a vision, the more effectively this vision can be 25
implemented. Moreover, such activities are in line with the trend of developing social 26
participation as a way of municipal management. The involvement of stakeholders in the 27
planning process is, by nature, multi-faceted and gradual. Literature emphasises that 28
participation is a certain continuum - a degree of development - of activity between authorities 29
and stakeholders, which can be scaled according to the following stages: informing the society; 30
listening to the society; involving the society; developing agreements/partnerships (Creighton, 31
2012). 32
33
Support for delocalisation processes… 121
4. Resource analysis 1
Each analysis of resources must be preceded by a precise socio-economic diagnosis of the 2
municipality. This is a very important element of creating a vision, as it is assumed that the 3
existing advantages should be strengthened and not at any cost planned for the development of 4
the municipality against internal and external conditions. The scope of the diagnosis should 5
include: 6
General characteristics of the municipality against the background of the region. 7
Demographic structure. 8
Economic structure. 9
State and protection of the environment. 10
Waste management. 11
Technical infrastructure, including telecommunications. 12
Housing management. 13
Road infrastructure. 14
Education. 15
Culture, sport and recreation. 16
Characteristics of the third sector. 17
Human capital and labour market. 18
Health and safety protection. 19
An interesting example of defining the areas of analysis is the methodology of PwC 20
(PricewaterhouseCoopers) used in the study of Polish metropolises. According to this 21
methodology, the analysis areas are grouped into seven development assets (Raport…, 2012): 22
1) Financial Source Assets, which show to what extent the city is able to find funds 23
necessary to finance development. 24
2) Institutional and Democratic Assets, which show the efficiency of city institutions and 25
civil society activity. 26
3) Technical and Infrastructure Assets, which show the city's infrastructure: housing, 27
transport, accessibility, modern services and media. 28
4) Investment Attractiveness Assets, which show the city's potential to attract domestic and 29
foreign investors. 30
5) Culture and Image Assets, which show whether the city is perceived as an interesting 31
and culturally attractive place. 32
6) Human and Social Assets, which define the quality of human resources: knowledge and 33
qualifications, demographic structure, pro-market attitude encouraging economic 34
activity. 35
7) Quality of Life Assets, which show the living conditions offered by the city: the state of 36
the environment, the level of health care, education, safety, traffic. 37
122 B. Sobotka
The above resources belong to internal conditions; however, it is also very important to 1
analyse external conditions, which have an increasing impact on all development processes. 2
The external conditions include: 3
International environment – general social and economic situations, directions and 4
priorities for the development of the European Union, global policy priorities, current 5
transnational phenomena (e.g. migration problem). 6
National and regional environment – sectoral and industry policies, the general political 7
situation. 8
Economic environment – dynamics of economic development, programmes supporting 9
the development of small and medium-sized enterprises, economic development 10
policies, active forms of combating unemployment. 11
Social environment – changes in lifestyle, consumption preferences, forms of spending 12
free time, counteracting the social exclusion of citizens and families in a difficult life 13
situation. 14
Technological environment – innovative processes, new technologies, trends in 15
modernisation of production processes. 16
Legal environment - political and legal basis for the functioning and development of the 17
state, society, local government. 18
Ecological environment - directions and priorities of social, organisational and technical 19
activities for the protection of the natural environment and prevention of its degradation. 20
5. Building partnerships towards the quadruple helix 21
In the modern world, we can observe dynamic processes resulting in interdependence. 22
Building an effective vision of development and its implementation seems impossible without 23
building appropriate partnerships and the involvement of many entities. However, various 24
actors who are involved in the development processes of a municipality must achieve certain 25
benefits in order for this involvement to be real. This phenomenon is explained by the theory 26
of stakeholders, whose most famous promoter is the American economist R.E. Freeman. 27
The most important assumptions of the Stakeholder Theory are (Freeman, 1984): 28
The existence of many groups of stakeholders who are interested in assessing the 29
functioning of an entity (e.g. municipalities). 30
A given entity enters into relations with many stakeholder groups. 31
32
Support for delocalisation processes… 123
Focusing on the nature of relationships, both in the areas of processes and results for the 1
organisation. 2
The interests of all eligible stakeholders have an important value, and none of them 3
should dominate the others. 4
On the other hand, the purpose of the stakeholder analysis is to identify and assess the type 5
and scope of influence in different types of interest groups (stakeholders) shaping the 6
organisation's strategy of operation in the case of a municipality interest. The aim of this activity 7
is to explain and analyse the expectations and behaviours of stakeholders, the relations between 8
them and the organisation, the directions and possibilities of their influence on changes in the 9
organisation's goals, as well as its functioning and effectiveness. A stakeholder analysis aims, 10
first of all, at getting to know groups, business entities or institutions that are strategic partners 11
of the organisation, determining the nature of relations that take place between them and their 12
partners, and secondly, identifying instruments or decisions with which they exert or intend to 13
exert influence over the organisation. 14
This method is a procedure of systematic collection and processing of qualitative data to 15
define whose benefits should be considered when creating and implementing activities. It also 16
serves to identify and evaluate people, social groups and institutions which are key to the project 17
or undertaking and have a decisive influence on the operationalisation of activities. 18
In order to analyse the stakeholders in the scope of undertaking pro-investment activities by 19
the municipality, after their identification, the following features are examined (Freeman, 20
1984): 21
- Stakeholder knowledge about the pro-investment activities and their importance. 22
- Benefits for individual stakeholders. 23
- Support or lack of support for these activities. 24
- Potential alliances between stakeholders, as well as the ability to influence the process 25
of implementation of the pro-investment policy of the municipality. 26
Moreover, the impact, i.e. the strength with which the stakeholders can influence the 27
implementation of the pro-investment policy of the municipality, is assessed. It manifests itself 28
primarily in the ability to control the decisions made, the possibility to facilitate the 29
implementation of activities, as well as the negative dimension, i.e. the possibility to block these 30
activities. 31
On the other hand, the importance of stakeholders is a parameter which indicates the 32
importance that has been assigned to the satisfaction of the needs and benefits of a given 33
stakeholder resulting from the implementation of the measures. 34
The importance of stakeholder impact depends on: 35
- Formal authorities. 36
- Authority. 37
- Control over strategic project resources. 38
124 B. Sobotka
- Expertise. 1
- Negotiating position. 2
- Economic, social and political status. 3
- Influence on other stakeholders. 4
Building partnerships for municipality development is nothing more than shaping relations 5
with stakeholders. Thanks to this analysis, the hierarchy of importance of the municipality's 6
interest groups is established, and the potential tools for influencing them are defined. 7
These tools primarily include public relations, i.e. creating a positive image of the municipality 8
and its host as a partner for all stakeholders (Comp.: McFarland, & McConnell, 2011, p. 11). 9
Constant communication is crucial in the process of managing stakeholder relations (Hund, 10
& Engel-Cox, 2002, p. 228). It is also very important to introduce elements of risk management 11
in the area of shaping stakeholder relations, which consists primarily in eliminating potential 12
conflicts or preparing for them. 13
A. Svendsen points out the following stages of building stakeholder relations, which can be 14
attributed to the municipality's prior investment activities (Svendsen, 1998, p. 67): 15
1) Creation of foundations (e.g. selection of strategic directions, defining the mission, 16
vision and values of the municipality in the context of attracting investors and support 17
for internal involvement). 18
2) Reorientation of the organisation (municipality office and its subordinate institutions) – 19
identification of potential gaps and deficiencies, evaluation of the system and structure 20
and introduction of necessary changes. 21
3) Formulating a strategy (primarily in the aspect of attracting investors to the 22
municipality). 23
4) Building trust between all activity stakeholders (information exchange, communication, 24
identification of common goals, identification of conflict areas, providing resources). 25
5) Evaluation and repetition of those stages which require development and enhancements. 26
It is of key importance to identify and include inhabitants of the municipality as a group of 27
stakeholders (today – NGOs, municipal activists; tomorrow – all inhabitants through municipal 28
information systems). On the one hand, the activation of this stakeholder group may counteract 29
the commonly occurring phenomena, such as: social atrophy of the inhabitants and migration 30
movements to larger centres, and it may contribute to the construction of high quality social 31
capital, including the much-needed creative class (Florida, 2010), the engine of economic 32
growth. 33
34
Support for delocalisation processes… 125
6. Summary 1
In the 21st century, most business processes are developed using advanced technology and 2
highly skilled employees, yet traditional industries continue to use cheap labour, mainly in 3
developing countries. 4
At this point, it is worth noting how China is traditionally treated as a huge reservoir for 5
cheap labour. However, there has been increasing pressure placed on raising labour costs, 6
due to the formation of the middle classes, and their aspirations coinciding with their demands. 7
The Chinese authorities are preparing to celebrate the centenary of the Chinese Communist 8
Party (est. 1921). They are also celebrating the building of a "moderate welfare state", 9
i.e. the middle class (Góralczyk, 2018). 10
Increasingly, simple production processes are performed by robots in the context of the 11
fourth industrial revolution (Economy 4.0), so it seems that the key factor in attracting investors 12
is ensuring access to qualified personnel. 13
In the traditional approach, municipality authorities were passive in relation to this issue. 14
Building partnerships between local authorities and institutions of the education sector gives 15
this aspect a dynamic dimension. 16
Both in the case of small municipalities and large cities, the local authorities have great 17
opportunities to influence and create partnerships with primary and secondary schools in the 18
context of building staff potential. Firstly, these schools often report directly to the local 19
government units, which are the leading body for them. Secondly, the quality of education and 20
the fate of graduates depends on the interest of potential new students (candidates for these 21
schools). In Poland, large cities allocate about half of their budget to education, so the impact 22
can be very high if there is an appropriate partnership based on mutual understanding of the 23
objectives and benefits for all parties. 24
In many cases, the institutions of the educational system are subordinate to the local 25
government and are characterised by a low level of knowledge about the pro-investment 26
activities of the municipality, having a neutral attitude towards this. This means that there is 27
a large space for including these institutions in the pro-investment policy of the municipality, 28
due to the great possibilities of their influence as entities that prepare staff for investors by 29
including them in the process of adjusting the educational offer to the needs of the labour 30
market. 31
The construction and quality of partnerships in the area of pro-investment activities of 32
a municipality – and thus its effectiveness – are much less affected by local authorities in the 33
case of higher education institutions, which are not only independent from them but also fully 34
autonomous. In this case, only mutual understanding of their interests can bring the expected 35
benefits. 36
126 B. Sobotka
Moreover, there is a certain analogy in terms of building partnerships with the triple and 1
quadruple helix concepts, which are the basis for the development of modern cities. They are 2
based on cooperation and the search for collaborations between three (triple: administration, 3
business, science) or four stakeholder groups (quadruple: additionally, residents/civic society) 4
(Lombardi et al., 2012, pp. 137-149). 5
In the 21st century, human capital and its quality (inhabitants/civic society), in particular, 6
play a key role in development. This is related to the new development paradigm of countries 7
and regions, i.e. building a knowledge-based economy. One of the most popular definitions of 8
human capital is that developed by the OECD. Within this definition, human capital is 9
understood as "the knowledge, skills, abilities and other qualities of the human being which 10
enable the production of personal, social and economic well-being (Boris et al., 2006, 11
pp. 81-107)". 12
As early as 1962, Nobel Prize winner George Becker introduced the concept of investing in 13
human capital as a way of allocating resources that influences future income. By investing in 14
assets, he understood education and gaining experience at work through training or collecting 15
information about the world around him. This is not only still valid, it is a condition for 16
development, but more importantly, it can be a condition for survival (Comp: Kuzior, 2010; 17
Kuzior 2014a, 2014b, 2014c). 18
References 19
1. Barrios, S., Gorg, H., Strobl, E. (2006). Multinationals' location choice, agglomeration 20
economies and public incentives. International Regional Science Review, 29, 81-107. 21
2. Creighton, J.L. (2012). The public participation handbook. San Francisco: Wiley. 22
3. Devereux, M., Griffith, R., Simpson, H. (2007). Firm location decisions, regional grants 23
and agglomeration externalities. Journal of Public Economics, 91, 413-435. 24
4. Domański, B. (2001). Kapitał zagraniczny w przemyśle Polski: prawidłowości 25
rozmieszczenia, uwarunkowania i skutki. Kraków: Instytut Geografii i Gospodarki 26
Przestrzennej Uniwersytetu Jagiellońskiego. 27
5. Dziemianowicz, W. (2008). Konkurencyjność gmin w kontekście relacji władze lokalne – 28
inwestorzy zagraniczni. Warszawa: Wydawnictwa Uniwersytetu Warszawskiego. 29
6. Florida, R. (2010). Narodziny klasy kreatywnej. Narodowe Centrum Nauki. 30
7. Freeman, R.E. Strategic Management: A stakeholder approach. Boston: Pitman. 31
8. Fukuyama, F. (2003). Kapitał społeczny. In: L.E. Harrison, S.P. Huntington (eds.), Kultura 32
ma znaczenie. Kraków: Zysk i S-ka. 33
9. Góralczyk, B. (2018). Wielki renesans. Chińska transformacja i jej konsekwencje. 34
Warszawa: Dialog. 35
Support for delocalisation processes… 127
10. Greaver, M. (1999). Strategic Outsourcing A Structured Approach to Outsourcing 1
Decisions and Initiatives. AMACOM. 2
11. Handbook for Promoting Foreign Direct Investment in Medium‐Size, Low‐Budget Cities in 3
Emerging Markets, Millenium Cities Initatives (2009). New York: Columbia University. 4
12. Hund, G.E., Engel-Cox, J.A. (2002). Two-Way Responsibility. In: J. Andriof, S. Waddock, 5
B. Husted, S.S. Rahma (eds.), Unfolding Stakeholder Thinking. Sheffield: Greenleaf 6
Publishing. 7
13. Jarczewski, W. (2012). Pozyskanie inwestorów do gmin. Warszawa: Wolters Kluwer 8
business. 9
14. Kondratenko, V., Okopnyk, O., Ziganto, L., Kwilinski, A. (2020). Innovation Development 10
of Public Administration. Management and Legislation Features, 1. 11
15. Kraszewski, W. (2001). Przedsiębiorstwa z udziałem kapitału zagranicznego w Polsce 12
w latach 1990-1999 (miejsce w gospodarce kraju, czynniki i perspektywy rozwojowe). 13
Wydawnictwo Uniwersytetu Mikołaja Kopernika w Toruniu. 14
16. Kuzior, A. (2014b). Aksjologia zrównoważonego rozwoju. Bańska Bystrzyca: UMB 15
Belianum. 16
17. Kuzior, A. (2014a). Dekada edukacji dla zrównoważonego rozwoju. Zeszyty Naukowe, 17
seria Organizacja i Zarządzanie, 72. Politechnika Śląska. 18
18. Kuzior, A. (2014c). Development of competences key to sustainable development. Zeszyty 19
Naukowe, seria Organizacja i Zarządzanie, 75. Politechnika Śląska. 20
19. Kuzior, A. (2010). Polskie i niemieckie doświadczenia w projektowaniu i wdrażaniu 21
zrównoważonego rozwoju. Problemy Ekorozwoju, 5, 1. 22
20. Lombardi, P., Giordano, S., Farouh, H., Yousef, W. (2012). Modelling the smart city 23
performance. Innovation: The European Journal of Social Science Research, 25, 2. 24
21. McFarland, K.C., McConnell, J.K. (2011). Strategies for globally competitive cities. Local 25
roles in Foreign direct investment and International Trade. Washington, DC: Center for 26
Research and Innovation; National League of Cities. 27
22. OECD (2001). The Well-being of Nations, The Role of Human and Social Capital. OECD 28
Publishing. 29
23. Power, M., Desouza, K., Bonifazi, C. (2006). The Outsourcing Handbook: How to 30
Implement a Successful Outsourcing Process. Kogan Page Limited. 31
24. Prahalad, C.K., Hamel, G. (1990). The core competence of the corporation. Harvard 32
Business Review, 68, 3, 12. 33
25. Radło, J. (2013). Offshoring i Outsourcing Implikacja dla gospodarki i przedsiębiorstw. 34
Oficyna Wydawnicza SGH. 35
26. Skupiak, B. (2013). Edukacja jako czynnik wspierający rozwój gospodarczy. Implikacje 36
dla Polski. Studia Ekonomiczne. Zeszyty Naukowe Uniwersytetu Ekonomicznego 37
w Katowicach, 129. 38

128 B. Sobotka
27. Svendsen, A. (2998). The Stakeholder Strategy. Profiting from Collaborative Business 1
Relationships. San Francisco: Berrett-Koehler Publishers. 2
28. Swianiewicz, P., Klimska, U., Mielczarek, A. (2004). Nierówne koalicje – liderzy miejscy 3
w poszukiwaniu nowego modelu zarządzania rozwojem. Warszawa: Scholar. 4
Scientific Quarterly “Organization and Management”, 2020, Vol. 1, No. 49; DOI: 10.29119/1899-6116.2020.49.9 www.oamquarterly.polsl.pl
GLOBAL COMPETENCE: A PREREQUISITE FOR A GLOBAL 1
LABOR MARKET AND A CHALLENGE FOR EDUCATION 2
Aleksandra SYNOWIEC 3
Silesian University of Technology, Faculty of Organization and Management; [email protected], 4 ORCID: 0000-0001-8251-2322 5
Abstract: The aim of the article is to recognize the essence of global competence for effective 6
functioning on the global labor market. Global competence is understood as the ability to 7
interact effectively in international and intercultural environments. The concept of global 8
competence is based on mutual respect and an attitude of openness to cultural diversity. 9
Presented study refers to the significance and necessity of global competence analyzed in 10
literature concerning contemporary educational challenges. 11
Keywords: global education, education, globalization, labor market. 12
1. Introduction 13
The aim of the article is to discuss the concept of global competence and contribution of 14
education in challenging the issues of sustainable development. A global competence as 15
a multidimensional capacity responds to the requirements induced by socio-economic changes, 16
such as the increasing role of migration, culturally diverse teams and intercultural encounters. 17
The concept of global competence is examined in the context of the changing environment of 18
the global labor market and the requirements that contemporary employees should perform. 19
The study has a theoretical character and is based on literature analysis. 20
2. Globalization and education 21
The question of education and development is still the most important in terms of 22
fundamental changes people face in the stage of “liquid modernity” (Bauman, 2010, p. 1). 23
The more globalized and fragmented the world is – the greater is the role of education in 24
challenging the issues of social cohesion, inclusion and democratic participation. Globalization, 25
130 A. Synowiec
according to Giddens (1990), is “the intensification of worldwide social relations which link 1
distant localities in such way that local happenings are shaped by events occurring many miles 2
away, and vice versa” (p. 64). This in consequence, influences societies, organizations and 3
individuals. Jacques Delors (1996), the author of the assessment Learning: The Treasure 4
Within, the Report to UNESCO of the International Commission on Education for the Twenty-5
first Century, emphasizes the essential task of contemporary educational policies, which 6
“can help to create a better world, by contributing to sustainable human development, mutual 7
understanding among peoples and a renewal of practical democracy” (p. 14). The principle to 8
leave no one behind vividly applies to education as a tool for increasing cultural and diversity 9
awareness and overcoming inequalities. 10
On the other hand, the global landscape is being transforming continuously; Veronica Boix 11
Mansilla and Anthony Jackson (2013) define three factors that have significantly changed the 12
socio-economic conditions we live in: the flattened global economy and changing demands of 13
work; migration and immigration creating more culturally and linguistically diverse societies, 14
and climate instability and the growing need for global environmental stewardship” (p. 2). 15
In order to meet new expectations resulting from the process of transition, new sorts of 16
capacities are necessary. The new requirement for thriving in contemporary culture is called 17
global competence (Reimers, 2009; Boix Mansilla, and Jackson, 2013; Verger, 2014; Verger, 18
and Curran, 2014; Murray, 2014). 19
The issue of global competence is not limited to the education discourse. The authors of the 20
6th World Bank’s Report Skills, not Just Diplomas explain the context for necessity of 21
developing new skills: “New skills have come into demand, as employment has been allocated 22
away from declining industries and firms, towards expanding ones. In addition, there has been 23
a large-scale shift of jobs from agriculture and, to a lesser extent, industry towards the service 24
sector” (Sondergaard, Murthi, et al., 2012, p. 17). In turn, Cascio and Boudreau emphasize that 25
the evolution of global business requires “the search for global competence – managerial, 26
cultural, and operational. Global competence is embedded in organizational talent and the 27
systems and leadership that organize and deploy it, but it is increasingly embedded within 28
a workforce that lies beyond the familiar boundaries of regular full-time employment, and is 29
empowered by technologies, platforms and connectedness (…)” (Cascio, and Boudreau, 2016, 30
p. 103). The challenges of the modern labor market faced by employers and employees entail 31
the development of competencies essential in today’s ever-changing global environment. 32
Kuzior and Sobotka (2019) noted that “along with the development of the economic reality 33
described as Industry 4.0, questions about the role and function of Society 4.0 appear more and 34
more often in the public debate” (p. 64). This discussion is evidently followed by considerations 35
on present, as well as future labor competencies. Such circumstances determine the need for 36
continuous education for employees and at the same time demand the appropriate education 37
institutions response to prepare graduates for modern labor market requirements. 38
Global competence: a prerequisite… 131
3. Global competence for global workers 1
Brookings has recently stated that according to experts’ predictions, “by 2030, 825 million 2
children in low- and middle-income countries – half of today’s youths’ generation – will reach 3
adulthood without the skills they need to thrive in work and life” (Brookings.edu, 21.05.2018, 4
para. 1). An important aspect within the framework of the question of education of the future is 5
also to recognize the essence of shaping global competence for effective functioning in the 6
global labor market. “Twenty-first century students live in an interconnected, diverse and 7
rapidly changing world with the increasing role of intercultural encounters” (PISA, 2018, p. 4). 8
Education meeting modern needs is a new challenge. Taking it into consideration, in 2015 17, 9
Sustainable Development Goals (SDGs) were adopted by the General Assembly of the United 10
Nations to be achieved until 2030; goal number four was education (PISA for Development 11
Brief 2017/09, para. 1). Inclusive and quality education “enables upward socioeconomic 12
mobility and is a key to escaping poverty. Education is also essential to achieving many other 13
Sustainable Development Goals” (UN Sustainable Development Goals: 4 Quality Education, 14
2015, para. 2). 15
There is no doubt that comprehensive implementation of sustainable development 16
objectives depends on systematic education and continuous broadening of the sphere of social 17
awareness (Kuzior, 2006, p. 71). Education, as Jacques Delors (1996) acknowledges, is the key 18
for both personal and community development; “its mission is to enable each of us, without 19
exception, to develop our talents to the full and to realize our creative potential, including 20
responsibility for our own lives and achievement of our personal aims” (p. 17). 21
One of the targets defined for Quality Education is described as “promotion of a culture of 22
peace and non-violence, global citizenship and appreciation of cultural diversity and of 23
culture’s contribution to sustainable development” (UN Sustainable Development Goals: 24
4 Quality Education, 2015, para. 10). Whether this can be achieved depends to a large extent 25
on teaching philosophy and curriculum in schools or higher education institutions. It is thus 26
inevitable to foster contemporary concepts in education, such as education for sustainable 27
development, global education, global competence global citizenship, peace education and 21st 28
century skills and to adopt them into education agenda and policies (Verger, 2014; Verger, and 29
Curran, 2014; Murray, 2014). 30
Global education as an umbrella concept is understood as extending “the scope of civic 31
education and upbringing to a global perspective, by making people aware of the phenomena 32
and interdependencies that connect people and places. Its aim is to prepare recipients to face 33
the challenges of all humanity. By interdependence, we understand the interconnectedness and 34
diffusion of cultural, environmental, economic, social, political and technological systems. 35
Global education puts a special emphasis on: explanation of the causes and consequences of 36
the phenomena described; showing the individual's influence on global processes and the 37
132 A. Synowiec
impact of global processes on the individual; overcoming existing stereotypes and prejudices; 1
presenting the global perspective of the South; shaping critical thinking and changing attitudes” 2
(Lipska-Badoti et al, 2011, p. 4). Therefore, global education means an educational approach 3
focused on developing understanding of other cultures and cultural interconnection. The idea 4
of global competence derives from other concepts of global education mentioned above and is 5
oriented on fostering understanding of the contemporary world and increasing the participation 6
in society. 7
PISA – the OECD Program for International Student Assessment – explains that global 8
competence is a multidimensional capacity that enables individuals “to examine local, global 9
and intercultural issues, understand and appreciates different perspectives and world views, 10
interact successfully and respectfully with others and take responsible action toward 11
sustainability and collective well-being” (PISA, 2018, p. 4). According to Fernando 12
M. Reimers, Director of the Global Education Innovation Initiative and the International 13
Education Policy Master’s Program at Harvard University, global competence is: 14
“The knowledge and skills people need to understand today's flat world and to integrate across 15
disciplines so that they can comprehend global events and create possibilities to address them. 16
Global competencies are also the attitudinal and ethical dispositions that make it possible to 17
interact peacefully, respectfully, and productively with fellow human beings from diverse 18
geographies” (2009, p. 184). Polish pedagogist Urszula Dernowska (2013) underlines that 19
global competence is “the ability to effectively interact with other people – people who speak 20
different languages, who profess different religions, who believe in different values” (p. 22). 21
In other words, global competence incorporates attributes in the sphere of knowledge, skills 22
and values, and enables one to act in international and intercultural environments, and to interact 23
on the ground of mutual respect and openness to cultural diversity. Hence, as Veronica Boix 24
Mansilla and Anthony Jackson (2013) claim, the globally competent student should acquire 25
four competences indispensable to perform in globalized world: “Investigating the world 26
beyond their immediate environment; framing significant problems and conducting well-27
crafted and age-appropriate research; recognizing the perspectives of others and their own; 28
articulating and explaining such perspectives thoughtfully and respectfully; communicating 29
ideas effectively with diverse audiences, bridging geographic, linguistic, ideological, 30
and cultural barriers; taking action to improve conditions, viewing themselves as players in the 31
world and participating reflectively” (p. 2). 32
Global competence as an educational concept is reflected in the forecasts of competences 33
inevitable for modern organizations. The Institute of the Future (Davies, Fidler, and Gorbis, 34
2011) defines ten skills for future workforce: 1) Sense-making, 2) Social intelligence, 35
3) Adaptive thinking, 4) Cross-cultural competency; 5) Computational thinking and data-based 36
reasoning, 6) New-media literacy and persuasiveness, 7) Trans-discipline understanding and 37
integration, 8) Design mindset in external environments, 9) Cognitive load management, 38
10) Virtual collaboration. The need for global competence is a response for conditions 39
Global competence: a prerequisite… 133
encountered in multinational and multicultural societies, and accompanies sociological, 1
philosophical and legal reflection on multicultural reality in the era of globalization. 2
One of the most challenging issues for modern societies is multiculturalism, as the questions 3
of ethnic, linguistic, religious or cultural diversity, the phenomenon of the coexistence of groups 4
with different cultural backgrounds within a given territory and institutional solutions 5
regulating their status and mutual relations are the subject of sociological, political, 6
philosophical and legal reflection. Researchers undertake analysis of the phenomenon of 7
multiculturalism both from an ethnic perspective – where ethnic bond is the foundation of 8
identity, cultural content is passed from generation to generation, and cultural diversity is 9
a consequence of migration, conflicts, wars, border changes – and from a non-ethnic 10
perspective, which applies to social categories that differ in the field of normative systems, 11
articulated interests or cultural practices (Mucha, 2005, p. 57). In the first approach, the subject 12
of reflection will be multinational and multi-ethnic societies, immigrant societies; in the second, 13
however, the processes of emancipation of social and cultural minorities are considered. 14
The idea of multiculturalism as an important and meaningful interdisciplinary category 15
describing the dilemmas of the modern world is very capacious – hence, a multitude of 16
interpretations and definitions of this concept can be found in literature. Marian Golka (2010) 17
defines multiculturalism “as one of the incarnations of pluralism, a broader category covering 18
all the plurality and diversity of social groups, layers and categories as well as their political, 19
economic, social and cultural features functioning in society” (p. 65.). Therefore, according to 20
the analysis of The Institute of the Future (Davies, Fidler, and Gorbis, 2011), “cross-cultural 21
competency will become an important skill for all workers, not just those who have to operate 22
in diverse geographical environments. 23
Organizations increasingly see diversity as a driver of innovation. Research now tells us 24
that what makes a group truly intelligent and innovative is the combination of different ages, 25
skills, disciplines, and working and thinking styles that members bring to the table” (p. 9). 26
The role of education should not be forgotten while dealing with the new requirements 27
concerning social networks, or discussion over global issues. 28
4. Global competence: employers’ perception 29
One of the most important challenges for contemporary organizations, as Józef Ober 30
underlines (2016) is “finding, hiring and keep the right employees with the right skills, 31
experience and knowledge that are in line with what the company expects” (p. 353). Skills are 32
usually divided into hard (job-specific, technical, technological) and soft (connected with 33
emotional intelligence). The Cambridge Business English Dictionary defines soft skills 34
as people’s abilities to communicate with each other and work well together. The turn towards 35
134 A. Synowiec
soft skills has been already noticed both by researchers and practitioners – soft skills seem to 1
have become the new hard skills”. Recent research shows that “94% of recruiting professionals 2
believe an employee with stronger soft skills has a better chance to being promoted to 3
a leadership position than an employee with more years of experience but weaker soft skills 4
(Forbes, 18.08.2017, para. 1). Communication, teamwork, adaptability, empathy, work ethic, 5
problem solving and collaboration – these are attributes inevitable to become successful in work 6
life. Strong communication skills and willingness to learn new things are valued by employers 7
(Edsurge.com, 12.06.2019, para. 1-5). What is significant – the list of 21st century skills is 8
composed mainly of soft skills: 1) critical thinking; 2) creativity; 3) collaboration; 9
4) communication; 5) information literacy; 6) media literacy; 7) technology literacy; 10
8) flexibility; 9) leadership; 10) initiative; 11) productivity; 12) social skills (Applied 11
Educational Systems, access date 27.07.2019). What is, therefore, the difference between soft 12
skills and global competence? Competence – as OECD Program for International Students 13
Assessment explains (2018), is much more than skill, since it is “a combination of knowledge, 14
skills, attitudes and values successfully applied to face-to-face, virtual or mediated encounters 15
with people perceived to be from a different cultural background (PISA, 2018, p. 7). The quoted 16
document also emphasizes that acquiring global competence is a life-long process. 17
According to PISA, global competence consists of four dimensions that shape globally 18
competent people who: 1) examine issues of local, global and cultural significance; 19
2) understand and appreciate the perspective of others; 3) engage in open, appropriate and 20
effective interactions across cultures; 4) Take action for collective well-being and sustainable 21
development (PISA, 2018, pp. 7-11). The first dimension of global competence refers to 22
purposeful using knowledge and critical thinking when it comes to making judgments on global 23
and intercultural issues. It requires skills such as selecting and weighing arguments, thus media 24
literacy and effective use of media. The second dimension indicates willingness and capacity 25
to understand global issues from different perspectives, regarding that they result from a system 26
of reference that construct, objectified social reality (Berger, and Luckmann, 1991). This means 27
that globally competent individuals consider that values and behavior of others are influenced 28
by different concepts of reality. 29
The third component of global competence stresses the ability to interact appropriately with 30
people from different background; i.e. not only understanding the others, but also having the 31
capacity to be responsive and prepared for a dialogue. “Diversity will, therefore, become a core 32
competency for organizations over the next decade. Successful employees within these diverse 33
teams need to be able to identify and communicate points of connection (shared goals, priorities, 34
values) that transcend their differences and enable them to build relationships and to work 35
together effectively” (Davies, Fidler, and Gorbis, 2011, p. 9). 36
37

Global competence: a prerequisite… 135
Last, but not least, a further trait, being active and self-conscious members of society, is 1
fundamental to survival in the Fourth Age. Such individuals are those able to mobilize resources 2
in order to respond to local, global and intercultural issues. These attributes are described and 3
implemented through four equivalent measures (PISA, 2018, pp. 12-18): 4
1) knowledge – knowledge about global issues, intercultural knowledge, knowledge about 5
environmental issues, socio-economic development and interdependence; 6
2) skills – cognitive, communication and socio-emotional complex patterns of thinking or 7
behavior inevitable to achieve a goal; 8
3) attitudes – mind-set of beliefs or feelings toward a person, a group, an institution, 9
an issue, a behavior, a symbol; 10
4) values – standards used consciously and unconsciously as a reference for judgments. 11
It is difficult to question the necessity of establishing global competence around the world, 12
considering the global issues and globalization processes we all are subjected to, no matter 13
where we live. The authors of The Global Skills Gap Report in the 21st Century (2018) confirm 14
the commonly known fact, “that universities do not necessarily provide enough opportunities 15
for students to develop skills critical for the labor market” (p. 5) and lay bare that the most 16
important skills across the globe are considered to be problem-solving, the ability to work in 17
a team, and being communicative (p. 8). In the case of business education, Kedia B.L. and 18
Englis P.D. (2011) identifies “a disconnect between global economic realities and the ability of 19
business schools to produce global managers. The gap between traditional business education 20
programs and the business skills set that students need to deal effectively with the global 21
marketplace was noted over two decades ago” (p. 325-326). Still, many of these skills can be 22
developed through existing subjects or special courses taking advantage of processes of 23
internationalization of institutions of higher education, as well as internationalization at home 24
policies. 25
5. Conclusion 26
The concept of global competence is inevitable while challenging the issues of sustainable 27
development, global organizations and global workers. There is a need for establishing global 28
competence as a multidimensional capacity recognizing the socio-economic requirements of 29
today’s labor reality, including the increasing role of migration and intercultural issues, 30
culturally diverse teams and intercultural encounters. The notion of global competence is 31
connected with the changing environment of the global labor market and of requirements that 32
contemporary employees should perform. This concept is strongly present in contemporary 33
literature, and is particularly evident in studies on the role of education in the globalized world. 34
136 A. Synowiec
Moreover, it is noticeable in countries that have recently undergone socio-economic 1
transformation and have become an attractive destination for labor migration – such as Poland. 2
References 3
1. Applied Education Systems, available online: https://www.aeseducation.com/career-4
readiness/what-are-21st-century-skills, 27.07.2019. 5
2. Bauman, Z. (2010). 44 letters from the Liquid Modern World. Cambridge: Polity Press. 6
3. Berger, P.L., and Luckmann, T. (1991). The Social Construction of Reality. A Treatise in 7
the Sociology of Knowledge. Penguin Books. 8
4. Boix Mansilla, V., and Jackson, A. (2013). Educating for Global Competence: Learning 9
Redefined for an Interconnected World In Heidi Jacobs. Mastering Global Literacy, 10
Contemporary Perspectives. New York: Solution Tree. 11
5. Brookings.edu, Citizens of the future: Innovations to leapfrog global education. Accessible 12
online: https://www.brookings.edu/events/citizens-of-the-future/, 27.07.2019. 13
6. Cascio, W.F. and Boudreau, J.W. (2016). The search for global competence: From 14
international HR to talent management. Journal of World Business, 51, 103-114. 15
7. Davies, A., Fidler, D., Gorbis, M. (2011). Future Work Skills 2020. Palo Alto, CA: Institute 16
for the Future. Accessible online: http://www.iftf.org/uploads/media/SR-1382A_UPRI_ 17
future_work_skills_sm.pdf, 28.07.2019. 18
8. Delors, J. (1996). Learning: The Treasure Within, the Report to UNESCO of the 19
International Commission on Education for the Twenty-first Century. UNESCO Publishing. 20
Retrieved from UNESDOC Digital Library: https://unesdoc.unesco.org/ark:/48223/ 21
pf0000109590, 26.07.2019. 22
9. Dernowska, U. (2013). Kompetencja globalna w szkole. Przegląd Pedagogiczny, 2, 17-32. 23
10. Giddens, A. (1990). The Consequences of Modernity. Stanford: Stanford University Press. 24
11. Golka, M. (2010). Imiona wielokulturowości. Warszawa: Warszawskie Wydawnictwo 25
Literackie „Muza SA”. 26
12. Kedia, B.L. and Englis, P.D. (2011). Transforming business education to produce global 27
managers. Business Horizons, 54, 325-331. 28
13. Kuzior, A. (2006). Człowiek jako racjonalny podmiot działań w świetle założeń koncepcji 29
zrównoważonego rozwoju. Problemy Ekorozwoju, 1, 2, 67-72. 30
14. Kuzior, A. and Sobotka B. (2019). Key competencies in the modern business services 31
sector. Organization and Management Scientific Quarterly, 2(46), 63-74, doi: 10.29119/ 32
1899-6116.2019.46.5. 33
Global competence: a prerequisite… 137
15. Lipska-Badoti, G., Rostek, B., Szczygieł, P., and Witkowski, J. (2011). Edukacja globalna 1
w szkole. Każdy nawija. M. Metera, K. Wojda (eds.), Warszawa: Centrum Edukacji 2
Obywatelskiej, Polska Akcja Humanitarna. 3
16. Mucha, J. (2005). Oblicza etniczności. Studia teoretyczne i empiryczne. Kraków: Zakład 4
Wydawniczy Nomos. 5
17. Ober, J. (2016). Employer branding – strategia sukcesu organizacji w nowoczesnej 6
gospodarce. Zeszyty Naukowe Politechniki Śląskiej Seria: Organizacja i Zarządzanie, 7
95, 345-356. 8
18. OECD, PISA 2018 Global competence. Accessible online: http://www.oecd.org/pisa/pisa-9
2018-global-competence.htm, 27.07.2019. 10
19. OECD, PISA for Development Brief 2017/09. Accessible online: https://www.oecd.org/ 11
pisa/pisa-for-development/17-PISA-D-and-SDG4.pdf, 27.07.2019. 12
20. QS Intelligence UNIT, The Global Skills Gap Report in the 21st Century, Retrieved from: 13
https://www.qs.com/the-global-graduate-skills-gaps/, 15.07.2019. 14
21. Reimers, F.M. (2009). Educating for Global Competency. In J. Cohen, M. Malin (Eds.), 15
International Perspectives on the Goals of Universal Basic and Secondary School (pp. 183-16
202). Routledge Press. 17
22. Sondergaard, L., Murthi, M. et al. (2012). Skills, Not Just Diplomas. Managing Education 18
9 for Results in Eastern Europe and Central Asia. Washington: The World Bank. 19
23. Tate, E. (2019). Edsurge.com. Students in Tech Say Soft Skills and Arts Set Them Up for 20
Success. Accessible online: https://www.edsurge.com/news/2019-06-12-students-in-tech-21
say-soft-skills-and-the-arts-set-them-up-for-success, 27.07.2019. 22
24. United Nations Sustainable Development Goals, Education. Accessible online: 23
https://www.un.org/sustainabledevelopment/education/, 27.07.2019. 24
25. United Nations Sustainable Development Goals, Quality Education – why it matters? 25
Retrieved from: https://www.un.org/sustainabledevelopment/wp-content/uploads/2017/ 26
02/4.pdf, 27.07.2019. 27
26. Verger, A. (2014). Why do policy-makers adopt global education policies? Toward 28
a research framework on the varying role of ideas in education reform. Current Issues in 29
Comparative Education, 16, 2, 14-29. 30
27. Verger, A., and Curran, M. (2014). New Public Management as Global Education Policy: 31
Its Adoption and ReContextualisation in a Southern European Setting. Critical Studies in 32
Education, doi: 10.1080/17508487.2014.913531. 33

Scientific Quarterly “Organization and Management”, 2020, Vol. 1, No. 49; DOI: 10.29119/1899-6116.2020.49.10 www.oamquarterly.polsl.pl
PERSONNEL SELECTION METHODS AND THE EMPLOYEE'S
LABOUR MARKET
Olga ZWARDOŃ-KUCHCIAK1*, Agnieszka LIPIŃSKA-GROBELNY2
1 Institute of Psychology, Department of Work and Organisational Psychology, University of Lódź;
[email protected], ORCID: 0000-0001-8463-0496 2 Institute of Psychology, Department of Work and Organisational Psychology, University of Lódź;
[email protected], ORCID: 0000-0003-2770-172
* Correspondence author
Abstract: The aim of the study was to present a comparative analysis of personnel selection
methods with the participation of two key groups in the recruitment process: recruiters and
candidates. A multidimensional assessment was performed of the following selection tools:
interview, application forms, personal questionnaires, psychological testing, knowledge tests,
work samples, Assessment Centre (AC) and candidate screening. The study included
193 people aged between 20 and 55 years. Of these, 84 were HR professionals, and 109 were
candidates for positions. The subjects assessed the personnel selection methods using
a proprietary tool based on semantic differential. The obtained results indicate that the
candidates and recruiters differed in their assessment of the methods. The recruiters considered
the AC, personal questionnaire, psychological tests and knowledge tests as the most effective,
followed by work samples and candidate screening, with the application forms and interview
as the least effective. In contrast, the candidates rated the interview the most highly, followed
by application forms, candidate screening, work samples, psychological tests and knowledge
tests, with personal questionnaires and AC the lowest. Summarising, research and practice in
the field of HR needs to take into considerations macro issues (examining HR system more
broadly), as well as micro issues (examining individual differences and perception).
Keywords: recruitment and selection, personnel selection methods, recruiters, candidates,
employee's labour market.
1. Introduction
The past 10 years has seen a dramatic increase in the demand for workers in response to
continual growth in the global economy (Barometer of employment prospects, 2018).
Moreover, prognoses suggest that this demand may grow, with a very high requirement for
employees. Of the labour markets in the EMEA area, the Polish market is regarded as being the
fifth easiest regarding employment (Barometer of employment prospects, 2019). Hence,
it would be fair to state that the current labour market is one for employees, as it is the job
140 O. Zwardoń-Kuchciak, A. Lipińska-Grobelny
seekers who decide which advert to respond to and in which job to remain. Therefore, firms
have taken steps to encourage applications from unemployed candidates and workers at other
firms by investing in more refined recruitment strategies and in “recruiting with class”.
The latter means a focus on the customer, a two-way flow of information and the regular
assessment of personnel selection methods from the macro HR perspective and the micro
candidate’s perspective. All these activities are designed to create an attractive image of an
employer.
As it is shown form the meta-analysis by Chapman et al. (2005), the attractiveness of an
employer correlates with the perception of the job (i.e. bonuses, type of work), of the
organisation (i.e. its brand, reputation, location) and of the recruitment and selection process
(i.e. recruiter's behaviour, choice of HR methods).
With this in mind, the aim of the present study was to introduce a comparative analysis of
personnel selection methods with the participation of two key groups: recruiters and candidates.
Firstly, the obtained knowledge fits with the idea of supporting business practice through
science; secondly, it gains a greater understanding of the expectations of the two parties, which
can lead to the better design of recruitment programmes and identification of the most effective
methods of personnel selection.
2. Methods of personnel selection and the employee's labour market
The review will begin by defining the concept of personnel selection. Witkowski (2007)
regards selection as essentially being of a social and bidirectional nature: on the one hand,
an organisation makes a decision to submit a job offer to a candidate, while on the other,
the candidate decides whether to accept it. In the institutional context, personnel selection is
defined as a set of actions taken to fill a position so as to guarantee the continuity and efficiency
of the organisation (Marek, 2008). During this process, it is important to adjust the competences
of the candidate to the requirements of the workplace. To achieve this, a specific method of
personnel selection is needed, i.e. one that enables the organisation to verify the professional
suitability of its potential employees (Cowling, 2000; Kawka, & Listwan, 2004). Accordingly,
the method of personnel selection is understood as any form of activity that allows the selection
of the best candidate for performing the tasks associated with a given position (Suchar, 2008).
Declining unemployment, difficulties in finding candidates and dynamic changes in
competence requirements represent a real challenge for all business owners, bearing in mind
that retention is now an everyday occurrence. McKinsey reports that while a typical period of
employment in one organisation in the 1950s was longer than 23 years, this is now around
4 years. In addition, the costs of recruitment and induction are continually rising. For this
reason, the labour market requires that not only do candidates need to be identified and
Personnel selection methods and the employee's labour market 141
contacted, but their professional competences also need to be verified using personnel selection
methods. In addition, potential candidates may sometimes be discouraged from applying for
a position due to the fear of the recruitment procedure; however, it is possible to increase the
chances of their participation by including them in the recruitment and selection process.
Another advantage of this approach is that such activities may also serve to build
a positive image and brand for the employer (Backhaus, and Tikoo, 2004).
Backhaus and Tikoo (2004) propose that building such an image and brand confers
a competitive advantage by emphasising the attractiveness of the organisation and the
productivity of its employees. In this model, the actions undertaken as part of such employer
branding are used to shape two assets: 1) the attractiveness of the organisation to external
stakeholders and 2) loyalty to the employer’s brand, resulting from the identity and culture of
the organisation and the productivity of its employees (internal stakeholders). It should be
assumed that the relations in question are bilateral, i.e. strengthening the employer brand
increases the attractiveness and efficiency of the job, and conversely, these individual
components can also support brand building. Hence, the methods chosen for personnel
selection, i.e. striving for excellence in the process of acquiring staff, can be a source of benefits
for current and potential employees and contribute to creating a strong employer brand.
Following previous studies regarding the frequency of use of selection tools (Dale, 2013;
Jarecki, 2012; Marek, 2008; Witkowski, 2007; Wood, & Payne, 2006), the following methods
of staff selection were chosen for evaluation in the present study: 1) interview, 2) application
form, 3) personal questionnaire, 4) psychological tests, 5) knowledge tests, 6) practical tests
(work samples), 7) Assessment Centre (AC) and 8) candidate screening. Due to the fact that the
selection of appropriate tools may determine the success of recruitment and even support the
reputation of the employer, a number of studies have endeavoured to identify which method is
regarded as the most effective.
3. The aim of the study
In the light of these issues, the theme of the study was to present a comparative analysis of
the perceived effectiveness of chosen methods of personnel selection with the participation of
both recruiters and potential employees. Although literature is rich in works evaluating
selection tools with various criteria and groups of assessors, most studies examine the predictive
validity of the methods (Armstrong, 2007; Cowling, 2000; Sajkiewicz, 1999; Witkowski, 2007)
or the frequency of their application (Furnham, 2008; Lichtarski, 2007; Witkowski, 2007).
A meta-analysis of studies by Hunter and Schmidt on the methods of personnel recruitment
(1990 by Lipińska-Grobelny, 2010) found that practical tests and special ability tests,
Assessment Centre, cognitive tests (general intelligence) and a biographical questionnaire were
142 O. Zwardoń-Kuchciak, A. Lipińska-Grobelny
generally regarded as being the most accurate forms of testing. In contrast, interview and
personality testing appear to be characterised by a moderate degree of reliability and accuracy
by many professional fields, while references and graphology are believed to provide the least
reliable information about the candidate. Some interesting conclusions were reached in a survey
of 255 specialists in personnel departments (52% women and 48% men), mainly employees of
large British companies, regarding methods of assessing job candidates. The results indicate
that the recruiters regarded the Assessment Centre (14.9%), cognitive tests (13.9%) and work
samples (13.6%) as the most accurate methods of personnel selection, while recommendations
(10.8%), references (9.6%) and biographical questionnaire (7.8%) were rated lowest (Furnham,
2008). A study of workers dealing with candidate selection also found the most common, and
often the only, selection method to be the traditionally-conducted interview, being indicated in
66% of cases; less popular were the knowledge and skills tests (25%), Assessment Centre
(19%), application analysis (16%), with case study (2%) and personal questionnaire (1%) being
the least commonly used (Chirkowska-Smolak & Grobelny, 2014).
However, while Chirkowska-Smolak et al. (2014) or Furnham (2008) only evaluated
recruiters, the present study surveys two groups involved in the selection process: recruiters and
candidates. Additionally, in order to operationalise the concept of effectiveness, the current
research examines the respondents concerning features which the most effective selection tools
should possess, rather than using only single evaluation criteria (a frequency or the overall
assessment of effectiveness). In this scrutiny, seven adjectives were selected, these being
helpful, fair, multifaceted, effective, valid (in the sense of returning results that can be acted
upon), reliable and non-schematic. They will be described more fully below. These adjectives
were then used as sub-dimensions of effectiveness in the preparation of an original tool based
on the semantic differential. It should be emphasised that this multidimensional approach was
intended as a contrast to the single-dimension approach used in previous studies. Thus, the first
research question was formulated:
Q1. Is there a difference between recruiters and candidates with regard to their assessment
of personnel selection methods, with reference to the following dimensions: 1.1. helpful in
making personnel decisions; 1.2. fair; 1.3. multifaceted; 1.4. effective; 1.5. valid; 1.6. reliable;
1.7. non-schematic?
The second research question was proposed in response to the possibility of comparison
with other single-dimension surveys.
Q2. Is there a difference between recruiters and candidates in their assessment of the overall
effectiveness of particular personnel selection methods?
Personnel selection methods and the employee's labour market 143
4. Materials and Methods
4.1. Study group
The study included 193 respondents aged 20 to 55 (M = 28, SD = 7.17), including
84 recruiters (R) and 109 candidates (C). The analyses were carried out in accordance with the
principles given in the Helsinki Declaration. The respondents were informed that their
participation was voluntary, they were fully informed about the purpose and course of the study,
and they were assured of their anonymity and the fact that the results would only be used for
group analyses. The group of recruiters included 84 respondents (49 women and 35 men) aged
21 to 54 years (M = 30.2, SD = 6.5), whose seniority in the position did not exceed ten years.
Of this group, 94% were employees of personnel departments, while the remaining 6% were
individuals influencing the personnel policy of a firm, i.e. company owners, directors or board
members. In this group, all respondents had completed higher education, with the most
frequently declared fields of study being Psychology (43%), Human Resources Management
and Pedagogy (30%). The second group comprised 109 candidates seeking employment
(70 women and 39 men) aged 20 to 55 years (M = 30.1, SD = 7.6), of whom 45% had
participated in at least five recruitment processes. Of this group, 65% had completed higher
education, and 32% only secondary education.
4.2. Employed study tools
To address the study questions, a proprietary tool based on Osgood’s semantic differential
technique was used to quantitatively assess the content. The judgment-making procedure
consists of placing the subject of the study, i.e. a specific selection method, on an empirical
continuum determined by a pair of opposing adjectives (e.g. effective-ineffective).
These individual continua form sub-dimensions that define the semantic space, within which
the meaning of the tested concept is located. In addition, the scales used in the tool are strongly
correlated with each other, thus forming a correlation bundle, i.e. a single dimension, which can
be used to indicate overall assessment of effectiveness (Osgood, Suci, and Tannenbaum, 1957).
The semantic differential prepared for the needs of the study was based on a five-point scale of
responses for each of the seven sub-dimensions of the effectiveness of personnel selection
methods given earlier. These were:
helpful vs. unhelpful in making a decision about employment – the method largely
supports the selection of the candidate and allows the assessor to fully present the
desired competences;
fair vs. unfair – the method allows reliable assessments to be made and minimises
unfairness in the process of making personnel decisions;
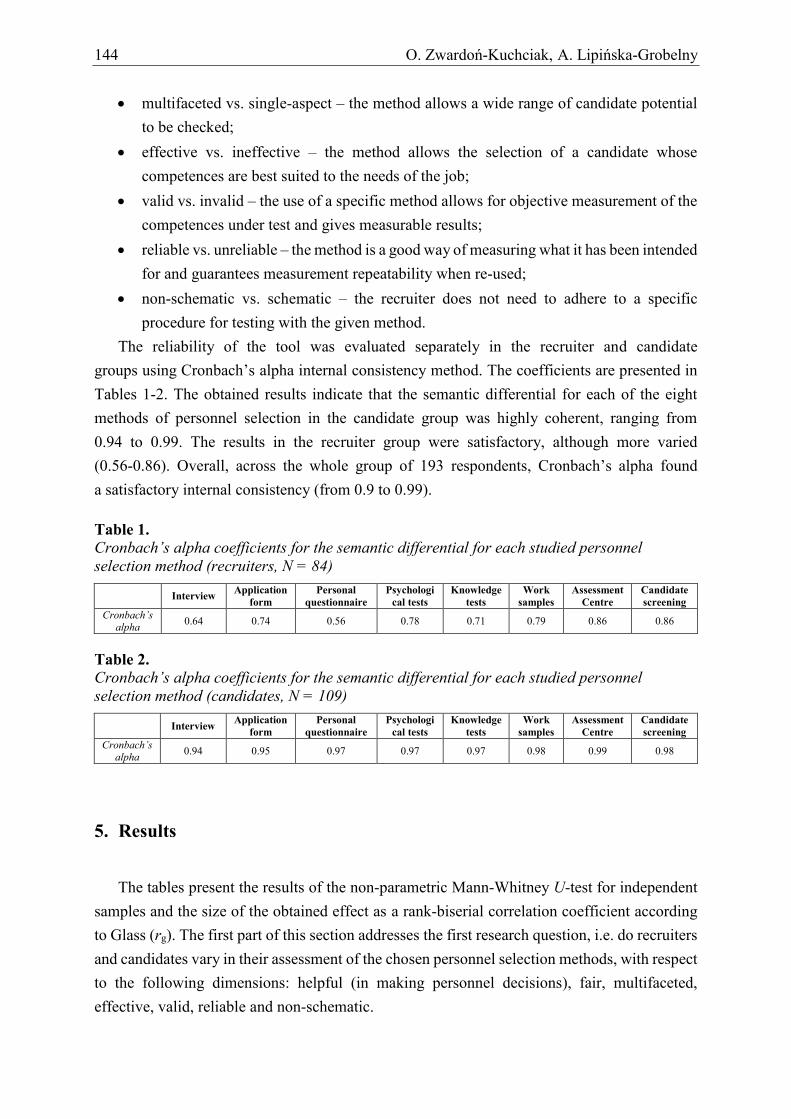
144 O. Zwardoń-Kuchciak, A. Lipińska-Grobelny
multifaceted vs. single-aspect – the method allows a wide range of candidate potential
to be checked;
effective vs. ineffective – the method allows the selection of a candidate whose
competences are best suited to the needs of the job;
valid vs. invalid – the use of a specific method allows for objective measurement of the
competences under test and gives measurable results;
reliable vs. unreliable – the method is a good way of measuring what it has been intended
for and guarantees measurement repeatability when re-used;
non-schematic vs. schematic – the recruiter does not need to adhere to a specific
procedure for testing with the given method.
The reliability of the tool was evaluated separately in the recruiter and candidate
groups using Cronbach’s alpha internal consistency method. The coefficients are presented in
Tables 1-2. The obtained results indicate that the semantic differential for each of the eight
methods of personnel selection in the candidate group was highly coherent, ranging from
0.94 to 0.99. The results in the recruiter group were satisfactory, although more varied
(0.56-0.86). Overall, across the whole group of 193 respondents, Cronbach’s alpha found
a satisfactory internal consistency (from 0.9 to 0.99).
Table 1. Cronbach’s alpha coefficients for the semantic differential for each studied personnel
selection method (recruiters, N = 84)
Interview Application
form
Personal
questionnaire
Psychologi
cal tests
Knowledge
tests
Work
samples
Assessment
Centre
Candidate
screening
Cronbach’s alpha
0.64 0.74 0.56 0.78 0.71 0.79 0.86 0.86
Table 2. Cronbach’s alpha coefficients for the semantic differential for each studied personnel
selection method (candidates, N = 109)
Interview Application
form
Personal
questionnaire
Psychologi
cal tests
Knowledge
tests
Work
samples
Assessment
Centre
Candidate
screening
Cronbach’s alpha
0.94 0.95 0.97 0.97 0.97 0.98 0.99 0.98
5. Results
The tables present the results of the non-parametric Mann-Whitney U-test for independent
samples and the size of the obtained effect as a rank-biserial correlation coefficient according
to Glass (rg). The first part of this section addresses the first research question, i.e. do recruiters
and candidates vary in their assessment of the chosen personnel selection methods, with respect
to the following dimensions: helpful (in making personnel decisions), fair, multifaceted,
effective, valid, reliable and non-schematic.
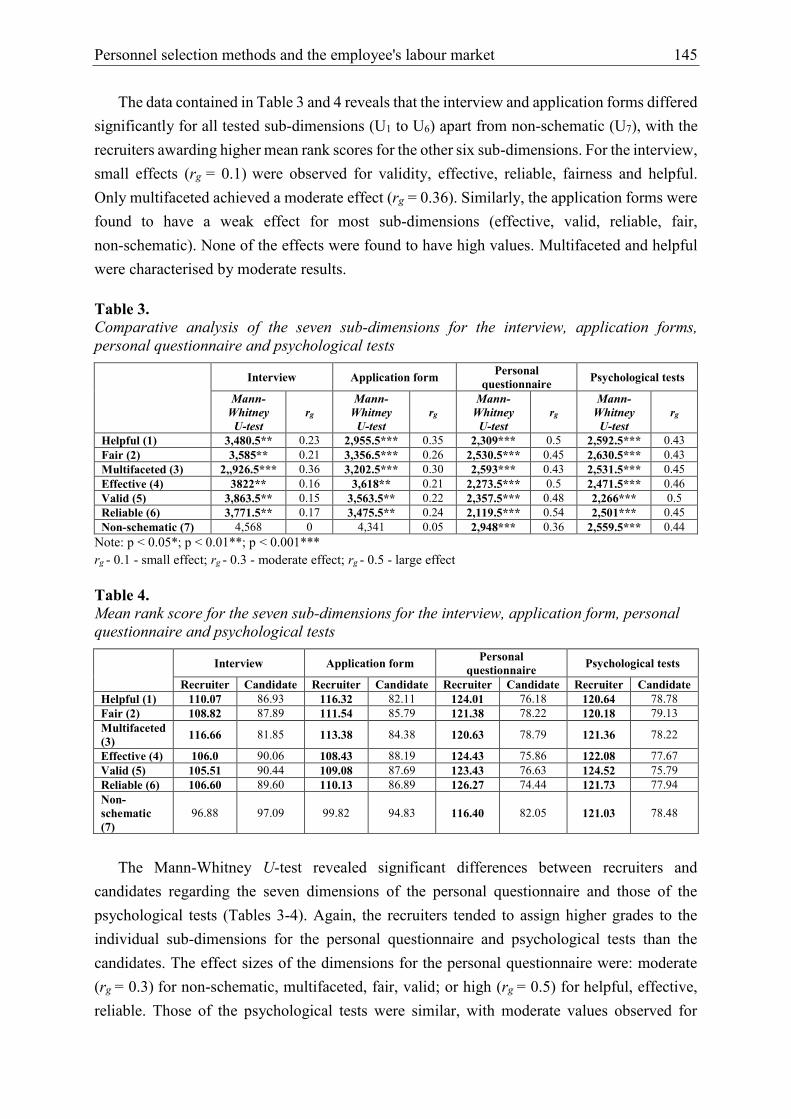
Personnel selection methods and the employee's labour market 145
The data contained in Table 3 and 4 reveals that the interview and application forms differed
significantly for all tested sub-dimensions (U1 to U6) apart from non-schematic (U7), with the
recruiters awarding higher mean rank scores for the other six sub-dimensions. For the interview,
small effects (rg = 0.1) were observed for validity, effective, reliable, fairness and helpful.
Only multifaceted achieved a moderate effect (rg = 0.36). Similarly, the application forms were
found to have a weak effect for most sub-dimensions (effective, valid, reliable, fair,
non-schematic). None of the effects were found to have high values. Multifaceted and helpful
were characterised by moderate results.
Table 3. Comparative analysis of the seven sub-dimensions for the interview, application forms,
personal questionnaire and psychological tests
Interview Application form Personal
questionnaire Psychological tests
Mann-
Whitney
U-test
rg
Mann-
Whitney
U-test
rg
Mann-
Whitney
U-test
rg
Mann-
Whitney
U-test
rg
Helpful (1) 3,480.5** 0.23 2,955.5*** 0.35 2,309*** 0.5 2,592.5*** 0.43
Fair (2) 3,585** 0.21 3,356.5*** 0.26 2,530.5*** 0.45 2,630.5*** 0.43
Multifaceted (3) 2,,926.5*** 0.36 3,202.5*** 0.30 2,593*** 0.43 2,531.5*** 0.45
Effective (4) 3822** 0.16 3,618** 0.21 2,273.5*** 0.5 2,471.5*** 0.46
Valid (5) 3,863.5** 0.15 3,563.5** 0.22 2,357.5*** 0.48 2,266*** 0.5
Reliable (6) 3,771.5** 0.17 3,475.5** 0.24 2,119.5*** 0.54 2,501*** 0.45
Non-schematic (7) 4,568 0 4,341 0.05 2,948*** 0.36 2,559.5*** 0.44
Note: p < 0.05*; p < 0.01**; p < 0.001***
rg - 0.1 - small effect; rg - 0.3 - moderate effect; rg - 0.5 - large effect
Table 4. Mean rank score for the seven sub-dimensions for the interview, application form, personal
questionnaire and psychological tests
Interview Application form
Personal
questionnaire Psychological tests
Recruiter Candidate Recruiter Candidate Recruiter Candidate Recruiter Candidate
Helpful (1) 110.07 86.93 116.32 82.11 124.01 76.18 120.64 78.78
Fair (2) 108.82 87.89 111.54 85.79 121.38 78.22 120.18 79.13
Multifaceted
(3) 116.66 81.85 113.38 84.38 120.63 78.79 121.36 78.22
Effective (4) 106.0 90.06 108.43 88.19 124.43 75.86 122.08 77.67
Valid (5) 105.51 90.44 109.08 87.69 123.43 76.63 124.52 75.79
Reliable (6) 106.60 89.60 110.13 86.89 126.27 74.44 121.73 77.94
Non-
schematic
(7)
96.88 97.09 99.82 94.83 116.40 82.05 121.03 78.48
The Mann-Whitney U-test revealed significant differences between recruiters and
candidates regarding the seven dimensions of the personal questionnaire and those of the
psychological tests (Tables 3-4). Again, the recruiters tended to assign higher grades to the
individual sub-dimensions for the personal questionnaire and psychological tests than the
candidates. The effect sizes of the dimensions for the personal questionnaire were: moderate
(rg = 0.3) for non-schematic, multifaceted, fair, valid; or high (rg = 0.5) for helpful, effective,
reliable. Those of the psychological tests were similar, with moderate values observed for
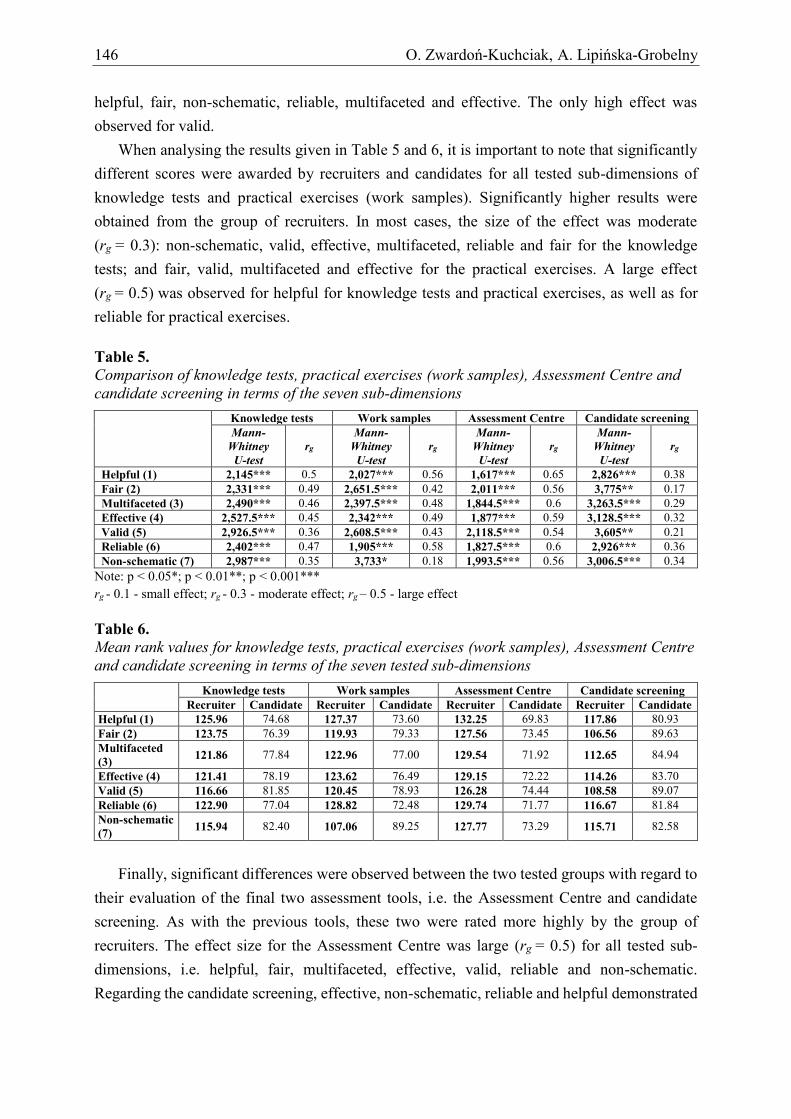
146 O. Zwardoń-Kuchciak, A. Lipińska-Grobelny
helpful, fair, non-schematic, reliable, multifaceted and effective. The only high effect was
observed for valid.
When analysing the results given in Table 5 and 6, it is important to note that significantly
different scores were awarded by recruiters and candidates for all tested sub-dimensions of
knowledge tests and practical exercises (work samples). Significantly higher results were
obtained from the group of recruiters. In most cases, the size of the effect was moderate
(rg = 0.3): non-schematic, valid, effective, multifaceted, reliable and fair for the knowledge
tests; and fair, valid, multifaceted and effective for the practical exercises. A large effect
(rg = 0.5) was observed for helpful for knowledge tests and practical exercises, as well as for
reliable for practical exercises.
Table 5. Comparison of knowledge tests, practical exercises (work samples), Assessment Centre and
candidate screening in terms of the seven sub-dimensions
Knowledge tests Work samples Assessment Centre Candidate screening
Mann-
Whitney
U-test
rg
Mann-
Whitney
U-test
rg
Mann-
Whitney
U-test
rg
Mann-
Whitney
U-test
rg
Helpful (1) 2,145*** 0.5 2,027*** 0.56 1,617*** 0.65 2,826*** 0.38
Fair (2) 2,331*** 0.49 2,651.5*** 0.42 2,011*** 0.56 3,775** 0.17
Multifaceted (3) 2,490*** 0.46 2,397.5*** 0.48 1,844.5*** 0.6 3,263.5*** 0.29
Effective (4) 2,527.5*** 0.45 2,342*** 0.49 1,877*** 0.59 3,128.5*** 0.32
Valid (5) 2,926.5*** 0.36 2,608.5*** 0.43 2,118.5*** 0.54 3,605** 0.21
Reliable (6) 2,402*** 0.47 1,905*** 0.58 1,827.5*** 0.6 2,926*** 0.36
Non-schematic (7) 2,987*** 0.35 3,733* 0.18 1,993.5*** 0.56 3,006.5*** 0.34
Note: p < 0.05*; p < 0.01**; p < 0.001***
rg - 0.1 - small effect; rg - 0.3 - moderate effect; rg – 0.5 - large effect
Table 6. Mean rank values for knowledge tests, practical exercises (work samples), Assessment Centre
and candidate screening in terms of the seven tested sub-dimensions
Knowledge tests Work samples Assessment Centre Candidate screening
Recruiter Candidate Recruiter Candidate Recruiter Candidate Recruiter Candidate
Helpful (1) 125.96 74.68 127.37 73.60 132.25 69.83 117.86 80.93
Fair (2) 123.75 76.39 119.93 79.33 127.56 73.45 106.56 89.63
Multifaceted
(3) 121.86 77.84 122.96 77.00 129.54 71.92 112.65 84.94
Effective (4) 121.41 78.19 123.62 76.49 129.15 72.22 114.26 83.70
Valid (5) 116.66 81.85 120.45 78.93 126.28 74.44 108.58 89.07
Reliable (6) 122.90 77.04 128.82 72.48 129.74 71.77 116.67 81.84
Non-schematic
(7) 115.94 82.40 107.06 89.25 127.77 73.29 115.71 82.58
Finally, significant differences were observed between the two tested groups with regard to
their evaluation of the final two assessment tools, i.e. the Assessment Centre and candidate
screening. As with the previous tools, these two were rated more highly by the group of
recruiters. The effect size for the Assessment Centre was large (rg = 0.5) for all tested sub-
dimensions, i.e. helpful, fair, multifaceted, effective, valid, reliable and non-schematic.
Regarding the candidate screening, effective, non-schematic, reliable and helpful demonstrated
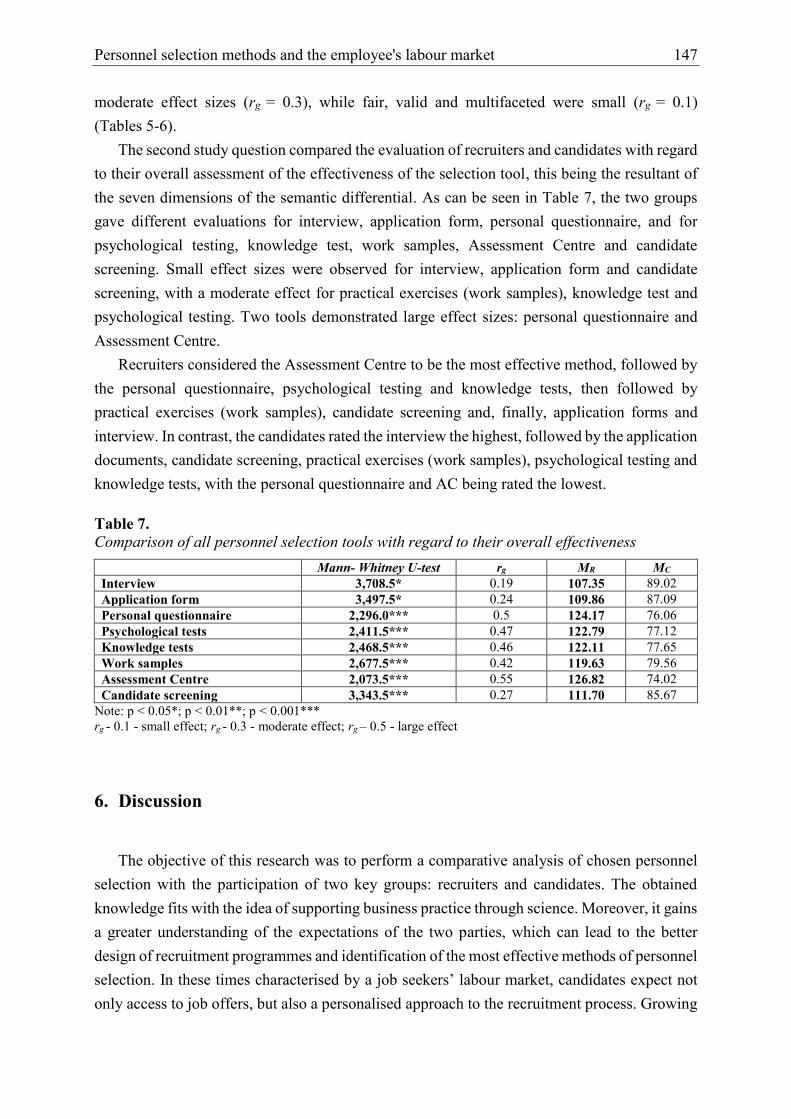
Personnel selection methods and the employee's labour market 147
moderate effect sizes (rg = 0.3), while fair, valid and multifaceted were small (rg = 0.1)
(Tables 5-6).
The second study question compared the evaluation of recruiters and candidates with regard
to their overall assessment of the effectiveness of the selection tool, this being the resultant of
the seven dimensions of the semantic differential. As can be seen in Table 7, the two groups
gave different evaluations for interview, application form, personal questionnaire, and for
psychological testing, knowledge test, work samples, Assessment Centre and candidate
screening. Small effect sizes were observed for interview, application form and candidate
screening, with a moderate effect for practical exercises (work samples), knowledge test and
psychological testing. Two tools demonstrated large effect sizes: personal questionnaire and
Assessment Centre.
Recruiters considered the Assessment Centre to be the most effective method, followed by
the personal questionnaire, psychological testing and knowledge tests, then followed by
practical exercises (work samples), candidate screening and, finally, application forms and
interview. In contrast, the candidates rated the interview the highest, followed by the application
documents, candidate screening, practical exercises (work samples), psychological testing and
knowledge tests, with the personal questionnaire and AC being rated the lowest.
Table 7. Comparison of all personnel selection tools with regard to their overall effectiveness
Mann- Whitney U-test rg MR MC
Interview 3,708.5* 0.19 107.35 89.02
Application form 3,497.5* 0.24 109.86 87.09
Personal questionnaire 2,296.0*** 0.5 124.17 76.06
Psychological tests 2,411.5*** 0.47 122.79 77.12
Knowledge tests 2,468.5*** 0.46 122.11 77.65
Work samples 2,677.5*** 0.42 119.63 79.56
Assessment Centre 2,073.5*** 0.55 126.82 74.02
Candidate screening 3,343.5*** 0.27 111.70 85.67
Note: p < 0.05*; p < 0.01**; p < 0.001***
rg - 0.1 - small effect; rg - 0.3 - moderate effect; rg – 0.5 - large effect
6. Discussion
The objective of this research was to perform a comparative analysis of chosen personnel
selection with the participation of two key groups: recruiters and candidates. The obtained
knowledge fits with the idea of supporting business practice through science. Moreover, it gains
a greater understanding of the expectations of the two parties, which can lead to the better
design of recruitment programmes and identification of the most effective methods of personnel
selection. In these times characterised by a job seekers’ labour market, candidates expect not
only access to job offers, but also a personalised approach to the recruitment process. Growing
148 O. Zwardoń-Kuchciak, A. Lipińska-Grobelny
numbers of organisations are becoming aware of the importance of getting to know the
experiences and impressions held by candidates, together with their evaluation of the
recruitment process. Not only does this have an influence on the management of human
resources in the organisation, but also on the public image of the company and its business
effects. Negative impressions from the recruitment process can quickly be shared, thus
tarnishing the image of the company and, more importantly, reducing interest among potential
candidates.
The first research question (Q1.1.-Q1.7.), regarding whether the two groups of respondents
differed in their assessment of individual methods of personnel selection, was confirmed.
The recruiter group, i.e. the staff of the HR department and those responsible for steering the
company HR policy, rated the interview, application forms, personal questionnaire,
psychological testing, knowledge tests, work samples, Assessment Centre and candidate
screening more highly than the candidates with regard to helpfulness in making personnel
decisions, fairness, their multi-faceted nature, effectiveness, validity, reliability and non-
schematic structure (with the exception of the interview and application forms). The magnitude
of the effect ranged from medium to high. This more favourable evaluation by the recruiters
may result from their more extensive knowledge about the effectiveness of the various selection
tools and their wider experience of their use. In addition, their commitment may also have
played a role, and this may adversely affect the selection of personnel selection methods.
An analysis of the seven individual sub-dimensions indicates that specialists considered the
Assessment Centre to be the most helpful method in deciding upon staff, as well as being the
fairest, most multifaceted, effective, valid, reliable and non-schematic tool. The recruiters also
rated practical exercises and knowledge tests quite highly in terms of helpfulness, while the
candidates preferred interview, application forms and candidate screening. In terms of fairness,
the recruiters rated the Assessment Centre, knowledge tests and personal questionnaires the
most highly, while the candidates preferred the candidate screening, interview and application
forms as not only fair, but also superior in terms of being multi-faceted, effective, valid, reliable
and non-schematic. The multidimensional analysis revealed that the recruiters ranked the
Assessment Centre as being the most effective tool overall; however, practical exercises and
interview were also awarded high scores for being multifaceted, personal questionnaire and
practical exercises as being effective, psychological tests and personal questionnaire for
validity, practical exercises and personal questionnaire for reliability, and psychological testing
and knowledge tests were rated highly for being non-schematic.
Regarding the second question, the recruiters gave a more favourable assessment of overall
effectiveness for some of the personnel selection tools. Interestingly, while the Assessment
Centre (AC) was ranked most highly by recruiters, it was rated lowest by the candidates.
The recruiters based their positive evaluation on its multidimensionality and its level of
precision associated with its preparation and implementation. In addition, as the successful
candidate can be equipped with the necessary hard skills for a post relatively quickly, employers
Personnel selection methods and the employee's labour market 149
tend to place more value on assessing soft skills during recruitment and thus place a high value
on Assessment Centre evaluation during recruitment as a method of verifying behaviour in the
workplace. Further confirmation of these high scores can be found in meta-analyses by
J.E. Hunter and F.L. Schmidt (1990) (Lipińska-Grobelny, 2010) and A. Furnham (2008),
which confirm the significance of the Assessment Centre. In turn, the candidates reacted
negatively to the AC, due to the sophisticated method of research, lack of introductory
information as to its purpose and the nature of the tasks being performed. In addition, the
personal questionnaire and psychological testing were ranked much more highly by the
recruiters than the candidates, and while the candidates regarded the interview, application form
and candidate screening as the most effective tools, the recruitment group found the opposite.
It is possible that the candidates have the highest regard for the methods with which they have
the most contact; therefore, the perception of the AC among candidates and the procedures
associated with it may be improved by regularly referring to the AC during recruitment.
The results obtained are quite surprising, as the specialists implementing the process of
personnel selection have an entirely different perception of the selection tools as its main
heroes, i.e. the candidates. The evaluations given by the recruiters are not surprising when
considering their greater experience, knowledge and qualifications regarding the issue.
They regard the most effective methods as those that are standardised with a clearly defined
procedure and which offer clear recommendations for choosing the best candidate. However,
it seems that specialists do not appreciate which methods are the most popular or which are
used most frequently (Dale, 2013; Jarecki, 2012; Marek, 2008; Witkowski, 2007). In addition,
our findings suggest they also do not favour the methods preferred by the candidates. The high
scores awarded by candidates to traditional interviews and application forms may be associated
with the high popularity and wide availability of these methods. The candidates may have
knowledge regarding the theoretical and practical aspects of the methods which were used to
test them. There could also be a contextual effect associated with the tools, where positive
associations are activated by the experience, e.g. getting a job after a job interview. In addition,
their positive evaluation of these methods may offer an insight into the nature of the labour
market and may encourage candidates to take part in the recruitment and selection process.
These methods are also the most commonly used by recruiters during the selection process
(Chirkowska-Smolak & Grobelny, 2014). Well-known methods, such as interviews or
application forms, provide a sense of security for the candidates, and they guarantee
preparedness and eliminate stress.
The role of the specialist is to create a personnel selection process to attract as many
potential employees as possible and then to select those whose competences are best suited to
the vacant position. As a well-chosen method can widen the pool of people taking part in the
recruitment process, our present findings, and the dynamics of the labour market, emphasise
the need to consider the opinion of the candidates regarding recruitment. However, while
interviews and application forms have proven to be effective tools from the point of view of the

150 O. Zwardoń-Kuchciak, A. Lipińska-Grobelny
candidate, recruiters should also further refine their use to suit their own needs. Well-structured
interviews can achieve high efficiency, but the results depend on the content and form of the
interview. The best solution for the two groups may lie within the structure of the tool,
i.e. by choosing suitable questions for the interview and devising appropriate criteria for
assessing the response. Topgrading, by Brad Smart, details an ideally prepared job interview,
including behavioural, cognitive or situational questions with clearly defined assessment
criteria, irrespective of the subjectivity of the recruiter.
7. Summary, limitations and directions for future study
Due to the pace of change in the modern world, we now live and work in a global village.
One space for the exchange of experiences and competences is the labour market, which
extended its borders outside Poland in 2004 upon its accession to the European Union.
This event opened doors, not only for Polish specialists planning to work overseas, but also to
corporations who had hitherto only been successful in Poland. The Polish economic landscape
has undergone considerable changes in recent years, and these changes are particularly visible
in the sphere of employment. Unemployment fell from 11.4% at the end of 2014 to 5.8% at the
end of 2018. Many businesses, both Polish and foreign, which had not previously had problems
with recruitment, now face the challenge of providing full staffing. For this reason, the opinions
of both recruiters and job applicants on the effectiveness of personnel selection methods is of
great importance, as they can have an important impact on recruitment practice facilitating
successful employment (Woźniak, 2012, 2019).
According to the Directions 2017 report, the greatest investments on the Polish labour
market are represented by companies from France, Germany, Spain and the United Kingdom.
In addition, the latest Nielsen report, commissioned by CCI France Pologne (French-Polish
Chamber of Commerce), 75% of the French organisations surveyed regard Poland’s investment
attractiveness as positive or very positive and the competences of Polish employees as very
high. However, they also rate employee availability on the labour market as very low. Hence,
it is important that the recruitment and selection process is carried out efficiently to guarantee
access to qualified staff. In addition, Polish companies are also becoming more attractive to
foreign employees. According to the Ministry of Family, Labour and Social Policy, in 2017,
approximately 250,000 work permits were issued to foreign workers, almost 100% higher than
in 2016, and district labour offices registered approximately 1.8 million statements of intention
to employ foreign workers from businesses: almost 40% higher (Employment of foreigners in
Poland, 2018). In response to this growing interest in the Polish labour market, the personnel
selection process should be open to new environments. In addition, a greater familiarity with
preferred selection methods will allow potential foreign employees to be more prepared for
Personnel selection methods and the employee's labour market 151
interviews and to better understand the idiosyncrasies of the new market. Furthermore, the new
environment brings new challenges regarding “distance recruitment”, and with it, the use of
ICT tools, which are regarded as being not as fair as traditional methods (Woźniak, 2019).
From this perspective, employers facing a “talent shortage” would be advised to accommodate
the preferences of candidates, as the use of an inappropriate method can lead to withdrawal
from the entire selection process (Hausknecht, Day, & Thomas, 2004; Truxillo & Bauer, 2011).
Summarising, recruitment and selection are the key strategic domain in human resources
management. As was mentioned, research and practice in the field of HR need to take into
considerations macro issues (examining HR system more broadly), as well as micro issues
(examining individual differences and apperception). In that research, both perspectives were
included. What is well established is that candidates make inferences about companies based
on how they are treated in the selection process (Chapman et al., 2005). Therefore,
it is reasonable to further explore the opinions and needs of potential employees and how the
recruitment and selection process can be used to shape a desirable brand for the employer.
It is the people who choose to take part in the recruitment process who then apply for a position,
and our present findings may indicate which selection tools are preferred by desirable
employees. Another possible approach is the obtained knowledge that fits with the idea of
supporting business practice through science, increasing professionalisation in the field of
HRM. The authors are aware that the study has some limitations. Therefore, it is recommended
that further studies should be performed involving larger groups of recruiters with matching
groups of work positions, as this may offer a further insight into how the selection process
should best be formulated. Future research should also adapt a multilevel perspective to display
whether validities of selection methods at the individual level are associated with the
organisational level.
References
1. Armstrong, M. (2007). Zarządzanie Zasobami Ludzki [Human Resource Management].
Kraków: Oficyna & Wolters Kluwer Business.
2. Backhaus, K., and Tikoo, S. (2004). Conceptualizing and researching employer branding.
Career Development International, 9, 5, 501-517, doi: 10.1108/13620430410550754.
3. Barometer of employment prospects 2018. Retrieved from http://www.manpowergroup.pl/
wpcontent/uploads/2017/12/Barometr_Manpower_Perspektyw_Zatrudnienia_Q1_18_PL
_www.pdf, 10.10.2018.
4. Barometer of employment prospects 2019. Retrieved from https://www.manpowergroup.
com/wps/wcm/connect/ec952d82-f46e-4502-a513d376cacf6278/PO_PO_1Q19_Release.
pdf?, 2.01.2019.
152 O. Zwardoń-Kuchciak, A. Lipińska-Grobelny
5. Chapman, D.S., Uggerslev, K.L., Carroll, S.A., Piasentin, K.A., and Jones, D.A. (2005).
Applicant attraction to organizations and job choice: A meta-analytic review of correlates
of recruiting outcome. Journal of Applied Psychology, 90, 5, 928-944, doi: 10.1037/0021-
9010.90.5.928.
6. Chirkowska-Smolak, T., and Grobelny, J. (2014). Wykorzystanie metod doboru personelu
oraz przekonania profesjonalistów na temat ich trafności prognostycznej [Use of personnel
selection methods and the views of professionals regarding their predictive validity].
Zarządzanie Zasobami Ludzkimi [Human Resource Management], 96, 1, 125-141.
7. Cowling, A. (2000). Strategiczne zarządzanie zasobami ludzkimi [Strategic management
of human resources]. Kraków: Oficyna Ekonomiczna.
8. Dale, M. (2013). Skuteczna rekrutacja i selekcja pracowników [Effective recruitment and
selection of employees]. Kraków: Oficyna Ekonomiczna.
9. Directions 2017. Negative economic shocks. Stress-tests of the Polish economy in 2017,
Retrieved from https://www.slideshare.net/DeloittePolska/raport-kierunki-2017-
negatywne-szoki-gospodarcze-stresstesty-polskiej-gospodarki-w-2017-r, 28.11.2019.
10. Employment of foreigners in Poland. Retrieved from https://psz.praca.gov.pl/rynek-
pracy/statystyki-i-analizy/zatrudnianie-cudzoziemcow-w-polsce, 3011.2019.
11. Furnham, A. (2008). HR Professionals’ beliefs about, and knowledge of, assessment
techniques and psychometric tests. International Journal of Selection and Assessment,
16, 3, 300-305, doi: 10.1111/j.1468-2389.2008.00436.x.
12. Hausknecht, J.P., Day, D.V., and Thomas, S.C. (2004). Applicant reactions to selection
procedures: An updated model and meta-analysis. Personnel Psychology, 57, 639-683.
13. Hunter, J.E., and Hunter, R.F. (1984). Validity and utility of alternative predictors of job
performance. Psychological Bulletin, 96, 1, 72-98, doi: 10.1037/0033-2909.96.1.72.
14. Jarecki, W. (2012). Rekrutacja pracowników [Recruitment of employees]. Szczecin:
Economicus.
15. Kawka, T., and Listwan, T. (2004). Pozyskiwanie pracowników [Recruitment of
employees]. In: T. Listwan (ed.), Zarządzanie Zasobami Ludzkimi [Human Resources
Management] (pp. 76-101). Warszawa: C.H. Beck.
16. Lichtarski, J.M. (2007). Specyfika doboru pracowników do struktur zadaniowych w teorii
i praktyce [The specificity of selecting employees for task structures in theory and
practice]. Zarządzanie Zasobami Ludzkimi [Human Resource Management], 6, 25-40.
17. Lipińska-Grobelny, A. (2010). Rola testów psychologicznych w ocenie przydatności
zawodowej kandydatów do pracy [The role of psychological tests in assessing the
professional suitability of candidates for work]. In: Z. Goral (ed.), Kontrola pracownika.
Możliwości techniczne i dylematy prawne [Employee control. Technical possibilities and
legal dilemmas] (pp. 467-480). Warszawa: Wydawnictwo Wolters Kluwer.
Personnel selection methods and the employee's labour market 153
18. Marek, J. (2008). Pozyskiwanie i dobór personelu: kształtowanie zatrudnienia
w organizacji [Acquisition and selection of staff: shaping employment in the organization].
Warszawa: Difin.
19. Nielsen Report. 25 years of Polish-French partnership. French investments in Poland
(2019). Retrieved from https://assets.kpmg/content/dam/kpmg/pl/pdf/pl-raport-kpmg-i-
ccifp-25-lat-polsko-francuskiego-partnerstwa-pl.pdf , 2911.2019.
20. Osgood, C.E., Suci, D.J., and Tannenbaum P.H. (1957). The measurement of meaning.
Urbana: University of Illinois Press.
21. Sajkiewicz, A. (1999). Zasoby ludzkie w firmie [Human resources in the company].
Warszawa: Poltext.
22. Suchar, M. (2008). Rekrutacja i selekcja personelu [Recruitment and personnel selection].
Warszawa: C.H. Beck.
23. Truxillo, D. M., and Bauer, T. N. (2011). Applicant reactions to organizations and selection
systems. In: S. Zedeck (ed.), APA handbooks in psychology. APA handbook of industrial
and organizational psychology, 2. Selecting and developing members for the organization
(pp. 379-397). Thousand Oaks, CA, Sage: American Psychological Association.
24. Witkowski, T. (2007). Nowoczesne metody doboru i oceny personelu [Modern methods of
personnel selection and evaluation]. Kraków: Wydawnictwo Profesjonalnej Szkoły
Biznesu.
25. Wood, R, Payne, T. (2006). Metody rekrutacji i selekcji pracowników oparte na
kompetencjach [Methods of recruitment and selection of employees based on
competences]. Kraków: Oficyna Ekonomiczna.
26. Woźniak, J. (2012). Współczesne systemy motywacyjne [Modern incentive systems].
Warszawa: PWN.
27. Woźniak, J. (2019). Akceptacja różnych form narzędzi selekcyjnych – przegląd literatury
i wstępne wyniki badania [Fairness assessment of different forms of traditional and ICT-
based selection tools: review of literature and first results of empirical study]. Zarządzanie
Zasobami Ludzkimi [Human Resource Management], 5, 11-37.
Kwartalnik Naukowy „Organizacja i Zarządzanie” (Organization & Management Scientific
Quarterly) wydawany przez Wydział Organizacji i Zarządzania Politechniki Śląskiej został
objęty programem Ministerstwa Nauki i Szkolnictwa Wyższego „Wsparcie dla czasopism
naukowych” w latach 2019-2020, otrzymując dofinansowanie na:
1. Wdrożenie procedur zabezpieczających oryginalność publikacji naukowych (pozyskanie
numerów DOI (Digital Object Identifier)).
2. Korektę tłumaczenia artykułów na język angielski.
3. Zakup oprogramowania do zarządzania pracami edytorskimi.
4. Stworzenie anglojęzycznych wersji wydawanych publikacji.
Wydano za zgodą
Rektora Politechniki Śląskiej
WYDAWNICTWO POLITECHNIKI ŚLĄSKIEJ
ul. Akademicka 5, 44-100 Gliwice
tel. (32) 237-13-81, faks (32) 237-15-02
www.wydawnictwopolitechniki.pl
Sprzedaż i Marketing
tel. (32) 237-18-48 [email protected]
Nakł. 50 + 44 Ark. wyd. 13 Ark. druk. 10 Papier offset 70x100, 80g
zam.


![Agata Stachowicz-Stanusch Destrukcyjne strony ...cejsh.icm.edu.pl/cejsh/element/bwmeta1.element.0d... · na charyzmie [Fanelli, Misangyi, 2006] jako „relacji pomiędzy osobą (liderem)](https://img.pdfslide.tips/doc/110x75/5fd16f9cd68e1411b74a1d85/agata-stachowicz-stanusch-destrukcyjne-strony-cejshicmeduplcejshelement.jpg)