Embed Size (px)
Citation preview
1
[N.2.1.4]
R&D on Energy Conservation Operation Support System
for Decompressed Residual Oil Combustion Boiler
(Decompressed residual oil combustion group)
� Yutaka Sakai, Shuichiro Natake, Tadafumi Yoshimura, Takao Adachi,
Seiji Takahashi, Kenji Saito, Tatsue Miyagawa, Eikichi Takahashi
1. R&D Objectives
According to a survey conducted by the Petroleum Energy Center, the availability of generated
electric power, using decompressed residual oil as fuel, is about 20,000 MW maximum, on the
assumption that the domestic topper capacity is 5.3 million BPSD. There are two combustion
formats for decompressed residual oil: 1) the IGCC format whereby gas obtained through
gasification (partial oxidation) is burnt, and 2) the BTG format, whereby fuel is burnt directly by
burner. In general, the BTG format is used for heavy oil, but with decompressed residual oil,
because the amount of residual carbon in the fuel is so large, the concentration of oxygen in the
emissions is believed to be of higher value than during normal combustion of C heavy oil. On
the other hand, because of requirements for reduction of CO2 discharged from boilers for
electric power generation, demands call for the establishment of a combustion control method in
which the concentration of oxygen in emissions from the burning of decompressed residual oil
by burner is reduced.
In the present R&D, the objective is to conserve energy, reduce waste and secure continuous
long-term operation through operational control of boilers for power generation, using
decompressed residual oil as fuel. Another aim is to develop an operational support system
whereby the concentration of oxygen in emissions is reduced from the present level of 2.0% to
0.5%.
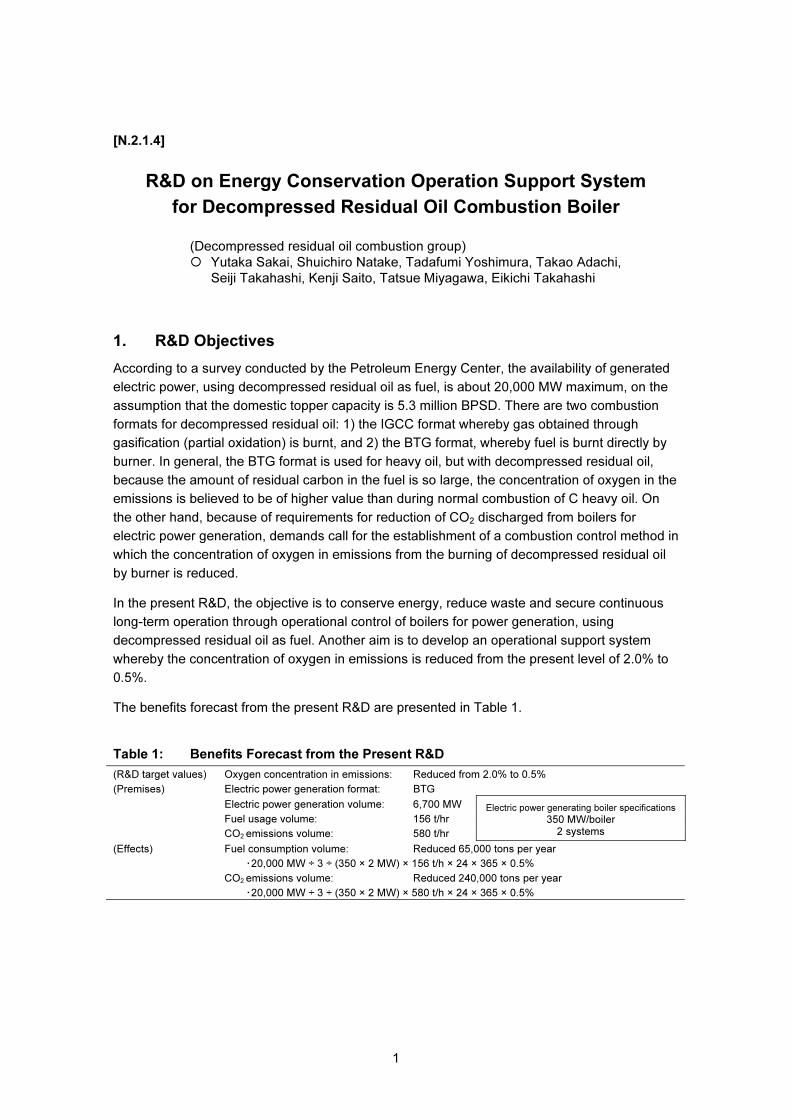
The benefits forecast from the present R&D are presented in Table 1.
Table 1: Benefits Forecast from the Present R&D
(R&D target values) Oxygen concentration in emissions: Reduced from 2.0% to 0.5%
(Premises) Electric power generation format: BTG
Electric power generation volume: 6,700 MW
Fuel usage volume: 156 t/hr
CO2 emissions volume: 580 t/hr
Electric power generating boiler specifications
350 MW/boiler 2 systems
(Effects) Fuel consumption volume: Reduced 65,000 tons per year
・20,000 MW ÷ 3 ÷ (350 × 2 MW) × 156 t/h × 24 × 365 × 0.5%
CO2 emissions volume: Reduced 240,000 tons per year
・20,000 MW ÷ 3 ÷ (350 × 2 MW) × 580 t/h × 24 × 365 × 0.5%
2
2. R&D Contents
2.1 Creation of Emissions Forecast Formula with Combustion Test Furnace
In attempting to lower the concentration of oxygen in emissions, it is the emissions properties
that are affected the most. Given this fact, an investigation was made of methods for forecasting,
by means of a test furnace, the relationship between oxygen concentration in emissions and
emissions (NOx, dust) concentrations.
(1) Test furnace
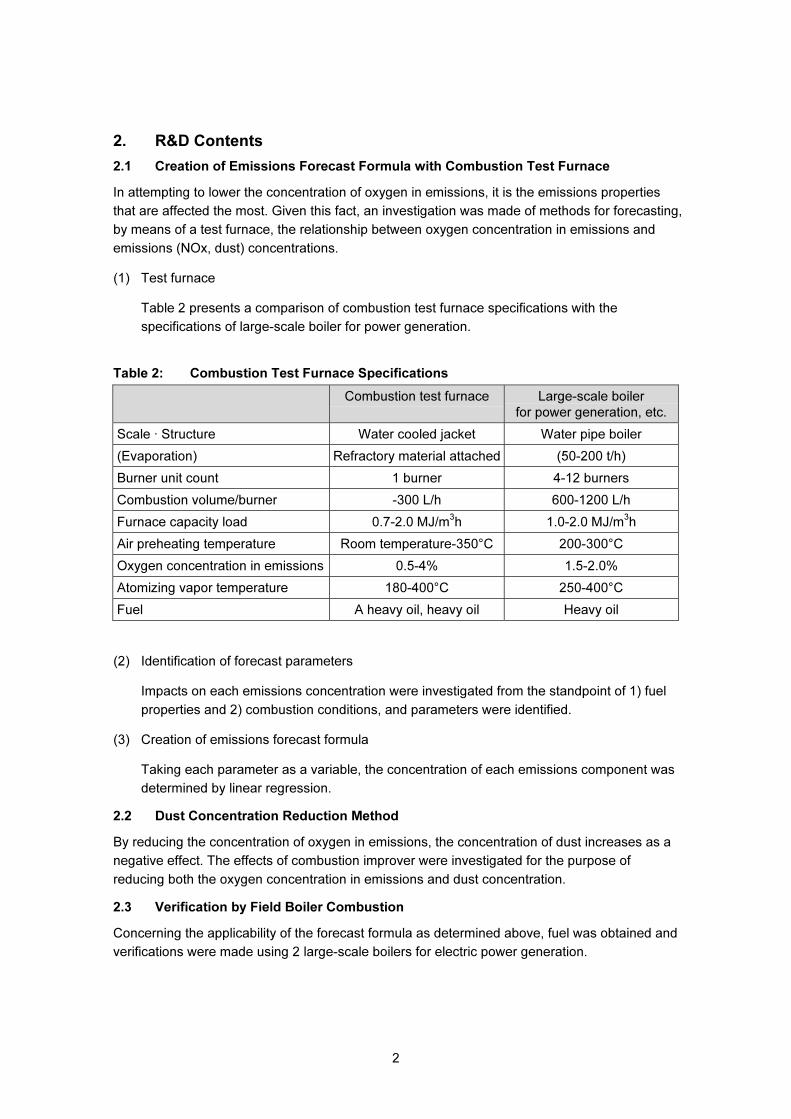
Table 2 presents a comparison of combustion test furnace specifications with the
specifications of large-scale boiler for power generation.
Table 2: Combustion Test Furnace Specifications
Combustion test furnace Large-scale boiler
for power generation, etc.
Scale · Structure Water cooled jacket Water pipe boiler
(Evaporation) Refractory material attached (50-200 t/h)
Burner unit count 1 burner 4-12 burners
Combustion volume/burner -300 L/h 600-1200 L/h
Furnace capacity load 0.7-2.0 MJ/m3h 1.0-2.0 MJ/m
3h
Air preheating temperature Room temperature-350°C 200-300°C
Oxygen concentration in emissions 0.5-4% 1.5-2.0%
Atomizing vapor temperature 180-400°C 250-400°C
Fuel A heavy oil, heavy oil Heavy oil
(2) Identification of forecast parameters
Impacts on each emissions concentration were investigated from the standpoint of 1) fuel
properties and 2) combustion conditions, and parameters were identified.
(3) Creation of emissions forecast formula
Taking each parameter as a variable, the concentration of each emissions component was
determined by linear regression.
2.2 Dust Concentration Reduction Method
By reducing the concentration of oxygen in emissions, the concentration of dust increases as a
negative effect. The effects of combustion improver were investigated for the purpose of
reducing both the oxygen concentration in emissions and dust concentration.
2.3 Verification by Field Boiler Combustion
Concerning the applicability of the forecast formula as determined above, fuel was obtained and
verifications were made using 2 large-scale boilers for electric power generation.
3
2.4 Development of Operation Support System
Corrections were made in the forecast formula based on the results of field boiler combustion
tests. A support system for operation by linear programming was developed by means of the
interval method and the direct search method.
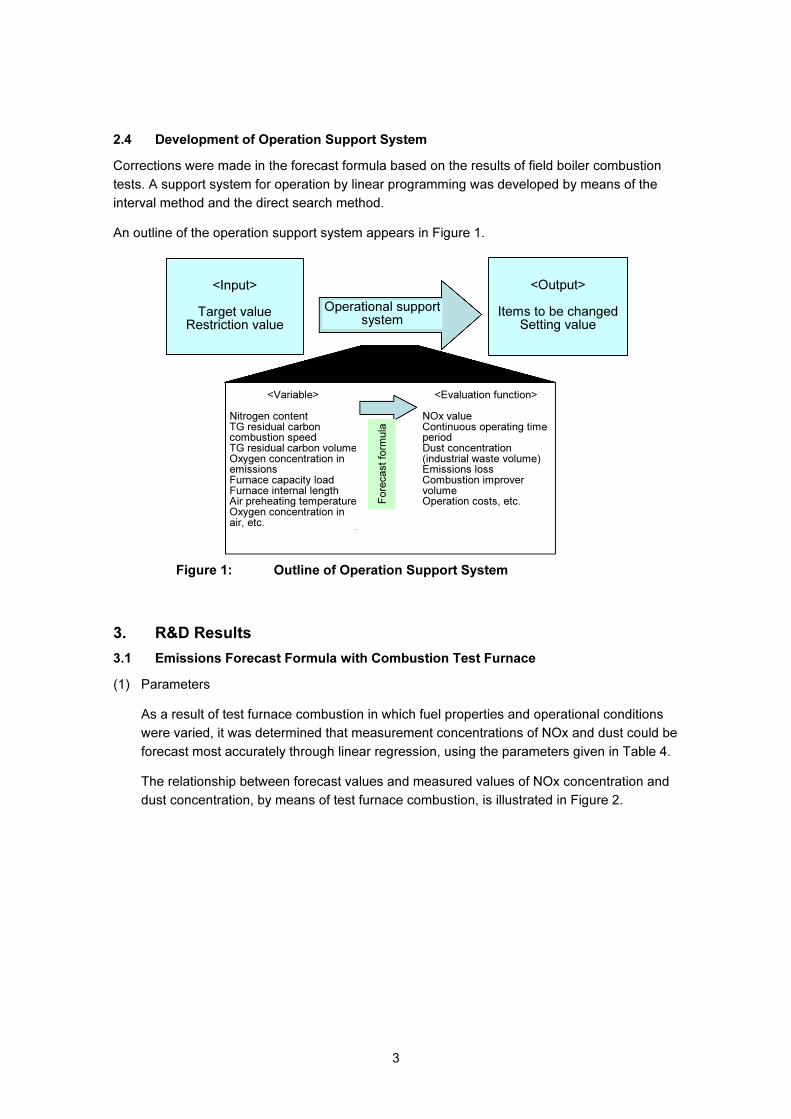
An outline of the operation support system appears in Figure 1.
<Input>
Target value Restriction value
<Output>
Items to be changed Setting value
Operational support system
<Variable>
Nitrogen content TG residual carbon combustion speed TG residual carbon volumeOxygen concentration in emissions Furnace capacity load Furnace internal length Air preheating temperatureOxygen concentration in air, etc.
<Evaluation function>
NOx value Continuous operating time period Dust concentration (industrial waste volume)Emissions loss Combustion improver volume Operation costs, etc. F
ore
ca
st
form
ula
Figure 1: Outline of Operation Support System
3. R&D Results
3.1 Emissions Forecast Formula with Combustion Test Furnace
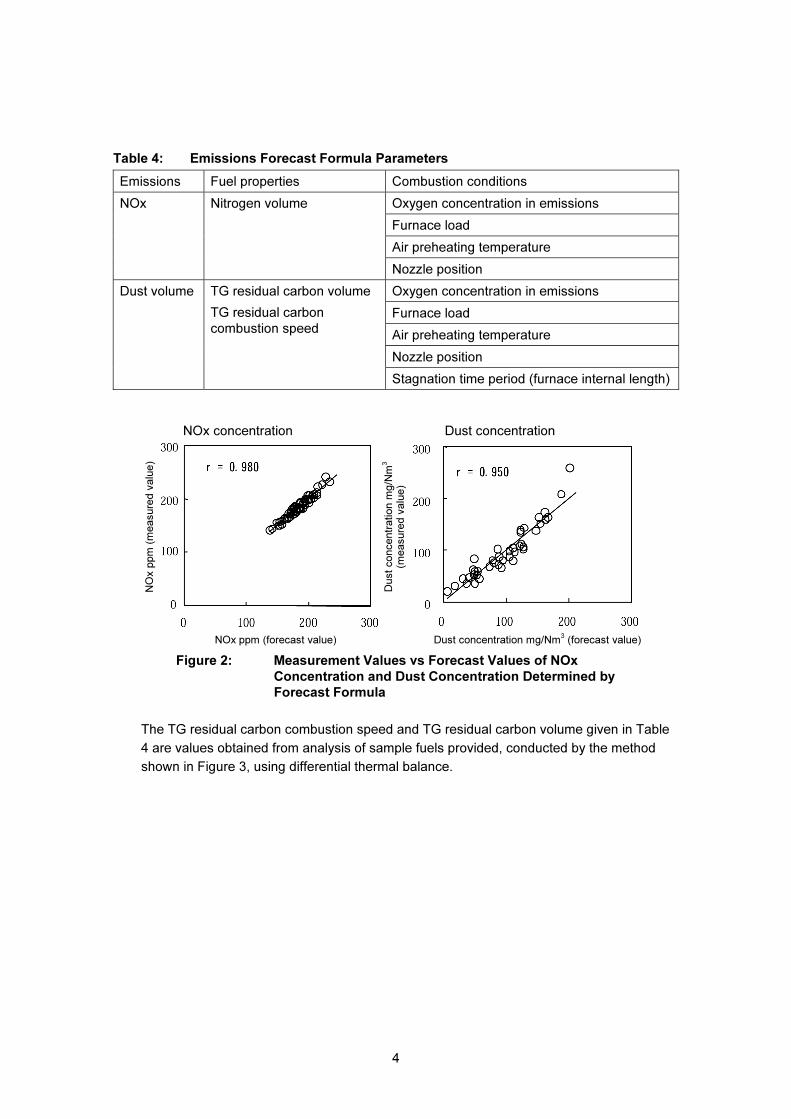
(1) Parameters
As a result of test furnace combustion in which fuel properties and operational conditions
were varied, it was determined that measurement concentrations of NOx and dust could be
forecast most accurately through linear regression, using the parameters given in Table 4.
The relationship between forecast values and measured values of NOx concentration and
dust concentration, by means of test furnace combustion, is illustrated in Figure 2.
4
Table 4: Emissions Forecast Formula Parameters
Emissions Fuel properties Combustion conditions
Oxygen concentration in emissions
Furnace load
Air preheating temperature
NOx Nitrogen volume
Nozzle position
Oxygen concentration in emissions
Furnace load
Air preheating temperature
Nozzle position
Dust volume TG residual carbon volume
TG residual carbon
combustion speed
Stagnation time period (furnace internal length)
NO
x p
pm
(m
ea
su
red
va
lue
)
NOx ppm (forecast value)
NOx concentration
Du
st
co
nce
ntr
atio
n m
g/N
m3
(me
asu
red
va
lue
)
Dust concentration mg/Nm3 (forecast value)
Dust concentration
Figure 2: Measurement Values vs Forecast Values of NOx
Concentration and Dust Concentration Determined by
Forecast Formula
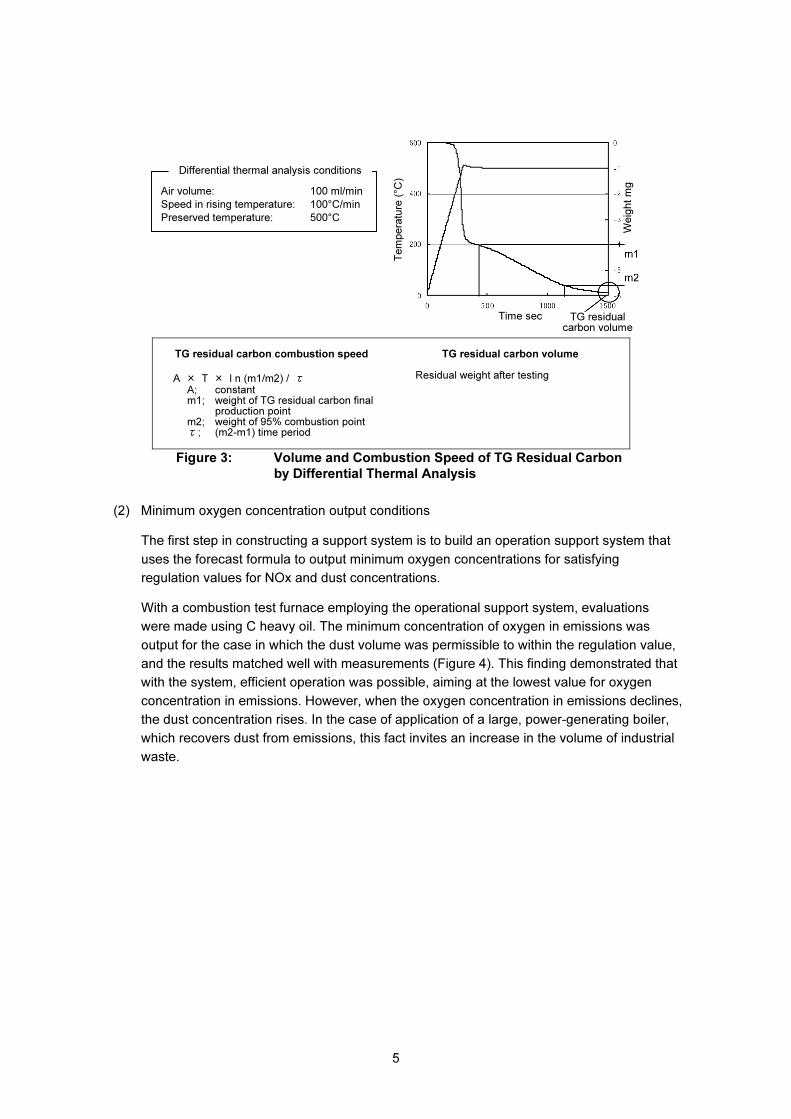
The TG residual carbon combustion speed and TG residual carbon volume given in Table
4 are values obtained from analysis of sample fuels provided, conducted by the method
shown in Figure 3, using differential thermal balance.
5
Te
mp
era
ture
(°C
)
Time sec
Air volume: 100 ml/min
Speed in rising temperature: 100°C/min
Preserved temperature: 500°C
Differential thermal analysis conditions
TG residual carbon volume
We
igh
t m
g
TG residual carbon combustion speed
A × T × l n (m1/m2) / τ A; constant m1; weight of TG residual carbon final
production point m2; weight of 95% combustion point τ; (m2-m1) time period
TG residual carbon volume
Residual weight after testing
Figure 3: Volume and Combustion Speed of TG Residual Carbon
by Differential Thermal Analysis
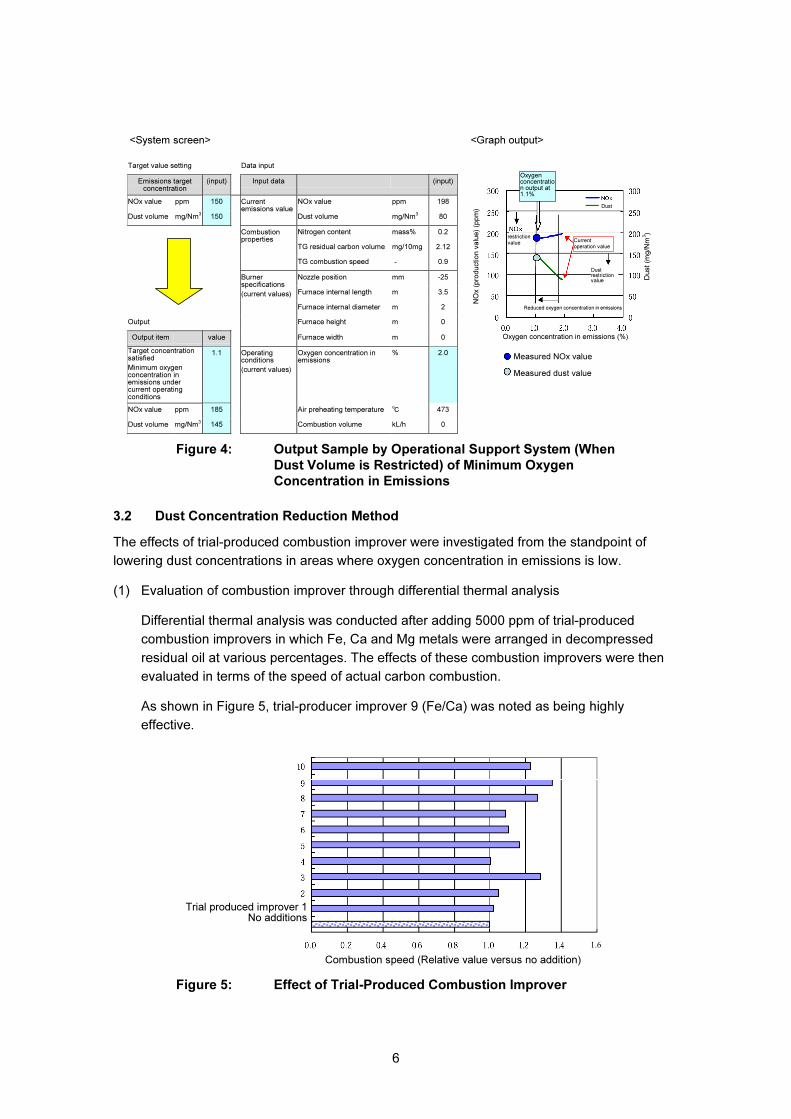
(2) Minimum oxygen concentration output conditions
The first step in constructing a support system is to build an operation support system that
uses the forecast formula to output minimum oxygen concentrations for satisfying
regulation values for NOx and dust concentrations.
With a combustion test furnace employing the operational support system, evaluations
were made using C heavy oil. The minimum concentration of oxygen in emissions was
output for the case in which the dust volume was permissible to within the regulation value,
and the results matched well with measurements (Figure 4). This finding demonstrated that
with the system, efficient operation was possible, aiming at the lowest value for oxygen
concentration in emissions. However, when the oxygen concentration in emissions declines,
the dust concentration rises. In the case of application of a large, power-generating boiler,
which recovers dust from emissions, this fact invites an increase in the volume of industrial
waste.
6
Target value setting Data input
Emissions target concentration
(input) Input data (input)
NOx value ppm 150 NOx value ppm 198
Dust volume mg/Nm3 150
Current emissions value
Dust volume mg/Nm3 80
Nitrogen content mass% 0.2
TG residual carbon volume mg/10mg 2.12
Combustion properties
TG combustion speed ‐ 0.9
Nozzle position mm -25
Furnace internal length m 3.5
Furnace internal diameter m 2
Output Furnace height m 0
Output item value
Burner specifications
(current values)
Furnace width m 0
Target concentration satisfied
Minimum oxygen concentration in emissions under current operating conditions
1.1 Oxygen concentration in emissions
% 2.0
NOx value ppm 185 Air preheating temperature ℃ 473
Dust volume mg/Nm3 145
Operating conditions
(current values)
Combustion volume kL/h 0
NO
x (
pro
du
ctio
n v
alu
e)
(pp
m)
<System screen> <Graph output>
Oxygen concentration in emissions (%)
Oxygen concentration output at 1.1%
restriction value
Dust
Current operation value
Dust restriction value
Reduced oxygen concentration in emissions
Du
st (m
g/N
m3)
Measured NOx value
Measured dust value
Figure 4: Output Sample by Operational Support System (When
Dust Volume is Restricted) of Minimum Oxygen
Concentration in Emissions
3.2 Dust Concentration Reduction Method
The effects of trial-produced combustion improver were investigated from the standpoint of
lowering dust concentrations in areas where oxygen concentration in emissions is low.
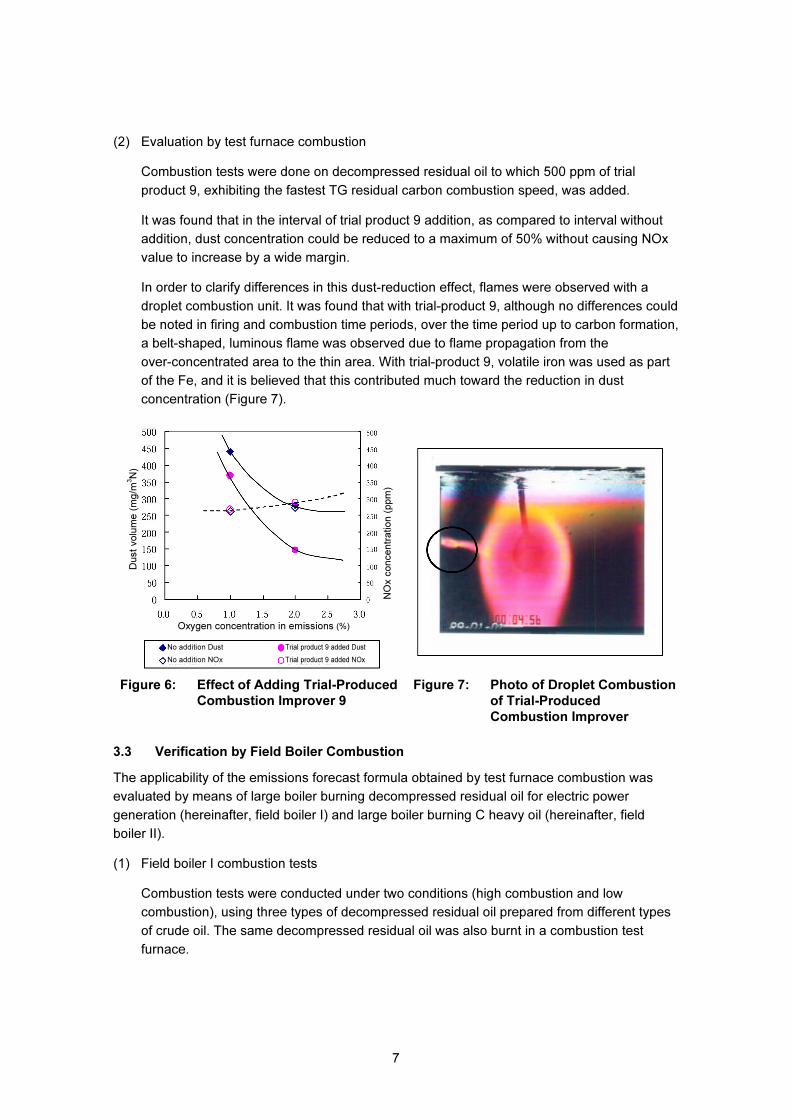
(1) Evaluation of combustion improver through differential thermal analysis
Differential thermal analysis was conducted after adding 5000 ppm of trial-produced
combustion improvers in which Fe, Ca and Mg metals were arranged in decompressed
residual oil at various percentages. The effects of these combustion improvers were then
evaluated in terms of the speed of actual carbon combustion.
As shown in Figure 5, trial-producer improver 9 (Fe/Ca) was noted as being highly
effective.
Trial produced improver 1No additions
Combustion speed (Relative value versus no addition)
1.6
Figure 5: Effect of Trial-Produced Combustion Improver
7
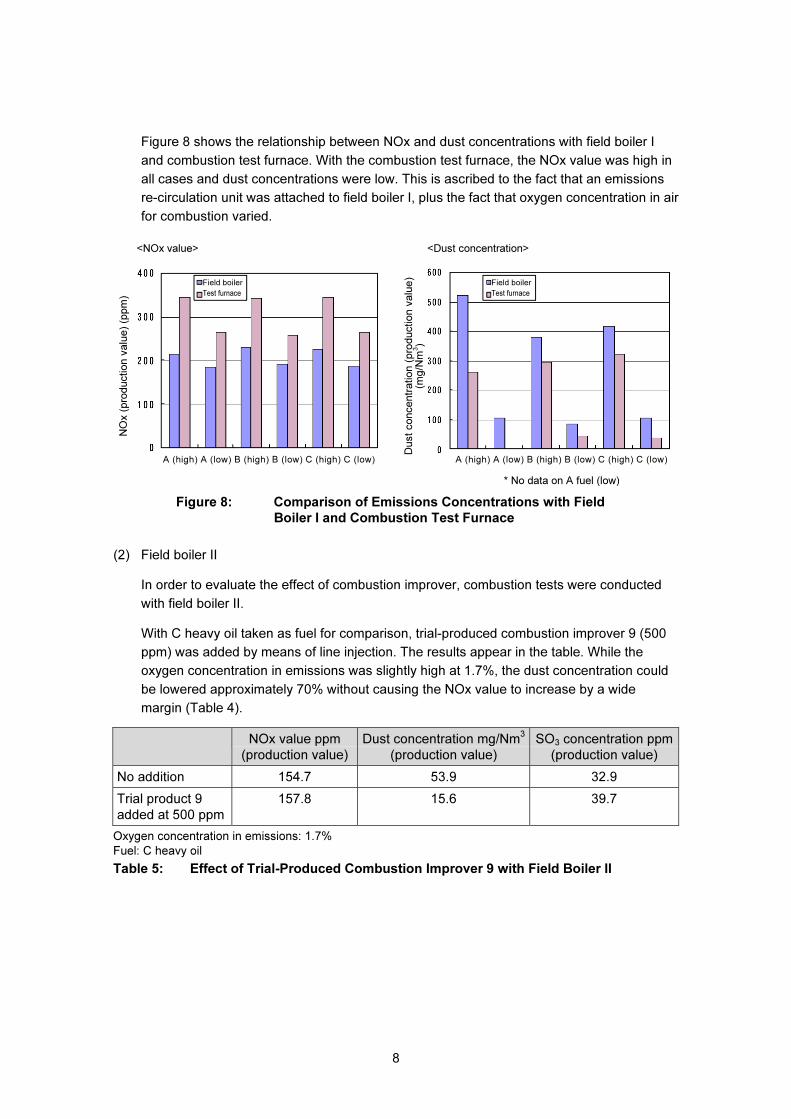
(2) Evaluation by test furnace combustion
Combustion tests were done on decompressed residual oil to which 500 ppm of trial
product 9, exhibiting the fastest TG residual carbon combustion speed, was added.
It was found that in the interval of trial product 9 addition, as compared to interval without
addition, dust concentration could be reduced to a maximum of 50% without causing NOx
value to increase by a wide margin.
In order to clarify differences in this dust-reduction effect, flames were observed with a
droplet combustion unit. It was found that with trial-product 9, although no differences could
be noted in firing and combustion time periods, over the time period up to carbon formation,
a belt-shaped, luminous flame was observed due to flame propagation from the
over-concentrated area to the thin area. With trial-product 9, volatile iron was used as part
of the Fe, and it is believed that this contributed much toward the reduction in dust
concentration (Figure 7).
Oxygen concentration in emissions (%)
Dust
volu
me (
mg/m
3N
)
NO
x c
on
cen
tra
tio
n (
pp
m)
No addition Dust
No addition NOx
Trial product 9 added Dust
Trial product 9 added NOx
Figure 6: Effect of Adding Trial-Produced
Combustion Improver 9
Figure 7: Photo of Droplet Combustion
of Trial-Produced
Combustion Improver
3.3 Verification by Field Boiler Combustion
The applicability of the emissions forecast formula obtained by test furnace combustion was
evaluated by means of large boiler burning decompressed residual oil for electric power
generation (hereinafter, field boiler I) and large boiler burning C heavy oil (hereinafter, field
boiler II).
(1) Field boiler I combustion tests
Combustion tests were conducted under two conditions (high combustion and low
combustion), using three types of decompressed residual oil prepared from different types
of crude oil. The same decompressed residual oil was also burnt in a combustion test
furnace.
8
Figure 8 shows the relationship between NOx and dust concentrations with field boiler I
and combustion test furnace. With the combustion test furnace, the NOx value was high in
all cases and dust concentrations were low. This is ascribed to the fact that an emissions
re-circulation unit was attached to field boiler I, plus the fact that oxygen concentration in air
for combustion varied.
A (high) A (low) B (high) B (low) C (high) C (low)
NO
x (
pro
du
ctio
n v
alu
e)
(pp
m)
<NOx value> <Dust concentration>
Field boiler
Test furnace
Field boiler
Test furnace
A (high) A (low) B (high) B (low) C (high) C (low)
* No data on A fuel (low)
Du
st
co
nce
ntr
atio
n (
pro
du
ctio
n v
alu
e)
(mg
/Nm
3)
Figure 8: Comparison of Emissions Concentrations with Field
Boiler I and Combustion Test Furnace
(2) Field boiler II
In order to evaluate the effect of combustion improver, combustion tests were conducted
with field boiler II.
With C heavy oil taken as fuel for comparison, trial-produced combustion improver 9 (500
ppm) was added by means of line injection. The results appear in the table. While the
oxygen concentration in emissions was slightly high at 1.7%, the dust concentration could
be lowered approximately 70% without causing the NOx value to increase by a wide
margin (Table 4).
NOx value ppm
(production value)
Dust concentration mg/Nm3
(production value)
SO3 concentration ppm
(production value)
No addition 154.7 53.9 32.9
Trial product 9
added at 500 ppm
157.8 15.6 39.7
Oxygen concentration in emissions: 1.7%
Fuel: C heavy oil
Table 5: Effect of Trial-Produced Combustion Improver 9 with Field Boiler II
9
3.4 Development of Operational Support System
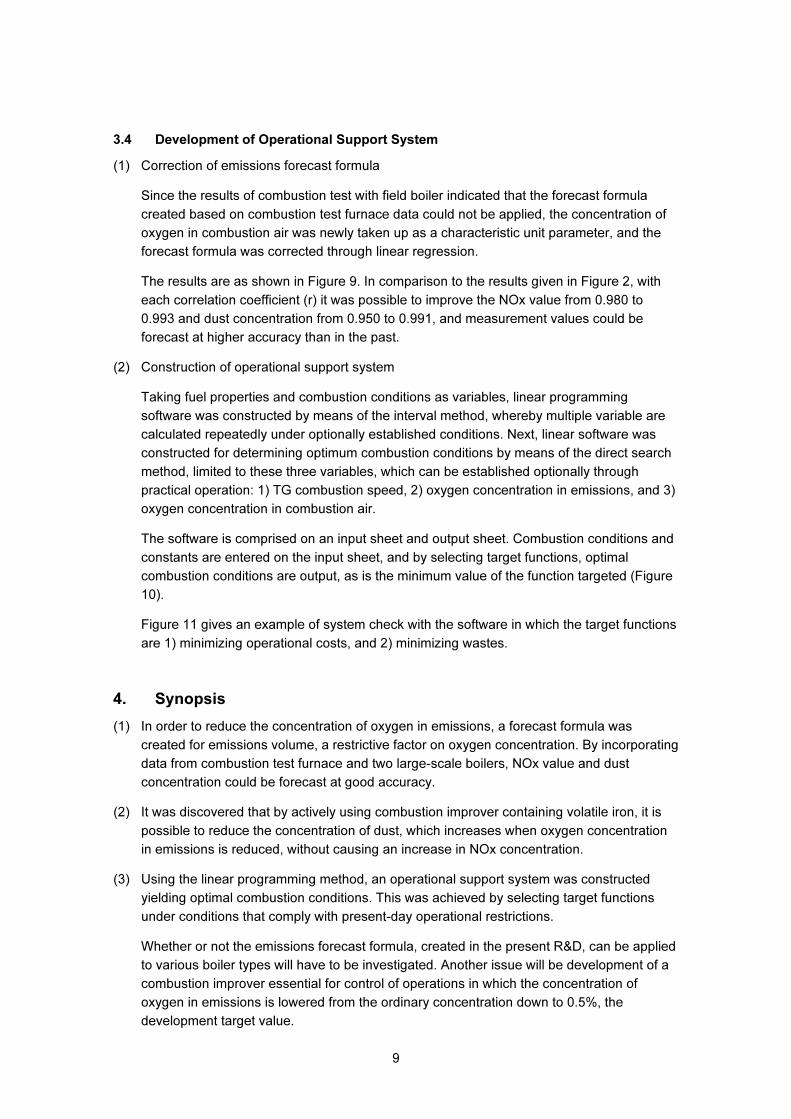
(1) Correction of emissions forecast formula
Since the results of combustion test with field boiler indicated that the forecast formula
created based on combustion test furnace data could not be applied, the concentration of
oxygen in combustion air was newly taken up as a characteristic unit parameter, and the
forecast formula was corrected through linear regression.
The results are as shown in Figure 9. In comparison to the results given in Figure 2, with
each correlation coefficient (r) it was possible to improve the NOx value from 0.980 to
0.993 and dust concentration from 0.950 to 0.991, and measurement values could be
forecast at higher accuracy than in the past.
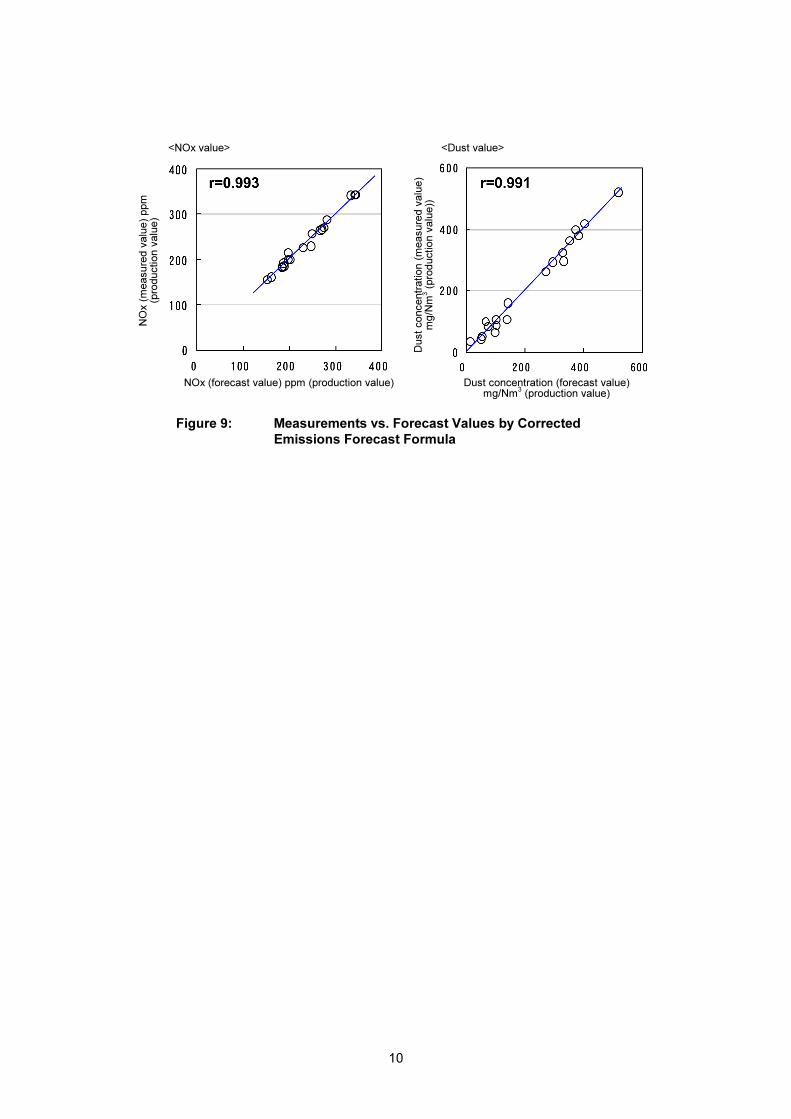
(2) Construction of operational support system
Taking fuel properties and combustion conditions as variables, linear programming
software was constructed by means of the interval method, whereby multiple variable are
calculated repeatedly under optionally established conditions. Next, linear software was
constructed for determining optimum combustion conditions by means of the direct search
method, limited to these three variables, which can be established optionally through
practical operation: 1) TG combustion speed, 2) oxygen concentration in emissions, and 3)
oxygen concentration in combustion air.
The software is comprised on an input sheet and output sheet. Combustion conditions and
constants are entered on the input sheet, and by selecting target functions, optimal
combustion conditions are output, as is the minimum value of the function targeted (Figure
10).
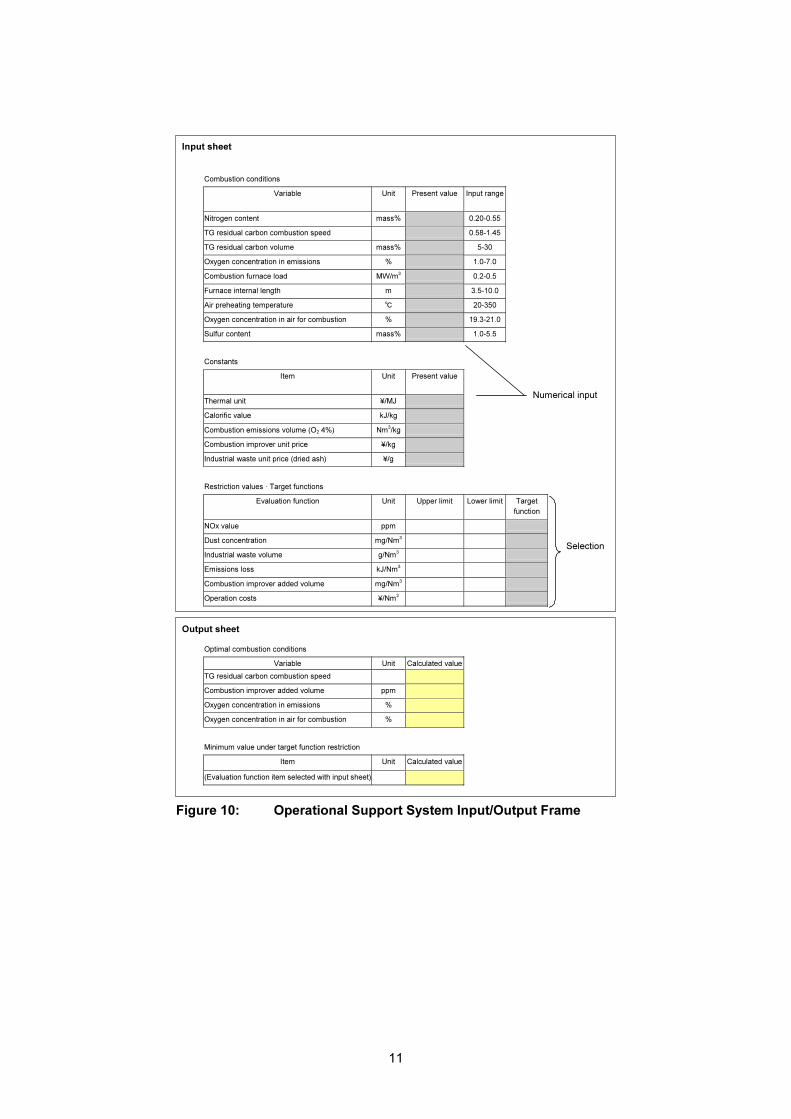
Figure 11 gives an example of system check with the software in which the target functions
are 1) minimizing operational costs, and 2) minimizing wastes.
4. Synopsis
(1) In order to reduce the concentration of oxygen in emissions, a forecast formula was
created for emissions volume, a restrictive factor on oxygen concentration. By incorporating
data from combustion test furnace and two large-scale boilers, NOx value and dust
concentration could be forecast at good accuracy.
(2) It was discovered that by actively using combustion improver containing volatile iron, it is
possible to reduce the concentration of dust, which increases when oxygen concentration
in emissions is reduced, without causing an increase in NOx concentration.
(3) Using the linear programming method, an operational support system was constructed
yielding optimal combustion conditions. This was achieved by selecting target functions
under conditions that comply with present-day operational restrictions.
Whether or not the emissions forecast formula, created in the present R&D, can be applied
to various boiler types will have to be investigated. Another issue will be development of a
combustion improver essential for control of operations in which the concentration of
oxygen in emissions is lowered from the ordinary concentration down to 0.5%, the
development target value.
10
NO
x (
me
asu
red
va
lue
) p
pm
(p
rod
uctio
n v
alu
e)
<NOx value>
Du
st
co
nce
ntr
atio
n (
me
asu
red
va
lue
) m
g/N
m3 (
pro
du
ctio
n v
alu
e))
NOx (forecast value) ppm (production value) Dust concentration (forecast value) mg/Nm
3 (production value)
<Dust value>
Figure 9: Measurements vs. Forecast Values by Corrected
Emissions Forecast Formula
11
Combustion conditions
Variable Unit Present value Input range
Nitrogen content mass% 0.20-0.55
TG residual carbon combustion speed 0.58-1.45
TG residual carbon volume mass% 5-30
Oxygen concentration in emissions % 1.0-7.0
Combustion furnace load MW/m3
0.2-0.5
Furnace internal length m 3.5-10.0
Air preheating temperature ℃ 20-350
Oxygen concentration in air for combustion % 19.3-21.0
Sulfur content mass% 1.0-5.5
Constants
Item Unit Present value
Thermal unit ¥/MJ
Calorific value kJ/kg
Combustion emissions volume (O2 4%) Nm3/kg
Combustion improver unit price ¥/kg
Industrial waste unit price (dried ash) ¥/g
Restriction values · Target functions
Evaluation function Unit Upper limit Lower limit Target
function
NOx value ppm
Dust concentration mg/Nm3
Industrial waste volume g/Nm3
Emissions loss kJ/Nm3
Combustion improver added volume mg/Nm3
Operation costs ¥/Nm3
Optimal combustion conditions
Variable Unit Calculated value
TG residual carbon combustion speed
Combustion improver added volume ppm
Oxygen concentration in emissions %
Oxygen concentration in air for combustion %
Minimum value under target function restriction
Item Unit Calculated value
(Evaluation function item selected with input sheet)
Input sheet
Output sheet
Numerical input
Selection
Figure 10: Operational Support System Input/Output Frame
12
Input 2 Output Restriction values · Target functions Optimal combustion conditions
Evaluation function Unit Upper limit Lower limit Target function
Variable Unit Calculated value
NOx value ppm 300 0 TG residual carbon combustion speed 0.7
Dust concentration mg/Nm3
500 0 Combustion improver added volume ppm 496
Industrial waste volume g/Nm3
1 0 Oxygen concentration in emissions % 1.9
Emissions loss kJ/Nm3
300 0 Oxygen concentration in air for combustion % 20.8
Combustion improver added volume mg/Nm3
1000 0
Operation costs ¥/Nm3
0.05 0 ○ Minimum value under target function restriction
Item
Unit Calculated value
Operation costs ¥/Nm3 0.0331
Input 2 Output
Restriction values · Target functions Optimal combustion conditions
Evaluation function Unit Upper limit Lower limit Target function
Variable Unit Calculated value
NOx value ppm 300 0 TG residual carbon combustion speed 0.7
Dust concentration mg/Nm3
500 0 Combustion improver added volume ppm 496
Industrial waste volume g/Nm3
1 0 ○ Oxygen concentration in emissions % 1.5
Emissions loss kJ/Nm3
300 0 Oxygen concentration in air for combustion % 20.8
Combustion improver added volume mg/Nm3
1000 0
Operation costs ¥/Nm3
0.05 0 Minimum value under target function restriction
Item Unit
Calculated value
Industrial waste volume 0.4764
Input 1 Combustion conditions
Variable Unit Present value Input range
Nitrogen content mass% 0.55 0.20~0.55
TG residual carbon combustion speed 0.58 0.58~1.48
TG residual carbon volume mass% 24 5~30
Oxygen concentration in emissions % 2 1.0~7.0
Combustion furnace load MW/m3
0.252 0.2~0.5
Furnace internal length m 9.8 3.5~10.0
Air preheating temperature ℃ 300 20~350
Oxygen concentration in air for combustion % 20 19.3~21.0
Sulfur content mass% 4.5 1.0~5.5
Constants
Variable Unit Present value
Thermal unit ¥/MJ 0.49
Calorific value kJ/kg 41100
Combustion emissions volume (O2 4%) Nm3/kg 12.94
Combustion improver unit price ¥/kg 100
Industrial waste unit price (dried ash) ¥/g 0.05
Target function · Operation costs
Target function · Industrial waste volume
Figure 11: System Check of Operational Support System
Copyright 2002 Petroleum Energy Center. All rights reserved.