Embed Size (px)
Citation preview
Bihar’s Finances Receipts & Expenditure Fiscal situation Public Debt Policy Initiatives Development Efforts
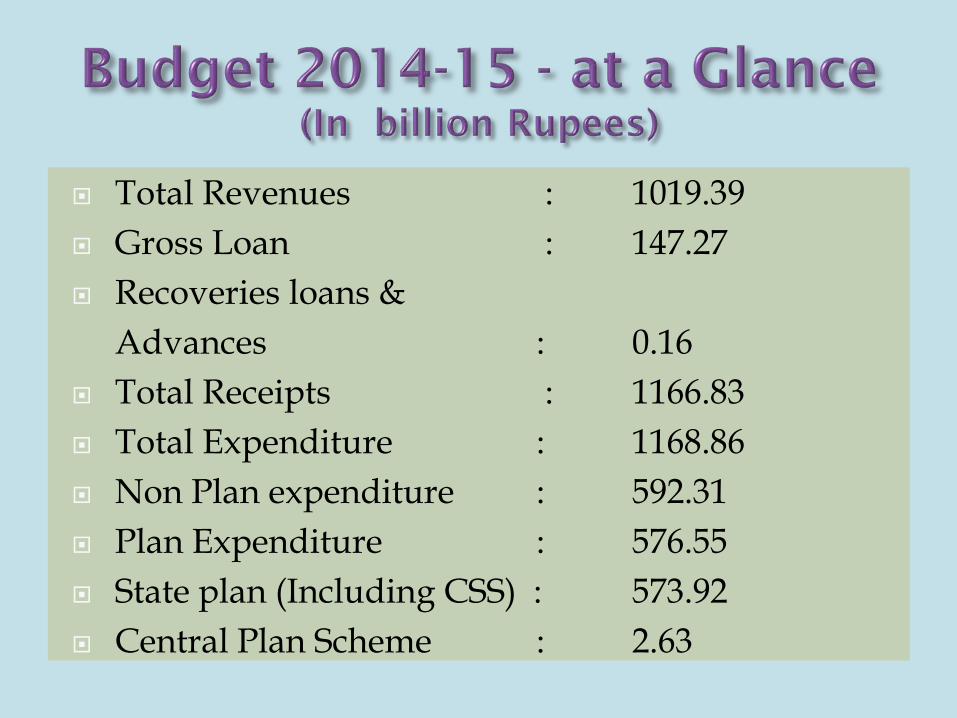
Total Revenues : 1019.39 Gross Loan : 147.27 Recoveries loans & Advances : 0.16 Total Receipts : 1166.83 Total Expenditure : 1168.86 Non Plan expenditure : 592.31 Plan Expenditure : 576.55 State plan (Including CSS) : 573.92 Central Plan Scheme : 2.63
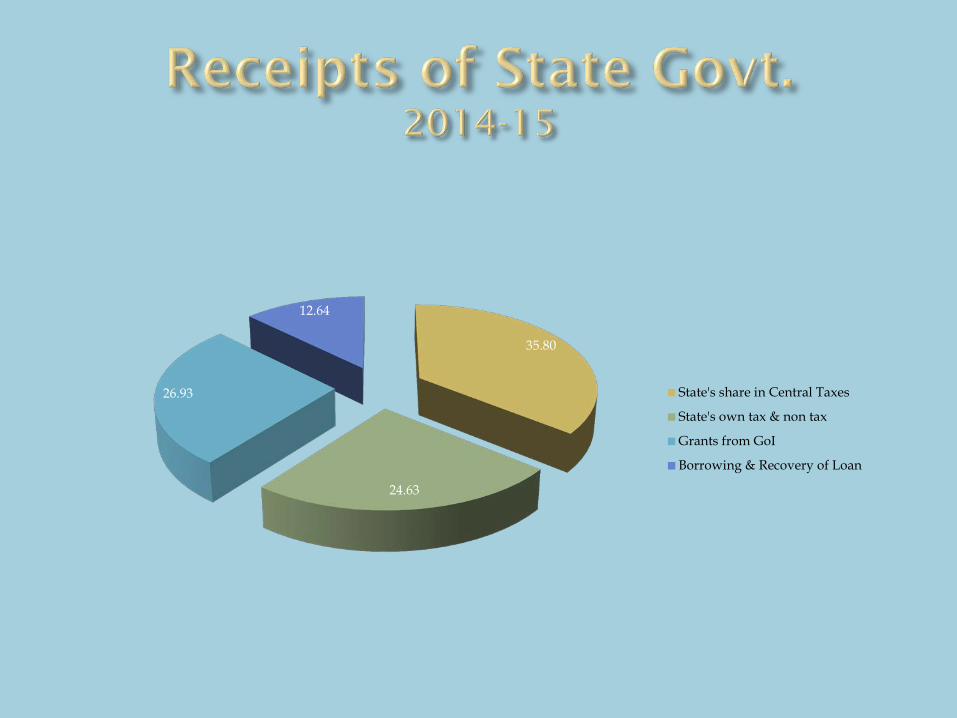
35.80
24.63
26.93
12.64
State's share in Central Taxes
State's own tax & non tax
Grants from GoI
Borrowing & Recovery of Loan

Expenditure of State Govt. 2014-15 (In billion Rupees)
101.44 190.59
116.66
544.59
215.58
Loan & Interest Payment (8.68 %)
Salary (16.31 %)
Pension (9.98 %)
Other Revenue Expenditure of Plan & Non-Plan(46.59 %)
Capital Expenditure (18.44 %)

Revenue Receipts of State Government (in billion Rupees)
178.37 230.83
282.10 329.81 355.27
445.32
513.20
595.67
689.19
1019.39
2005-06 2006-07 2007-08 2008-09 2009-10 2010-11 2011-12 2012-13 2013-14(Pre
Actual)
2014-15(B.E.)
Share in central taxes.
State Tax & Non Tax Revenue.
Grants From GOI.
Total Revenue Receipt.
1200
1000
800
600
400
200
0
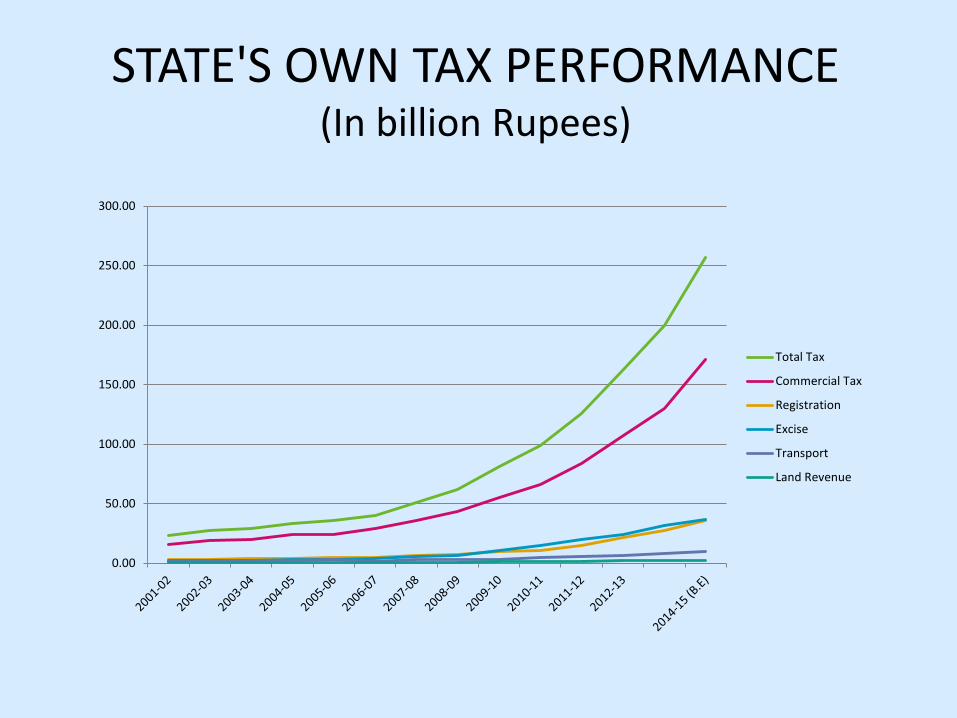
STATE'S OWN TAX PERFORMANCE (In billion Rupees)
0.00
50.00
100.00
150.00
200.00
250.00
300.00
Total Tax
Commercial Tax
Registration
Excise
Transport
Land Revenue
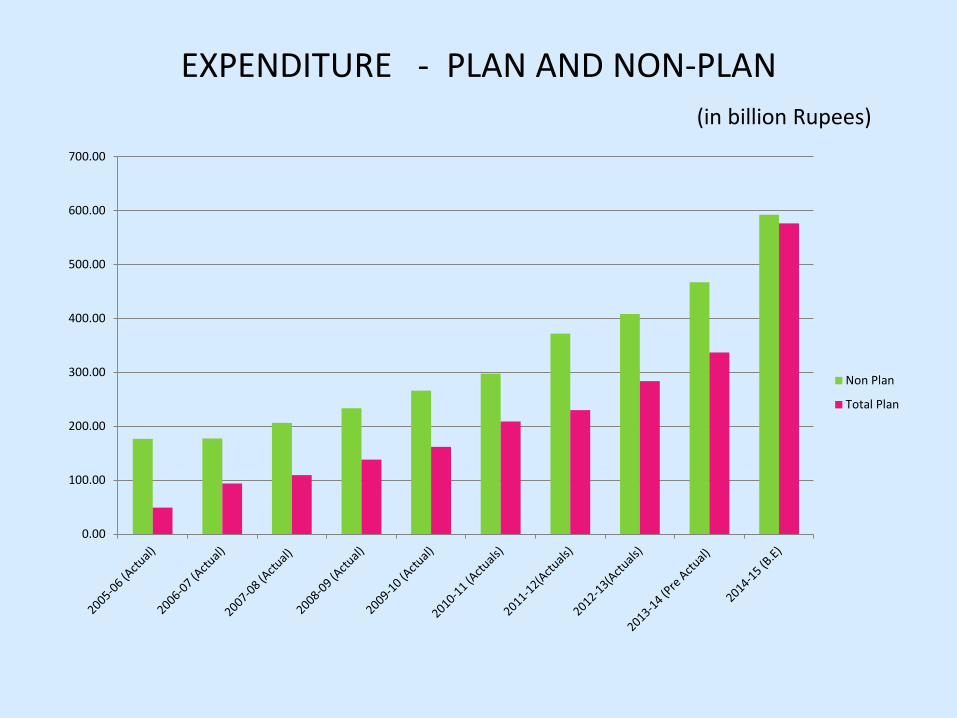
EXPENDITURE - PLAN AND NON-PLAN (in billion Rupees)
0.00
100.00
200.00
300.00
400.00
500.00
600.00
700.00
Non Plan
Total Plan
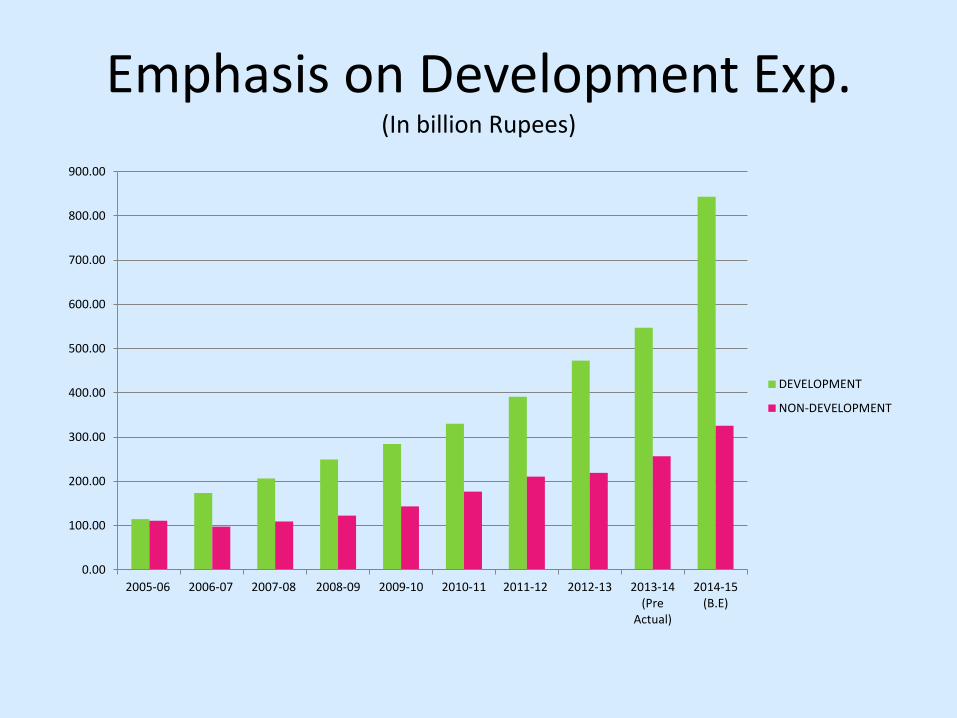
Emphasis on Development Exp. (In billion Rupees)
0.00
100.00
200.00
300.00
400.00
500.00
600.00
700.00
800.00
900.00
2005-06 2006-07 2007-08 2008-09 2009-10 2010-11 2011-12 2012-13 2013-14(Pre
Actual)
2014-15(B.E)
DEVELOPMENT
NON-DEVELOPMENT

Fiscal Performance
-3.00
-2.00
-1.00
0.00
1.00
2.00
3.00
4.00
5.00
Revenue Deficit/GSDP
Gross Fiscal Deficit/GSDP
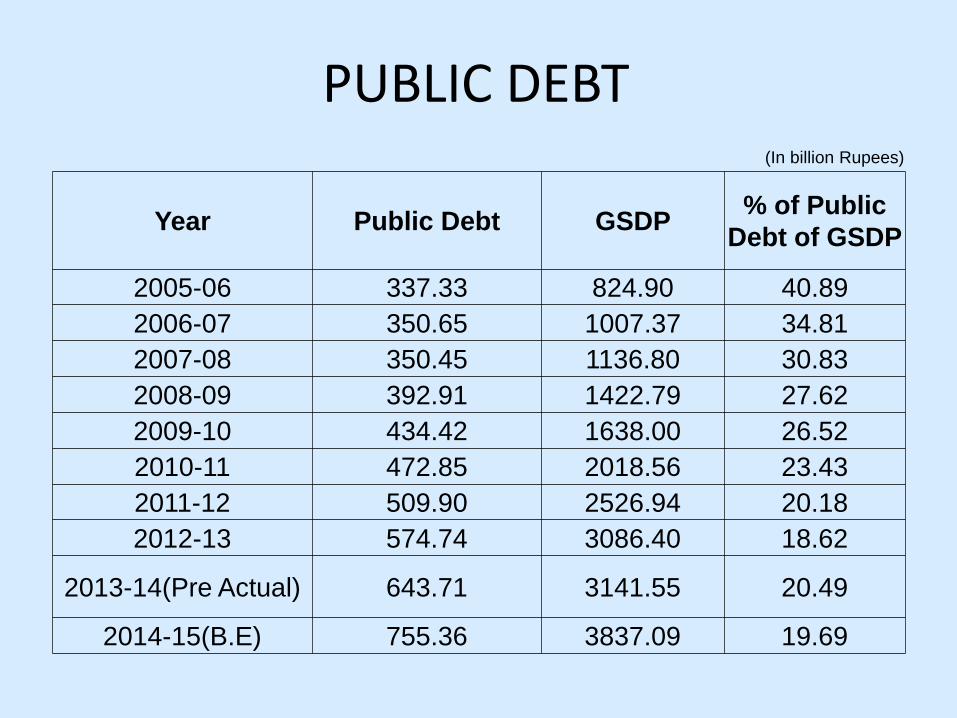
PUBLIC DEBT (In billion Rupees)
Year Public Debt GSDP % of Public Debt of GSDP
2005-06 337.33 824.90 40.89 2006-07 350.65 1007.37 34.81 2007-08 350.45 1136.80 30.83 2008-09 392.91 1422.79 27.62 2009-10 434.42 1638.00 26.52 2010-11 472.85 2018.56 23.43 2011-12 509.90 2526.94 20.18 2012-13 574.74 3086.40 18.62
2013-14(Pre Actual) 643.71 3141.55 20.49
2014-15(B.E) 755.36 3837.09 19.69
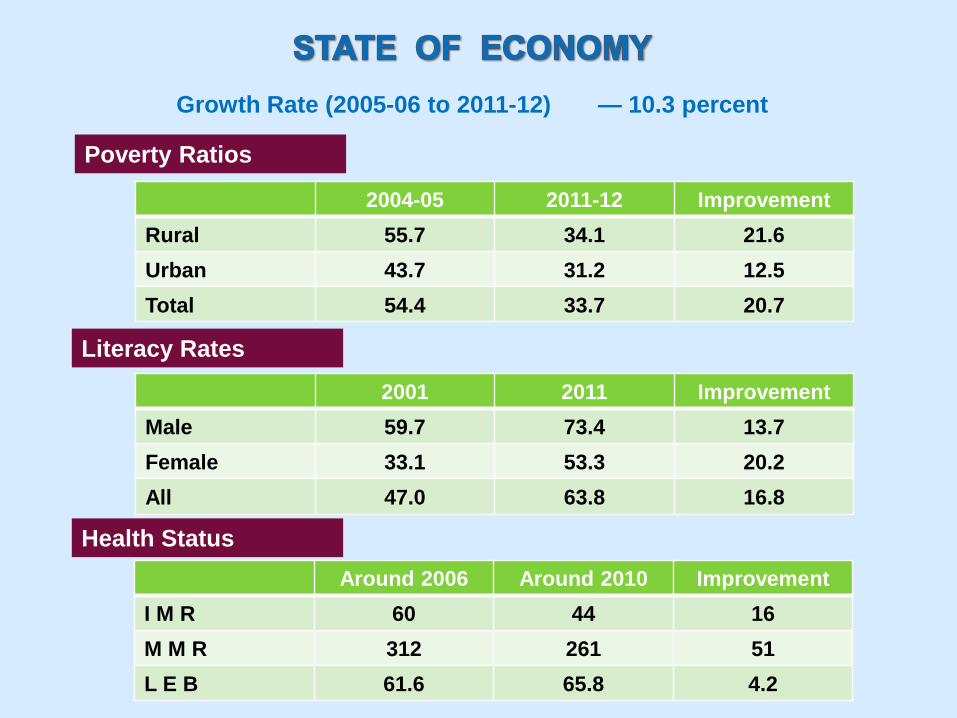
Growth Rate (2005-06 to 2011-12) — 10.3 percent
2004-05 2011-12 Improvement Rural 55.7 34.1 21.6 Urban 43.7 31.2 12.5 Total 54.4 33.7 20.7
2001 2011 Improvement Male 59.7 73.4 13.7 Female 33.1 53.3 20.2 All 47.0 63.8 16.8
Around 2006 Around 2010 Improvement I M R 60 44 16 M M R 312 261 51 L E B 61.6 65.8 4.2
Poverty Ratios
Literacy Rates
Health Status

Expenditure on Social Sector
(In billion Rupees)
Year 2010-11 2011-12 2012-13 2013-14 2014-15
Social Sector in which
161.62 195.36 244.38 282.53 471.37
Education 81.56 100.85 142.41 149.09 247.91
Health 16.67 15.22 20.93 25.74 48.03

Status :: Health
Sr. No
Indicator Latest
Situation Trend
1 I M R 44 Improved from 61 in 2005
2 M M R 261 Improved from 312 in 2005
3 T F R 3.6 Improved from 3.9 in 2005
4 Child marriage 23 Improved from 46% in 2009
5 Life Expectancy at Birth 65.5(M) & 66.2 (F) Improved from 61.6 (M) & 59.7(F) in 2001
6 Anaemia (All women 15-49 years) % 68.3 63% in 1999
7 Malnutrition (children under 3 years of age)* 58.4 54% in 1999
8 Sex Ratio 916 921 in 2001

Status :: Education
Sr. No
Indicator Latest
Situation Trend
1 Literacy rates 71.2(M) & 51.5(F)
Improved from 60.3(M)&33.6(F)in 2001
2 Total Literacy 61.8 Improved from 47 in 2001
3 Enrolment rate in primary and upper primary levels.
207.25 Improved from 176.64 in 2007-08
4 Dropout rates at primary, upper
primary, secondary and higher secondary levels
34.80,55.48,65.18 and 66.98
Improved from 46.10,61.80,76.80 and
81.90 in 2006-07
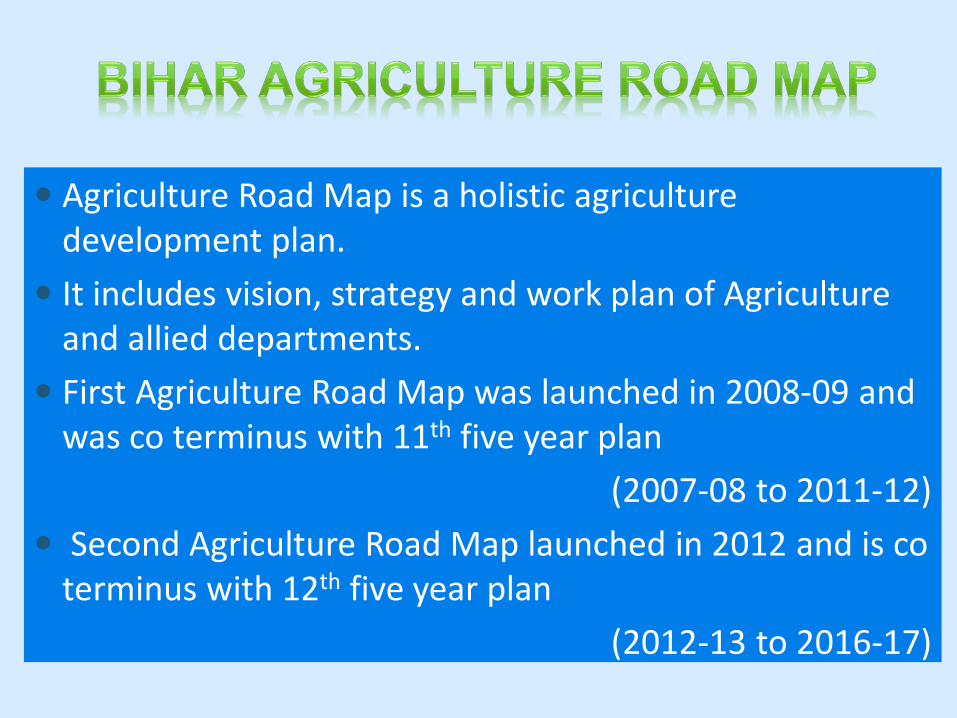
Agriculture Road Map is a holistic agriculture development plan.
It includes vision, strategy and work plan of Agriculture and allied departments.
First Agriculture Road Map was launched in 2008-09 and was co terminus with 11th five year plan
(2007-08 to 2011-12) Second Agriculture Road Map launched in 2012 and is co
terminus with 12th five year plan (2012-13 to 2016-17)
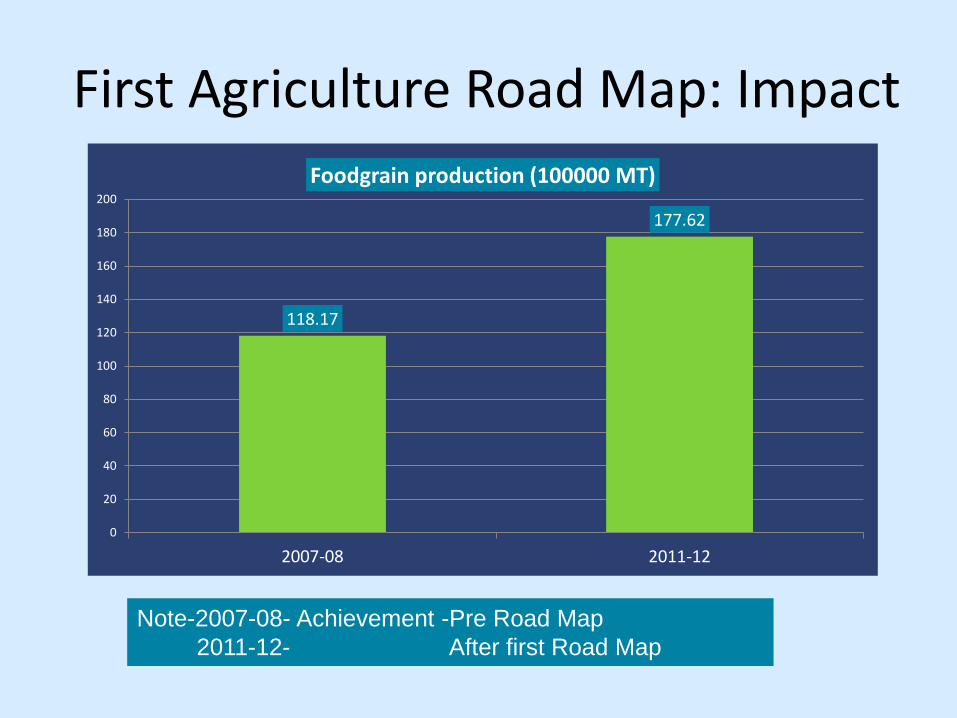
First Agriculture Road Map: Impact
Note-2007-08- Achievement -Pre Road Map 2011-12- After first Road Map
118.17
177.62
0
20
40
60
80
100
120
140
160
180
200
2007-08 2011-12
Foodgrain production (100000 MT)
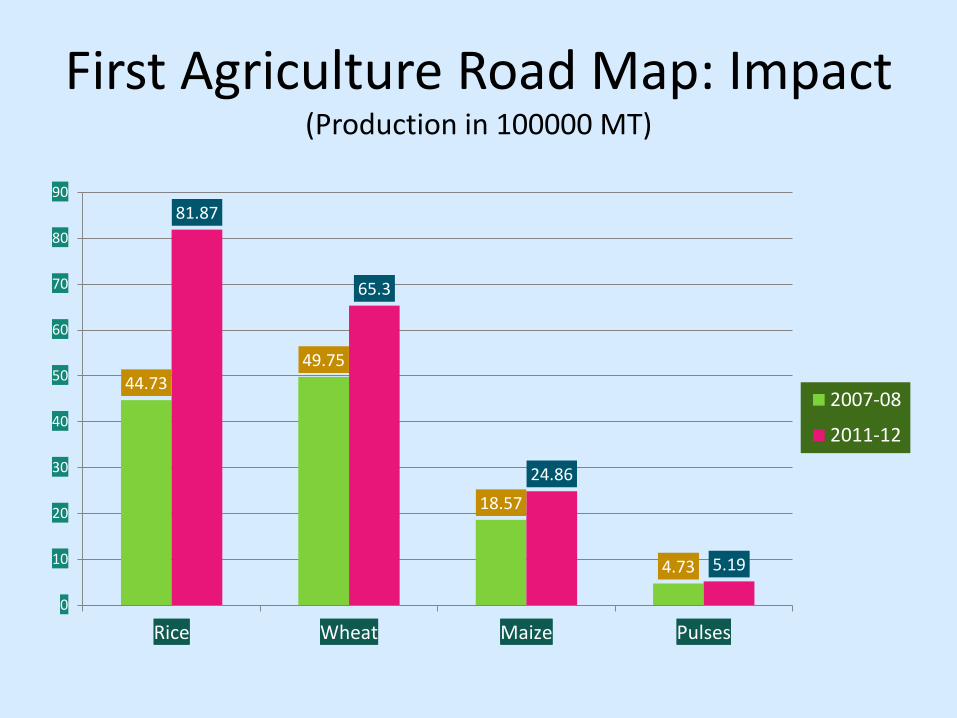
44.73 49.75
18.57
4.73
81.87
65.3
24.86
5.19
0
10
20
30
40
50
60
70
80
90
Rice Wheat Maize Pulses
2007-08
2011-12
First Agriculture Road Map: Impact (Production in 100000 MT)

RURAL ROADS
• All habitations exceeding 250 to be connected by all weather pucca road by 2017
• A comprehensive Maintenance Policy for rural roads.
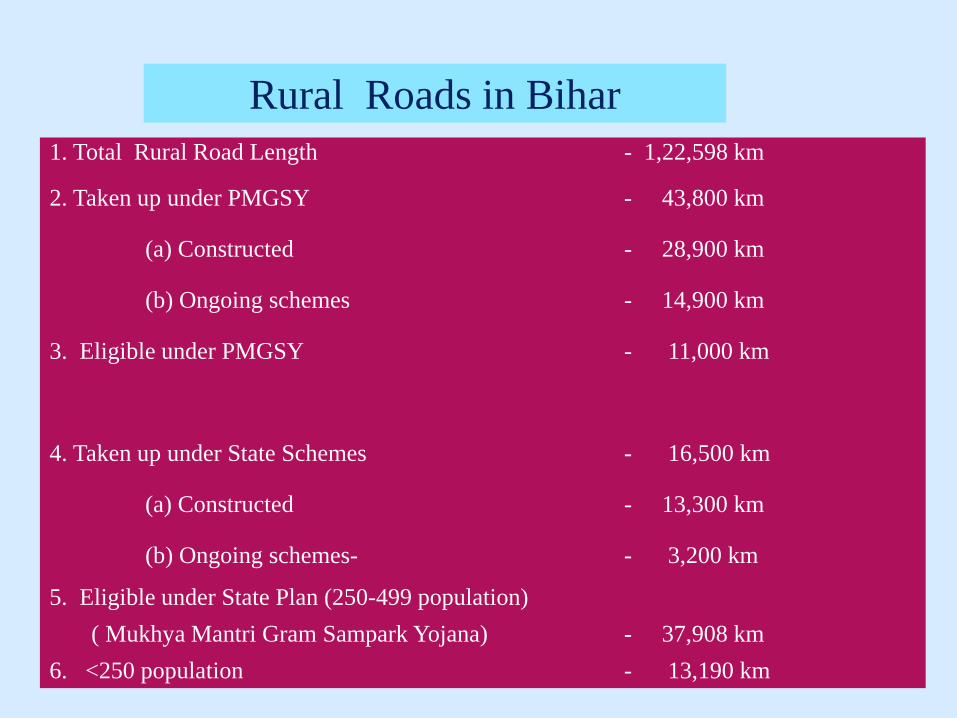
Rural Roads in Bihar 1. Total Rural Road Length - 1,22,598 km
2. Taken up under PMGSY - 43,800 km
(a) Constructed - 28,900 km
(b) Ongoing schemes - 14,900 km
3. Eligible under PMGSY - 11,000 km
4. Taken up under State Schemes - 16,500 km
(a) Constructed - 13,300 km
(b) Ongoing schemes- - 3,200 km
5. Eligible under State Plan (250-499 population) ( Mukhya Mantri Gram Sampark Yojana) - 37,908 km 6. <250 population - 13,190 km
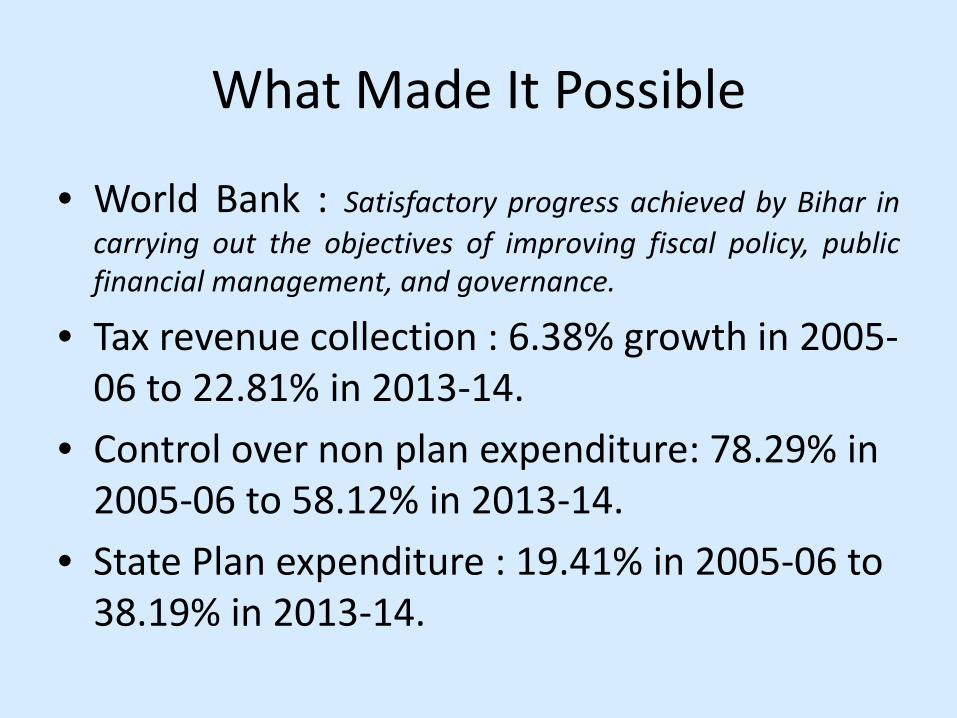
What Made It Possible
• World Bank : Satisfactory progress achieved by Bihar in carrying out the objectives of improving fiscal policy, public financial management, and governance.
• Tax revenue collection : 6.38% growth in 2005-06 to 22.81% in 2013-14.
• Control over non plan expenditure: 78.29% in 2005-06 to 58.12% in 2013-14.
• State Plan expenditure : 19.41% in 2005-06 to 38.19% in 2013-14.

Reform initiatives
• Full budgets since 2006-07 every year. • Tax rates rationalized • VAT implemented (Apr 2005) • FRBM Act enacted (Feb 2006) • New Pension Scheme introduced (Sep 2005) • Economic Surveys published regularly from
2007 onwards. • Delegation of powers to Depts & field officials.

Financial Management
• Treasury Computerization(CTMIS) for constant tracking of expenditures & revenues.
• Bihar Treasury Code amended in 2011. • Budget Computerization. • Internal Financial Advisor Cell in depts to
monitor development expenditure. • Bihar Financial Rules & Budget Manual under
amendment.

Indicators Reference Year Bihar India Best in India
Per Capita Income (Rs.) (2004-05 prices) 2010-11 7813 26015 40628 (Haryana)
Poverty Ratio Rural 2011-12 34.1 25.7 7.7 (Punjab)
Urban 2011-12 31.2 13.7 5.0 (Kerala)
Total 2011-12 33.7 21.9 7.1 (Kerala)
Literacy Rate Male 2011 73.4 82.1 96.0 (Kerala)
Female 2011 53.3 65.5 92.0 (Kerala)
All 2011 63.8 74.0 93.9 (Kerala)
I M R 2011 44 44 12 (Kerala)
M M R 2007-09 261 212 81 (Kerala)
L E B 2006-10 65.8 66.1 74.2 (Kerala)
H D I 2011 0.447 0.504 0.625 (Kerala)
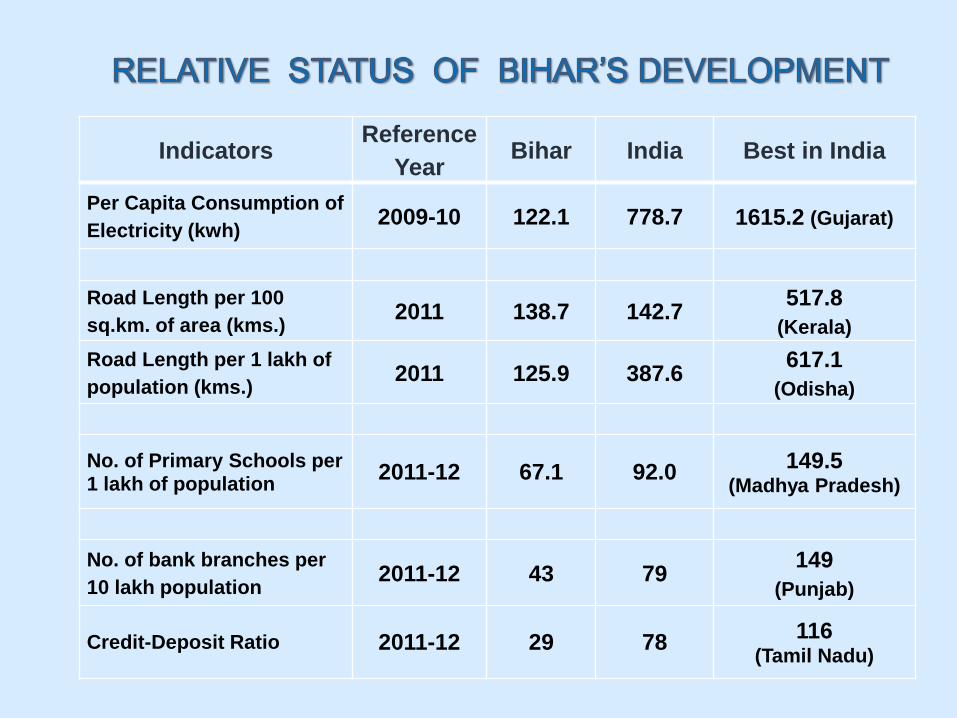
Indicators Reference
Year Bihar India Best in India
Per Capita Consumption of Electricity (kwh) 2009-10 122.1 778.7 1615.2 (Gujarat)
Road Length per 100 sq.km. of area (kms.) 2011 138.7 142.7 517.8
(Kerala) Road Length per 1 lakh of population (kms.) 2011 125.9 387.6 617.1
(Odisha)
No. of Primary Schools per 1 lakh of population 2011-12 67.1 92.0 149.5
(Madhya Pradesh)
No. of bank branches per 10 lakh population 2011-12 43 79 149
(Punjab)
Credit-Deposit Ratio 2011-12 29 78 116 (Tamil Nadu)
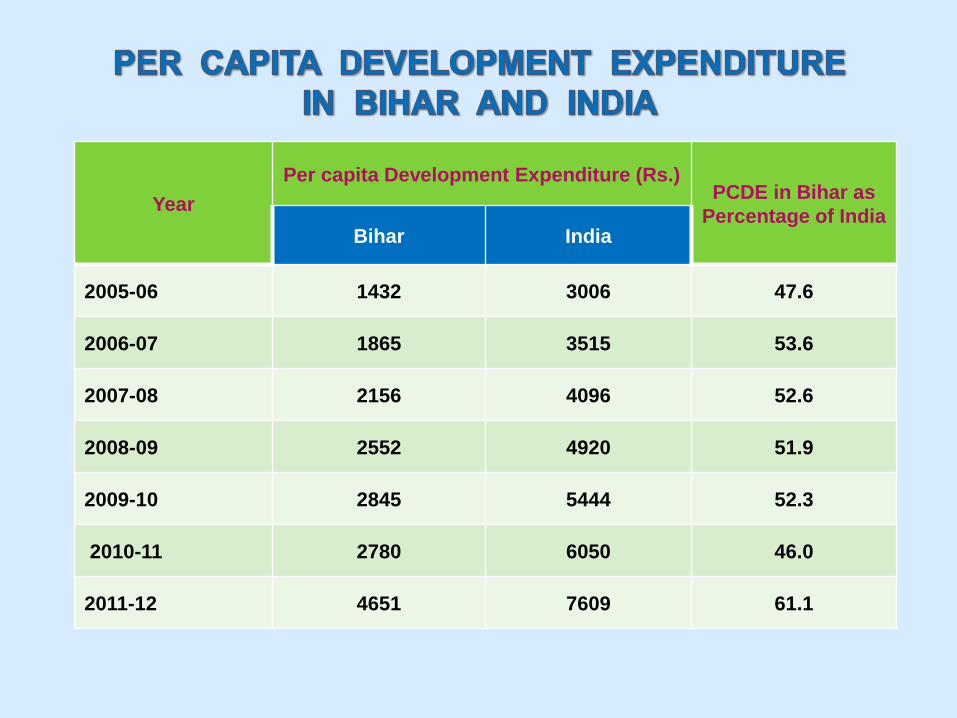
Year Per capita Development Expenditure (Rs.)
PCDE in Bihar as Percentage of India
Bihar India
2005-06 1432 3006 47.6
2006-07 1865 3515 53.6
2007-08 2156 4096 52.6
2008-09 2552 4920 51.9
2009-10 2845 5444 52.3
2010-11 2780 6050 46.0
2011-12 4651 7609 61.1

Miles To Go Despite high social sector expenditure, Bihar lies last in the country in terms of human development index. This can be attributed to very low per capita development expenditure. Needed : Still higher investments in social sectors and therefore far more resources at the command of the State Govt.

»THANK YOU


![2016-17 ACCOUNTS · 2016-17 లెక్కలు ACCOUNTS 2016-17 NON - PLAN Summary (]ూపా\లు లక్షల లో Rupees in Lakhs) ఖాతయ ప్ద్ుద HEAD](https://img.pdfslide.tips/doc/110x75/6004e613cfced455e3225d05/2016-17-accounts-2016-17-aaaaaaa-accounts-2016-17-non-plan-summary.jpg)