Embed Size (px)
Citation preview
Revista Mexicana de Ciencias Agrícolas
ISSN: 2007-0934
Instituto Nacional de Investigaciones
Forestales, Agrícolas y Pecuarias
México
Sánchez Aspeytia, David; Borrego Escalante, Fernando; Zamora Villa, Víctor Manuel; Sánchez
Chaparro, Juan David; Castillo Reyes, Francisco
Estimación de la interacción genotipo-ambiente en tomate (Solanum lycopersicum L.) con el modelo
AMMI
Revista Mexicana de Ciencias Agrícolas, vol. 6, núm. 4, mayo-junio, 2015, pp. 763-778
Instituto Nacional de Investigaciones Forestales, Agrícolas y Pecuarias
Estado de México, México
Disponible en: http://www.redalyc.org/articulo.oa?id=263138102008
Cómo citar el artículo
Número completo
Más información del artículo
Página de la revista en redalyc.org
Sistema de Información Científica
Red de Revistas Científicas de América Latina, el Caribe, España y Portugal
Proyecto académico sin fines de lucro, desarrollado bajo la iniciativa de acceso abierto
Revista Mexicana de Ciencias Agrícolas Vol.6 Núm.4 16 de mayo - 29 de junio, 2015 p. 763-778
Estimación de la interacción genotipo-ambiente en tomate (Solanum lycopersicum L.) con el modelo AMMI*
Estimation of the genotype-environment interaction in tomato (Solanum lycopersicum L.) with the AMMI model
David Sánchez Aspeytia1§, Fernando Borrego Escalante2, Víctor Manuel Zamora Villa2, Juan David Sánchez Chaparro1 y Francisco Castillo Reyes1
1Campo Experimental Saltillo-INIFAP. Carretera Saltillo-Zacatecas, km 342+119, 9515. Hacienda de Buena Vista C. P. 25315. Tel: 01-844-4391901, Saltillo, Coahuila. ([email protected]; [email protected]). 2Universidad Autónoma Agraria Antonio Narro. Calzada Antonio Narro 923, Buenavista, Saltillo, Coahuila, México. ([email protected]; [email protected]). §Autor para correspondencia: [email protected].
* Recibido: noviembre de 2014
Aceptado: abril de 2015
Resumen
El tomate (Solanum lycopersicum L.) es una hortaliza con un alto valor comercial para su consumo en fresco y en la manufactura de productos procesados. La potencialidad de la zona norte de México en la producción de esta hortalizas hace necesario la formación de nuevos genotipos de tomate y por ello es necesario medir la interacción genotipo-ambiente (IG x A) y así determinar la estabilidad fenotípica de los genotipos ante las fluctuaciones ambientales, los objetivos del presente trabajo se enfocaron a estimar la interacción genotipo-ambiente y estabilidad de características de rendimiento, fisiológicas y de calidad de 25 genotipos de tomate en tres ambientes a través del modelo multivariado AMMI. Se encontraron diferencias significativas para las variables de calidad (p< 0.01) en la IG x A, El resultado del análisis AMMI indica que solo dos componentes explicaron 100% de la variación existente, siendo el híbrido experimental Q3 x R1 el mejor en cuanto a las variables de calidad y rendimiento, los ambientes de evaluación mostraron ser muy diferentes en su discriminación de los materiales genéticos. Por lo cual será necesario seguir evaluando a estos genotipos bajo diferentes formas de producción y ambientes a fin de que los genes involucrados en la expresión de las variables de rendimiento, fisiológicas
Abstract
Tomato (Solanum lycopersicum L.) is a vegetable with high commercial value for fresh consumption and the manufacture of processed products. The potential of northern Mexico in the production of this vegetable is necessary to the formation of new genotypes of tomato and it is necessary to measure the genotype-environment (IG x A) interaction and determine the phenotypic stability of genotypes to the environmental fluctuations, the objectives of this work is focused to estimate the genotype-environment and stability of yield characteristics, physiological and quality of 25 tomato genotypes in three environments through the AMMI multivariate model interaction. Significant differences for quality variables (p< 0.01) in the IG x A were found AMMI The analysis result indicates that only two components explained 100% of the variation, with the experimental hybrid Q3 x R1 the best in terms the variables of quality and yield environments evaluation showed very different in their discrimination of genetic materials. Therefore it will be necessary to further assess these genotypes under different forms of production and environments so that the genes involved in the expression of the yield variables, physiological and quality go setting and the effect of the environment is minimized and so achieved genetic materials
764 Rev. Mex. Cienc. Agríc. Vol.6 Núm.4 16 de mayo - 29 de junio, 2015 David Sánchez Aspeytia et al.
y de calidad se vayan fijando y que el efecto del ambiente se minimice y así logra materiales genéticos que se adapten a diferentes ambientes y con altos contenidos de compuestos nutritivos y alimenticios que permitan a esta hortaliza seguir siendo una de las más importantes a nivel nacional y mundial.
Palabras clave: AMMI, calidad, interacción genotipo-ambiente, rendimiento, tomate.
Introducción
El tomate rojo mexicano es una de las especies agrícolas cultivadas que generan más divisas para el país ya que cerca de 30% de la producción nacional se exporta y en los últimos 10 años las exportaciones se han incrementado 67% (Hernández et al, 2004). Cifras del Servicio de Información Agroalimentaria y Pesquera (SIAP) de la Secretaría de Agricultura, Ganadería, Desarrollo Rural, Pesca y Alimentación (SAGARPA) indican que en el año 2011 el total de la superficie sembrada en México fue de 53 780 hectáreas, con un volumen de producción de 1 872 481 t y un rendimiento promedio de 41.67 t ha-1. Para la región noreste del país, el cultivo de tomate representa una alternativa agrícola en las condiciones semiáridas, dado que existe una superficie potencial de 150 000 hectáreas (Villa et al., 2001), actualmente se siembran en la región lagunera cerca de 800 ha de tomate (SIAP, 2007), además de que existe una demanda que crece día a día, por la alta rentabilidad del cultivo, por sus propiedades nutracéuticas y su uso como complemento en la alimentación diaria, lo que lo hacen ser un producto de consumo básico. Sin embargo, la mayoría de las variedades e híbridos presentes en el mercado son generados en su mayoría por empresas transnacionales y que en condiciones de alta temperatura presentan problemas de amarre y de calidad de los frutos.
La formación de nuevos genotipos requiere evaluar los materiales genéticos en diferentes ambientes y medir su interacción genotipo-ambiente (IG x A), la cual da una idea de la estabilidad fenotípica de los genotipos ante las fluctuaciones ambientales y es necesario para el desarrollo de un programa de mejoramiento genético del tomate en México.
Existen varios métodos para medir la interacción genotipo ambiente destacando el empleado por Eberhart y Russell (1966) que se basa principalmente en el análisis de regresión para conocer la estabilidad de genotipos en
to suit different environments and high in nutritional compounds and food to enable this vegetable remain one of the most important national and global levels.
Keywords: AMMI, genotype-environment interaction, quality, tomato, yield.
Introduction
Mexican tomato is one of the cultivated crop species that generate more income for the country and that about 30% of domestic production is exported and in the last 10 years, exports have increased 67% (Hernández et al., 2004). Number from the Agricultural and Fishing Information Service (SIAP) of the Secretariat of Agriculture, Livestock, Rural Development, Fisheries and Food (SAGARPA) indicate that in 2011 the total area planted in Mexico was 53 780 hectares with a production volume of 1 872 481 t and an average yield of 41.67 t ha-1. To the northeast of the country, tomato cultivation is an agricultural alternative in semiarid conditions, since there is a potential area of 150 000 hectares (Villa et al., 2001), currently planted in the Laguna region around 800 ha with tomato (SIAP, 2007), there is also a demand that is growing every day in the high profitability of the crop, for their nutraceutical properties and its use as a supplement in the daily diet, which make him a Product basic consumer. However, most varieties and hybrids on the market are generated mostly by transnational corporations and high temperature conditions present problems of mooring and fruit quality.
The formation of new genotypes requires assessing the genetic materials in different environments and measure its genotype-environment interaction (IG x A), which gives an idea of the phenotypic stability of genotypes to environmental f luctuations and is required for the development of a breeding program tomato in Mexico.
There are several methods for measuring the ambient genotype used by highlighting the interaction Eberhart and Russell (1966) that is mainly based on the regression analysis to determine the stability of genotypes in various environments. The statistical models used for analysing the IG x A have in common the assumption of additivity of effects that compose it. All models are also linear in its parameters, which means that the genetic and environmental differences contribute independently from each other, for phenotypic variation.
765Estimación de la interacción genotipo-ambiente en tomate (Solanum lycopersicum L.) con el modelo AMMI
In recent years we have developed new multivariate methodologies to not only describe the genotype-environment interaction but also explore the nature of the interaction, including the model Additive Main Effects and Multiplicative Interaction (AMMI) stands out for its ability to interpret a large number of genotypes in various environments, this method is currently the most widely used because they consider genotypes and environments as additives and nonlinear effects allowing their study through an analysis of variance (ANOVA), while the IG x A is multiplicative effects that can be analysed via principal component (Crossa et al., 1990)
It is known that internal and external factors have an important influence on the main features of interest to plant breeders, highlighting the yield variables, physiological and quality. Riga et al. (2007) found that, the quality of the tomato depends more on the temperature of photosynthetically active radiation, temperature was highly correlated with strength, electrical conductivity, and soluble solids and moderately correlated with pH, dry weight and vitamin C. The biosynthesis lycopene is affected by environmental conditions if the fruit temperature exceeds 30 °C, lycopene synthesis is inhibited, the fruits direct radiation of about 2 990 umol m-2 s-1 for 1.5 to 4 h is detrimental to the fruits (Brandt et al., 2005).
The increase in vitamin C and lycopene is presented as a promising target of genetic improvement, since these substances play an important role in the prevention of degenerative diseases, cancer, neurological disorders and sight. However, the evolution and selection of interesting sources of variability and elite genotypes in segregating generations greatly hampered by the high influence that the environment has on the accumulation of vitamin C and lycopene in tomatoes (Dumas et al., 2003). Therefore, it is necessary to determine the experimental conditions that minimize the environmental influence on the accumulation of vitamin C and lycopene in tomato.
Understanding the IG x A under adverse weather conditions to assess the behaviour of genotypes and stability in a region adaptive potential. Ortiz and Izquierdo (1994) evaluated nine varieties six tomato hybrids in 20 countries in Latin America for business yield and average fruit weight finding significant differences in genotype environment interaction, indicating that genotypes have different productive response between environments.
diversos ambientes. Los modelos estadísticos empleados para el análisis de la IGxA tienen en común la suposición de la aditividad de los efectos que la componen. Todos los modelos son también lineales en sus parámetros, lo que significa que las diferencias genéticas y ambientales contribuyen independientemente, unas de otras, para la variación fenotípica.
En los últimos años se han desarrollado nuevas metodologías multivariadas que permiten no solo describir la interacción genotipo-ambiente sino también profundizar en la naturaleza de la interacción, entre ellas destaca el modelo Additive Main Effects and Multiplicative Interaction (AMMI) por su gran capacidad para interpretar un gran número de genotipos en varios ambientes, este método es actualmente de los más usados ya que consideran a los genotipos y ambientes como efectos aditivos y lineales permitiendo su estudio por medio de un análisis de varianza (ANVA), mientras que la IG x A es de efectos multiplicativos que pueden ser analizados por medio de componentes principales (Crossa et al., 1990).
Es conocido que los factores internos y externos influyen de manera importante en las principales características de interés para los mejoradores de plantas, destacando las variables de rendimiento, fisiológicas y calidad. Riga et al. (2007) encontraron que la calidad del tomate depende más de la temperatura que de la radiación fotosintéticamente activa, la temperatura fue altamente correlacionada con firmeza, conductividad eléctrica, contenido de sólidos solubles y medianamente correlacionada con pH, peso seco y vitamina C. La biosíntesis de licopeno es afectada por condiciones ambientales, si la temperatura de la fruta excede los 30 °C, la síntesis de licopeno es inhibida, radiación directa en los frutos de más o menos 2 990 µmol m-2 s-1 por 1.5 a 4 h es perjudicial para los frutos (Brandt et al, 2005).
El incremento del contenido en vitamina C y licopeno se presenta como un objetivo de mejoramiento genético prometedor, ya que estas sustancias desempeñan un papel importante en la prevención de enfermedades degenerativas, canceres, desórdenes neurológicos y de la vista. Sin embargo, la evolución y selección de fuentes de variabilidad interesante y de genotipos elite en generaciones segregantes se ve dificultada enormemente por la elevada influencia que el ambiente tiene en la acumulación de vitamina C y licopeno en tomate (Dumas et al., 2003). Por ello, es necesario determinar las condiciones de experimentación que minimicen esta influencia del ambiente en la acumulación de vitamina C y licopeno en tomate.
766 Rev. Mex. Cienc. Agríc. Vol.6 Núm.4 16 de mayo - 29 de junio, 2015 David Sánchez Aspeytia et al.
La comprensión de la IG x A bajo condiciones climáticas adversas permite evaluar el comportamiento de genotipos y su estabilidad en una región potencial de adaptación. Ortiz e Izquierdo (1994) evaluaron nueve variedades y seis híbridos de tomate en 20 países de Latinoamérica para rendimiento comercial y peso promedio de fruto encontrando diferencias significativas en la interacción genotipo ambiente, indicando que los genotipos tienen diferente respuesta productiva entre ambientes.
Cuartero y Cubero (1982) evaluaron 12 variedades de tomate y sus híbridos en España, encontrando que los híbridos presentaron más estabilidad y alto rendimiento que sus progenitores en diferentes ambientes.
Ortiz et al. (2007) mencionan que la interacción genotipo ambiente afecta el rendimiento comercial y peso promedio de fruto de variedades e híbridos de tomate, ellos utilizaron la regresión factorial (RF) y la regresión de los cuadrados medios parciales (RCMP), herramientas poderosas actuales para analizar la interacción genotipo-ambiente en cultivos de tomate evaluados en diferentes ambientes. González et al. (2007) compararon tres métodos para estimar la estabilidad del rendimiento en nueve variedades de algodón, encontrando que el modelo AMMI fue el mejor ya que permitió asociar la respuesta de las variedades más rendidoras a ambientes específicos y resulto ser más informativo y sencillo de interpretar.
Bajo este esquema, los objetivos de la presente investigación se enfocaron a estimar la interacción genotipo-ambiente y estabilidad de características de rendimiento, fisiológicas y de calidad de 25 genotipos de tomate en tres ambientes a través del modelo multivariado AMMI.
Materiales y métodos
El material genético que se empleó en esta investigación fueron: 25 materiales genéticos siendo siete líneas F9 generadas en el área de Fisiotecnia de la Universidad Autónoma Agraria Antonio Narro (UAAAN), 17 híbridos experimentales y un híbrido comercial como testigo y como progenitor (Cuadro 1). La generación de los híbridos experimentales se llevó acabo en el año 2005, provenientes de cruzamientos dirigidos entre líneas experimentales con híbridos comerciales y entre híbridos comerciales. La procedencia de las líneas experimentales es resultado de más
Cuartero and Cubero (1982) evaluated 12 varieties of tomato hybrids in Spain, finding that the hybrids had more stability and higher yield than their parents in different environments.
Ortiz et al. (2007) mentioned that, the genotype environment interaction affects business yield and average fruit weight of tomato varieties and hybrids, they used the regression factor (RF) and partial regression of the squares means (RCMP), current powerful tools to analyse the genotype-environment interaction in tomato evaluated in different environments. González et al. (2007) compared three methods for estimating yield stability in nine varieties of cotton, finding that the AMMI model was the best since it allowed to associate the response of the varieties yielding to specific environments and turned out to be more informative and easy to interpret.
Under this scheme, the objectives of this research focused on estimating the genotype-environment and stability of yield characteristics, physiological and quality of 25 tomato genotypes in three environments through the AMMI multivariate model interaction.
Materials and methods
The genetic material that was used in this research were: 25 genetic materials being seven lines F9 generated in the area of Physio-tecnique at the Agraria Antonio Narro Autonomus University (UAAAN), 17 experimental hybrids and commercial hybrid as a control and as a parent (Table 1). The generation of experimental hybrids was carried out in 2005, directed from crosses between commercial and experimental lines between commercial hybrids. The origin of the experimental lines is the result of over 10 years of research, which are outstanding in phenological characteristics, physio-tecniques, quality and tolerance to different diseases, from initial crosses of materials Shady Lady, Bonita, Monte Carlo, Celebrity, Sunny and Tequila F1.
The 25 genetic materials were evaluated in three environments (Table 2) during the 2006-2007 agricultural cycle, according to the National Institute of Statistics, Geography and Informatics (INEGI, 2007), these environments are in an area of semi-arid conditions, with low rainfall and average annual temperatures of 18-20 °C.
767Estimación de la interacción genotipo-ambiente en tomate (Solanum lycopersicum L.) con el modelo AMMI
The trial was established on January 20, 2006 for localities Rancho Nuevo and Providencia, while for UAAAN was on February 16, 2006, in polystyrene trays 200 filled cavities organic substrate (peat-moss ), the transplant took place on March 16 in Rancho Nuevo, March 23 in Providencia
and April 4, 2006 at UAAAN, three lots of land were used in the UAAAN 6 m wide by 30 m d e long each, from each batch four beds of 28 m d e long and a distance of 1.3 m between beds were made, in Providencia five beds were used stuffed with coconut fibre, placing eight plants for "bolis" in Rancho Nuevo, beds are mechanically raised beds at a
de 10 años de investigación, las cuales son sobresalientes en características fenológicas, fisiotécnicas, calidad y tolerancia a diferentes enfermedades, procedentes de cruzas iniciales de los materiales Shady Lady, Bonita, Montecarlo, Celebrity , Sunny y Tequila F1.
Los veinticinco materiales genéticos se evaluaron en tres ambientes (Cuadro 2) durante el ciclo agrícola 2006-2007, de acuerdo al Instituto Nacional de Estadística, Geografía e Informática (INEGI, 2007) estos ambientes se encuentran en una zona de condiciones semiáridas, con bajas precipitaciones y con temperaturas medias anuales de 18-20 °C.
Genotipo Descripción Genotipo Descripción Genotipo Descripción1.- F3 x D1 Híbrido
experimental10.- TR x F3 Híbrido comercial x
línea F919.- R1 Línea F9
2.- Z4 x R1 Híbrido experimental
11.- Z4 x SXXI Línea F9 x híbrido comercial
20.- U2 Línea F9
3.- Z4 x L1 Híbrido experimental
12.- F3 x CB Línea L9x híbrido comercial
21.- L1 Línea F9
4.- Z4 x U2 Híbrido experimental
13.- DR x R1 Híbrido comercial x línea F9
22.- Q3 Línea F9
5.- S1 x L1 Híbrido experimental
14.- DR x Z4 Híbrido comercial x línea
23.- DR Híbrido comercial
6.- P3 x F3 Híbrido experimental
15.- DR x Q3 Híbrido comercial x línea
24.- TR x L1 Híbrido comercial x línea F9
7.- Q3 x R1 Híbrido experimental
16.- F3 Línea F9 25.- WS x F3 Híbrido comercial x línea F9
8.- Z4 x D 1 Híbrido experimental
17.- D1 Línea F9
9.- Z4 x Q3 Híbrido experimental
18.- Z4 Línea F9
Cuadro 1. Genotipos evaluados en tres ambientes del estado de Coahuila, México, 2006.Table 1. Genotypes evaluated in three environments of the state of Coahuila, Mexico, 2006.
Ambiente Evaluación Coordenadas geográficas
Altitud (m)
Precipitación media (mm)
Temperatura promedio P-V (ºC)
A. Rancho Nuevo
Campo 25º31´53” latitud N 101º00´50¨ longitud W
1 473 350 34.7
B. Providencia Invernadero 25° 13' 60 latitud N101º10´00longitud W
1 866 350 31.6
C. Buenavista Campo 25º 22´ latitud N 101º 00¨ longitud W
1 742 400 37.3
Cuadro 2. Ambientes de evaluación y sus características generales.Table 2. Evaluation Environments and their general characteristics.
768 Rev. Mex. Cienc. Agríc. Vol.6 Núm.4 16 de mayo - 29 de junio, 2015 David Sánchez Aspeytia et al.
distance of 1.8 m and a length of 200 m, the materials were established in seven beds, in the towns of field using paddings and DFS provided cintilla and the greenhouse system was semi-hydroponics.
Staking was performed at 20 days after transplantation, when the plants had a height of 0.3 m, at UAAAN metal tubes were placed in the middle of the bed coinciding with the row of plants, the separation of tubes was 2 m, on which was placing two plastic wires (raffia) to 0.20 m high to avoid contact of the aerial parts of the plants with soil. Providencia, consisted of tying yarns to the greenhouse structure by which the plants were guided. In Rancho Nuevo, wooden stakes were placed at a distance of 3 m between each wire and 3 levels. The prunings were performed at 2 days after transplantation, intercalandolas every 15 days in the towns until the end of the crop cycle in certain indeterminate tomatoes and tomatoes just until the beginning of fruiting.
Irrigation was carried out twice a week at the beginning of the cycle, increasing to three times as the crop was developing. Fertilization was using the formula 250N-250P-125K-100 Ca. In Buenavista, nitrogen application was made in two parts, the first during the formation of the beds before transplantation using a trickle to a depth of 0.15 m, the second application was made 40 days after transplantation in the same way as the first. In Rancho Nuevo and Providencia dosage of nutrients and water was carried out according to the technical requirements of each company, Magaña's Ranch to Rancho Nuevo and Greenhouses Santa Maria for Providencia.
Variables evaluated
Yield variables (quantitative) days to first cut (DPC) in days, average fruit weight (PPF) in grams, yield (YIELD) in tonnes per hectare. Yield variables (qualitative): Brix (° Brix) in percent, vitamin C (VITC) in milligrams and lycopene (LICOP) in milligrams.
Physiological: photosynthesis (PHOTO) in umol CO2 m-2 s-1, transpiration (TRANS) in umol H2O m-2 s-1, efficient use of physiological water (UEAF) in g CO2 m-2 s-1 by 10 LH2O m-2 s-1.
Data collection
For days to first cut a count of days was made from the transplant date and the start of harvest of each genotype, and thus determine its earliness. After the last cut, we
La siembra se realizó el 20 de enero de 2006 para las localidades Rancho Nuevo y Providencia, mientras que para la UAAAN fue el 16 de febrero de 2006, en charolas de poliestireno de 200 cavidades rellenas de sustrato orgánico (peat-moss), el transplante se realizó el día 16 de marzo en Rancho Nuevo, 23 de marzo en Providencia y 04 de abril de 2006 en la UAAAN, se emplearon tres lotes de terreno en la UAAAN de 6 m de ancho por 30 m de largo cada uno, en cada lote se hicieron cuatro camas de 28 m de largo y una distancia de 1.3 m entre camas, en Providencia se utilizaron cinco camas con “bolis” rellenos de fibra de coco, colocando ocho plantas por “bolis”, en Rancho Nuevo, las camas se levantaron mecánicamente a una distancia entre camas de 1.8 m y una longitud de 200 m, los materiales se establecieron en siete camas, en las localidades de campo se empleó acolchado y sistema de fertirriego por cintilla y en el invernadero el sistema fue semi-hidropónico.
El entutorado se realizó a los 20 días después del transplante, cuando las plantas tenían una altura mínima de 0.3 m, en la UAAAN se colocaron tubos de metal en la parte media de la cama coincidiendo con la hilera de plantas, la separación entre tubos fue de 2 m, en los que se fue colocando dos hilos de plástico (rafia) a 0.2 m de altura para evitar el contacto de las partes aéreas de las plantas con el suelo. En Providencia, consistió en amarrar hilos a la estructura del invernadero por la que se fueron guiando las plantas. En Rancho Nuevo, se colocaron tutores de madera a una distancia de 3 m entre cada uno y 3 niveles de hilos. Las podas se realizaron a los 20 días después del transplante, intercalándolas a cada 15 días en las localidades hasta la finalización del ciclo de cultivo en tomates indeterminados y en tomates determinados sólo hasta el comienzo de la fructificación.
El riego se llevó a cabo dos veces por semana al inicio del ciclo, aumentándose a tres veces conforme el cultivo iba desarrollándose. La fertilización fue mediante la fórmula 250N-250P-125K-100 Ca. En Buenavista, la aplicación del nitrógeno se hizo en dos partes, la primera durante la formación de las camas antes del trasplante aplicando a chorrillo a una profundidad de 0.15 m, la segunda aplicación se realizó 40 días después del trasplante de la misma forma que la primera. En Rancho Nuevo y Providencia la dosificación de los nutrientes y el agua se llevó a cabo de acuerdo a las normas técnicas de cada empresa, “Magaña’s Ranch” para Rancho Nuevo e Invernaderos “Santa María” para Providencia.
769Estimación de la interacción genotipo-ambiente en tomate (Solanum lycopersicum L.) con el modelo AMMI
Variables evaluadas
Variables de rendimiento (cuantitativas): días a primer corte (DPC) en días, peso promedio de fruto (PPF) en gramos, rendimiento (REND) en toneladas por hectárea. Variables de rendimiento (cualitativas): grados Brix (°Brix) en porcentaje, vitamina C (VITC) en miligramos y licopeno (LICOP) en miligramos.
Fisiológicas: fotosíntesis (FOTO) en µmol de CO2 m-2 s-1, transpiración (TRANS) en mol H2O m-2 s-1, uso eficiente del agua fisiológico (UEAF) en g CO2 m-2 s-1 por 10 L H2O m-2 s-1.
Toma de datos
Para los días a primer corte se realizó un conteo de días a partir de la fecha de trasplante y el inicio de cosecha de cada uno de los genotipos, y así determinar su precocidad. Después del último corte, se procedió a obtener el rendimiento total de cada genotipo, esto se obtuvo sumando el peso de cada una de las cosechas realizadas. El peso total que se obtuvo se dividió entre el número de plantas cosechadas, en este caso fueron tres, obteniéndose así el rendimiento de cada planta. Para obtener el rendimiento en t ha-1, se multiplicó el rendimiento por planta por la densidad de plantación. El peso promedio de fruto se obtuvo dividiendo el peso total obtenido entre el número de frutos cosechados.
Pruebas de calidad de fruto
Después del quinto corte se seleccionaron tres frutos al azar de cada genotipo. Los frutos se colocaron en bolsas de papel para su maduración completa. Una vez que presentaron un color rojo intenso se realizaron las pruebas de calidad de fruto, para determinar Grados Brix, vitamina C y licopeno, bajo la siguiente metodología:
Se molió cada fruto y con el refractómetro portátil (ATAGO 01018) se determinó grados Brix, colocando con una espátula una pequeña muestra en el área de lectura.
Determinación de vitamina C.
Se pesó 20 g de muestra de cada genotipo, y se le agregó 10 ml de ácido clorhídrico al 2%.
La mezcla de cada vaso se llevó a un agitador vortex por un tiempo de 15 min.
proceeded to obtain the total yield of each genotype, this was obtained by adding the weight of each of the crops made. Total weight obtained was divided by the number of harvested plants, in this case was three, thereby obtaining the yield of each plant. For yield t ha-1, yield per plant multiplied by the density of planting. The average fruit weight was obtained by dividing the total weight obtained by the number of harvested fruits.
Tests fruit quality
After the fifth cut, three fruits at random from each genotype were selected. The fruits were placed in paper bags for full maturation. Once submitted the bright red fruit quality tests were conducted to determine Brix, vitamin C and lycopene, the following methodology:
Each fruit was ground and the portable refractometer (Atago 01018) Brix grades were determined by placing a spatula a small sample in the area of reading.
Vitamin C determination.
20 g samples of each genotype were weighed, and was added 10 ml of 2% hydrochloric acid.
The mixture of each glass was vortex for a time of 15 min.
After stirring the sample, the content in Erlenmeyer flasks of 500 ml capacity was filtered, 5 ml of this sample was taken which was filled to 100 ml with distilled water.
Finally, we proceeded to head with the reagent Thielman, to obtain permanent pink colour, taking the amount of reagent used, the equation was used to determine vitamin C is given by Chechetkin et al. (1984):
Where: X= mg 100 g-1 vitamin C; = 0.088 equivalent milligrams of ascorbic acidto 1 ml of reagent Thielman; a= ml of reagent spent, Thielman; b= volume in ml of the aliquot; 100 = volume in ml of the solution of vitamin C in HCl; c= weight of the sample; determination of lycopene; tomato liquefied and extracted 3 g sample, placing it in a plastic tube; 3 ml of phosphate buffer was added and stirred for 15 min; surplus sample (3 ml) was removed and placed in test tube to which was added 6 ml of hexane-acetone (3:2) and stirred well;
(a)(0.088)(100)X= (b)(c)
770 Rev. Mex. Cienc. Agríc. Vol.6 Núm.4 16 de mayo - 29 de junio, 2015 David Sánchez Aspeytia et al.
Una vez agitada la muestra, se filtró el contenido en matraces Erlenmeyer de 500 ml de capacidad, de esta muestra se tomaron 5 ml y se aforó a 100 ml con agua destilada.
Por último, se procedió a titular con el reactivo de Thielman, hasta obtener la coloración rosa permanente, tomando la cantidad de reactivo utilizado, La ecuación que se utilizó para determinar vitamina C es la propuesta por Chechetkin et al. (1984):
Donde: X= mg 100-1g vitamina C; 0.088= miligramos de ácido ascórbico equivalente a 1 ml de reactivo Thielman; a= ml del reactivo de Thielman gastados; b= volumen en ml de la alicuota valorada; 100= volumen en ml del filtrado de vitamina C en HCl; c= peso de la muestra; determinación de licopeno; se licuó el tomate y se extrajo 3 gr de muestra, colocándola en un tubo de plástico; se agregó 3 ml de buffer fosfato y se agitó por 15 min; se eliminó el excedente de muestra (3 ml) y se colocó en tubo de ensaye al que se le agregó 6 ml de hexano-acetona (3:2) y se agitó bien; se centrifugó por 5 min a 5 000 rpm; se tomó 1 ml de la muestra y se colocó en las celdillas, identificando cada una de ellas; se agregó 2 ml de acetona a cada una de las celdillas y se expuso en el espectrofotómetro, para obtener la lectura correspondiente de absorbancia; para las variables fisiológicas se utilizó el aparato de fotosíntesis (LI-6200) que mide el intercambio del C02 de la atmósfera con el área foliar del cultivo, tomando estos datos cuando el cultivo se encontraba en la etapa fenológica de fructificación, seleccionando una planta al azar.
Diseño experimental
El diseño experimental que se utilizó en las tres localidades de evaluación correspondió a diseño de bloques al azar con dos repeticiones para las características de rendimiento y fisiológicas y tres repeticiones para calidad, el análisis estadístico se efectuó como un análisis combinado sobre localidades, se consideró a los genotipos como un efecto fijo y a los ambientes como efecto aleatorio probándose en la prueba de F contra el anidamiento de repeticiones dentro de ambientes, cuyo modelo se representa como:
Yijk= µ + Ai + Rj (Ai)+ GK +AiGk + Εijk
Donde: Yijk= valor observado de la j-ésima repetición anidada en el i-ésimo ambiente en el i-ésimo en el k-ésimo genotipo; µ= efecto de la media general; Ai= efecto deL i-ésimo
centrifuged for 5 min at 5 000 rpm; 1 ml of the sample was taken and placed in the cells, identifying each; 2 ml of acetone was added to each cell and exposed in the spectrophotometer to obtain the corresponding absorbance reading; for physiological variables photosynthetic apparatus (LI-6200) which measures the exchange of CO2 from the atmosphere to the leaf area of the crop, taking this data when the crop was at the phenological stage of fruiting was used, selecting a plant randomly.
Experimental design
The experimental design was used in the three localities evaluation corresponded to design randomized blocks with two replications for yield characteristics and physiological and three replicates for quality, statistical analysis was performed as a combined analysis of localities, it was considered to genotypes as a fixed effect and random effect environments like trying on the F test against nesting replicates within environments, the model is represented as:
Yijk= µ + Ai + Rj (Ai)+ GK +AiGk + Εijk
Where: Yijk= observed value of the j-th replicate nested in the i-th environment in the i-th of the k-th genotype; μ= overall mean effect; Ai= effect of the i-th environment; Rj(Ai)= effect of the j-th replicate nested in the i-th environment; Gk= effect of the k-th genotype; AiGk= effect of the interaction of the i-th environment k-th genotype; Eijk= effect of experimental error; AMMI multivariate analysis was analysed by the method proposed program by Vargas and Crossa (2000), which of the following lines, as Zobel et al. (1988).
n
Yij= µ+gi+aj+Ʃλkαikγjk + Rij k=l
Where: Yij = observed value of the ith genotype in the jth environment; μ= general mean; gi= mean of the ith genotype least the general average; aj= mean of the jth environment minus the overall average; λk= square root of the characteristic value of the k-th axis of principal component analysis (PCA)k; αikγjk= ACP qualifications for the k-th axis of the ith genotype and jth environment; Ri= residual model.
Results and discussion
The combined analysis of variance (Table 3) shows significant differences in environments for DPC, PPF and YIELD variables indicating that genotypes behaved
(a)(0.088)(100)X= (b)(c)
771Estimación de la interacción genotipo-ambiente en tomate (Solanum lycopersicum L.) con el modelo AMMI
ambiente; Rj(Ai)= Efecto de la j-ésima repetición anidada en el i-ésimo ambiente; Gk= efecto de k-ésimo genotipo; AiGk= efecto de la interacción del i-ésimo ambiente del k-ésimo genotipo; Eijk= efecto del error experimental; el análisis multivariado AMMI se analizó mediante el programa propuesto por Vargas y Crossa (2000), el cual parte del siguiente modelo, según Zobel et al. (1988).
n
Yij= µ+gi+aj+Ʃλkαikγjk + Rij k=l
Donde: Yij= Valor observado del i-ésimo genotipo en el j-ésimo ambiente; µ= media general; gi= media del i-ésimo genotipo menos la media general; aj= media del j-ésimo ambiente menos la media general; λk= raíz cuadrada del valor característico del k-ésimo eje del análisis de componentes principales (ACP)k; αikγjk= calificaciones del ACP para el k-ésimo eje del i-ésimo genotipo y el j-ésimo ambiente; Rij= residual del modelo.
Resultados y discusión
El análisis de varianza combinado (Cuadro 3) muestra diferencias significativas en ambientes para las variables DPC, PPF y REND indicando que los genotipos se comportaron de forma diferente en los tres ambientes de evaluación, el rendimiento promedio fue de 43.71 t ha-1, siendo superior a lo reportado en 2011 que fue de 41.67 t ha-1( SIAP-SAGARPA, 2011) no siendo así para las variables fisiológicas, para el efecto de genotipos se observa diferencias significativas para DPC y PPF, en general podemos afirmar que al no existir diferencias en la IG x A los genotipos se comportaron de manera similar en los ambientes de evaluación para las variables de rendimiento y fisiológicas, esto es debido a que en general los ambientes de evaluación no tuvieron un efecto en la IG x A, Cuarteto y Cubero (1982) no encontraron diferencias significativas en la IG x A, del rendimiento total de 12 genotipos de tomate evaluados en cuatro ambientes mencionando que el uso de invernadero y campo abierto no tuvieron un efecto diferencial en la interacción.
Las condiciones climáticas afectan de manera sustancial el proceso fisiológico de la planta y esto tiene un efecto en el rendimiento total, en este trabajo la temperatura promedio durante el desarrollo del cultivo fue de 34.5 °C (Cuadro 2), Allen y Rudich (1978) indican que las altas temperaturas (más de 34 °C) provocan daños en la flor y
differently in the three environments evaluation, the average yield was 43.71 t ha-1, being higher than that reported in 2011 that was 41.67 t ha-1 (SIAP-SAGARPA, 2011) not so for physiological variables for the effect of genotypes significant differences for DPC and PPF is observed, in general we can say that at no be differences in the IG x A genotypes behaved similarly in the evaluation environments for yield variables and physiological, this is because in general the evaluation environments had no effect on the IG x A, Cuarteto and Cubero (1982) found no significant differences in the IG x A, the total yield of 12 tomato genotypes into four areas evaluated mentioning that the use of greenhouse and open field had no differential effect on the interaction.
Weather conditions substantially affect the physiological process of the plant and this has an effect on the overall yield, in this work the average temperature during the growing season was 34.5 °C (Table 2), Allen and Rudich (1978) indicated that high temperatures (over 34 °C) cause damage to flower and therefore in the number of tied fruits, as well as the quality of the fruit. Ortiz et al. (2007) refers, it is possible to select stable tomato genotypes, but genetic materials requires advanced development in a breeding program, evaluated in different seasons to identify stable genotypes with high yield.
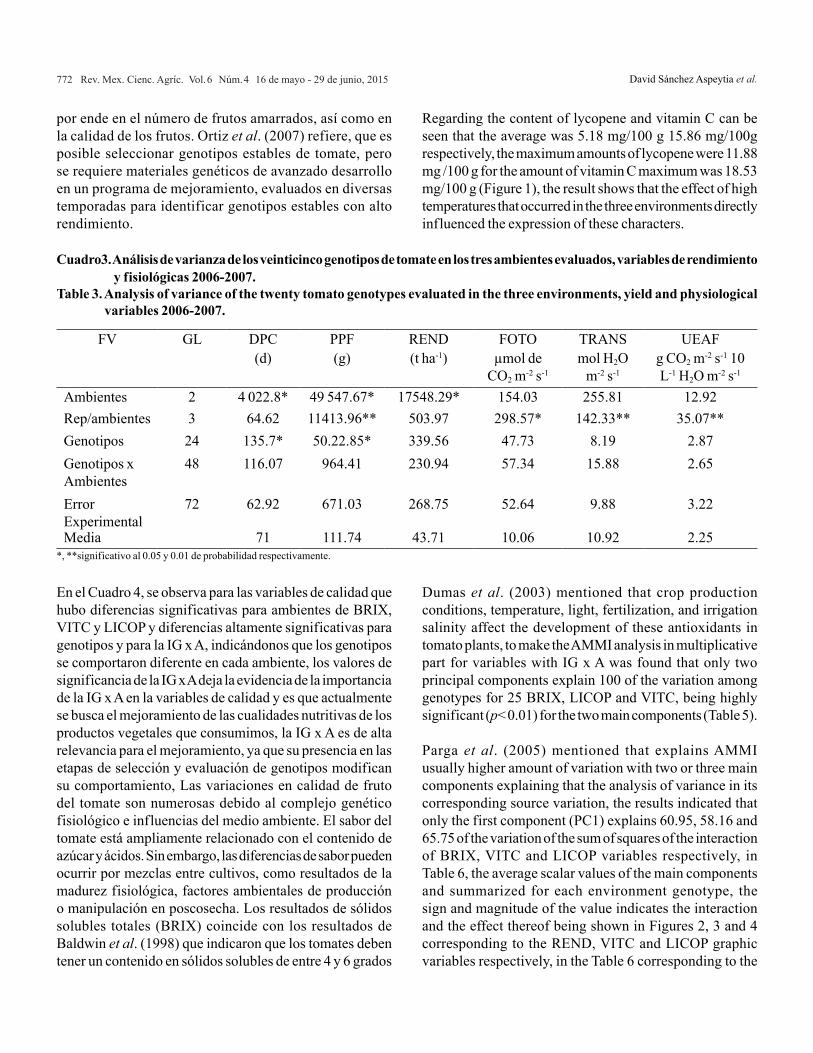
In the Table 4, it is noted for the quality variables that were significant differences for environments of Brix, VITC and LICOP and highly significant differences for genotypes and for IG x A, indicating that genotypes behaved differently in each environment, values significance of GI x A leaves the evidence of the importance of IG x A in quality variables and is currently improving the nutritional qualities of plant products we consume is sought, the IG x A is highly relevant for improvement, since its presence in the stages of selection and evaluation of genotypes modify their behaviour, variations in quality of tomato fruit are numerous due to physiological and genetic complex environmental influences. The tomato flavour is largely related to the content of sugar and acids. However, f lavour differences can occur between crop mixtures, as a result of physiological maturity, environmental factors of production and postharvest handling. The results of total soluble solids (Brix) coincides with the results of Baldwin et al. (1998) who indicated that tomatoes should have a soluble solids content of between 4 and 6 degrees Brix and pH between 4 and 5. They believe that the relationship between the soluble solids and acidity are a good indicator for flavour and aroma of tomatoes and are the most important for the tomato industry parameters.
772 Rev. Mex. Cienc. Agríc. Vol.6 Núm.4 16 de mayo - 29 de junio, 2015 David Sánchez Aspeytia et al.
por ende en el número de frutos amarrados, así como en la calidad de los frutos. Ortiz et al. (2007) refiere, que es posible seleccionar genotipos estables de tomate, pero se requiere materiales genéticos de avanzado desarrollo en un programa de mejoramiento, evaluados en diversas temporadas para identificar genotipos estables con alto rendimiento.
En el Cuadro 4, se observa para las variables de calidad que hubo diferencias significativas para ambientes de BRIX, VITC y LICOP y diferencias altamente significativas para genotipos y para la IG x A, indicándonos que los genotipos se comportaron diferente en cada ambiente, los valores de significancia de la IG x A deja la evidencia de la importancia de la IG x A en la variables de calidad y es que actualmente se busca el mejoramiento de las cualidades nutritivas de los productos vegetales que consumimos, la IG x A es de alta relevancia para el mejoramiento, ya que su presencia en las etapas de selección y evaluación de genotipos modifican su comportamiento, Las variaciones en calidad de fruto del tomate son numerosas debido al complejo genético fisiológico e influencias del medio ambiente. El sabor del tomate está ampliamente relacionado con el contenido de azúcar y ácidos. Sin embargo, las diferencias de sabor pueden ocurrir por mezclas entre cultivos, como resultados de la madurez fisiológica, factores ambientales de producción o manipulación en poscosecha. Los resultados de sólidos solubles totales (BRIX) coincide con los resultados de Baldwin et al. (1998) que indicaron que los tomates deben tener un contenido en sólidos solubles de entre 4 y 6 grados
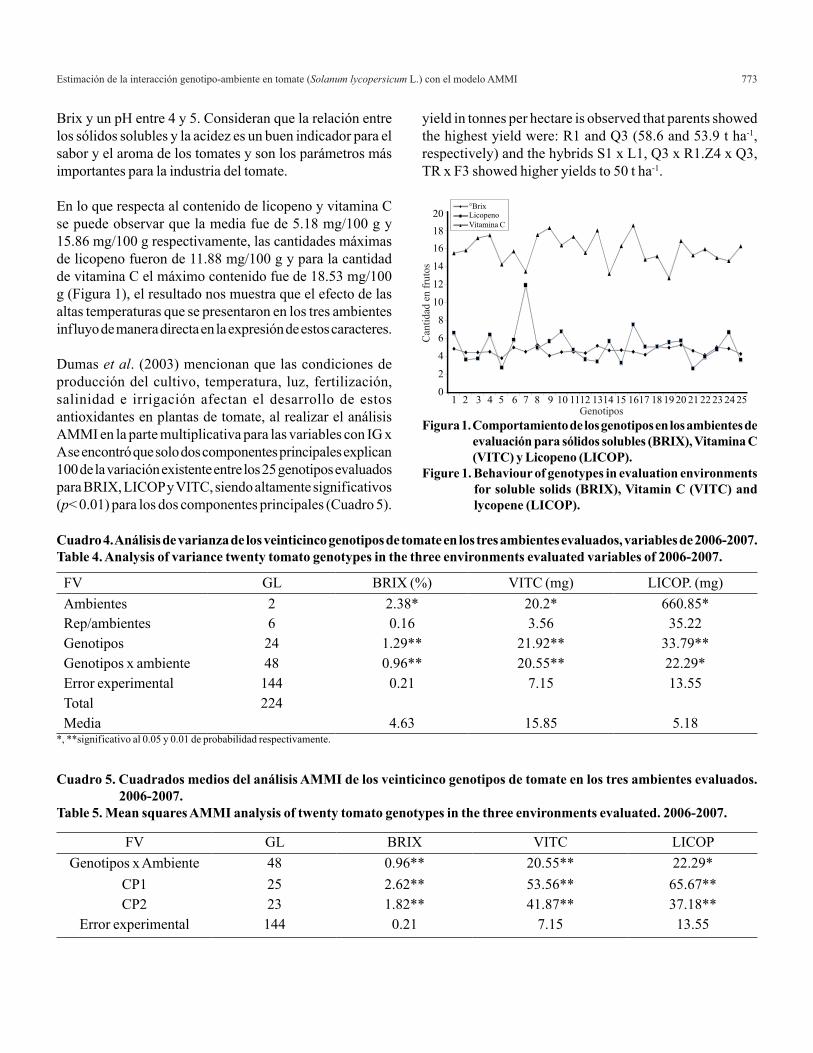
Regarding the content of lycopene and vitamin C can be seen that the average was 5.18 mg/100 g 15.86 mg/100g respectively, the maximum amounts of lycopene were 11.88 mg /100 g for the amount of vitamin C maximum was 18.53 mg/100 g (Figure 1), the result shows that the effect of high temperatures that occurred in the three environments directly influenced the expression of these characters.
Dumas et al. (2003) mentioned that crop production conditions, temperature, light, fertilization, and irrigation salinity affect the development of these antioxidants in tomato plants, to make the AMMI analysis in multiplicative part for variables with IG x A was found that only two principal components explain 100 of the variation among genotypes for 25 BRIX, LICOP and VITC, being highly significant (p< 0.01) for the two main components (Table 5).
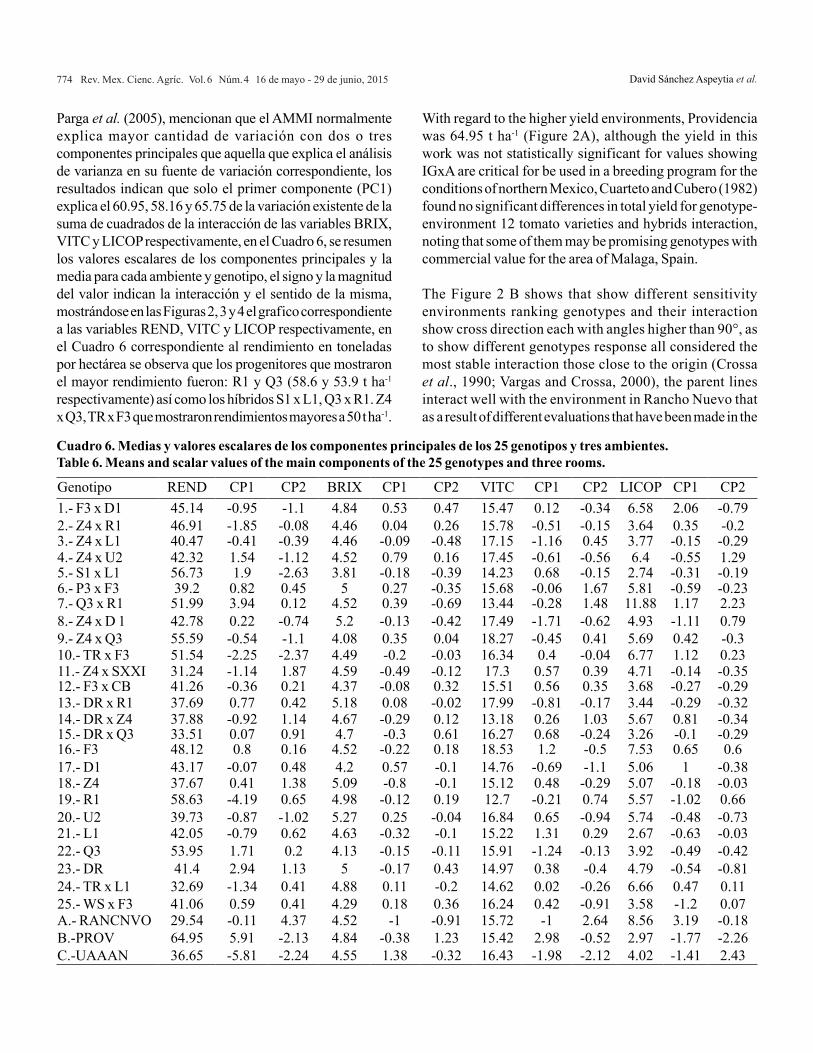
Parga et al. (2005) mentioned that explains AMMI usually higher amount of variation with two or three main components explaining that the analysis of variance in its corresponding source variation, the results indicated that only the first component (PC1) explains 60.95, 58.16 and 65.75 of the variation of the sum of squares of the interaction of BRIX, VITC and LICOP variables respectively, in Table 6, the average scalar values of the main components and summarized for each environment genotype, the sign and magnitude of the value indicates the interaction and the effect thereof being shown in Figures 2, 3 and 4 corresponding to the REND, VITC and LICOP graphic variables respectively, in the Table 6 corresponding to the
FV GL DPC PPF REND FOTO TRANS UEAF(d) (g) (t ha-1) µmol de
CO2 m-2 s-1mol H2O
m-2 s-1g CO2 m-2 s-1 10 L-1 H2O m-2 s-1
Ambientes 2 4 022.8* 49 547.67* 17548.29* 154.03 255.81 12.92Rep/ambientes 3 64.62 11413.96** 503.97 298.57* 142.33** 35.07**Genotipos 24 135.7* 50.22.85* 339.56 47.73 8.19 2.87Genotipos x Ambientes
48 116.07 964.41 230.94 57.34 15.88 2.65
Error Experimental
72 62.92 671.03 268.75 52.64 9.88 3.22
Media 71 111.74 43.71 10.06 10.92 2.25
Cuadro3. Análisis de varianza de los veinticinco genotipos de tomate en los tres ambientes evaluados, variables de rendimiento y fisiológicas 2006-2007.
Table 3. Analysis of variance of the twenty tomato genotypes evaluated in the three environments, yield and physiological variables 2006-2007.
*, **significativo al 0.05 y 0.01 de probabilidad respectivamente.
773Estimación de la interacción genotipo-ambiente en tomate (Solanum lycopersicum L.) con el modelo AMMI
Brix y un pH entre 4 y 5. Consideran que la relación entre los sólidos solubles y la acidez es un buen indicador para el sabor y el aroma de los tomates y son los parámetros más importantes para la industria del tomate.
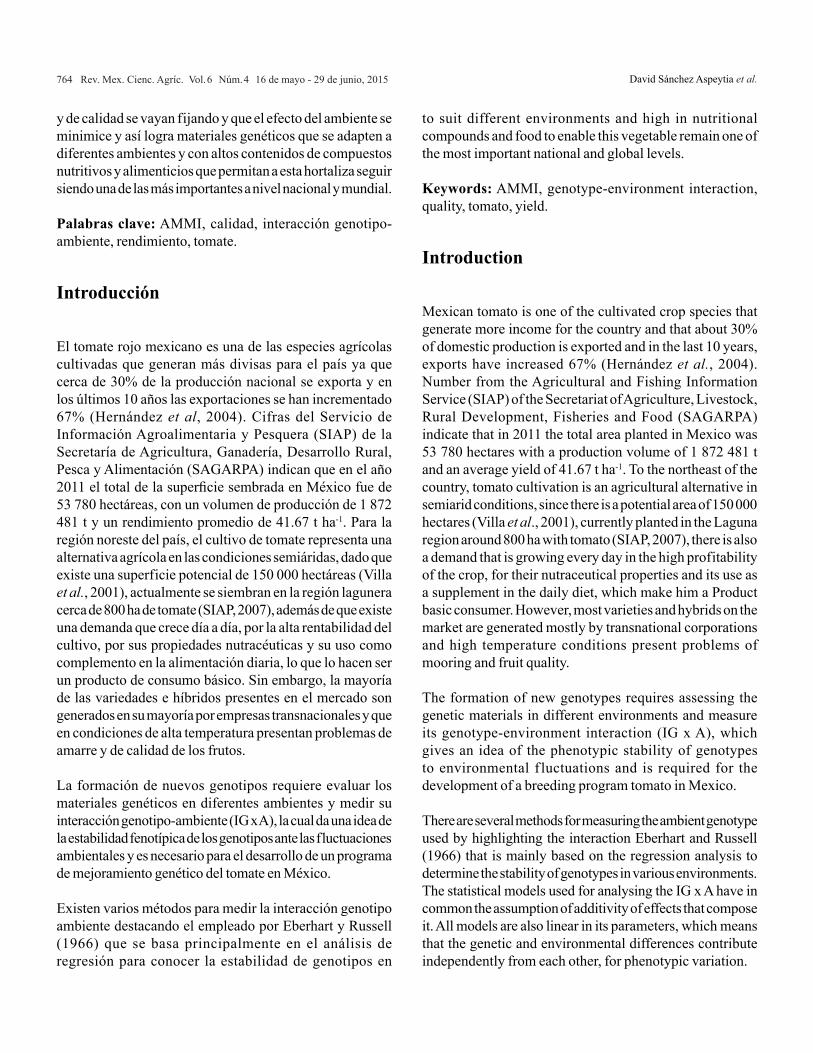
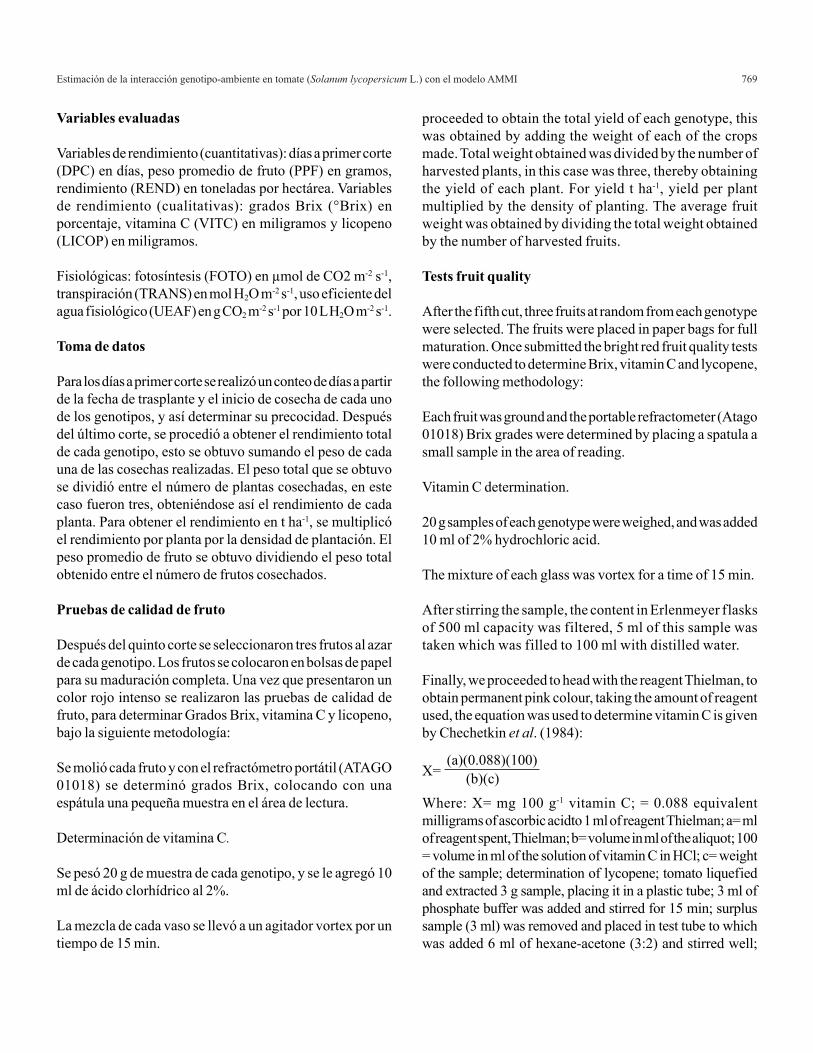
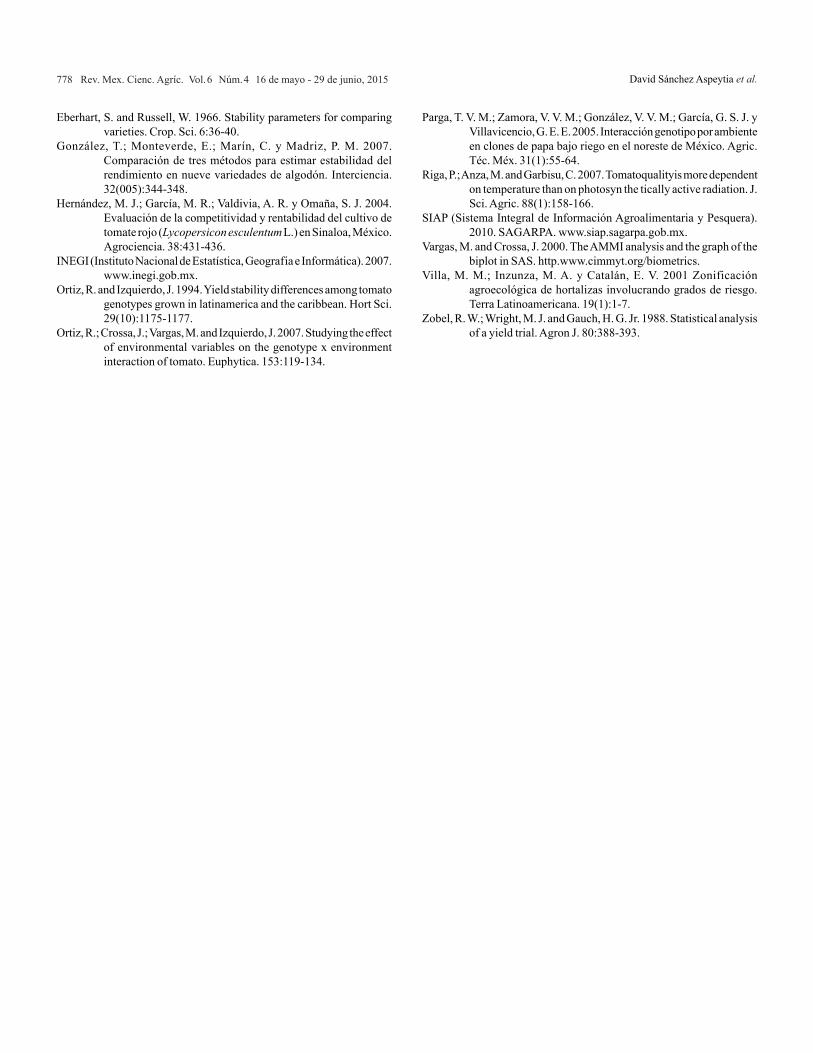
En lo que respecta al contenido de licopeno y vitamina C se puede observar que la media fue de 5.18 mg/100 g y 15.86 mg/100 g respectivamente, las cantidades máximas de licopeno fueron de 11.88 mg/100 g y para la cantidad de vitamina C el máximo contenido fue de 18.53 mg/100 g (Figura 1), el resultado nos muestra que el efecto de las altas temperaturas que se presentaron en los tres ambientes influyo de manera directa en la expresión de estos caracteres.
Dumas et al. (2003) mencionan que las condiciones de producción del cultivo, temperatura, luz, fertilización, salinidad e irrigación afectan el desarrollo de estos antioxidantes en plantas de tomate, al realizar el análisis AMMI en la parte multiplicativa para las variables con IG x A se encontró que solo dos componentes principales explican 100 de la variación existente entre los 25 genotipos evaluados para BRIX, LICOP y VITC, siendo altamente significativos (p< 0.01) para los dos componentes principales (Cuadro 5).
yield in tonnes per hectare is observed that parents showed the highest yield were: R1 and Q3 (58.6 and 53.9 t ha-1, respectively) and the hybrids S1 x L1, Q3 x R1.Z4 x Q3, TR x F3 showed higher yields to 50 t ha-1.
FV GL BRIX (%) VITC (mg) LICOP. (mg)Ambientes 2 2.38* 20.2* 660.85*Rep/ambientes 6 0.16 3.56 35.22Genotipos 24 1.29** 21.92** 33.79**Genotipos x ambiente 48 0.96** 20.55** 22.29*Error experimental 144 0.21 7.15 13.55Total 224Media 4.63 15.85 5.18
Cuadro 4. Análisis de varianza de los veinticinco genotipos de tomate en los tres ambientes evaluados, variables de 2006-2007.Table 4. Analysis of variance twenty tomato genotypes in the three environments evaluated variables of 2006-2007.
*, **significativo al 0.05 y 0.01 de probabilidad respectivamente.
Figura 1. Comportamiento de los genotipos en los ambientes de evaluación para sólidos solubles (BRIX), Vitamina C (VITC) y Licopeno (LICOP).
Figure 1. Behaviour of genotypes in evaluation environments for soluble solids (BRIX), Vitamin C (VITC) and lycopene (LICOP).
Can
tidad
en
frut
osGenotipos
1 2 3 4 5 6 7 8 9 10 1112 1314 15 1617 18 19 20 21 22 23 24 25
201816
14
12
10
8
6
4
2
0
°BrixLicopenoVitamina C
FV GL BRIX VITC LICOPGenotipos x Ambiente 48 0.96** 20.55** 22.29*
CP1 25 2.62** 53.56** 65.67**CP2 23 1.82** 41.87** 37.18**
Error experimental 144 0.21 7.15 13.55
Cuadro 5. Cuadrados medios del análisis AMMI de los veinticinco genotipos de tomate en los tres ambientes evaluados. 2006-2007.
Table 5. Mean squares AMMI analysis of twenty tomato genotypes in the three environments evaluated. 2006-2007.
774 Rev. Mex. Cienc. Agríc. Vol.6 Núm.4 16 de mayo - 29 de junio, 2015 David Sánchez Aspeytia et al.
Parga et al. (2005), mencionan que el AMMI normalmente explica mayor cantidad de variación con dos o tres componentes principales que aquella que explica el análisis de varianza en su fuente de variación correspondiente, los resultados indican que solo el primer componente (PC1) explica el 60.95, 58.16 y 65.75 de la variación existente de la suma de cuadrados de la interacción de las variables BRIX, VITC y LICOP respectivamente, en el Cuadro 6, se resumen los valores escalares de los componentes principales y la media para cada ambiente y genotipo, el signo y la magnitud del valor indican la interacción y el sentido de la misma, mostrándose en las Figuras 2, 3 y 4 el grafico correspondiente a las variables REND, VITC y LICOP respectivamente, en el Cuadro 6 correspondiente al rendimiento en toneladas por hectárea se observa que los progenitores que mostraron el mayor rendimiento fueron: R1 y Q3 (58.6 y 53.9 t ha-1
respectivamente) así como los híbridos S1 x L1, Q3 x R1. Z4 x Q3, TR x F3 que mostraron rendimientos mayores a 50 t ha-1.
With regard to the higher yield environments, Providencia was 64.95 t ha-1 (Figure 2A), although the yield in this work was not statistically significant for values showing IGxA are critical for be used in a breeding program for the conditions of northern Mexico, Cuarteto and Cubero (1982) found no significant differences in total yield for genotype-environment 12 tomato varieties and hybrids interaction, noting that some of them may be promising genotypes with commercial value for the area of Malaga, Spain.
The Figure 2 B shows that show different sensitivity environments ranking genotypes and their interaction show cross direction each with angles higher than 90°, as to show different genotypes response all considered the most stable interaction those close to the origin (Crossa et al., 1990; Vargas and Crossa, 2000), the parent lines interact well with the environment in Rancho Nuevo that as a result of different evaluations that have been made in the
Genotipo REND CP1 CP2 BRIX CP1 CP2 VITC CP1 CP2 LICOP CP1 CP21.- F3 x D1 45.14 -0.95 -1.1 4.84 0.53 0.47 15.47 0.12 -0.34 6.58 2.06 -0.792.- Z4 x R1 46.91 -1.85 -0.08 4.46 0.04 0.26 15.78 -0.51 -0.15 3.64 0.35 -0.23.- Z4 x L1 40.47 -0.41 -0.39 4.46 -0.09 -0.48 17.15 -1.16 0.45 3.77 -0.15 -0.294.- Z4 x U2 42.32 1.54 -1.12 4.52 0.79 0.16 17.45 -0.61 -0.56 6.4 -0.55 1.295.- S1 x L1 56.73 1.9 -2.63 3.81 -0.18 -0.39 14.23 0.68 -0.15 2.74 -0.31 -0.196.- P3 x F3 39.2 0.82 0.45 5 0.27 -0.35 15.68 -0.06 1.67 5.81 -0.59 -0.237.- Q3 x R1 51.99 3.94 0.12 4.52 0.39 -0.69 13.44 -0.28 1.48 11.88 1.17 2.238.- Z4 x D 1 42.78 0.22 -0.74 5.2 -0.13 -0.42 17.49 -1.71 -0.62 4.93 -1.11 0.799.- Z4 x Q3 55.59 -0.54 -1.1 4.08 0.35 0.04 18.27 -0.45 0.41 5.69 0.42 -0.310.- TR x F3 51.54 -2.25 -2.37 4.49 -0.2 -0.03 16.34 0.4 -0.04 6.77 1.12 0.2311.- Z4 x SXXI 31.24 -1.14 1.87 4.59 -0.49 -0.12 17.3 0.57 0.39 4.71 -0.14 -0.3512.- F3 x CB 41.26 -0.36 0.21 4.37 -0.08 0.32 15.51 0.56 0.35 3.68 -0.27 -0.2913.- DR x R1 37.69 0.77 0.42 5.18 0.08 -0.02 17.99 -0.81 -0.17 3.44 -0.29 -0.3214.- DR x Z4 37.88 -0.92 1.14 4.67 -0.29 0.12 13.18 0.26 1.03 5.67 0.81 -0.3415.- DR x Q3 33.51 0.07 0.91 4.7 -0.3 0.61 16.27 0.68 -0.24 3.26 -0.1 -0.2916.- F3 48.12 0.8 0.16 4.52 -0.22 0.18 18.53 1.2 -0.5 7.53 0.65 0.617.- D1 43.17 -0.07 0.48 4.2 0.57 -0.1 14.76 -0.69 -1.1 5.06 1 -0.3818.- Z4 37.67 0.41 1.38 5.09 -0.8 -0.1 15.12 0.48 -0.29 5.07 -0.18 -0.0319.- R1 58.63 -4.19 0.65 4.98 -0.12 0.19 12.7 -0.21 0.74 5.57 -1.02 0.6620.- U2 39.73 -0.87 -1.02 5.27 0.25 -0.04 16.84 0.65 -0.94 5.74 -0.48 -0.7321.- L1 42.05 -0.79 0.62 4.63 -0.32 -0.1 15.22 1.31 0.29 2.67 -0.63 -0.0322.- Q3 53.95 1.71 0.2 4.13 -0.15 -0.11 15.91 -1.24 -0.13 3.92 -0.49 -0.4223.- DR 41.4 2.94 1.13 5 -0.17 0.43 14.97 0.38 -0.4 4.79 -0.54 -0.8124.- TR x L1 32.69 -1.34 0.41 4.88 0.11 -0.2 14.62 0.02 -0.26 6.66 0.47 0.1125.- WS x F3 41.06 0.59 0.41 4.29 0.18 0.36 16.24 0.42 -0.91 3.58 -1.2 0.07A.- RANCNVO 29.54 -0.11 4.37 4.52 -1 -0.91 15.72 -1 2.64 8.56 3.19 -0.18B.-PROV 64.95 5.91 -2.13 4.84 -0.38 1.23 15.42 2.98 -0.52 2.97 -1.77 -2.26C.-UAAAN 36.65 -5.81 -2.24 4.55 1.38 -0.32 16.43 -1.98 -2.12 4.02 -1.41 2.43
Cuadro 6. Medias y valores escalares de los componentes principales de los 25 genotipos y tres ambientes.Table 6. Means and scalar values of the main components of the 25 genotypes and three rooms.
775Estimación de la interacción genotipo-ambiente en tomate (Solanum lycopersicum L.) con el modelo AMMI
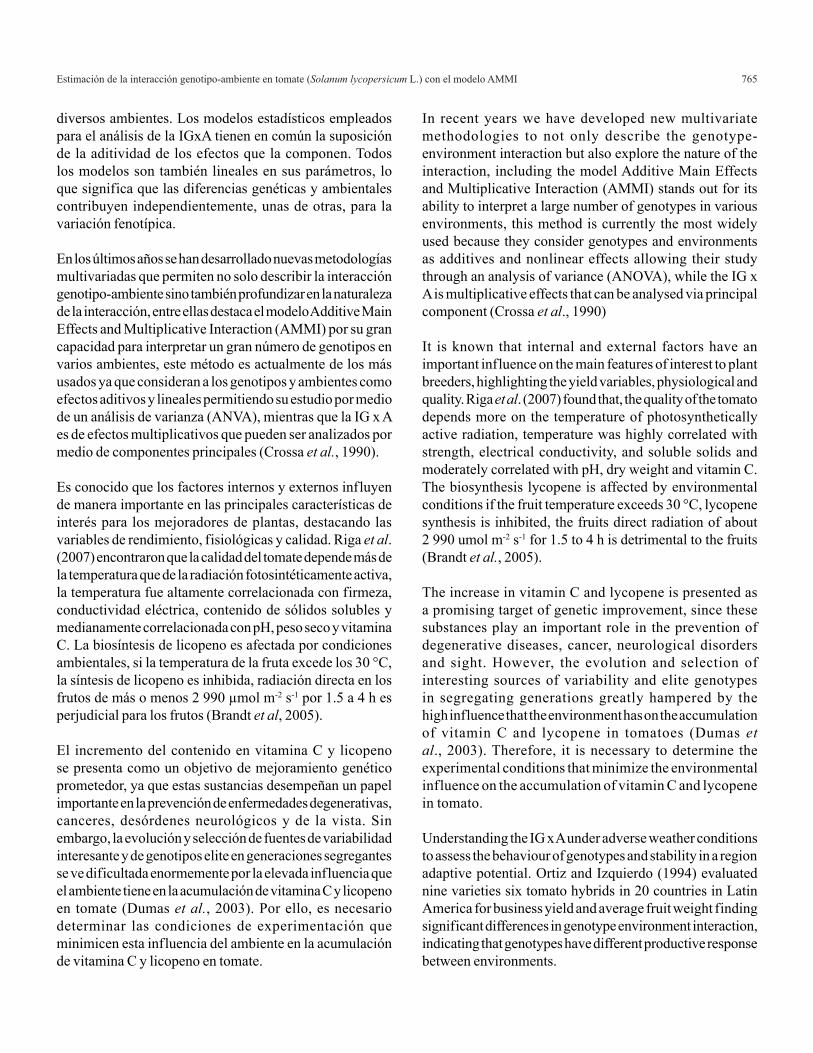
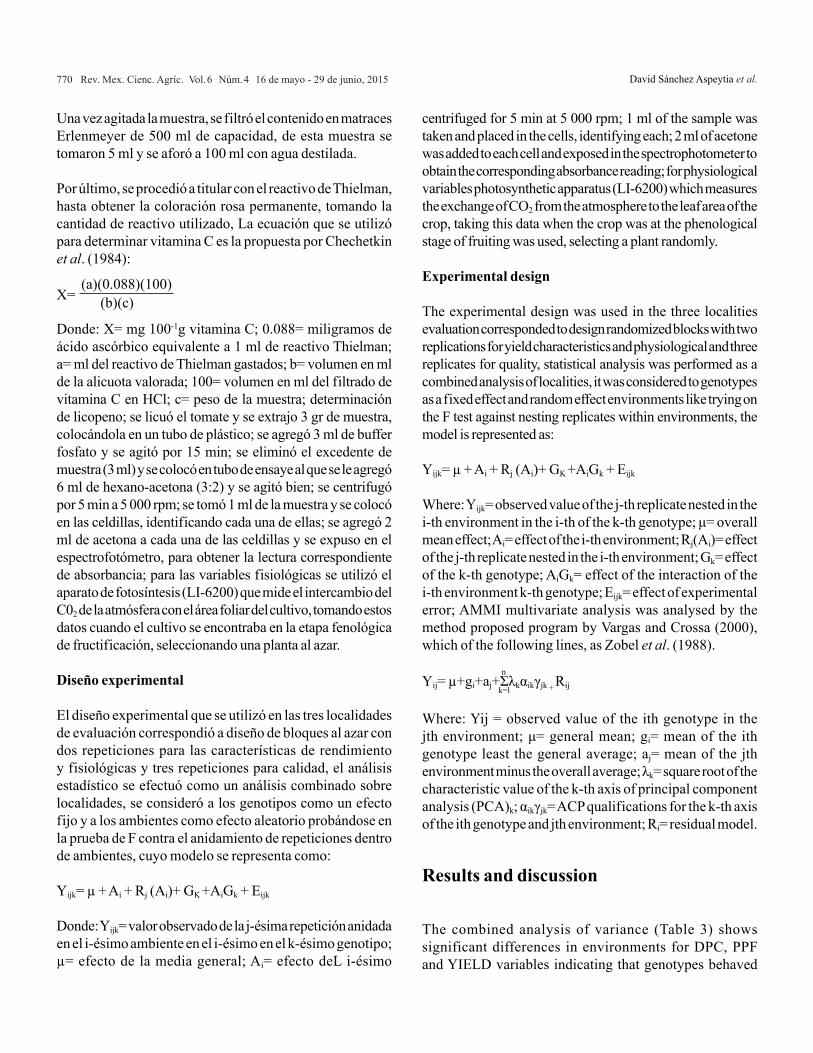
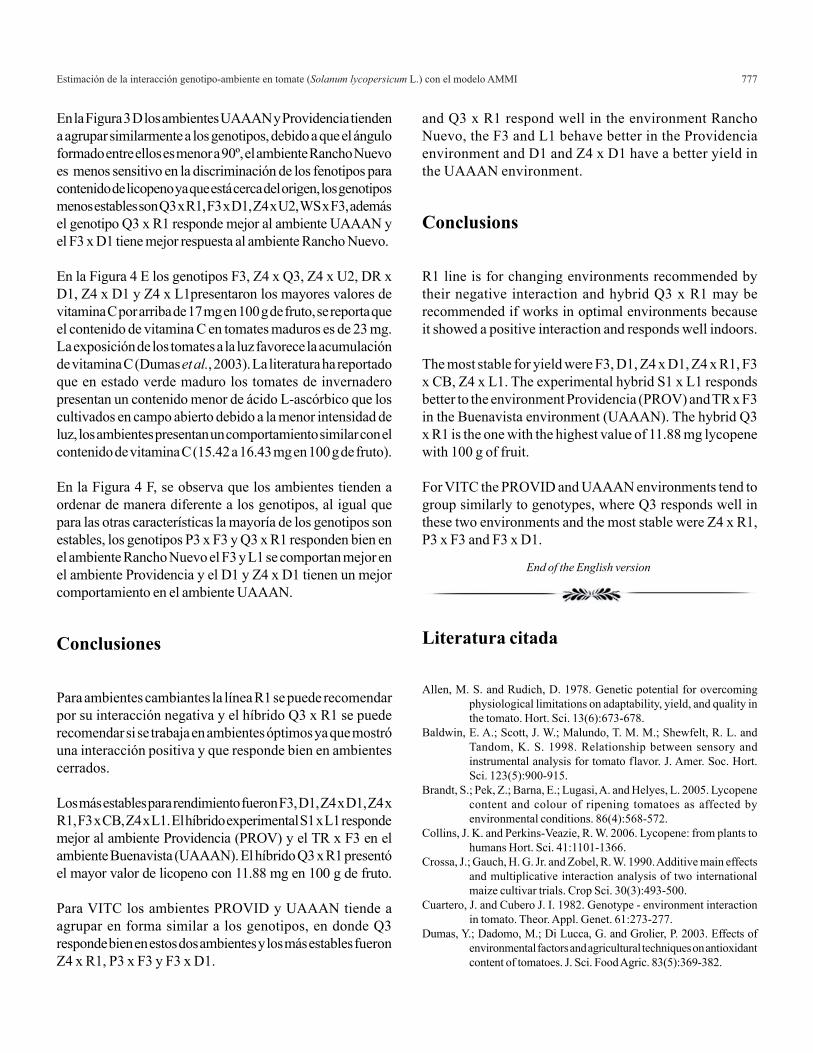
Figura 4 (E, F) Distribución de los genotipos en los ambientes de evaluación para vitamina C, de acuerdo al análisis AMMI.Figure 4 (E, F) genotype distribution in the environment assessment for vitamin C, according to the AMMI analysis.
VITC (mg)
4
3
2
1
0
-1
-2
-312 13 14 15 16 17 18 19
CP1
3
2
1
0
-1
-2
-3-3 -2 -1 0 1 2 3 4
CP1
CP2
4 E) 4 F)
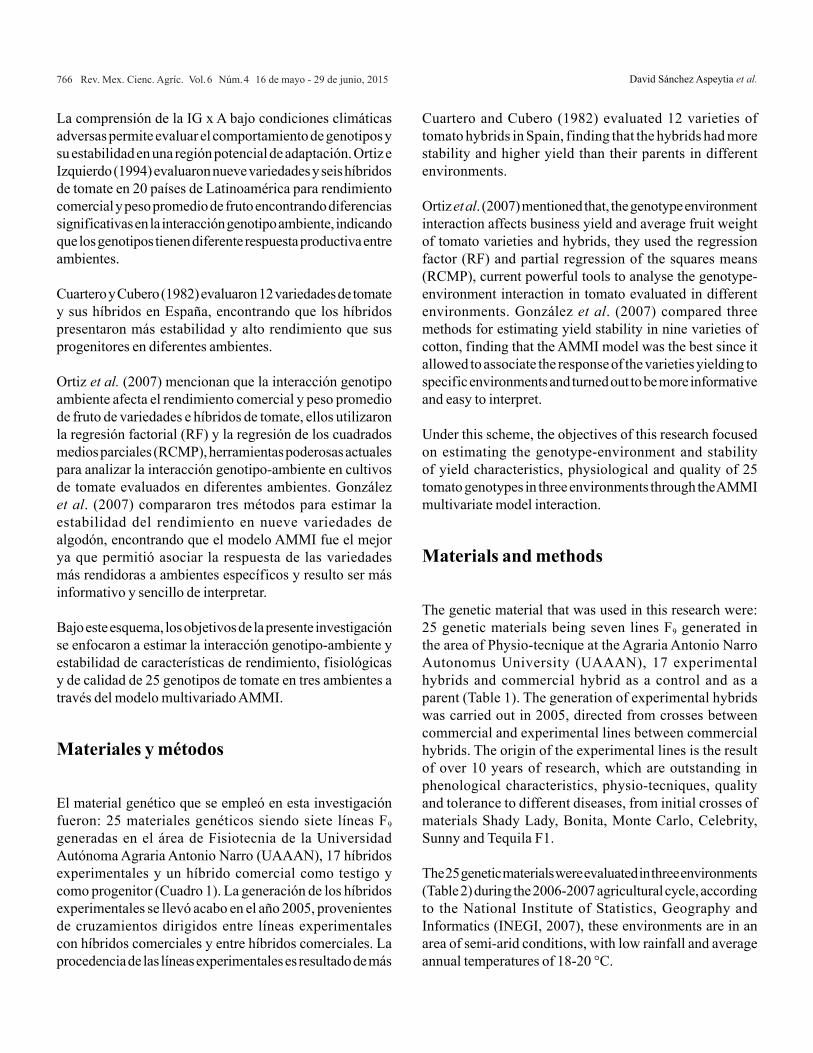
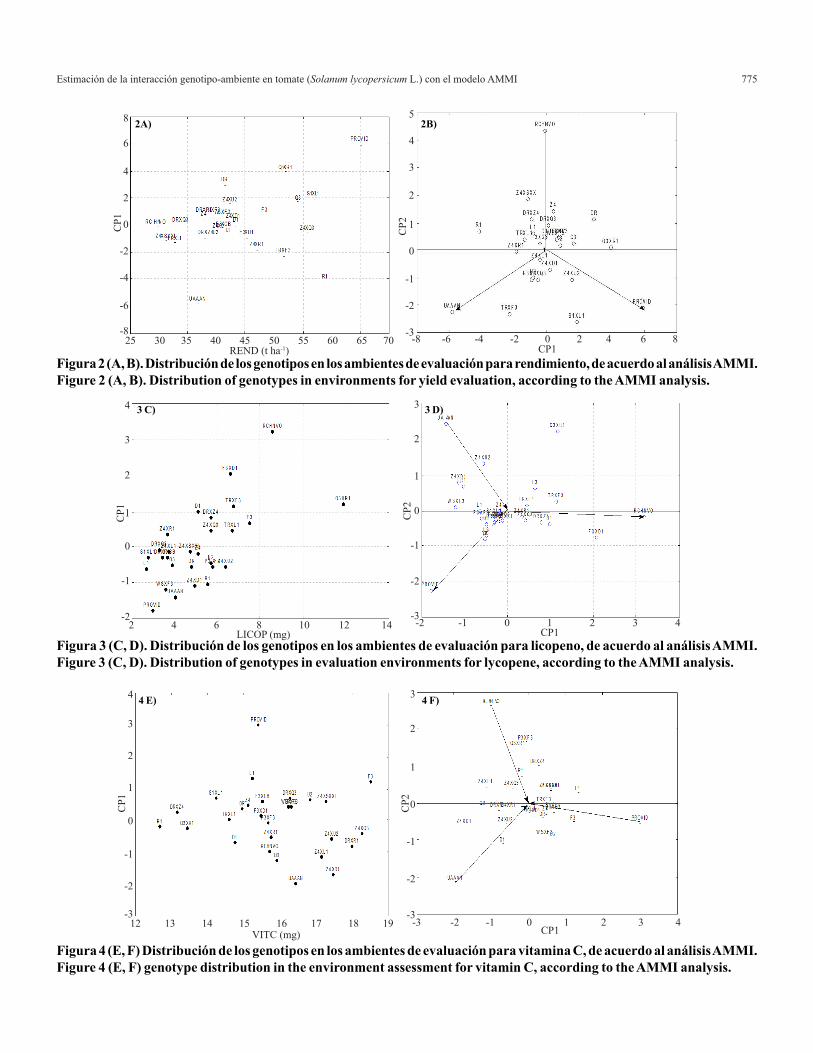
Figura 2 (A, B). Distribución de los genotipos en los ambientes de evaluación para rendimiento, de acuerdo al análisis AMMI.Figure 2 (A, B). Distribution of genotypes in environments for yield evaluation, according to the AMMI analysis.
5
4
3
2
1
0
-1
-2
-3-8 -6 -4 -2 0 2 4 6 8CP1
CP2
8
6
4
2
0
-2
-4
-6
-8
CP1
25 30 35 40 45 50 55 60 65 70REND (t ha-1)
2A) 2B)
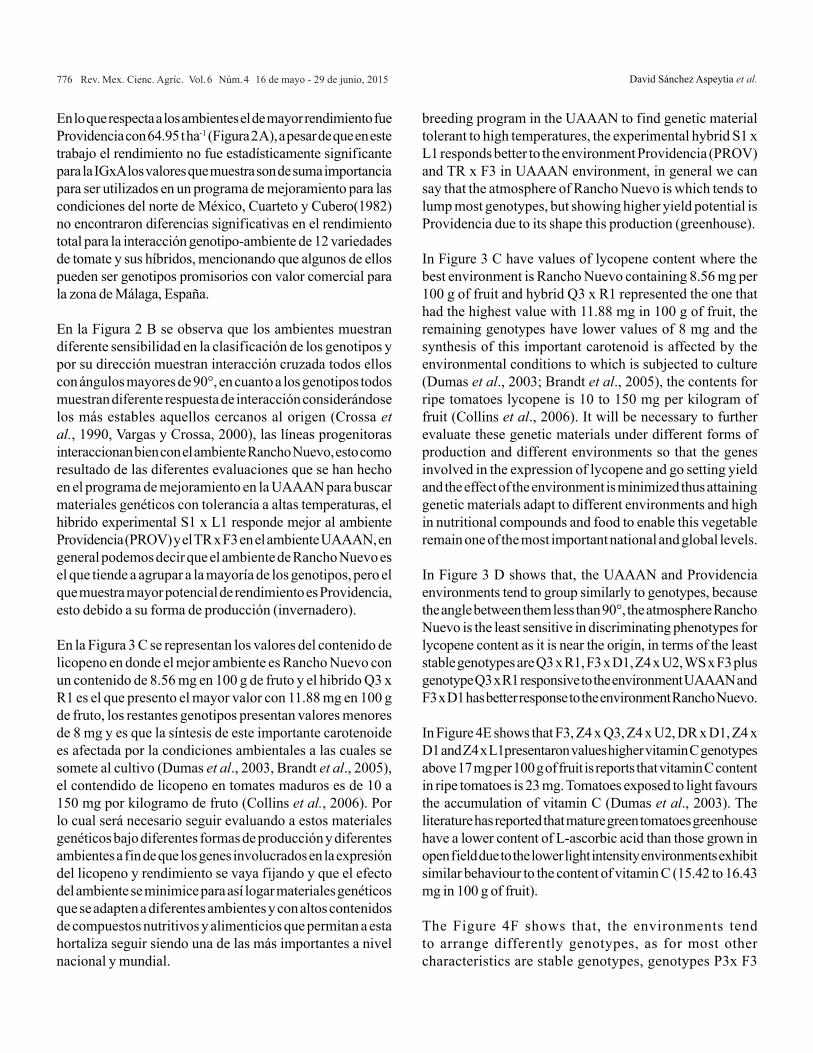
Figura 3 (C, D). Distribución de los genotipos en los ambientes de evaluación para licopeno, de acuerdo al análisis AMMI.Figure 3 (C, D). Distribution of genotypes in evaluation environments for lycopene, according to the AMMI analysis.
4
3
2
1
0
-1
-2
CP1
2 4 6 8 10 12 14
3
2
1
0
-1
-2
-3-2 -1 0 1 2 3 4CP1
CP2
LICOP (mg)
3 C) 3 D)
776 Rev. Mex. Cienc. Agríc. Vol.6 Núm.4 16 de mayo - 29 de junio, 2015 David Sánchez Aspeytia et al.
En lo que respecta a los ambientes el de mayor rendimiento fue Providencia con 64.95 t ha-1 (Figura 2 A), a pesar de que en este trabajo el rendimiento no fue estadísticamente significante para la IGxA los valores que muestra son de suma importancia para ser utilizados en un programa de mejoramiento para las condiciones del norte de México, Cuarteto y Cubero(1982) no encontraron diferencias significativas en el rendimiento total para la interacción genotipo-ambiente de 12 variedades de tomate y sus híbridos, mencionando que algunos de ellos pueden ser genotipos promisorios con valor comercial para la zona de Málaga, España.
En la Figura 2 B se observa que los ambientes muestran diferente sensibilidad en la clasificación de los genotipos y por su dirección muestran interacción cruzada todos ellos con ángulos mayores de 90°, en cuanto a los genotipos todos muestran diferente respuesta de interacción considerándose los más estables aquellos cercanos al origen (Crossa et al., 1990, Vargas y Crossa, 2000), las líneas progenitoras interaccionan bien con el ambiente Rancho Nuevo, esto como resultado de las diferentes evaluaciones que se han hecho en el programa de mejoramiento en la UAAAN para buscar materiales genéticos con tolerancia a altas temperaturas, el hibrido experimental S1 x L1 responde mejor al ambiente Providencia (PROV) y el TR x F3 en el ambiente UAAAN, en general podemos decir que el ambiente de Rancho Nuevo es el que tiende a agrupar a la mayoría de los genotipos, pero el que muestra mayor potencial de rendimiento es Providencia, esto debido a su forma de producción (invernadero).
En la Figura 3 C se representan los valores del contenido de licopeno en donde el mejor ambiente es Rancho Nuevo con un contenido de 8.56 mg en 100 g de fruto y el hibrido Q3 x R1 es el que presento el mayor valor con 11.88 mg en 100 g de fruto, los restantes genotipos presentan valores menores de 8 mg y es que la síntesis de este importante carotenoide es afectada por la condiciones ambientales a las cuales se somete al cultivo (Dumas et al., 2003, Brandt et al., 2005), el contendido de licopeno en tomates maduros es de 10 a 150 mg por kilogramo de fruto (Collins et al., 2006). Por lo cual será necesario seguir evaluando a estos materiales genéticos bajo diferentes formas de producción y diferentes ambientes a fin de que los genes involucrados en la expresión del licopeno y rendimiento se vaya fijando y que el efecto del ambiente se minimice para así logar materiales genéticos que se adapten a diferentes ambientes y con altos contenidos de compuestos nutritivos y alimenticios que permitan a esta hortaliza seguir siendo una de las más importantes a nivel nacional y mundial.
breeding program in the UAAAN to find genetic material tolerant to high temperatures, the experimental hybrid S1 x L1 responds better to the environment Providencia (PROV) and TR x F3 in UAAAN environment, in general we can say that the atmosphere of Rancho Nuevo is which tends to lump most genotypes, but showing higher yield potential is Providencia due to its shape this production (greenhouse).
In Figure 3 C have values of lycopene content where the best environment is Rancho Nuevo containing 8.56 mg per 100 g of fruit and hybrid Q3 x R1 represented the one that had the highest value with 11.88 mg in 100 g of fruit, the remaining genotypes have lower values of 8 mg and the synthesis of this important carotenoid is affected by the environmental conditions to which is subjected to culture (Dumas et al., 2003; Brandt et al., 2005), the contents for ripe tomatoes lycopene is 10 to 150 mg per kilogram of fruit (Collins et al., 2006). It will be necessary to further evaluate these genetic materials under different forms of production and different environments so that the genes involved in the expression of lycopene and go setting yield and the effect of the environment is minimized thus attaining genetic materials adapt to different environments and high in nutritional compounds and food to enable this vegetable remain one of the most important national and global levels.
In Figure 3 D shows that, the UAAAN and Providencia environments tend to group similarly to genotypes, because the angle between them less than 90°, the atmosphere Rancho Nuevo is the least sensitive in discriminating phenotypes for lycopene content as it is near the origin, in terms of the least stable genotypes are Q3 x R1, F3 x D1, Z4 x U2, WS x F3 plus genotype Q3 x R1 responsive to the environment UAAAN and F3 x D1 has better response to the environment Rancho Nuevo.
In Figure 4E shows that F3, Z4 x Q3, Z4 x U2, DR x D1, Z4 x D1 and Z4 x L1presentaron values higher vitamin C genotypes above 17 mg per 100 g of fruit is reports that vitamin C content in ripe tomatoes is 23 mg. Tomatoes exposed to light favours the accumulation of vitamin C (Dumas et al., 2003). The literature has reported that mature green tomatoes greenhouse have a lower content of L-ascorbic acid than those grown in open field due to the lower light intensity environments exhibit similar behaviour to the content of vitamin C (15.42 to 16.43 mg in 100 g of fruit).
The Figure 4F shows that, the environments tend to arrange differently genotypes, as for most other characteristics are stable genotypes, genotypes P3x F3
777Estimación de la interacción genotipo-ambiente en tomate (Solanum lycopersicum L.) con el modelo AMMI
En la Figura 3 D los ambientes UAAAN y Providencia tienden a agrupar similarmente a los genotipos, debido a que el ángulo formado entre ellos es menor a 90º, el ambiente Rancho Nuevo es menos sensitivo en la discriminación de los fenotipos para contenido de licopeno ya que está cerca del origen, los genotipos menos estables son Q3 x R1, F3 x D1, Z4 x U2, WS x F3, además el genotipo Q3 x R1 responde mejor al ambiente UAAAN y el F3 x D1 tiene mejor respuesta al ambiente Rancho Nuevo.
En la Figura 4 E los genotipos F3, Z4 x Q3, Z4 x U2, DR x D1, Z4 x D1 y Z4 x L1presentaron los mayores valores de vitamina C por arriba de 17 mg en 100 g de fruto, se reporta que el contenido de vitamina C en tomates maduros es de 23 mg. La exposición de los tomates a la luz favorece la acumulación de vitamina C (Dumas et al., 2003). La literatura ha reportado que en estado verde maduro los tomates de invernadero presentan un contenido menor de ácido L-ascórbico que los cultivados en campo abierto debido a la menor intensidad de luz, los ambientes presentan un comportamiento similar con el contenido de vitamina C (15.42 a 16.43 mg en 100 g de fruto).
En la Figura 4 F, se observa que los ambientes tienden a ordenar de manera diferente a los genotipos, al igual que para las otras características la mayoría de los genotipos son estables, los genotipos P3 x F3 y Q3 x R1 responden bien en el ambiente Rancho Nuevo el F3 y L1 se comportan mejor en el ambiente Providencia y el D1 y Z4 x D1 tienen un mejor comportamiento en el ambiente UAAAN.
Conclusiones
Para ambientes cambiantes la línea R1 se puede recomendar por su interacción negativa y el híbrido Q3 x R1 se puede recomendar si se trabaja en ambientes óptimos ya que mostró una interacción positiva y que responde bien en ambientes cerrados.
Los más estables para rendimiento fueron F3, D1, Z4 x D1, Z4 x R1, F3 x CB, Z4 x L1. El híbrido experimental S1 x L1 responde mejor al ambiente Providencia (PROV) y el TR x F3 en el ambiente Buenavista (UAAAN). El híbrido Q3 x R1 presentó el mayor valor de licopeno con 11.88 mg en 100 g de fruto.
Para VITC los ambientes PROVID y UAAAN tiende a agrupar en forma similar a los genotipos, en donde Q3 responde bien en estos dos ambientes y los más estables fueron Z4 x R1, P3 x F3 y F3 x D1.
and Q3 x R1 respond well in the environment Rancho Nuevo, the F3 and L1 behave better in the Providencia environment and D1 and Z4 x D1 have a better yield in the UAAAN environment.
Conclusions
R1 line is for changing environments recommended by their negative interaction and hybrid Q3 x R1 may be recommended if works in optimal environments because it showed a positive interaction and responds well indoors.
The most stable for yield were F3, D1, Z4 x D1, Z4 x R1, F3 x CB, Z4 x L1. The experimental hybrid S1 x L1 responds better to the environment Providencia (PROV) and TR x F3 in the Buenavista environment (UAAAN). The hybrid Q3 x R1 is the one with the highest value of 11.88 mg lycopene with 100 g of fruit.
For VITC the PROVID and UAAAN environments tend to group similarly to genotypes, where Q3 responds well in these two environments and the most stable were Z4 x R1, P3 x F3 and F3 x D1.
Literatura citada
Allen, M. S. and Rudich, D. 1978. Genetic potential for overcoming physiological limitations on adaptability, yield, and quality in the tomato. Hort. Sci. 13(6):673-678.
Baldwin, E. A.; Scott, J. W.; Malundo, T. M. M.; Shewfelt, R. L. and Tandom, K. S. 1998. Relationship between sensory and instrumental analysis for tomato flavor. J. Amer. Soc. Hort. Sci. 123(5):900-915.
Brandt, S.; Pek, Z.; Barna, E.; Lugasi, A. and Helyes, L. 2005. Lycopene content and colour of ripening tomatoes as affected by environmental conditions. 86(4):568-572.
Collins, J. K. and Perkins-Veazie, R. W. 2006. Lycopene: from plants to humans Hort. Sci. 41:1101-1366.
Crossa, J.; Gauch, H. G. Jr. and Zobel, R. W. 1990. Additive main effects and multiplicative interaction analysis of two international maize cultivar trials. Crop Sci. 30(3):493-500.
Cuartero, J. and Cubero J. I. 1982. Genotype - environment interaction in tomato. Theor. Appl. Genet. 61:273-277.
Dumas, Y.; Dadomo, M.; Di Lucca, G. and Grolier, P. 2003. Effects of environmental factors and agricultural techniques on antioxidant content of tomatoes. J. Sci. Food Agric. 83(5):369-382.
End of the English version
778 Rev. Mex. Cienc. Agríc. Vol.6 Núm.4 16 de mayo - 29 de junio, 2015 David Sánchez Aspeytia et al.
Eberhart, S. and Russell, W. 1966. Stability parameters for comparing varieties. Crop. Sci. 6:36-40.
González, T.; Monteverde, E.; Marín, C. y Madriz, P. M. 2007. Comparación de tres métodos para estimar estabilidad del rendimiento en nueve variedades de algodón. Interciencia. 32(005):344-348.
Hernández, M. J.; García, M. R.; Valdivia, A. R. y Omaña, S. J. 2004. Evaluación de la competitividad y rentabilidad del cultivo de tomate rojo (Lycopersicon esculentum L.) en Sinaloa, México. Agrociencia. 38:431-436.
INEGI (Instituto Nacional de Estatística, Geografia e Informática). 2007. www.inegi.gob.mx.
Ortiz, R. and Izquierdo, J. 1994. Yield stability differences among tomato genotypes grown in latinamerica and the caribbean. Hort Sci. 29(10):1175-1177.
Ortiz, R.; Crossa, J.; Vargas, M. and Izquierdo, J. 2007. Studying the effect of environmental variables on the genotype x environment interaction of tomato. Euphytica. 153:119-134.
Parga, T. V. M.; Zamora, V. V. M.; González, V. V. M.; García, G. S. J. y Villavicencio, G. E. E. 2005. Interacción genotipo por ambiente en clones de papa bajo riego en el noreste de México. Agric. Téc. Méx. 31(1):55-64.
Riga, P.; Anza, M. and Garbisu, C. 2007. Tomatoqualityis more dependent on temperature than on photosyn the tically active radiation. J. Sci. Agric. 88(1):158-166.
SIAP (Sistema Integral de Información Agroalimentaria y Pesquera). 2010. SAGARPA. www.siap.sagarpa.gob.mx.
Vargas, M. and Crossa, J. 2000. The AMMI analysis and the graph of the biplot in SAS. http.www.cimmyt.org/biometrics.
Villa, M. M.; Inzunza, M. A. y Catalán, E. V. 2001 Zonificación agroecológica de hortalizas involucrando grados de riesgo. Terra Latinoamericana. 19(1):1-7.
Zobel, R. W.; Wright, M. J. and Gauch, H. G. Jr. 1988. Statistical analysis of a yield trial. Agron J. 80:388-393.