Embed Size (px)
Citation preview
Engineering Structures 138 (2017) 394–409
Contents lists available at ScienceDirect
Engineering Structures
journal homepage: www.elsevier .com/locate /engstruct
Refined numerical modelling for the structural assessment ofsteel-concrete composite beam-to-column joints under seismic loads
http://dx.doi.org/10.1016/j.engstruct.2017.02.0370141-0296/� 2017 Elsevier Ltd. All rights reserved.
⇑ Corresponding author at: University of Trieste, Department of Engineering andArchitecture, Piazzale Europa 1, 34127 Trieste, Italy.
E-mail address: [email protected] (C. Bedon).
Claudio Amadio a, Chiara Bedon a,⇑, Marco Fasan a, Maria Rosa Pecce b
aUniversity of Trieste, Department of Engineering and Architecture, ItalybUniversity of Sannio, Department of Engineering, Italy
a r t i c l e i n f o a b s t r a c t
Article history:Received 31 July 2016Revised 17 November 2016Accepted 13 February 2017
Keywords:Steel-concrete composite jointsSeismic loadsFinite-Element numerical modellingExperimental testsDesign recommendationsResisting mechanisms
This paper proposes a refined Finite-Element (FE) numerical approach to predict both global and localbehaviour of steel-concrete composite welded joints subjected to seismic loads. The reference FE modelis implemented in ABAQUS and first extensively validated to the full-scale experimental results of awelded steel-concrete composite specimen tested in a past research project, where the beam-to-column sub-assemblages were designed according to the prescriptions of Eurocode 4 and Eurocode 8.As shown, due to the FE modelling assumptions, a rather close agreement was generally found betweenthe FE predictions and the corresponding test measurements, both in terms of global and local phenom-ena. Therefore, it is first expected that such numerical approach could be implemented as an alternativeto costly and time consuming full-scale experimental tests, allowing an extensive parametric investiga-tion of composite joints and possible design optimizations. An implicit advantage of the implemented FEmodel, in fact, is that according to a refined analysis of the experimental and numerical results for thewelded joint object of investigation, the efficiency of the Eurocode 8 design prescriptions for steel-concrete composite joint details can be critically discussed and reviewed. In the specific case, a possibleimprovement of the design recommendations for the slab reinforcement around the column is proposed.
� 2017 Elsevier Ltd. All rights reserved.
1. Introduction
The behaviour of composite joints is a major issue for steel-concrete composite moment resisting frames subjected to seismicloads; many studies [1–3] investigated their influence on the seis-mic response of frames considering different design strategies. Thecurrent design procedures are based on experimental results andnumerical analyses carried out by various researchers mainly inthe last 20 years.
The main results of tests on composite joints carried out until1989 are summarized in [4], then further monotonic and cyclictests have been carried out on various type of full-scale compositejoint sub-assemblages representing exterior and interior beam tocolumn connections [5–16].
The majority of tests past has been performed to study the stiff-ness, strength, ductility, and energy dissipation capacity of the sub-assemblages and emphasized the effects of deformation of thecomposite slab and the panel zone (e.g. [6]).
Simões et al. [8–9] focused on the identification of the concreteconfinement contribution on composite columns, as well as on theassessment of strength and stiffness degradation. Experimentaltests allowed then to study the effect of load path, identifyingthe corresponding failure modes and fitting the corresponding hys-teretic curves by means of the Richard-Abbott and Mazzolani mod-els [16–17].
Green et al. [10] showed that two failure modes must be consid-ered in the design of a composite joint subjected to large cyclicbidirectional loads: a ‘‘punch through” of the column web due toforce transfer from the ‘‘pinned” side of the connection and acrushing mechanism of the concrete slab in contact with the col-umn. More generally, connections with dissipation occurring inthe joints components have been tested to verify the influence ofthe concrete slab and its reinforcement around the column (e.g.[15]), the presence of a cantilever edge strip in exterior joints,the direction of the ribs of the steel sheeting, the presence of sup-plementary column web panel and stiffeners.
Finite-Element (FE) numerical models related to several exper-imental tests have been also proposed in the last years, in order topredict the global inelastic response (both monotonic and cyclic) ofexterior and interior beam-to-column joints [18–22]. Anyway, theexperimental tests on composite joints conducted so far and the
C. Amadio et al. / Engineering Structures 138 (2017) 394–409 395
corresponding FE numerical representations, although available ina large number in the literature, have been mainly focused on theprediction of the global behaviour only. Differing from existingresearch projects, this paper focuses on the FE numerical predic-tion of both global and local behaviour of steel-concrete compositejoints.
To this aim, two full-scale exterior steel-concrete compositejoints were designed according to the Eurocode 8 and 4 provisions[23,24] and characterized by the presence of two types of connec-tions, i.e. a steel bolted extended endplate connection and awelded connection.
Cyclic experiments were then carried out on both specimens;see [25,26] for a description of the experimental program.
In this paper, as an intermediate stage of an extended researchinvestigation, careful attention is paid to the FE numerical mod-elling of the welded connection only, which exhibited some rele-vant mechanisms during the past experiment. The specimen,tested under cyclic loading, was in fact extensively instrumentedand a wide range of parameters was monitored during the exper-imental test. In this respect, the experimental setup and measure-ments are first recalled from [25].
Based on both global and local available test measurements, theconsistency and accuracy of a refined Finite-Element numericalmodel is then proposed and critically discussed. The main advan-tage of the presented 3D FE numerical model, implemented inABAQUS [27,28], is that the actual geometrical and mechanicalproperties of the joint components, as well as their reciprocalinteraction, can be properly taken into account. Given the ratherclose agreement between experimental results and FE numericalpredictions, in particular, it is expected that such numericalapproach could be implemented as an alternative to costly andtime consuming experimental tests, allowing an extensive para-metric investigation of composite joints, including a wide set ofgeometrical and mechanical configurations for steel-concretestructural systems. An implicit advantage of the same FE modellingapproach, as also discussed in this paper, is given in fact the criticaldiscussion and possible review of the design recommendationsactually provided by the Eurocode 8 for the steel-concrete compos-ite joints.
2. Past experimental test
2.1. Specimen geometrical details and material properties
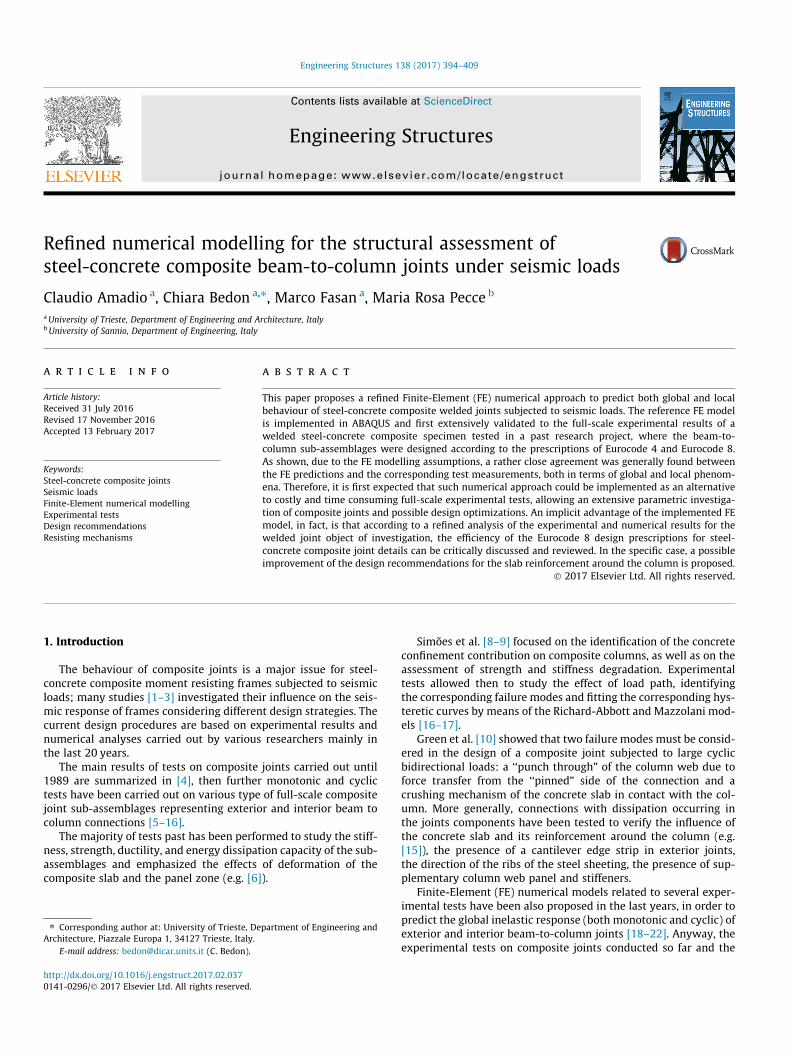
Through the FE exploratory investigation, the exterior full-scalecomposite welded joint (hereinafter called WJ) investigated in[25,26] was taken into account. As shown in Figs. 1–4, the WJ spec-imen was characterized by the presence of a 330 mm-long (fromthe external flange of the column) concrete cantilever edge stripand a 2000 mm-long (from the internal face of the column)IPE240 steel beam section directly welded to a 3400 mm-longHE280B partially encased composite column section. Table 1 col-lects the main features of the steel profiles that were taken intoaccount for the design of the composite beam and column, at thetime of the experimental research project.
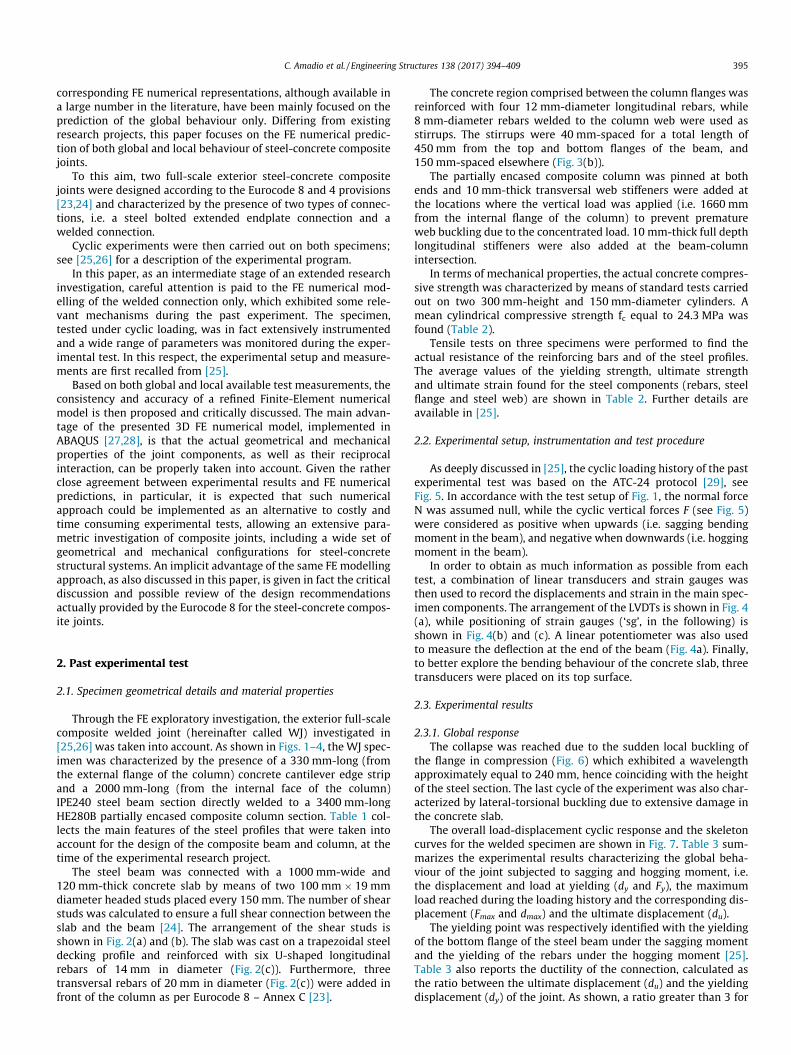
The steel beam was connected with a 1000 mm-wide and120 mm-thick concrete slab by means of two 100 mm � 19 mmdiameter headed studs placed every 150 mm. The number of shearstuds was calculated to ensure a full shear connection between theslab and the beam [24]. The arrangement of the shear studs isshown in Fig. 2(a) and (b). The slab was cast on a trapezoidal steeldecking profile and reinforced with six U-shaped longitudinalrebars of 14 mm in diameter (Fig. 2(c)). Furthermore, threetransversal rebars of 20 mm in diameter (Fig. 2(c)) were added infront of the column as per Eurocode 8 – Annex C [23].
The concrete region comprised between the column flanges wasreinforced with four 12 mm-diameter longitudinal rebars, while8 mm-diameter rebars welded to the column web were used asstirrups. The stirrups were 40 mm-spaced for a total length of450 mm from the top and bottom flanges of the beam, and150 mm-spaced elsewhere (Fig. 3(b)).
The partially encased composite column was pinned at bothends and 10 mm-thick transversal web stiffeners were added atthe locations where the vertical load was applied (i.e. 1660 mmfrom the internal flange of the column) to prevent prematureweb buckling due to the concentrated load. 10 mm-thick full depthlongitudinal stiffeners were also added at the beam-columnintersection.
In terms of mechanical properties, the actual concrete compres-sive strength was characterized by means of standard tests carriedout on two 300 mm-height and 150 mm-diameter cylinders. Amean cylindrical compressive strength fc equal to 24.3 MPa wasfound (Table 2).
Tensile tests on three specimens were performed to find theactual resistance of the reinforcing bars and of the steel profiles.The average values of the yielding strength, ultimate strengthand ultimate strain found for the steel components (rebars, steelflange and steel web) are shown in Table 2. Further details areavailable in [25].
2.2. Experimental setup, instrumentation and test procedure
As deeply discussed in [25], the cyclic loading history of the pastexperimental test was based on the ATC-24 protocol [29], seeFig. 5. In accordance with the test setup of Fig. 1, the normal forceN was assumed null, while the cyclic vertical forces F (see Fig. 5)were considered as positive when upwards (i.e. sagging bendingmoment in the beam), and negative when downwards (i.e. hoggingmoment in the beam).
In order to obtain as much information as possible from eachtest, a combination of linear transducers and strain gauges wasthen used to record the displacements and strain in the main spec-imen components. The arrangement of the LVDTs is shown in Fig. 4(a), while positioning of strain gauges (‘sg’, in the following) isshown in Fig. 4(b) and (c). A linear potentiometer was also usedto measure the deflection at the end of the beam (Fig. 4a). Finally,to better explore the bending behaviour of the concrete slab, threetransducers were placed on its top surface.
2.3. Experimental results
2.3.1. Global responseThe collapse was reached due to the sudden local buckling of
the flange in compression (Fig. 6) which exhibited a wavelengthapproximately equal to 240 mm, hence coinciding with the heightof the steel section. The last cycle of the experiment was also char-acterized by lateral-torsional buckling due to extensive damage inthe concrete slab.
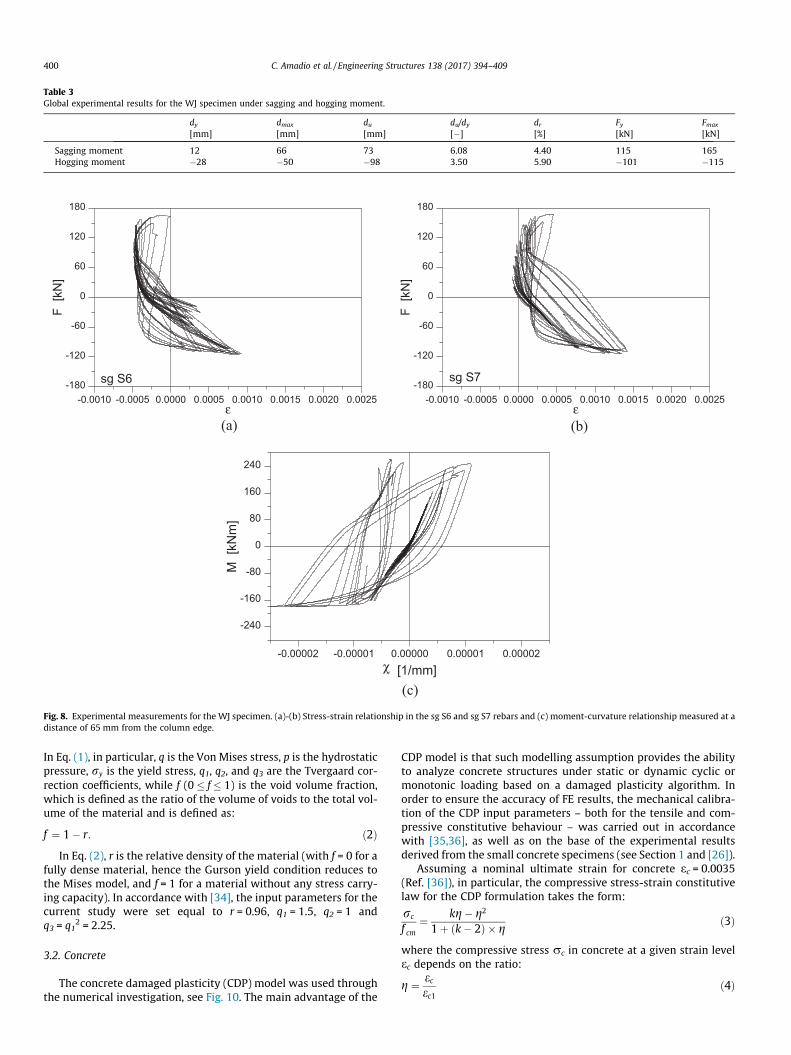
The overall load-displacement cyclic response and the skeletoncurves for the welded specimen are shown in Fig. 7. Table 3 sum-marizes the experimental results characterizing the global beha-viour of the joint subjected to sagging and hogging moment, i.e.the displacement and load at yielding (dy and Fy), the maximumload reached during the loading history and the corresponding dis-placement (Fmax and dmax) and the ultimate displacement (du).
The yielding point was respectively identified with the yieldingof the bottom flange of the steel beam under the sagging momentand the yielding of the rebars under the hogging moment [25].Table 3 also reports the ductility of the connection, calculated asthe ratio between the ultimate displacement (du) and the yieldingdisplacement (dy) of the joint. As shown, a ratio greater than 3 for
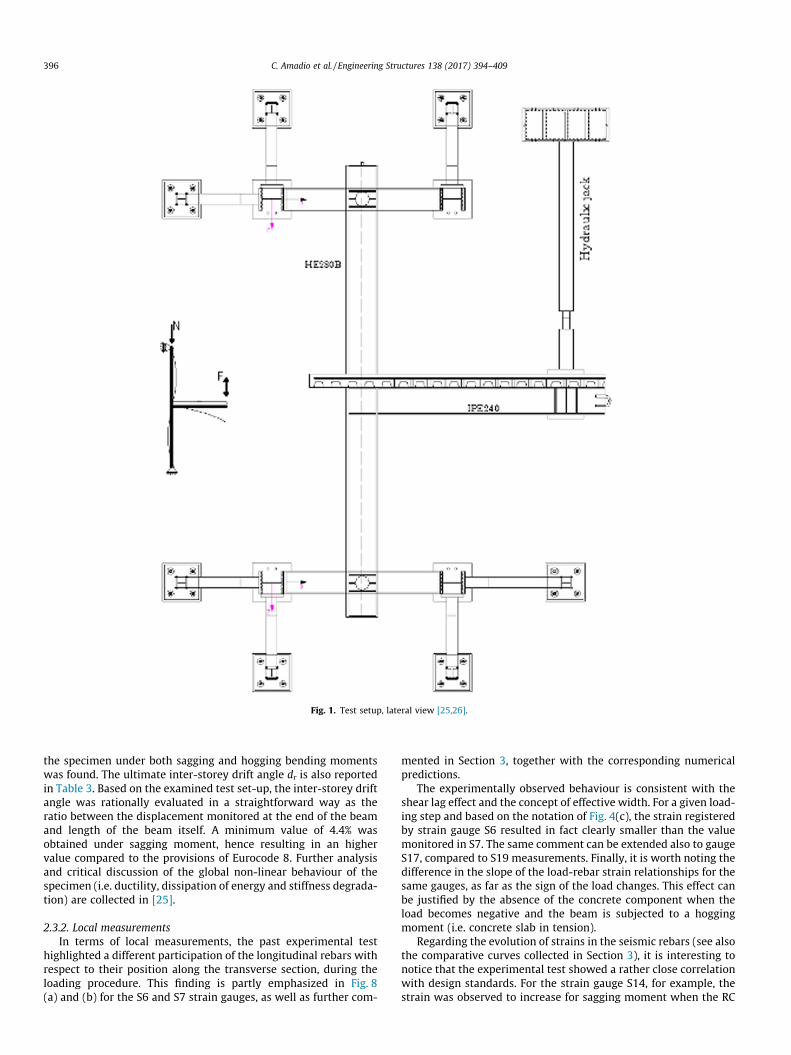
Fig. 1. Test setup, lateral view [25,26].
396 C. Amadio et al. / Engineering Structures 138 (2017) 394–409
the specimen under both sagging and hogging bending momentswas found. The ultimate inter-storey drift angle dr is also reportedin Table 3. Based on the examined test set-up, the inter-storey driftangle was rationally evaluated in a straightforward way as theratio between the displacement monitored at the end of the beamand length of the beam itself. A minimum value of 4.4% wasobtained under sagging moment, hence resulting in an highervalue compared to the provisions of Eurocode 8. Further analysisand critical discussion of the global non-linear behaviour of thespecimen (i.e. ductility, dissipation of energy and stiffness degrada-tion) are collected in [25].
2.3.2. Local measurementsIn terms of local measurements, the past experimental test
highlighted a different participation of the longitudinal rebars withrespect to their position along the transverse section, during theloading procedure. This finding is partly emphasized in Fig. 8(a) and (b) for the S6 and S7 strain gauges, as well as further com-
mented in Section 3, together with the corresponding numericalpredictions.
The experimentally observed behaviour is consistent with theshear lag effect and the concept of effective width. For a given load-ing step and based on the notation of Fig. 4(c), the strain registeredby strain gauge S6 resulted in fact clearly smaller than the valuemonitored in S7. The same comment can be extended also to gaugeS17, compared to S19 measurements. Finally, it is worth noting thedifference in the slope of the load-rebar strain relationships for thesame gauges, as far as the sign of the load changes. This effect canbe justified by the absence of the concrete component when theload becomes negative and the beam is subjected to a hoggingmoment (i.e. concrete slab in tension).
Regarding the evolution of strains in the seismic rebars (see alsothe comparative curves collected in Section 3), it is interesting tonotice that the experimental test showed a rather close correlationwith design standards. For the strain gauge S14, for example, thestrain was observed to increase for sagging moment when the RC
Fig. 2. Geometrical properties of the specimen. (a) Lateral view; (b) cross-section of the composite beam and (c) rebars in the slab, top view [25,26]. Nominal dimensions inmm.
Fig. 3. Geometrical properties of the tested specimens. (a) Cross-section of the composite column and (b) lateral view of the reinforcing bars in the column (90� rotated).Nominal dimensions in mm.
C. Amadio et al. / Engineering Structures 138 (2017) 394–409 397
slab is subjected to compression, due to the formation of compres-sion struts (i.e., what is described as mechanism 1 and 2 in Euro-code 8). The same behaviour was also observed in the cantileverconcrete edge strip, as far as the assigned load induces a hoggingmoment on the composite beam. In this latter case, the rebarsinvolved in the mechanisms consisted in U-shaped longitudinalbars (3U14, Fig. 2).
Together with strain measurements in the rebars, the overallmoment-curvature response of the joint was also monitored, seeFig. 8(c). In the figure, the cyclic response of the specimen isshown, as obtained by the strain gauges on the rebars and the steeljoist at a cross-section 65 mm distant from the edge of the column.
The LVDT10 instrument was finally placed on the concrete slab(Fig. 4(a)) to calculate the average strain of the concrete region incontact with the flange of the column (mechanism 1, as for Euro-code 8). Despite the cyclic loading condition (see also section 3),the specimen achieved a strain in compression in the order of�0.5%, i.e. markedly higher than the ultimate strain provided bythe Eurocode 8.
2.4. Finite-Element numerical modelling
Based on the available experimental test results, a three-dimensional Finite Element model was implemented in the ABA-QUS computer software [27,28], to simulate the response of the fullscale WJ joint as well as to further explore at the component levelthe typical structural performance. At the current stage of theresearch project, only a monotonic, static simulation was carriedout.
The intention – once assessed the accuracy and possible criticalaspects of the presented FE modelling approach – is to furtherextend the same methodology to a multitude of geometrical andmechanical configurations of practical interest, including also possi-ble variations in boundary and loading conditions (i.e. cyclic loads).
2.5. Element type, mesh pattern and model assembly
To ensure the accuracy and the computational efficiencyof the FE simulations, careful consideration was first paid to the
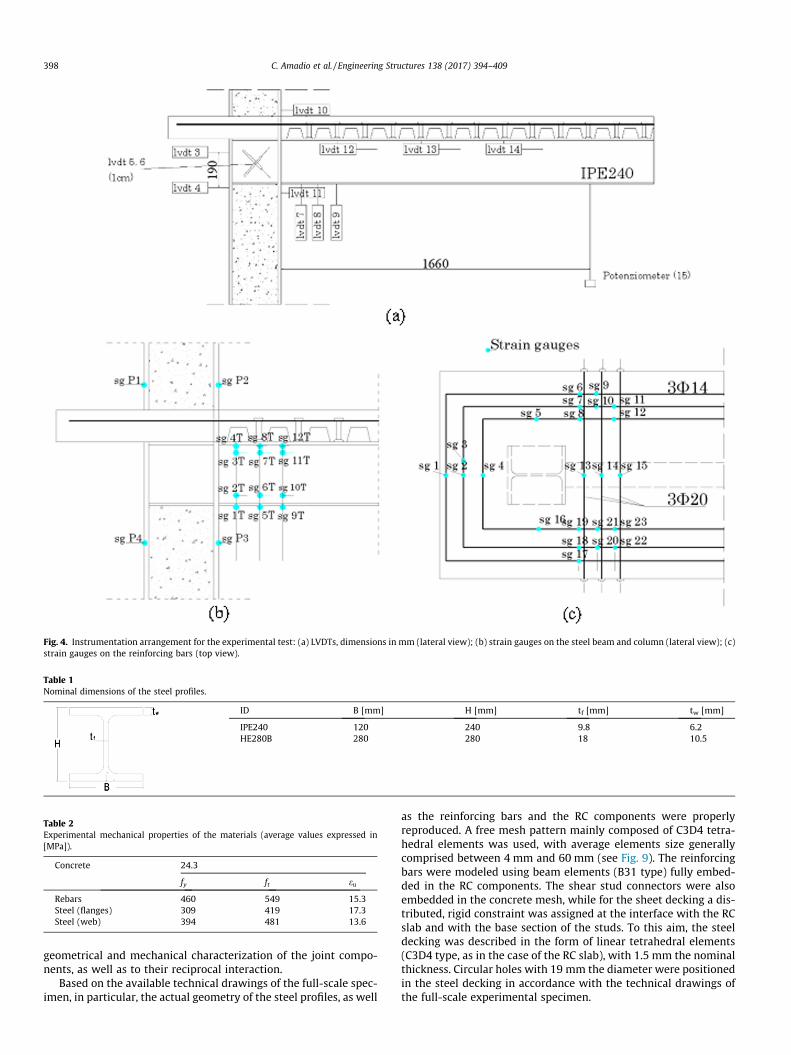
Fig. 4. Instrumentation arrangement for the experimental test: (a) LVDTs, dimensions in mm (lateral view); (b) strain gauges on the steel beam and column (lateral view); (c)strain gauges on the reinforcing bars (top view).
Table 1Nominal dimensions of the steel profiles.
ID B [mm] H [mm] tf [mm] tw [mm]
IPE240 120 240 9.8 6.2HE280B 280 280 18 10.5
Table 2Experimental mechanical properties of the materials (average values expressed in[MPa]).
Concrete 24.3
fy ft eu
Rebars 460 549 15.3Steel (flanges) 309 419 17.3Steel (web) 394 481 13.6
398 C. Amadio et al. / Engineering Structures 138 (2017) 394–409
geometrical and mechanical characterization of the joint compo-nents, as well as to their reciprocal interaction.
Based on the available technical drawings of the full-scale spec-imen, in particular, the actual geometry of the steel profiles, as well
as the reinforcing bars and the RC components were properlyreproduced. A free mesh pattern mainly composed of C3D4 tetra-hedral elements was used, with average elements size generallycomprised between 4 mm and 60 mm (see Fig. 9). The reinforcingbars were modeled using beam elements (B31 type) fully embed-ded in the RC components. The shear stud connectors were alsoembedded in the concrete mesh, while for the sheet decking a dis-tributed, rigid constraint was assigned at the interface with the RCslab and with the base section of the studs. To this aim, the steeldecking was described in the form of linear tetrahedral elements(C3D4 type, as in the case of the RC slab), with 1.5 mm the nominalthickness. Circular holes with 19 mm the diameter were positionedin the steel decking in accordance with the technical drawings ofthe full-scale experimental specimen.
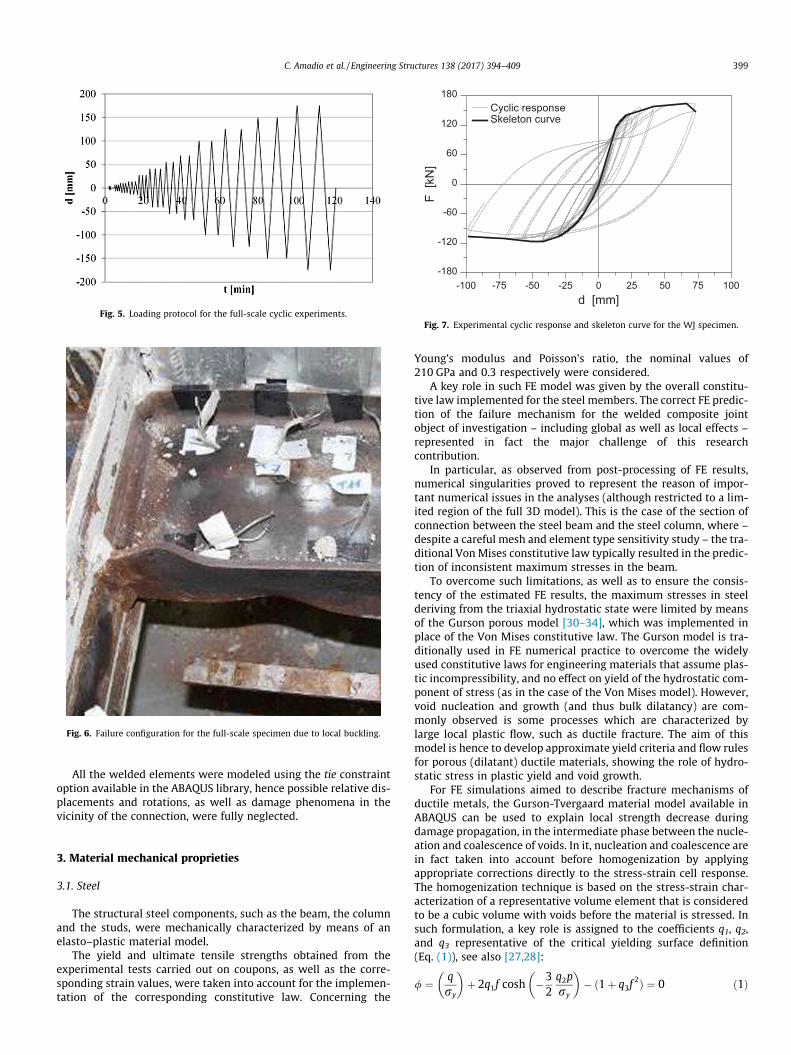
Fig. 5. Loading protocol for the full-scale cyclic experiments.
Fig. 6. Failure configuration for the full-scale specimen due to local buckling.
-100 -75 -50 -25 0 25 50 75 100d [mm]
-180
-120
-60
0
60
120
180
F [k
N]
Cyclic responseSkeleton curve
Fig. 7. Experimental cyclic response and skeleton curve for the WJ specimen.
C. Amadio et al. / Engineering Structures 138 (2017) 394–409 399
All the welded elements were modeled using the tie constraintoption available in the ABAQUS library, hence possible relative dis-placements and rotations, as well as damage phenomena in thevicinity of the connection, were fully neglected.
3. Material mechanical proprieties
3.1. Steel
The structural steel components, such as the beam, the columnand the studs, were mechanically characterized by means of anelasto–plastic material model.
The yield and ultimate tensile strengths obtained from theexperimental tests carried out on coupons, as well as the corre-sponding strain values, were taken into account for the implemen-tation of the corresponding constitutive law. Concerning the
Young’s modulus and Poisson’s ratio, the nominal values of210 GPa and 0.3 respectively were considered.
A key role in such FE model was given by the overall constitu-tive law implemented for the steel members. The correct FE predic-tion of the failure mechanism for the welded composite jointobject of investigation – including global as well as local effects –represented in fact the major challenge of this researchcontribution.
In particular, as observed from post-processing of FE results,numerical singularities proved to represent the reason of impor-tant numerical issues in the analyses (although restricted to a lim-ited region of the full 3D model). This is the case of the section ofconnection between the steel beam and the steel column, where –despite a careful mesh and element type sensitivity study – the tra-ditional VonMises constitutive law typically resulted in the predic-tion of inconsistent maximum stresses in the beam.
To overcome such limitations, as well as to ensure the consis-tency of the estimated FE results, the maximum stresses in steelderiving from the triaxial hydrostatic state were limited by meansof the Gurson porous model [30–34], which was implemented inplace of the Von Mises constitutive law. The Gurson model is tra-ditionally used in FE numerical practice to overcome the widelyused constitutive laws for engineering materials that assume plas-tic incompressibility, and no effect on yield of the hydrostatic com-ponent of stress (as in the case of the Von Mises model). However,void nucleation and growth (and thus bulk dilatancy) are com-monly observed is some processes which are characterized bylarge local plastic flow, such as ductile fracture. The aim of thismodel is hence to develop approximate yield criteria and flow rulesfor porous (dilatant) ductile materials, showing the role of hydro-static stress in plastic yield and void growth.
For FE simulations aimed to describe fracture mechanisms ofductile metals, the Gurson-Tvergaard material model available inABAQUS can be used to explain local strength decrease duringdamage propagation, in the intermediate phase between the nucle-ation and coalescence of voids. In it, nucleation and coalescence arein fact taken into account before homogenization by applyingappropriate corrections directly to the stress-strain cell response.The homogenization technique is based on the stress-strain char-acterization of a representative volume element that is consideredto be a cubic volume with voids before the material is stressed. Insuch formulation, a key role is assigned to the coefficients q1, q2,and q3 representative of the critical yielding surface definition(Eq. (1)), see also [27,28]:
/ ¼ qry
� �þ 2q1f cosh �3
2q2pry
� �� ð1þ q3f
2Þ ¼ 0 ð1Þ
-0.0010 -0.0005 0.0000 0.0005 0.0010 0.0015 0.0020 0.0025ε
-180
-120
-60
0
60
120
180
F [k
N]
sg S6-0.0010 -0.0005 0.0000 0.0005 0.0010 0.0015 0.0020 0.0025
ε
-180
-120
-60
0
60
120
180
F [k
N]
sg S7
)b()a(
-0.00002 -0.00001 0.00000 0.00001 0.00002χ [1/mm]
-240
-160
-80
0
80
160
240
M [
kNm
]
(c)
Fig. 8. Experimental measurements for the WJ specimen. (a)-(b) Stress-strain relationship in the sg S6 and sg S7 rebars and (c) moment-curvature relationship measured at adistance of 65 mm from the column edge.
Table 3Global experimental results for the WJ specimen under sagging and hogging moment.
dy dmax du du/dy dr Fy Fmax
[mm] [mm] [mm] [�] [%] [kN] [kN]
Sagging moment 12 66 73 6.08 4.40 115 165Hogging moment �28 �50 �98 3.50 5.90 �101 �115
400 C. Amadio et al. / Engineering Structures 138 (2017) 394–409
In Eq. (1), in particular, q is the Von Mises stress, p is the hydrostaticpressure, ry is the yield stress, q1, q2, and q3 are the Tvergaard cor-rection coefficients, while f (0 � f � 1) is the void volume fraction,which is defined as the ratio of the volume of voids to the total vol-ume of the material and is defined as:
f ¼ 1� r: ð2ÞIn Eq. (2), r is the relative density of the material (with f = 0 for a
fully dense material, hence the Gurson yield condition reduces tothe Mises model, and f = 1 for a material without any stress carry-ing capacity). In accordance with [34], the input parameters for thecurrent study were set equal to r = 0.96, q1 = 1.5, q2 = 1 andq3 = q1
2 = 2.25.
3.2. Concrete
The concrete damaged plasticity (CDP) model was used throughthe numerical investigation, see Fig. 10. The main advantage of the
CDP model is that such modelling assumption provides the abilityto analyze concrete structures under static or dynamic cyclic ormonotonic loading based on a damaged plasticity algorithm. Inorder to ensure the accuracy of FE results, the mechanical calibra-tion of the CDP input parameters – both for the tensile and com-pressive constitutive behaviour – was carried out in accordancewith [35,36], as well as on the base of the experimental resultsderived from the small concrete specimens (see Section 1 and [26]).
Assuming a nominal ultimate strain for concrete ec = 0.0035(Ref. [36]), in particular, the compressive stress-strain constitutivelaw for the CDP formulation takes the form:
rc
f cm¼ kg� g2
1þ ðk� 2Þ � gð3Þ
where the compressive stress rc in concrete at a given strain levelec depends on the ratio:
g ¼ ecec1
ð4Þ
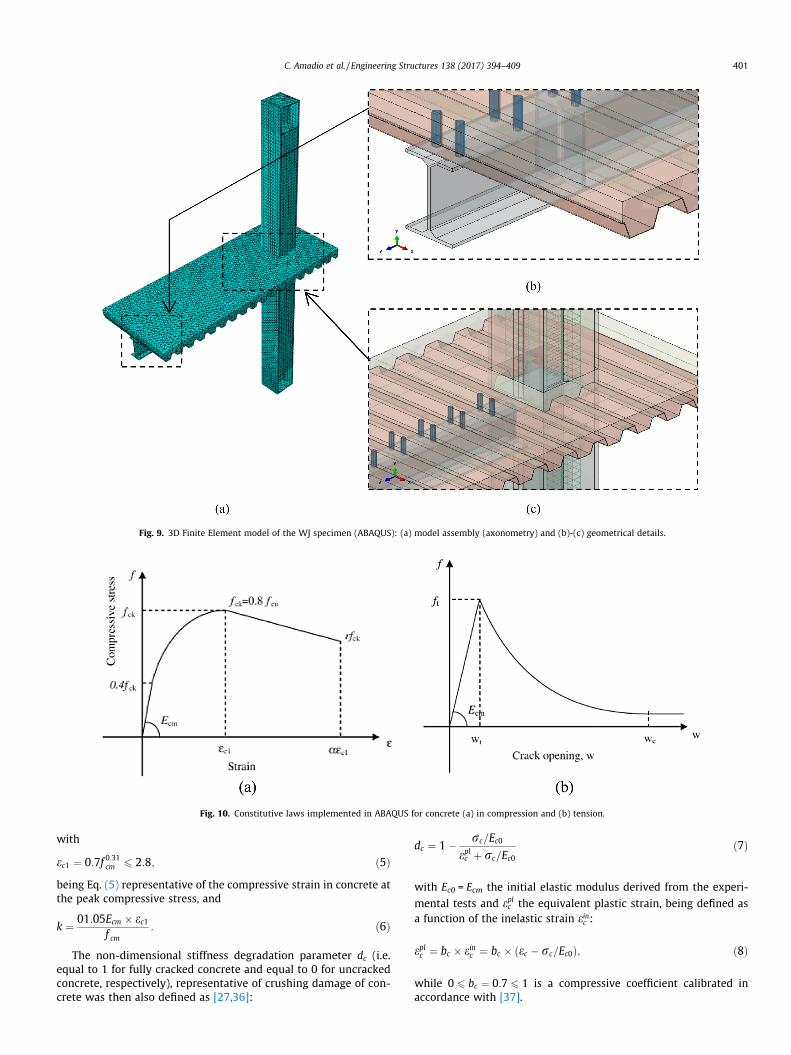
Fig. 9. 3D Finite Element model of the WJ specimen (ABAQUS): (a) model assembly (axonometry) and (b)-(c) geometrical details.
Fig. 10. Constitutive laws implemented in ABAQUS for concrete (a) in compression and (b) tension.
C. Amadio et al. / Engineering Structures 138 (2017) 394–409 401
with
ec1 ¼ 0:7f 0:31cm 6 2:8; ð5Þbeing Eq. (5) representative of the compressive strain in concrete atthe peak compressive stress, and
k ¼ 01:05Ecm � ec1f cm
: ð6Þ
The non-dimensional stiffness degradation parameter dc (i.e.equal to 1 for fully cracked concrete and equal to 0 for uncrackedconcrete, respectively), representative of crushing damage of con-crete was then also defined as [27,36]:
dc ¼ 1� rc=Ec0
eplc þ rc=Ec0
ð7Þ
with Ec0 = Ecm the initial elastic modulus derived from the experi-
mental tests and eplc the equivalent plastic strain, being defined asa function of the inelastic strain einc :
eplc ¼ bc � einc ¼ bc � ðec � rc=Ec0Þ; ð8Þ
while 0 6 bc ¼ 0:7 6 1 is a compressive coefficient calibrated inaccordance with [37].
-100 -75 -50 -25 0 25 50 75 100d [mm]
-180
-120
-60
0
60
120
180
F [k
N]
ExperimentalFE (VM)FE (G)
Fig. 11. Experimental and FE load-displacement curves. (VM = Von Mises;G = Gurson).
402 C. Amadio et al. / Engineering Structures 138 (2017) 394–409
In terms of tensile behaviour of concrete, a similar approachwas followed. The stress-strain constitutive law, in this case, wasdefined as [27,36,38,39]:
rt
f t¼ f ðwÞ � w
wcf ðwcÞ ð9Þ
with
f ðwcÞ ¼ 1þ c1wwc
� �3" #
exp � c2wwc
� �ð10Þ
where w represents the crack opening displacement, while
wc ¼ 5:14Gf
f ctð11Þ
is the crack opening displacement at which stress can no longer betransferred.
In Eq. (9), moreover, c1 = 3 and c2 = 6.93 are two material con-stants (values in use for Normal Weight Concrete), while fct in Eq.(11) can be calculated as [27]:
f ct ¼ 0:7� ð0:3f 2=3ck Þ ¼ 0:7� ð0:3� ðf cm � 8Þ2=3Þ: ð12ÞIn Eq. (11), finally, the fracture energy of concrete was esti-
mated as (see [40]):
Gf � GF
2:5ð13Þ
A reference value of 0.15 N/mmwas assumed for the base valueof fracture energy GF, based on the average size of aggregates forthe examined experimental specimen.
3.3. Boundary conditions, loading procedure and solving method
The assembled FE model was properly restrained, in order toreproduce the ideal restraint conditions of the tested full-scalespecimen (see Fig. 1). The monotonic response under both saggingand hogging moment was then separately explored. The typicalsimulation, as a result, consisted in a linear geometrical, static stepin which monotonic loads were linearly increased up to failure.
4. Discussion of results
4.1. Global response
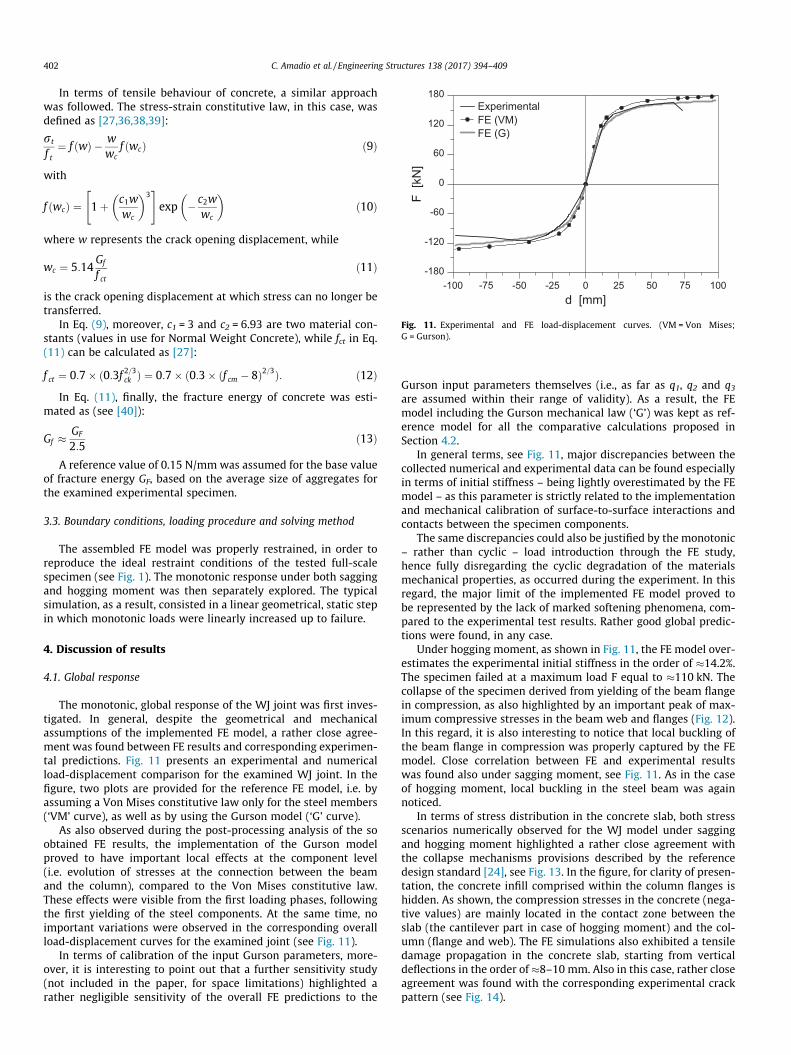
The monotonic, global response of the WJ joint was first inves-tigated. In general, despite the geometrical and mechanicalassumptions of the implemented FE model, a rather close agree-ment was found between FE results and corresponding experimen-tal predictions. Fig. 11 presents an experimental and numericalload-displacement comparison for the examined WJ joint. In thefigure, two plots are provided for the reference FE model, i.e. byassuming a Von Mises constitutive law only for the steel members(‘VM’ curve), as well as by using the Gurson model (‘G’ curve).
As also observed during the post-processing analysis of the soobtained FE results, the implementation of the Gurson modelproved to have important local effects at the component level(i.e. evolution of stresses at the connection between the beamand the column), compared to the Von Mises constitutive law.These effects were visible from the first loading phases, followingthe first yielding of the steel components. At the same time, noimportant variations were observed in the corresponding overallload-displacement curves for the examined joint (see Fig. 11).
In terms of calibration of the input Gurson parameters, more-over, it is interesting to point out that a further sensitivity study(not included in the paper, for space limitations) highlighted arather negligible sensitivity of the overall FE predictions to the
Gurson input parameters themselves (i.e., as far as q1, q2 and q3are assumed within their range of validity). As a result, the FEmodel including the Gurson mechanical law (‘G’) was kept as ref-erence model for all the comparative calculations proposed inSection 4.2.
In general terms, see Fig. 11, major discrepancies between thecollected numerical and experimental data can be found especiallyin terms of initial stiffness – being lightly overestimated by the FEmodel – as this parameter is strictly related to the implementationand mechanical calibration of surface-to-surface interactions andcontacts between the specimen components.
The same discrepancies could also be justified by the monotonic– rather than cyclic – load introduction through the FE study,hence fully disregarding the cyclic degradation of the materialsmechanical properties, as occurred during the experiment. In thisregard, the major limit of the implemented FE model proved tobe represented by the lack of marked softening phenomena, com-pared to the experimental test results. Rather good global predic-tions were found, in any case.
Under hogging moment, as shown in Fig. 11, the FE model over-estimates the experimental initial stiffness in the order of �14.2%.The specimen failed at a maximum load F equal to �110 kN. Thecollapse of the specimen derived from yielding of the beam flangein compression, as also highlighted by an important peak of max-imum compressive stresses in the beam web and flanges (Fig. 12).In this regard, it is also interesting to notice that local buckling ofthe beam flange in compression was properly captured by the FEmodel. Close correlation between FE and experimental resultswas found also under sagging moment, see Fig. 11. As in the caseof hogging moment, local buckling in the steel beam was againnoticed.
In terms of stress distribution in the concrete slab, both stressscenarios numerically observed for the WJ model under saggingand hogging moment highlighted a rather close agreement withthe collapse mechanisms provisions described by the referencedesign standard [24], see Fig. 13. In the figure, for clarity of presen-tation, the concrete infill comprised within the column flanges ishidden. As shown, the compression stresses in the concrete (nega-tive values) are mainly located in the contact zone between theslab (the cantilever part in case of hogging moment) and the col-umn (flange and web). The FE simulations also exhibited a tensiledamage propagation in the concrete slab, starting from verticaldeflections in the order of�8–10 mm. Also in this case, rather closeagreement was found with the corresponding experimental crackpattern (see Fig. 14).
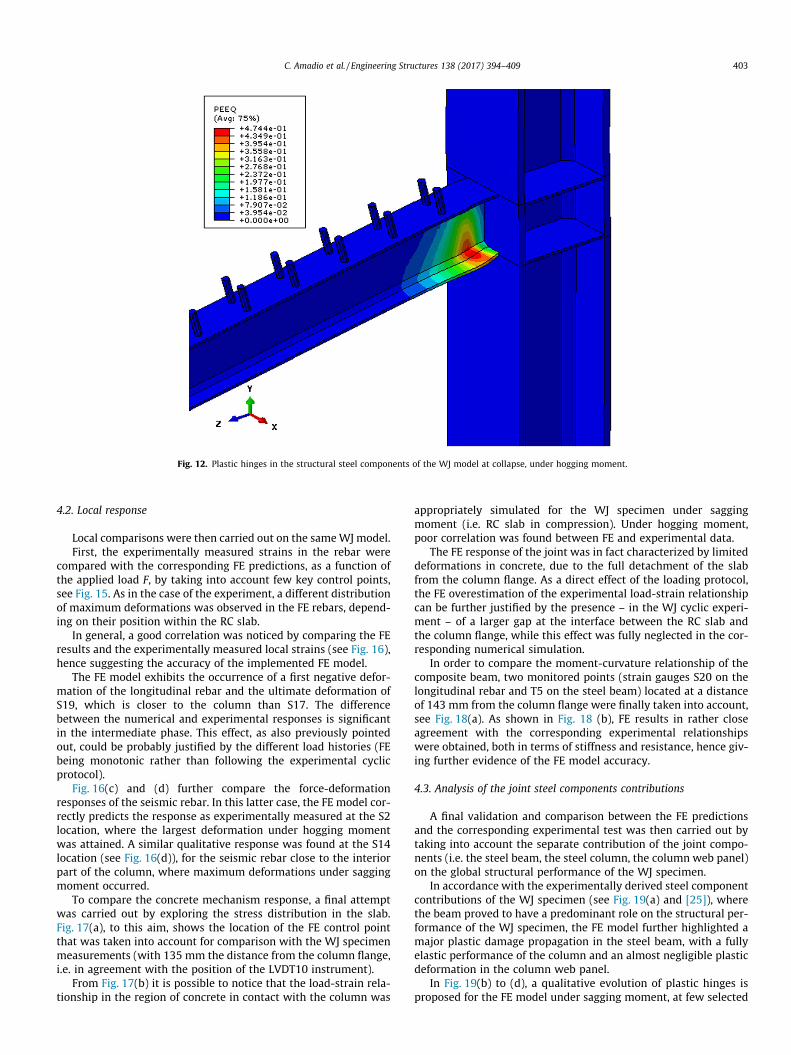
Fig. 12. Plastic hinges in the structural steel components of the WJ model at collapse, under hogging moment.
C. Amadio et al. / Engineering Structures 138 (2017) 394–409 403
4.2. Local response
Local comparisons were then carried out on the sameWJ model.First, the experimentally measured strains in the rebar were
compared with the corresponding FE predictions, as a function ofthe applied load F, by taking into account few key control points,see Fig. 15. As in the case of the experiment, a different distributionof maximum deformations was observed in the FE rebars, depend-ing on their position within the RC slab.
In general, a good correlation was noticed by comparing the FEresults and the experimentally measured local strains (see Fig. 16),hence suggesting the accuracy of the implemented FE model.
The FE model exhibits the occurrence of a first negative defor-mation of the longitudinal rebar and the ultimate deformation ofS19, which is closer to the column than S17. The differencebetween the numerical and experimental responses is significantin the intermediate phase. This effect, as also previously pointedout, could be probably justified by the different load histories (FEbeing monotonic rather than following the experimental cyclicprotocol).
Fig. 16(c) and (d) further compare the force-deformationresponses of the seismic rebar. In this latter case, the FE model cor-rectly predicts the response as experimentally measured at the S2location, where the largest deformation under hogging momentwas attained. A similar qualitative response was found at the S14location (see Fig. 16(d)), for the seismic rebar close to the interiorpart of the column, where maximum deformations under saggingmoment occurred.
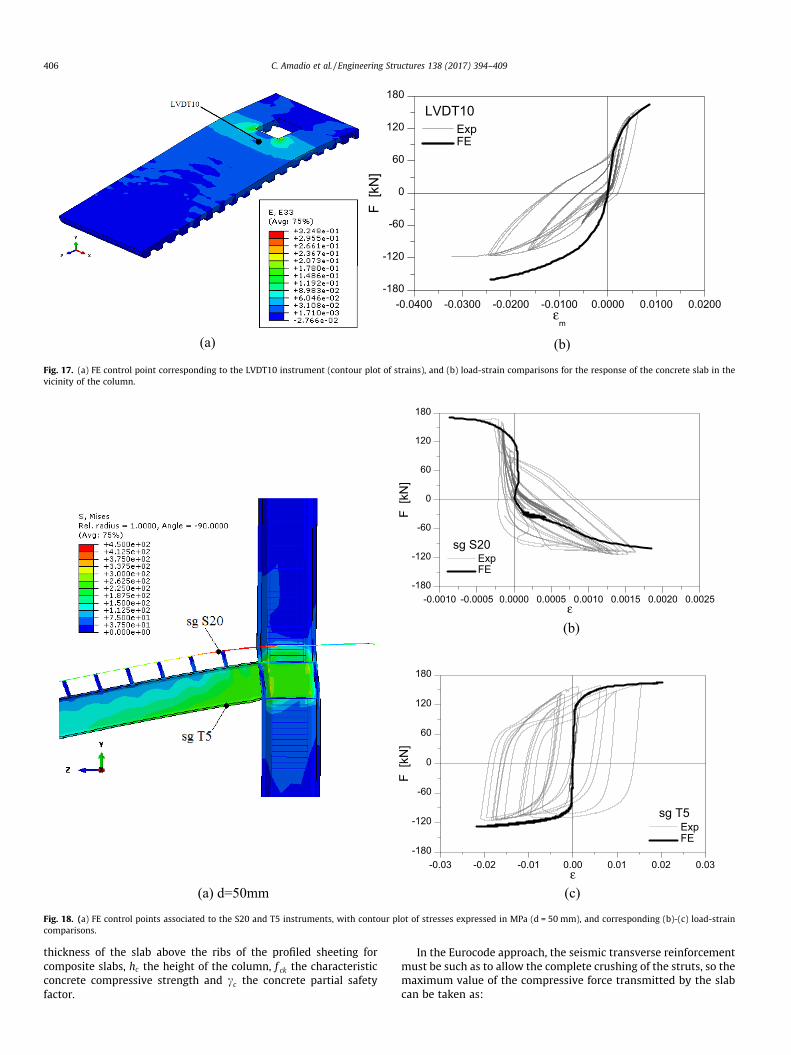
To compare the concrete mechanism response, a final attemptwas carried out by exploring the stress distribution in the slab.Fig. 17(a), to this aim, shows the location of the FE control pointthat was taken into account for comparison with the WJ specimenmeasurements (with 135 mm the distance from the column flange,i.e. in agreement with the position of the LVDT10 instrument).
From Fig. 17(b) it is possible to notice that the load-strain rela-tionship in the region of concrete in contact with the column was
appropriately simulated for the WJ specimen under saggingmoment (i.e. RC slab in compression). Under hogging moment,poor correlation was found between FE and experimental data.
The FE response of the joint was in fact characterized by limiteddeformations in concrete, due to the full detachment of the slabfrom the column flange. As a direct effect of the loading protocol,the FE overestimation of the experimental load-strain relationshipcan be further justified by the presence – in the WJ cyclic experi-ment – of a larger gap at the interface between the RC slab andthe column flange, while this effect was fully neglected in the cor-responding numerical simulation.
In order to compare the moment-curvature relationship of thecomposite beam, two monitored points (strain gauges S20 on thelongitudinal rebar and T5 on the steel beam) located at a distanceof 143 mm from the column flange were finally taken into account,see Fig. 18(a). As shown in Fig. 18 (b), FE results in rather closeagreement with the corresponding experimental relationshipswere obtained, both in terms of stiffness and resistance, hence giv-ing further evidence of the FE model accuracy.
4.3. Analysis of the joint steel components contributions
A final validation and comparison between the FE predictionsand the corresponding experimental test was then carried out bytaking into account the separate contribution of the joint compo-nents (i.e. the steel beam, the steel column, the column web panel)on the global structural performance of the WJ specimen.
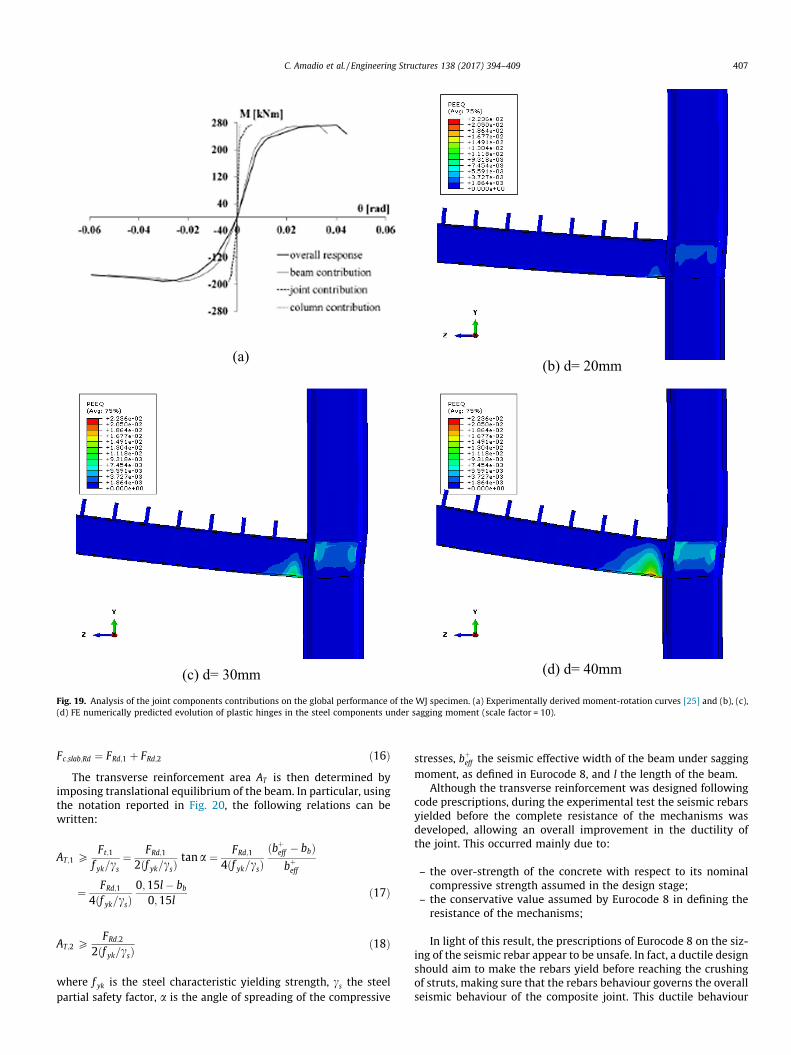
In accordance with the experimentally derived steel componentcontributions of the WJ specimen (see Fig. 19(a) and [25]), wherethe beam proved to have a predominant role on the structural per-formance of the WJ specimen, the FE model further highlighted amajor plastic damage propagation in the steel beam, with a fullyelastic performance of the column and an almost negligible plasticdeformation in the column web panel.
In Fig. 19(b) to (d), a qualitative evolution of plastic hinges isproposed for the FE model under sagging moment, at few selected
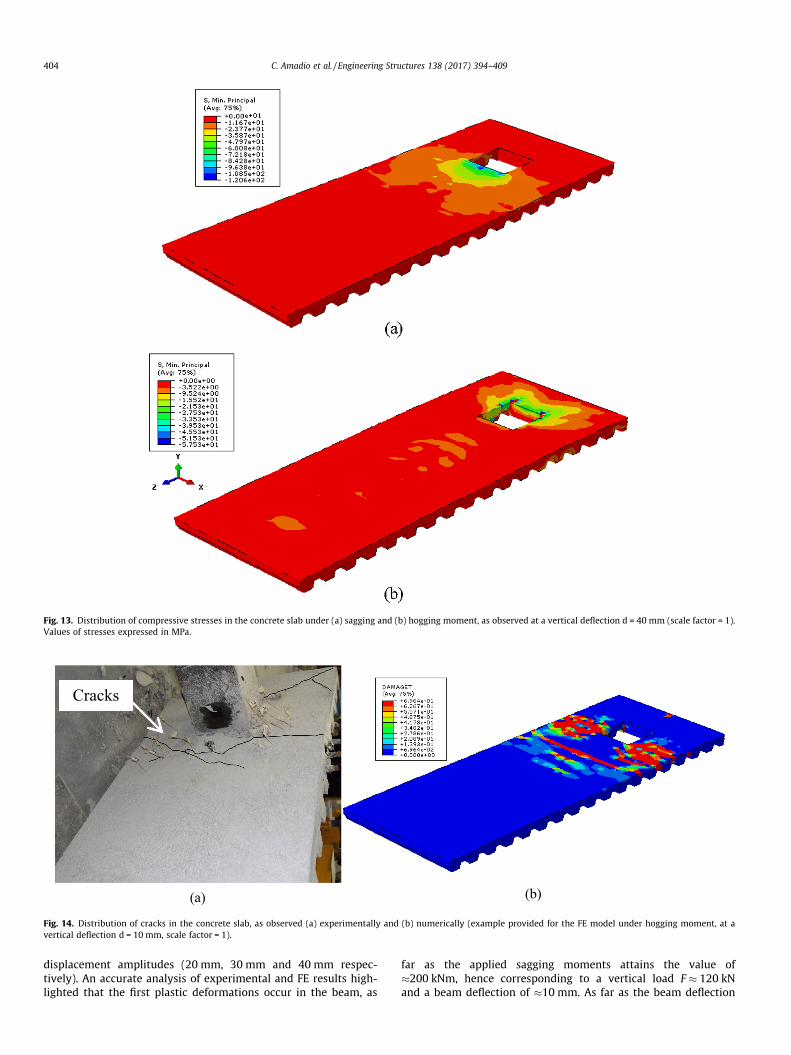
Fig. 13. Distribution of compressive stresses in the concrete slab under (a) sagging and (b) hogging moment, as observed at a vertical deflection d = 40 mm (scale factor = 1).Values of stresses expressed in MPa.
)b()a(
Cracks
Fig. 14. Distribution of cracks in the concrete slab, as observed (a) experimentally and (b) numerically (example provided for the FE model under hogging moment, at avertical deflection d = 10 mm, scale factor = 1).
404 C. Amadio et al. / Engineering Structures 138 (2017) 394–409
displacement amplitudes (20 mm, 30 mm and 40 mm respec-tively). An accurate analysis of experimental and FE results high-lighted that the first plastic deformations occur in the beam, as
far as the applied sagging moments attains the value of�200 kNm, hence corresponding to a vertical load F � 120 kNand a beam deflection of �10 mm. As far as the beam deflection
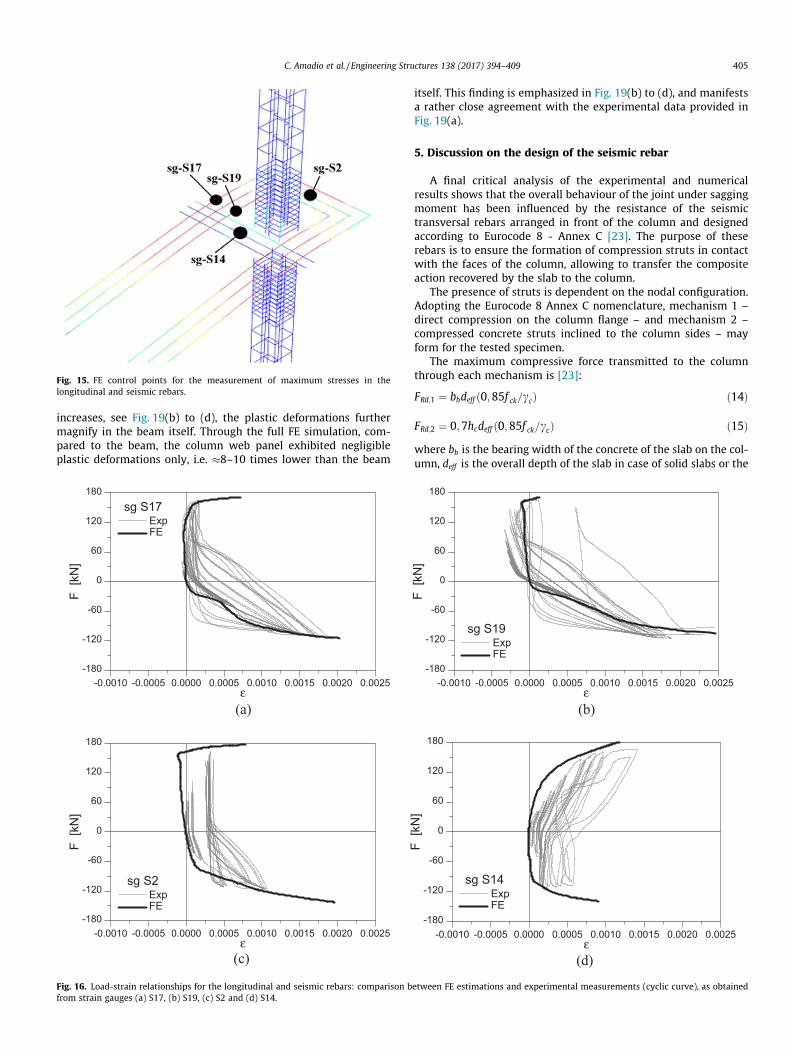
Fig. 15. FE control points for the measurement of maximum stresses in thelongitudinal and seismic rebars.
C. Amadio et al. / Engineering Structures 138 (2017) 394–409 405
increases, see Fig. 19(b) to (d), the plastic deformations furthermagnify in the beam itself. Through the full FE simulation, com-pared to the beam, the column web panel exhibited negligibleplastic deformations only, i.e. �8–10 times lower than the beam
-0.0010 -0.0005 0.0000 0.0005 0.0010 0.0015 0.0020 0.0025ε
-180
-120
-60
0
60
120
180
F [k
N]
sg S17ExpFE
)a(
-0.0010 -0.0005 0.0000 0.0005 0.0010 0.0015 0.0020 0.0025ε
-180
-120
-60
0
60
120
180
F [k
N]
sg S2ExpFE
)c(
Fig. 16. Load-strain relationships for the longitudinal and seismic rebars: comparison bfrom strain gauges (a) S17, (b) S19, (c) S2 and (d) S14.
itself. This finding is emphasized in Fig. 19(b) to (d), and manifestsa rather close agreement with the experimental data provided inFig. 19(a).
5. Discussion on the design of the seismic rebar
A final critical analysis of the experimental and numericalresults shows that the overall behaviour of the joint under saggingmoment has been influenced by the resistance of the seismictransversal rebars arranged in front of the column and designedaccording to Eurocode 8 - Annex C [23]. The purpose of theserebars is to ensure the formation of compression struts in contactwith the faces of the column, allowing to transfer the compositeaction recovered by the slab to the column.
The presence of struts is dependent on the nodal configuration.Adopting the Eurocode 8 Annex C nomenclature, mechanism 1 –direct compression on the column flange – and mechanism 2 –compressed concrete struts inclined to the column sides – mayform for the tested specimen.
The maximum compressive force transmitted to the columnthrough each mechanism is [23]:
FRd;1 ¼ bbdeff ð0;85f ck=ccÞ ð14Þ
FRd;2 ¼ 0;7hcdeff ð0;85f ck=ccÞ ð15Þwhere bb is the bearing width of the concrete of the slab on the col-umn, deff is the overall depth of the slab in case of solid slabs or the
-0.0010 -0.0005 0.0000 0.0005 0.0010 0.0015 0.0020 0.0025ε
-180
-120
-60
0
60
120
180
F [k
N]
sg S19ExpFE
)b(
-0.0010 -0.0005 0.0000 0.0005 0.0010 0.0015 0.0020 0.0025ε
-180
-120
-60
0
60
120
180
F [k
N]
sg S14ExpFE
)d(
etween FE estimations and experimental measurements (cyclic curve), as obtained
-0.0400 -0.0300 -0.0200 -0.0100 0.0000 0.0100 0.0200ε
m
-180
-120
-60
0
60
120
180
F [k
N]
LVDT10ExpFE
)b()a(
Fig. 17. (a) FE control point corresponding to the LVDT10 instrument (contour plot of strains), and (b) load-strain comparisons for the response of the concrete slab in thevicinity of the column.
-0.0010 -0.0005 0.0000 0.0005 0.0010 0.0015 0.0020 0.0025ε
-180
-120
-60
0
60
120
180F
[kN
]
sg S20ExpFE
(b)
-0.03 -0.02 -0.01 0.00 0.01 0.02 0.03ε
-180
-120
-60
0
60
120
180
F [k
N]
sg T5ExpFE
)c(mm05=d)a(
Fig. 18. (a) FE control points associated to the S20 and T5 instruments, with contour plot of stresses expressed in MPa (d = 50 mm), and corresponding (b)-(c) load-straincomparisons.
406 C. Amadio et al. / Engineering Structures 138 (2017) 394–409
thickness of the slab above the ribs of the profiled sheeting forcomposite slabs, hc the height of the column, f ck the characteristicconcrete compressive strength and cc the concrete partial safetyfactor.
In the Eurocode approach, the seismic transverse reinforcementmust be such as to allow the complete crushing of the struts, so themaximum value of the compressive force transmitted by the slabcan be taken as:
mm02=d)b()a(
mm04=d)d(mm03=d)c(Fig. 19. Analysis of the joint components contributions on the global performance of the WJ specimen. (a) Experimentally derived moment-rotation curves [25] and (b), (c),(d) FE numerically predicted evolution of plastic hinges in the steel components under sagging moment (scale factor = 10).
C. Amadio et al. / Engineering Structures 138 (2017) 394–409 407
Fc;slab;Rd ¼ FRd;1 þ FRd;2 ð16ÞThe transverse reinforcement area AT is then determined by
imposing translational equilibrium of the beam. In particular, usingthe notation reported in Fig. 20, the following relations can bewritten:
AT;1 PFt;1
f yk=cs¼ FRd;1
2ðf yk=csÞtana ¼ FRd;1
4ðf yk=csÞðbþ
eff � bbÞbþeff
¼ FRd;1
4ðf yk=csÞ0;15l� bb
0;15lð17Þ
AT;2 PFRd;2
2ðf yk=csÞð18Þ
where f yk is the steel characteristic yielding strength, cs the steelpartial safety factor, a is the angle of spreading of the compressive
stresses, bþeff the seismic effective width of the beam under sagging
moment, as defined in Eurocode 8, and l the length of the beam.Although the transverse reinforcement was designed following
code prescriptions, during the experimental test the seismic rebarsyielded before the complete resistance of the mechanisms wasdeveloped, allowing an overall improvement in the ductility ofthe joint. This occurred mainly due to:
– the over-strength of the concrete with respect to its nominalcompressive strength assumed in the design stage;
– the conservative value assumed by Eurocode 8 in defining theresistance of the mechanisms;
In light of this result, the prescriptions of Eurocode 8 on the siz-ing of the seismic rebar appear to be unsafe. In fact, a ductile designshould aim to make the rebars yield before reaching the crushingof struts, making sure that the rebars behaviour governs the overallseismic behaviour of the composite joint. This ductile behaviour
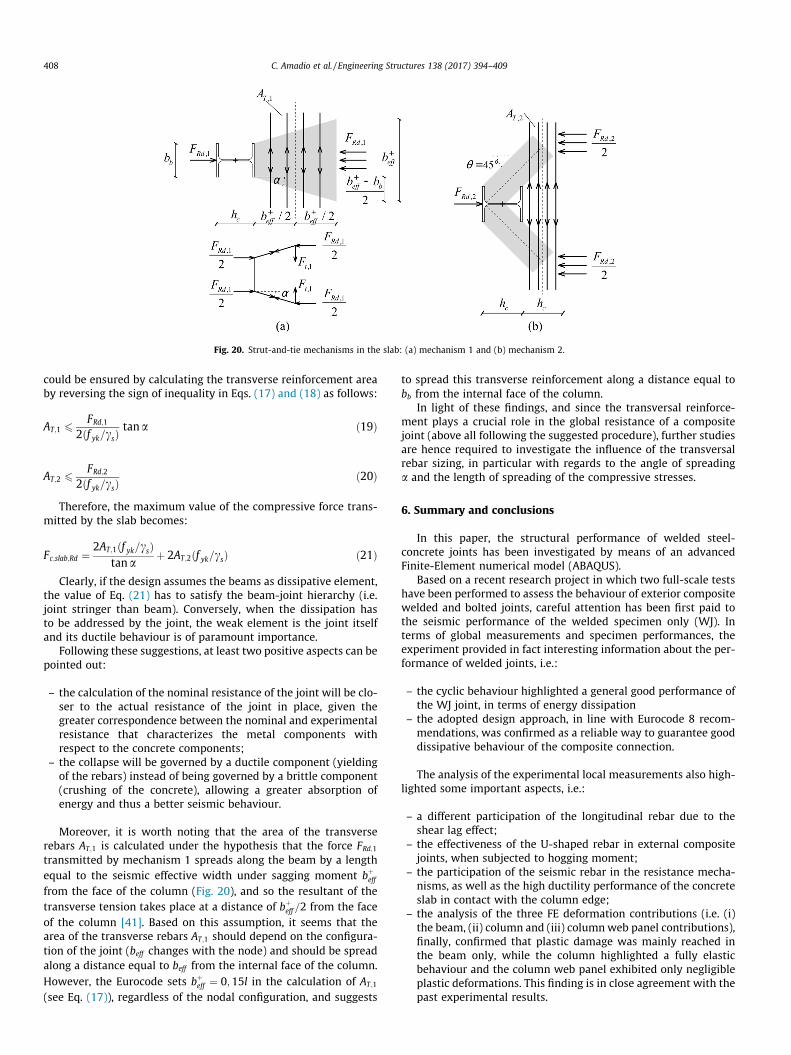
Fig. 20. Strut-and-tie mechanisms in the slab: (a) mechanism 1 and (b) mechanism 2.
408 C. Amadio et al. / Engineering Structures 138 (2017) 394–409
could be ensured by calculating the transverse reinforcement areaby reversing the sign of inequality in Eqs. (17) and (18) as follows:
AT;1 6 FRd;1
2ðf yk=csÞtana ð19Þ
AT;2 6 FRd;2
2ðf yk=csÞð20Þ
Therefore, the maximum value of the compressive force trans-mitted by the slab becomes:
Fc;slab;Rd ¼2AT;1ðf yk=csÞ
tanaþ 2AT;2ðf yk=csÞ ð21Þ
Clearly, if the design assumes the beams as dissipative element,the value of Eq. (21) has to satisfy the beam-joint hierarchy (i.e.joint stringer than beam). Conversely, when the dissipation hasto be addressed by the joint, the weak element is the joint itselfand its ductile behaviour is of paramount importance.
Following these suggestions, at least two positive aspects can bepointed out:
– the calculation of the nominal resistance of the joint will be clo-ser to the actual resistance of the joint in place, given thegreater correspondence between the nominal and experimentalresistance that characterizes the metal components withrespect to the concrete components;
– the collapse will be governed by a ductile component (yieldingof the rebars) instead of being governed by a brittle component(crushing of the concrete), allowing a greater absorption ofenergy and thus a better seismic behaviour.
Moreover, it is worth noting that the area of the transverserebars AT;1 is calculated under the hypothesis that the force FRd;1
transmitted by mechanism 1 spreads along the beam by a lengthequal to the seismic effective width under sagging moment bþ
eff
from the face of the column (Fig. 20), and so the resultant of thetransverse tension takes place at a distance of bþ
eff=2 from the faceof the column [41]. Based on this assumption, it seems that thearea of the transverse rebars AT;1 should depend on the configura-tion of the joint (beff changes with the node) and should be spreadalong a distance equal to beff from the internal face of the column.However, the Eurocode sets bþ
eff ¼ 0;15l in the calculation of AT;1
(see Eq. (17)), regardless of the nodal configuration, and suggests
to spread this transverse reinforcement along a distance equal tobb from the internal face of the column.
In light of these findings, and since the transversal reinforce-ment plays a crucial role in the global resistance of a compositejoint (above all following the suggested procedure), further studiesare hence required to investigate the influence of the transversalrebar sizing, in particular with regards to the angle of spreadinga and the length of spreading of the compressive stresses.
6. Summary and conclusions
In this paper, the structural performance of welded steel-concrete joints has been investigated by means of an advancedFinite-Element numerical model (ABAQUS).
Based on a recent research project in which two full-scale testshave been performed to assess the behaviour of exterior compositewelded and bolted joints, careful attention has been first paid tothe seismic performance of the welded specimen only (WJ). Interms of global measurements and specimen performances, theexperiment provided in fact interesting information about the per-formance of welded joints, i.e.:
– the cyclic behaviour highlighted a general good performance ofthe WJ joint, in terms of energy dissipation
– the adopted design approach, in line with Eurocode 8 recom-mendations, was confirmed as a reliable way to guarantee gooddissipative behaviour of the composite connection.
The analysis of the experimental local measurements also high-lighted some important aspects, i.e.:
– a different participation of the longitudinal rebar due to theshear lag effect;
– the effectiveness of the U-shaped rebar in external compositejoints, when subjected to hogging moment;
– the participation of the seismic rebar in the resistance mecha-nisms, as well as the high ductility performance of the concreteslab in contact with the column edge;
– the analysis of the three FE deformation contributions (i.e. (i)the beam, (ii) column and (iii) columnweb panel contributions),finally, confirmed that plastic damage was mainly reached inthe beam only, while the column highlighted a fully elasticbehaviour and the column web panel exhibited only negligibleplastic deformations. This finding is in close agreement with thepast experimental results.
C. Amadio et al. / Engineering Structures 138 (2017) 394–409 409
Based on the experimental test results, a full 3D solid modelwas then developed in ABAQUS, to further assess the monotonicstructural response of the tested welded specimen.
In general, rather close agreement was found between the FEpredictions and the corresponding test measurements, both interms of global and local phenomena. As a result, it is expected thatthe actual numerical approach could be further extended andimplemented for an extensive parametric investigation of compos-ite joints, including a multitude of geometrical and mechanicalconfigurations, as well as composite joints typologies, henceresulting in a valid tool for the calibration of design rules andrecommendations.
To this aim, some first considerations were in fact provided forthe welded joint object of investigation. As observed from a criticalanalysis of the experimental and numerical results, in particular, itwas noticed that the prescriptions of Eurocode 8 on the seizing ofthe seismic rebar could present some flaws which could reduce theoverall ductility of the joint. On the basis of the developed model,some initial considerations were hence made on the transverseseismic rebars placed in the slab in proximity of the joint.
Acknowledgment
DPC-RELUIS 2015 and 2016 is gratefully acknowledged forfunding the research activity.
References
[1] Leon RT. Analysis and design problems for PR composite frames subjected toseismic loads. Eng Struct 1998;20(4–6):364–71.
[2] Thermou GE, Elnashai AS, Plumier A, Doneux C. Seismic design andperformance of composite frames. J Constr Steel Res 2004;60:31–57.
[3] Aribert J, Ciutina A, Dubina D. Seismic response of composite structuresincluding actual behaviour of beam-to-column joints. Compos Constr SteelConcr 2006;V:708–17. http://dx.doi.org/10.1061/40826(186)66.
[4] Zandonini R. Semi-rigid composite joints. In: Narayanan, editor. Structuralconnections stability and strength, Chapter 3. London (UK): Elsevier AppliedScience; 1989. p. 63–120.
[5] Lee S-J, Lu L-W. Cyclic tests of full-scale composite joint subassemblages. JStruct Eng 1989;115(8):1977–98.
[6] Liew JYR, Teo TH, Shanmugam NE, Yu CH. Testing of steel–concrete compositeconnections and appraisal of results. J Constr Steel Res 2000;56:117–50.
[7] Bursi OS, Gramola G. Behaviour of composite substructures with full andpartial shear connection under quasi-static cyclic and pseudo-dynamicdisplacements. Mater Struct/Materiaux et Constructions 2000;33:154–63.
[8] Simões R, Simões da Silva L, Cruz P. Experimental behaviour of end-platebeam-to-column composite joints under monotonical loading. Eng Struct2001;23:1383–409.
[9] Simões R, Simões da Silva L. Cyclic behaviour of end-plate beam-to-columncomposite joints. Steel Compos Struct 2001;1(3):355–76.
[10] Green TP, Leon RT, Rassati GA. Bidirectional tests on partially restrained,composite beam-to-column connections. J Struct Eng 2004;130(2):320–7.Special Issue: Composite and Hybrid Structures.
[11] Liew JYR, Teo TH, Shanmugam NE. Composite joints subject to reversal ofloading—Part 1: experimental study. J Constr Steel Res 2004;60:221–46.
[12] Liew JYR, Teo TH, Shanmugam NE. Composite joints subject to reversal ofloading—Part 2: analytical assessment. J Constr Steel Res 2004;60:247–68.
[13] Nakashima M, Matsumiya T, Suita K, Zhou F. Full-scale test of composite frameunder large cyclic loading. J Struct Eng 2007;133(2):297–304.
[14] Braconi A, Bursi OS, Fabbrocino G, Salvatore W, Tremblay R. Seismicperformance of a 3D full-scale high-ductility steel–concrete compositemoment-resisting structure—Part I: design and testing procedure.Earthquake Eng Struct Dynam 2008;37:1609–34.
[15] Vasdravellis G, Valente M, Castiglioni CA. Behavior of exterior partial-strengthcomposite beam-to-column connections: experimental study and numericalsimulations. J Constr Steel Res 2009;65:23–35.
[16] Mazzolani FM. Mathematical model for semi-rigid joints under cyclic loads. In:Bjorhovde R et al., editors. Connections in steel structures: behaviour, strengthand design. London: Elsevier Applied Science Publishers; 1988. p. 112–20.
[17] Richard RM, Abbott BJ. Versatile elasto-plastic stress-strain formula. J EngMech 1975:511–5.
[18] Salvatore W, Bursi OS, Lucchesi D. Design, testing and analysis of high ductilepartial-strength steel–concrete composite beam-to-column joints. ComputStruct 2005;83(28–30):2334–52.
[19] Zhou F, Mosalam KM, Nakashima M. Finite-element analysis of a compositeframe under large lateral cyclic loading. J Struct Eng 2007;133(7):1018–26.
[20] Braconi A, Salvatore W, Tremblay R, Bursi OS. Behaviour and modelling ofpartial- strength beam-to-column composite joints for seismic applications.Earthquake Eng Struct Dynam 2007;36:142–61.
[21] Braconi A, Bursi OS, Fabbrocino G, Salvatore W, Taucer F, Tremblay R. Seismicperformance of a 3D full-scale high-ductility steel–concrete compositemoment-resisting structure— Part II: test results and analytical validation.Earthquake Eng Struct Dynam 2008;37:1635–55.
[22] Amadio C, Bella M, Bertoni V, Macorini L. Numerical modeling and seismicassessment of steel and steel-concrete composite frames, the line 5 of theReLUIS-DPC 2005–2008 Project, 409–448. Napoli, Italy: Doppiavoce; 2011.
[23] Eurocode 8. Design provisions for earthquake resistance of structures. Part 1.3:general rules. Specific rules for various materials and elements. Brussels,Belgium: CEN, European Committee for Standardisation; 2004.
[24] Eurocode 4. Design of composite steel and composite structures. Part 1.1:general rules and rules for buildings. Brussels, Belgium: CEN, EuropeanCommittee for Standardisation; 2008.
[25] Pecce M, Rossi F. The experimental behavior and simple modeling of joints incomposite MRFs. Eng Struct 2015;105:249–63.
[26] Amadio C, Pecce M, Rossi F, Akkad N, Fasan, M. Experimental study andnumerical simulations of composite joints. Proceedings of EUROSTEEL 2014,September 10–12, Naples, Italy, 2014.
[27] Simulia. ABAQUS theory manual. Dassault Systems; 2012.[28] Simulia. ABAQUS analysis manual. Dassault Systems; 2012.[29] ATC-24. Guidelines for cyclic seismic testing of components of steel structures
for buildings – Report No. ATC-24. Redwood City, CA: Applied TechnologyCouncil; 1992.
[30] Cricrì G. Consistent use of the Gurson-Tvergaard damage model for the R-curve calculation, Proceedings of the IGF XX national conference, pp. 138–150,Torino 24–26 June 2009.
[31] Zhang ZL, Thaulow C, Odegard J. A complete Gurson model approach forductile fracture. Eng Fract Mech 2000;67(2):155–68.
[32] Jiang W, Li Y, Shu Y, Fan Z. Analysis of metallic ductile fracture by extendedGurson models, Proceedings of 13th international conference on fracture, June16–21, 2013, Beijing, China; 2013.
[33] Achouri M, Germain G, Dal Santo P, Saidane D. Implementation and validationof a Gurson damage model modified for shear loading: effect of void growthrate and mesh size on the predicted behavior. Mater Form ESAFORM2012:691–6.
[34] Kiran R, Khandelwal K. Gurson model parameters for ductile fracturesimulation in ASTM A992 steels. Fatigue Fract Eng Mater Struct 2013;37(2).http://dx.doi.org/10.1111/ffe.12097.
[35] Jankowiak T, Lodygowski T. Identification of parameters of concrete damageplasticity constitutive model. Foundation of civil and environmentalengineering, 6: 53–69. Poznan university of technology, Poland; 2005.
[36] EN 1992-1-1. Eurocode 2: design of concrete structures: part 1–1: generalrules and rules for buildings. Brussels, Belgium: CEN; 2004.
[37] Birtel V, Mark P. Parameterised finite element modelling of RC beam shearfailure. Proceedings of 2006 ABAQUS users’ conference, pp. 95–108.
[38] Cornelissen HAW, Hordijk DA, Reinhardt HW. Experimental determination ofcrack softening characteristics of normal weight and lightweight concrete.Heron 1986;31(2):45–56.
[39] Quereshi J, Lam D, Ye J. Effect of shear connector spacing and layout on theshear connector capacity in composite beams. J Constr Steel Res2011;67:706–11.
[40] Bazant ZP. Concrete fracture models: testing and practice. Eng Fract Mech2002;69:165–205.
[41] Plumier A, Doneux C, Bouwkamp JG, Plumier C. Slab design in connection zoneof composite frames. In proc. of the 11th european conference on earthquakeengineering. Rotterdam, Holland; 1998.