Embed Size (px)
Citation preview
IngenIería InvestIgacIón y tecnología
volumen XXII (número 1), enero-marzo 2021 1-13ISSN 2594-0732 FI-UNAM artículo arbitradoInformación del artículo: Recibido: 22 de junio de 2020, aceptado: 1 de octubre de 2020 Attribution-NonCommercial-NoDerivatives 4.0 International (CC BY-NC-ND 4.0) licensehttps://doi.org/10.22201/fi.25940732e.2021.22.1.002
AbstractOne of the basic needs for a country’s economic development is to cover the major fuel demand, and both energy consumption and environmental impacts resulting from the production of such fuels need to be fast and reliable. The purpose of this paper is to contribute to an estimate of energy consumption and atmospheric emissions of some of the pollutant species reported by Pemex Refinacion under different projections. The predictive estimate model was applied considering four different gasoline demand scenarios, as well as different refining technology options to satisfy fuel consumption needs, based on production yields: four different types of refineries, three types of crude oils and eight different processes. Emission estimates were determined applying emission factors, both for the type of fossil fuel energy source used in the direct heating processes for vapor generation, as well by using electric energy. Results show that the equivalent energy consumption relative to the total processes crude is greater in complex refineries (full conversion); however, a greater conversion efficiency allows a smaller volume of crude consumption needed to satisfy the fuel demand with lower emissions relative to other types of technologies. Mexico’s possible refineries need to adapt themselves to different operation scenarios, such as changes in the crude’s yield, the quality of the product, variations in the prices of the crude and of the refined products. Therefore, is important to develop and apply perspectives than maximize productivity and minimize energy consump-tion, reducing air emissions, in constant change scenarios. Finally, the problem would then be evaluating which would be more convenient to obtain a greater socio-economic benefit: reduce emissions to the atmosphere or to lower operation costs of the refinery.Keywords: Energy consumption, oil refineries, energy efficiency, air pollution, gasolines.
ResumenCubrir la demanda de combustibles de mayor consumo es una de las necesidades básicas para el desarrollo económico de un país. Así también, el consumo de energía y los impactos ambientales debidos a la producción de estos combustibles deben ser informados con prontitud y confiabilidad. El objetivo que se persigue en este artículo es contribuir para obtener un estimado del consumo de energía y de las emisiones atmosféricas de algunas de las especies contami-nantes reportadas por Pemex refinación, analizando diferentes proyecciones. El modelo de estimación predictivo se aplicó considerando cuatro escenarios de demanda de gasolinas, así como las siguientes opciones tecnológicas de refinación para satisfacer el consumo del combustible, con base en un rendimiento de producción: cuatro tipos de refinerías, tres tipos de crudo y ocho procesos. La estimación de las emisiones se determinó aplicando factores de emisión, tanto por tipo de fuente de energía fósil consumida en los procesos de calentamiento directo o para la generación de vapor, así como por el uso de energía eléctrica. Los resultados muestran que el consumo equivalente de energía respecto al total de crudo procesado es mayor en las refinerías muy complejas (R4), sin em-bargo, su gran eficiencia de conversión permite consumir menor volumen de crudo para satisfacer la demanda del combustible con emisiones bajas al aire, respecto a otro tipo de tecnologías. Las posibles refinerías en México tendrán que adaptarse a diferentes escenarios operativos, como cambios en el rendimien-to del crudo, calidad del producto, así como variación en los precios del crudo y de los productos refinados. Por lo tanto, es importante desarrollar e imple-mentar enfoques que maximicen la productividad y minimicen el consumo de energía, reduciendo las emisiones atmosféricas en escenarios operativos de constante cambio. Por último, el problema sería entonces evaluar qué sería más conveniente para obtener un mayor beneficio socioeconómico: reducir las emisiones a la atmósfera o disminuir los costos de operación de la refinería.Descriptores: Consumo energético, refinerías de petróleo, eficiencia energética, contaminación del aire, gasolinas.
Energy consumption and atmospheric emissions from refined petroleum in Mexico by 2030Consumo de energía y emisiones atmosféricas por el petróleo refinado en México para el año 2030
Granados-Hernández ElíasUniversidad Nacional Autónoma de MéxicoCentro Tecnológico-FES AragónE-mail: [email protected]://orcid.org/0000-0001-6157-898X
López-Andrade XicoténcatlUniversidad para el Bienestar Benito Juárez GarcíaEscuela de Ingeniería AmbientalE-mail: [email protected]://orcid.org/0000-0001-6303-9576
Vega-Rangel ElizabethUniversidad Nacional Autónoma de MéxicoCentro de Ciencias de la AtmósferaE-mail: [email protected]://orcid.org/0000-0003-2954-950X
Sosa-Echeverría RodolfoUniversidad Nacional Autónoma de MéxicoCentro de Ciencias de la AtmósferaE-mail: [email protected]://orcid.org/0000-0003-2536-7266
Alarcón-Jiménez Ana LuisaUniversidad Nacional Autónoma de MéxicoCentro de Ciencias de la AtmósferaE-mail: [email protected]://orcid.org/0000-0001-7814-7887
Fuentes-García GilbertoUniversidad Nacional Autónoma de MéxicoCentro de Ciencias de la AtmósferaE-mail: [email protected]://orcid.org/0000-0002-5634-5249
Sánchez-Álvarez PabloUniversidad Nacional Autónoma de MéxicoCentro de Ciencias de la AtmósferaE-mail: [email protected] https://orcid.org/0000-0003-2165-8541
IngenIería InvestIgacIón y tecnología, volumen XXII (número 1), enero-marzo 2021: 1-13 ISSN 2594-0732 FI-UNAM2
EnErgy consumption and atmosphEric Emissions from rEfinEd pEtrolEum in mExico by 2030
https://doi.org/10.22201/fi.25940732e.2021.22.1.002
IntroductIon
Oil refineries are big energy-consuming industrial faci-lities (Rossi et al., 2020; Ulyev et al., 2018). Several authors, such as (Ocic, 2005), state that the equivalent energy consumption relative to the processed crude, ranges between 4 % and 8 % (Szklo & Schaeffer, 2007; Ochoa & Jobson, 2015) between 7 % and 15 %, and (Wo-rrel et al., 2015), between 27 % and 35 % with data calcu-lated by this agency. Therefore, energy consumption in an oil refinery may vary in time, due to the type of pro-cessed crude, the complexity of the refinery (U.S. Ener-gy Information Administration, 2012), loading capacity, and other operational factors (Hui et al., 2016).
Additionally, the processes with a greater energy in-tensity in relation to a major load capacity are atmosphe-ric distillation “AD”, vacuum distillation “VD”, catalytic reforming “CR”, catalytic cracking “CC”, hydrocracking “HC”, hydrotreatment “HT”, coking “CK”, and alkyla-tion “AK” (Worrel et al., 2015). The energy consumption of AD and VD is 35 % and 45 % of the total of the diffe-rent processes (Szklo & Schaeffer, 2007), and more than 80 % of the energy consumption results from the refinery products, including refinery gas (RG), petroleum coke (PC), liquid gas (LG), fuel oil (FO), and other refined pro-ducts (Wang et al., 2004), which are used for direct hea-ting or for vapor generation; additionally electricity (EL) is used to power pumps, compressors and other anci-llary equipment (Worrel et al., 2015).
In recent years, the processed crude has become heavier and the established refineries have focused in procuring lighter fuels such as gasoline (Demirbas & Bamufleh, 2017). Among the different oil-derived pro-ducts produced from an oil barrel in a United States refinery, 45 % to 48 % is gasoline (U.S. Energy Informa-tion Administration, 2019) and, according to (Wang et al., 2004), 53.7 % of the energy used in a particular refi-nery is used in the production of fuel.
In contrast, although refineries satisfy society’s energy demands, they can also affect air quality (Ra-gothaman & Anderson, 2017). The World Health Orga-nization (WHO) has identified polluted air as the biggest health hazard and, thus, efforts are needed to maintain a good air quality (World Health Organiza-tion, 2020). This industry is responsible for the emission of several air pollutants (Kalabokas et al., 2001; Hadidi et al., 2016), emitting millions of tons (MM tons) to the air with a potential health risk (Wakefield, 2007). Some of the pollutants emitted by this industry include car-bon monoxide (CO), particles (PM), nitrogen oxides (NOx), sulfur oxides (SOx), and volatile organic com-pounds (VOC) (Worrel et al., 2015).
To this date, Mexico has six oil refineries (Cadere-yta, Madero, Minatitlán, Salamanca, Salina Cruz and Tula), which process three types of crude oils (Olmeca, Istmo and Maya), which are considered as super light, light, and heavy, respectively (Petróleos Mexicanos, 2018). According to the Energy Information System the six refineries had a gasoline production yield of 30.2 % in 2007 and 28.1 % in 2017 (Sistema de Información Energética, 2019).
According to data obtained from the National Insti-tute of Transparency, Access to Information and Perso-nal Data Protection (INAI), the Transformation Subsector of Petróleos Mexicanos (INAI, 2017), reported that the energy self-consumption of the Oil Refining Sector (SNR) was only fuel oil (FO) and electricity (EL), which repre-sented 8 % of the equivalent energy relative to the total processed crude in 2007 and 9 % in 2016. Additionally. Mexico’s oil refineries emitted a total of 326,456 tonnes (tons) in 2016, with a proportion of 84 % (SOx), 6 % (NOx), 4 % (PM) and 5 % (VOC).
Finally Miranda (2018), published an informative note in the newspaper La Jornada, where it is mentioned that gasoline importation increased 63 % and production decreased 50 %, that is, Refining National System de-creased from a production of 437,000 barrels per day (B/D) in 2013, to 217,000 B/D in the first half of 2018. On the other hand, the current situation limits fuel offer for the next years, implying that Mexico will continue im-porting gasoline.
In this sense, the set-up of the oil refining industry in Mexico has the main objective of satisfying the de-mand of different fuels, particularly of gasolines, con-suming the greater volume of the crudes in the country and reporting clearly and timely the energy and envi-ronmental impact that this industry will have. Howe-ver, this depends on a series of challenges which are the bases of study of the present paper, and which will be decisive in the fuel transformation processes.
The principal objective of this study is to estimate the energy consumption and the emissions of CO, SOx, NOx, PM and VOC of the Mexican oil refining industry for the year 2030, with the idea of contributing and ex-tending new information on the atmospheric emissions of this industry, applying different refining technolo-gies used to satisfy the gasoline demand.
Consequently, this paper, after the Introduction, be-gins with information on the possible gasoline demand scenarios in Mexico, after which the energy consump-tion and atmospheric emissions estimates are modeled. Finally, the last two sections emphasize and discuss its results and conclusions, respectively.
3IngenIería InvestIgacIón y tecnología, volumen XXII (número 1), enero-marzo 2021: 1-13 ISSN 2594-0732 FI-UNAM
Granados-Hernández e., López-andrade X., VeGa-ranGeL e., sosa-ecHeVerría r., aLarcón-Jiménez a.L., Fuentes-García G., sáncHez-áLVarez p.
https://doi.org/10.22201/fi.25940732e.2021.22.1.002
GasolIne demand scenarIos In mexIco
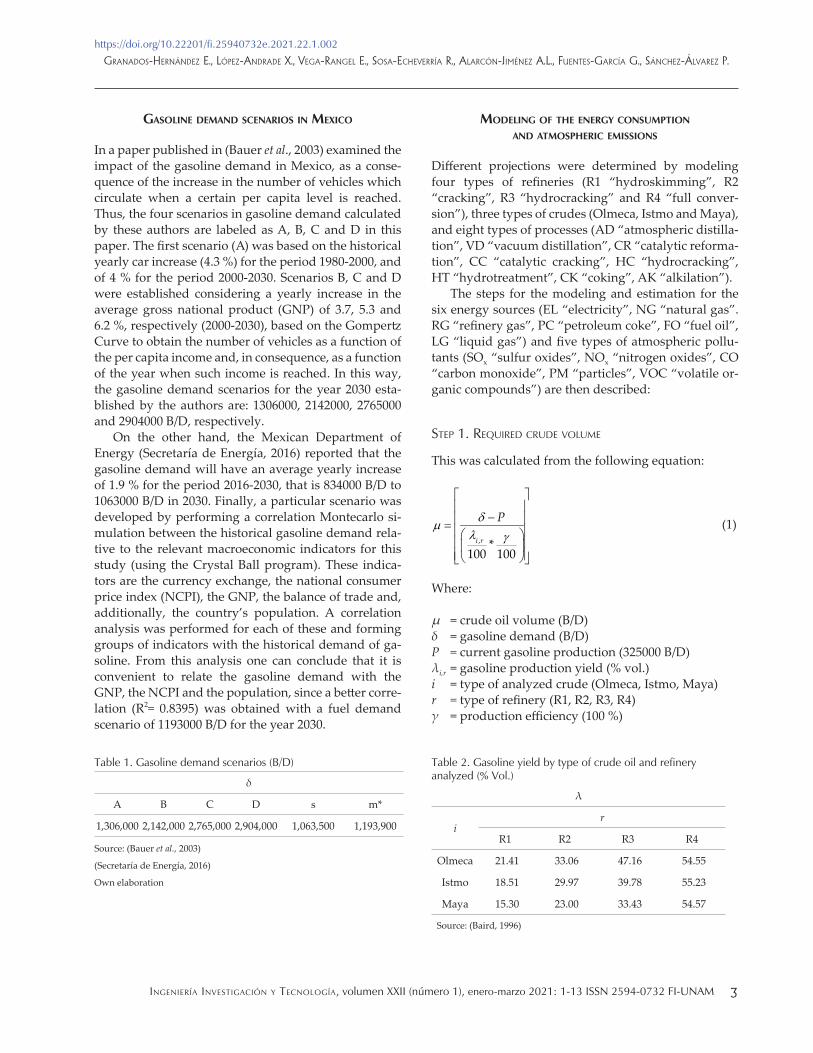
In a paper published in (Bauer et al., 2003) examined the impact of the gasoline demand in Mexico, as a conse-quence of the increase in the number of vehicles which circulate when a certain per capita level is reached. Thus, the four scenarios in gasoline demand calculated by these authors are labeled as A, B, C and D in this paper. The first scenario (A) was based on the historical yearly car increase (4.3 %) for the period 1980-2000, and of 4 % for the period 2000-2030. Scenarios B, C and D were established considering a yearly increase in the average gross national product (GNP) of 3.7, 5.3 and 6.2 %, respectively (2000-2030), based on the Gompertz Curve to obtain the number of vehicles as a function of the per capita income and, in consequence, as a function of the year when such income is reached. In this way, the gasoline demand scenarios for the year 2030 esta-blished by the authors are: 1306000, 2142000, 2765000 and 2904000 B/D, respectively.
On the other hand, the Mexican Department of Energy (Secretaría de Energía, 2016) reported that the gasoline demand will have an average yearly increase of 1.9 % for the period 2016-2030, that is 834000 B/D to 1063000 B/D in 2030. Finally, a particular scenario was developed by performing a correlation Montecarlo si-mulation between the historical gasoline demand rela-tive to the relevant macroeconomic indicators for this study (using the Crystal Ball program). These indica-tors are the currency exchange, the national consumer price index (NCPI), the GNP, the balance of trade and, additionally, the country’s population. A correlation analysis was performed for each of these and forming groups of indicators with the historical demand of ga-soline. From this analysis one can conclude that it is convenient to relate the gasoline demand with the GNP, the NCPI and the population, since a better corre-lation (R2= 0.8395) was obtained with a fuel demand scenario of 1193000 B/D for the year 2030.
modelInG of the enerGy consumptIon and atmospherIc emIssIons
Different projections were determined by modeling four types of refineries (R1 “hydroskimming”, R2 “cracking”, R3 “hydrocracking” and R4 “full conver-sion”), three types of crudes (Olmeca, Istmo and Maya), and eight types of processes (AD “atmospheric distilla-tion”, VD “vacuum distillation”, CR “catalytic reforma-tion”, CC “catalytic cracking”, HC “hydrocracking”, HT “hydrotreatment”, CK “coking”, AK “alkilation”).
The steps for the modeling and estimation for the six energy sources (EL “electricity”, NG “natural gas”. RG “refinery gas”, PC “petroleum coke”, FO “fuel oil”, LG “liquid gas”) and five types of atmospheric pollu-tants (SOx “sulfur oxides”, NOx “nitrogen oxides”, CO “carbon monoxide”, PM “particles”, VOC “volatile or-ganic compounds”) are then described:
Step 1. RequiRed cRude volume
This was calculated from the following equation:
(1)
Where:
µ = crude oil volume (B/D)δ = gasoline demand (B/D)P = current gasoline production (325000 B/D)λi,r = gasoline production yield (% vol.)i = type of analyzed crude (Olmeca, Istmo, Maya)r = type of refinery (R1, R2, R3, R4)γ = production efficiency (100 %)
, *100 100
i r
Pδmλ γ
− =
Table 1. Gasoline demand scenarios (B/D)
δ
A B C D s m*
1,306,000 2,142,000 2,765,000 2,904,000 1,063,500 1,193,900
Source: (Bauer et al., 2003)
(Secretaría de Energía, 2016)
Own elaboration
Table 2. Gasoline yield by type of crude oil and refinery analyzed (% Vol.)
λ
ir
R1 R2 R3 R4
Olmeca 21.41 33.06 47.16 54.55
Istmo 18.51 29.97 39.78 55.23
Maya 15.30 23.00 33.43 54.57
Source: (Baird, 1996)
IngenIería InvestIgacIón y tecnología, volumen XXII (número 1), enero-marzo 2021: 1-13 ISSN 2594-0732 FI-UNAM4
EnErgy consumption and atmosphEric Emissions from rEfinEd pEtrolEum in mExico by 2030
https://doi.org/10.22201/fi.25940732e.2021.22.1.002
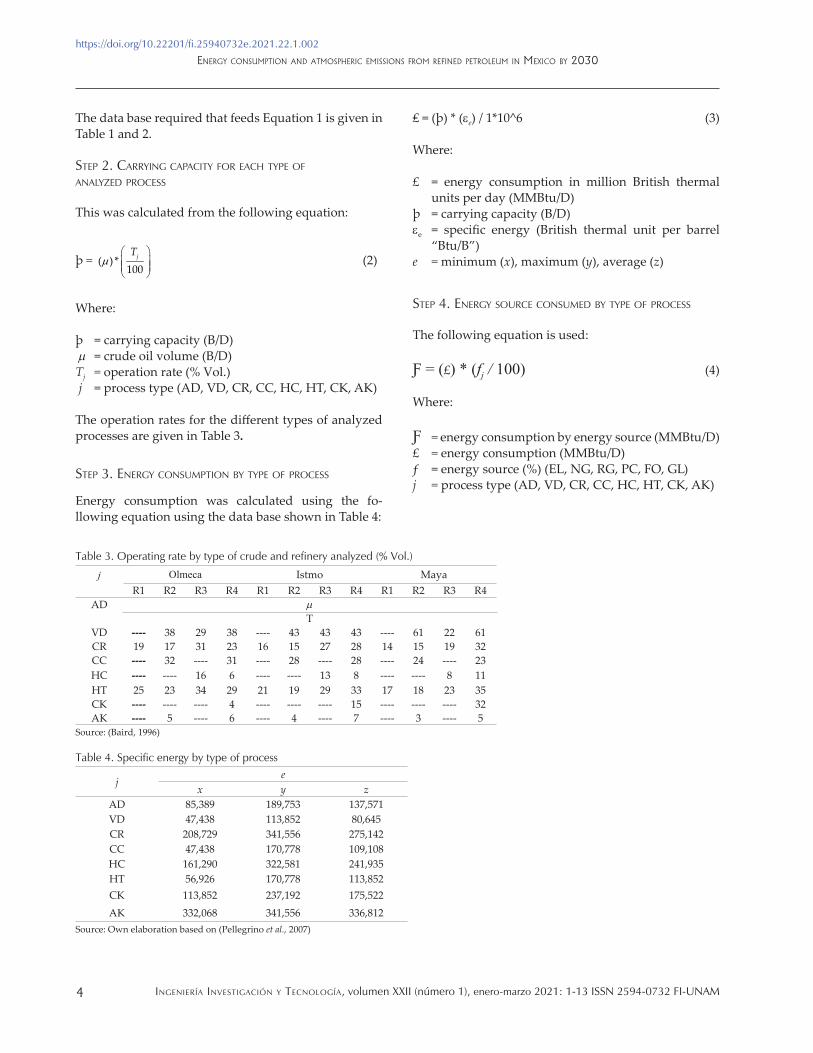
The data base required that feeds Equation 1 is given in Table 1 and 2.
Step 2. caRRying capacity foR each type of analyzed pRoceSS
This was calculated from the following equation:
þ = (2)
Where:
þ = carrying capacity (B/D)m = crude oil volume (B/D)Tj = operation rate (% Vol.) j = process type (AD, VD, CR, CC, HC, HT, CK, AK)
The operation rates for the different types of analyzed processes are given in Table 3.
Step 3. eneRgy conSumption by type of pRoceSS
Energy consumption was calculated using the fo-llowing equation using the data base shown in Table 4:
₤ = (þ) * (εe) / 1*10^6 (3)
Where:
£ = energy consumption in million British thermal units per day (MMBtu/D)
þ = carrying capacity (B/D)εe = specific energy (British thermal unit per barrel
“Btu/B”)e = minimum (x), maximum (y), average (z)
Step 4. eneRgy SouRce conSumed by type of pRoceSS
The following equation is used:
Ƒ = (£) * (fj / 100) (4)
Where:
Ƒ = energy consumption by energy source (MMBtu/D)£ = energy consumption (MMBtu/D)ƒ = energy source (%) (EL, NG, RG, PC, FO, GL)j = process type (AD, VD, CR, CC, HC, HT, CK, AK)
( ) *100
jTm
Table 3. Operating rate by type of crude and refinery analyzed (% Vol.)
j Olmeca Istmo MayaR1 R2 R3 R4 R1 R2 R3 R4 R1 R2 R3 R4
AD mT
VD ---- 38 29 38 ---- 43 43 43 ---- 61 22 61CR 19 17 31 23 16 15 27 28 14 15 19 32CC ---- 32 ---- 31 ---- 28 ---- 28 ---- 24 ---- 23HC ---- ---- 16 6 ---- ---- 13 8 ---- ---- 8 11HT 25 23 34 29 21 19 29 33 17 18 23 35CK ---- ---- ---- 4 ---- ---- ---- 15 ---- ---- ---- 32AK ---- 5 ---- 6 ---- 4 ---- 7 ---- 3 ---- 5
Source: (Baird, 1996)
Table 4. Specific energy by type of process
je
x y zAD 85,389 189,753 137,571VD 47,438 113,852 80,645CR 208,729 341,556 275,142CC 47,438 170,778 109,108HC 161,290 322,581 241,935HT 56,926 170,778 113,852CK 113,852 237,192 175,522AK 332,068 341,556 336,812
Source: Own elaboration based on (Pellegrino et al., 2007)
5IngenIería InvestIgacIón y tecnología, volumen XXII (número 1), enero-marzo 2021: 1-13 ISSN 2594-0732 FI-UNAM
Granados-Hernández e., López-andrade X., VeGa-ranGeL e., sosa-ecHeVerría r., aLarcón-Jiménez a.L., Fuentes-García G., sáncHez-áLVarez p.
https://doi.org/10.22201/fi.25940732e.2021.22.1.002
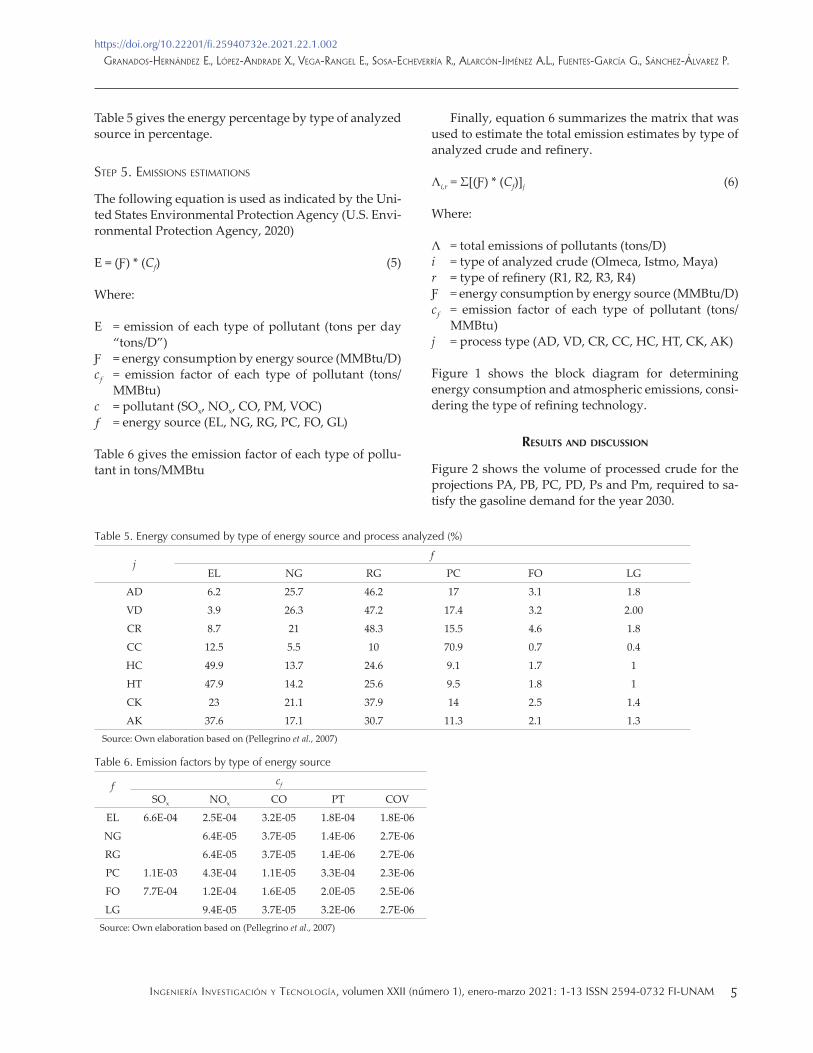
Table 5 gives the energy percentage by type of analyzed source in percentage.
Step 5. emiSSionS eStimationS
The following equation is used as indicated by the Uni-ted States Environmental Protection Agency (U.S. Envi-ronmental Protection Agency, 2020)
E = (Ƒ) * (Cf) (5)
Where:
E = emission of each type of pollutant (tons per day “tons/D”)
Ƒ = energy consumption by energy source (MMBtu/D)cƒ = emission factor of each type of pollutant (tons/
MMBtu)c = pollutant (SOx, NOx, CO, PM, VOC)ƒ = energy source (EL, NG, RG, PC, FO, GL)
Table 6 gives the emission factor of each type of pollu-tant in tons/MMBtu
Finally, equation 6 summarizes the matrix that was used to estimate the total emission estimates by type of analyzed crude and refinery.
Ʌi,r = Σ[(Ƒ) * (Cf)]j (6)
Where:
Ʌ = total emissions of pollutants (tons/D)i = type of analyzed crude (Olmeca, Istmo, Maya)r = type of refinery (R1, R2, R3, R4)Ƒ = energy consumption by energy source (MMBtu/D)cƒ = emission factor of each type of pollutant (tons/
MMBtu)j = process type (AD, VD, CR, CC, HC, HT, CK, AK)
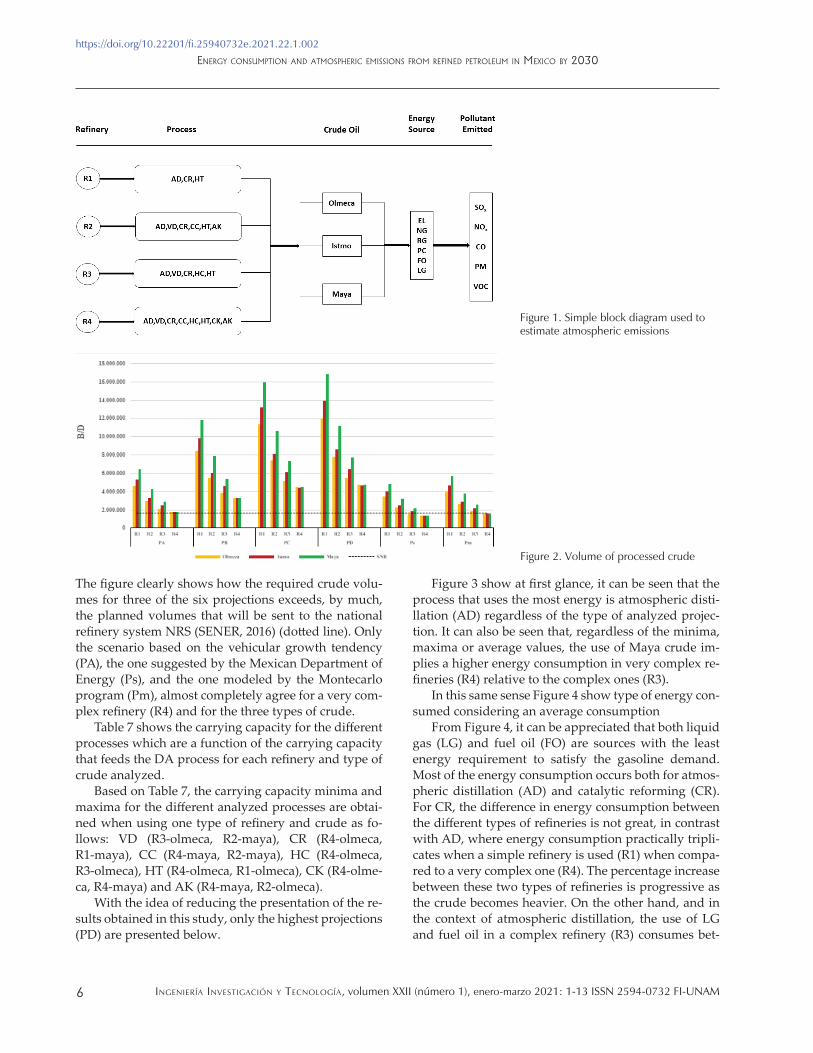
Figure 1 shows the block diagram for determining energy consumption and atmospheric emissions, consi-dering the type of refining technology.
results and dIscussIon
Figure 2 shows the volume of processed crude for the projections PA, PB, PC, PD, Ps and Pm, required to sa-tisfy the gasoline demand for the year 2030.
Table 5. Energy consumed by type of energy source and process analyzed (%)
jf
EL NG RG PC FO LG
AD 6.2 25.7 46.2 17 3.1 1.8
VD 3.9 26.3 47.2 17.4 3.2 2.00
CR 8.7 21 48.3 15.5 4.6 1.8
CC 12.5 5.5 10 70.9 0.7 0.4
HC 49.9 13.7 24.6 9.1 1.7 1
HT 47.9 14.2 25.6 9.5 1.8 1
CK 23 21.1 37.9 14 2.5 1.4
AK 37.6 17.1 30.7 11.3 2.1 1.3 Source: Own elaboration based on (Pellegrino et al., 2007)
Table 6. Emission factors by type of energy source
f cf
SOx NOx CO PT COV
EL 6.6E-04 2.5E-04 3.2E-05 1.8E-04 1.8E-06
NG 6.4E-05 3.7E-05 1.4E-06 2.7E-06
RG 6.4E-05 3.7E-05 1.4E-06 2.7E-06
PC 1.1E-03 4.3E-04 1.1E-05 3.3E-04 2.3E-06
FO 7.7E-04 1.2E-04 1.6E-05 2.0E-05 2.5E-06
LG 9.4E-05 3.7E-05 3.2E-06 2.7E-06Source: Own elaboration based on (Pellegrino et al., 2007)
IngenIería InvestIgacIón y tecnología, volumen XXII (número 1), enero-marzo 2021: 1-13 ISSN 2594-0732 FI-UNAM6
EnErgy consumption and atmosphEric Emissions from rEfinEd pEtrolEum in mExico by 2030
https://doi.org/10.22201/fi.25940732e.2021.22.1.002
The figure clearly shows how the required crude volu-mes for three of the six projections exceeds, by much, the planned volumes that will be sent to the national refinery system NRS (SENER, 2016) (dotted line). Only the scenario based on the vehicular growth tendency (PA), the one suggested by the Mexican Department of Energy (Ps), and the one modeled by the Montecarlo program (Pm), almost completely agree for a very com-plex refinery (R4) and for the three types of crude.
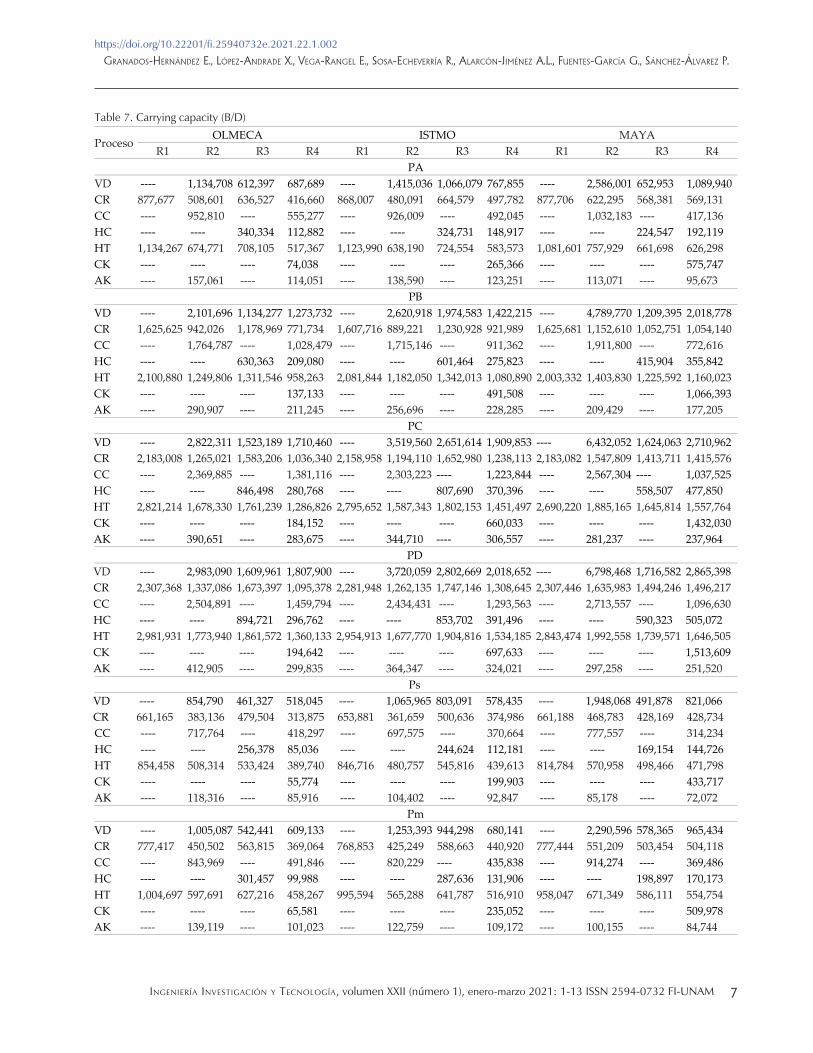
Table 7 shows the carrying capacity for the different processes which are a function of the carrying capacity that feeds the DA process for each refinery and type of crude analyzed.
Based on Table 7, the carrying capacity minima and maxima for the different analyzed processes are obtai-ned when using one type of refinery and crude as fo-llows: VD (R3-olmeca, R2-maya), CR (R4-olmeca, R1-maya), CC (R4-maya, R2-maya), HC (R4-olmeca, R3-olmeca), HT (R4-olmeca, R1-olmeca), CK (R4-olme-ca, R4-maya) and AK (R4-maya, R2-olmeca).
With the idea of reducing the presentation of the re-sults obtained in this study, only the highest projections (PD) are presented below.
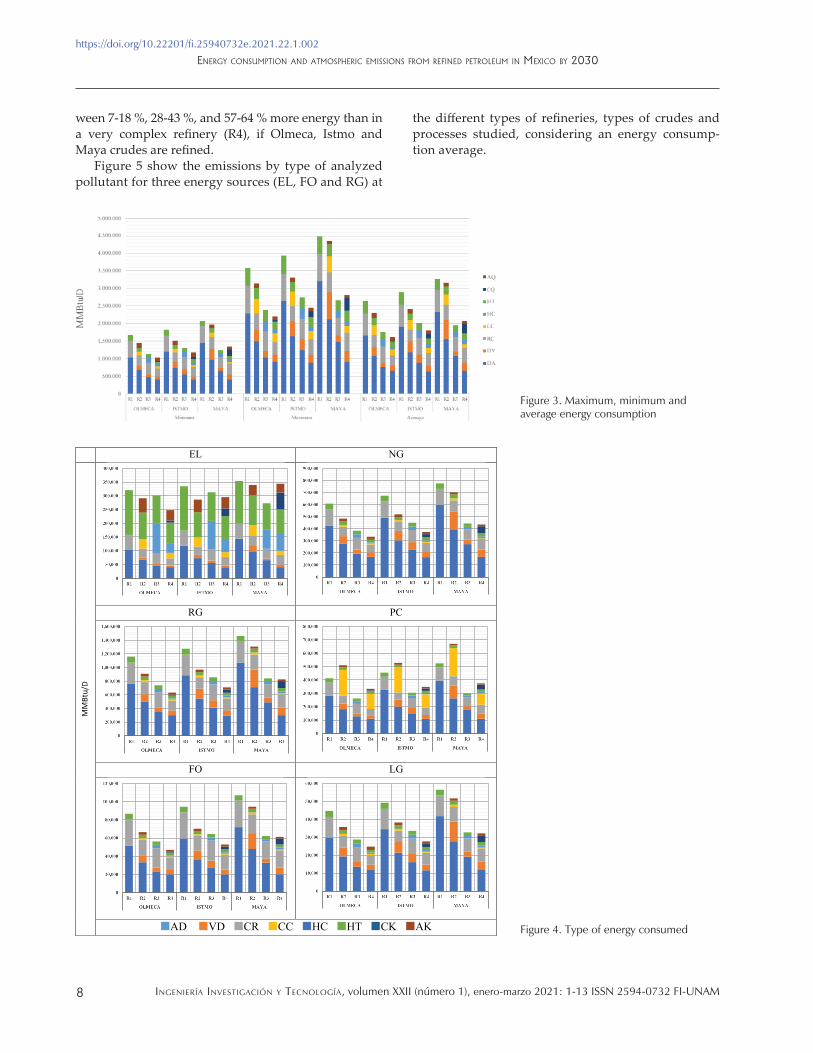
Figure 3 show at first glance, it can be seen that the process that uses the most energy is atmospheric disti-llation (AD) regardless of the type of analyzed projec-tion. It can also be seen that, regardless of the minima, maxima or average values, the use of Maya crude im-plies a higher energy consumption in very complex re-fineries (R4) relative to the complex ones (R3).
In this same sense Figure 4 show type of energy con-sumed considering an average consumption
From Figure 4, it can be appreciated that both liquid gas (LG) and fuel oil (FO) are sources with the least energy requirement to satisfy the gasoline demand. Most of the energy consumption occurs both for atmos-pheric distillation (AD) and catalytic reforming (CR). For CR, the difference in energy consumption between the different types of refineries is not great, in contrast with AD, where energy consumption practically tripli-cates when a simple refinery is used (R1) when compa-red to a very complex one (R4). The percentage increase between these two types of refineries is progressive as the crude becomes heavier. On the other hand, and in the context of atmospheric distillation, the use of LG and fuel oil in a complex refinery (R3) consumes bet-
Figure 1. Simple block diagram used to estimate atmospheric emissions
Figure 2. Volume of processed crude
7IngenIería InvestIgacIón y tecnología, volumen XXII (número 1), enero-marzo 2021: 1-13 ISSN 2594-0732 FI-UNAM
Granados-Hernández e., López-andrade X., VeGa-ranGeL e., sosa-ecHeVerría r., aLarcón-Jiménez a.L., Fuentes-García G., sáncHez-áLVarez p.
https://doi.org/10.22201/fi.25940732e.2021.22.1.002
Table 7. Carrying capacity (B/D)
ProcesoOLMECA ISTMO MAYA
R1 R2 R3 R4 R1 R2 R3 R4 R1 R2 R3 R4PA
VD ---- 1,134,708 612,397 687,689 ---- 1,415,036 1,066,079 767,855 ---- 2,586,001 652,953 1,089,940CR 877,677 508,601 636,527 416,660 868,007 480,091 664,579 497,782 877,706 622,295 568,381 569,131CC ---- 952,810 ---- 555,277 ---- 926,009 ---- 492,045 ---- 1,032,183 ---- 417,136HC ---- ---- 340,334 112,882 ---- ---- 324,731 148,917 ---- ---- 224,547 192,119HT 1,134,267 674,771 708,105 517,367 1,123,990 638,190 724,554 583,573 1,081,601 757,929 661,698 626,298CK ---- ---- ---- 74,038 ---- ---- ---- 265,366 ---- ---- ---- 575,747AK ---- 157,061 ---- 114,051 ---- 138,590 ---- 123,251 ---- 113,071 ---- 95,673
PBVD ---- 2,101,696 1,134,277 1,273,732 ---- 2,620,918 1,974,583 1,422,215 ---- 4,789,770 1,209,395 2,018,778CR 1,625,625 942,026 1,178,969 771,734 1,607,716 889,221 1,230,928 921,989 1,625,681 1,152,610 1,052,751 1,054,140CC ---- 1,764,787 ---- 1,028,479 ---- 1,715,146 ---- 911,362 ---- 1,911,800 ---- 772,616HC ---- ---- 630,363 209,080 ---- ---- 601,464 275,823 ---- ---- 415,904 355,842HT 2,100,880 1,249,806 1,311,546 958,263 2,081,844 1,182,050 1,342,013 1,080,890 2,003,332 1,403,830 1,225,592 1,160,023CK ---- ---- ---- 137,133 ---- ---- ---- 491,508 ---- ---- ---- 1,066,393AK ---- 290,907 ---- 211,245 ---- 256,696 ---- 228,285 ---- 209,429 ---- 177,205
PCVD ---- 2,822,311 1,523,189 1,710,460 ---- 3,519,560 2,651,614 1,909,853 ---- 6,432,052 1,624,063 2,710,962CR 2,183,008 1,265,021 1,583,206 1,036,340 2,158,958 1,194,110 1,652,980 1,238,113 2,183,082 1,547,809 1,413,711 1,415,576CC ---- 2,369,885 ---- 1,381,116 ---- 2,303,223 ---- 1,223,844 ---- 2,567,304 ---- 1,037,525HC ---- ---- 846,498 280,768 ---- ---- 807,690 370,396 ---- ---- 558,507 477,850HT 2,821,214 1,678,330 1,761,239 1,286,826 2,795,652 1,587,343 1,802,153 1,451,497 2,690,220 1,885,165 1,645,814 1,557,764CK ---- ---- ---- 184,152 ---- ---- ---- 660,033 ---- ---- ---- 1,432,030AK ---- 390,651 ---- 283,675 ---- 344,710 ---- 306,557 ---- 281,237 ---- 237,964
PDVD ---- 2,983,090 1,609,961 1,807,900 ---- 3,720,059 2,802,669 2,018,652 ---- 6,798,468 1,716,582 2,865,398CR 2,307,368 1,337,086 1,673,397 1,095,378 2,281,948 1,262,135 1,747,146 1,308,645 2,307,446 1,635,983 1,494,246 1,496,217CC ---- 2,504,891 ---- 1,459,794 ---- 2,434,431 ---- 1,293,563 ---- 2,713,557 ---- 1,096,630HC ---- ---- 894,721 296,762 ---- ---- 853,702 391,496 ---- ---- 590,323 505,072HT 2,981,931 1,773,940 1,861,572 1,360,133 2,954,913 1,677,770 1,904,816 1,534,185 2,843,474 1,992,558 1,739,571 1,646,505CK ---- ---- ---- 194,642 ---- ---- ---- 697,633 ---- ---- ---- 1,513,609AK ---- 412,905 ---- 299,835 ---- 364,347 ---- 324,021 ---- 297,258 ---- 251,520
PsVD ---- 854,790 461,327 518,045 ---- 1,065,965 803,091 578,435 ---- 1,948,068 491,878 821,066CR 661,165 383,136 479,504 313,875 653,881 361,659 500,636 374,986 661,188 468,783 428,169 428,734CC ---- 717,764 ---- 418,297 ---- 697,575 ---- 370,664 ---- 777,557 ---- 314,234HC ---- ---- 256,378 85,036 ---- ---- 244,624 112,181 ---- ---- 169,154 144,726HT 854,458 508,314 533,424 389,740 846,716 480,757 545,816 439,613 814,784 570,958 498,466 471,798CK ---- ---- ---- 55,774 ---- ---- ---- 199,903 ---- ---- ---- 433,717AK ---- 118,316 ---- 85,916 ---- 104,402 ---- 92,847 ---- 85,178 ---- 72,072
PmVD ---- 1,005,087 542,441 609,133 ---- 1,253,393 944,298 680,141 ---- 2,290,596 578,365 965,434CR 777,417 450,502 563,815 369,064 768,853 425,249 588,663 440,920 777,444 551,209 503,454 504,118CC ---- 843,969 ---- 491,846 ---- 820,229 ---- 435,838 ---- 914,274 ---- 369,486HC ---- ---- 301,457 99,988 ---- ---- 287,636 131,906 ---- ---- 198,897 170,173HT 1,004,697 597,691 627,216 458,267 995,594 565,288 641,787 516,910 958,047 671,349 586,111 554,754CK ---- ---- ---- 65,581 ---- ---- ---- 235,052 ---- ---- ---- 509,978AK ---- 139,119 ---- 101,023 ---- 122,759 ---- 109,172 ---- 100,155 ---- 84,744
IngenIería InvestIgacIón y tecnología, volumen XXII (número 1), enero-marzo 2021: 1-13 ISSN 2594-0732 FI-UNAM8
EnErgy consumption and atmosphEric Emissions from rEfinEd pEtrolEum in mExico by 2030
https://doi.org/10.22201/fi.25940732e.2021.22.1.002
ween 7-18 %, 28-43 %, and 57-64 % more energy than in a very complex refinery (R4), if Olmeca, Istmo and Maya crudes are refined.
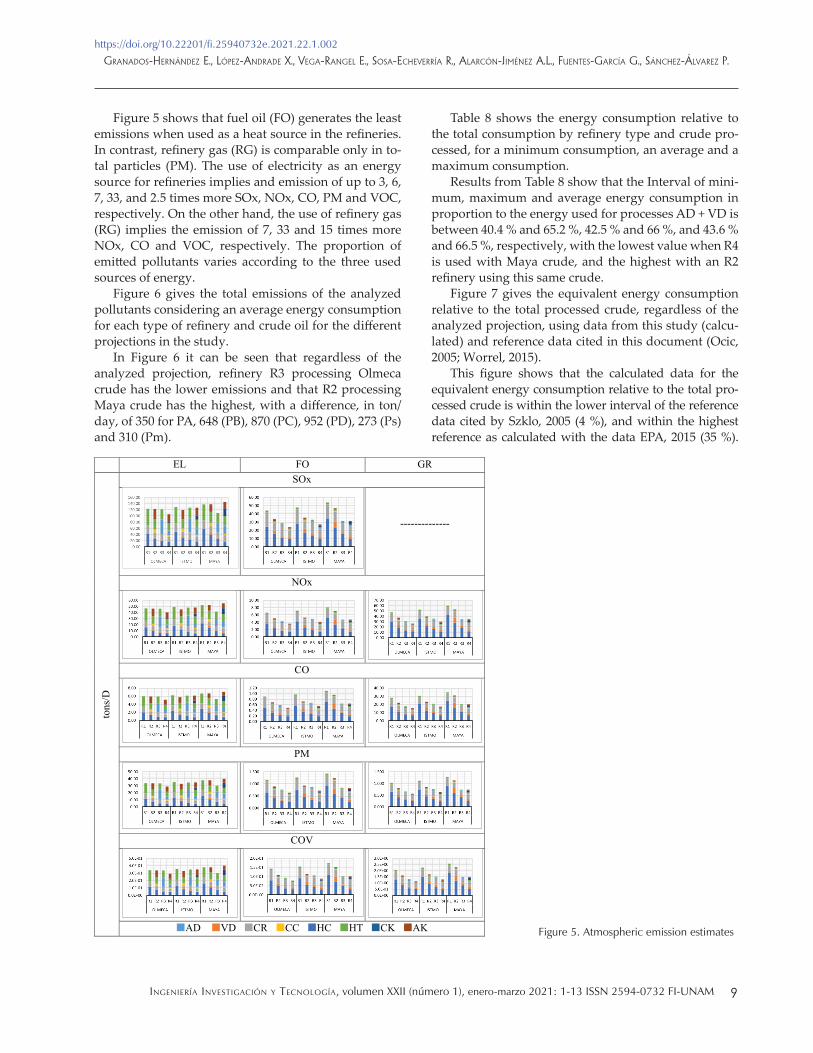
Figure 5 show the emissions by type of analyzed pollutant for three energy sources (EL, FO and RG) at
the different types of refineries, types of crudes and processes studied, considering an energy consump-tion average.
EL NG
MM
Btu/
D
RG PC
FO LG
AD VD CR CC HC HT CK AK
1 Figure 4. Type of energy consumed
Figure 3. Maximum, minimum and average energy consumption
9IngenIería InvestIgacIón y tecnología, volumen XXII (número 1), enero-marzo 2021: 1-13 ISSN 2594-0732 FI-UNAM
Granados-Hernández e., López-andrade X., VeGa-ranGeL e., sosa-ecHeVerría r., aLarcón-Jiménez a.L., Fuentes-García G., sáncHez-áLVarez p.
https://doi.org/10.22201/fi.25940732e.2021.22.1.002
Figure 5 shows that fuel oil (FO) generates the least emissions when used as a heat source in the refineries. In contrast, refinery gas (RG) is comparable only in to-tal particles (PM). The use of electricity as an energy source for refineries implies and emission of up to 3, 6, 7, 33, and 2.5 times more SOx, NOx, CO, PM and VOC, respectively. On the other hand, the use of refinery gas (RG) implies the emission of 7, 33 and 15 times more NOx, CO and VOC, respectively. The proportion of emitted pollutants varies according to the three used sources of energy.
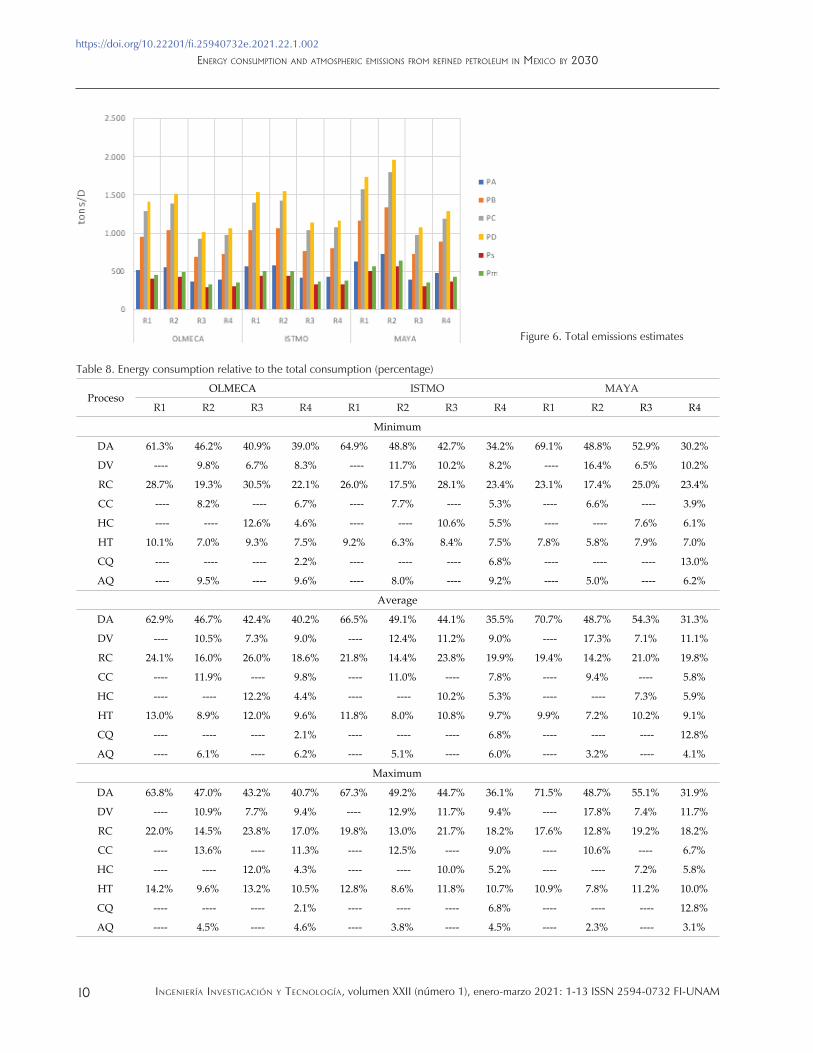
Figure 6 gives the total emissions of the analyzed pollutants considering an average energy consumption for each type of refinery and crude oil for the different projections in the study.
In Figure 6 it can be seen that regardless of the analyzed projection, refinery R3 processing Olmeca crude has the lower emissions and that R2 processing Maya crude has the highest, with a difference, in ton/day, of 350 for PA, 648 (PB), 870 (PC), 952 (PD), 273 (Ps) and 310 (Pm).
Table 8 shows the energy consumption relative to the total consumption by refinery type and crude pro-cessed, for a minimum consumption, an average and a maximum consumption.
Results from Table 8 show that the Interval of mini-mum, maximum and average energy consumption in proportion to the energy used for processes AD + VD is between 40.4 % and 65.2 %, 42.5 % and 66 %, and 43.6 % and 66.5 %, respectively, with the lowest value when R4 is used with Maya crude, and the highest with an R2 refinery using this same crude.
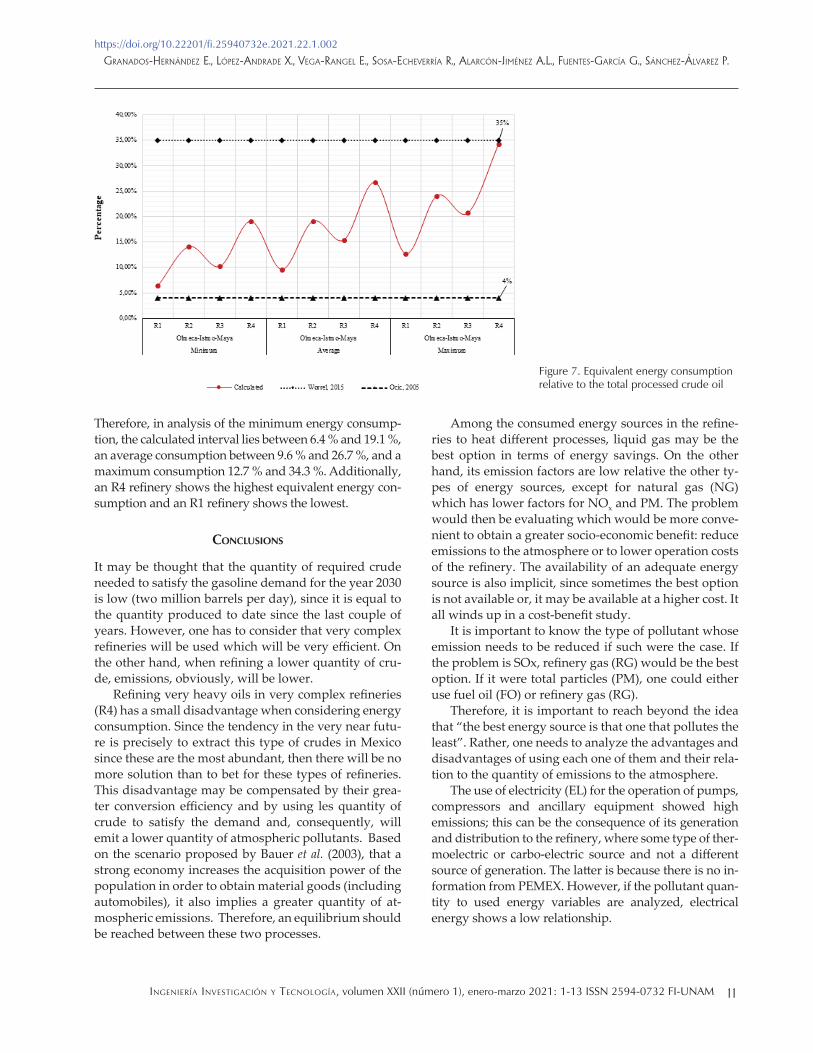
Figure 7 gives the equivalent energy consumption relative to the total processed crude, regardless of the analyzed projection, using data from this study (calcu-lated) and reference data cited in this document (Ocic, 2005; Worrel, 2015).
This figure shows that the calculated data for the equivalent energy consumption relative to the total pro-cessed crude is within the lower interval of the reference data cited by Szklo, 2005 (4 %), and within the highest reference as calculated with the data EPA, 2015 (35 %).
EL FO GR
tons
/D
SOx
--------------
NOx
CO
PM
COV
AD VD CR CC HC HT CK AK
1 Figure 5. Atmospheric emission estimates
IngenIería InvestIgacIón y tecnología, volumen XXII (número 1), enero-marzo 2021: 1-13 ISSN 2594-0732 FI-UNAM10
EnErgy consumption and atmosphEric Emissions from rEfinEd pEtrolEum in mExico by 2030
https://doi.org/10.22201/fi.25940732e.2021.22.1.002
Figure 6. Total emissions estimates
Table 8. Energy consumption relative to the total consumption (percentage)
ProcesoOLMECA ISTMO MAYA
R1 R2 R3 R4 R1 R2 R3 R4 R1 R2 R3 R4
Minimum
DA 61.3% 46.2% 40.9% 39.0% 64.9% 48.8% 42.7% 34.2% 69.1% 48.8% 52.9% 30.2%
DV ---- 9.8% 6.7% 8.3% ---- 11.7% 10.2% 8.2% ---- 16.4% 6.5% 10.2%
RC 28.7% 19.3% 30.5% 22.1% 26.0% 17.5% 28.1% 23.4% 23.1% 17.4% 25.0% 23.4%
CC ---- 8.2% ---- 6.7% ---- 7.7% ---- 5.3% ---- 6.6% ---- 3.9%
HC ---- ---- 12.6% 4.6% ---- ---- 10.6% 5.5% ---- ---- 7.6% 6.1%
HT 10.1% 7.0% 9.3% 7.5% 9.2% 6.3% 8.4% 7.5% 7.8% 5.8% 7.9% 7.0%
CQ ---- ---- ---- 2.2% ---- ---- ---- 6.8% ---- ---- ---- 13.0%
AQ ---- 9.5% ---- 9.6% ---- 8.0% ---- 9.2% ---- 5.0% ---- 6.2%
Average
DA 62.9% 46.7% 42.4% 40.2% 66.5% 49.1% 44.1% 35.5% 70.7% 48.7% 54.3% 31.3%
DV ---- 10.5% 7.3% 9.0% ---- 12.4% 11.2% 9.0% ---- 17.3% 7.1% 11.1%
RC 24.1% 16.0% 26.0% 18.6% 21.8% 14.4% 23.8% 19.9% 19.4% 14.2% 21.0% 19.8%
CC ---- 11.9% ---- 9.8% ---- 11.0% ---- 7.8% ---- 9.4% ---- 5.8%
HC ---- ---- 12.2% 4.4% ---- ---- 10.2% 5.3% ---- ---- 7.3% 5.9%
HT 13.0% 8.9% 12.0% 9.6% 11.8% 8.0% 10.8% 9.7% 9.9% 7.2% 10.2% 9.1%
CQ ---- ---- ---- 2.1% ---- ---- ---- 6.8% ---- ---- ---- 12.8%
AQ ---- 6.1% ---- 6.2% ---- 5.1% ---- 6.0% ---- 3.2% ---- 4.1%
Maximum
DA 63.8% 47.0% 43.2% 40.7% 67.3% 49.2% 44.7% 36.1% 71.5% 48.7% 55.1% 31.9%
DV ---- 10.9% 7.7% 9.4% ---- 12.9% 11.7% 9.4% ---- 17.8% 7.4% 11.7%
RC 22.0% 14.5% 23.8% 17.0% 19.8% 13.0% 21.7% 18.2% 17.6% 12.8% 19.2% 18.2%
CC ---- 13.6% ---- 11.3% ---- 12.5% ---- 9.0% ---- 10.6% ---- 6.7%
HC ---- ---- 12.0% 4.3% ---- ---- 10.0% 5.2% ---- ---- 7.2% 5.8%
HT 14.2% 9.6% 13.2% 10.5% 12.8% 8.6% 11.8% 10.7% 10.9% 7.8% 11.2% 10.0%
CQ ---- ---- ---- 2.1% ---- ---- ---- 6.8% ---- ---- ---- 12.8%
AQ ---- 4.5% ---- 4.6% ---- 3.8% ---- 4.5% ---- 2.3% ---- 3.1%
11IngenIería InvestIgacIón y tecnología, volumen XXII (número 1), enero-marzo 2021: 1-13 ISSN 2594-0732 FI-UNAM
Granados-Hernández e., López-andrade X., VeGa-ranGeL e., sosa-ecHeVerría r., aLarcón-Jiménez a.L., Fuentes-García G., sáncHez-áLVarez p.
https://doi.org/10.22201/fi.25940732e.2021.22.1.002
Therefore, in analysis of the minimum energy consump-tion, the calculated interval lies between 6.4 % and 19.1 %, an average consumption between 9.6 % and 26.7 %, and a maximum consumption 12.7 % and 34.3 %. Additionally, an R4 refinery shows the highest equivalent energy con-sumption and an R1 refinery shows the lowest.
conclusIons
It may be thought that the quantity of required crude needed to satisfy the gasoline demand for the year 2030 is low (two million barrels per day), since it is equal to the quantity produced to date since the last couple of years. However, one has to consider that very complex refineries will be used which will be very efficient. On the other hand, when refining a lower quantity of cru-de, emissions, obviously, will be lower.
Refining very heavy oils in very complex refineries (R4) has a small disadvantage when considering energy consumption. Since the tendency in the very near futu-re is precisely to extract this type of crudes in Mexico since these are the most abundant, then there will be no more solution than to bet for these types of refineries. This disadvantage may be compensated by their grea-ter conversion efficiency and by using les quantity of crude to satisfy the demand and, consequently, will emit a lower quantity of atmospheric pollutants. Based on the scenario proposed by Bauer et al. (2003), that a strong economy increases the acquisition power of the population in order to obtain material goods (including automobiles), it also implies a greater quantity of at-mospheric emissions. Therefore, an equilibrium should be reached between these two processes.
Among the consumed energy sources in the refine-ries to heat different processes, liquid gas may be the best option in terms of energy savings. On the other hand, its emission factors are low relative the other ty-pes of energy sources, except for natural gas (NG) which has lower factors for NOx and PM. The problem would then be evaluating which would be more conve-nient to obtain a greater socio-economic benefit: reduce emissions to the atmosphere or to lower operation costs of the refinery. The availability of an adequate energy source is also implicit, since sometimes the best option is not available or, it may be available at a higher cost. It all winds up in a cost-benefit study.
It is important to know the type of pollutant whose emission needs to be reduced if such were the case. If the problem is SOx, refinery gas (RG) would be the best option. If it were total particles (PM), one could either use fuel oil (FO) or refinery gas (RG).
Therefore, it is important to reach beyond the idea that “the best energy source is that one that pollutes the least”. Rather, one needs to analyze the advantages and disadvantages of using each one of them and their rela-tion to the quantity of emissions to the atmosphere.
The use of electricity (EL) for the operation of pumps, compressors and ancillary equipment showed high emissions; this can be the consequence of its generation and distribution to the refinery, where some type of ther-moelectric or carbo-electric source and not a different source of generation. The latter is because there is no in-formation from PEMEX. However, if the pollutant quan-tity to used energy variables are analyzed, electrical energy shows a low relationship.
Figure 7. Equivalent energy consumption relative to the total processed crude oil
IngenIería InvestIgacIón y tecnología, volumen XXII (número 1), enero-marzo 2021: 1-13 ISSN 2594-0732 FI-UNAM12
EnErgy consumption and atmosphEric Emissions from rEfinEd pEtrolEum in mExico by 2030
https://doi.org/10.22201/fi.25940732e.2021.22.1.002
In relation to the different analyzed processes, the atmospheric distillation and vacuum distillation units should be emphasized since they are characterized by a high energy consumption. This means that their opera-tion has serious implications relative to the product re-venues and operation costs.
The complexity of a refinery in terms of a higher ga-soline production yield is an important factor for ener-gy consumption and atmospheric emissions.
Mexico’s possible refineries need to adapt themsel-ves to different operation scenarios, such as changes in the crude’s yield, the quality of the product, variations in the prices of the crude and of the refined products.
It is important to develop and apply perspectives than maximize productivity and minimize energy con-sumption in constant change scenarios.
In relation with the energy reform in Mexico and the posture of the recently elected President (Andrés Ma-nuel López Obrador), of building a new refinery, this document may help guide to the authorities of the ener-gy sector to plan for a better yield in the production of gasoline and satisfy the possible demand for the future years, as well as minimize atmospheric emissions.
Finally, the demand for gasoline could vary in the future mainly due to the introduction of hybrid or elec-tric vehicles, therefore it would be important to carry out research work that will consider this variable in the projection of the fuel.
references
Baird, C. (1996). Handbook & database of petroleum refining yields. Arizona, USA: HPI Consultants.
Bauer, M., Mar, E. & Elizalde, A. (2003). Transport and energy demand in Mexico: The personal income shock. Energy Policy, 1475-1480. https://doi.org/10.1016/S0301-4215(02)00203-3
Demirbas, A. & Bamufleh, H. (2017). Optimization of crude oil refining products to. Petroleum Science and Technology, 35, 1532-2459. https://doi.org/10.1080/10916466.2016.1261162
Hadidi, L., AlDosary, A., Al-Matar, A. & Mudallah, O. (2016). An optimization model to improve gas emission mitigation in oil refineries. Journal of Cleaner Production, 118, 29-36. https://doi.org/10.1016/j.jclepro.2016.01.033
Hui, L., Renjin, S., Kangyin, D. & Rui, G. (2016). Refining opera-tions: energy consumption and emission. Journal of Computa-tional and Theoretical Nanoscience, 13, 1497-1502. https://doi.org/10.1166/jctn.2016.5074
INAI. (2017, junio 20). Solicitud de información 1867900053417. CDMX.
Kalabokas, P., Hatzianestis, J., Bartzis, J. & Papagiannakopoulos, P. (2001). Atmospheric concentrations of saturated and aro-matic hydrocarbons around a Greek oil refinery. Atmospheric
Environment, 35, 2545-2555. https://doi.org/10.1016/S1352-2310(00)00423-4
Miranda, J. C. (2018). Sube 63 % la importación de gasolinas; baja 50 % la producción. Retrieved from https://www.jornada.com.mx/2018/10/07/
Ochoa, L. & Jobson, M. (2015). Optimization of heat-integrated crude oil distillation systems. Part I: The distillation model. American Chemical Society, 54, 4988-5000. https://doi.org/10.1021ie503802j
Ocic, O. (2005). Oil Refineries in the 21st Century. Pancevo Serbia: WILEY-VCH Verlag GmbH & Co. KGaA, Weinheim.
Pellegrino, J., Brueske, S., Carole, T. & Howard, A. (2007). Energy and environmental profile of the U.S. Petroleum refining indus-try. http://doi.org/10.2172/1218665
Petróleos Mexicanos. (2018). Anuario estadístico. Retrieved from https://www.pemex.com/ri/Publicaciones/Anuario%20Esta-distico%20Archivos/anuario-estadistico_2018.pdf
Ragothaman, A. & Anderson, W. (2017). Air quality impacts of petroleum refining and petrochemical industries. Environ-ments, 4. http://doi.org/10.3390/environments4030066
Rossi, M., Comodi, G., Piacente, N. & Renzi, M. (2020). Energy recovery in oil refineries by means of a Hydraulic Power Re-covery. Applied Energy, 270, 1-10. https://doi.org/10.1016/j.ape-nergy.2020.115097
Secretaría de Energía. (2016). Prospectica de petróleo crudo y pe-trolíferos 2016-2030. Retrieved from http://www.olade.org/realc/docs/doc_103522_20170501101247.pdf
Sistema de Información Energética. (2019). Elaboración de pro-ductos petrolíferos. Retrieved from http://sie.energia.gob.mx/bdiController.do?action=cuadro&subAction=applyOptions
Szklo, A. & Schaeffer, R. (2007). Fuel specification, energy con-sumption and CO2 emission in oil refineries. Energy, 32, 1075-1092. https://doi.org/10.1016/j.energy.2006.08.008
U.S. Energy Information Administration. (2012). Petroleum refi-neries vary by level of complexity. Retrieved from https://www.eia.gov/todayinenergy/detail.php?id=8330
U.S. Energy Information Administration. (2019). Oil and petro-leum products explained: Refining crude oil. Retrieved from https://www.eia.gov/energyexplained/oil-and-petroleum-products/refining-crude-oil.php
U.S. Environmental Protection Agency. (2020). Retrieved from https://www.epa.gov/air-emissions-factors-and-quantification/basic-information-air-emissions-factors-and-quantification.
Ulyev, L., Vasiliev, M. & Boldyryev, S. (2018). Process integration of crude oildistillation with technological and economic res-trictions. Journal of Environmental Management, 222, 454-464. https://doi.org/10.1016/j.jenvman.2018.05.062
Wakefield, B. (2007). A handbook for citizen participation in the per-mitting of oil refineries under the new source review provisions of the clean air act. Retrieved from http://www.environmentalin-tegrity.org/pdf/publications/HANDBOOK_FINAL_121007.pdf
Wang, M., Lee, H. & Molburg, J. (2004). Allocation of energy use in petroleum refineries to petroleum products: implications
13IngenIería InvestIgacIón y tecnología, volumen XXII (número 1), enero-marzo 2021: 1-13 ISSN 2594-0732 FI-UNAM
Granados-Hernández e., López-andrade X., VeGa-ranGeL e., sosa-ecHeVerría r., aLarcón-Jiménez a.L., Fuentes-García G., sáncHez-áLVarez p.
https://doi.org/10.22201/fi.25940732e.2021.22.1.002
for life-cycle energy use and emission inventory of petroleum transportation fuels. The International Journal of Life Cycle As-sessment, 9, 34-44. http://dx.doi.org/10.1065/lca2003.07.129
World Health Organization. (2020). How air pollution is destroying our health. Retrieved from https://www.who.int/air-pollution/news-and-events/how-air-pollution-is-destroying-our-health
Worrel, E., Corsten, M. & Galitsky, C. (2015). Energy efficiency improvement and cost saving opportunities for petroleum re-fineries. Retrieved from https://www.energystar.gov/sites/default/files/tools/ENERGY_STAR_Guide_Petroleum_Refi-neries_20150330.pdf