Embed Size (px)
Citation preview
Relationship between Transmission Intensity andIncidence of Dengue Hemorrhagic Fever in ThailandSuwich Thammapalo1, Yoshiro Nagao2,3*, Wataru Sakamoto4, Seeviga Saengtharatip1, Masaaki
Tsujitani5, Yasuhide Nakamura6, Paul G. Coleman3, Clive Davies3
1 Bureau of Vector Borne Disease, Department of Disease Control, Ministry of Public Health, Nonthaburi, Thailand, 2 Osaka University Graduate School of Medicine, Suita,
Osaka, Japan, 3 London School of Hygiene and Tropical Medicine, London, United Kingdom, 4 Osaka University Graduate School of Engineering, Toyonaka, Osaka, Japan,
5 Osaka Electro-Communication University, Neyagawa, Osaka, Japan, 6 Osaka University Graduate School of Human Sciences, Suita, Osaka, Japan
Abstract
Background: Dengue is the most prevalent mosquito-borne virus, and potentially fatal dengue hemorrhagic fever (DHF)occurs mainly in secondary infections. It recently was hypothesized that, due to the presence of cross-immunity, therelationship between the incidence of DHF and transmission intensity may be negative at areas of intense transmission. Wetested this hypothesis empirically, using vector abundance as a surrogate of transmission intensity.
Methodology/Principal Findings: House Index (HI), which is defined as the percentage of households infested with vectorlarvae/pupae, was obtained from surveys conducted on one million houses in Thailand, between 2002 and 2004. First, theutility of HI as a surrogate of transmission intensity was confirmed because HI was correlated negatively with mean age ofDHF in the population. Next, the relationship between DHF incidence and HI was investigated. DHF incidence increasedonly up to an HI of about 30, but declined thereafter. Reduction of HI from the currently maximal level to 30 would increasethe incidence by more than 40%. Simulations, which implemented a recently proposed model for cross-immunity,generated results that resembled actual epidemiological data. It was predicted that cross-immunity generates a widevariation in incidence, thereby obscuring the relationship between incidence and transmission intensity. The relationshipwould become obvious only if data collected over a long duration (e.g., .10 years) was averaged.
Conclusion: The negative relationship between DHF incidence and dengue transmission intensity implies that in regions ofintense transmission, insufficient reduction of vector abundance may increase long-term DHF incidence. Further studies of aduration much longer than the present study, are warranted.
Citation: Thammapalo S, Nagao Y, Sakamoto W, Saengtharatip S, Tsujitani M, et al. (2008) Relationship between Transmission Intensity and Incidence of DengueHemorrhagic Fever in Thailand. PLoS Negl Trop Dis 2(7): e263. doi:10.1371/journal.pntd.0000263
Editor: Mercedes Pascual, University of Michigan, United States of America
Received October 3, 2007; Accepted June 17, 2008; Published July 16, 2008
Copyright: � 2008 Thammapalo et al. This is an open-access article distributed under the terms of the Creative Commons Attribution License, which permitsunrestricted use, distribution, and reproduction in any medium, provided the original author and source are credited.
Funding: The entomological survey was funded by the Government of Thailand. The funders had no role in study design, data collection and analysis, decisionto publish, or preparation of the manuscript.
Competing Interests: The authors have declared that no competing interests exist.
* E-mail: [email protected] or [email protected]
Introduction
Dengue is the most prevalent vector-borne viral disease, the
distribution of which has been expanding continually [1]. Dengue
virus is transmitted by Aedes mosquitoes [2–4], which breed
predominantly in water-holding containers within human habitats.
Infections with dengue virus may manifest as dengue fever (DF), or
the potentially more fatal dengue hemorrhagic fever (DHF). There
are four serotypes of dengue virus, among which transient cross-
protection exists [5]. Dengue virus is unique in that viral
amplification in a primate host is enhanced dramatically in the
presence of pre-existing immunity to a heterogeneous dengue
serotype(s). This phenomenon, called antibody-dependent en-
hancement (ADE), had been reported initially in other arthropod-
borne virus infections [6,7]. In terms of dengue, ADE was
demonstrated both by in vitro [8] and animal experiments [9].
Subsequently, pre-existing hetero-serotypic antibodies were shown
to be associated with elevated risk for development of DHF [10].
Although the periodicity of highly oscillatory DHF outbreaks has
been under intensive study [11,12], determinants of the absolute
magnitude of DHF incidence remain poorly understood. It would
be understandable if the incidence of DF or DHF were affected
positively by transmission intensity (measured either as force of
infection or basic reproductive number). However, this intuitive
thinking may be too naive in terms of dengue illness. As an example,
increases in DF observed in Singapore were thought to be due to
insufficient vector reduction [13,14]. This paradox may be
explained as follows, at least to some extent, by the age-dependent
manifestation of DF [15,16]. Under more intense transmission,
infections occur at earlier ages [17]. Primary infections of younger
children often result in no symptoms or mild illness [16,18]. As a
result, many infections do not manifest as clinical DF under high
www.plosntds.org 1 July 2008 | Volume 2 | Issue 7 | e263

transmission intensity, and consequently, the incidence of DF
decreases. This state of low incidence of clinical illness under intense
transmission is known as ‘‘endemic stability’’ [15].
In contrast to DF, children seemed to be more prone to manifest
DHF than are adults [19–21]. However, these studies, which did
not fully consider the immunological status of the hosts, cannot be
compared easily. This lack of reliable information about age-
dependency in the manifestation of DHF has made it difficult to
predict whether endemic stability occurs for DHF. On the other
hand, a mathematical model recently predicted that, due to the
presence of transient cross-serotype immunity, the incidence of
DHF and transmission intensity will be correlated negatively at
high transmission intensities [22]. This model hypothesized that a
cross-protected individual will be seroconverted to an infecting
viral serotype, while he/she is protected from manifesting severe
illness. Under this assumption, which is consistent with results
from experiments on monkeys [23], the individual would acquire
immunity to nearly all serotypes while being cross-protected from
clinical illness, at very intense transmission. As a result, the
incidence of DHF could be correlated negatively to transmission
intensity at areas of intense transmission, while the correlation is
positive only at low levels of transmission. In the present study,
such a complex correlation structure mixed with positive and
negative correlations will be called ‘‘non-monotonic’’, hereafter.
To the contrary, correlation structure, which is simply either
positive or negative, is referred to as ‘‘monotonic’’.
The present study aims to provide an empirical example of this
non-monotonic relationship between the incidence of DHF and
transmission intensity, with transmission intensity represented by
vector abundance. Vector abundance is one of the major
determinants for transmission intensity of a vector-borne disease
[24]. Accordingly, the WHO recommends that vector abundance
be quantified in regions highly infested with Aedes through
breeding site surveys and/or adult mosquito collections [25]. In
developing countries, breeding site survey is preferred over
mosquito collection, since the former is less labor-intensive. These
surveys measure the number of houses or water containers infested
by Aedes larvae/pupae through standard larval indices, such as
House index (HI) and Breteau index (BI). HI is defined as the
percentage of all surveyed houses in which Aedes larvae or pupae
are present, while BI represents the number of infested containers
in 100 houses. BI was shown to be relatively sensitive in predicting
transmission [26]. Since HI and BI are strongly positively
correlated [26], HI also may reflect transmission intensity to some
extent. Although the absolute number of pupae is thought to
reflect transmission intensity more directly than do larval indices
[27–29], Southeast Asian households often possess many large
water containers [30], that are irregularly shaped and partially
sealed, making it difficult to obtain precise estimates of the
absolute number of pupae. For this reason, absolute pupal counts
have not been used in large-scale surveys in Thailand.
Here, we describe the empirical relationship between DHF
incidence and transmission intensity, as represented by HI. The
age-specific structure of this relationship also was characterized to
support findings obtained for the entire population. The
epidemiological characteristics of DHF were compared with
predictions made by simulation of an individual-based model
based upon the above mentioned mathematical modelling study.
Our findings have major implications for future epidemiological
surveys and dengue control programs.
Methods
Aedes surveyIn Thailand, the highest incidence of DHF occurs between June
and August. Hence, entomological surveys mainly are conducted in
the pre-epidemic season (e.g., April), with the assumption that vector
abundance in this season will serve as an indicator of disease
incidence later in the year. Between 2002 and 2004, a large-scale
national Aedes survey was conducted in all 914 districts of Thailand.
The survey was intended partly for community education and was
implemented by investigators dispatched from 302 vector control
units and community volunteers, under the supervision of the five
regional vector-borne disease control offices. The administrative
central village or municipality of each sub-district was surveyed
because of their accessibility. A total of 40 houses were visited in
each village/municipality. Prior appointments with the residents
were not made, so that the residents did not clean their houses in
advance. This design, taken with incomplete house registry in rural
areas, made genuine randomization impossible. Surveys were
conducted in April of each year, with 9,483 villages surveyed in
2002, 9,763 in 2003, and 7,482 in 2004. The HI values were
averaged for each district for comparison with district-level DHF
data. The average population of a district in Thailand is 67,500.
Epidemiological dataThe Bureau of Epidemiology, Ministry of Public Health,
provided the annual number of cases of DHF (including Dengue
Shock Syndrome) in nine age categories (0–4, 5–9, 10–14, 15–24,
25–34, 35–44, 45–54, 55–64, $65 years) for each district, for the
years between 1994 and 2004. Age-stratified population data,
based upon five yearly censuses/surveys and yearly projections,
were obtained from the National Statistics Office of Thailand
(http://www.nso.th.go) to calculate DHF incidence. The inci-
dence of DHF in an entire district population was adjusted to the
national age-population structure of 2000 by using the Direct
Method, to eliminate possible interference by the heterogeneity in
demographic structure. The mean age of DHF cases was
calculated as the average of the mid-point of the different age
categories (2.5, 7.5, 12.5, 20, 30, 40, 50, 60, and 75 years)
weighted by the number of cases in each category.
Author Summary
An infection with dengue virus may lead to denguehemorrhagic fever (DHF), a dangerous illness. There is noapproved vaccine for this most prevalent mosquito-bornevirus, which infects tens of millions (or more) peopleannually. Therefore, health authorities have been puttingan emphasis on reduction of vector mosquitoes, genusAedes. However, a new mathematical hypothesis predict-ed, quite paradoxically, that reducing Aedes mosquitoes inhighly endemic countries may ‘‘increase’’ the incidence ofDHF. To test this hypothesis based upon actual data, wecompared DHF incidence collected from each of 1,000districts in Thailand to data of Aedes abundance, whichwas obtained by surveying one million households. Thisanalysis showed that reducing Aedes abundance from thehighest level in Thailand to a moderate level wouldincrease the incidence by more than 40%. In addition, wedeveloped computer simulation software based upon theabove hypothesis. The simulation predicted that epidemi-ological studies should be continued for a very longduration, preferably over a decade, to clearly detect such aparadoxical relationship between Aedes abundance andincidence of DHF. Such long-term studies are necessary,especially because tremendous efforts and resources havebeen (and perhaps will be) spent on combating Aedes.
Dengue Hemorrhagic Fever Incidence in Thailand
www.plosntds.org 2 July 2008 | Volume 2 | Issue 7 | e263

Statistical methodsSubsequent statistical analyses were performed using R 2.6.2
and Stata 9.2. We used non-parametric statistical methods,
Spearman’s rank correlation analysis and the generalized additive
model (GAM), so that analyses did not have to assume any fixed
distribution a priori. Akaike’s Information Criteria (AIC) inversely
represented the goodness of fit, or predictability, for a regression
model obtained from GAM [31]. Deviance around the prediction
also was presented, although this measurement is not adjusted for
degree of freedom (df) used in a regression model.
Analysis of relationship between DHF mean age and HITo ensure that HI could be used as a reliable surrogate of
transmission intensity, we compared the mean age of DHF cases to
HI using rank correlation analysis. A high mean age of DHF cases
was used as an indicator of low transmission intensity, because the
mean age of infected individuals generally is negatively correlated
with the transmission intensity of an acute infectious disease [17].
Since each district was surveyed three times (2002, 2003, and
2004), the possible bias from this repeated measurement was
adjusted by simply aggregating records from three years for each
district. Among the all 914 districts, this analysis incorporated 909
districts that reported at least one case of DHF between 2002 and
2004.
Analysis of the relationship between DHF incidence andHI
We examined the quantitative relationship between incidence of
DHF and HI using GAM. Logarithm was used as the link
function. First, we tested this relationship by incorporating only HI
as the independent variable (univariate analysis). Then, we
adjusted for possible confounding by socioeconomic and climatic
variables. Socioeconomic factors may affect reported incidence in
diverse fashions. For example, incidence may be biased by (a) the
prevalence of health offices, which are responsible for DHF case
reporting in each district. Abundance of breeding places is affected
by local water storage practices (reviewed by [32]). Our analysis
incorporated the following socioeconomic factors that were
reported to be associated with dengue transmission intensity
[33]: (b) per capita number of public large water wells, (c) that of
public small wells, (d) that of private small wells, (e) annual birth
rate per 1,000 individuals, (f) proportion of households owning
land, and (g) proportion of villages in which high schools are
present. These seven socioeconomic variables (a–f), censused every
other year, were obtained from the Information Processing Centre
of Thammasat University, Bangkok, and were interpolated
linearly to the intervening years. On the other hand, dengue
transmission intensity is influenced by climatic factors as well.
Temperature affects critically the rate of viral amplification in
mosquitoes [34]. In addition, extremely high or low temperatures
are rate-determining factors for the growth and survival of
mosquitoes [35]. Atmospheric vapor pressure is known to affect
dengue transmission [36]. Aridity, which is likely to reflect the
scarcity of underground water, may be associated with increased
use of household water containers. To adjust for these possible
confounders, the following climatic variables were obtained from
the University Cooperation for Atmospheric Research [37]: (a)
temperature averaged between January and February, the coolest
months in Thailand (‘‘winter temperature’’, uC), (b) temperature
averaged between April and May, the hottest months (‘‘summer
temperature’’, uC), (c) average vapor pressure (AVP, hPa), and (d)
average pan evapo-transpiration (APET, mm/day). These climatic
variables were obtained from 89 weather stations in Thailand and
its adjacent countries, averaged for each year, and interpolated to
the geographic centroid of each district by using Inverse Distance
Weighting method. We confirmed that multiple interpolation
methods generated comparative results, perhaps because these
weather stations constituted a sufficiently exhaustive dataset [38].
Collectively, these socioeconomic/climatic variables were aver-
aged for the period for which the dependent variable, incidence,
was averaged. We enrolled districts from which socioeconomic
and climatic variables have been available from 1994 to 2004.
Consequently, 785 districts were enrolled. This dataset (incidence
linked with covariates) is available on request from the
corresponding author. Multivariate analyses were conducted using
the following procedure. First, HI and all socioeconomic/climatic
factors were incorporated as independent variables, with df of each
variable set to 2. Next, independent variables that remained
significant (P,0.05) in a stepwise elimination procedure were
selected, generating the ‘‘smallest regression model for df = 2’’.
Finally, df of each of the remaining six variables was replaced with
df = 3, generating 26 combinations of df. Among these, the
combination that exhibited the smallest AIC was adopted as the
‘‘final regression model’’.
Age-stratified analysis of DHF incidence and HIThe relationship between DHF incidence and HI was examined
within different age classes for which original age categories were
aggregated into the following three age classes: 0–4, 5–24, and
$25 years. GAM was applied similarly to these age-class specific
incidences.
SimulationWe employed computer simulations to see whether (and to what
extent) the observed epidemiological pattern could be explained
based upon a theoretical framework. The assumption of the above
Figure 1. Relationship between mean age of Dengue Hemor-rhagic Fever (DHF) cases and House Index in Thailand,averaged between 2002–2004. Each point corresponds to onedistrict in this and subsequent figures.doi:10.1371/journal.pntd.0000263.g001
Dengue Hemorrhagic Fever Incidence in Thailand
www.plosntds.org 3 July 2008 | Volume 2 | Issue 7 | e263

mentioned mathematical model was expressed equivalently by an
individual-based model (see Protocol S1, Section I). This model is
summarized as follows. The cross-protective period was assumed
to be of a fixed duration (‘‘C’’ years). Inoculation by a virus, which
occurred during this cross-protective period, does not develop into
DHF, but induces seroconversion. As the cross-protective period
expires, the individual is predisposed to the risk of manifesting
DHF in a subsequent inoculation by a secondary (or later)
serotype. An individual could manifest DHF after secondary,
tertiary or quaternary infections.
In addition, this individual-based model can incorporate the
age-dependency in the probability to manifest DHF (categorical
parameter ‘‘A’’, defined in Figure S1B in Protocol S1).
Transmission intensity is represented by basic reproductive
number (R0) of dengue virus. The present study parameterized
simulations with the following three scenarios. (I) Cross-immunity
scenario: the duration of cross-serotype protection (‘‘C’’) was set to
two years, while the probability to manifest DHF was assumed to
be independent of age (A = 0). We selected this duration of cross-
immunity based upon the results of sensitivity analysis (see
Protocol S1). (II) Age-dependency scenario: the probability to
manifest DHF in secondary or later infections was assumed to
increase in accordance with the age of the individual (A = 2), while
no cross-immunity was assumed (C = 0). (III) Control scenario: no
cross-immunity or age-dependency was assumed (C = 0, A = 0). R0
was selected by extrapolating the mean age of DHF obtained
between 2002 and 2004 from each of the 785 districts, through the
relationship between R0 and mean age of DHF (Figure S6 in
Protocol S1). This set of R0 values was used as the input for all
three scenarios. Each simulation was run for 150 years.
Comparison of predictability between simulations andactual incidence
At different durations for averaging (W), the goodness of fit was
compared between the statistical models that explained the
incidence in simulations versus those that explained the actual
incidence. Incidences of DHF generated from simulations were
averaged from the last W years [W = 3, 4 … 40] (for example,
148th, 149th and 150th years were averaged for W = 3).
Subsequently, the averaged incidence was regressed against R0
using GAM.
On the other hand, actual incidences were averaged for the
recent W years [W = 3, 4 … 11] (for example, W = 3 corresponds
to 2002–2004; W = 11 corresponds to 1994–2004). Then, the
averaged actual incidence was regressed against HI obtained from
the 2002–2004 survey, and socioeconomic/climatic variables
averaged for the recent W years.
Results
Relationship between mean age of DHF and HIThe national-level mean age of DHF cases was 16 years during
2002 to 2004. The mean HI recorded each April during 2002 to
2004 was 23. As shown in Figure 1, the mean age was negatively
correlated with HI at the district level (Spearman’s R = 20.35,
P,0.0001, N = 909).
Table 1. Contribution of vector abundance and socioeconomic/climatic factors in explaining log incidence of DengueHemorrhagic Fever averaged between 2002 and 2004, revealed by generalized additive model (GAM).
N = 785
1. univariate regression model (df { = 2)
Variable P values
House Index 0.006
Deviance 2,092,809
AIC { 8,428
2. multivariate regression model
full regression model for df = 2 smallest regression model for df = 2 final regression model with mixed df
variables 1 P values
House Index 0.028 0.035 0.031 (df = 2)
APET ,0.001 ,0.001 ,0.001 (df = 2)
winter temperature ,0.001 ,0.001 ,0.001 (df = 2)
summer temperature 0.003 ,0.001 ,0.001 (df = 2)
public large wells 0.004 ,0.001 ,0.001 (df = 3)
birth rate ,0.001 ,0.001 ,0.001 (df = 2)
AVP 0.651
health stations 0.468
high schools 0.301
public small wells 0.846
private small wells 0.401
land ownership 0.714
Deviance 1,558,853 1,572,931 1,566,715
AIC 8,240 8,224 8,223
{ df: degree of freedom; { Akaike’s Information Criterion; 1 AVP: average vapor pressure (hPa); APET: average pan evapo-transpiration (mm/day). Socioeconomicvariables are defined in the text.doi:10.1371/journal.pntd.0000263.t001
Dengue Hemorrhagic Fever Incidence in Thailand
www.plosntds.org 4 July 2008 | Volume 2 | Issue 7 | e263
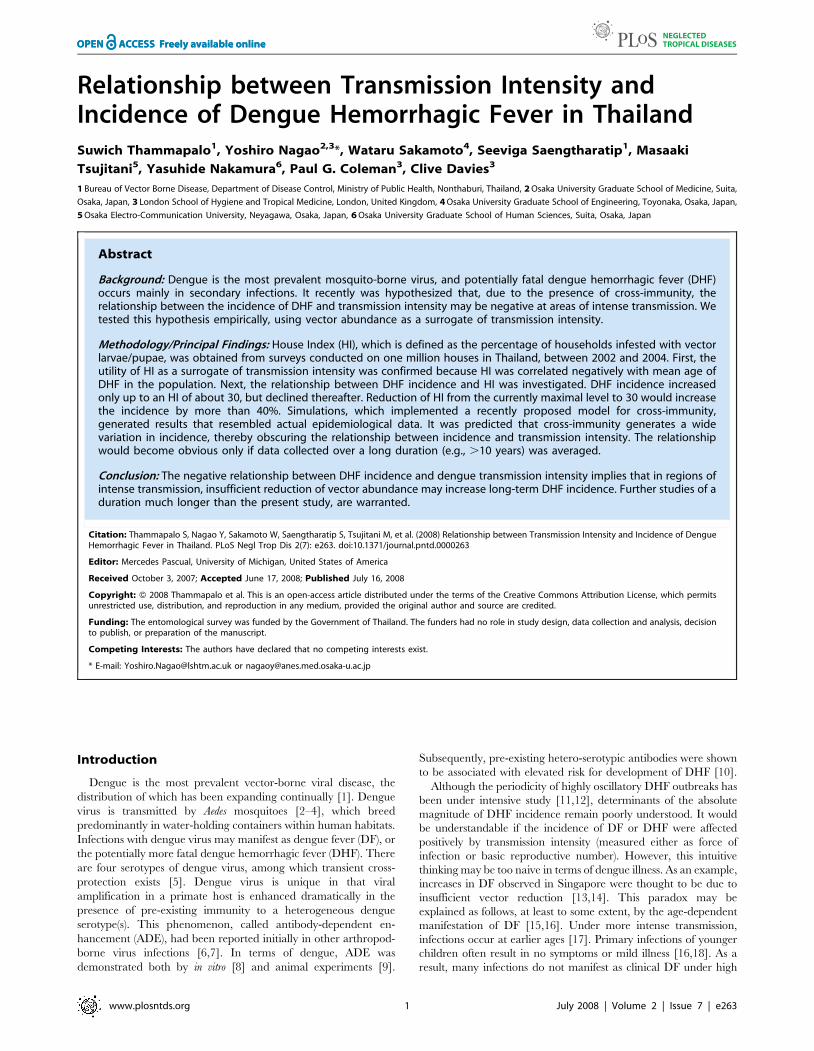
Relationship between DHF incidence and HIDuring 2002 to 2004, the annual DHF incidence was 83 per
100,000 individuals. HI showed a statistically significant contri-
bution to the log incidence of DHF, both in univariate and
multivariate regression models (Table 1). Univariate analysis of
GAM revealed that the correlation between HI and incidence was
positive below about HI = 30, while the correlation was negative
above this HI value (Figure 2B; Figure 3). As HI decreases from 70
to 30, for example, the log incidence would increase by 0.35
(Figure 3), which is equivalent to an increase of 40% in incidence,
since exp (0.35) = 1.4.
In multivariate analysis, the following six variables remained in
the final regression model (Table 1; Figure 4): HI, winter
temperature, summer temperature, APET, public large wells,
and birth rate. The best predictability (or lowest AIC) was
achieved by the final regression model which assigned df = 3 only
to public large wells, and df = 2 to other covariates. Multivariate
analysis estimated that, as HI decreases from 70 to 30, log
incidence would increase by 0.6 (Figure 4A), which corresponds to
an increase of 80%.
Although incorporation of socioeconomic/variables improved
the goodness of fit, this multivariate predictive model still failed to
Figure 2. Relationship between DHF incidence and House Index, observed between 2002 and 2004 in Thailand. The annual incidenceof DHF (per 100,000 individuals) averaged between 2002 and 2004 is plotted against House Index in the entire population (A, B), at 0–4 years (C), 5–24 years (D), and $25 years (E). Y-axis is original scale (A) or log scale (B–E). The lines correspond to the univariate regression model presented inTable 1 for the entire population, and in Table 2 for the age-stratified population.doi:10.1371/journal.pntd.0000263.g002
Dengue Hemorrhagic Fever Incidence in Thailand
www.plosntds.org 5 July 2008 | Volume 2 | Issue 7 | e263

reproduce the very wide variation in the observed incidence
(compare Figure 2B vs Figure 5).
Age-specific relationship between DHF incidence and HIFurther analysis of the age-specific associations between
incidence of DHF and HI was conducted, as shown in Table 2.
Univariate analysis revealed that incidence and HI were positively
correlated in the youngest age class (Figure 2C); whereas, DHF
incidence and HI were negatively correlated in the oldest age class
(Figure 2E). A non-monotonic relationship between DHF
incidence and HI was detected within the intermediate age class
(Figure 2D). When the socioeconomic/climatic variables were
incorporated, the statistical significance of positive correlation
among the youngest age class diminished (Table 2).
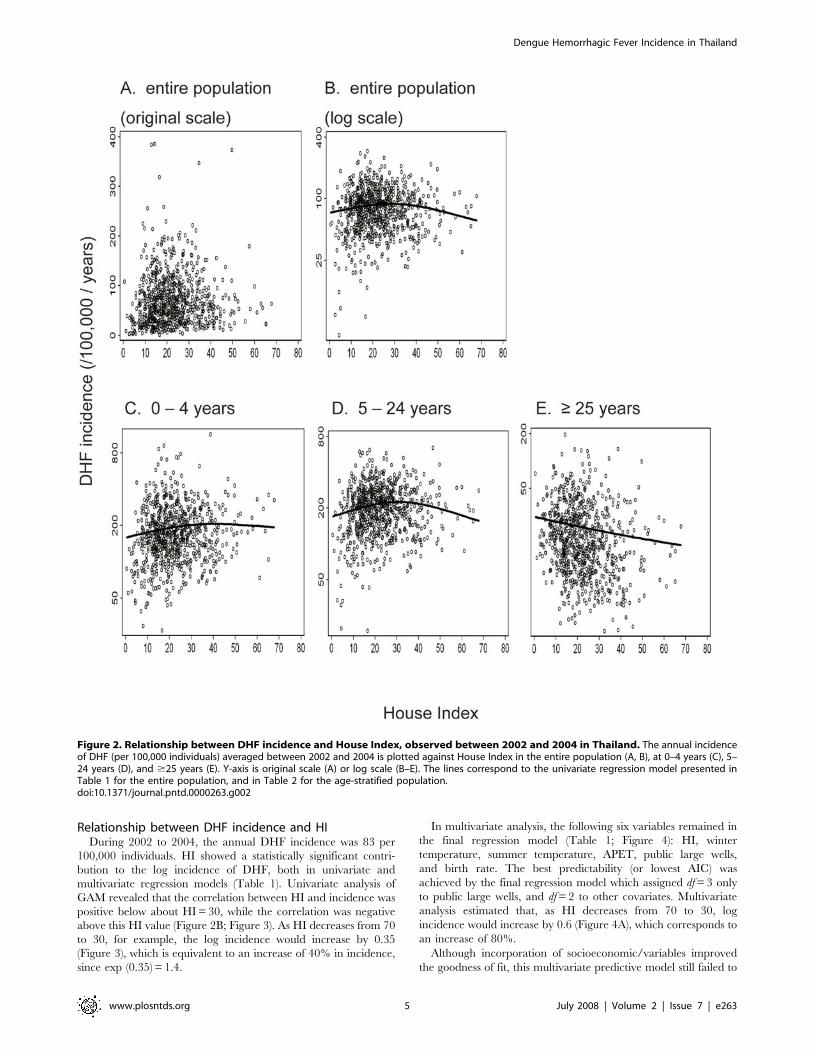
SimulationAs shown in Figure 6, averaging only the last three years of each
simulation resulted in a negligibly detectable relationship between
DHF incidence and R0, which greatly resembled the empirical
relationship (compare with Figure 2B). As the window for
averaging increased, the relationship generally became more
apparent. The incidences generated by simulations with cross-
immunity were much more dispersed than those generated by
other simulations, at any window lengths.
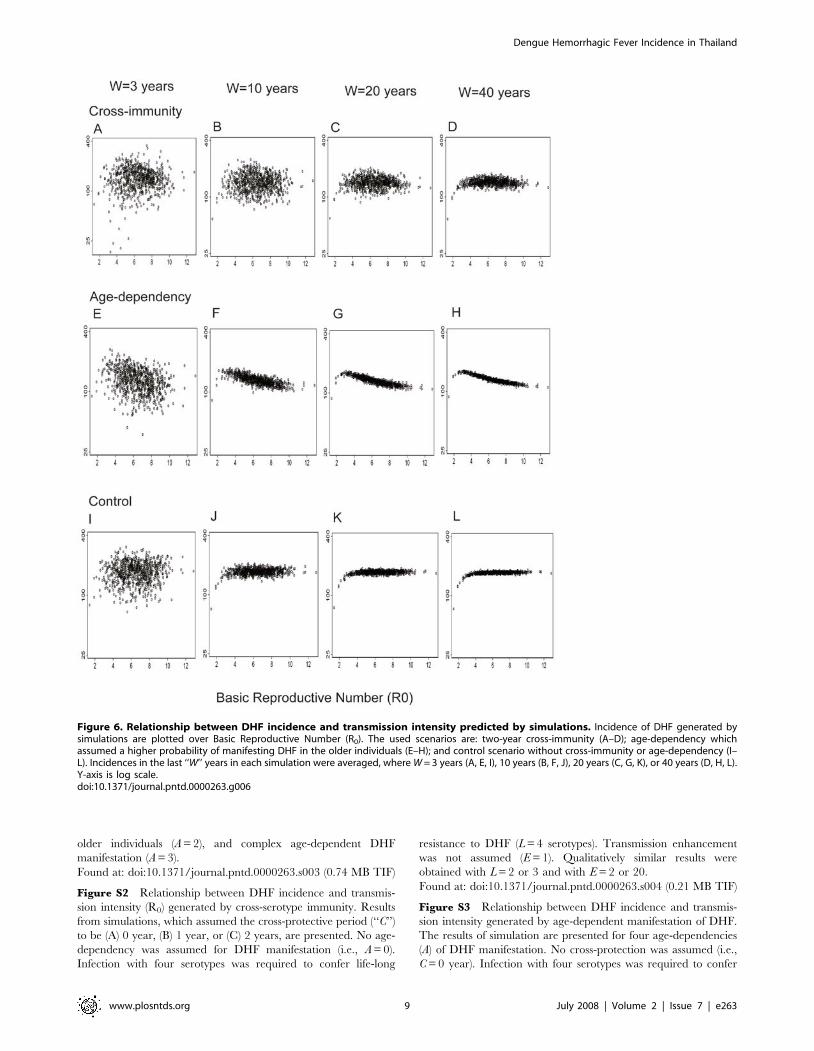
GAM was applied to examine the relationship between
incidences generated by simulations and R0 (Figure 7). As a
result, GAM detected a non-monotonic relationship in the
simulations with cross-immunity (Figure 7A), a negative relation-
ship in those with age-dependency (Figure 7E), and a slightly
positive relationship in the control simulations (Figure 7I). Age-
stratification of the simulation results generated a similar trend in
the empirical data, regardless of the presence of cross-immunity or
age-dependency (Figure 7B–D, F–H, J–L). That is, a positive
correlation was observed between DHF incidence and transmis-
sion intensity in the younger population, and a negative
correlation was present in the older population.
Comparison of predictabilityThe goodness of fit in predicting incidence by R0 showed
remarkable differences between simulation with cross-immunity
and those without cross-immunity (Figure 8). The predictability
was much worse in simulation with cross-immunity than in other
simulations. In addition, the response to the window length was
more complex in the presence of cross-immunity than in other
simulations. That is, in simulations without cross-immunity, the
predictabilities improved continuously as W increased. In contrast,
the predictability in the presence of cross-immunity deteriorated as
the window for averaging increased from W = 3 to W = 4, then
improved up to W = 6. With a small setback at W = 7, it improved
again thereafter. Such a complex response of predictability to W
was reproduced at diverse durations of cross-immunity (Figure 9),
which were sufficiently long to generate dominant supra-annual
periodicities (see Section II and Figure S7 in Protocol S1).
The goodness of fit in predicting actual incidence, either by HI
only or by HI and covariates, showed a similarly complex response
to W (Table 3). The predictability attained solely by HI was much
inferior to that attained in any simulations (Figure 8). However,
the predictability using the multivariate regression model was as
good as that in simulations with cross-immunity, up to W = 8.
Discussion
Our analysis demonstrates that HI is a reliable indicator of
transmission intensity, at least at the district level. The usefulness
of HI is evident by its highly significant, inverse relationship to
mean age, otherwise equivalent to a positive correlation between
HI and transmission intensity. Our findings are consistent with
observations from Singapore, where an increase in the mean age
of patients with dengue infection was preceded by a substantial
reduction in HI [13,14].
Analysis of DHF incidence among the entire Thai population
revealed that incidence rose up to HI of about 30 and gradually
declined thereafter. This non-monotonic relationship appears to
be consistent with a state of endemic stability. However, the age-
dependency in the probability to manifest DHF may not simply
satisfy the condition for endemic stability, because DHF occurs
more frequently in children than in adults. On the other hand,
cross-immunity explains not only this non-monotonic relationship
(Figure S2 in Protocol S1), but also the wide variation in incidence
of DHF, as well as its complex response to the duration of window
for averaging (Figure S8 in Protocol S1). Of note, the regression
model comprised of HI and socioeconomic/climatic variables
predicted actual incidence to the same goodness of fit, with which
R0 predicted incidence from simulations with cross-immunity
(Figure 8). This finding may support the validity of the multivariate
regression model, and that of our assumption for cross-immunity,
simultaneously.
Stratification of data according to age revealed a positive
association between DHF incidence and HI among the youngest
population. In contrast, a negative association was observed in the
oldest population. These contrasting correlations may be
explained as follows. Under low transmission intensity, the
majority of individuals in the youngest age class do not possess
Figure 3. Non-linear responses of the log incidence of DHF toHouse Index, revealed by univariate analysis of generalizedadditive model (GAM). The smoothing function obtained from GAManalysis, which regressed the log of DHF incidence reported between2002 and 2004 against House Index, is presented as the solid line.Dashed line represents the 95% confidence interval, while the spikes onthe horizontal axis represent the frequency of data points (or districts)in this and the next figure.doi:10.1371/journal.pntd.0000263.g003
Dengue Hemorrhagic Fever Incidence in Thailand
www.plosntds.org 6 July 2008 | Volume 2 | Issue 7 | e263

antibodies against any serotype and are relatively resistant to
DHF. As the transmission intensity increases, a larger number of
individuals in this age class possess antibodies to only one serotype,
making them predisposed to DHF. Therefore, the correlation
between DHF incidence and transmission intensity becomes
positive in the youngest age class, as observed here. In contrast,
when transmission intensity is low, many in the oldest age class
possess antibodies against only one serotype and are predisposed
to DHF. As transmission intensity increases, more members of this
age class possess antibodies against almost all serotypes, conferring
Figure 4. Non-linear responses of the log incidence of DHF to House Index and socioeconomic/climatic variables revealed bymultivarite analysis of GAM. The final regression model obtained from the multivariate GAM analysis (Table 1) is presented. Log incidence of DHFreported between 2002 to 2004 was regressed against House Index and socioeconomic/variables. The per capital number of public large wells wasassigned with df = 3, while other covariates were assigned with df = 2.doi:10.1371/journal.pntd.0000263.g004
Dengue Hemorrhagic Fever Incidence in Thailand
www.plosntds.org 7 July 2008 | Volume 2 | Issue 7 | e263

resistance to DHF. Importantly, these age-stratified relationships
could be reproduced by simulations of any scenarios examined.
Therefore, this analysis did not differentiate whether cross-
immunity or age-dependency determined the epidemiological
characteristics of DHF.
The negative response of incidence to transmission intensity at
areas of intense transmission has important public health
implications, regardless of its underlying mechanism. The
incidence of DHF is affected by the dominant virus serotype,
which shifts from period to period [39,40]. In addition, HI
measured in one country cannot be compared with HI in another
country. Since our analysis was based on a single three-year period
in one country, the stability of our estimated HI value at the
maximum (‘‘turning’’) point should be treated with some caution.
However, with these caveats, our results indicate that insufficient
reduction of vector abundance in highly endemic areas could
result in an increased incidence of DHF. As the HI decreases from
the current highest level in Thailand, the incidence of DHF could
increase by more than 40%. Any medical/public-health interven-
tion that causes a foreseeable increase of illness should be subject
to ethical discussion.
Theoretically, sufficiently radical reduction of vector mosquitoes
can achieve a decrease of the entire incidence of DHF. However, it
is unclear whether such radical vector control is possible at a
nation-wide scale in developing countries. Instead, reduction of the
vector population may become stagnant as the vector abundance
decreases. Furthermore, even substantial vector reduction (for
example, from HI = 60 to10) would not necessarily decrease the
final incidence (extrapolate the HI values to incidence in Figure 3
and Figure 4A), but would result most likely in a greater number of
DHF cases accumulated over the course of time. This calculation
suggests that it is extremely difficult for vector control alone to
achieve the ultimate goal of control program– reduction of
incidence.
Supporting Information
Protocol S1
Found at: doi:10.1371/journal.pntd.0000263.s001 (0.25 MB
DOC)
Table S1 Definition and values of scenario parameters assigned
to each simulation of Dengue Hemorrhagic Fever (DHF)
Found at: doi:10.1371/journal.pntd.0000263.s002 (0.04 MB
DOC)
Figure S1 Individual-Based Model for Dengue Hemorrhagic
Fever (DHF). A. Diagram of the transition between immunological
states caused by infections with wild type virus. The transition
between immunological states was a result of either viral
inoculation (solid arrow) or expiration of time from the most
recent inoculation (broken arrow). The serotype(s) that an
individual has experienced is recorded as the existence of
protective antibodies to this serotype(s). B. Age-dependent
probability for a secondary infection to manifest as DHF in a
DHF-predisposed individual. Four hypothetical possibilities of
age-dependency are defined: no age-dependency (A = 0), higher
probability in younger individuals (A = 1), higher probability in
Figure 5. Prediction of DHF incidence based upon House Indexand socioeconomic/climatic variables. Incidence of DHF waspredicted based upon the final regression model (Table 1) and plottedagainst House Index. Y-axis is log scale.doi:10.1371/journal.pntd.0000263.g005
Table 2. Relationship between vector abundance andincidence of DHF stratified for age classes, revealed by GAM.
N = 785
Age class 0–4 years 5–24 years $25 years
1. univariate regression model (df { = 2)
variable P values
House Index 0.044 0.001 0.008
Deviance 5,592,654 12,851,371 290,947
AIC { 9,200 9,852 6,879
2. multivariate regression model (final regression model with mixed df)
variables 1 P values
House Index 0.031 (df = 3) 0.002 (df = 2)
APET ,0.001 (df = 3) ,0.001 (df = 2) 0.006 (df = 2)
winter temperature ,0.001 (df = 2) ,0.001 (df = 2) 0.003 (df = 2)
summer temperature ,0.001 (df = 2) ,0.001 (df = 2) 0.005 (df = 2)
public large wells 0.002 (df = 3) ,0.001 (df = 2)
birth rate ,0.001 (df = 2)
AVP ,0.001 (df = 3)
health stations
high schools 0.008 (df = 3)
public small wells
private small wells ,0.001 (df = 2)
land ownership 0.001 (df = 2) ,0.001 (df = 3)
Deviance 4,592,236 10,128,066 165,907
AIC 9,058 9,689 6,476
{ df: degree of freedom; { Akaike’s Information Criterion; 1 AVP: average vaporpressure (hPa); APET: average pan evapo-transpiration (mm/day).Socioeconomic variables are defined in the text.doi:10.1371/journal.pntd.0000263.t002
Dengue Hemorrhagic Fever Incidence in Thailand
www.plosntds.org 8 July 2008 | Volume 2 | Issue 7 | e263
older individuals (A = 2), and complex age-dependent DHF
manifestation (A = 3).
Found at: doi:10.1371/journal.pntd.0000263.s003 (0.74 MB TIF)
Figure S2 Relationship between DHF incidence and transmis-
sion intensity (R0) generated by cross-serotype immunity. Results
from simulations, which assumed the cross-protective period (‘‘C’’)
to be (A) 0 year, (B) 1 year, or (C) 2 years, are presented. No age-
dependency was assumed for DHF manifestation (i.e., A = 0).
Infection with four serotypes was required to confer life-long
resistance to DHF (L = 4 serotypes). Transmission enhancement
was not assumed (E = 1). Qualitatively similar results were
obtained with L = 2 or 3 and with E = 2 or 20.
Found at: doi:10.1371/journal.pntd.0000263.s004 (0.21 MB TIF)
Figure S3 Relationship between DHF incidence and transmis-
sion intensity generated by age-dependent manifestation of DHF.
The results of simulation are presented for four age-dependencies
(A) of DHF manifestation. No cross-protection was assumed (i.e.,
C = 0 year). Infection with four serotypes was required to confer
Figure 6. Relationship between DHF incidence and transmission intensity predicted by simulations. Incidence of DHF generated bysimulations are plotted over Basic Reproductive Number (R0). The used scenarios are: two-year cross-immunity (A–D); age-dependency whichassumed a higher probability of manifesting DHF in the older individuals (E–H); and control scenario without cross-immunity or age-dependency (I–L). Incidences in the last ‘‘W’’ years in each simulation were averaged, where W = 3 years (A, E, I), 10 years (B, F, J), 20 years (C, G, K), or 40 years (D, H, L).Y-axis is log scale.doi:10.1371/journal.pntd.0000263.g006
Dengue Hemorrhagic Fever Incidence in Thailand
www.plosntds.org 9 July 2008 | Volume 2 | Issue 7 | e263
life-long immunity (L = 4 serotypes). Transmission enhancement
was not assumed (E = 1). Qualitatively similar results were
obtained with L = 2 or 3, and with E = 2 or 20.
Found at: doi:10.1371/journal.pntd.0000263.s005 (0.26 MB TIF)
Figure S4 Relationship between DHF incidence and transmis-
sion intensity generated by transmission enhancement. Transmis-
sion enhancement (E) during manifesting DHF was assumed to be
1 (no enhancement), 2 or 20. No age-dependency or cross-
Figure 7. Age-specific relationship between DHF incidence and transmission intensity predicted by simulations. Age-stratifiedincidence of DHF in the last three years from each simulation were averaged. The parameters inputted to simulations were: two-year cross-immunity(A–D); age-dependency which assumes a higher probability of manifesting DHF in older individuals (E–H); control scenario without cross-immunity orage-dependency (I–L). DHF incidence presented for the entire population (A, E, I) or stratified into 0–4 years (B, F, J), 5–24 years (C, G, K), and $25years (D, H, L). Y-axis is log scale.doi:10.1371/journal.pntd.0000263.g007
Dengue Hemorrhagic Fever Incidence in Thailand
www.plosntds.org 10 July 2008 | Volume 2 | Issue 7 | e263
protection was assumed (i.e., A = 0, C = 0 year). Infection with four
serotypes was required to confer life-long immunity (L = 4
serotypes). Qualitatively similar results were obtained with L = 2
or 3.
Found at: doi:10.1371/journal.pntd.0000263.s006 (0.18 MB
DOC)
Figure S5 Temporal pattern of alternating serotypes in the
presence of cross immunity and effects of a sudden drop in
transmission intensity. Examples of serotype-specific incidence of
DHF are presented. The last 40 years are presented.
Found at: doi:10.1371/journal.pntd.0000263.s007 (1.18 MB TIF)
Figure S6 Relationship between mean age of DHF cases and
Dengue transmission intensity (R0) Mean age of DHF cases is
plotted against transmission intensity (R0). The result for a
parameter setting (C = 2 years, L = 4 serotypes, A = no age-
dependency, E = 1) is presented. All other parameter combinations
examined generated similarly negative correlations between mean
age of DHF cases and R0.
Found at: doi:10.1371/journal.pntd.0000263.s008 (0.14 MB TIF)
Figure S7 Periodicity profile (periodogram) for incidence
generated by simulations for Dengue Hemorrhagic Fever (DHF).
Individual-based simulation for DHF (described in the accompa-
nying manuscript) was executed for 150 years, from which
monthly incidence for the last 40 years was analyzed by fast
Fourier transform with Daniell smoothing (provided in R 2.6.2).
Parameters for simulations are as follows: cross-immunity of 0.5
year (A–C), one year (D–F), two years (G–I), three years (J–L), and
four years (M–O); age-dependency, which attributes a higher
probability of manifesting DHF to the older population [defined as
A = 2 in the accompanying manuscript] (P–R); control (i.e., no
cross-immunity, no age-dependency) (S–U). Transmission intensi-
ty inputted to simulations were R0 = 3 (A, D, G, J, M, P, S), R0 = 6
(B, E, H, K, N, Q, T), or R0 = 12 (C, F, I, L, O, R, U). We
executed each parameter setting in duplicate, and confirmed that
the resulting periodograms were very similar. The highest
spectrum intensity was presented as 1, for each parameter setting.
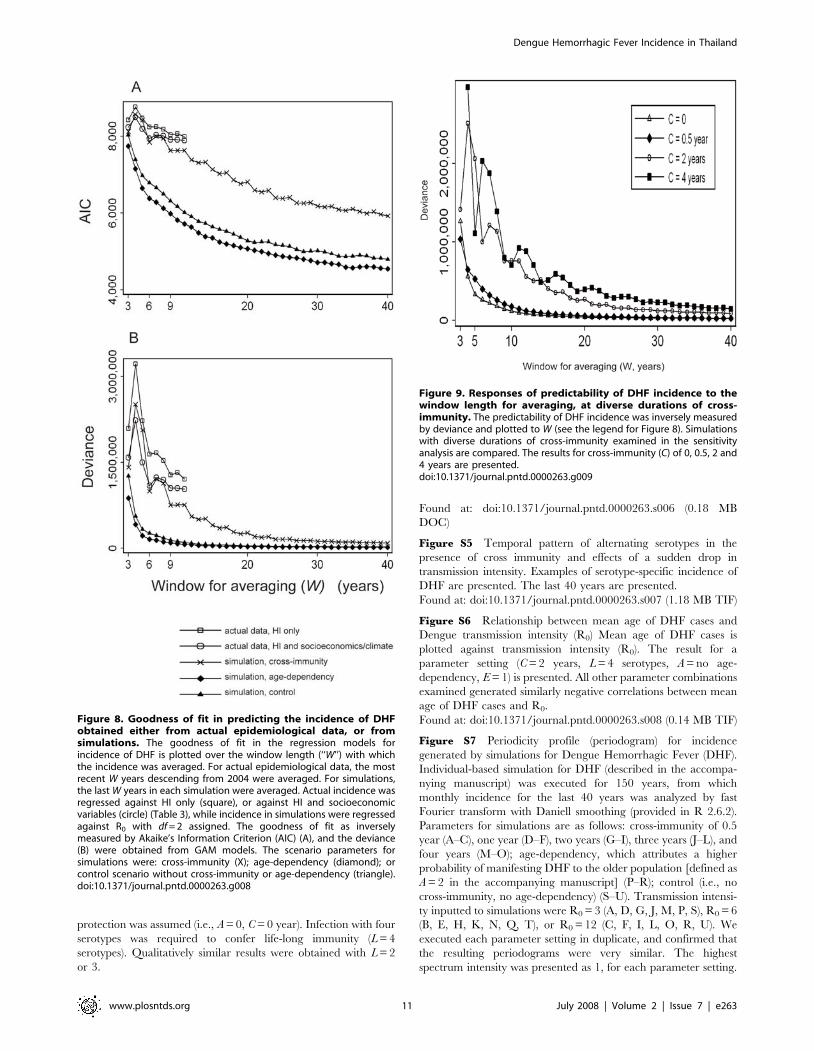
Figure 8. Goodness of fit in predicting the incidence of DHFobtained either from actual epidemiological data, or fromsimulations. The goodness of fit in the regression models forincidence of DHF is plotted over the window length (‘‘W’’) with whichthe incidence was averaged. For actual epidemiological data, the mostrecent W years descending from 2004 were averaged. For simulations,the last W years in each simulation were averaged. Actual incidence wasregressed against HI only (square), or against HI and socioeconomicvariables (circle) (Table 3), while incidence in simulations were regressedagainst R0 with df = 2 assigned. The goodness of fit as inverselymeasured by Akaike’s Information Criterion (AIC) (A), and the deviance(B) were obtained from GAM models. The scenario parameters forsimulations were: cross-immunity (X); age-dependency (diamond); orcontrol scenario without cross-immunity or age-dependency (triangle).doi:10.1371/journal.pntd.0000263.g008
Figure 9. Responses of predictability of DHF incidence to thewindow length for averaging, at diverse durations of cross-immunity. The predictability of DHF incidence was inversely measuredby deviance and plotted to W (see the legend for Figure 8). Simulationswith diverse durations of cross-immunity examined in the sensitivityanalysis are compared. The results for cross-immunity (C) of 0, 0.5, 2 and4 years are presented.doi:10.1371/journal.pntd.0000263.g009
Dengue Hemorrhagic Fever Incidence in Thailand
www.plosntds.org 11 July 2008 | Volume 2 | Issue 7 | e263

Found at: doi:10.1371/journal.pntd.0000263.s009 (0.87 MB TIF)
Figure S8 Standard deviation in the asynchronous sinusoidal
incidences. One hundred sinusoidal curves, with asynchronous
phases, were generated, to emulate the incidence of DHF. The
sinusoidal incidence was averaged for diverse window lengths
(‘‘W’’), and standard deviation was measured among these averaged
incidences. A. Each sinusoidal time-series follows cycles of exactly
one year (diamond) or three years (x). B. To add noise to the cycles,
the cycle at each time-series was selected randomly between 0.8 and
1.2 years (diamond), or between 2.6 and 3.4 years (x).
Found at: doi:10.1371/journal.pntd.0000263.s010 (0.47 MB TIF)
Alternative Language Abstract S1 Translation of the Abstract
into Japanese by Yoshiro Nagao
Found at: doi:10.1371/journal.pntd.0000263.s011 (0.09 MB PDF)
Acknowledgments
We thank the community volunteers as well as the staff of vector control
units and regional vector-borne disease control offices. We thank Professor
Takashi Mashimo, Dr. Katia Koelle, Dr. Joseph Egger, Mrs. Ladda
Likityingwara, Dr. Usavadee Thavara, Ms. Pensri Chitnumsup, Dr. Ichiro
Kurane, Dr. Diarmid Campbell-Lendrum, and Professor Susumu Hotta
for their advice and assistance. We are grateful to a reviewer for suggesting
the use of GAM.
Author Contributions
Conceived and designed the experiments: ST. Analyzed the data: PC CD
YN WS MT. Contributed reagents/materials/analysis tools: WS. Wrote
the paper: PC CD YN ST. Organized collaboration and collected data:.
Conducted entomological surveys:.
References
1. Gubler DJ (1997) Dengue and dengue hemorrhagic fever: its history and
resurgence as a global public health problem. In: Gubler DJ, Kuno G, eds (1997)
Dengue and Dengue Hemorrhagic Fever. Wallingford: CAB International. pp
1–22.
2. Cleland JB, Bradley B, McDonald W (1916) On the transmission of Australian
dengue by the mosquito Stegomyia fasciata. Medical Journal of Australia 2:
179–205.
3. Siler JF, Hall MW, Hitchens AP (1926) Dengue: the history, epidemiology,
mechanism of transmission, etiology, clinical manifestations, immunity, and
prevention. Philippine Journal of Science 29: 1–304.
4. Simmons JS, St John JH, Reynolds FHK (1931) Experimental studies of dengue.
Philippine Journal of Science 44: 1–247.
5. Sabin AB (1952) Research on dengue during World War II. Am J Trop Med
Hyg 1: 30–50.
6. Hawkes RA (1964) Enhancement of the Infectivity of Arboviruses by Specific
Antisera Produced in Domestic Fowls. Aust J Exp Biol Med Sci 42: 465–482.
7. Hawkes RA, Lafferty KJ (1967) The enhancement of virus infectivity by
antibody. Virology 33: 250–261.
8. Halstead SB, O’Rourke EJ (1977) Antibody-enhanced dengue virus infection in
primate leukocytes. Nature 265: 739–741.
9. Halstead SB, O’Rourke EJ (1977) Dengue viruses and mononuclear phagocytes.
I. Infection enhancement by non-neutralizing antibody. J Exp Med 146:
201–217.
10. Sangkawibha N, Rojanasuphot S, Ahandrik S, Viriyapongse S, Jatanasen S, et
al. (1984) Risk factors in dengue shock syndrome: a prospective epidemiologic
study in Rayong, Thailand. I. The 1980 outbreak. Am J Epidemiol 120:
653–669.
11. Hay SI, Myers MF, Burke DS, Vaughn DW, Endy T, et al. (2000) Etiology of
interepidemic periods of mosquito-borne disease. Proc Natl Acad Sci U S A 97:
9335–9339.
12. Cazelles B, Chavez M, McMichael AJ, Hales S (2005) Nonstationary influence
of El Nino on the synchronous dengue epidemics in Thailand. PLoS Med 2:
e106. doi:10.1371/journal.pmed.0020106.
13. Ooi EE, Goh KT, Gubler DJ (2006) Dengue prevention and 35 years of vector
control in Singapore. Emerg Infect Dis 12: 887–893.
14. Egger JR, Ooi EE, Kelly DW, Woolhouse ME, Davies CR, et al. (2007)
Reconstructing historical changes in the force of infection of dengue fever in
Singapore: implications for surveillance and control. Bulletin of the World
Health Organization 86: 187–196.
15. Coleman PG, Perry BD, Woolhouse ME (2001) Endemic stability–a veterinary
idea applied to human public health. Lancet 357: 1284–1286.
16. Egger JR, Coleman PG (2007) Age and clinical dengue illness. Emerging
Infectious Diseases 13: 924–925.
17. Anderson RM, May RM (1991) Infectious Diseases of Humans: Dynamics and
Control. Oxford: Oxford University Press.
18. Dantes HG, Koopman JS, Addy CL, Zarate ML, Marin MA, et al. (1988)
Dengue epidemics on the Pacific Coast of Mexico. Int J Epidemiol 17: 178–186.
19. Guzman MG, Kouri G, Valdes L, Bravo J, Alvarez M, et al. (2000)
Epidemiologic studies on Dengue in Santiago de Cuba, 1997. Am J Epidemiol
152: 793–799; discussion 804.
Table 3. Contribution of vector abundance and socioeconomic/climatic factors in explaining log incidence of DHF averaged overdiverse durations, revealed by GAM.
N = 785
window for averaing (years) 3 4 5 6 7 8 9 10 11
1. univariate regression model (df { = 2)
variable level of P values
House Index ** ** ** * * * ** ** *
AIC { 8,428 8,767 8,477 8,239 8,250 8,183 8,040 8,069 7,993
2. multivariate regression model (final regression model with mixed df)
variables 1 level of P values
House Index * * * * * * *
APET *** *** *** *** *** *** ** *
winter temperature *** *** *** *** *** *** *** *** ***
summer temperature *** ** *** * * *** *
public large wells *** ** ** ** *
birth rate *** *** *** *** *** *** *** *** ***
AIC 8,223 8,497 8,180 7,932 8,037 8,011 7,908 7,913 7,905
{ df: degree of freedom; { Akaike’s Information Criterion; 1 APET: average pan evapo-transpiration (mm/day). Socioeconomic variables are defined in the text. Variable‘‘public large wells’’ was assigned df = 3. All other independent variables were assigned df = 2. *: P,0.05, **: P,0.01, ***: P,0.001.doi:10.1371/journal.pntd.0000263.t003
Dengue Hemorrhagic Fever Incidence in Thailand
www.plosntds.org 12 July 2008 | Volume 2 | Issue 7 | e263

20. Guzman MG, Kouri G, Bravo J, Valdes L, Vazquez S, et al. (2002) Effect of age
on outcome of secondary dengue 2 infections. Int J Infect Dis 6: 118–124.21. Hammond SN, Balmaseda A, Perez L, Tellez Y, Saborio SI, et al. (2005)
Differences in dengue severity in infants, children, and adults in a 3-year
hospital-based study in Nicaragua. Am J Trop Med Hyg 73: 1063–1070.22. Nagao Y, Koelle K (2008) Decreases in dengue transmission may act to increase
the incidence of dengue hemorrhagic fever. Proc Natl Acad Sci U S A 105:2238–2243.
23. Kochel TJ, Watts DM, Gozalo AS, Ewing DF, Porter KR, et al. (2005) Cross-
serotype neutralization of dengue virus in Aotus nancymae monkeys. J Infect Dis191: 1000–1004.
24. Macdonald G (1952) The analysis of equilibrium in malaria. Trop Dis Bull 49:813–829.
25. WHO (1997) Vector surveillance and control. Dengue haemorrhagic feverDiagnosis, treatment, prevention and control. 2nd ed. Geneva: World Health
Organization. pp 48–59.
26. Sanchez L, Vanlerberghe V, Alfonso L, Marquetti Mdel C, Guzman MG, et al.(2006) Aedes aegypti larval indices and risk for dengue epidemics. Emerg Infect
Dis 12: 800–806.27. Focks DA, Chadee DD (1997) Pupal survey: an epidemiologically significant
surveillance method for Aedes aegypti: an example using data from Trinidad.
Am J Trop Med Hyg 56: 159–167.28. Reiter P, Gubler DJ (1998) Surveillance and control of urban dengue vectors. In:
Gubler DJ, Kuno G, eds (1998) Dengue and Dengue Hemorrhagic Fever.Wallingford: CAB International. pp 425–462.
29. Nathan MB, Focks DA, Kroeger A (2006) Pupal/demographic surveys to informdengue-vector control. Ann Trop Med Parasitol 100 Suppl 1: S1–S3.
30. Wellmer H (1983) Dengue Haemorrhagic Fever in Thailand. Geomedical
observations on developments over the period 1970–1979. Berlin: Springer-Verlag.
31. Figueiras A, Cadarso-Suarez C (2001) Application of nonparametric models for
calculating odds ratios and their confidence intervals for continuous exposures.
Am J Epidemiol 154: 264–275.
32. Kuno G (1997) Factors influencing the transmission of dengue viruses. In:
Gubler DJ, Kuno G, eds (1997) Dengue and Dengue Hemorrhagic Fever. New
York: CAB International. pp 61–88.
33. Nagao Y, Svasti P, Tawatsin A, Thavara U (2007) Geographical structure of
dengue transmission and its determinants in Thailand. Epidemiol Infect. pp 1–9.
34. Watts DM, Burke DS, Harrison BA, Whitmire RE, Nisalak A (1987) Effect of
temperature on the vector efficiency of Aedes aegypti for dengue 2 virus.
Am J Trop Med Hyg 36: 143–152.
35. Clements AN (1992) The Biology of Mosquitoes. Volume 1. Development,
Nutrition and Reproduction. London: Chapman and Hall.
36. Hales S, de Wet N, Maindonald J, Woodward A (2002) Potential effect of
population and climate changes on global distribution of dengue fever: an
empirical model. Lancet 360: 830–834.
37. UCAR Climate Prediction Center Global Summary of Day/Month Observa-
tions. http://dss.ucar.edu/datasets/ds512.0/.
38. Goovaerts P (1997) Geostatistics for Natural Resources Evaluation. New York:
Oxford University Press, USA.
39. Nisalak A, Endy TP, Nimmannitya S, Kalayanarooj S, Thisayakorn U, et al.
(2003) Serotype-specific dengue virus circulation and dengue disease in Bangkok,
Thailand from 1973 to 1999. Am J Trop Med Hyg 68: 191–202.
40. Endy TP, Nisalak A, Chunsuttiwat S, Libraty DH, Green S, et al. (2002) Spatial
and temporal circulation of dengue virus serotypes: a prospective study of
primary school children in Kamphaeng Phet, Thailand. Am J Epidemiol 156:
52–59.
Dengue Hemorrhagic Fever Incidence in Thailand
www.plosntds.org 13 July 2008 | Volume 2 | Issue 7 | e263