Embed Size (px)
Citation preview
1
Remote control of neural function by X-ray-induced scintillation
Takanori Matsubara1,2, Takayuki Yanagida3, Noriaki Kawaguchi3, Takashi Nakano3, Junichiro Yoshimoto3, Satoshi P. Tsunoda4,5, Shin-ichiro Horigane6,7, Shuhei Ueda6,7, Sayaka Takemoto-Kimura6,7, Hideki Kandori4,8, Akihiro Yamanaka1,2,8 and Takayuki Yamashita1,2,5,8* 1 Department of Neuroscience II, Research Institute of Environmental Medicine, Nagoya University, Nagoya, Japan. 2 Department of Neural Regulation, Graduate School of Medicine, Nagoya University, Nagoya, Japan. 3 Nara Institute of Science and Technology, Nara, Japan. 4 Department of Life Science and Applied Chemistry, Nagoya Institute of Technology, Nagoya, Japan. 5 PRESTO, Japan Science and Technology Agency, Kawaguchi, Japan. 6 Department of Neuroscience I, Research Institute of Environmental Medicine, Nagoya University, Nagoya, Japan. 7 Department of Molecular Neuroscience, Graduate School of Medicine, Nagoya University, Nagoya, Japan. 8 CREST, Japan Science and Technology Agency, Kawaguchi, Japan
* Correspondence should be addressed to: Takayuki Yamashita ([email protected]).
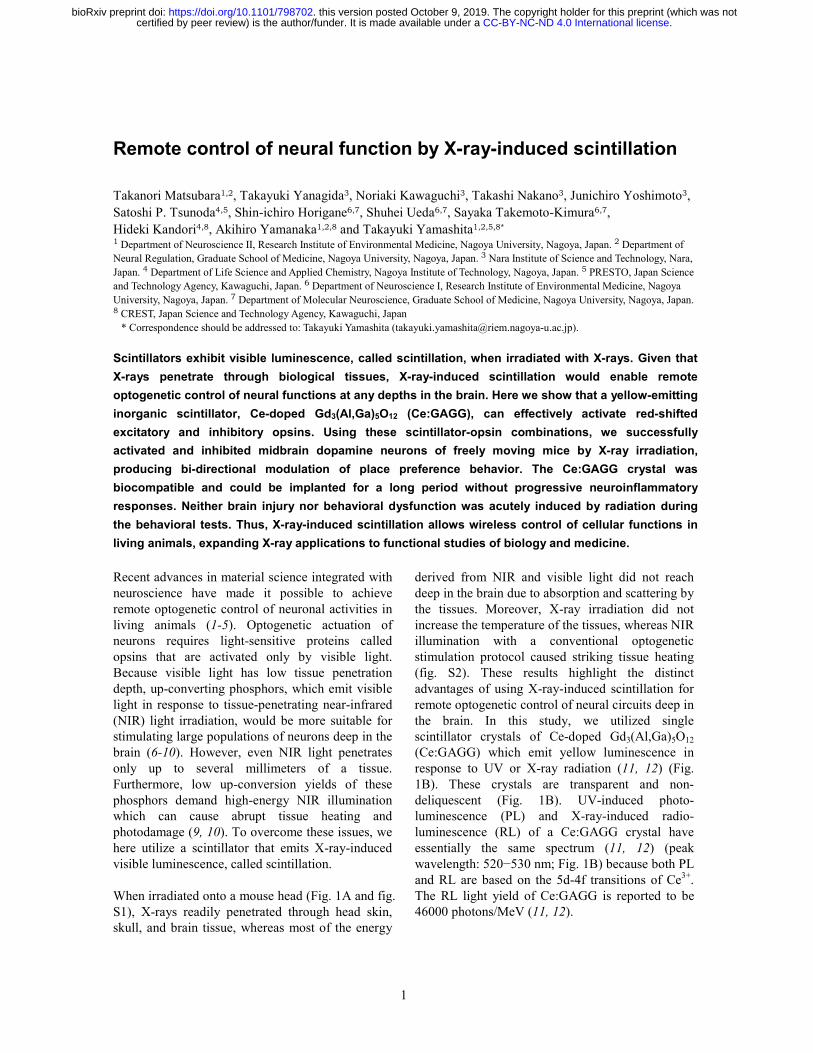
Scintillators exhibit visible luminescence, called scintillation, when irradiated with X-rays. Given that X-rays penetrate through biological tissues, X-ray-induced scintillation would enable remote optogenetic control of neural functions at any depths in the brain. Here we show that a yellow-emitting inorganic scintillator, Ce-doped Gd3(Al,Ga)5O12 (Ce:GAGG), can effectively activate red-shifted excitatory and inhibitory opsins. Using these scintillator-opsin combinations, we successfully activated and inhibited midbrain dopamine neurons of freely moving mice by X-ray irradiation, producing bi-directional modulation of place preference behavior. The Ce:GAGG crystal was biocompatible and could be implanted for a long period without progressive neuroinflammatory responses. Neither brain injury nor behavioral dysfunction was acutely induced by radiation during the behavioral tests. Thus, X-ray-induced scintillation allows wireless control of cellular functions in living animals, expanding X-ray applications to functional studies of biology and medicine. Recent advances in material science integrated with neuroscience have made it possible to achieve remote optogenetic control of neuronal activities in living animals (1-5). Optogenetic actuation of neurons requires light-sensitive proteins called opsins that are activated only by visible light. Because visible light has low tissue penetration depth, up-converting phosphors, which emit visible light in response to tissue-penetrating near-infrared (NIR) light irradiation, would be more suitable for stimulating large populations of neurons deep in the brain (6-10). However, even NIR light penetrates only up to several millimeters of a tissue. Furthermore, low up-conversion yields of these phosphors demand high-energy NIR illumination which can cause abrupt tissue heating and photodamage (9, 10). To overcome these issues, we here utilize a scintillator that emits X-ray-induced visible luminescence, called scintillation.
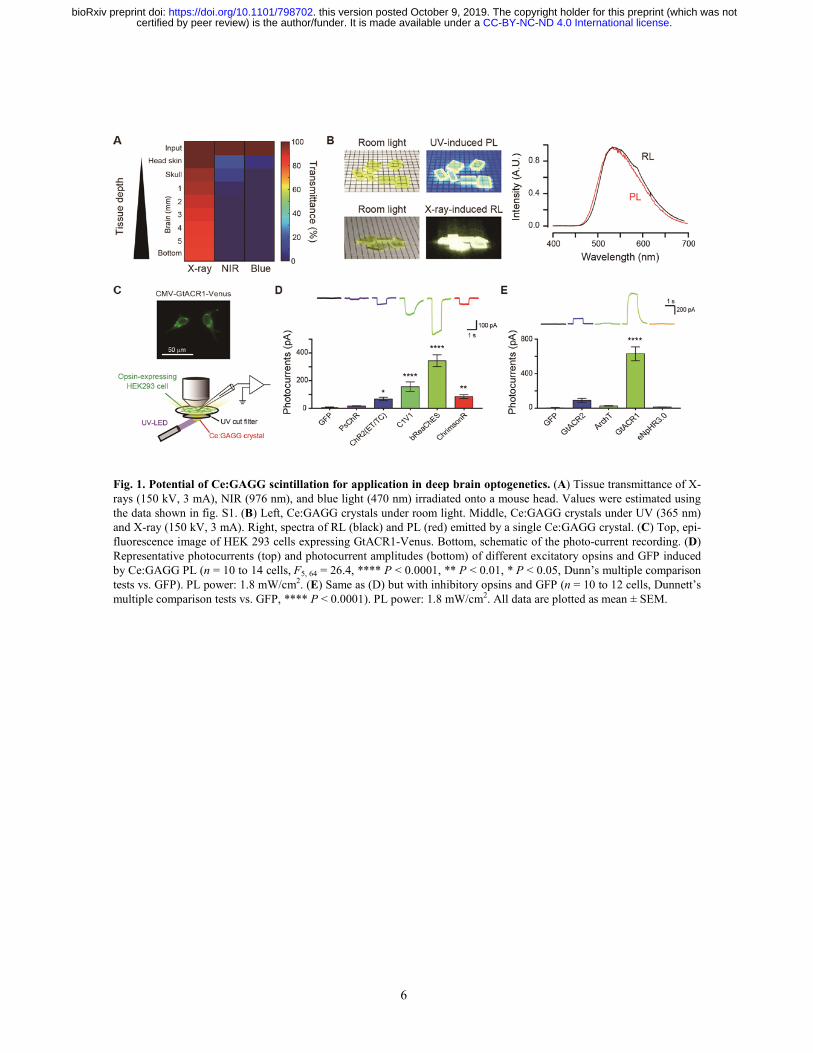
When irradiated onto a mouse head (Fig. 1A and fig. S1), X-rays readily penetrated through head skin, skull, and brain tissue, whereas most of the energy
derived from NIR and visible light did not reach deep in the brain due to absorption and scattering by the tissues. Moreover, X-ray irradiation did not increase the temperature of the tissues, whereas NIR illumination with a conventional optogenetic stimulation protocol caused striking tissue heating (fig. S2). These results highlight the distinct advantages of using X-ray-induced scintillation for remote optogenetic control of neural circuits deep in the brain. In this study, we utilized single scintillator crystals of Ce-doped Gd3(Al,Ga)5O12 (Ce:GAGG) which emit yellow luminescence in response to UV or X-ray radiation (11, 12) (Fig. 1B). These crystals are transparent and non-deliquescent (Fig. 1B). UV-induced photo-luminescence (PL) and X-ray-induced radio-luminescence (RL) of a Ce:GAGG crystal have essentially the same spectrum (11, 12) (peak wavelength: 520−530 nm; Fig. 1B) because both PL and RL are based on the 5d-4f transitions of Ce3+. The RL light yield of Ce:GAGG is reported to be 46000 photons/MeV (11, 12).
.CC-BY-NC-ND 4.0 International licensecertified by peer review) is the author/funder. It is made available under aThe copyright holder for this preprint (which was notthis version posted October 9, 2019. . https://doi.org/10.1101/798702doi: bioRxiv preprint
2
We first sought opsins that could be effectively activated by the PL of Ce:GAGG. DNA plasmids encoding different opsins were transfected into HEK 293 cells and photocurrents induced by PL illumination were measured (Fig. 1C). For depolarizing opsins, the yellow PL of Ce:GAGG (1.8 mW/cm2) elicited the largest photocurrents in cells expressing the red-shifted opsin bReaChES (13) (340.3 ± 43.1 pA, n = 12; Fig. 1D). Regarding inhibitory opsins, the anion channelrhodopsin GtACR1 (14) showed the strongest activation (627.2 ± 80.2 pA, n = 12; Fig. 1E) in response to the PL of Ce:GAGG (1.8 mW/cm2). PL-irradiation of GFP-expressing cells induced undetectable currents (Fig. 1, D and E). Thus, Ce:GAGG PL can activate red-shifted opsins that are used for optogenetic control of neurons. Furthermore, the yellow PL of Ce:GAGG could also induce significant activation of enzyme rhodopsin BeGC1 (15) (fig. S3), suggesting that the scintillation of Ce:GAGG can be used for activation of various light-sensitive proteins.
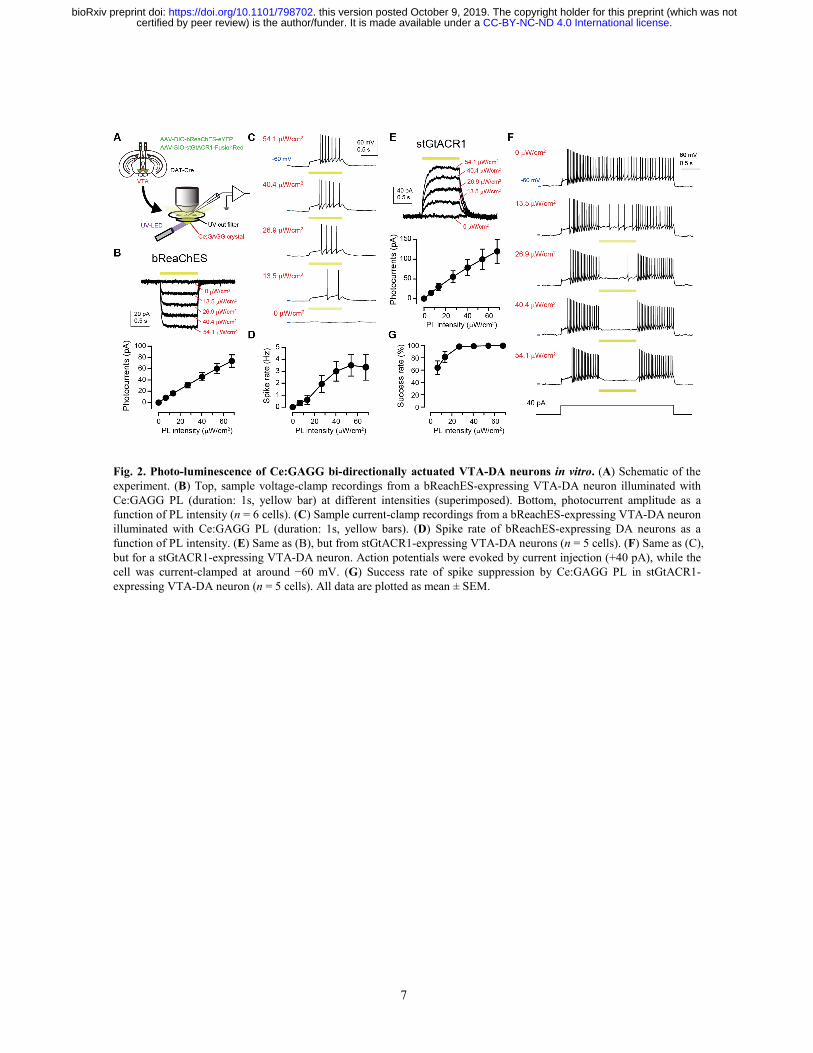
We next tested the ability of Ce:GAGG PL to actuate neuronal membrane potentials in vitro. Cre-dependent adeno-associated virus (AAV) vectors were injected into the ventral tegmental area (VTA) of DAT-IRES-Cre mice to induce the specific expression of bReaChES in dopamine (DA) neurons (Fig. 2A and fig. S4). In acute slice preparations, 1-s pulses of the yellow PL of Ce:GAGG elicited depolarizing photocurrents in DA neurons in a PL intensity-dependent manner (Fig. 2B) Irradiation with 13.5 µW/cm2 elicited action potentials in a fraction (2 out of 6) of DA neurons, and the rate of PL-evoked spikes was plateaued at approximately 40 µW/cm2 (Fig. 2, C and D). With a higher PL intensity (2.0 mW/cm2), time-locked spiking up to 20 Hz could be induced with shorter (2 ms) pulses (fig. S5). In DA neurons expressing inhibitory soma-targeted GtACR1 (16) (stGtACR1; fig. S4), hyperpolarizing photocurrents were induced by Ce:GAGG PL illumination, which attenuated action potential generation at 13.5 µW/cm2 and maximally suppressed spiking at >30 µW/cm2 PL (Fig. 2, F and G). Thus, the Ce:GAGG crystal combined with bReaChES and stGtACR1 can serve as bi-directional optogenetic actuators.
Having identified scintillator-opsin combinations
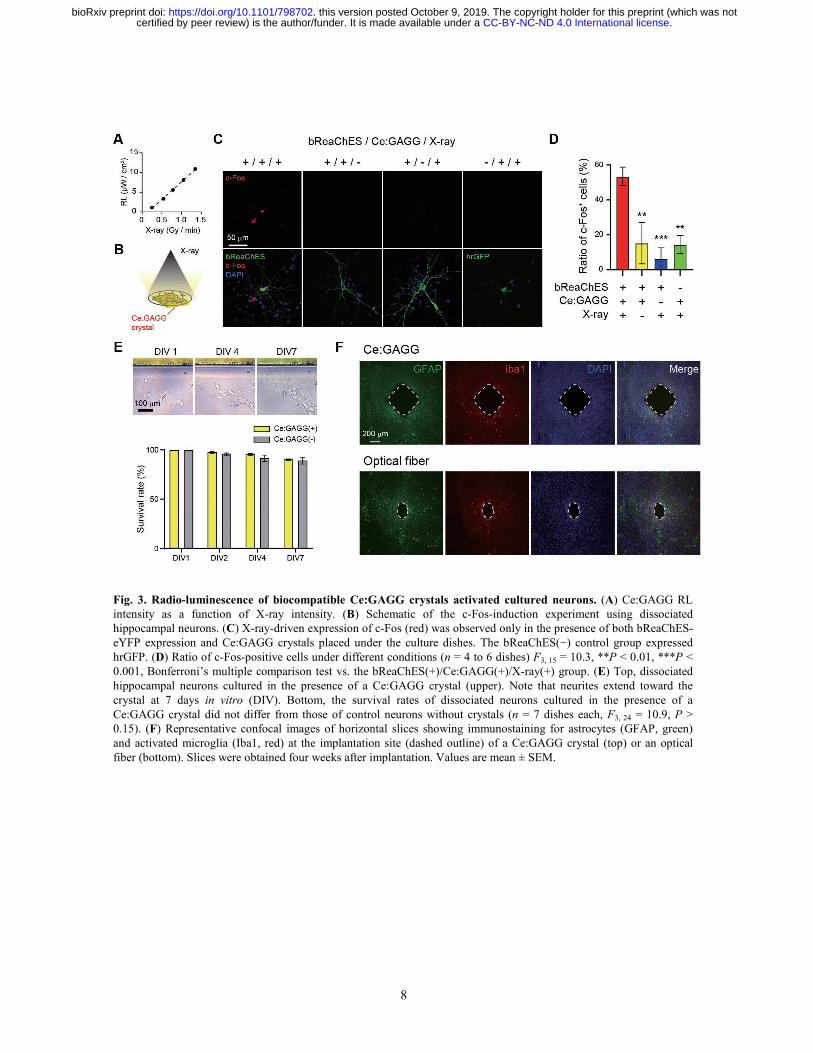
that modulate neuronal activity, we next examined the ability of X-ray-induced RL of the Ce:GAGG crystal to activate dissociated hippocampal neurons. The intensity of the RL emitted by the Ce:GAGG crystal was proportional to the intensity of X-rays (Fig. 3A). X-ray irradiation for total 10 min (20 s pluses every 1 min, 30 times) induced c-Fos expression among bReaChES-expressing neurons only in the presence of Ce:GAGG crystals, but not under control conditions (Fig. 3, B to D), suggesting that the RL of Ce:GAGG can activate bReaChES-expressing neurons. Before the scintillation-mediated optogenetics is adapted to living animals, the biocompatibility of the scintillator was assessed. The vast majority of dissociated hippocampal neurons around the Ce:GAGG crystal in the culture dish survived for 7 days (Fig. 3E), and a fraction of neurites extended toward the crystal (Fig. 3E). Similarly, HEK 293 cells cultured in the presence of the Ce:GAGG crystal proliferated at a normal rate (fig. S6). Furthermore, rod-shaped Ce:GAGG crystals (size: 0.5 mm × 0.5 mm × 1.0−1.5 mm) implanted into the brain for four weeks did not cause activation of glial cells beyond that caused by biocompatible optic fibers (Fig. 3F and fig. S7). Thus, the Ce:GAGG crystal is biocompatible and could be implanted without cytotoxicity.
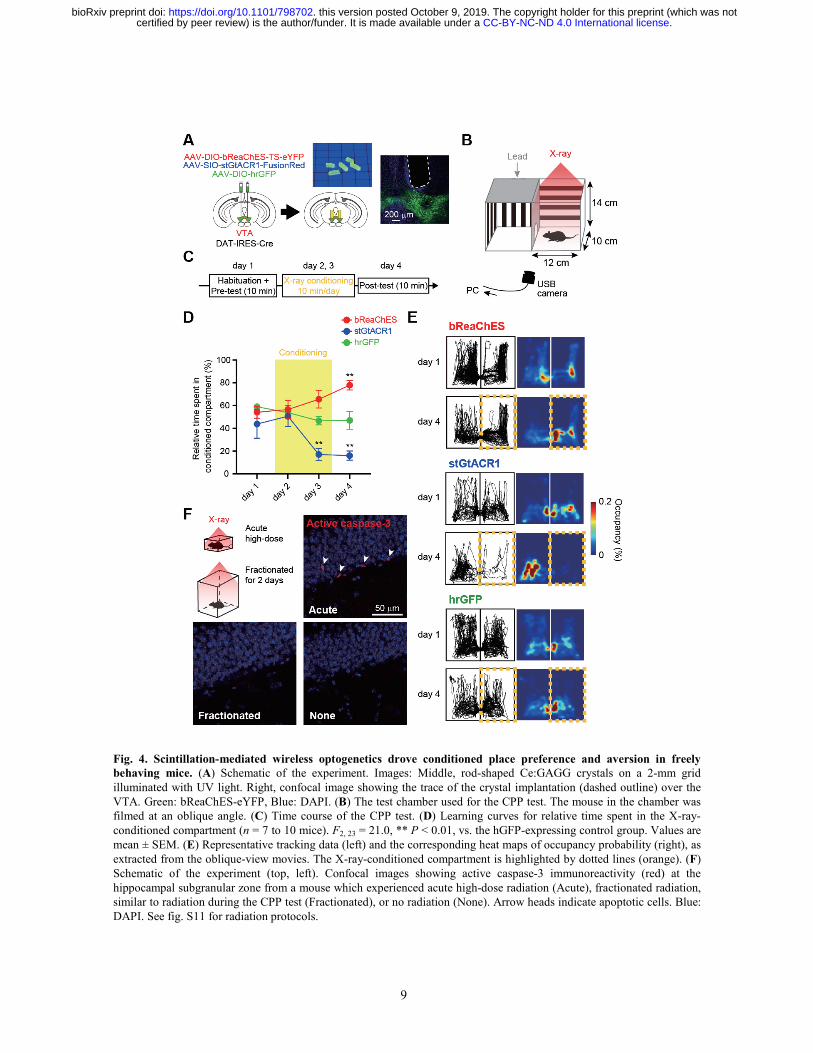
We finally tested whether scintillation-mediated actuation of neurons in vivo could induce behavioral changes. Transient activation and inhibition of DA neurons in the VTA is sufficient for behavioral conditioning (17-19). We therefore induced the expression of excitatory bReaChES or inhibitory stGtACR1 in VTA-DA neurons through viral injections, and bilaterally implanted rod-shaped Ce:GAGG crystals over the VTA (Fig. 4A). The conditioned place preference (CPP) test was performed by placing the mice into a test chamber with two compartments, only one of which was irradiated by X-rays (Fig. 4B and fig. S8). The initial place preference was not different among opsin-expressing and GFP-expressing control mice (Fig. 4C). After two days of conditioning, however, mice expressing bReaChES had a significantly greater tendency to spend more time in the X-ray conditioned compartment (Fig. 4, D and E, and fig. S9), whereas those expressing stGtACR1 spent significantly less time in the conditioned
.CC-BY-NC-ND 4.0 International licensecertified by peer review) is the author/funder. It is made available under aThe copyright holder for this preprint (which was notthis version posted October 9, 2019. . https://doi.org/10.1101/798702doi: bioRxiv preprint
3
compartment (Fig. 4, D and E). Control mice did not change place preference after conditioning (Fig. 4, D and E, and fig. S9). These opsin-expressing mice did not show any difference in the body weight, spontaneous locomotor and rearing behaviors compared to control mice (fig. S10). X-irradiation of an implanted Ce:GAGG crystal did not affect the temperature of the ambient tissue (fig. S2). Thus, scintillation-mediated remote optogenetics can be used for bi-directional neuronal actuation deep in the brain of mice, resulting in behavioral changes.
Neuronal precursor cells are the most radiosensitive cells in the brain (20, 21). Acute irradiation of mice with high-dose X-rays (9 Gy) induced apoptotic cell death among putative neuronal precursor cells as detected with active caspase-3 immunoreactivity (Fig. 4F and fig. S11). However, we hardly observed apoptotic signals in the brain irradiated with fractionated X-ray irradiations in our test chamber which are essentially the same as those during the CPP test (Fig. 4F and fig. S11). Moreover, 10-min X-irradiation of mice in our test chamber did not cause abnormality in the home-cage behavior (fig. S12). Thus, the fractionated X-ray irradiation during the behavioral testing might not induce acute neuronal dysfunction.
We have here demonstrated the feasibility of a novel, scintillation-mediated optogenetic technology that allows fully wireless control of neuronal activity in behaving animals. The scintillator crystal was biocompatible and safely implantable for long periods. Thermal effects on neuronal activity were negligible using this technology, a significant advantage over conventional (22, 23) and NIR-mediated (9, 10) optogenetics. Given the deep tissue penetration of X-rays (Fig. 1A), scintillation-mediated optogenetics can be readily applied to larger animals including monkeys. Future innovations and technical advances, such as minimizing the size of the implanted scintillator crystals, or reducing the dose of X-rays through the use of pulsed and targeted X-ray irradiation, should further enable manipulation of neuronal functions with less invasiveness.
Since its discovery in the late 19th century (24), X-
rays have been widely used for medical imaging and cancer therapy. However, X-rays have never been used for controlling physiological functions of cells in living animals, as we have shown here. The development of scintillation-mediated optogenetics thus expands the range of X-ray applications to functional studies of biology and medicine. Biomedical technologies that use visible light for genome editing (25) or cancer therapy (26) would benefit from wireless application to deeper tissues, which is now possible with scintillation-mediated approaches. Acknowledgements We thank H. Kasai for providing DAT-IRES-Cre mice; K. Deisseroth for providing bReaChES plasmid; H. Yawo for providing PsChR and C1V1 plasmids; K. Yamanaka for providing anti-caspase-3 antibody; B. Haider for comments; Y. Miyoshi, S. Tsukamoto, A. Kambara, C. Koike, M. Jin for technical assistances. This work was supported by JST-PRESTO (JPMJPR168D) to T.Yamashita; KAKENHI grants (16H05927, 17H05744 and 19H03533) to T.Yamashita; Asahi Glass Foundation to T.Yamashita; Sumitomo Foundation to T.Yamashita; Takeda Science Foundation to T.Yamashita; and JST-CREST (JPMJCR1656) to A.Y. Author contributions T.Yamashita conceived and designed the project with inputs from T.M. and T.Yanagida. T.M. conducted all AAV injections, Ce:GAGG implantation, behavioral experiments, cell culture and histology experiments, and analyzed data. T.M. and T. Yamashita carried out AAV production and characterization of X-ray and Ce:GAGG crystals. T.Yanagida and N.K. provided Ce:GAGG crystals and performed spectral measurements. T.N. and J.Y. analyzed behavioral data. S.P.T. and H.K. helped with Glosensor experiments. S.H. helped with constructing plasmids. S.U. and S.T-K. helped with implantation of Ce:GAGG crystals. A.Y. provided AAV and contributed to interpretation of results. T.Yamashita performed all physiological measurements, Glosensor experiments, analyzed data, and wrote the manuscript with inputs from other co-authors.
.CC-BY-NC-ND 4.0 International licensecertified by peer review) is the author/funder. It is made available under aThe copyright holder for this preprint (which was notthis version posted October 9, 2019. . https://doi.org/10.1101/798702doi: bioRxiv preprint
4
References 1. T. I. Kim, J. G. McCall, Y. H. Jung, X. Huang, E. R.
Siuda, Y. Li, J. Song, Y. M. Song, H. A. Pao, R. H. Kim, C. Lu, S. D. Lee, I. S. Song, G. Shin, R. Al-Hasani, S. Kim, M. P. Tan, Y. Huang, F. G. Omenetto, J. A. Rogers, M. R. Bruchas, Injectable, cellular-scale optoelectronics with applications for wireless optogenetics. Science 340, 211−216 (2013).
2. J. W. Jeong, J. G. McCall, G. Shin, Y. Zhang, R. Al-Hasani, M. Kim, S. Li, J. Y. Sim, K. I. Jang, Y. Shi, D. Y. Hong, Y. Liu, G. P. Schmitz, L. Xia, Z. He, P. Gamble, W. Z. Ray, Y. Huang, M. R. Bruchas, J. A. Rogers, Wireless optofluidic systems for programmable in vivo pharmacology and optogenetics. Cell 162, 662−674 (2015).
3. K. L. Montgomery, A. J. Yeh, J. S. Ho, V. Tsao, S. Mohan Iyer, L. Grosenick, E. A. Ferenczi, Y. Tanabe, K. Deisseroth, S. L. Delp, A. S. Poon, Wirelessly powered, fully internal optogenetics for brain, spinal and peripheral circuits in mice. Nat. Methods 12, 969−974 (2015).
4. S. I. Park, D. S. Brenner, G. Shin, C. D. Morgan, B. A. Copits, H. U. Chung, M. Y. Pullen, K. N. Noh, S. Davidson, S. J. Oh, J. Yoon, K. I. Jang, V. K. Samineni, M. Norman, J. G. Grajales-Reyes, S. K. Vogt, S. S. Sundaram, K. M. Wilson, J. S. Ha, R. Xu, T. Pan, T. I. Kim, Y. Huang, M. C. Montana, J. P. Golden, M. R. Bruchas, R. W. t. Gereau, J. A. Rogers, Soft, stretchable, fully implantable miniaturized optoelectronic systems for wireless optogenetics. Nat. Biotechnol. 33, 1280−1286 (2015).
5. A. D. Mickle, S. M. Won, K. N. Noh, J. Yoon, K. W. Meacham, Y. Xue, L. A. McIlvried, B. A. Copits, V. K. Samineni, K. E. Crawford, D. H. Kim, P. Srivastava, B. H. Kim, S. Min, Y. Shiuan, Y. Yun, M. A. Payne, J. Zhang, H. Jang, Y. Li, H. H. Lai, Y. Huang, S. I. Park, R. W. T. Gereau, J. A. Rogers, A wireless closed-loop system for optogenetic peripheral neuromodulation. Nature 565, 361−365 (2019).
6. S. Hososhima, H. Yuasa, T. Ishizuka, M. R. Hoque, T. Yamashita, A. Yamanaka, E. Sugano, H. Tomita, H. Yawo, Near-infrared (NIR) up-conversion optogenetics. Sci. Rep. 5, 16533 (2015).
7. S. Shah, J. J. Liu, N. Pasquale, J. Lai, H. McGowan, Z. P. Pang, K. B. Lee, Hybrid upconversion nanomaterials for optogenetic neuronal control. Nanoscale 7, 16571−16577 (2015).
8. X. Wu, Y. Zhang, K. Takle, O. Bilsel, Z. Li, H. Lee, Z. Zhang, D. Li, W. Fan, C. Duan, E. M. Chan, C. Lois, Y. Xiang, G. Han, Dye-sensitized core/active shell upconversion nanoparticles for optogenetics and bioimaging applications. ACS Nano 10, 1060−1066 (2016).
9. S. Chen, A. Z. Weitemier, X. Zeng, L. He, X. Wang, Y. Tao, A. J. Y. Huang, Y. Hashimotodani, M. Kano,
H. Iwasaki, L. K. Parajuli, S. Okabe, D. B. L. Teh, A. H. All, I. Tsutsui-Kimura, K. F. Tanaka, X. Liu, T. J. McHugh, Near-infrared deep brain stimulation via upconversion nanoparticle-mediated optogenetics. Science 359, 679−684 (2018).
10. T. Miyazaki, S. Chowdhury, T. Yamashita, T. Matsubara, H. Yawo, H. Yuasa, A. Yamanaka, Large Timescale Interrogation of Neuronal Function by Fiberless Optogenetics Using Lanthanide Micro-particles. Cell Rep. 26, 1033−1043 (2019).
11. K. Kamada, T. Yanagida, J. Pejchal, M. Nikl, T. Endo, K. Tsutsumi, Y. Fujimoto, A. Fukabori, A. Yoshikawa, Crystal growth and scintillation properties of Ce doped Gd3(Ga,Al)5O12 single crystals. IEEE T. Nucl. Sci. 59, 2112-2115 (2012).
12. T. Yanagida, K. Kamada, Y. Fujimoto, H. Yagi, T. Yanagitani, Comparative study of ceramic and single crystal Ce:GAGG scintillator. Opt. Mater. 35, 2480-2485 (2013).
13. P. Rajasethupathy, S. Sankaran, J. H. Marshel, C. K. Kim, E. Ferenczi, S. Y. Lee, A. Berndt, C. Ramakrishnan, A. Jaffe, M. Lo, C. Liston, K. Deisseroth, Projections from neocortex mediate top-down control of memory retrieval. Nature 526, 653-659 (2015).
14. E. G. Govorunova, O. A. Sineshchekov, R. Janz, X. Liu, J. L. Spudich, Natural light-gated anion channels: A family of microbial rhodopsins for advanced optogenetics. Science 349, 647-650 (2015).
15. G. M. Avelar, R. I. Schumacher, P. A. Zaini, G. Leonard, T. A. Richards, S. L. Gomes, A rhodopsin-guanylyl cyclase gene fusion functions in visual perception in a fungus. Curr. Biol. 24, 1234-1240 (2014).
16. M. Mahn, L. Gibor, P. Patil, K. Cohen-Kashi Malina, S. Oring, Y. Printz, R. Levy, I. Lampl, O. Yizhar, High-efficiency optogenetic silencing with soma-targeted anion-conducting channelrhodopsins. Nat. Commun. 9, 4125 (2018).
17. H. C. Tsai, F. Zhang, A. Adamantidis, G. D. Stuber, A. Bonci, L. de Lecea, K. Deisseroth, Phasic firing in dopaminergic neurons is sufficient for behavioral conditioning. Science 324, 1080-1084 (2009).
18. A. R. Adamantidis, H. C. Tsai, B. Boutrel, F. Zhang, G. D. Stuber, E. A. Budygin, C. Tourino, A. Bonci, K. Deisseroth, L. de Lecea, Optogenetic interrogation of dopaminergic modulation of the multiple phases of reward-seeking behavior. J. Neurosci. 31, 10829-10835 (2011).
19. T. Danjo, K. Yoshimi, K. Funabiki, S. Yawata, S. Nakanishi, Aversive behavior induced by optogenetic inactivation of ventral tegmental area dopamine neurons is mediated by dopamine D2 receptors in the nucleus accumbens. Proc. Natl. Acad. Sci. U. S. A. 111, 6455-6460 (2014).
20. C. Shinohara, G. T. Gobbel, K. R. Lamborn, E. Tada, J. R. Fike, Apoptosis in the subependyma of young adult rats after single and fractionated doses of X-
.CC-BY-NC-ND 4.0 International licensecertified by peer review) is the author/funder. It is made available under aThe copyright holder for this preprint (which was notthis version posted October 9, 2019. . https://doi.org/10.1101/798702doi: bioRxiv preprint
5
rays. Cancer Res. 57, 2694-2702 (1997). 21. R. Nagai, S. Tsunoda, Y. Hori, H. Asada, Selective
vulnerability to radiation in the hippocampal dentate granule cells. Surg. Neurol. 53, 503-507 (2000).
22. B. D. Allen, A. C. Singer, E. S. Boyden, Principles of designing interpretable optogenetic behavior experiments. Learn. Mem. 22, 232-238 (2015).
23. S. F. Owen, M. H. Liu, A. C. Kreitzer, Thermal constraints on in vivo optogenetic manipulations. Nat. Neurosci. 22, 1061-1065 (2019).
24. W. C. Röntgen, Uber eine neue Art von Strahlen. Sitzungsber. Phys. Med. Ges. Würtzburg. 9, 132−141 (1895).
25. Y. Nihongaki, F. Kawano, T. Nakajima, M. Sato, Photoactivatable CRISPR-Cas9 for optogenetic genome editing. Nat. Biotechnol. 33, 755-760 (2015).
26. D. E. Dolmans, D. Fukumura, R. K. Jain, Photodynamic therapy for cancer. Nat. Rev. Cancer 3, 380-387 (2003).
27. C. M. Bäckman, N. Malik, Y. Zhang, L. Shan, A. Grinberg, B. J. Hoffer, H. Westphal, A. C. Tomac, Characterization of a mouse strain expressing Cre recombinase from the 3' untranslated region of the dopamine transporter locus. Genesis 44, 383-390 (2006).
28. K. Yoshida, S. P. Tsunoda, L. S. Brown, H. Kandori, A unique choanoflagellate enzyme rhodopsin exhibits light-dependent cyclic nucleotide phosphodiesterase activity. J. Biol. Chem. 292, 7531-7541 (2017).
29. T. Yamashita, K. Eguchi, N. Saitoh, H. von Gersdorff, T. Takahashi, Developmental shift to a mechanism of synaptic vesicle endocytosis requiring nanodomain Ca2+. Nat. Neurosci. 13, 838-844 (2010).
30. A. Mathis, P. Mamidanna, K. M. Cury, T. Abe, V. N. Murthy, M. W. Mathis, M. Bethge, DeepLabCut: markerless pose estimation of user-defined body parts with deep learning. Nat. Neurosci. 21, 1281-1289 (2018).
.CC-BY-NC-ND 4.0 International licensecertified by peer review) is the author/funder. It is made available under aThe copyright holder for this preprint (which was notthis version posted October 9, 2019. . https://doi.org/10.1101/798702doi: bioRxiv preprint
6
Fig. 1. Potential of Ce:GAGG scintillation for application in deep brain optogenetics. (A) Tissue transmittance of X-rays (150 kV, 3 mA), NIR (976 nm), and blue light (470 nm) irradiated onto a mouse head. Values were estimated using the data shown in fig. S1. (B) Left, Ce:GAGG crystals under room light. Middle, Ce:GAGG crystals under UV (365 nm) and X-ray (150 kV, 3 mA). Right, spectra of RL (black) and PL (red) emitted by a single Ce:GAGG crystal. (C) Top, epi-fluorescence image of HEK 293 cells expressing GtACR1-Venus. Bottom, schematic of the photo-current recording. (D) Representative photocurrents (top) and photocurrent amplitudes (bottom) of different excitatory opsins and GFP induced by Ce:GAGG PL (n = 10 to 14 cells, F5, 64 = 26.4, **** P < 0.0001, ** P < 0.01, * P < 0.05, Dunn’s multiple comparison tests vs. GFP). PL power: 1.8 mW/cm2. (E) Same as (D) but with inhibitory opsins and GFP (n = 10 to 12 cells, Dunnett’s multiple comparison tests vs. GFP, **** P < 0.0001). PL power: 1.8 mW/cm2. All data are plotted as mean ± SEM.
.CC-BY-NC-ND 4.0 International licensecertified by peer review) is the author/funder. It is made available under aThe copyright holder for this preprint (which was notthis version posted October 9, 2019. . https://doi.org/10.1101/798702doi: bioRxiv preprint
7
Fig. 2. Photo-luminescence of Ce:GAGG bi-directionally actuated VTA-DA neurons in vitro. (A) Schematic of the experiment. (B) Top, sample voltage-clamp recordings from a bReachES-expressing VTA-DA neuron illuminated with Ce:GAGG PL (duration: 1s, yellow bar) at different intensities (superimposed). Bottom, photocurrent amplitude as a function of PL intensity (n = 6 cells). (C) Sample current-clamp recordings from a bReachES-expressing VTA-DA neuron illuminated with Ce:GAGG PL (duration: 1s, yellow bars). (D) Spike rate of bReachES-expressing DA neurons as a function of PL intensity. (E) Same as (B), but from stGtACR1-expressing VTA-DA neurons (n = 5 cells). (F) Same as (C), but for a stGtACR1-expressing VTA-DA neuron. Action potentials were evoked by current injection (+40 pA), while the cell was current-clamped at around −60 mV. (G) Success rate of spike suppression by Ce:GAGG PL in stGtACR1-expressing VTA-DA neuron (n = 5 cells). All data are plotted as mean ± SEM.
.CC-BY-NC-ND 4.0 International licensecertified by peer review) is the author/funder. It is made available under aThe copyright holder for this preprint (which was notthis version posted October 9, 2019. . https://doi.org/10.1101/798702doi: bioRxiv preprint
8
Fig. 3. Radio-luminescence of biocompatible Ce:GAGG crystals activated cultured neurons. (A) Ce:GAGG RL intensity as a function of X-ray intensity. (B) Schematic of the c-Fos-induction experiment using dissociated hippocampal neurons. (C) X-ray-driven expression of c-Fos (red) was observed only in the presence of both bReaChES-eYFP expression and Ce:GAGG crystals placed under the culture dishes. The bReaChES(−) control group expressed hrGFP. (D) Ratio of c-Fos-positive cells under different conditions (n = 4 to 6 dishes) F3, 15 = 10.3, **P < 0.01, ***P < 0.001, Bonferroni’s multiple comparison test vs. the bReaChES(+)/Ce:GAGG(+)/X-ray(+) group. (E) Top, dissociated hippocampal neurons cultured in the presence of a Ce:GAGG crystal (upper). Note that neurites extend toward the crystal at 7 days in vitro (DIV). Bottom, the survival rates of dissociated neurons cultured in the presence of a Ce:GAGG crystal did not differ from those of control neurons without crystals (n = 7 dishes each, F3, 24 = 10.9, P > 0.15). (F) Representative confocal images of horizontal slices showing immunostaining for astrocytes (GFAP, green) and activated microglia (Iba1, red) at the implantation site (dashed outline) of a Ce:GAGG crystal (top) or an optical fiber (bottom). Slices were obtained four weeks after implantation. Values are mean ± SEM.
.CC-BY-NC-ND 4.0 International licensecertified by peer review) is the author/funder. It is made available under aThe copyright holder for this preprint (which was notthis version posted October 9, 2019. . https://doi.org/10.1101/798702doi: bioRxiv preprint
9
Fig. 4. Scintillation-mediated wireless optogenetics drove conditioned place preference and aversion in freely behaving mice. (A) Schematic of the experiment. Images: Middle, rod-shaped Ce:GAGG crystals on a 2-mm grid illuminated with UV light. Right, confocal image showing the trace of the crystal implantation (dashed outline) over the VTA. Green: bReaChES-eYFP, Blue: DAPI. (B) The test chamber used for the CPP test. The mouse in the chamber was filmed at an oblique angle. (C) Time course of the CPP test. (D) Learning curves for relative time spent in the X-ray-conditioned compartment (n = 7 to 10 mice). F2, 23 = 21.0, ** P < 0.01, vs. the hGFP-expressing control group. Values are mean ± SEM. (E) Representative tracking data (left) and the corresponding heat maps of occupancy probability (right), as extracted from the oblique-view movies. The X-ray-conditioned compartment is highlighted by dotted lines (orange). (F) Schematic of the experiment (top, left). Confocal images showing active caspase-3 immunoreactivity (red) at the hippocampal subgranular zone from a mouse which experienced acute high-dose radiation (Acute), fractionated radiation, similar to radiation during the CPP test (Fractionated), or no radiation (None). Arrow heads indicate apoptotic cells. Blue: DAPI. See fig. S11 for radiation protocols.
.CC-BY-NC-ND 4.0 International licensecertified by peer review) is the author/funder. It is made available under aThe copyright holder for this preprint (which was notthis version posted October 9, 2019. . https://doi.org/10.1101/798702doi: bioRxiv preprint
10
Materials and Methods Scintillator crystal preparation The single crystal Ce:GAGG was synthesized using the conventional Czochralski method in Furukawa11,12. For luminescence measurements and all experiments except for implantation in the brain, the crystal was fabricated into 3−8 mm rectangular blocks 0.5−1 mm thick. For implanting the crystals in the mouse brain, rod-shaped Ce:GAGG crystals (0.5 mm × 0.5 mm × 3.0 mm) obtained from Furukawa were cut into smaller pieces (0.5 mm × 0.5 mm × 1.0−1.5 mm) using a laser cutter and then slightly filed to round off the corners.
Luminescence measurements The PL of a Ce:GAGG crystal was induced with 365-nm UV light (LEDMOD V2, Omicron; LC-L2, Hamamatsu) unless otherwise noted. The PL intensity for electrophysiological recordings was routinely measured with a photodiode sensor (1 cm × 1 cm; PD300-1W, Ophir) placed over the recording chamber through a UV-cut filter fabricated from UV-cut goggles (SSUV 297, AS ONE) on each experimental day. In experiments using acute slices, the PL intensity over the slice in the recording chamber was measured. The intensity of unfiltered UV light over the recording chamber was <0.1 µW/cm2. The RL power of a Ce:GAGG crystal was measured with a fiber-coupled photoreceiver (Newport 2151) through an optical fibre (tip diameter: 200 µm) placed close to a Ce:GAGG crystal exposed to X-ray irradiation in an X-ray machine (MX-160Labo, mediXtec). The photoreceiver current, which was sampled using an analogue-digital converter (Picoscope 4262, Pico Technology), was calibrated against the PL power measured by the photodiode sensor and converted to luminescence intensity (in watts). PL emission spectra under UV illumination (340 ± 10 nm, LAX-103, Asahi Spectra) were measured using a spectrometer (QE-Pro, Ocean Optics). RL emission spectra under X-ray irradiation (70 kV, 1 mA) were measured through an optical fibre using a CCD spectrometer (DU-420-BU2, Andor) (12).
Animals All experiments were performed in accordance with the guidelines of the Physiological Society of Japan and approved by the institutional review board of the Research Institute of Environmental Medicine, Nagoya University, Japan. Adult C57BL6/J mice and DAT-IRES-Cre mice (27) (B6.SJL-Slc6a3tm1.1(cre)Bkmn/J, The Jackson Laboratory) of both sexes were maintained on a 12-h light-dark cycle (lights were turned on at 8:00 am), with free access to food and water. DAT-IRES-Cre mice were maintained as homogenic mutants. Only 11−18-week-old male DAT-IRES-Cre mice were used for the CPP experiments.
Plasmids For expression in HEK293 cells, all plasmids encoding opsins and fluorescent proteins were constructed by subcloning into an empty pCMV vector unless otherwise noted. pCMV-PsChR-Venus and pCMV-C1V1-Venus were obtained from H. Yawo (Tohoku University). bReaChES-TS-eYFP was isolated from pAAV-CaMKIIa-DIO-bReaChes-TS-eYFP gifted by K. Deisseroth (Stanford University). A full-length gene encoding BeGC1 (accession number KF309499) was synthesized after human codon optimization and inserted into the peGFP-N1 vector. For expression in primary cultured neurons, the bReaChES-TS-eYFP fragment was subcloned into an empty pCAG vector. For AAV production, pAAV-Ef1a-DIO-bReaChes-TS-eYFP was obtained from K. Deisseroth (Stanford University) and pAAV-hSyn1-SIO-stGtACR1-FusionRed was obtained from Addgene (#105678).
Cell culture and transfection For electrophysiological recordings in cultured cells, expression vector plasmids encoding opsins or hrGFP were transfected into HEK 293 cells using Lipofectamine 2000 (Thermo Fisher Scientific). The cells were washed with phosphate-buffered saline (PBS) 3–4 hours after transfection, and then seeded on a coverslip (12 mm diameter) in Dulbecco's modified Eagle’s medium (DMEM; Sigma-Aldrich) supplemented with 10% (vol/vol) fetal bovine serum (FBS), 100 U/ml penicillin, and 0.1 mg/ml streptomycin. The cells were maintained in the medium in an incubator at 37°C and 5% CO2/95% air for 24−36 hours before recordings.
Dissociated hippocampal neurons were prepared from embryonic (E17.5) mice. Isolated hippocampal tissues were incubated with Hank’s Balanced Salt Solution (HBSS; Sigma-Aldrich) containing 1% DNase I (Sigma-Aldrich) and 2.5% trypsin for 10 min at 37°C, and then washed three times with HBSS. The tissues were then dispersed by pipetting in Neurobasal medium (Thermo Fisher Scientific). After removing aggregated cells by filtration, the hippocampal cells were seeded on a coverslip (12 mm diameter) coated with poly-L-lysine in DMEM (Sigma-Aldrich) and incubated for 4 h at 37°C. The culture medium was subsequently replaced by Neurobasal medium supplemented with 0.5 mM GlutaMAX (Thermo Fisher Scientific), 2% (vol/vol) B-27 (Thermo Fisher Scientific), 100 U/ml penicillin and 0.1 mg/ml streptomycin. After 2 days in vitro (DIV 2), DNA plasmids carrying bReaChES-eYFP (1 µg/dish) or hrGFP (1 µg/dish) were transfected into cultured neurons using Lipofectamine 2000. The cultured neurons were maintained in the medium in an incubator at 34°C with 5% CO2 and 95% air.
Viral production For AAV production, HEK293 cells were transfected with vector plasmids including pAAV encoding an opsin,
.CC-BY-NC-ND 4.0 International licensecertified by peer review) is the author/funder. It is made available under aThe copyright holder for this preprint (which was notthis version posted October 9, 2019. . https://doi.org/10.1101/798702doi: bioRxiv preprint
11
pHelper and pAAV-RC (serotype 9 or DJ), using a standard calcium phosphate method. After three days, transfected cells were collected and suspended in lysis buffer (150 mM NaCl, 20 mM Tris pH 8.0). After four freeze-thaw cycles, the cell lysate was treated with 250 U/ml benzonase nuclease (Merck) and 1 mM MgCl2 for 10−15 min at 37 °C and centrifuged at 4000 rpm for 20 min at 4°C. AAV was then purified from the supernatant by iodixanol gradient ultracentrifugation. The purified AAV solution was concentrated in PBS via filtration and stored at −80°C.
In vitro X-ray irradiation test Tetrodotoxin (TTX, 1 µM) was applied to the primary hippocampal culture by adding a stock solution of TTX to the culture media at DIV 9, and the culture dishes were maintained at 34°C with 5% CO2 and 95% air for 24 h. At DIV 10, the culture media was replaced with TTX-free Neurobasal media, and then the dishes were placed over Ce:GAGG crystals and irradiated with X-rays (150 kV, 3 mA, 1.35 Gy/min, 20 sec, every 1 min, 30 times) at room temperature (RT). The dishes were then maintained at 34°C with 5% CO2 and 95% air. At 2 h after X-ray irradiation, the cultured cells were fixed with 4% paraformaldehyde (PFA) for 10 min at RT, and then rinsed with PBS.
GloSensor assay HEK293 cells were cultured in Eagle's minimal essential medium containing L-glutamine and phenol red (Wako) supplemented with 10% (vol/vol) FBS and penicillin-streptomycin. The cells were co-transfected with the BeGC1 plasmid and the pGloSensor-42F cGMP vector (Promega) using Lipofectamine 2000 (Thermo Fischer Scientific). After transfection, 0.5 µM all-trans-retinal (Toronto Research Chemicals) was added to the culture medium. Before measurements, the culture medium was replaced with a CO2-independent medium containing 10% (vol/vol) FBS and 2% (vol/vol) GloSensor cGMP stock solution (Promega). The cells were then incubated for 2 h at 27°C in the dark. Intracellular cGMP levels were measured by monitoring luminescence intensity using a microplate reader (Corona Electric) at 27°C (28).
Stereotactic surgery AAV-Ef1a-DIO-bReaChes-TS-eYFP (titer: 6.0 × 10¹³ copies/ml), AAV-hSyn1-SIO-stGtACR1-FusionRed (titer: 1.1 × 10¹³ copies/ml) or AAV-CMV-DIO-hrGFP (titer: 6.0 × 10¹² copies/ml) was injected bilaterally into the VTA (AP: from -3.0 to -3.3 mm, LM: ±0.5 mm, depth: 4.2 mm) of DAT-IRES-Cre mice under ~1.2% isoflurane anesthesia. Injection volume was 200 nl per site. The mice were kept in their home cages for at least 3 weeks after AAV injection, prior to behavioral or electrophysiological experiments. The biocompatibility of the scintillator crystal
was assessed by implanting a rod-shaped Ce:GAGG crystal (0.5 mm × 0.5 mm × 1.0−1.5 mm) over the VTA using a metal guide tube (inner diameter: 0.5 mm) with a movable metal plunger. After crystal implantation, the metal guide tube was first withdrawn and then the plunger was retracted. An optical fiber (0.4 mm diameter) attached to a stainless steel ferrule (CFM14L10, Thorlabs) was implanted over the VTA using a cannula holder (XCF, Thorlabs). The optical fiber cannula was permanently cemented to the skull.
Slice preparation Mice were perfused under isoflurane anesthesia with ice-cold dissection buffer containing (in mM): 87 NaCl, 25 NaHCO3, 25 D-glucose, 2.5 KCl, 1.25 NaH2PO4, 0.5 CaCl2, 7 MgCl2, and 75 sucrose, aerated with 95% O2 + 5% CO2. The mice were then decapitated, and the brain was isolated and cut into 200-μm-thick horizontal sections on a vibratome in the ice-cold dissection buffer. The slices containing the VTA were incubated for 30 min at 35°C in the dissection buffer and maintained thereafter at RT in standard artificial cerebrospinal fluid (aCSF) containing (in mM): 125 NaCl, 25 NaHCO3, 25 D-glucose, 2.5 KCl, 1.25 NaH2PO4, 1 MgCl2, and 2 CaCl2), aerated with 95% O2 and 5% CO2.
In vitro electrophysiology Whole-cell patch-clamp recordings from cultured HEK 293 cells or VTA-DA neurons in acute brain slices were performed using an IPA amplifier (Sutter Instruments) at RT. Fluorescently labelled cells were visually identified using an upright microscope (BX51WI; Olympus) equipped with a scientific complementary metal-oxide-semiconductor (sCMOS) video camera (Zyla4.2plus; Andor). The recording pipettes (5−7 MΩ) were filled with the intracellular solution containing (in mM): 135 potassium gluconate, 4 KCl, 4 Mg-ATP, 10 Na2-phosphocreatine, 0.3 Na-GTP, and 10 HEPES (pH 7.3, 280 mOsmol/l). Patch pipettes (5–7 MΩ) had a series resistance of 6.5–25 MΩ, which was compensated to have a final value of 6.5–7.0 MΩ for voltage-clamp recordings (29). For measuring photocurrents of depolarizing opsins, HEK 293 cells or DA neurons were voltage-clamped at −60 mV. For measuring the photocurrents of GtACR1 and GtACR2, cells were voltage-clamped at 0 mV (HEK 293 cells) or −30 mV (DA neurons). For measuring the photocurrents of ArchT or eNpHR3.0, cells were voltage-clamped at −20–0 mV to achieve near zero holding currents. For current-clamp recordings from DA neurons, the membrane potentials were held at around −60 mV to prevent spontaneous firings. The PL intensity of the specimen was measured using a photodiode sensor that was routinely calibrated for each experiment.
.CC-BY-NC-ND 4.0 International licensecertified by peer review) is the author/funder. It is made available under aThe copyright holder for this preprint (which was notthis version posted October 9, 2019. . https://doi.org/10.1101/798702doi: bioRxiv preprint
12
Conditioned place preference test More than 2 weeks after AAV injection, mice were bilaterally implanted with the rod-shaped Ce:GAGG crystals (0.5 mm × 0.5 mm × 1.0−1.5 mm) and used for behavioral tests at >1 week after crystal implantation. Conditioned place preference (CPP) tests were performed in an X-ray machine (MX-160Labo, mediXtec Japan) at the dark period. On the first day of the tests, mice were placed in a test chamber with two compartments (each 10 cm × 12 cm) with different floor textures and visual cues on the walls (Fig. 4B). The mice were habituated to the chamber for 5 min and then allowed to explore freely for 10 min without X-ray irradiation. On the second and third days, the mice were conditioned for 10 min in the chamber in the chamber in which only one of the compartments received X-ray irradiation (150 kV, 3 mA; fig. S8). To restrict the X-ray irradiation to one side, the other compartment was partially shielded with lead boards (Fig. 4B). On the fourth day, the mice were placed in the chamber for 10 min without X-ray irradiation. In the unbiased CPP tests, the mice were videotaped at an oblique angle using a USB camera while the whole chamber was illuminated by ambient white LED light, and the ears of mice were tracked offline using DeepLabCut (30). For the biased CPP tests (fig. S9), a soft floor mat was placed in the non-X-irradiated compartment so that the mice could spend less time in the X-irradiated compartment. In the biased CPP tests, the mice were filmed under infrared (IR) light using an IR camera, and the total time spent in each compartment was measured based on the location of the mouse head. After completion of the CPP tests, the mice were perfused with 4% PFA and the brain was post-fixed overnight. The brain was cut into coronal sections (section thickness: 80 µm) and the Ce:GAGG implantation sites were observed. The trace of the implanted crystal was observed at 0−200 µm from the closest edge of labelled VTA. One mouse that showed considerable damage to the VTA caused by a ventrally-implanted crystal was excluded from the analysis.
Immunostaining For immunostaining of cultured neurons, fixed neurons were washed three times with 1% bovine serum albumin (BSA) and 0.25% Triton-X in PBS (blocking buffer), and then incubated with primary antibodies (anti-GFP, mouse monoclonal, 1:1000, Wako; anti-c-Fos, rabbit polyclonal, 1:1000, Santa Cruz Biotechnology) in blocking buffer for 24−48 h at 4°C. The fixed neurons were washed three times with blocking buffer and then incubated with secondary antibodies (CF594 donkey anti-rabbit IgG, 1:1000, Biotium; CF488A donkey anti-mouse IgG, 1:1000, Biotium) overnight at 4°C.
For immunostaining of brain slices, we performed transcardial perfusion and post-fixation for overnight using 4% PFA. The fixed brains were sectioned into coronal or
horizontal slices on a vibratome (section thickness: 80 µm). The slices were washed three times with blocking buffer, and then incubated with primary antibodies (anti-tyrosine hydroxylase, rabbit polyclonal, 1:1000, Merck Millipore; anti-Iba1, rabbit monoclonal, 1:1000, Wako; anti-GFAP, mouse monoclonal, 1:1000, Merck Millipore; anti-GFP, mouse monoclonal, 1:1000, Wako; anti-cleaved caspase-3 (Asp175), rabbit polyclonal, 1:200, Cell Signaling Technology) in blocking buffer overnight at 4°C. The slices were then washed three times with blocking buffer and then incubated with secondary antibodies (CF594- or CF488A-conjugated donkey anti-rabbit IgG, 1:1000, Biotium; CF488A-conjugated donkey anti-mouse IgG, 1:1000, Biotium) in blocking buffer for 1–2 h at RT. Cellular nuclei were stained by incubation for 10–15 min with DAPI (2 µM in phosphate buffer) at RT. The stained samples were mounted using DABCO, and observed under a florescence microscope (BZ-9000, Keyence) or confocal microscope (LSM710, Zeiss). The green signal of bReaChES-eYFP (Fig. 4A and fig. S4a) was further enhanced by immunostaining using anti-GFP antibody.
Data analysis The number of HEK 293 cells in 35-mm culture dishes (fig. S6) was counted by randomly selecting 100 µm × 100 µm squares surrounding the Ce:GAGG crystal for the dishes containing the crystal or anywhere on the coverslip for control dishes. The mean cell density was calculated as the average of the cell densities of three sites per dish.
To estimate the survival rate of dissociated hippocampal neurons (Fig. 3E), we randomly selected three 0.2 mm × 1.0 mm rectangles per dish, surrounding the Ce:GAGG crystal (one of the longer sides of the rectangle was attached to the edge of the crystal) for the dishes containing the crystal or anywhere on the coverslip for control dishes. The dissociated neurons within these sites at DIV1 were monitored at DIV2, 4, and 7.
To quantify the pixel intensity in epifluorescence images (fig. S7), a 0.1 mm × 0.3 mm rectangle was drawn around the trace of the Ce:GAGG crystal or the optical fibre (one of the shorter sides of the rectangle was attached to the edge of the trace; three sites per image). The rectangle was divided into three sections measuring 0.1 mm × 0.1 mm, and the mean pixel intensity of each square was calculated. The mean global intensity for one image was calculated as the average pixel intensity of the nine squares.
To analyze animal movements in the CPP tests using DeepLabCut (30), the left and right ears of mice were manually annotated using 20−80 frames per movie to train a deep neural network. An estimated ear position with low likelihood (<0.8) was omitted and replaced with a pixel value obtained using linear interpolation of neighboring
.CC-BY-NC-ND 4.0 International licensecertified by peer review) is the author/funder. It is made available under aThe copyright holder for this preprint (which was notthis version posted October 9, 2019. . https://doi.org/10.1101/798702doi: bioRxiv preprint
13
values. The middle pixel coordinate between the tracked left and right ears was considered the animal trajectory, assuming that the coordinate represented the location of the mouse head. The heat maps shown in Fig. 4D indicate the probability of the presence of the animal trajectory within each 100 × 100 pixel image. The number of rearing events was calculated by counting the number of times that the height of the mouse head exceeded a threshold level. In the unbiased CPP test (Fig. 4, D and E), two animals that showed biased initial preference (>95% preference for one
of the two compartments) and one animal that exhibited extremely low locomotor activity were excluded from the analysis.
All values are expressed as mean ± SEM. Statistical analyses were performed using one- or two-way ANOVA followed by Bonferroni’s multiple comparison tests or Dunn’s multiple comparison tests vs. the control with GraphPad Prism or Igor Pro, unless otherwise noted.
.CC-BY-NC-ND 4.0 International licensecertified by peer review) is the author/funder. It is made available under aThe copyright holder for this preprint (which was notthis version posted October 9, 2019. . https://doi.org/10.1101/798702doi: bioRxiv preprint
14
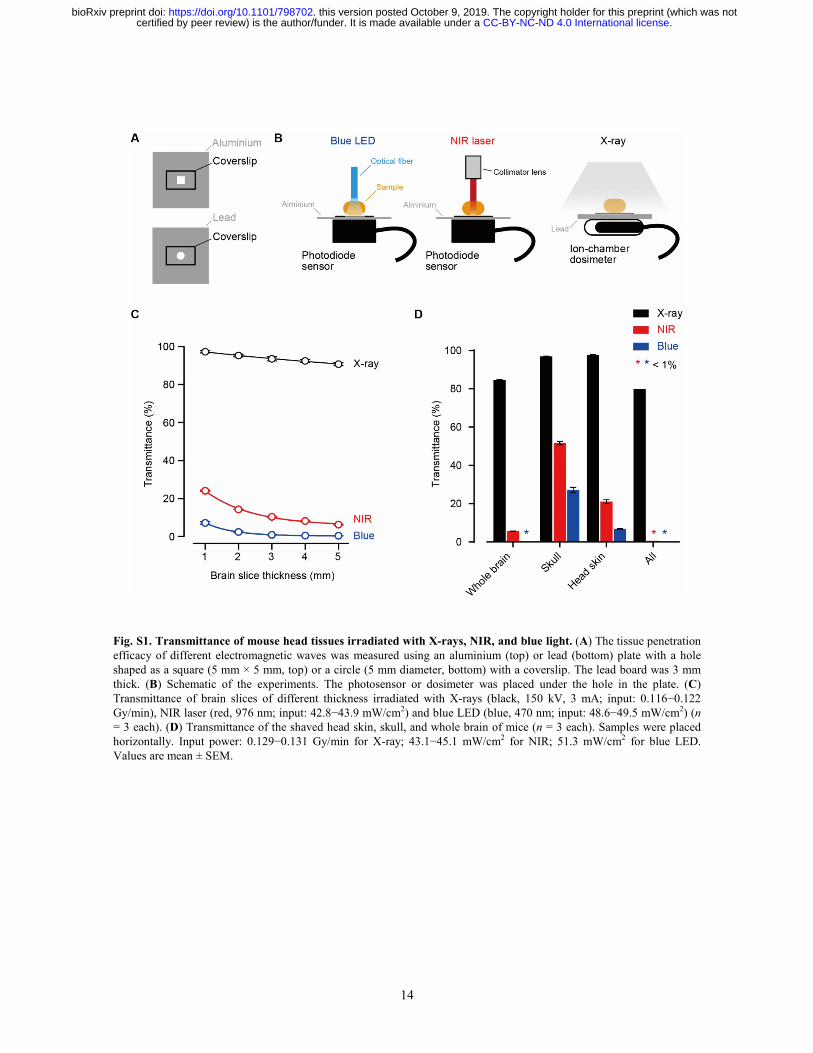
Fig. S1. Transmittance of mouse head tissues irradiated with X-rays, NIR, and blue light. (A) The tissue penetration efficacy of different electromagnetic waves was measured using an aluminium (top) or lead (bottom) plate with a hole shaped as a square (5 mm × 5 mm, top) or a circle (5 mm diameter, bottom) with a coverslip. The lead board was 3 mm thick. (B) Schematic of the experiments. The photosensor or dosimeter was placed under the hole in the plate. (C) Transmittance of brain slices of different thickness irradiated with X-rays (black, 150 kV, 3 mA; input: 0.116−0.122 Gy/min), NIR laser (red, 976 nm; input: 42.8−43.9 mW/cm2) and blue LED (blue, 470 nm; input: 48.6−49.5 mW/cm2) (n = 3 each). (D) Transmittance of the shaved head skin, skull, and whole brain of mice (n = 3 each). Samples were placed horizontally. Input power: 0.129−0.131 Gy/min for X-ray; 43.1−45.1 mW/cm2 for NIR; 51.3 mW/cm2 for blue LED. Values are mean ± SEM.
.CC-BY-NC-ND 4.0 International licensecertified by peer review) is the author/funder. It is made available under aThe copyright holder for this preprint (which was notthis version posted October 9, 2019. . https://doi.org/10.1101/798702doi: bioRxiv preprint
15
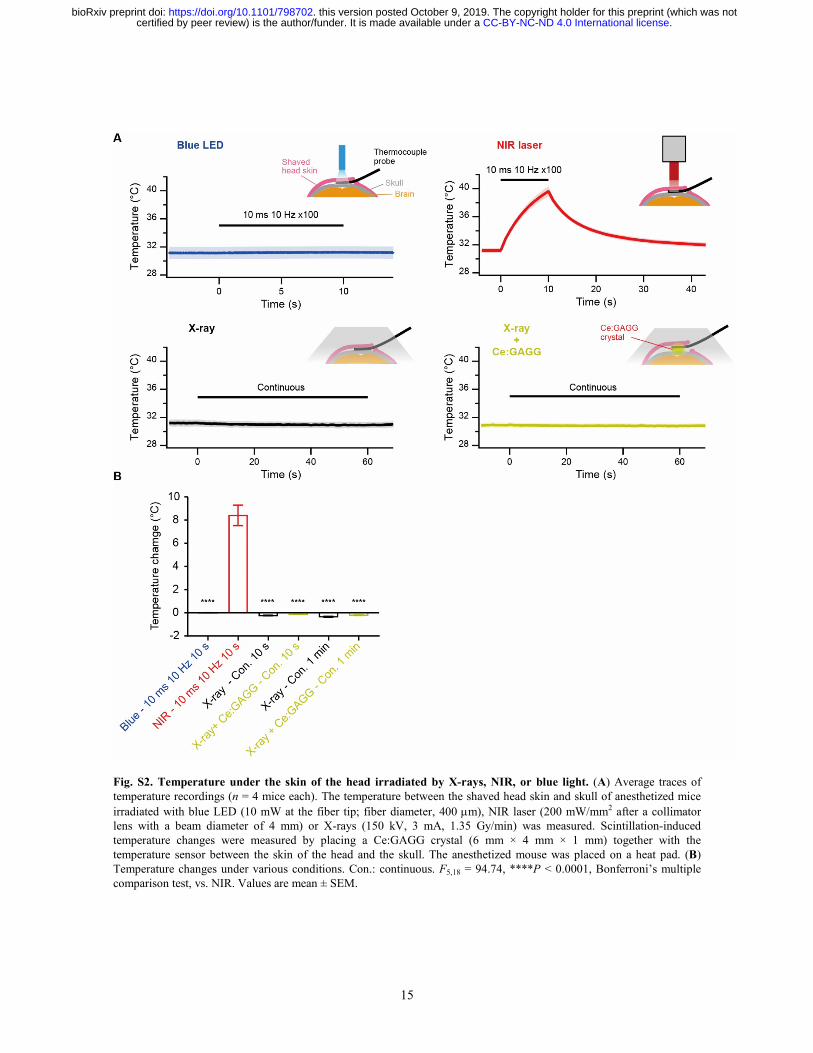
Fig. S2. Temperature under the skin of the head irradiated by X-rays, NIR, or blue light. (A) Average traces of temperature recordings (n = 4 mice each). The temperature between the shaved head skin and skull of anesthetized mice irradiated with blue LED (10 mW at the fiber tip; fiber diameter, 400 µm), NIR laser (200 mW/mm2 after a collimator lens with a beam diameter of 4 mm) or X-rays (150 kV, 3 mA, 1.35 Gy/min) was measured. Scintillation-induced temperature changes were measured by placing a Ce:GAGG crystal (6 mm × 4 mm × 1 mm) together with the temperature sensor between the skin of the head and the skull. The anesthetized mouse was placed on a heat pad. (B) Temperature changes under various conditions. Con.: continuous. F5,18 = 94.74, ****P < 0.0001, Bonferroni’s multiple comparison test, vs. NIR. Values are mean ± SEM.
.CC-BY-NC-ND 4.0 International licensecertified by peer review) is the author/funder. It is made available under aThe copyright holder for this preprint (which was notthis version posted October 9, 2019. . https://doi.org/10.1101/798702doi: bioRxiv preprint
16
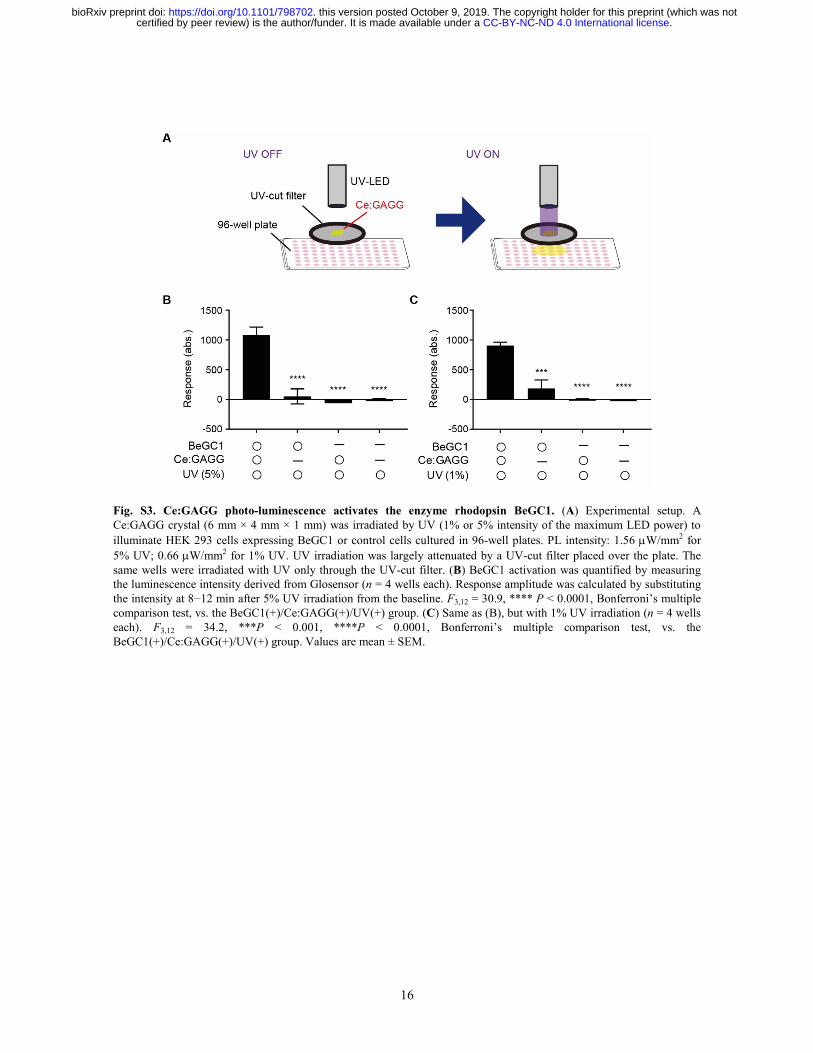
Fig. S3. Ce:GAGG photo-luminescence activates the enzyme rhodopsin BeGC1. (A) Experimental setup. A Ce:GAGG crystal (6 mm × 4 mm × 1 mm) was irradiated by UV (1% or 5% intensity of the maximum LED power) to illuminate HEK 293 cells expressing BeGC1 or control cells cultured in 96-well plates. PL intensity: 1.56 µW/mm2 for 5% UV; 0.66 µW/mm2 for 1% UV. UV irradiation was largely attenuated by a UV-cut filter placed over the plate. The same wells were irradiated with UV only through the UV-cut filter. (B) BeGC1 activation was quantified by measuring the luminescence intensity derived from Glosensor (n = 4 wells each). Response amplitude was calculated by substituting the intensity at 8−12 min after 5% UV irradiation from the baseline. F3,12 = 30.9, **** P < 0.0001, Bonferroni’s multiple comparison test, vs. the BeGC1(+)/Ce:GAGG(+)/UV(+) group. (C) Same as (B), but with 1% UV irradiation (n = 4 wells each). F3,12 = 34.2, ***P < 0.001, ****P < 0.0001, Bonferroni’s multiple comparison test, vs. the BeGC1(+)/Ce:GAGG(+)/UV(+) group. Values are mean ± SEM.
.CC-BY-NC-ND 4.0 International licensecertified by peer review) is the author/funder. It is made available under aThe copyright holder for this preprint (which was notthis version posted October 9, 2019. . https://doi.org/10.1101/798702doi: bioRxiv preprint
17
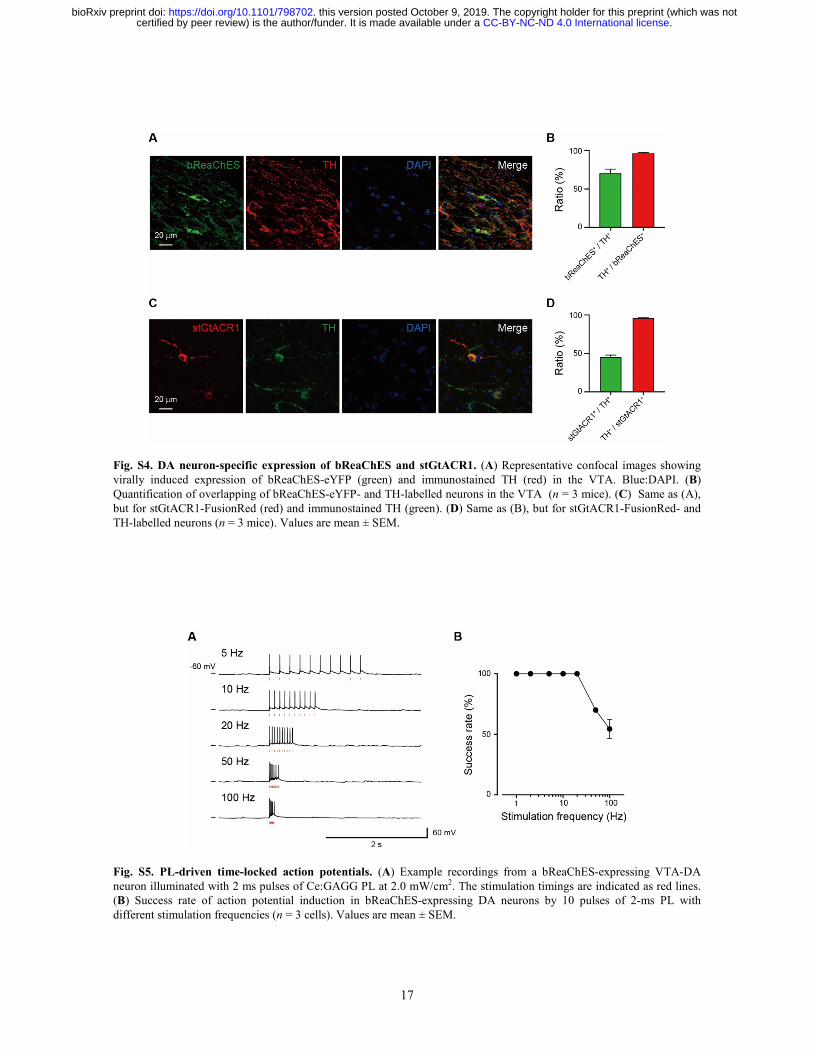
Fig. S4. DA neuron-specific expression of bReaChES and stGtACR1. (A) Representative confocal images showing virally induced expression of bReaChES-eYFP (green) and immunostained TH (red) in the VTA. Blue:DAPI. (B) Quantification of overlapping of bReaChES-eYFP- and TH-labelled neurons in the VTA (n = 3 mice). (C) Same as (A), but for stGtACR1-FusionRed (red) and immunostained TH (green). (D) Same as (B), but for stGtACR1-FusionRed- and TH-labelled neurons (n = 3 mice). Values are mean ± SEM.
Fig. S5. PL-driven time-locked action potentials. (A) Example recordings from a bReaChES-expressing VTA-DA neuron illuminated with 2 ms pulses of Ce:GAGG PL at 2.0 mW/cm2. The stimulation timings are indicated as red lines. (B) Success rate of action potential induction in bReaChES-expressing DA neurons by 10 pulses of 2-ms PL with different stimulation frequencies (n = 3 cells). Values are mean ± SEM.
.CC-BY-NC-ND 4.0 International licensecertified by peer review) is the author/funder. It is made available under aThe copyright holder for this preprint (which was notthis version posted October 9, 2019. . https://doi.org/10.1101/798702doi: bioRxiv preprint
18
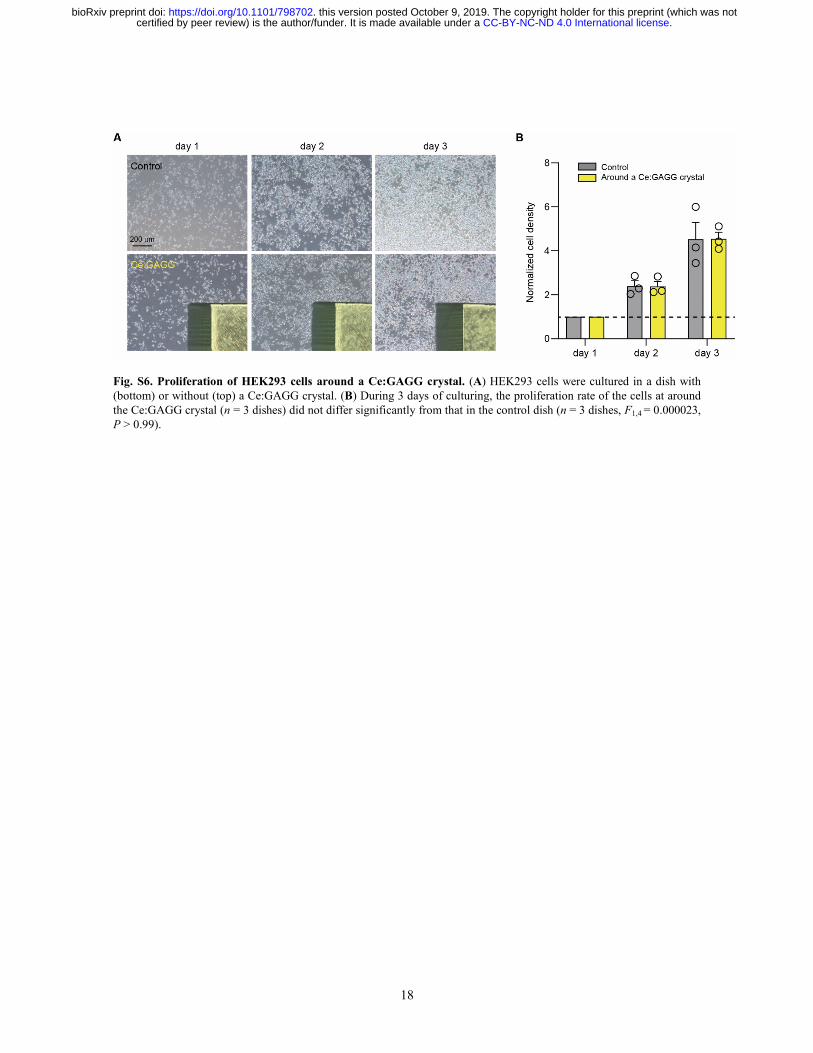
Fig. S6. Proliferation of HEK293 cells around a Ce:GAGG crystal. (A) HEK293 cells were cultured in a dish with (bottom) or without (top) a Ce:GAGG crystal. (B) During 3 days of culturing, the proliferation rate of the cells at around the Ce:GAGG crystal (n = 3 dishes) did not differ significantly from that in the control dish (n = 3 dishes, F1,4 = 0.000023, P > 0.99).
.CC-BY-NC-ND 4.0 International licensecertified by peer review) is the author/funder. It is made available under aThe copyright holder for this preprint (which was notthis version posted October 9, 2019. . https://doi.org/10.1101/798702doi: bioRxiv preprint
19
.CC-BY-NC-ND 4.0 International licensecertified by peer review) is the author/funder. It is made available under aThe copyright holder for this preprint (which was notthis version posted October 9, 2019. . https://doi.org/10.1101/798702doi: bioRxiv preprint
20
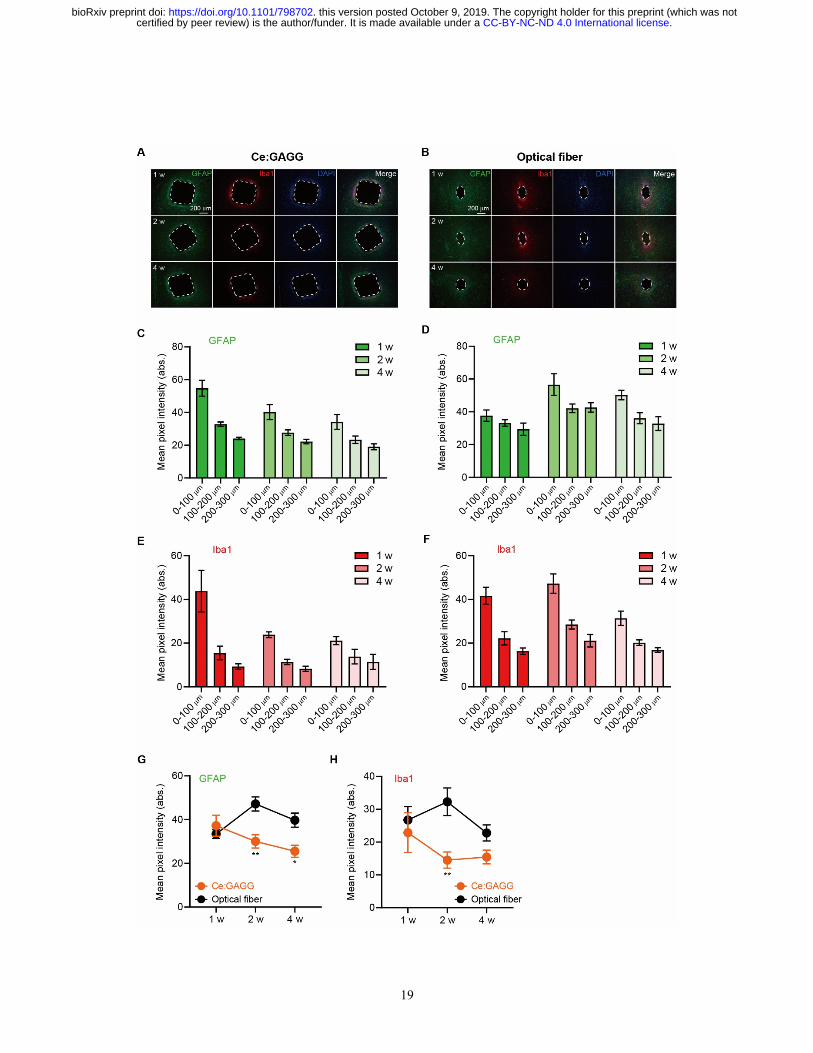
Fig. S7. Immunoreactivity against GFAP and Iba1 around the implanted Ce:GAGG crystal in vivo. (A and B) Representative epifluorescence images of horizontal slices showing immunostaining for astrocytes (GFAP, green) and activated microglia (Iba1, red) at the implantation site (dashed outline) of a Ce:GAGG crystal (A) or an optical fiber (B). The time points after implantation were 1, 2 or 4 weeks (w). (C and D) Mean pixel intensities of GFAP staining around the implantation trace of a Ce:GAGG crystal (C) or an optical fiber (D) as a function of distance from the trace (n = 3 mice each). (E and F) Same as (C and D), respectively, but for Iba1. (G and H) Mean pixel intensities of GFAP (G)- or Iba1 (H)-staining 0−300 µm from the trace edge are plotted as a function of implantation duration [(G) F2,32 = 21.5, *P < 0.05, **P < 0.01; (H) F2,32 = 4.7, **P < 0.01; Bonferroni’s multiple comparison test, Ce:GAGG vs. optical fiber at each time point]. Values are mean ± SEM.
.CC-BY-NC-ND 4.0 International licensecertified by peer review) is the author/funder. It is made available under aThe copyright holder for this preprint (which was notthis version posted October 9, 2019. . https://doi.org/10.1101/798702doi: bioRxiv preprint
21
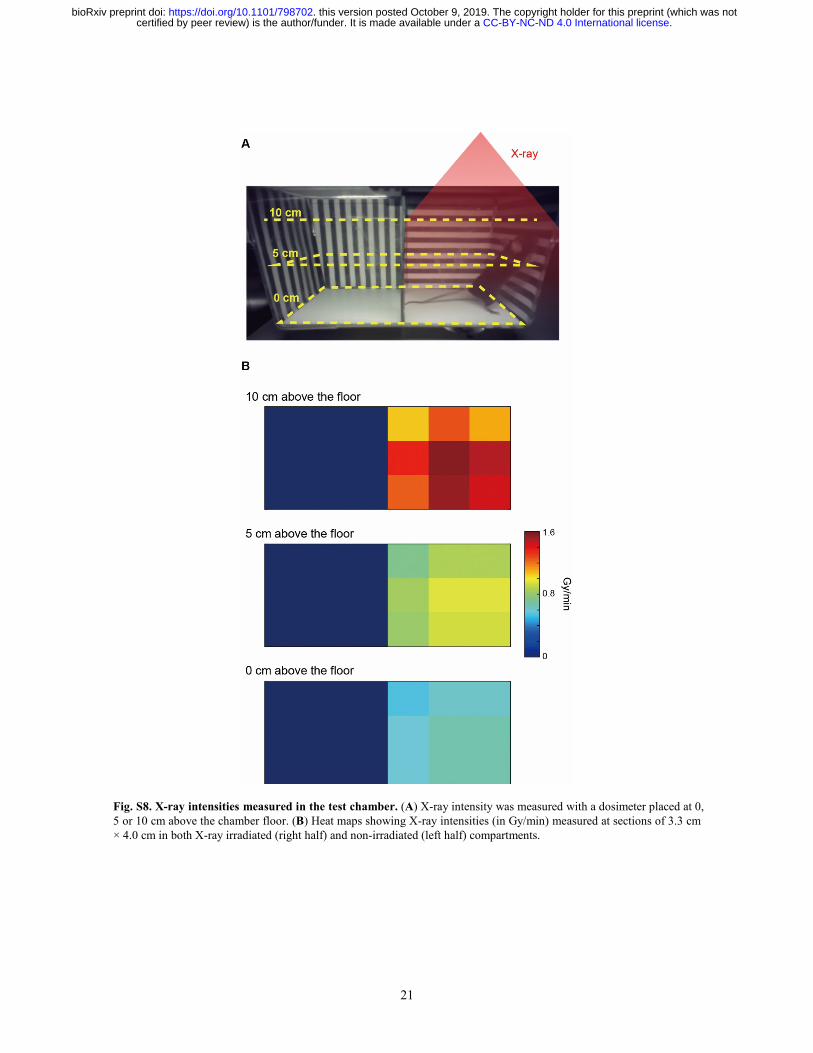
Fig. S8. X-ray intensities measured in the test chamber. (A) X-ray intensity was measured with a dosimeter placed at 0, 5 or 10 cm above the chamber floor. (B) Heat maps showing X-ray intensities (in Gy/min) measured at sections of 3.3 cm × 4.0 cm in both X-ray irradiated (right half) and non-irradiated (left half) compartments.
.CC-BY-NC-ND 4.0 International licensecertified by peer review) is the author/funder. It is made available under aThe copyright holder for this preprint (which was notthis version posted October 9, 2019. . https://doi.org/10.1101/798702doi: bioRxiv preprint
22
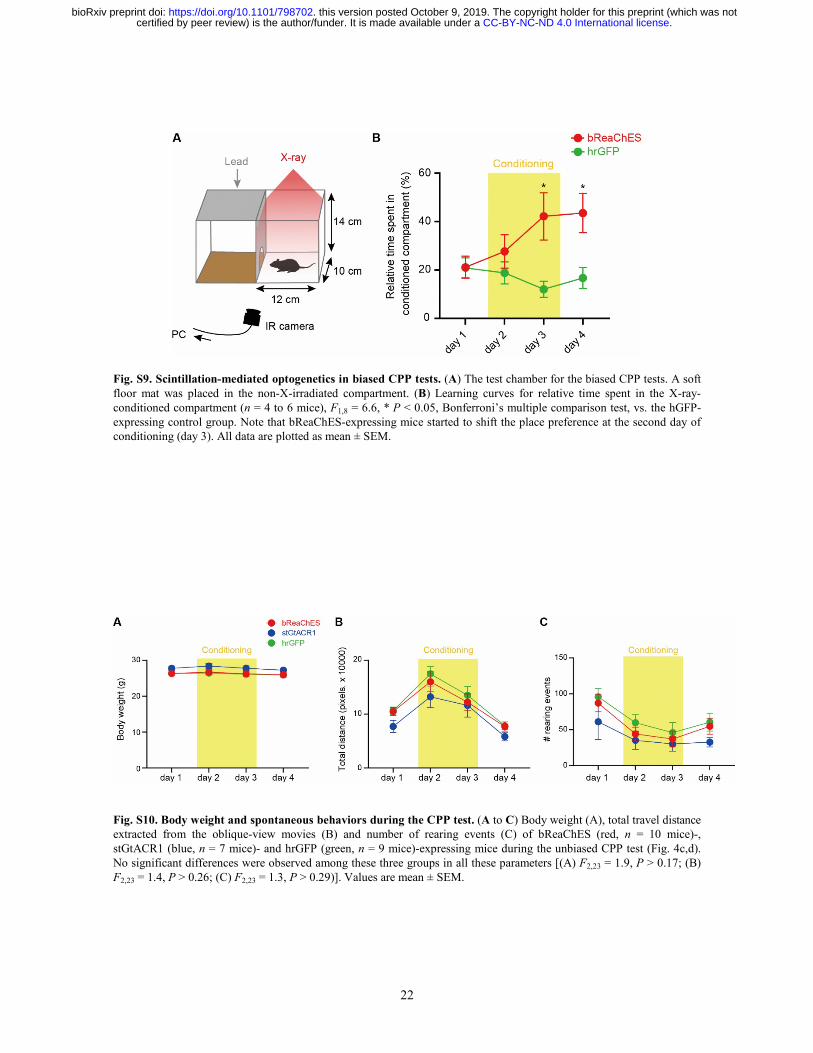
Fig. S9. Scintillation-mediated optogenetics in biased CPP tests. (A) The test chamber for the biased CPP tests. A soft floor mat was placed in the non-X-irradiated compartment. (B) Learning curves for relative time spent in the X-ray-conditioned compartment (n = 4 to 6 mice), F1,8 = 6.6, * P < 0.05, Bonferroni’s multiple comparison test, vs. the hGFP-expressing control group. Note that bReaChES-expressing mice started to shift the place preference at the second day of conditioning (day 3). All data are plotted as mean ± SEM.
Fig. S10. Body weight and spontaneous behaviors during the CPP test. (A to C) Body weight (A), total travel distance extracted from the oblique-view movies (B) and number of rearing events (C) of bReaChES (red, n = 10 mice)-, stGtACR1 (blue, n = 7 mice)- and hrGFP (green, n = 9 mice)-expressing mice during the unbiased CPP test (Fig. 4c,d). No significant differences were observed among these three groups in all these parameters [(A) F2,23 = 1.9, P > 0.17; (B) F2,23 = 1.4, P > 0.26; (C) F2,23 = 1.3, P > 0.29)]. Values are mean ± SEM.
.CC-BY-NC-ND 4.0 International licensecertified by peer review) is the author/funder. It is made available under aThe copyright holder for this preprint (which was notthis version posted October 9, 2019. . https://doi.org/10.1101/798702doi: bioRxiv preprint
23
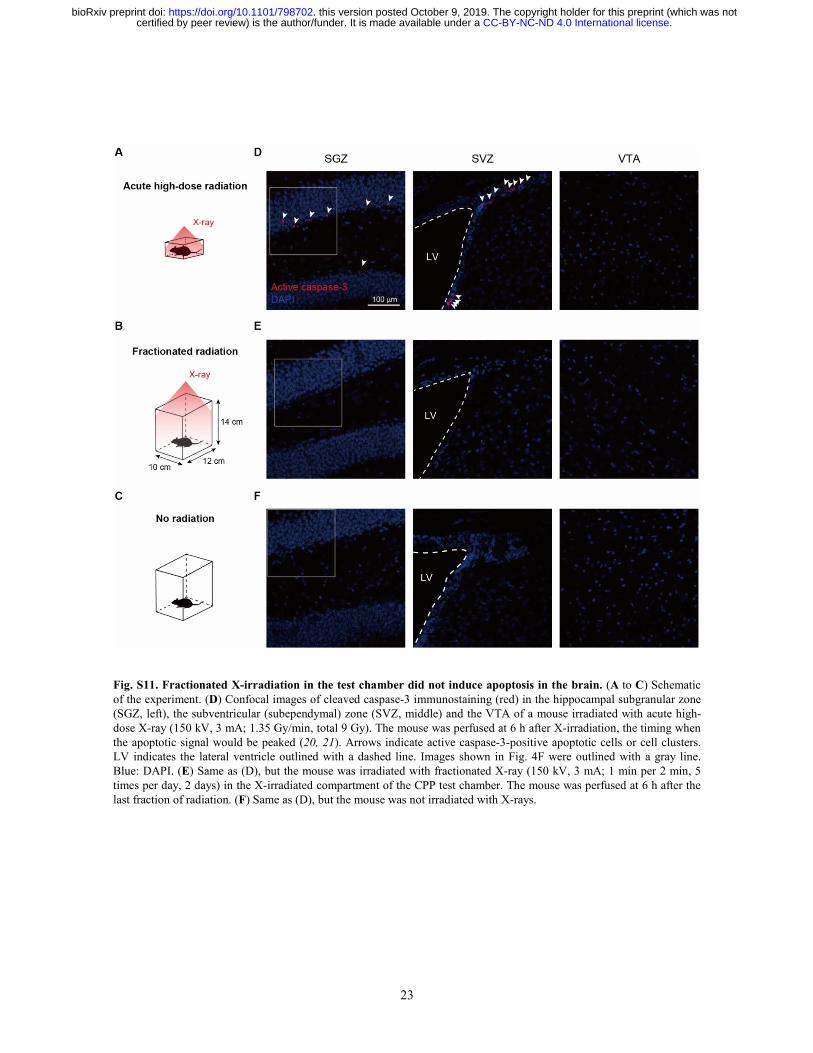
Fig. S11. Fractionated X-irradiation in the test chamber did not induce apoptosis in the brain. (A to C) Schematic of the experiment. (D) Confocal images of cleaved caspase-3 immunostaining (red) in the hippocampal subgranular zone (SGZ, left), the subventricular (subependymal) zone (SVZ, middle) and the VTA of a mouse irradiated with acute high-dose X-ray (150 kV, 3 mA; 1.35 Gy/min, total 9 Gy). The mouse was perfused at 6 h after X-irradiation, the timing when the apoptotic signal would be peaked (20, 21). Arrows indicate active caspase-3-positive apoptotic cells or cell clusters. LV indicates the lateral ventricle outlined with a dashed line. Images shown in Fig. 4F were outlined with a gray line. Blue: DAPI. (E) Same as (D), but the mouse was irradiated with fractionated X-ray (150 kV, 3 mA; 1 min per 2 min, 5 times per day, 2 days) in the X-irradiated compartment of the CPP test chamber. The mouse was perfused at 6 h after the last fraction of radiation. (F) Same as (D), but the mouse was not irradiated with X-rays.
.CC-BY-NC-ND 4.0 International licensecertified by peer review) is the author/funder. It is made available under aThe copyright holder for this preprint (which was notthis version posted October 9, 2019. . https://doi.org/10.1101/798702doi: bioRxiv preprint
24
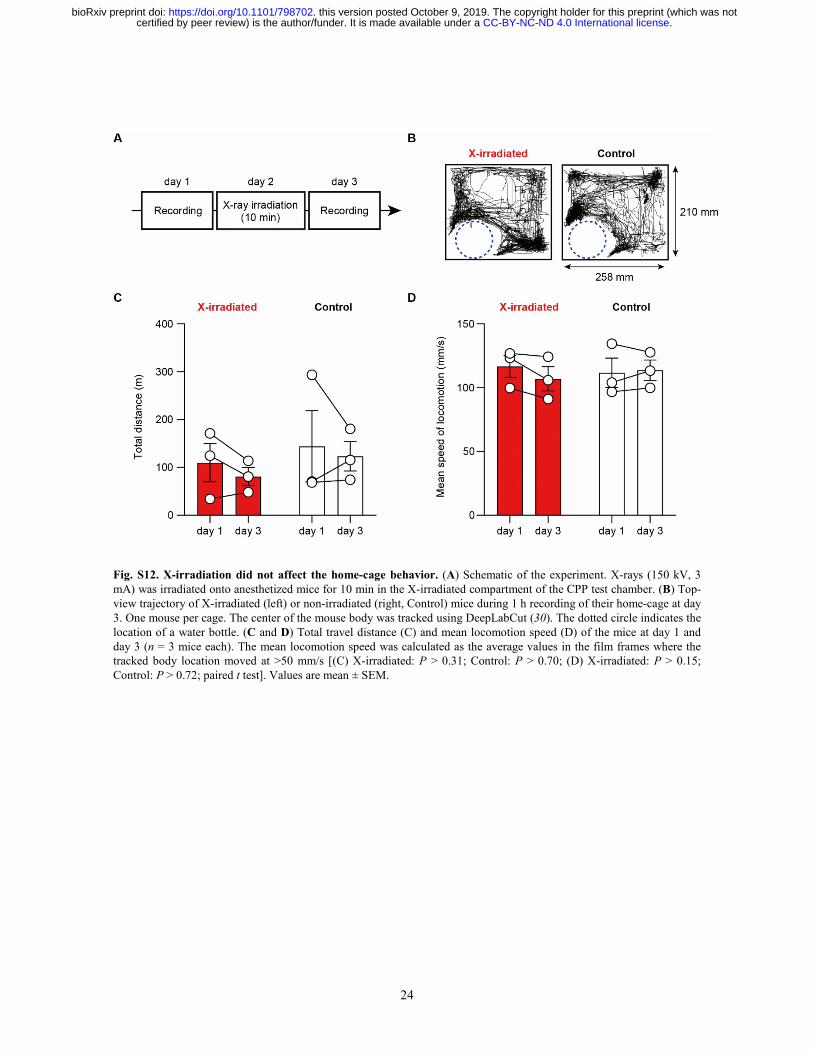
Fig. S12. X-irradiation did not affect the home-cage behavior. (A) Schematic of the experiment. X-rays (150 kV, 3 mA) was irradiated onto anesthetized mice for 10 min in the X-irradiated compartment of the CPP test chamber. (B) Top-view trajectory of X-irradiated (left) or non-irradiated (right, Control) mice during 1 h recording of their home-cage at day 3. One mouse per cage. The center of the mouse body was tracked using DeepLabCut (30). The dotted circle indicates the location of a water bottle. (C and D) Total travel distance (C) and mean locomotion speed (D) of the mice at day 1 and day 3 (n = 3 mice each). The mean locomotion speed was calculated as the average values in the film frames where the tracked body location moved at >50 mm/s [(C) X-irradiated: P > 0.31; Control: P > 0.70; (D) X-irradiated: P > 0.15; Control: P > 0.72; paired t test]. Values are mean ± SEM.
.CC-BY-NC-ND 4.0 International licensecertified by peer review) is the author/funder. It is made available under aThe copyright holder for this preprint (which was notthis version posted October 9, 2019. . https://doi.org/10.1101/798702doi: bioRxiv preprint