Embed Size (px)
Citation preview
Supporting Information
Replacing the Axial Ligand Tyrosine 75 or its Hydrogen Bond
Partner Histidine 83 minimally affects hemin acquisition by the
Hemophore HasAp from Pseudomonas aeruginosa§ξ
Ritesh Kumar¥, Hirotoshi Matsumura
€, Scott Lovell
¢, Huili Yao
£, Juan C. Rodríguez
£, Kevin P.
Battaile¶, Pierre Moënne-Loccoz
€*, and Mario Rivera
£*
£Department of Chemistry, University of Kansas, Multidisciplinary Research Building, 2030
Becker Dr., Lawrence, KS 66047, United States ¥Center for Bioinformatics and Department of Molecular Biosciences, University of Kansas,
Multidisciplinary Research Building , 2030 Becker Dr., Lawrence, KS 66047, United States ¢Protein Structure Lab, Del Shankel Structural Biology Center, University of Kansas, 2034
Becker Drive, Lawrence, Kansas 66047, United States €Division of Environmental & Biomolecular Systems, Institute of Environmental Health, Oregon
Health and Science University, 3181 SW Sam Jackson Park Road, Oregon 97239, United States
¶IMCA-CAT, Hauptman Woodward Medical Research Institute, 9700 South Cass Avenue, Bldg.
435A, Argonne, Illinois 60439, United States
*Corresponding authors:
Pierre Moënne-Loccoz, Division of Environmental & Biomolecular Systems, Institute of
Environmental Health, Oregon Health and Science University, 3181 SW Sam Jackson Park
Road, Oregon 97239. Telephone: 503-346-3429; Fax: 503-346-3417; Email:
Mario Rivera, Department of Chemistry, University of Kansas, Multidisciplinary Research
Building, 2030 Becker Dr., Lawrence, KS 66047. Telephone: 503-864-4936; Fax: 785-864-
1916; E-mail: [email protected]
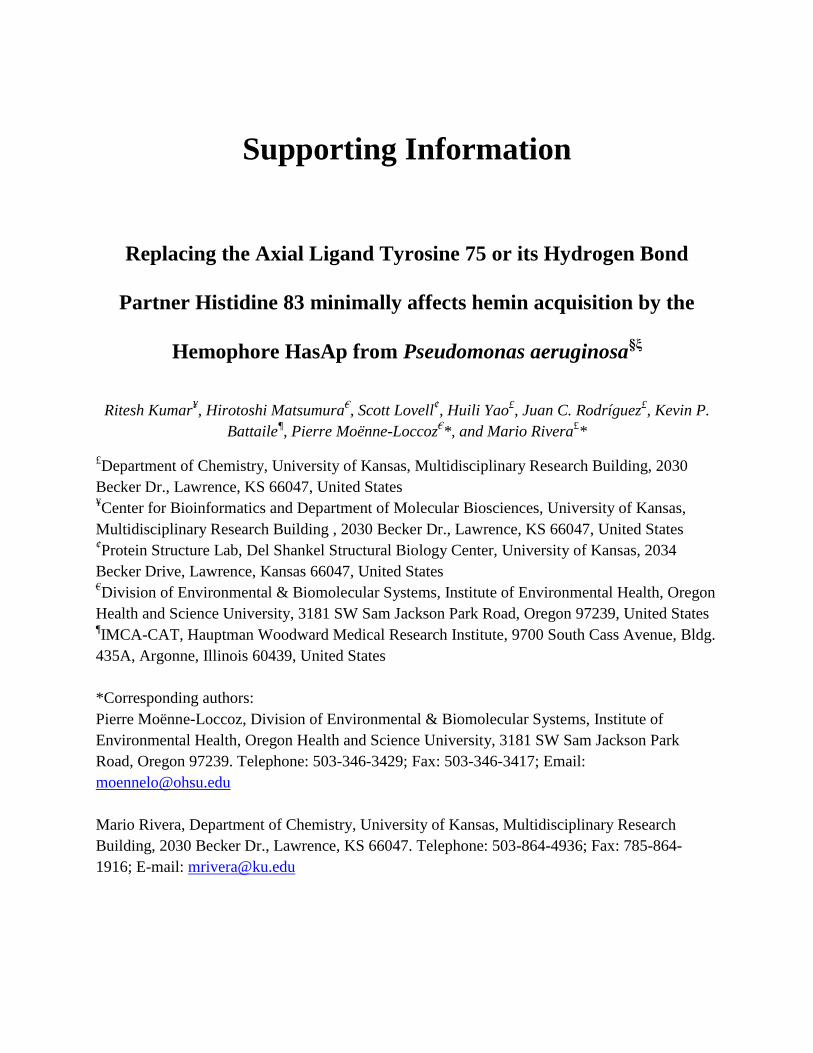
Figure S1. Elution volumes (Ve) from a calibrated Superdex 75 column and estimated molecular
weight of Y75A HasAp (red triangle) and H83A HasAp (green diamond). The Superdex 75
column was calibrated with albumin (67 kDa), ovalbumin (44 kDa), chymotrypsin (25 kDa), and
cytochrome c (12.4 kDa) shown in black filled circles.
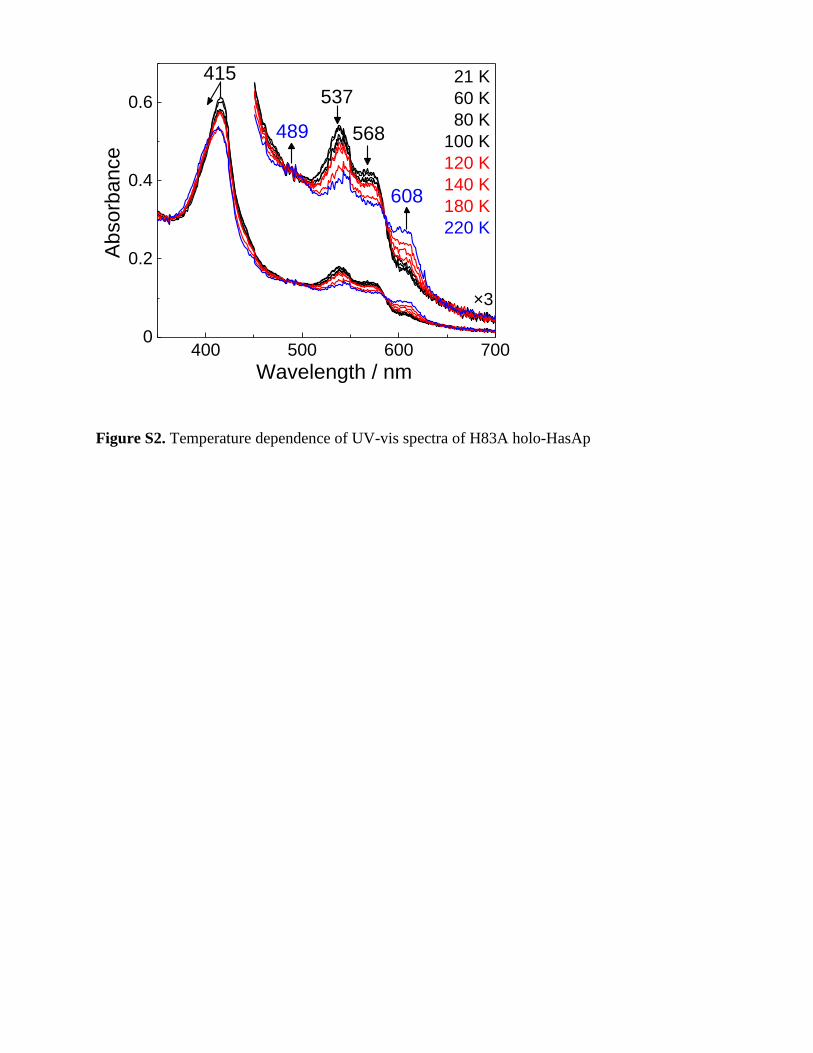
Figure S2. Temperature dependence of UV-vis spectra of H83A holo-HasAp
400 500 600 7000
0.2
0.4
0.6
489
×3
537
568
608
Ab
so
rba
nce
Wavelength / nm
415 21 K
60 K
80 K
100 K
120 K
140 K
180 K
220 K
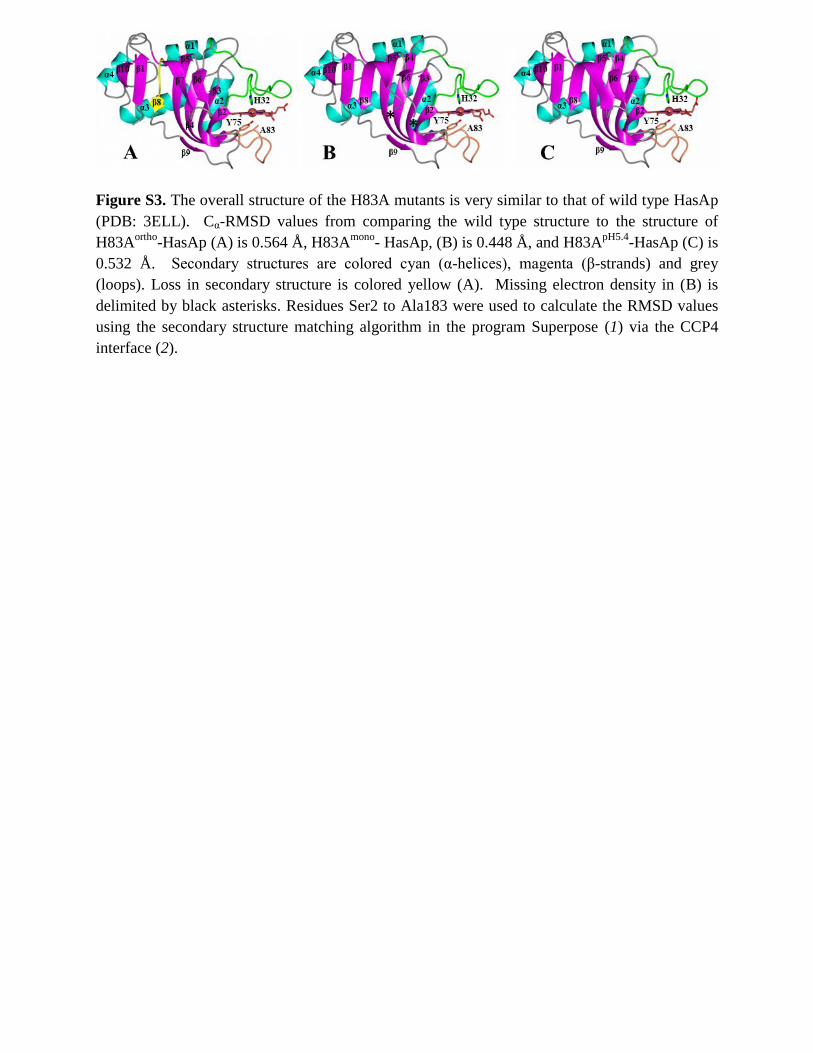
Figure S3. The overall structure of the H83A mutants is very similar to that of wild type HasAp
(PDB: 3ELL). Cα-RMSD values from comparing the wild type structure to the structure of
H83Aortho
-HasAp (A) is 0.564 Å, H83Amono
- HasAp, (B) is 0.448 Å, and H83ApH5.4
-HasAp (C) is
0.532 Å. Secondary structures are colored cyan (α-helices), magenta (β-strands) and grey
(loops). Loss in secondary structure is colored yellow (A). Missing electron density in (B) is
delimited by black asterisks. Residues Ser2 to Ala183 were used to calculate the RMSD values
using the secondary structure matching algorithm in the program Superpose (1) via the CCP4
interface (2).
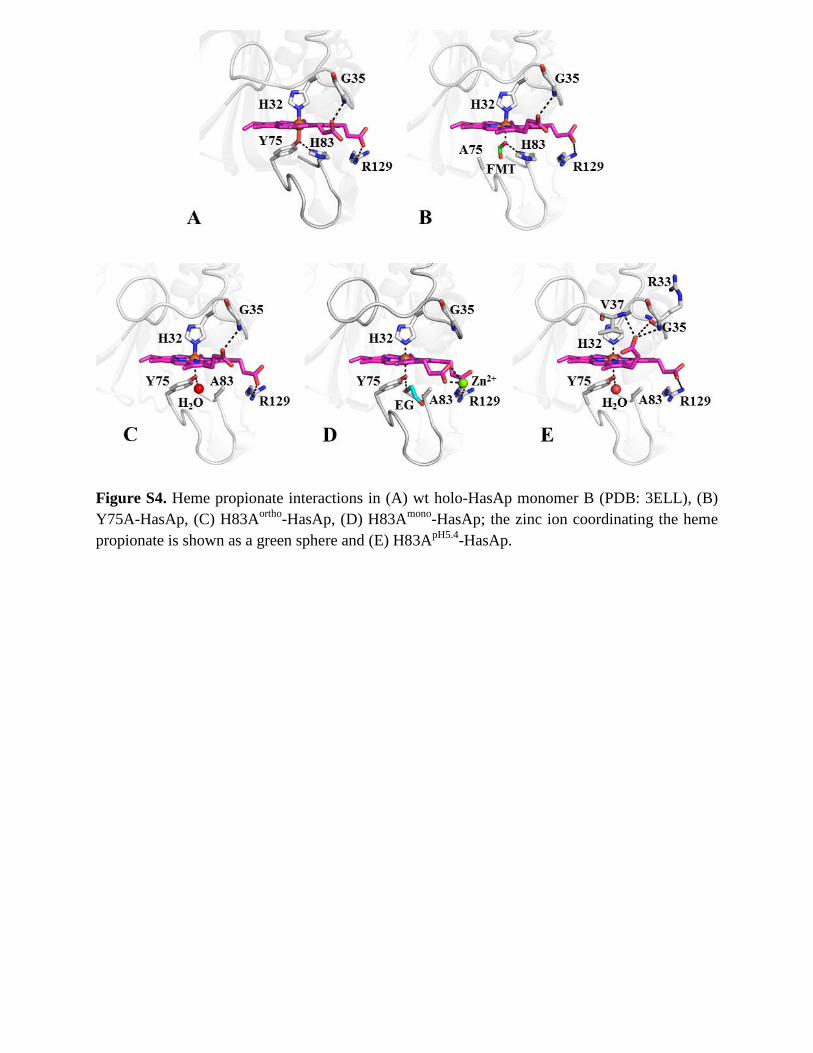
Figure S4. Heme propionate interactions in (A) wt holo-HasAp monomer B (PDB: 3ELL), (B)
Y75A-HasAp, (C) H83Aortho
-HasAp, (D) H83Amono
-HasAp; the zinc ion coordinating the heme
propionate is shown as a green sphere and (E) H83ApH5.4
-HasAp.
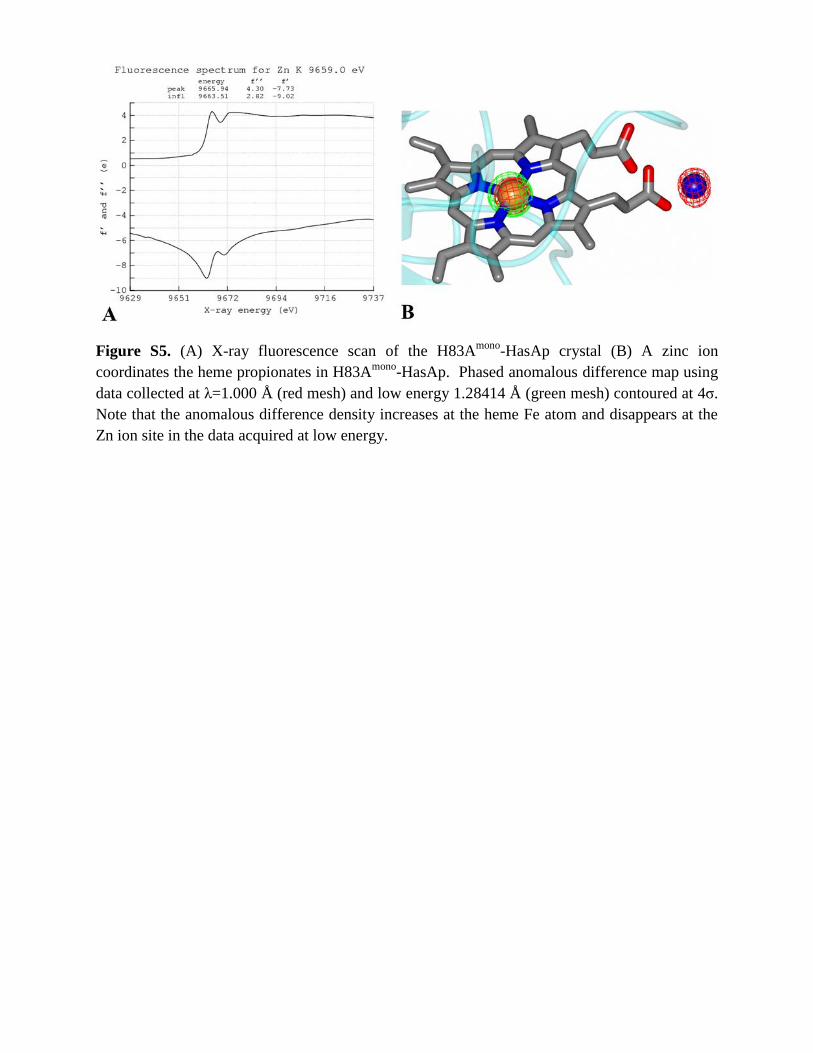
Figure S5. (A) X-ray fluorescence scan of the H83Amono
-HasAp crystal (B) A zinc ion
coordinates the heme propionates in H83Amono
-HasAp. Phased anomalous difference map using
data collected at λ=1.000 Å (red mesh) and low energy 1.28414 Å (green mesh) contoured at 4σ.
Note that the anomalous difference density increases at the heme Fe atom and disappears at the
Zn ion site in the data acquired at low energy.
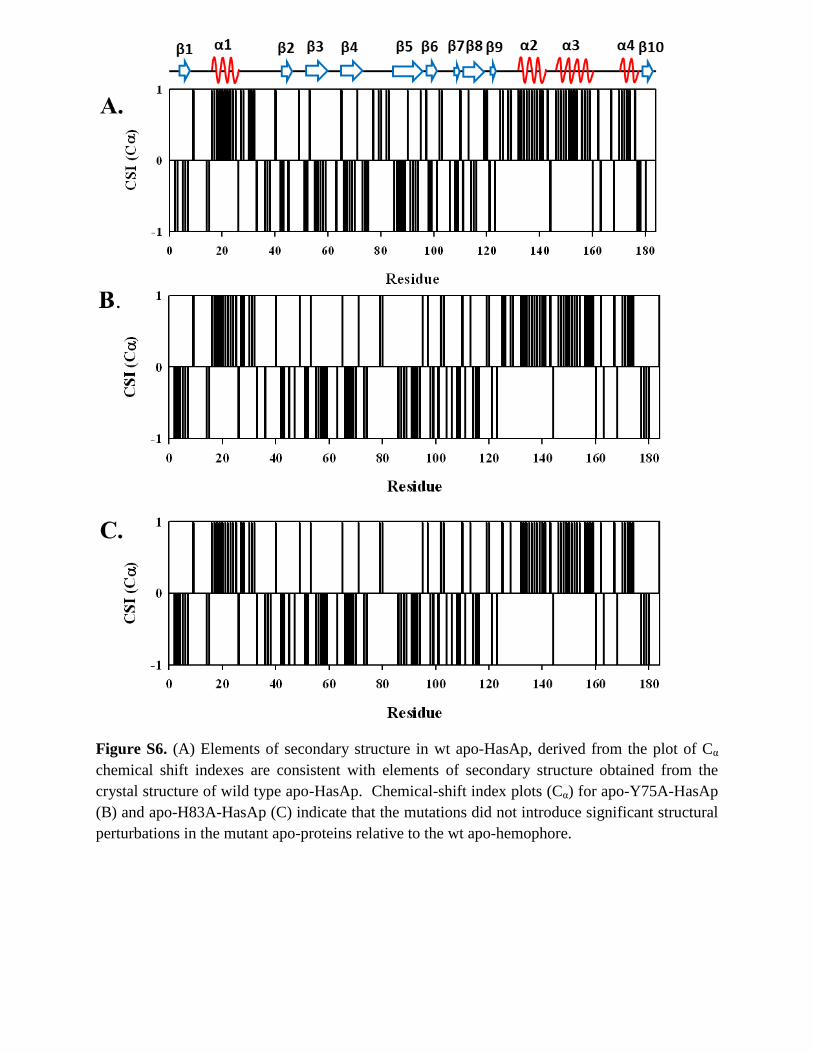
Figure S6. (A) Elements of secondary structure in wt apo-HasAp, derived from the plot of Cα
chemical shift indexes are consistent with elements of secondary structure obtained from the
crystal structure of wild type apo-HasAp. Chemical-shift index plots (Cα) for apo-Y75A-HasAp
(B) and apo-H83A-HasAp (C) indicate that the mutations did not introduce significant structural
perturbations in the mutant apo-proteins relative to the wt apo-hemophore.
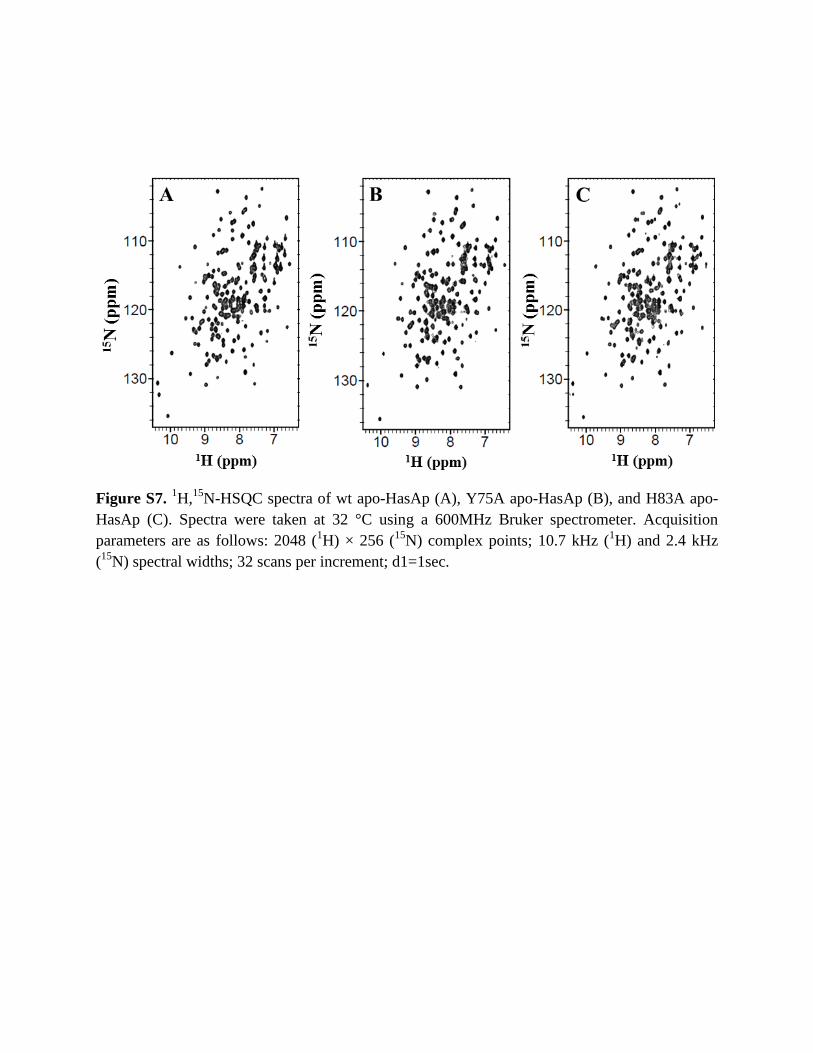
Figure S7. 1H,
15N-HSQC spectra of wt apo-HasAp (A), Y75A apo-HasAp (B), and H83A apo-
HasAp (C). Spectra were taken at 32 °C using a 600MHz Bruker spectrometer. Acquisition
parameters are as follows: 2048 (1H) × 256 (
15N) complex points; 10.7 kHz (
1H) and 2.4 kHz
(15
N) spectral widths; 32 scans per increment; d1=1sec.
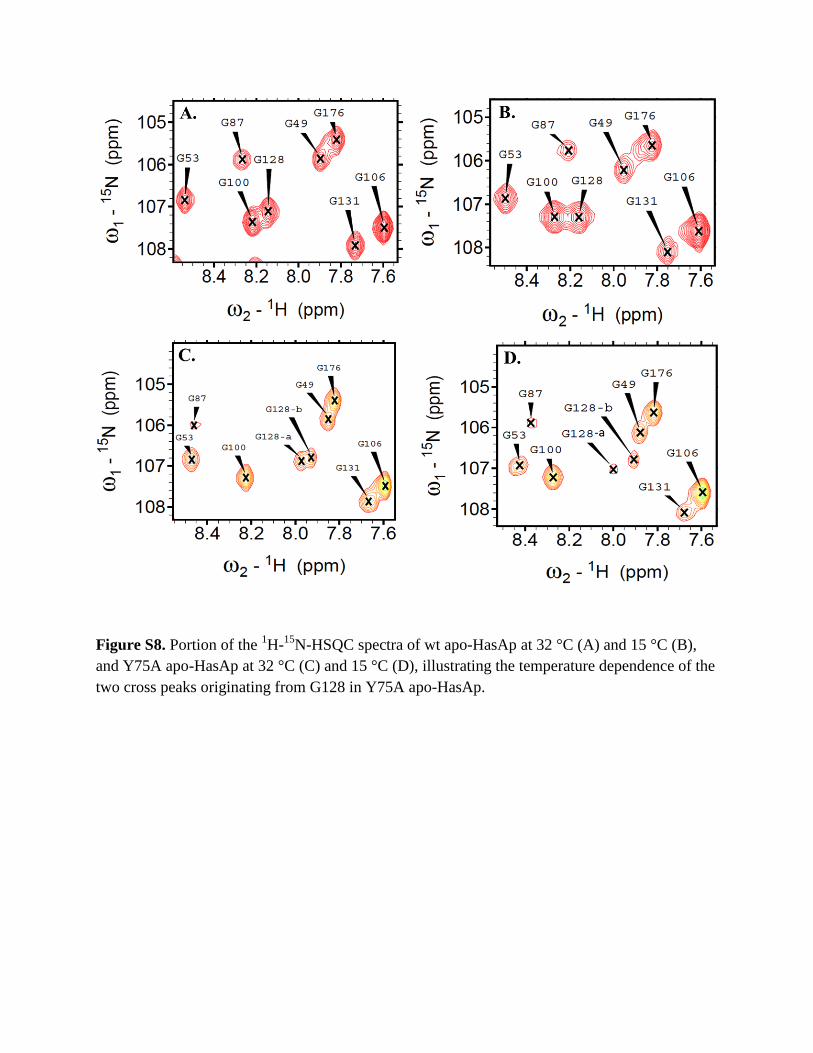
Figure S8. Portion of the 1H-
15N-HSQC spectra of wt apo-HasAp at 32 °C (A) and 15 °C (B),
and Y75A apo-HasAp at 32 °C (C) and 15 °C (D), illustrating the temperature dependence of the
two cross peaks originating from G128 in Y75A apo-HasAp.
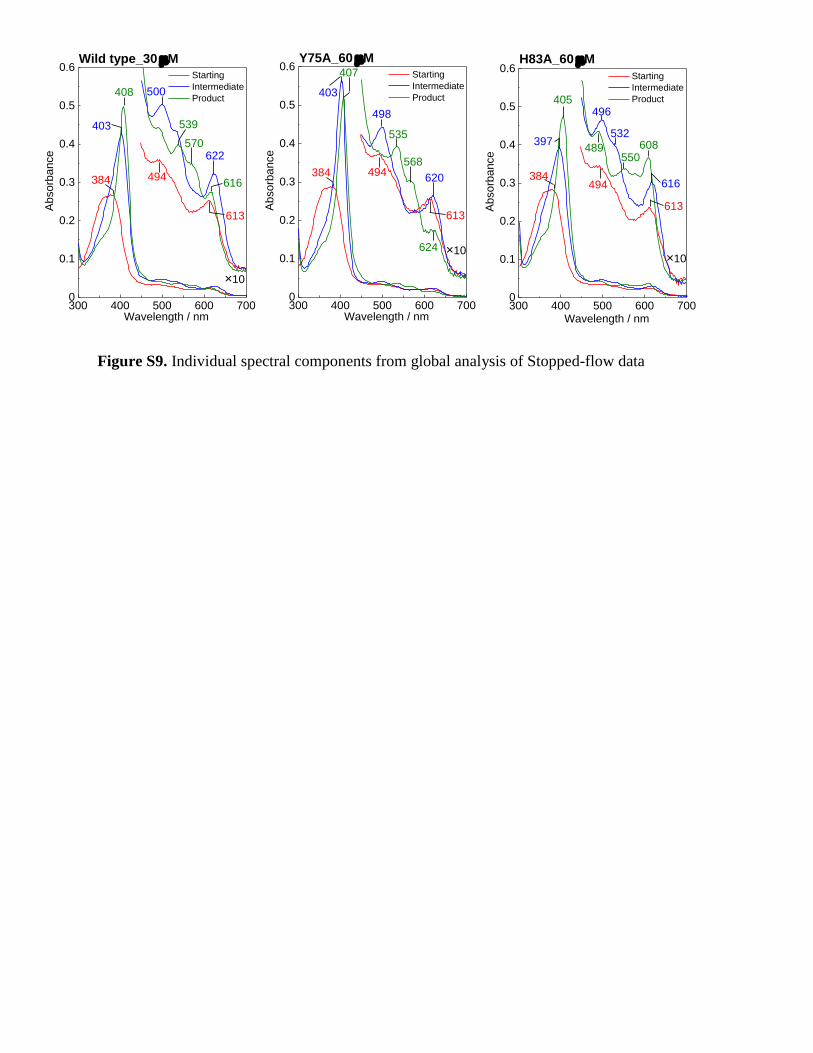
Figure S9. Individual spectral components from global analysis of Stopped-flow data
300 400 500 600 7000
0.1
0.2
0.3
0.4
0.5
0.6
×10
Wild type_30 M
A
bsorb
ance
Wavelength / nm
Starting
Intermediate
Product
384
539
570622
494
613
616
403
500408
300 400 500 600 7000
0.1
0.2
0.3
0.4
0.5
0.6
×10
Y75A_60 M
Absorb
ance
Wavelength / nm
Starting
Intermediate
Product
384
535
568
620494
613
624
403
498
407
300 400 500 600 7000
0.1
0.2
0.3
0.4
0.5
0.6
×10
Starting
Intermediate
Product
Ab
sorb
ance
Wavelength / nm
550
H83A_60 M
384
532
496
608
494
613
616
397489
405
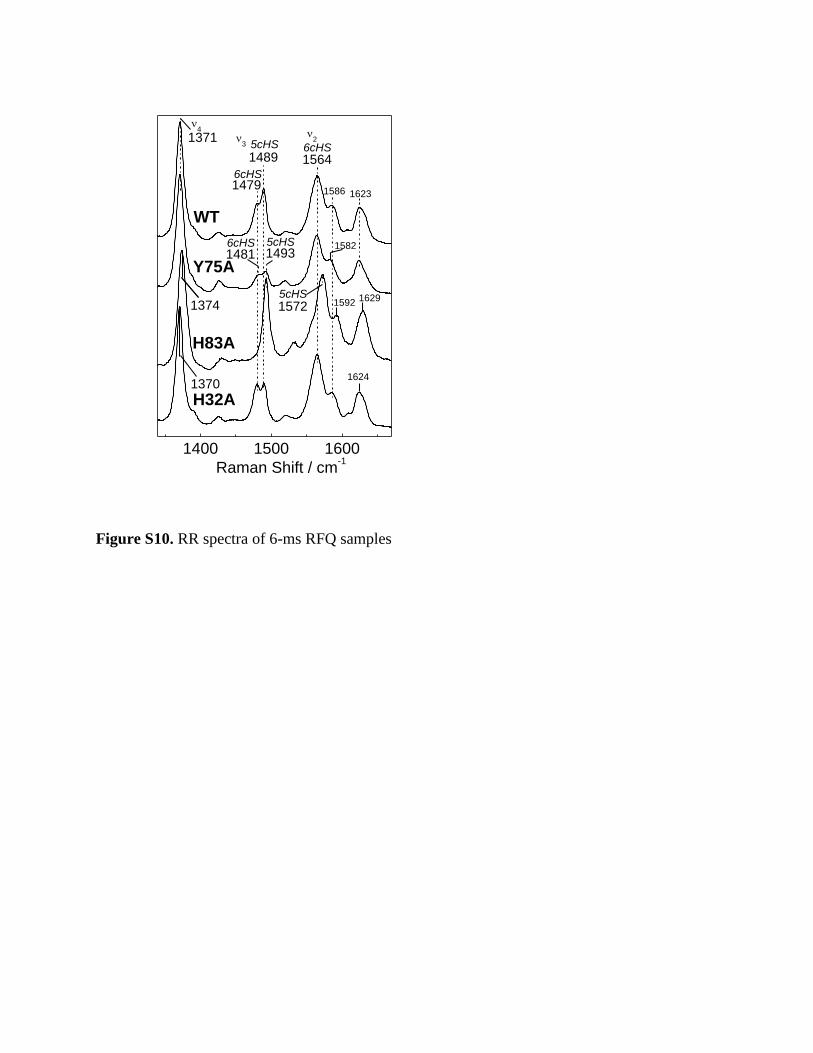
Figure S10. RR spectra of 6-ms RFQ samples
1400 1500 1600
1582
1592
16231586
6cHS
5cHS
1479
1489
1370
WT
H32A
H83A
6cHS
2
3
1624
1564
Raman Shift / cm-1
4
6cHS
5cHS14931481
1371
1374
Y75A
5cHS1572
1629
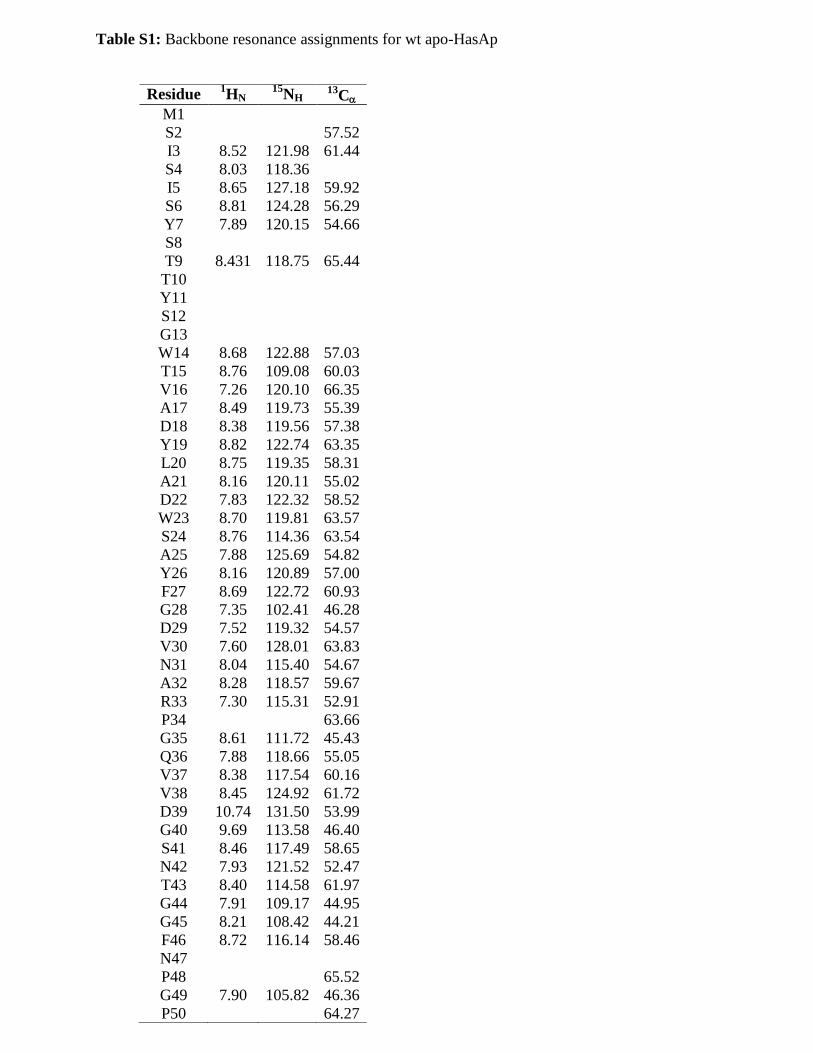
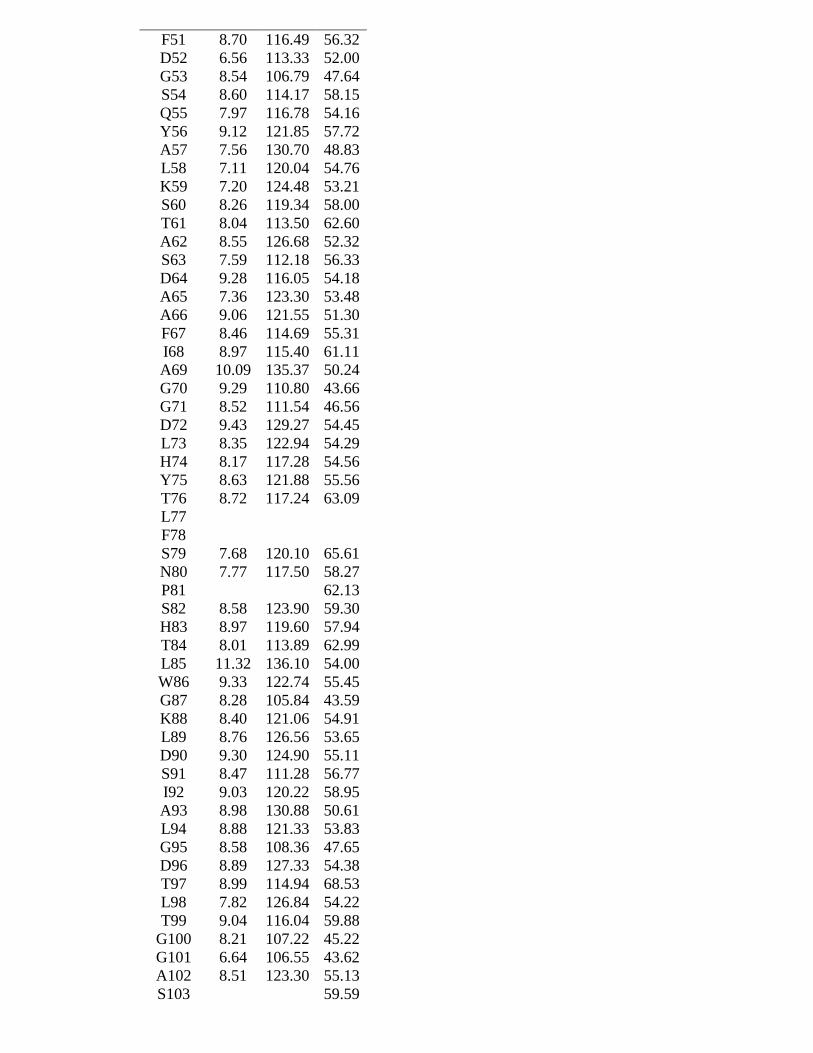
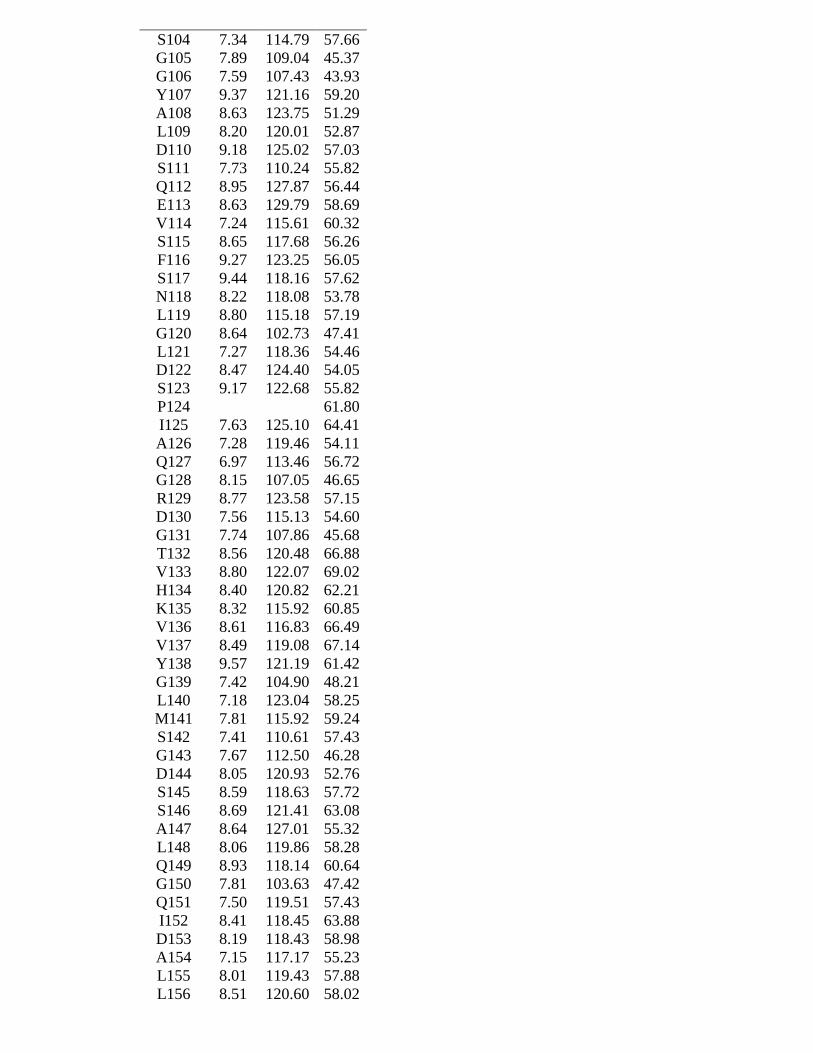
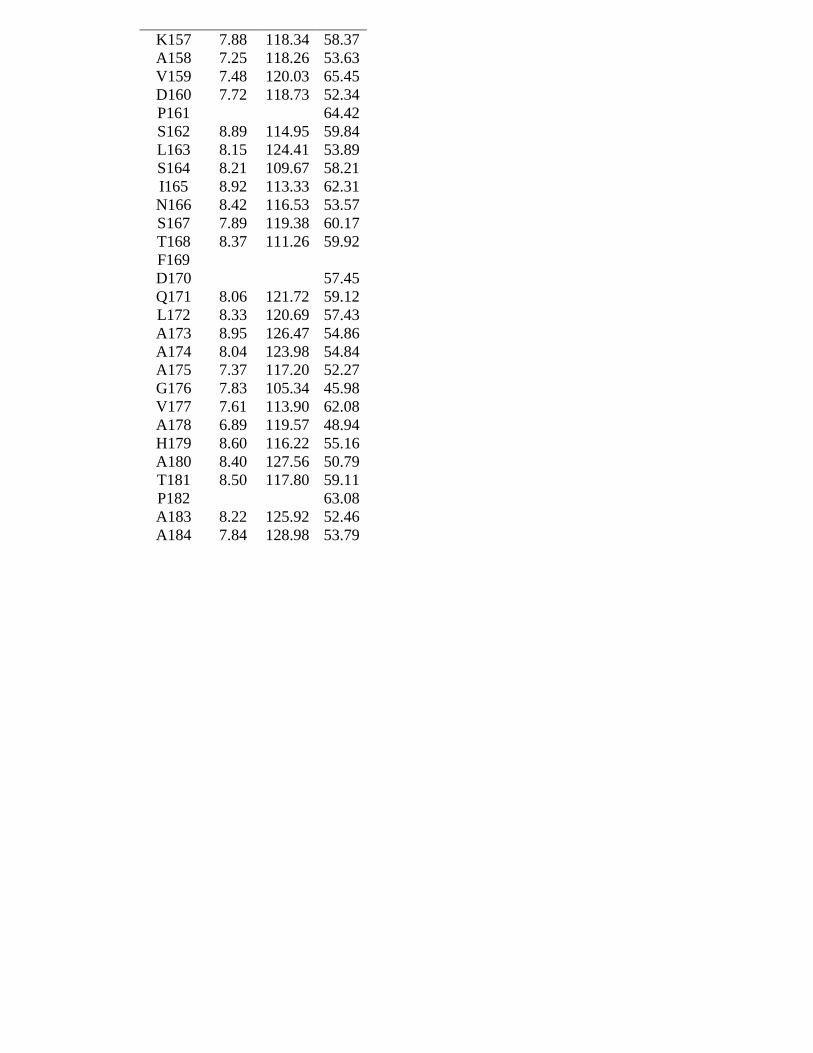
Table S1: Backbone resonance assignments for wt apo-HasAp
Residue 1HN
15NH 13
C
M1
S2 57.52
I3 8.52 121.98 61.44
S4 8.03 118.36
I5 8.65 127.18 59.92
S6 8.81 124.28 56.29
Y7 7.89 120.15 54.66
S8
T9 8.431 118.75 65.44
T10
Y11
S12
G13
W14 8.68 122.88 57.03
T15 8.76 109.08 60.03
V16 7.26 120.10 66.35
A17 8.49 119.73 55.39
D18 8.38 119.56 57.38
Y19 8.82 122.74 63.35
L20 8.75 119.35 58.31
A21 8.16 120.11 55.02
D22 7.83 122.32 58.52
W23 8.70 119.81 63.57
S24 8.76 114.36 63.54
A25 7.88 125.69 54.82
Y26 8.16 120.89 57.00
F27 8.69 122.72 60.93
G28 7.35 102.41 46.28
D29 7.52 119.32 54.57
V30 7.60 128.01 63.83
N31 8.04 115.40 54.67
A32 8.28 118.57 59.67
R33 7.30 115.31 52.91
P34 63.66
G35 8.61 111.72 45.43
Q36 7.88 118.66 55.05
V37 8.38 117.54 60.16
V38 8.45 124.92 61.72
D39 10.74 131.50 53.99
G40 9.69 113.58 46.40
S41 8.46 117.49 58.65
N42 7.93 121.52 52.47
T43 8.40 114.58 61.97
G44 7.91 109.17 44.95
G45 8.21 108.42 44.21
F46 8.72 116.14 58.46
N47
P48 65.52
G49 7.90 105.82 46.36
P50 64.27
F51 8.70 116.49 56.32
D52 6.56 113.33 52.00
G53 8.54 106.79 47.64
S54 8.60 114.17 58.15
Q55 7.97 116.78 54.16
Y56 9.12 121.85 57.72
A57 7.56 130.70 48.83
L58 7.11 120.04 54.76
K59 7.20 124.48 53.21
S60 8.26 119.34 58.00
T61 8.04 113.50 62.60
A62 8.55 126.68 52.32
S63 7.59 112.18 56.33
D64 9.28 116.05 54.18
A65 7.36 123.30 53.48
A66 9.06 121.55 51.30
F67 8.46 114.69 55.31
I68 8.97 115.40 61.11
A69 10.09 135.37 50.24
G70 9.29 110.80 43.66
G71 8.52 111.54 46.56
D72 9.43 129.27 54.45
L73 8.35 122.94 54.29
H74 8.17 117.28 54.56
Y75 8.63 121.88 55.56
T76 8.72 117.24 63.09
L77
F78
S79 7.68 120.10 65.61
N80 7.77 117.50 58.27
P81 62.13
S82 8.58 123.90 59.30
H83 8.97 119.60 57.94
T84 8.01 113.89 62.99
L85 11.32 136.10 54.00
W86 9.33 122.74 55.45
G87 8.28 105.84 43.59
K88 8.40 121.06 54.91
L89 8.76 126.56 53.65
D90 9.30 124.90 55.11
S91 8.47 111.28 56.77
I92 9.03 120.22 58.95
A93 8.98 130.88 50.61
L94 8.88 121.33 53.83
G95 8.58 108.36 47.65
D96 8.89 127.33 54.38
T97 8.99 114.94 68.53
L98 7.82 126.84 54.22
T99 9.04 116.04 59.88
G100 8.21 107.22 45.22
G101 6.64 106.55 43.62
A102 8.51 123.30 55.13
S103 59.59
S104 7.34 114.79 57.66
G105 7.89 109.04 45.37
G106 7.59 107.43 43.93
Y107 9.37 121.16 59.20
A108 8.63 123.75 51.29
L109 8.20 120.01 52.87
D110 9.18 125.02 57.03
S111 7.73 110.24 55.82
Q112 8.95 127.87 56.44
E113 8.63 129.79 58.69
V114 7.24 115.61 60.32
S115 8.65 117.68 56.26
F116 9.27 123.25 56.05
S117 9.44 118.16 57.62
N118 8.22 118.08 53.78
L119 8.80 115.18 57.19
G120 8.64 102.73 47.41
L121 7.27 118.36 54.46
D122 8.47 124.40 54.05
S123 9.17 122.68 55.82
P124 61.80
I125 7.63 125.10 64.41
A126 7.28 119.46 54.11
Q127 6.97 113.46 56.72
G128 8.15 107.05 46.65
R129 8.77 123.58 57.15
D130 7.56 115.13 54.60
G131 7.74 107.86 45.68
T132 8.56 120.48 66.88
V133 8.80 122.07 69.02
H134 8.40 120.82 62.21
K135 8.32 115.92 60.85
V136 8.61 116.83 66.49
V137 8.49 119.08 67.14
Y138 9.57 121.19 61.42
G139 7.42 104.90 48.21
L140 7.18 123.04 58.25
M141 7.81 115.92 59.24
S142 7.41 110.61 57.43
G143 7.67 112.50 46.28
D144 8.05 120.93 52.76
S145 8.59 118.63 57.72
S146 8.69 121.41 63.08
A147 8.64 127.01 55.32
L148 8.06 119.86 58.28
Q149 8.93 118.14 60.64
G150 7.81 103.63 47.42
Q151 7.50 119.51 57.43
I152 8.41 118.45 63.88
D153 8.19 118.43 58.98
A154 7.15 117.17 55.23
L155 8.01 119.43 57.88
L156 8.51 120.60 58.02
K157 7.88 118.34 58.37
A158 7.25 118.26 53.63
V159 7.48 120.03 65.45
D160 7.72 118.73 52.34
P161 64.42
S162 8.89 114.95 59.84
L163 8.15 124.41 53.89
S164 8.21 109.67 58.21
I165 8.92 113.33 62.31
N166 8.42 116.53 53.57
S167 7.89 119.38 60.17
T168 8.37 111.26 59.92
F169
D170 57.45
Q171 8.06 121.72 59.12
L172 8.33 120.69 57.43
A173 8.95 126.47 54.86
A174 8.04 123.98 54.84
A175 7.37 117.20 52.27
G176 7.83 105.34 45.98
V177 7.61 113.90 62.08
A178 6.89 119.57 48.94
H179 8.60 116.22 55.16
A180 8.40 127.56 50.79
T181 8.50 117.80 59.11
P182 63.08
A183 8.22 125.92 52.46
A184 7.84 128.98 53.79
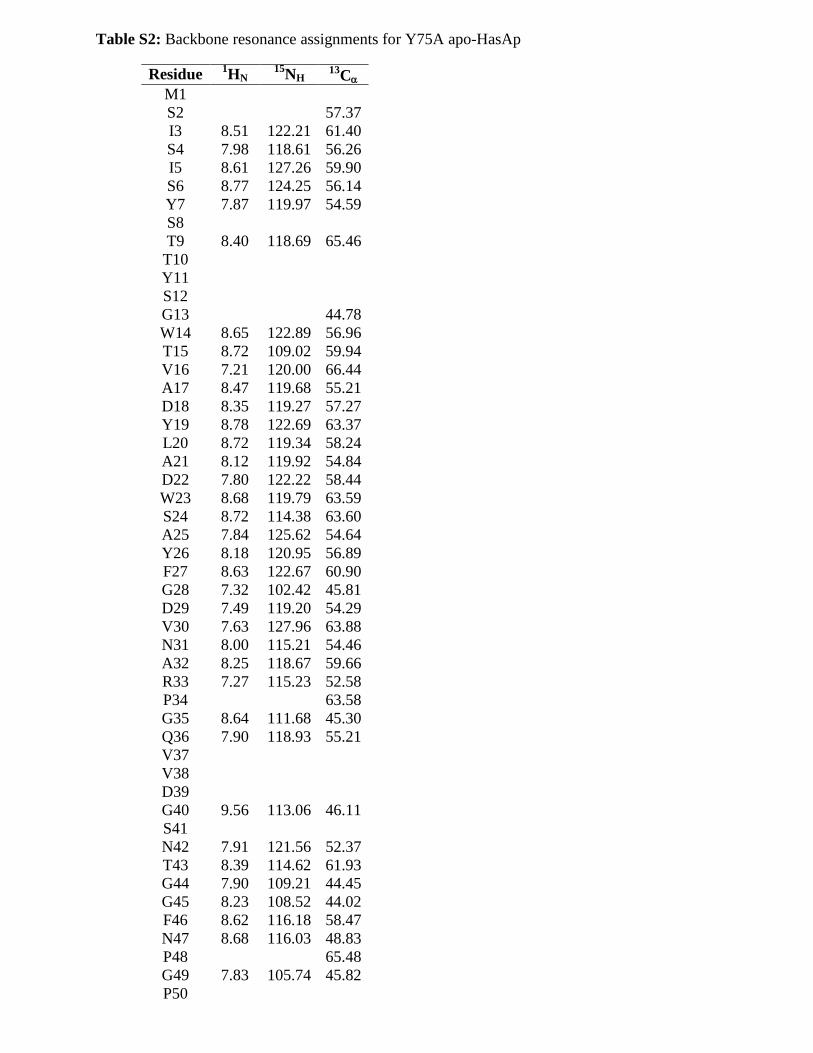
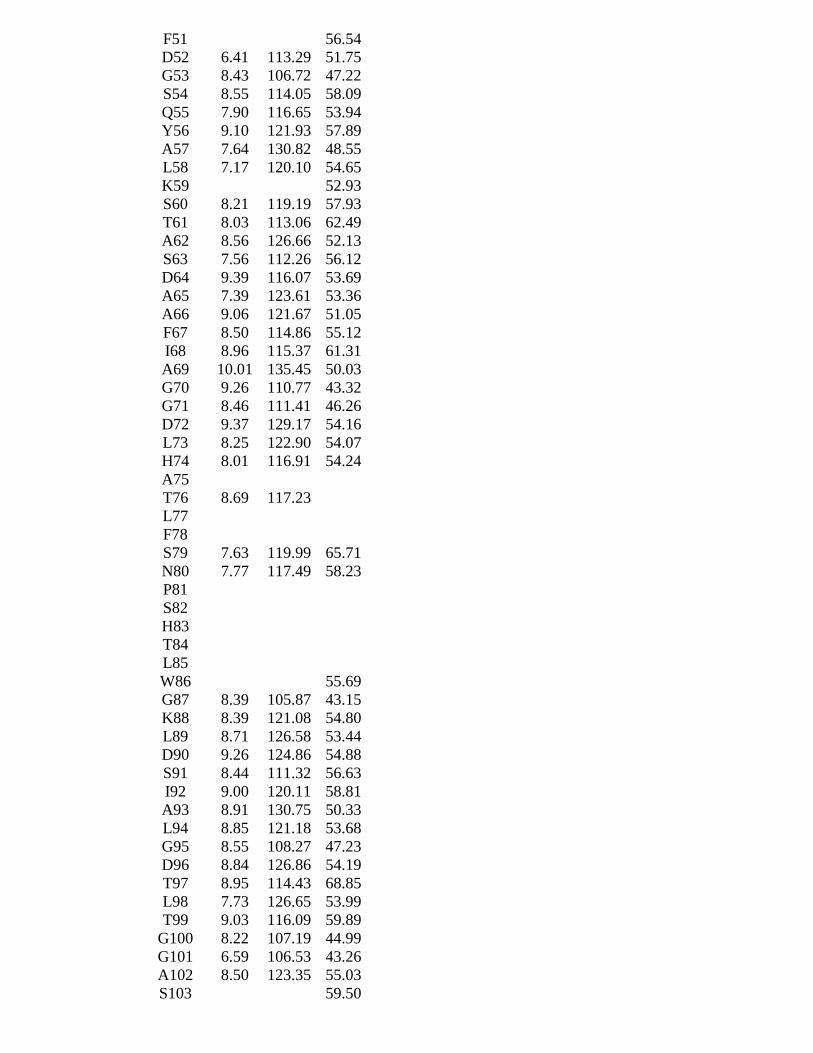
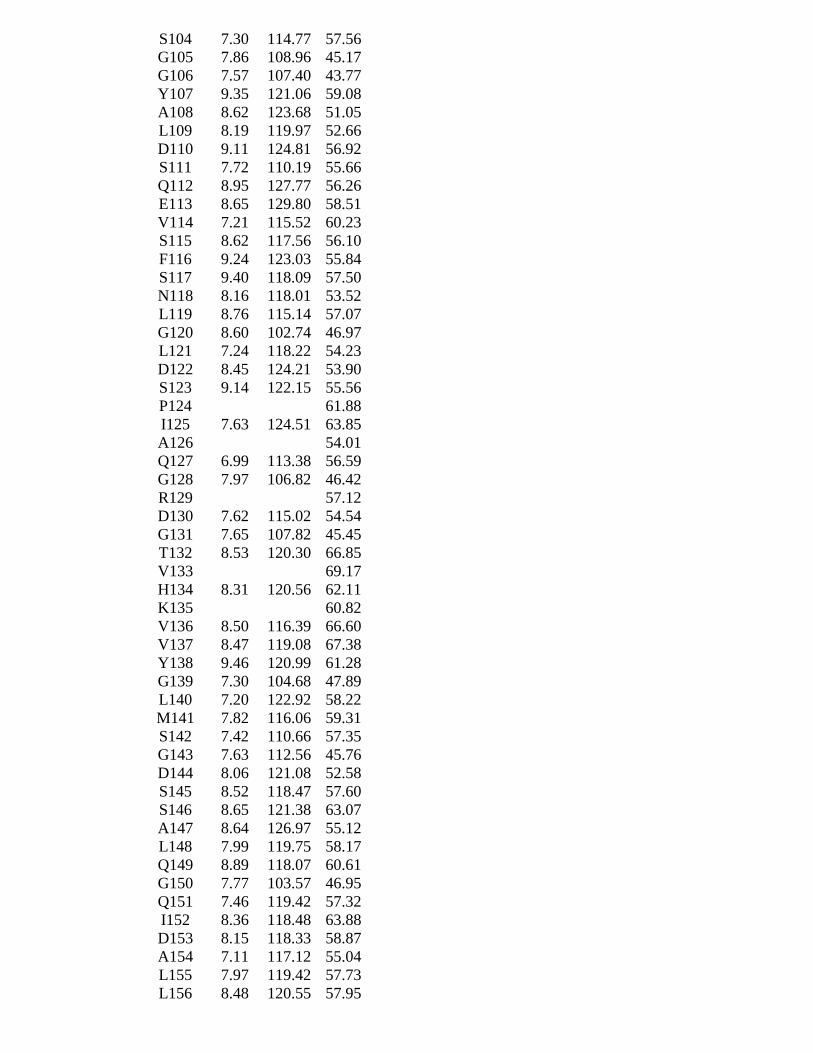
Table S2: Backbone resonance assignments for Y75A apo-HasAp
Residue 1HN
15NH 13
C
M1
S2 57.37
I3 8.51 122.21 61.40
S4 7.98 118.61 56.26
I5 8.61 127.26 59.90
S6 8.77 124.25 56.14
Y7 7.87 119.97 54.59
S8
T9 8.40 118.69 65.46
T10
Y11
S12
G13 44.78
W14 8.65 122.89 56.96
T15 8.72 109.02 59.94
V16 7.21 120.00 66.44
A17 8.47 119.68 55.21
D18 8.35 119.27 57.27
Y19 8.78 122.69 63.37
L20 8.72 119.34 58.24
A21 8.12 119.92 54.84
D22 7.80 122.22 58.44
W23 8.68 119.79 63.59
S24 8.72 114.38 63.60
A25 7.84 125.62 54.64
Y26 8.18 120.95 56.89
F27 8.63 122.67 60.90
G28 7.32 102.42 45.81
D29 7.49 119.20 54.29
V30 7.63 127.96 63.88
N31 8.00 115.21 54.46
A32 8.25 118.67 59.66
R33 7.27 115.23 52.58
P34 63.58
G35 8.64 111.68 45.30
Q36 7.90 118.93 55.21
V37
V38
D39
G40 9.56 113.06 46.11
S41
N42 7.91 121.56 52.37
T43 8.39 114.62 61.93
G44 7.90 109.21 44.45
G45 8.23 108.52 44.02
F46 8.62 116.18 58.47
N47 8.68 116.03 48.83
P48 65.48
G49 7.83 105.74 45.82
P50
F51 56.54
D52 6.41 113.29 51.75
G53 8.43 106.72 47.22
S54 8.55 114.05 58.09
Q55 7.90 116.65 53.94
Y56 9.10 121.93 57.89
A57 7.64 130.82 48.55
L58 7.17 120.10 54.65
K59 52.93
S60 8.21 119.19 57.93
T61 8.03 113.06 62.49
A62 8.56 126.66 52.13
S63 7.56 112.26 56.12
D64 9.39 116.07 53.69
A65 7.39 123.61 53.36
A66 9.06 121.67 51.05
F67 8.50 114.86 55.12
I68 8.96 115.37 61.31
A69 10.01 135.45 50.03
G70 9.26 110.77 43.32
G71 8.46 111.41 46.26
D72 9.37 129.17 54.16
L73 8.25 122.90 54.07
H74 8.01 116.91 54.24
A75
T76 8.69 117.23
L77
F78
S79 7.63 119.99 65.71
N80 7.77 117.49 58.23
P81
S82
H83
T84
L85
W86 55.69
G87 8.39 105.87 43.15
K88 8.39 121.08 54.80
L89 8.71 126.58 53.44
D90 9.26 124.86 54.88
S91 8.44 111.32 56.63
I92 9.00 120.11 58.81
A93 8.91 130.75 50.33
L94 8.85 121.18 53.68
G95 8.55 108.27 47.23
D96 8.84 126.86 54.19
T97 8.95 114.43 68.85
L98 7.73 126.65 53.99
T99 9.03 116.09 59.89
G100 8.22 107.19 44.99
G101 6.59 106.53 43.26
A102 8.50 123.35 55.03
S103 59.50
S104 7.30 114.77 57.56
G105 7.86 108.96 45.17
G106 7.57 107.40 43.77
Y107 9.35 121.06 59.08
A108 8.62 123.68 51.05
L109 8.19 119.97 52.66
D110 9.11 124.81 56.92
S111 7.72 110.19 55.66
Q112 8.95 127.77 56.26
E113 8.65 129.80 58.51
V114 7.21 115.52 60.23
S115 8.62 117.56 56.10
F116 9.24 123.03 55.84
S117 9.40 118.09 57.50
N118 8.16 118.01 53.52
L119 8.76 115.14 57.07
G120 8.60 102.74 46.97
L121 7.24 118.22 54.23
D122 8.45 124.21 53.90
S123 9.14 122.15 55.56
P124 61.88
I125 7.63 124.51 63.85
A126 54.01
Q127 6.99 113.38 56.59
G128 7.97 106.82 46.42
R129 57.12
D130 7.62 115.02 54.54
G131 7.65 107.82 45.45
T132 8.53 120.30 66.85
V133 69.17
H134 8.31 120.56 62.11
K135 60.82
V136 8.50 116.39 66.60
V137 8.47 119.08 67.38
Y138 9.46 120.99 61.28
G139 7.30 104.68 47.89
L140 7.20 122.92 58.22
M141 7.82 116.06 59.31
S142 7.42 110.66 57.35
G143 7.63 112.56 45.76
D144 8.06 121.08 52.58
S145 8.52 118.47 57.60
S146 8.65 121.38 63.07
A147 8.64 126.97 55.12
L148 7.99 119.75 58.17
Q149 8.89 118.07 60.61
G150 7.77 103.57 46.95
Q151 7.46 119.42 57.32
I152 8.36 118.48 63.88
D153 8.15 118.33 58.87
A154 7.11 117.12 55.04
L155 7.97 119.42 57.73
L156 8.48 120.55 57.95
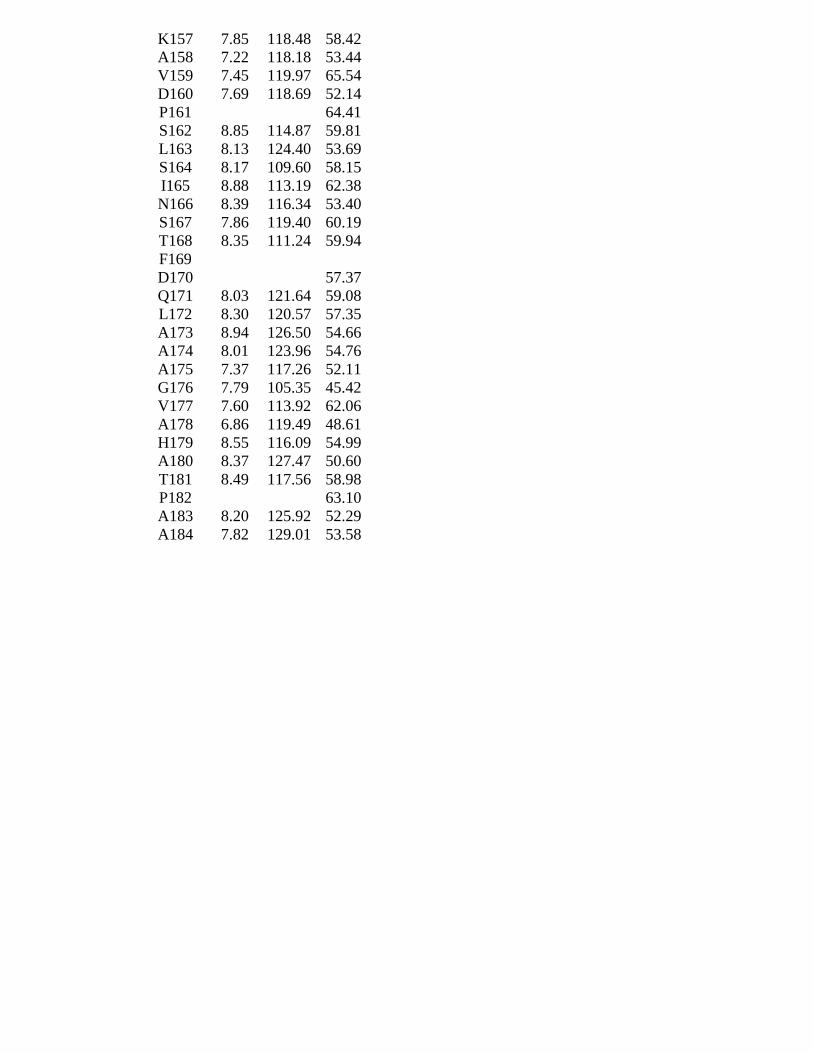
K157 7.85 118.48 58.42
A158 7.22 118.18 53.44
V159 7.45 119.97 65.54
D160 7.69 118.69 52.14
P161 64.41
S162 8.85 114.87 59.81
L163 8.13 124.40 53.69
S164 8.17 109.60 58.15
I165 8.88 113.19 62.38
N166 8.39 116.34 53.40
S167 7.86 119.40 60.19
T168 8.35 111.24 59.94
F169
D170 57.37
Q171 8.03 121.64 59.08
L172 8.30 120.57 57.35
A173 8.94 126.50 54.66
A174 8.01 123.96 54.76
A175 7.37 117.26 52.11
G176 7.79 105.35 45.42
V177 7.60 113.92 62.06
A178 6.86 119.49 48.61
H179 8.55 116.09 54.99
A180 8.37 127.47 50.60
T181 8.49 117.56 58.98
P182 63.10
A183 8.20 125.92 52.29
A184 7.82 129.01 53.58
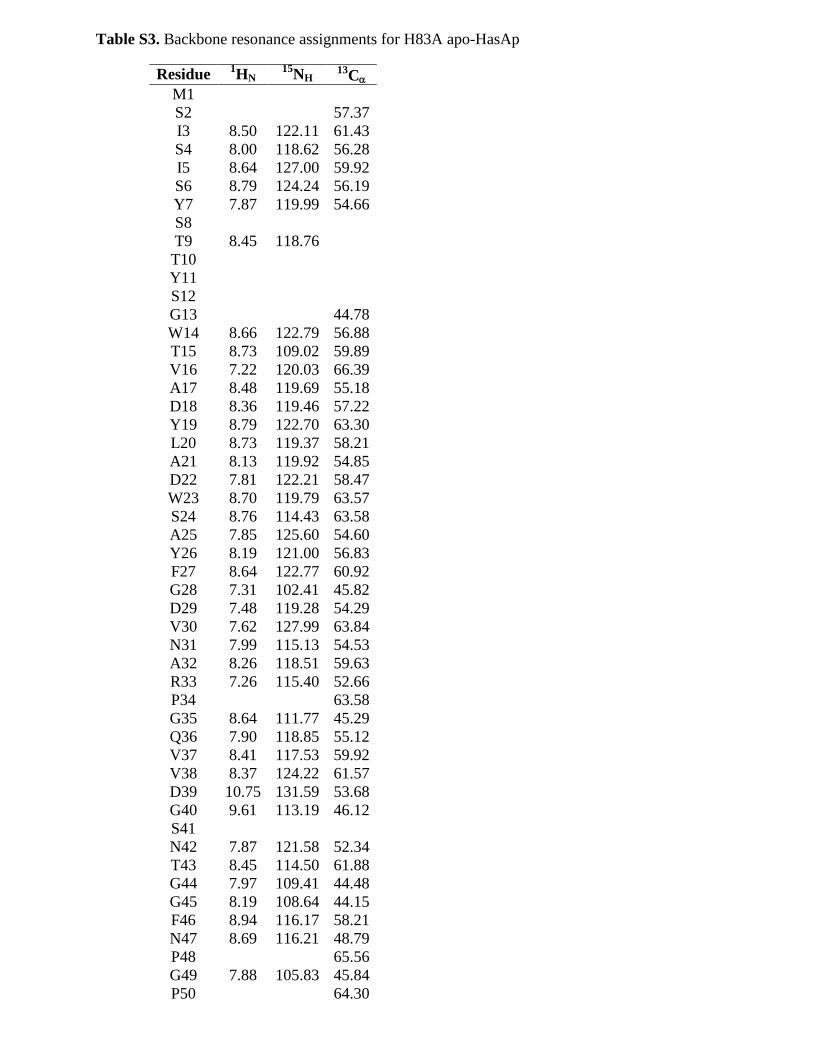
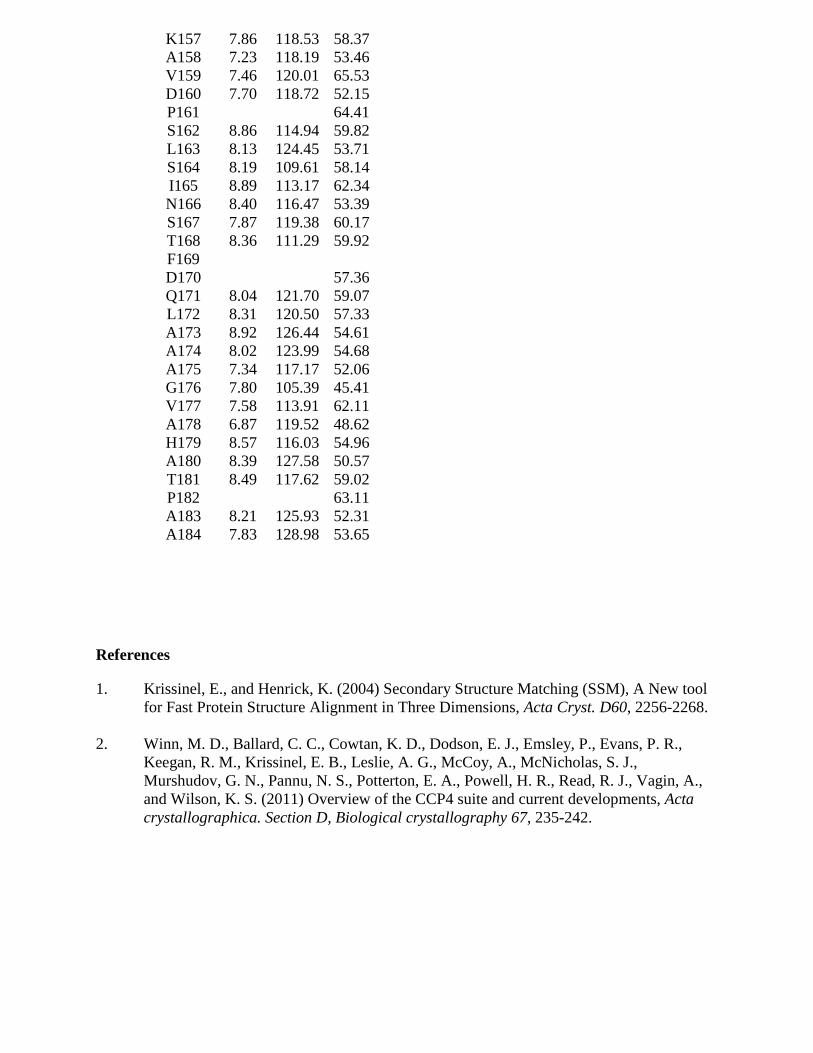
Table S3. Backbone resonance assignments for H83A apo-HasAp
Residue 1HN
15NH 13
C
M1
S2 57.37
I3 8.50 122.11 61.43
S4 8.00 118.62 56.28
I5 8.64 127.00 59.92
S6 8.79 124.24 56.19
Y7 7.87 119.99 54.66
S8
T9 8.45 118.76
T10
Y11
S12
G13 44.78
W14 8.66 122.79 56.88
T15 8.73 109.02 59.89
V16 7.22 120.03 66.39
A17 8.48 119.69 55.18
D18 8.36 119.46 57.22
Y19 8.79 122.70 63.30
L20 8.73 119.37 58.21
A21 8.13 119.92 54.85
D22 7.81 122.21 58.47
W23 8.70 119.79 63.57
S24 8.76 114.43 63.58
A25 7.85 125.60 54.60
Y26 8.19 121.00 56.83
F27 8.64 122.77 60.92
G28 7.31 102.41 45.82
D29 7.48 119.28 54.29
V30 7.62 127.99 63.84
N31 7.99 115.13 54.53
A32 8.26 118.51 59.63
R33 7.26 115.40 52.66
P34 63.58
G35 8.64 111.77 45.29
Q36 7.90 118.85 55.12
V37 8.41 117.53 59.92
V38 8.37 124.22 61.57
D39 10.75 131.59 53.68
G40 9.61 113.19 46.12
S41
N42 7.87 121.58 52.34
T43 8.45 114.50 61.88
G44 7.97 109.41 44.48
G45 8.19 108.64 44.15
F46 8.94 116.17 58.21
N47 8.69 116.21 48.79
P48 65.56
G49 7.88 105.83 45.84
P50 64.30
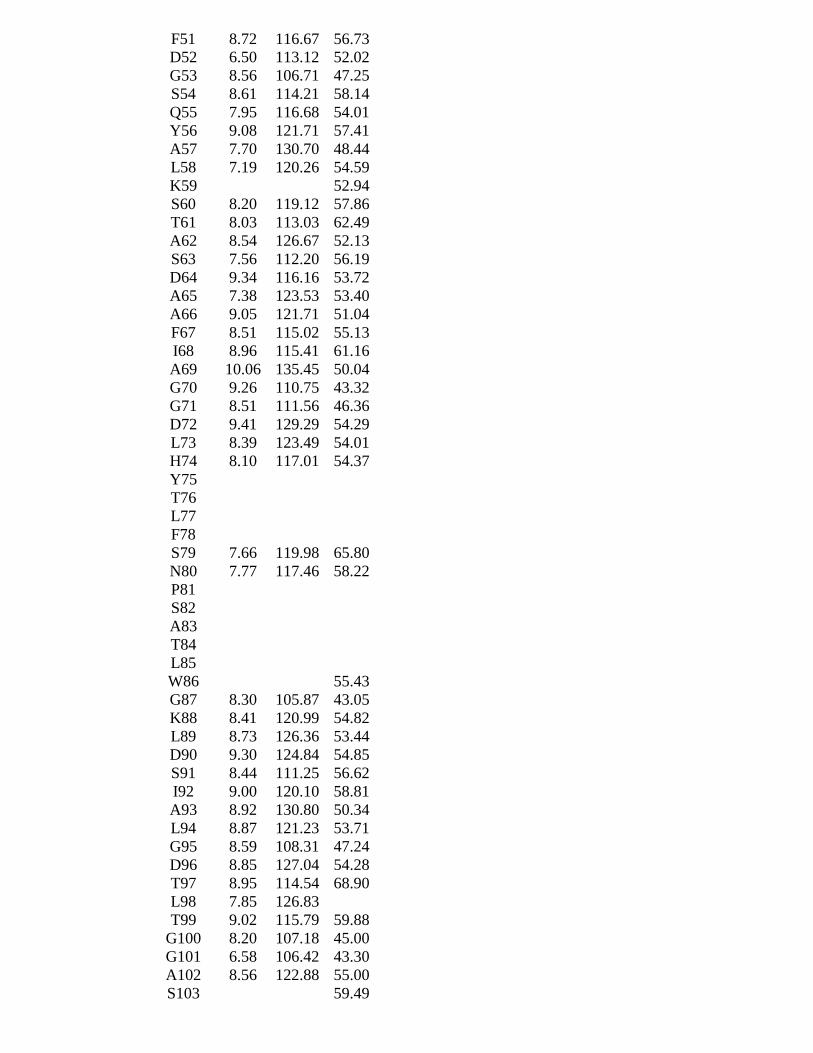
F51 8.72 116.67 56.73
D52 6.50 113.12 52.02
G53 8.56 106.71 47.25
S54 8.61 114.21 58.14
Q55 7.95 116.68 54.01
Y56 9.08 121.71 57.41
A57 7.70 130.70 48.44
L58 7.19 120.26 54.59
K59 52.94
S60 8.20 119.12 57.86
T61 8.03 113.03 62.49
A62 8.54 126.67 52.13
S63 7.56 112.20 56.19
D64 9.34 116.16 53.72
A65 7.38 123.53 53.40
A66 9.05 121.71 51.04
F67 8.51 115.02 55.13
I68 8.96 115.41 61.16
A69 10.06 135.45 50.04
G70 9.26 110.75 43.32
G71 8.51 111.56 46.36
D72 9.41 129.29 54.29
L73 8.39 123.49 54.01
H74 8.10 117.01 54.37
Y75
T76
L77
F78
S79 7.66 119.98 65.80
N80 7.77 117.46 58.22
P81
S82
A83
T84
L85
W86 55.43
G87 8.30 105.87 43.05
K88 8.41 120.99 54.82
L89 8.73 126.36 53.44
D90 9.30 124.84 54.85
S91 8.44 111.25 56.62
I92 9.00 120.10 58.81
A93 8.92 130.80 50.34
L94 8.87 121.23 53.71
G95 8.59 108.31 47.24
D96 8.85 127.04 54.28
T97 8.95 114.54 68.90
L98 7.85 126.83
T99 9.02 115.79 59.88
G100 8.20 107.18 45.00
G101 6.58 106.42 43.30
A102 8.56 122.88 55.00
S103 59.49
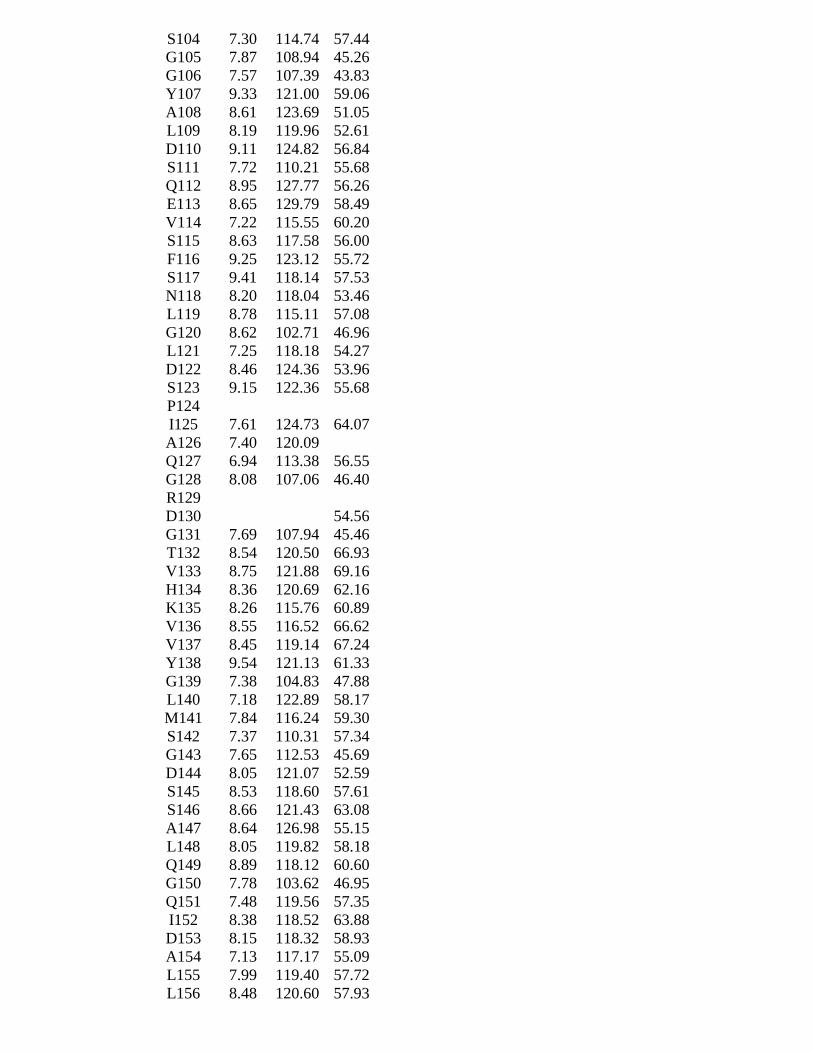
S104 7.30 114.74 57.44
G105 7.87 108.94 45.26
G106 7.57 107.39 43.83
Y107 9.33 121.00 59.06
A108 8.61 123.69 51.05
L109 8.19 119.96 52.61
D110 9.11 124.82 56.84
S111 7.72 110.21 55.68
Q112 8.95 127.77 56.26
E113 8.65 129.79 58.49
V114 7.22 115.55 60.20
S115 8.63 117.58 56.00
F116 9.25 123.12 55.72
S117 9.41 118.14 57.53
N118 8.20 118.04 53.46
L119 8.78 115.11 57.08
G120 8.62 102.71 46.96
L121 7.25 118.18 54.27
D122 8.46 124.36 53.96
S123 9.15 122.36 55.68
P124
I125 7.61 124.73 64.07
A126 7.40 120.09
Q127 6.94 113.38 56.55
G128 8.08 107.06 46.40
R129
D130 54.56
G131 7.69 107.94 45.46
T132 8.54 120.50 66.93
V133 8.75 121.88 69.16
H134 8.36 120.69 62.16
K135 8.26 115.76 60.89
V136 8.55 116.52 66.62
V137 8.45 119.14 67.24
Y138 9.54 121.13 61.33
G139 7.38 104.83 47.88
L140 7.18 122.89 58.17
M141 7.84 116.24 59.30
S142 7.37 110.31 57.34
G143 7.65 112.53 45.69
D144 8.05 121.07 52.59
S145 8.53 118.60 57.61
S146 8.66 121.43 63.08
A147 8.64 126.98 55.15
L148 8.05 119.82 58.18
Q149 8.89 118.12 60.60
G150 7.78 103.62 46.95
Q151 7.48 119.56 57.35
I152 8.38 118.52 63.88
D153 8.15 118.32 58.93
A154 7.13 117.17 55.09
L155 7.99 119.40 57.72
L156 8.48 120.60 57.93
K157 7.86 118.53 58.37
A158 7.23 118.19 53.46
V159 7.46 120.01 65.53
D160 7.70 118.72 52.15
P161 64.41
S162 8.86 114.94 59.82
L163 8.13 124.45 53.71
S164 8.19 109.61 58.14
I165 8.89 113.17 62.34
N166 8.40 116.47 53.39
S167 7.87 119.38 60.17
T168 8.36 111.29 59.92
F169
D170 57.36
Q171 8.04 121.70 59.07
L172 8.31 120.50 57.33
A173 8.92 126.44 54.61
A174 8.02 123.99 54.68
A175 7.34 117.17 52.06
G176 7.80 105.39 45.41
V177 7.58 113.91 62.11
A178 6.87 119.52 48.62
H179 8.57 116.03 54.96
A180 8.39 127.58 50.57
T181 8.49 117.62 59.02
P182 63.11
A183 8.21 125.93 52.31
A184 7.83 128.98 53.65
References
1. Krissinel, E., and Henrick, K. (2004) Secondary Structure Matching (SSM), A New tool
for Fast Protein Structure Alignment in Three Dimensions, Acta Cryst. D60, 2256-2268.
2. Winn, M. D., Ballard, C. C., Cowtan, K. D., Dodson, E. J., Emsley, P., Evans, P. R.,
Keegan, R. M., Krissinel, E. B., Leslie, A. G., McCoy, A., McNicholas, S. J.,
Murshudov, G. N., Pannu, N. S., Potterton, E. A., Powell, H. R., Read, R. J., Vagin, A.,
and Wilson, K. S. (2011) Overview of the CCP4 suite and current developments, Acta
crystallographica. Section D, Biological crystallography 67, 235-242.