Embed Size (px)
Citation preview


Report on Budgetary and Financial Management
Financial Year 2014

TABLE OF CONTENTS
Introduction…………………………………………………………………………………………1
PART A- Overview: Budget 2014…………………………………………………………………...5
A.1 Establishing the Initial Budget…………………………………………………………………..7
A.2 Carryover from 2013…………………………………………………………………………….9
A.3 Amending Budgets 2014……………………………………………………………………….12
A.4 Transfers 2014………………………………………………………………………………….13
A.5 2014 Implementation Overview………………………………………………………………..15
A.6 RAL-Situation………………………………………………………………………………….23
PART B- Overview: Budget 2014 by Heading……………………………………………………..27
B.1 Heading 1a: Competitiveness for Growth and Jobs…………………………………………….29
B.2 Heading 1b: Economic, social and territorial Cohesion………………………………………..40
B.3 Heading 2: Sustainable growth: Natural Resources…………………………………………….49
B.4: Heading 3: Security and Citizenship…………………………………………………………..55
B.5: Heading 4: Global Europe……………………………………………………………………..65
B.6: Heading 5: Administration……………………………………………………………………..77
B.7: Heading 6: Compensations……………………………………………………………………..94
B.8: Special instruments……………………………………………………………………………..95
PART C-Own Resources…………………………………………………………………………….97
C.1 Budget Implementation Table………………………………………………………………….99
C.2 Legal Basis……………………………………………………………………………………..100
C.3 The Budgetary Forecast of Own Resources…………………………………………………....100
C.4 The Process of Adopting The Budget…………………………………………………………101
C.5 Budget Forecasts Table 2014 Versus 2013……………………………………………………104
C.6 Own Resources by Member State……………………………………………………………..105
C.7 Implementation of Own Resources……………………………………………………………106
ANNEXES……………………………………………………………………………………….....107
Annex I Summary Information on 2014 Transfers of Appropriations……………………………108
Annex II Consolidated Community Entitlements …………………………………… …………...123

1
INTRODUCTION
Legal basis
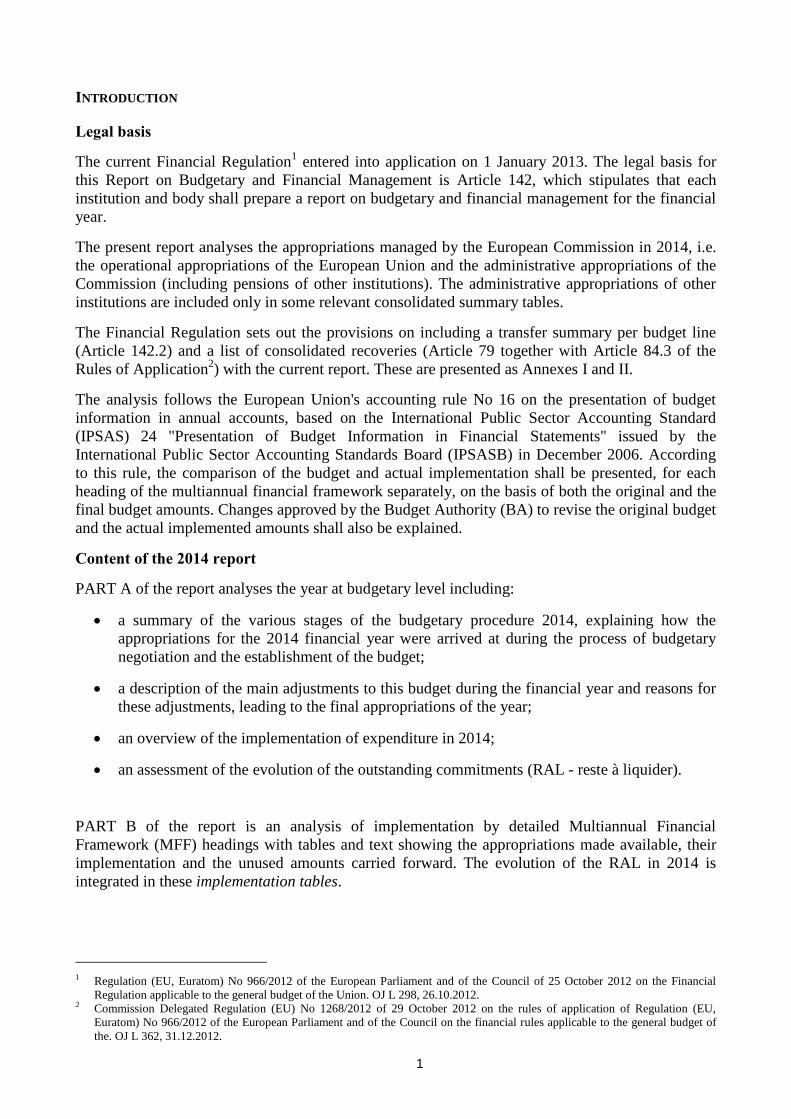
The current Financial Regulation1 entered into application on 1 January 2013. The legal basis for
this Report on Budgetary and Financial Management is Article 142, which stipulates that each
institution and body shall prepare a report on budgetary and financial management for the financial
year.
The present report analyses the appropriations managed by the European Commission in 2014, i.e.
the operational appropriations of the European Union and the administrative appropriations of the
Commission (including pensions of other institutions). The administrative appropriations of other
institutions are included only in some relevant consolidated summary tables.
The Financial Regulation sets out the provisions on including a transfer summary per budget line
(Article 142.2) and a list of consolidated recoveries (Article 79 together with Article 84.3 of the
Rules of Application2) with the current report. These are presented as Annexes I and II.
The analysis follows the European Union's accounting rule No 16 on the presentation of budget
information in annual accounts, based on the International Public Sector Accounting Standard
(IPSAS) 24 "Presentation of Budget Information in Financial Statements" issued by the
International Public Sector Accounting Standards Board (IPSASB) in December 2006. According
to this rule, the comparison of the budget and actual implementation shall be presented, for each
heading of the multiannual financial framework separately, on the basis of both the original and the
final budget amounts. Changes approved by the Budget Authority (BA) to revise the original budget
and the actual implemented amounts shall also be explained.
Content of the 2014 report
PART A of the report analyses the year at budgetary level including:
a summary of the various stages of the budgetary procedure 2014, explaining how the
appropriations for the 2014 financial year were arrived at during the process of budgetary
negotiation and the establishment of the budget;
a description of the main adjustments to this budget during the financial year and reasons for
these adjustments, leading to the final appropriations of the year;
an overview of the implementation of expenditure in 2014;
an assessment of the evolution of the outstanding commitments (RAL - reste à liquider).
PART B of the report is an analysis of implementation by detailed Multiannual Financial
Framework (MFF) headings with tables and text showing the appropriations made available, their
implementation and the unused amounts carried forward. The evolution of the RAL in 2014 is
integrated in these implementation tables.
1 Regulation (EU, Euratom) No 966/2012 of the European Parliament and of the Council of 25 October 2012 on the Financial
Regulation applicable to the general budget of the Union. OJ L 298, 26.10.2012. 2 Commission Delegated Regulation (EU) No 1268/2012 of 29 October 2012 on the rules of application of Regulation (EU,
Euratom) No 966/2012 of the European Parliament and of the Council on the financial rules applicable to the general budget of
the. OJ L 362, 31.12.2012.
2
They are linked to cumulative programme tables showing, for major programmes
the last programme allocation as per Technical update of financial programming 2016 – 2020
following adoption of the 2015 budget (ARES (2015) 3402649) transmitted to Budget
Authority on 28 January 2015. This document incorporates the technical changes that have
occurred since the adoption of the 2015 DB on 24 June 2014, including the allocation 2014
revised with budgetary adjustments made during 2014 and the allocation 2015 as per the
adopted budget;
the implementation of commitments and payments in the first year of the current
programming period;
the volume of outstanding commitments of the current programme, compared to the total
RAL of the detailed MFF heading. However, this percentage does not necessarily indicate
the breakdown of the current and the previous programmes, as some headings comprise
major lines not belonging to a programme and the share of third party appropriations in the
total RAL is significant in some cases.
PART C of the report is an analysis of the own resources.
The report contains three annexes:
Annex I transfer summary;
Annex II consolidated recoveries.
Definitions applied in this report
The implementation tables consist of:
Total appropriations:
- Initial budget: appropriations voted by the Budget Authority (BA) excluding the provisional
appropriations entered in article 40 02 41 Differentiated appropriations in Chapter 40 02
Reserves for financial interventions. With the release of the provisional appropriations in the
course of the budget year, subject to given conditions, the impact of transfers is to increase the
final budget in this report. In this report voted budget refers to initial budget including
provisional appropriations and it is commonly used in the context of the budgetary procedure.
- Amending budgets (AB).
- Budget Authority transfers: transfers submitted to the BA for decision.
- Commission transfers: transfers decided by the Commission on its own authority.
- Carryover from 2013: refers to budgetary appropriations carried forward by decision or
automatically.
- Assigned revenue: In order to harmonise the presentation with the annual accounts of the
European Union, total appropriations include assigned revenue. This column includes the
appropriations of the year and appropriations carried over from previous year.
3
Implementation
- Actual 2014 and Rate: For the purpose of analysing implementation, a distinction between
budget appropriations and assigned revenue is relevant. The nature of the implementation of
assigned revenue is different in the sense that their use may be subject to specific conditions:
normally for assigned revenue, payments are entered in the budget with an amount
corresponding to the commitments, even if it is clear from the outset that payments will be
implemented only in later years; furthermore, appropriations that remain unused at the end of
the year will not be cancelled, but carried forward automatically (with the exception of refunds
carried over).
- Actual 2013: Presented for comparison. The budget nomenclature of 2014 is applied.
- Carryover to 2015: Contrary to the carryover from 2013, this carryover includes assigned
revenue in order to illustrate the actual under-spending. However, the re-programming of
commitments from the first year of the new programming period to subsequent years in
accordance with Article 19 of Council Regulation No 1311/20133 (MFF Regulation) does not
appear in these tables
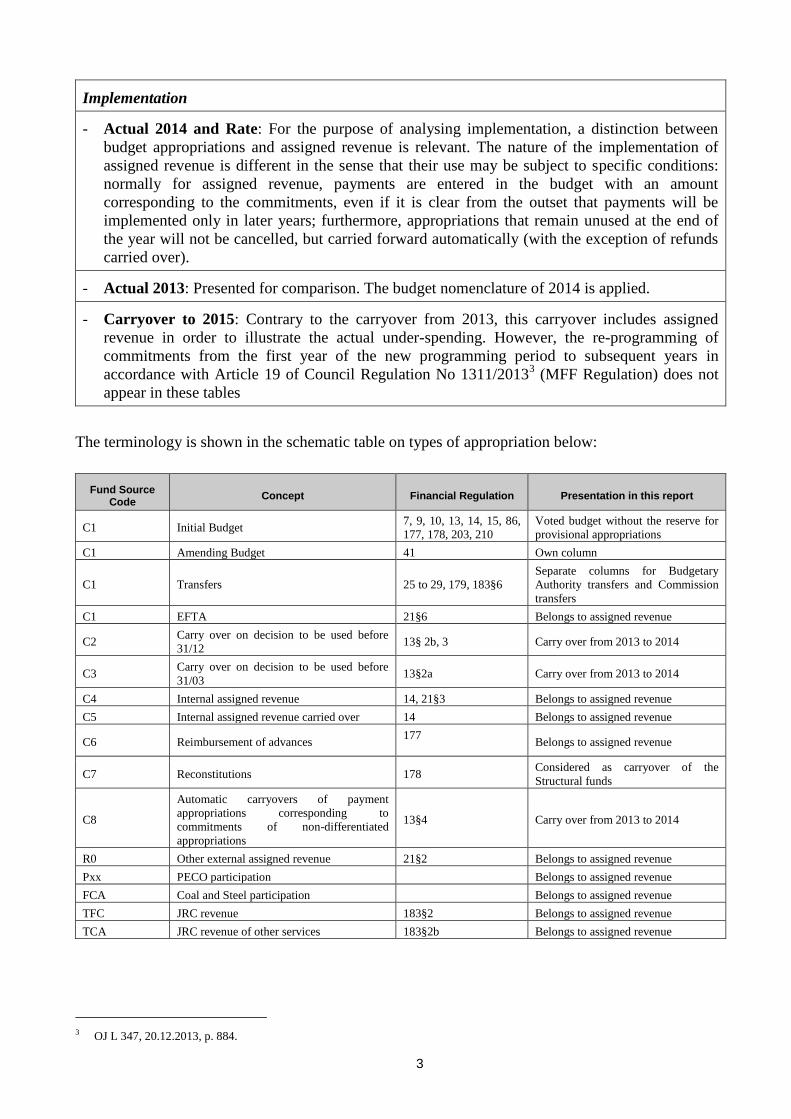
The terminology is shown in the schematic table on types of appropriation below:
Fund Source Code
Concept Financial Regulation Presentation in this report
C1 Initial Budget 7, 9, 10, 13, 14, 15, 86,
177, 178, 203, 210
Voted budget without the reserve for
provisional appropriations
C1 Amending Budget 41 Own column
C1 Transfers 25 to 29, 179, 183§6
Separate columns for Budgetary
Authority transfers and Commission
transfers
C1 EFTA 21§6 Belongs to assigned revenue
C2 Carry over on decision to be used before
31/12 13§ 2b, 3 Carry over from 2013 to 2014
C3 Carry over on decision to be used before
31/03 13§2a Carry over from 2013 to 2014
C4 Internal assigned revenue 14, 21§3 Belongs to assigned revenue
C5 Internal assigned revenue carried over 14 Belongs to assigned revenue
C6 Reimbursement of advances 177
Belongs to assigned revenue
C7 Reconstitutions 178 Considered as carryover of the
Structural funds
C8
Automatic carryovers of payment
appropriations corresponding to
commitments of non-differentiated
appropriations
13§4 Carry over from 2013 to 2014
R0 Other external assigned revenue 21§2 Belongs to assigned revenue
Pxx PECO participation Belongs to assigned revenue
FCA Coal and Steel participation Belongs to assigned revenue
TFC JRC revenue 183§2 Belongs to assigned revenue
TCA JRC revenue of other services 183§2b Belongs to assigned revenue
3 OJ L 347, 20.12.2013, p. 884.
4
Budgetary appropriations are C1 (excluding EFTA) + C2 + C3 + C7 + C8. The first item
covers 2014 appropriations.
Amounts are generally provided in EUR million or EUR billion after rounding. Consequently some
financial data in the tables may appear not to add up.
Date of extraction
The implementation data is the preliminary data serving as a basis for the provisional accounts at
end March 2014.
RAL figures include adjustments (de-commitments, cancellations and re-evaluations) made for the
closure of the accounts after the budget year.
Note: The information contained in this report is without prejudice to the content of the
official Commission documents on the closure of the accounts. Readers should refer in
particular to the final Revenue and Expenditure Account for the official figures on the 2014
budget outturn.
PART A - Overview: Budget 2014

7
A.1 ESTABLISHING THE INITIAL BUDGET
A.1.1 Budgetary Procedure 2014
The Commission adopted the Draft Budget for 2014 on 28 June 2013, taking into account the state
of the negotiations on the 2014-2020 multiannual financial framework (MFF). Commitment
appropriations were set at EUR 142 011 million, 5.8 % lower than the 2013 budget, and equivalent
to 1.05 % of GNI. The level of payment appropriations proposed decreased by 5.8 % as well, to a
total of EUR 135 866 million, or 1.01 % of GNI. The margins remaining under the ceilings of the
multiannual financial framework taken as a reference point for the preparation of the 2014 Draft
Budget were EUR 583 million for commitment appropriations and EUR 0.2 million for payment
appropriations, the latter reflecting the substantial reduction of the payment ceiling which was
assumed to be established for the Draft Budget 2014 as compared to the payment ceiling set for
2013. In addition, the appropriations proposed for special instruments outside the MFF for 2014
amounted to EUR 456 million for commitment appropriations and EUR 200 million for payment
appropriations.
In July 2013, the Council took its position on the Draft Budget 2014. The Council set commitment
appropriations at EUR 141 771 million, a cut of EUR 241 million compared to the Draft Budget
(DB). Payment appropriations were reduced by EUR 1 061 million to EUR 134 805 million, or
1.00 % of GNI. The biggest cuts were made in sub-heading 1a Competitiveness for growth and jobs
(EUR 60 million in commitments and EUR 427 million in payments); sub-heading 1b Economic,
social and territorial cohesion (EUR 3 million in commitments and EUR 202 million in payments):
heading 2 Sustainable growth: natural resources (EUR 1.6 million in commitments and
EUR 113 million in payments): heading 4 Global Europe (EUR 17 million in commitments and
EUR 157 million in payments); and heading 5 Administration (EUR 153 million in commitments
and payments).
Parliament’s amendments on the Draft Budget 2014 were voted in October 2013. Total commitment
appropriations were set at EUR 142 626 million (1.06 % of GNI); EUR 855 million higher than
Council’s position. The level of payments was set at EUR 136 077 million (1.01 % of GNI);
EUR 1 273 million higher than the Council’s position.
During the course of the procedure, the Commission presented two amending letters to the DB. The
Amending Letter No 1/2014 covered:
the frontloading of commitment appropriations for Horizon 2020, Erasmus+ and COSME, as
a result of the political agreement reached at the end of June 2013 on the 2014-2020 MFF;
the additional assistance to Cyprus under the Structural Funds (EUR 100 million), as part of
which the Commission proposed to mobilise the Flexibility Instrument in heading 1b for an
amount of EUR 78 million;
the consequences, in terms of human and financial resources, of the proposed new generation
of Joint Technology Initiatives (JTIs).
Amending Letter No 2/2014 concerned:
a revision of the forecast of Traditional Own Resources (TOR, i.e. customs duties and sugar
sector levies) to be received in 2014, to take account of the trend observed in TOR received
to date in 2013;
8
the usual update of the budget requests for the agricultural sector as well as for the
International Fisheries Agreements;
the consequences, in terms of human and financial resources, of the foreseen delegation of
the management of operational programmes under the new multiannual financial framework
(MFF) to executive agencies;
the integration of the new function group AST/SC in the establishment plans of the EU
institutions and bodies.
The net effect of the amending letters was to increase the initial Commission DB by EUR 95
million in commitments to EUR 142 107 million and to decrease the initial Commission DB by
EUR 5 million to EUR 135 861 million in payments. The Conciliation Committee during its 21-day
period reached an agreement on the 2014 budget through conciliation in November 2013. The final
compromise on the 2014 budget contained the following elements:
Agreement on the overall level of payment appropriations of EUR 135 505 million including
special instruments (1.00 % of GNI), EUR 500 million above the level proposed by the
Council in its position on the Draft Budget;
Agreement on the level of commitment appropriations for headings 1a, 1b, 3 and 4, as well
as for special instruments, with certain reinforcements for political priorities as compared to
the levels proposed by the Commission in the Draft Budget (as modified by amending
letters). As part of the agreement, EUR 89 million was mobilised from the Flexibility
Instrument in heading 1b.
Agreement on a reduction on the level of appropriations for administration (heading 5) by EUR 185
million in commitment appropriations and EUR 186 million in payment appropriations as compared
to the Draft Budget (as modified by amending letters).
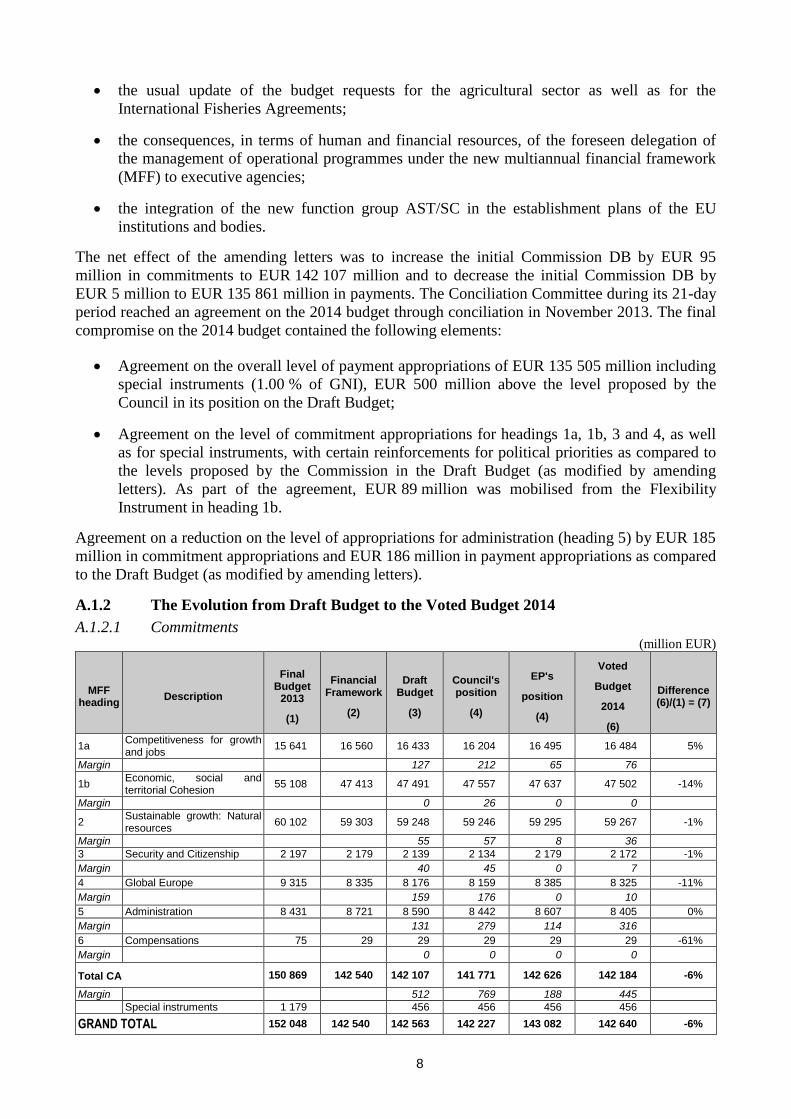
A.1.2 The Evolution from Draft Budget to the Voted Budget 2014
A.1.2.1 Commitments (million EUR)
MFF heading
Description
Final Budget
2013
(1)
Financial Framework
(2)
Draft Budget
(3)
Council's position
(4)
EP's
position
(4)
Voted
Budget
2014
(6)
Difference (6)/(1) = (7)
1a Competitiveness for growth and jobs
15 641 16 560 16 433 16 204 16 495 16 484 5%
Margin 127 212 65 76
1b Economic, social and territorial Cohesion
55 108 47 413 47 491 47 557 47 637 47 502 -14%
Margin 0 26 0 0
2 Sustainable growth: Natural resources
60 102 59 303 59 248 59 246 59 295 59 267 -1%
Margin 55 57 8 36
3 Security and Citizenship 2 197 2 179 2 139 2 134 2 179 2 172 -1%
Margin 40 45 0 7
4 Global Europe 9 315 8 335 8 176 8 159 8 385 8 325 -11%
Margin 159 176 0 10
5 Administration 8 431 8 721 8 590 8 442 8 607 8 405 0%
Margin 131 279 114 316
6 Compensations 75 29 29 29 29 29 -61%
Margin 0 0 0 0
Total CA 150 869 142 540 142 107 141 771 142 626 142 184 -6%
Margin 512 769 188 445
Special instruments 1 179 456 456 456 456
GRAND TOTAL 152 048 142 540 142 563 142 227 143 082 142 640 -6%
9
The voted commitment appropriations represent 1.06 % of GNI.
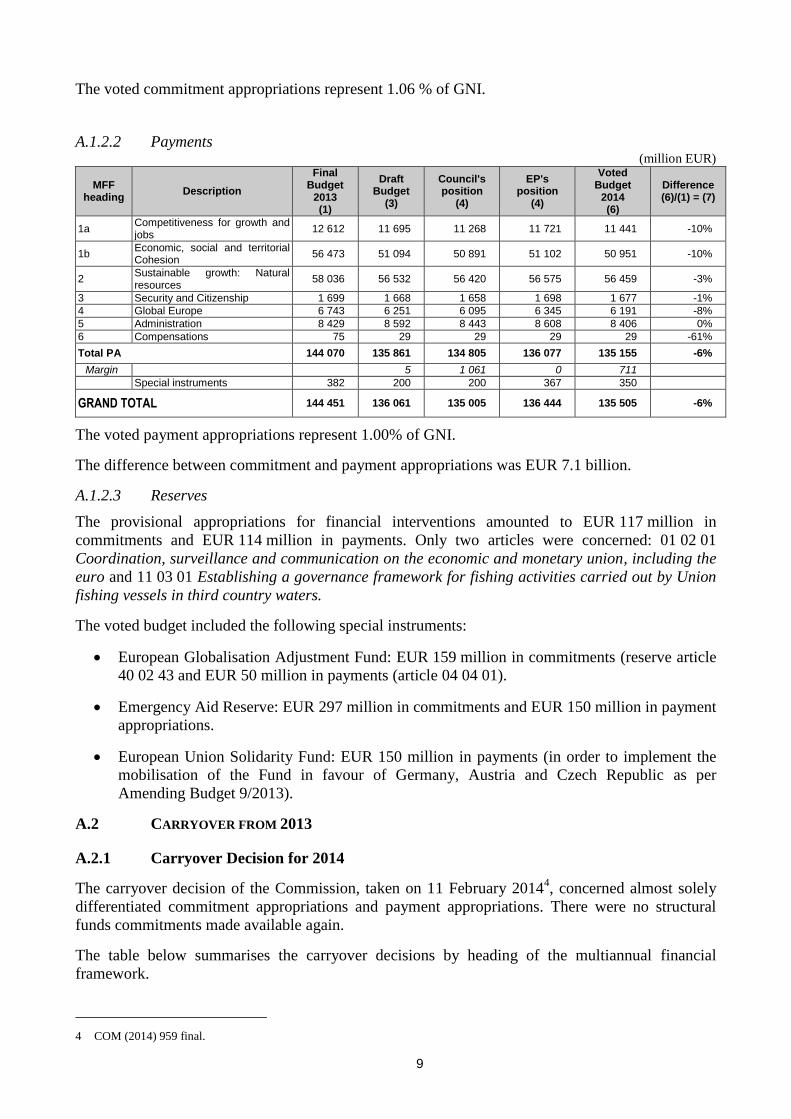
A.1.2.2 Payments (million EUR)
MFF heading
Description
Final Budget
2013 (1)
Draft Budget
(3)
Council's position
(4)
EP's position
(4)
Voted Budget
2014 (6)
Difference (6)/(1) = (7)
1a Competitiveness for growth and jobs
12 612 11 695 11 268 11 721 11 441 -10%
1b Economic, social and territorial Cohesion
56 473 51 094 50 891 51 102 50 951 -10%
2 Sustainable growth: Natural resources
58 036 56 532 56 420 56 575 56 459 -3%
3 Security and Citizenship 1 699 1 668 1 658 1 698 1 677 -1%
4 Global Europe 6 743 6 251 6 095 6 345 6 191 -8%
5 Administration 8 429 8 592 8 443 8 608 8 406 0%
6 Compensations 75 29 29 29 29 -61%
Total PA 144 070 135 861 134 805 136 077 135 155 -6%
Margin 5 1 061 0 711
Special instruments 382 200 200 367 350
GRAND TOTAL 144 451 136 061 135 005 136 444 135 505 -6%
The voted payment appropriations represent 1.00% of GNI.
The difference between commitment and payment appropriations was EUR 7.1 billion.
A.1.2.3 Reserves
The provisional appropriations for financial interventions amounted to EUR 117 million in
commitments and EUR 114 million in payments. Only two articles were concerned: 01 02 01
Coordination, surveillance and communication on the economic and monetary union, including the
euro and 11 03 01 Establishing a governance framework for fishing activities carried out by Union
fishing vessels in third country waters.
The voted budget included the following special instruments:
European Globalisation Adjustment Fund: EUR 159 million in commitments (reserve article
40 02 43 and EUR 50 million in payments (article 04 04 01).
Emergency Aid Reserve: EUR 297 million in commitments and EUR 150 million in payment
appropriations.
European Union Solidarity Fund: EUR 150 million in payments (in order to implement the
mobilisation of the Fund in favour of Germany, Austria and Czech Republic as per
Amending Budget 9/2013).
A.2 CARRYOVER FROM 2013
A.2.1 Carryover Decision for 2014
The carryover decision of the Commission, taken on 11 February 20144, concerned almost solely
differentiated commitment appropriations and payment appropriations. There were no structural
funds commitments made available again.
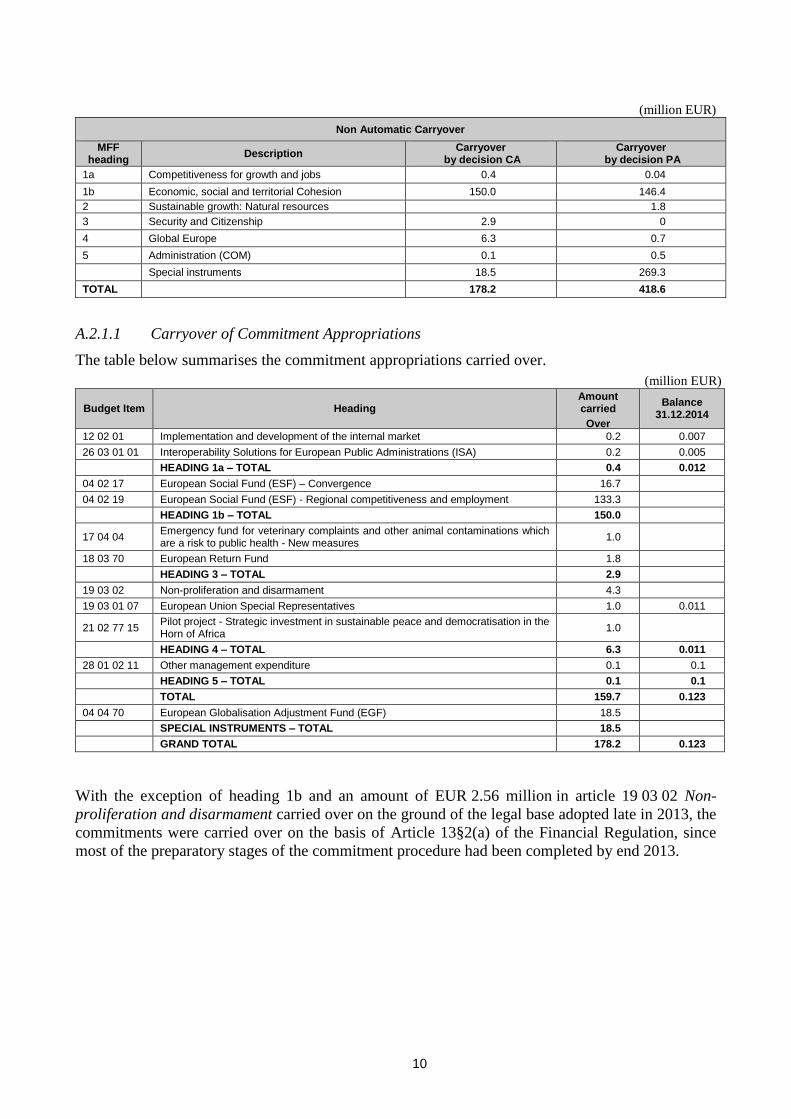
The table below summarises the carryover decisions by heading of the multiannual financial
framework.
4 COM (2014) 959 final.
10
(million EUR)
Non Automatic Carryover
MFF heading
Description Carryover
by decision CA Carryover
by decision PA
1a Competitiveness for growth and jobs 0.4 0.04
1b Economic, social and territorial Cohesion 150.0 146.4
2 Sustainable growth: Natural resources 1.8
3 Security and Citizenship 2.9 0
4 Global Europe 6.3 0.7
5 Administration (COM) 0.1 0.5
Special instruments 18.5 269.3
TOTAL 178.2 418.6
A.2.1.1 Carryover of Commitment Appropriations
The table below summarises the commitment appropriations carried over.
(million EUR)
Budget Item Heading Amount carried
Over
Balance 31.12.2014
12 02 01 Implementation and development of the internal market 0.2 0.007
26 03 01 01 Interoperability Solutions for European Public Administrations (ISA) 0.2 0.005
HEADING 1a – TOTAL 0.4 0.012
04 02 17 European Social Fund (ESF) – Convergence 16.7
04 02 19 European Social Fund (ESF) - Regional competitiveness and employment 133.3
HEADING 1b – TOTAL 150.0
17 04 04 Emergency fund for veterinary complaints and other animal contaminations which are a risk to public health - New measures
1.0
18 03 70 European Return Fund 1.8
HEADING 3 – TOTAL 2.9
19 03 02 Non-proliferation and disarmament 4.3
19 03 01 07 European Union Special Representatives 1.0 0.011
21 02 77 15 Pilot project - Strategic investment in sustainable peace and democratisation in the Horn of Africa
1.0
HEADING 4 – TOTAL 6.3 0.011
28 01 02 11 Other management expenditure 0.1 0.1
HEADING 5 – TOTAL 0.1 0.1
TOTAL 159.7 0.123
04 04 70 European Globalisation Adjustment Fund (EGF) 18.5
SPECIAL INSTRUMENTS – TOTAL 18.5
GRAND TOTAL 178.2 0.123
With the exception of heading 1b and an amount of EUR 2.56 million in article 19 03 02 Non-
proliferation and disarmament carried over on the ground of the legal base adopted late in 2013, the
commitments were carried over on the basis of Article 13§2(a) of the Financial Regulation, since
most of the preparatory stages of the commitment procedure had been completed by end 2013.
11
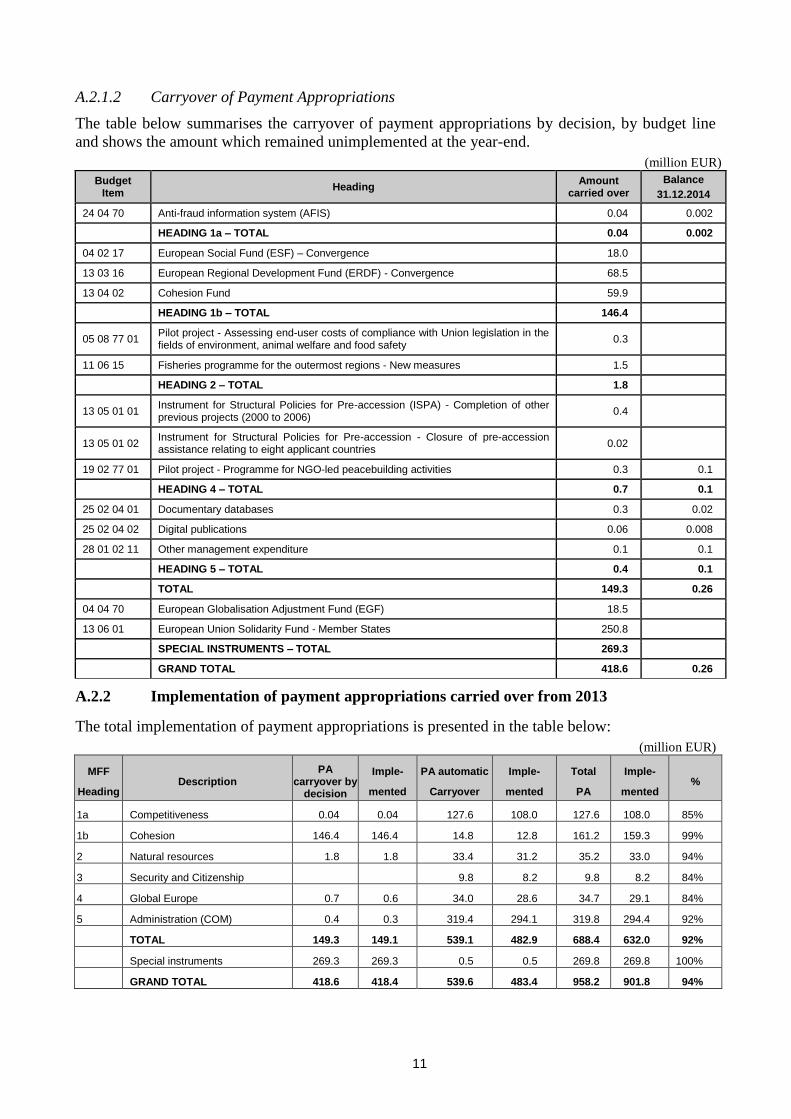
A.2.1.2 Carryover of Payment Appropriations
The table below summarises the carryover of payment appropriations by decision, by budget line
and shows the amount which remained unimplemented at the year-end.
(million EUR)
Budget Item
Heading Amount
carried over
Balance
31.12.2014
24 04 70 Anti-fraud information system (AFIS) 0.04 0.002
HEADING 1a – TOTAL 0.04 0.002
04 02 17 European Social Fund (ESF) – Convergence 18.0
13 03 16 European Regional Development Fund (ERDF) - Convergence 68.5
13 04 02 Cohesion Fund 59.9
HEADING 1b – TOTAL 146.4
05 08 77 01 Pilot project - Assessing end-user costs of compliance with Union legislation in the fields of environment, animal welfare and food safety
0.3
11 06 15 Fisheries programme for the outermost regions - New measures 1.5
HEADING 2 – TOTAL 1.8
13 05 01 01 Instrument for Structural Policies for Pre-accession (ISPA) - Completion of other previous projects (2000 to 2006)
0.4
13 05 01 02 Instrument for Structural Policies for Pre-accession - Closure of pre-accession assistance relating to eight applicant countries
0.02
19 02 77 01 Pilot project - Programme for NGO-led peacebuilding activities 0.3 0.1
HEADING 4 – TOTAL 0.7 0.1
25 02 04 01 Documentary databases 0.3 0.02
25 02 04 02 Digital publications 0.06 0.008
28 01 02 11 Other management expenditure 0.1 0.1
HEADING 5 – TOTAL 0.4 0.1
TOTAL 149.3 0.26
04 04 70 European Globalisation Adjustment Fund (EGF) 18.5
13 06 01 European Union Solidarity Fund - Member States 250.8
SPECIAL INSTRUMENTS – TOTAL 269.3
GRAND TOTAL 418.6 0.26
A.2.2 Implementation of payment appropriations carried over from 2013
The total implementation of payment appropriations is presented in the table below:
(million EUR)
MFF
Heading Description
PA carryover by
decision
Imple-
mented
PA automatic
Carryover
Imple-
mented
Total
PA
Imple-
mented %
1a Competitiveness 0.04 0.04 127.6 108.0 127.6 108.0 85%
1b Cohesion 146.4 146.4 14.8 12.8 161.2 159.3 99%
2 Natural resources 1.8 1.8 33.4 31.2 35.2 33.0 94%
3 Security and Citizenship 9.8 8.2 9.8 8.2 84%
4 Global Europe 0.7 0.6 34.0 28.6 34.7 29.1 84%
5 Administration (COM) 0.4 0.3 319.4 294.1 319.8 294.4 92%
TOTAL 149.3 149.1 539.1 482.9 688.4 632.0 92%
Special instruments 269.3 269.3 0.5 0.5 269.8 269.8 100%
GRAND TOTAL 418.6 418.4 539.6 483.4 958.2 901.8 94%
12
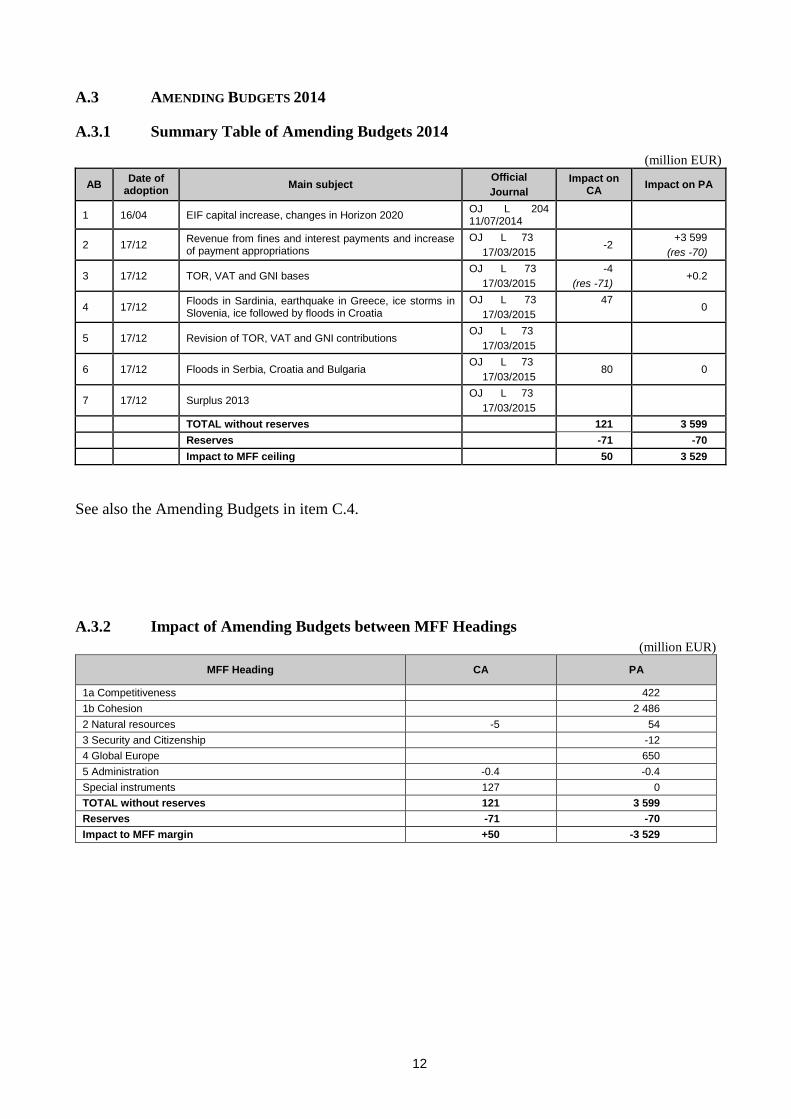
A.3 AMENDING BUDGETS 2014
A.3.1 Summary Table of Amending Budgets 2014
(million EUR)
AB Date of
adoption Main subject
Official
Journal
Impact on CA
Impact on PA
1 16/04 EIF capital increase, changes in Horizon 2020 OJ L 204 11/07/2014
2 17/12 Revenue from fines and interest payments and increase of payment appropriations
OJ L 73
17/03/2015 -2
+3 599
(res -70)
3 17/12 TOR, VAT and GNI bases OJ L 73
17/03/2015
-4
(res -71) +0.2
4 17/12 Floods in Sardinia, earthquake in Greece, ice storms in Slovenia, ice followed by floods in Croatia
OJ L 73
17/03/2015
47
0
5 17/12 Revision of TOR, VAT and GNI contributions OJ L 73
17/03/2015
6 17/12 Floods in Serbia, Croatia and Bulgaria OJ L 73
17/03/2015 80 0
7 17/12 Surplus 2013 OJ L 73
17/03/2015
TOTAL without reserves 121 3 599
Reserves -71 -70
Impact to MFF ceiling 50 3 529
See also the Amending Budgets in item C.4.
A.3.2 Impact of Amending Budgets between MFF Headings
(million EUR)
MFF Heading CA PA
1a Competitiveness 422
1b Cohesion 2 486
2 Natural resources -5 54
3 Security and Citizenship -12
4 Global Europe 650
5 Administration -0.4 -0.4
Special instruments 127 0
TOTAL without reserves 121 3 599
Reserves -71 -70
Impact to MFF margin +50 -3 529
13
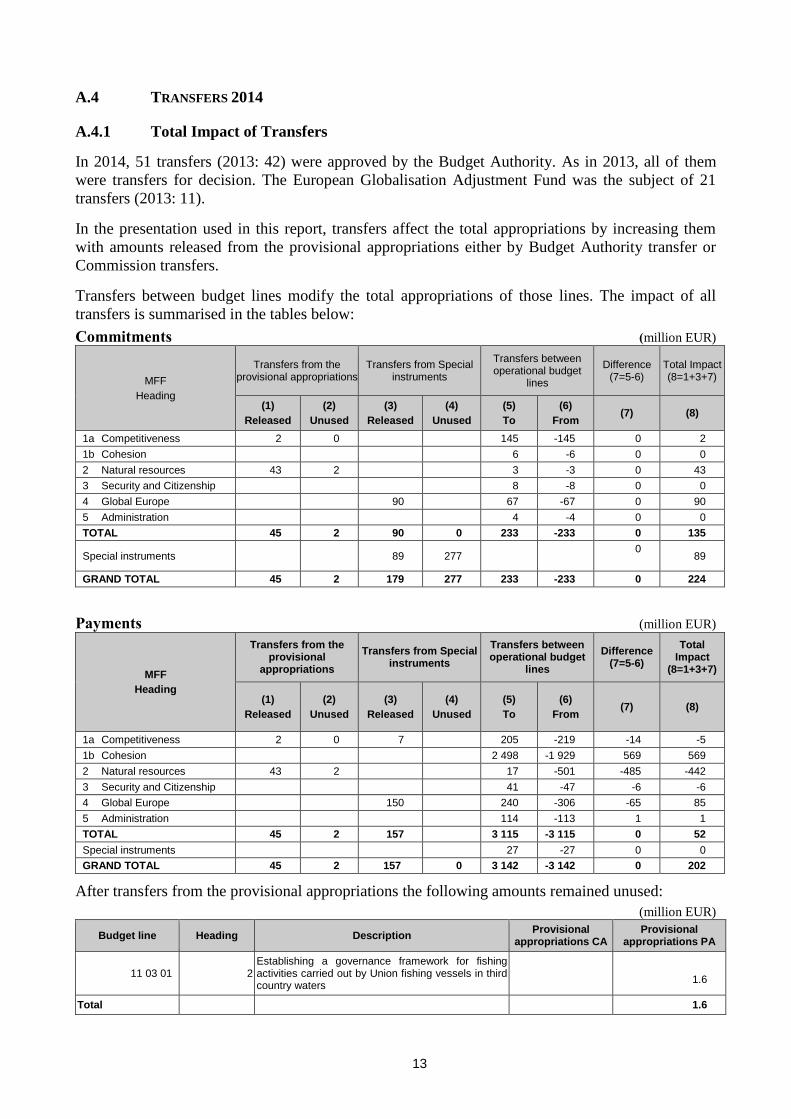
A.4 TRANSFERS 2014
A.4.1 Total Impact of Transfers
In 2014, 51 transfers (2013: 42) were approved by the Budget Authority. As in 2013, all of them
were transfers for decision. The European Globalisation Adjustment Fund was the subject of 21
transfers (2013: 11).
In the presentation used in this report, transfers affect the total appropriations by increasing them
with amounts released from the provisional appropriations either by Budget Authority transfer or
Commission transfers.
Transfers between budget lines modify the total appropriations of those lines. The impact of all
transfers is summarised in the tables below:
Commitments (million EUR)
MFF
Heading
Transfers from the provisional appropriations
Transfers from Special instruments
Transfers between operational budget
lines
Difference (7=5-6)
Total Impact (8=1+3+7)
(1)
Released
(2)
Unused
(3)
Released
(4)
Unused
(5)
To
(6)
From (7) (8)
1a Competitiveness 2 0 145 -145 0 2
1b Cohesion 6 -6 0 0
2 Natural resources 43 2 3 -3 0 43
3 Security and Citizenship 8 -8 0 0
4 Global Europe 90 67 -67 0 90
5 Administration 4 -4 0 0
TOTAL 45 2 90 0 233 -233 0 135
Special instruments 89 277 0
89
GRAND TOTAL 45 2 179 277 233 -233 0 224
Payments (million EUR)
MFF
Heading
Transfers from the provisional
appropriations
Transfers from Special instruments
Transfers between operational budget
lines
Difference (7=5-6)
Total Impact
(8=1+3+7)
(1)
Released
(2)
Unused
(3)
Released
(4)
Unused
(5)
To
(6)
From (7) (8)
1a Competitiveness 2 0 7 205 -219 -14 -5
1b Cohesion 2 498 -1 929 569 569
2 Natural resources 43 2 17 -501 -485 -442
3 Security and Citizenship 41 -47 -6 -6
4 Global Europe 150 240 -306 -65 85
5 Administration 114 -113 1 1
TOTAL 45 2 157 3 115 -3 115 0 52
Special instruments 27 -27 0 0
GRAND TOTAL 45 2 157 0 3 142 -3 142 0 202
After transfers from the provisional appropriations the following amounts remained unused:
(million EUR)
Budget line Heading Description Provisional
appropriations CA Provisional
appropriations PA
11 03 01 2 Establishing a governance framework for fishing activities carried out by Union fishing vessels in third country waters
1.6
Total 1.6
14
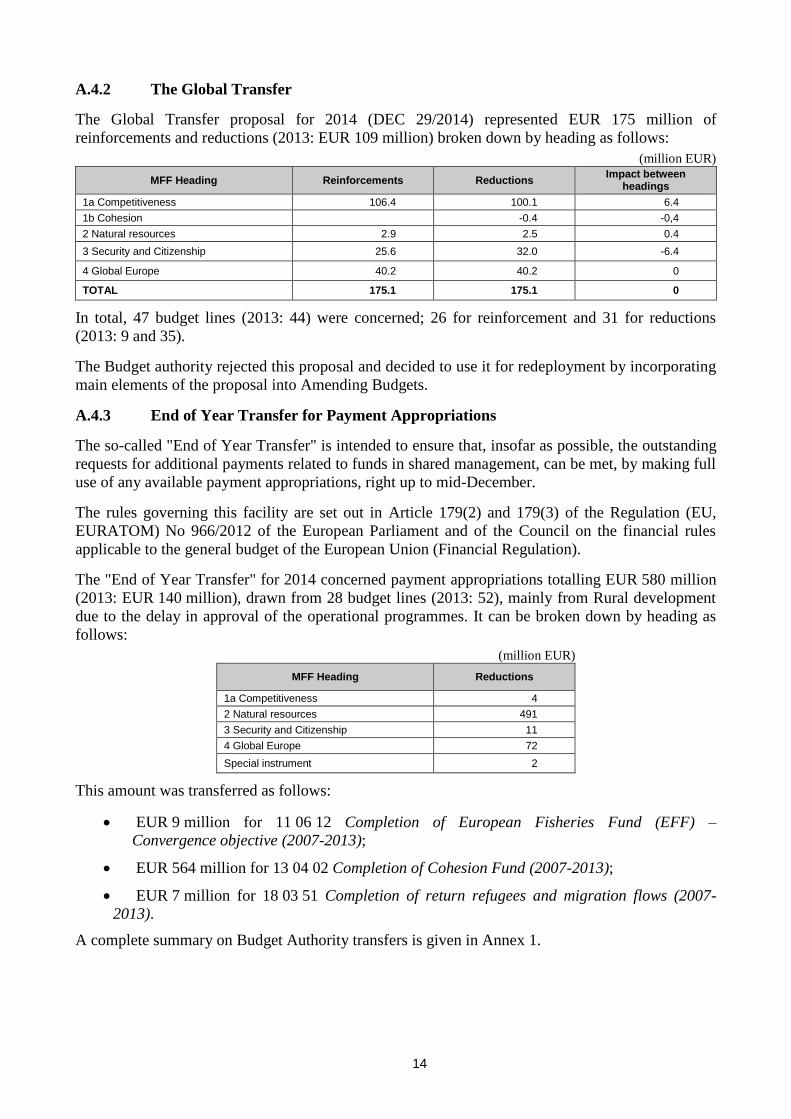
A.4.2 The Global Transfer
The Global Transfer proposal for 2014 (DEC 29/2014) represented EUR 175 million of
reinforcements and reductions (2013: EUR 109 million) broken down by heading as follows:
(million EUR)
MFF Heading Reinforcements Reductions Impact between
headings
1a Competitiveness 106.4 100.1 6.4
1b Cohesion -0.4 -0,4
2 Natural resources 2.9 2.5 0.4
3 Security and Citizenship 25.6 32.0 -6.4
4 Global Europe 40.2 40.2 0
TOTAL 175.1 175.1 0
In total, 47 budget lines (2013: 44) were concerned; 26 for reinforcement and 31 for reductions
(2013: 9 and 35).
The Budget authority rejected this proposal and decided to use it for redeployment by incorporating
main elements of the proposal into Amending Budgets.
A.4.3 End of Year Transfer for Payment Appropriations
The so-called "End of Year Transfer" is intended to ensure that, insofar as possible, the outstanding
requests for additional payments related to funds in shared management, can be met, by making full
use of any available payment appropriations, right up to mid-December.
The rules governing this facility are set out in Article 179(2) and 179(3) of the Regulation (EU,
EURATOM) No 966/2012 of the European Parliament and of the Council on the financial rules
applicable to the general budget of the European Union (Financial Regulation).
The "End of Year Transfer" for 2014 concerned payment appropriations totalling EUR 580 million
(2013: EUR 140 million), drawn from 28 budget lines (2013: 52), mainly from Rural development
due to the delay in approval of the operational programmes. It can be broken down by heading as
follows:
(million EUR)
MFF Heading Reductions
1a Competitiveness 4
2 Natural resources 491
3 Security and Citizenship 11
4 Global Europe 72
Special instrument 2
This amount was transferred as follows:
EUR 9 million for 11 06 12 Completion of European Fisheries Fund (EFF) –
Convergence objective (2007-2013);
EUR 564 million for 13 04 02 Completion of Cohesion Fund (2007-2013);
EUR 7 million for 18 03 51 Completion of return refugees and migration flows (2007-
2013).
A complete summary on Budget Authority transfers is given in Annex 1.
15
A.5 2014 IMPLEMENTATION OVERVIEW
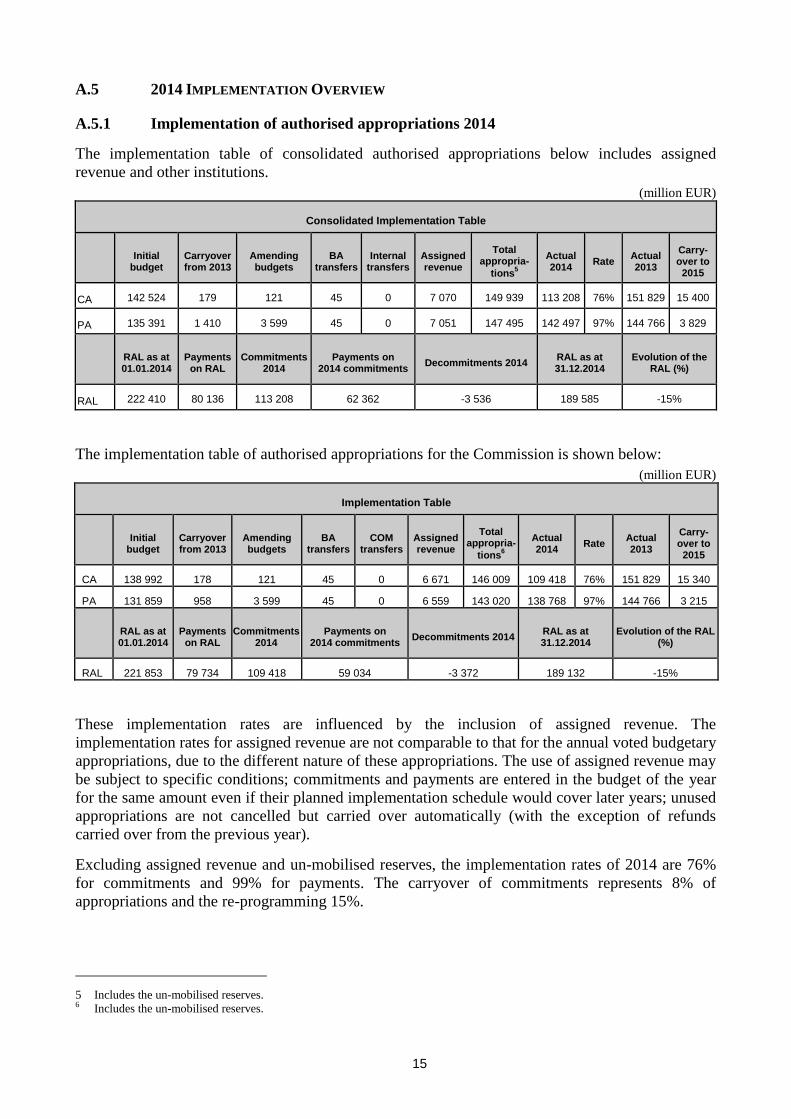
A.5.1 Implementation of authorised appropriations 2014
The implementation table of consolidated authorised appropriations below includes assigned
revenue and other institutions.
(million EUR)
Consolidated Implementation Table
Initial
budget Carryover from 2013
Amending budgets
BA transfers
Internal transfers
Assigned revenue
Total appropria-
tions5
Actual 2014
Rate Actual 2013
Carry-over to 2015
CA 142 524 179 121 45 0 7 070 149 939 113 208 76% 151 829 15 400
PA 135 391 1 410 3 599 45 0 7 051 147 495 142 497 97% 144 766 3 829
RAL as at 01.01.2014
Payments on RAL
Commitments 2014
Payments on 2014 commitments
Decommitments 2014 RAL as at 31.12.2014
Evolution of the RAL (%)
RAL 222 410 80 136 113 208 62 362 -3 536 189 585 -15%
The implementation table of authorised appropriations for the Commission is shown below:
(million EUR)
Implementation Table
Initial
budget Carryover from 2013
Amending budgets
BA transfers
COM transfers
Assigned revenue
Total appropria-
tions6
Actual 2014
Rate Actual 2013
Carry-over to 2015
CA 138 992 178 121 45 0 6 671 146 009 109 418 76% 151 829 15 340
PA 131 859 958 3 599 45 0 6 559 143 020 138 768 97% 144 766 3 215
RAL as at 01.01.2014
Payments on RAL
Commitments 2014
Payments on 2014 commitments
Decommitments 2014 RAL as at 31.12.2014
Evolution of the RAL (%)
RAL 221 853 79 734 109 418 59 034 -3 372 189 132 -15%
These implementation rates are influenced by the inclusion of assigned revenue. The
implementation rates for assigned revenue are not comparable to that for the annual voted budgetary
appropriations, due to the different nature of these appropriations. The use of assigned revenue may
be subject to specific conditions; commitments and payments are entered in the budget of the year
for the same amount even if their planned implementation schedule would cover later years; unused
appropriations are not cancelled but carried over automatically (with the exception of refunds
carried over from the previous year).
Excluding assigned revenue and un-mobilised reserves, the implementation rates of 2014 are 76%
for commitments and 99% for payments. The carryover of commitments represents 8% of
appropriations and the re-programming 15%.
5 Includes the un-mobilised reserves. 6 Includes the un-mobilised reserves.
16
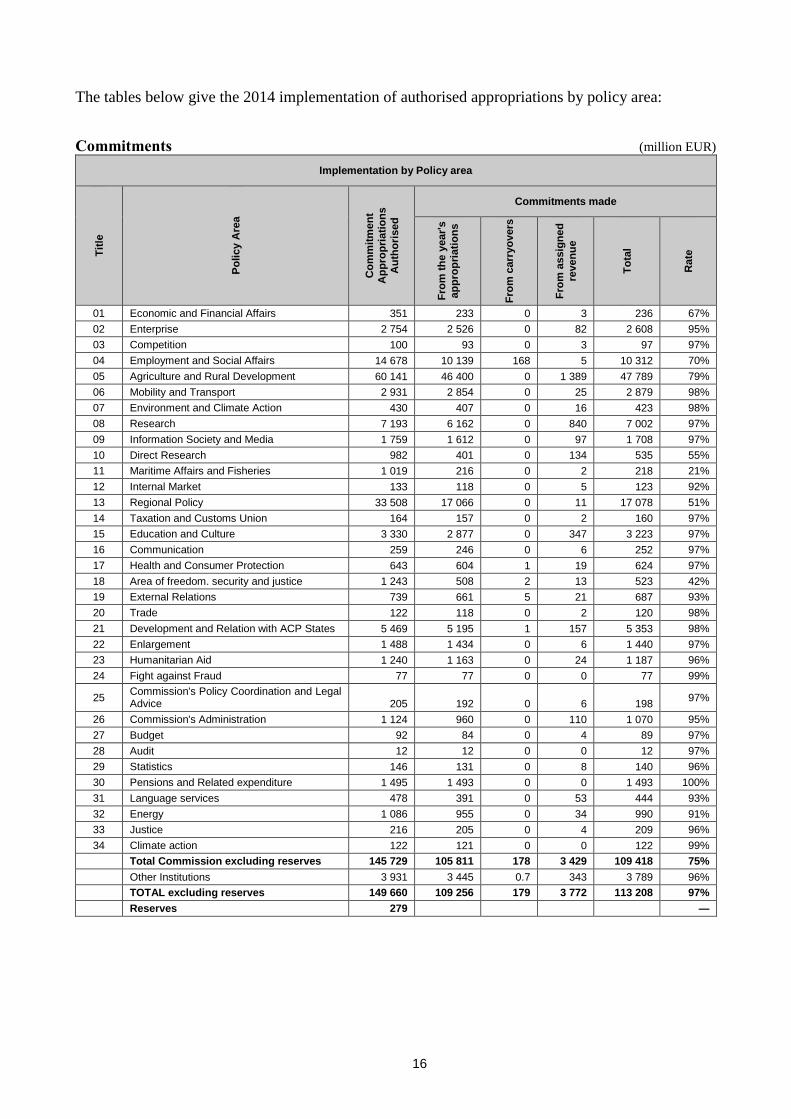
The tables below give the 2014 implementation of authorised appropriations by policy area:
Commitments (million EUR)
Implementation by Policy area
Tit
le
Po
licy A
rea
Co
mm
itm
en
t A
pp
rop
riati
on
s
Au
tho
rised
Commitments made
Fro
m t
he
year'
s
ap
pro
pri
ati
on
s
Fro
m c
arr
yo
vers
Fro
m a
ssig
ne
d
reven
ue
To
tal
Rate
01 Economic and Financial Affairs 351 233 0 3 236 67%
02 Enterprise 2 754 2 526 0 82 2 608 95%
03 Competition 100 93 0 3 97 97%
04 Employment and Social Affairs 14 678 10 139 168 5 10 312 70%
05 Agriculture and Rural Development 60 141 46 400 0 1 389 47 789 79%
06 Mobility and Transport 2 931 2 854 0 25 2 879 98%
07 Environment and Climate Action 430 407 0 16 423 98%
08 Research 7 193 6 162 0 840 7 002 97%
09 Information Society and Media 1 759 1 612 0 97 1 708 97%
10 Direct Research 982 401 0 134 535 55%
11 Maritime Affairs and Fisheries 1 019 216 0 2 218 21%
12 Internal Market 133 118 0 5 123 92%
13 Regional Policy 33 508 17 066 0 11 17 078 51%
14 Taxation and Customs Union 164 157 0 2 160 97%
15 Education and Culture 3 330 2 877 0 347 3 223 97%
16 Communication 259 246 0 6 252 97%
17 Health and Consumer Protection 643 604 1 19 624 97%
18 Area of freedom. security and justice 1 243 508 2 13 523 42%
19 External Relations 739 661 5 21 687 93%
20 Trade 122 118 0 2 120 98%
21 Development and Relation with ACP States 5 469 5 195 1 157 5 353 98%
22 Enlargement 1 488 1 434 0 6 1 440 97%
23 Humanitarian Aid 1 240 1 163 0 24 1 187 96%
24 Fight against Fraud 77 77 0 0 77 99%
25 Commission's Policy Coordination and Legal Advice 205 192 0 6 198
97%
26 Commission's Administration 1 124 960 0 110 1 070 95%
27 Budget 92 84 0 4 89 97%
28 Audit 12 12 0 0 12 97%
29 Statistics 146 131 0 8 140 96%
30 Pensions and Related expenditure 1 495 1 493 0 0 1 493 100%
31 Language services 478 391 0 53 444 93%
32 Energy 1 086 955 0 34 990 91%
33 Justice 216 205 0 4 209 96%
34 Climate action 122 121 0 0 122 99%
Total Commission excluding reserves 145 729 105 811 178 3 429 109 418 75%
Other Institutions 3 931 3 445 0.7 343 3 789 96%
TOTAL excluding reserves 149 660 109 256 179 3 772 113 208 97%
Reserves 279 —
17
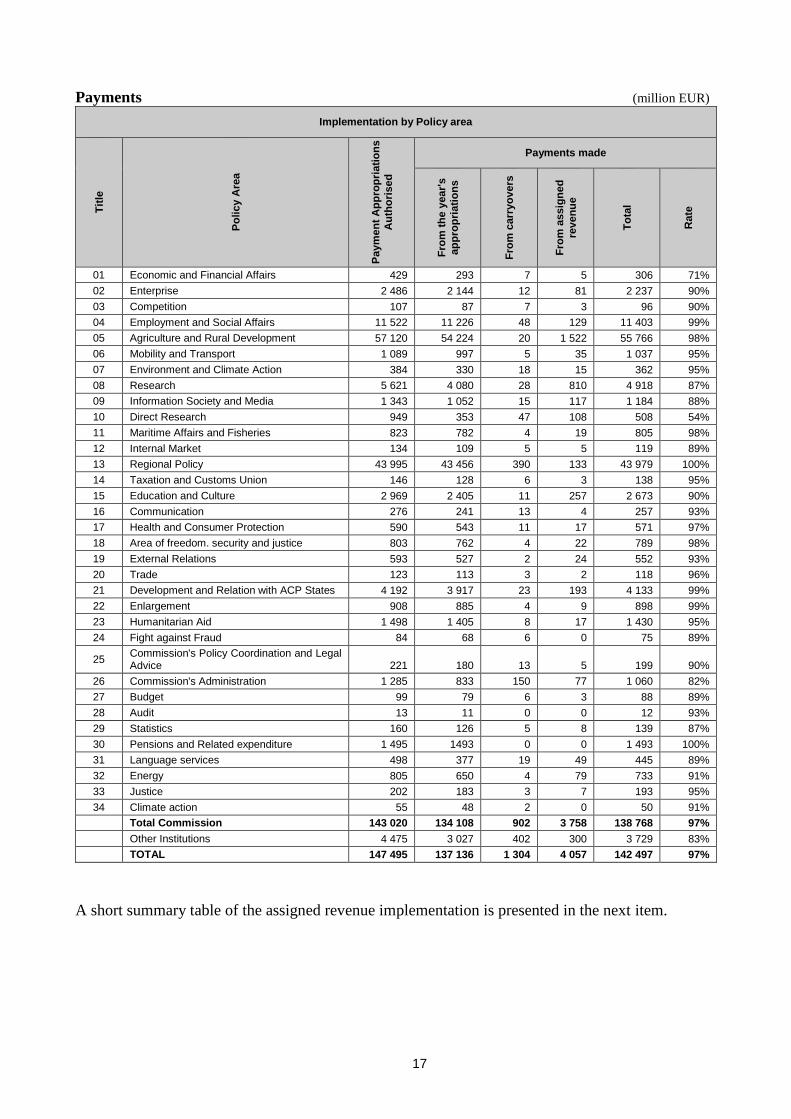
Payments (million EUR)
Implementation by Policy area
Tit
le
Po
licy A
rea
Paym
en
t A
pp
rop
riati
on
s
Au
tho
rised
Payments made
Fro
m t
he
year'
s
ap
pro
pri
ati
on
s
Fro
m c
arr
yo
vers
Fro
m a
ssig
ne
d
reven
ue
To
tal
Rate
01 Economic and Financial Affairs 429 293 7 5 306 71%
02 Enterprise 2 486 2 144 12 81 2 237 90%
03 Competition 107 87 7 3 96 90%
04 Employment and Social Affairs 11 522 11 226 48 129 11 403 99%
05 Agriculture and Rural Development 57 120 54 224 20 1 522 55 766 98%
06 Mobility and Transport 1 089 997 5 35 1 037 95%
07 Environment and Climate Action 384 330 18 15 362 95%
08 Research 5 621 4 080 28 810 4 918 87%
09 Information Society and Media 1 343 1 052 15 117 1 184 88%
10 Direct Research 949 353 47 108 508 54%
11 Maritime Affairs and Fisheries 823 782 4 19 805 98%
12 Internal Market 134 109 5 5 119 89%
13 Regional Policy 43 995 43 456 390 133 43 979 100%
14 Taxation and Customs Union 146 128 6 3 138 95%
15 Education and Culture 2 969 2 405 11 257 2 673 90%
16 Communication 276 241 13 4 257 93%
17 Health and Consumer Protection 590 543 11 17 571 97%
18 Area of freedom. security and justice 803 762 4 22 789 98%
19 External Relations 593 527 2 24 552 93%
20 Trade 123 113 3 2 118 96%
21 Development and Relation with ACP States 4 192 3 917 23 193 4 133 99%
22 Enlargement 908 885 4 9 898 99%
23 Humanitarian Aid 1 498 1 405 8 17 1 430 95%
24 Fight against Fraud 84 68 6 0 75 89%
25 Commission's Policy Coordination and Legal Advice 221 180 13 5 199 90%
26 Commission's Administration 1 285 833 150 77 1 060 82%
27 Budget 99 79 6 3 88 89%
28 Audit 13 11 0 0 12 93%
29 Statistics 160 126 5 8 139 87%
30 Pensions and Related expenditure 1 495 1493 0 0 1 493 100%
31 Language services 498 377 19 49 445 89%
32 Energy 805 650 4 79 733 91%
33 Justice 202 183 3 7 193 95%
34 Climate action 55 48 2 0 50 91%
Total Commission 143 020 134 108 902 3 758 138 768 97%
Other Institutions 4 475 3 027 402 300 3 729 83%
TOTAL 147 495 137 136 1 304 4 057 142 497 97%
A short summary table of the assigned revenue implementation is presented in the next item.
18
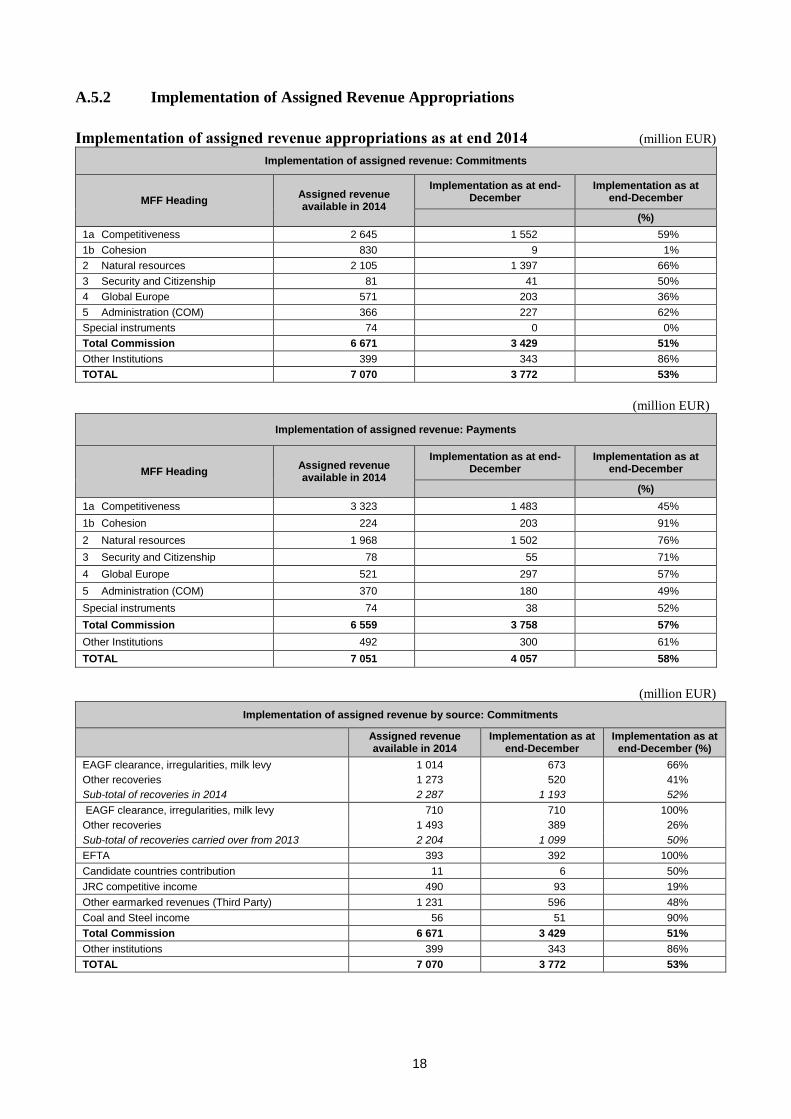
A.5.2 Implementation of Assigned Revenue Appropriations
Implementation of assigned revenue appropriations as at end 2014 (million EUR)
Implementation of assigned revenue: Commitments
MFF Heading Assigned revenue available in 2014
Implementation as at end-December
Implementation as at end-December
(%)
1a Competitiveness 2 645 1 552 59%
1b Cohesion 830 9 1%
2 Natural resources 2 105 1 397 66%
3 Security and Citizenship 81 41 50%
4 Global Europe 571 203 36%
5 Administration (COM) 366 227 62%
Special instruments 74 0 0%
Total Commission 6 671 3 429 51%
Other Institutions 399 343 86%
TOTAL 7 070 3 772 53%
(million EUR)
Implementation of assigned revenue: Payments
MFF Heading Assigned revenue available in 2014
Implementation as at end-December
Implementation as at end-December
(%)
1a Competitiveness 3 323 1 483 45%
1b Cohesion 224 203 91%
2 Natural resources 1 968 1 502 76%
3 Security and Citizenship 78 55 71%
4 Global Europe 521 297 57%
5 Administration (COM) 370 180 49%
Special instruments 74 38 52%
Total Commission 6 559 3 758 57%
Other Institutions 492 300 61%
TOTAL 7 051 4 057 58%
(million EUR)
Implementation of assigned revenue by source: Commitments
Assigned revenue available in 2014
Implementation as at end-December
Implementation as at end-December (%)
EAGF clearance, irregularities, milk levy 1 014 673 66%
Other recoveries 1 273 520 41%
Sub-total of recoveries in 2014 2 287 1 193 52%
EAGF clearance, irregularities, milk levy 710 710 100%
Other recoveries 1 493 389 26%
Sub-total of recoveries carried over from 2013 2 204 1 099 50%
EFTA 393 392 100%
Candidate countries contribution 11 6 50%
JRC competitive income 490 93 19%
Other earmarked revenues (Third Party) 1 231 596 48%
Coal and Steel income 56 51 90%
Total Commission 6 671 3 429 51%
Other institutions 399 343 86%
TOTAL 7 070 3 772 53%
19
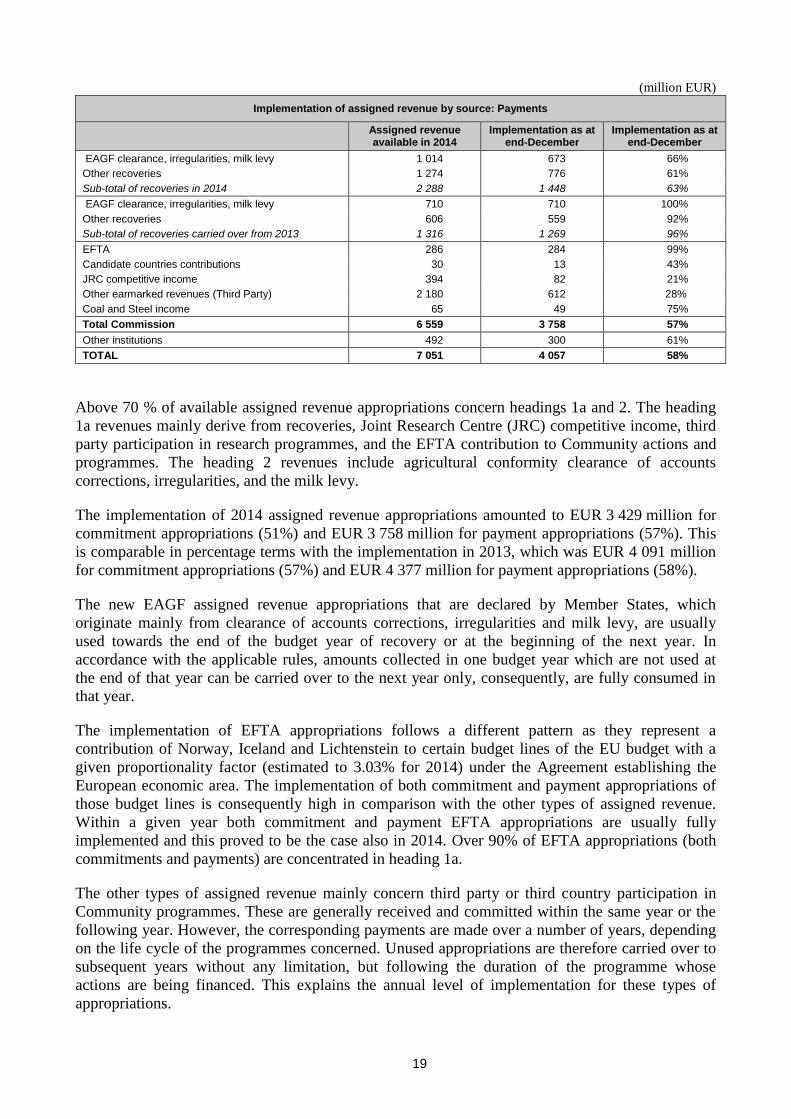
(million EUR)
Implementation of assigned revenue by source: Payments
Assigned revenue available in 2014
Implementation as at end-December
Implementation as at end-December
EAGF clearance, irregularities, milk levy 1 014 673 66%
Other recoveries 1 274 776 61%
Sub-total of recoveries in 2014 2 288 1 448 63%
EAGF clearance, irregularities, milk levy 710 710 100%
Other recoveries 606 559 92%
Sub-total of recoveries carried over from 2013 1 316 1 269 96%
EFTA 286 284 99%
Candidate countries contributions 30 13 43%
JRC competitive income 394 82 21%
Other earmarked revenues (Third Party) 2 180 612 28%
Coal and Steel income 65 49 75%
Total Commission 6 559 3 758 57%
Other institutions 492 300 61%
TOTAL 7 051 4 057 58%
Above 70 % of available assigned revenue appropriations concern headings 1a and 2. The heading
1a revenues mainly derive from recoveries, Joint Research Centre (JRC) competitive income, third
party participation in research programmes, and the EFTA contribution to Community actions and
programmes. The heading 2 revenues include agricultural conformity clearance of accounts
corrections, irregularities, and the milk levy.
The implementation of 2014 assigned revenue appropriations amounted to EUR 3 429 million for
commitment appropriations (51%) and EUR 3 758 million for payment appropriations (57%). This
is comparable in percentage terms with the implementation in 2013, which was EUR 4 091 million
for commitment appropriations (57%) and EUR 4 377 million for payment appropriations (58%).
The new EAGF assigned revenue appropriations that are declared by Member States, which
originate mainly from clearance of accounts corrections, irregularities and milk levy, are usually
used towards the end of the budget year of recovery or at the beginning of the next year. In
accordance with the applicable rules, amounts collected in one budget year which are not used at
the end of that year can be carried over to the next year only, consequently, are fully consumed in
that year.
The implementation of EFTA appropriations follows a different pattern as they represent a
contribution of Norway, Iceland and Lichtenstein to certain budget lines of the EU budget with a
given proportionality factor (estimated to 3.03% for 2014) under the Agreement establishing the
European economic area. The implementation of both commitment and payment appropriations of
those budget lines is consequently high in comparison with the other types of assigned revenue.
Within a given year both commitment and payment EFTA appropriations are usually fully
implemented and this proved to be the case also in 2014. Over 90% of EFTA appropriations (both
commitments and payments) are concentrated in heading 1a.
The other types of assigned revenue mainly concern third party or third country participation in
Community programmes. These are generally received and committed within the same year or the
following year. However, the corresponding payments are made over a number of years, depending
on the life cycle of the programmes concerned. Unused appropriations are therefore carried over to
subsequent years without any limitation, but following the duration of the programme whose
actions are being financed. This explains the annual level of implementation for these types of
appropriations.
20
A complete analysis of the implementation of assigned revenue in 2014 will be presented in the
Working document part V of the Draft General Budget of the European Commission for the
financial year 2016 Assigned revenue implementation in the previous year.
A.5.3 Implementation of Budgetary Appropriations 2014
A.5.3.1 2014 Implementation Overview Table
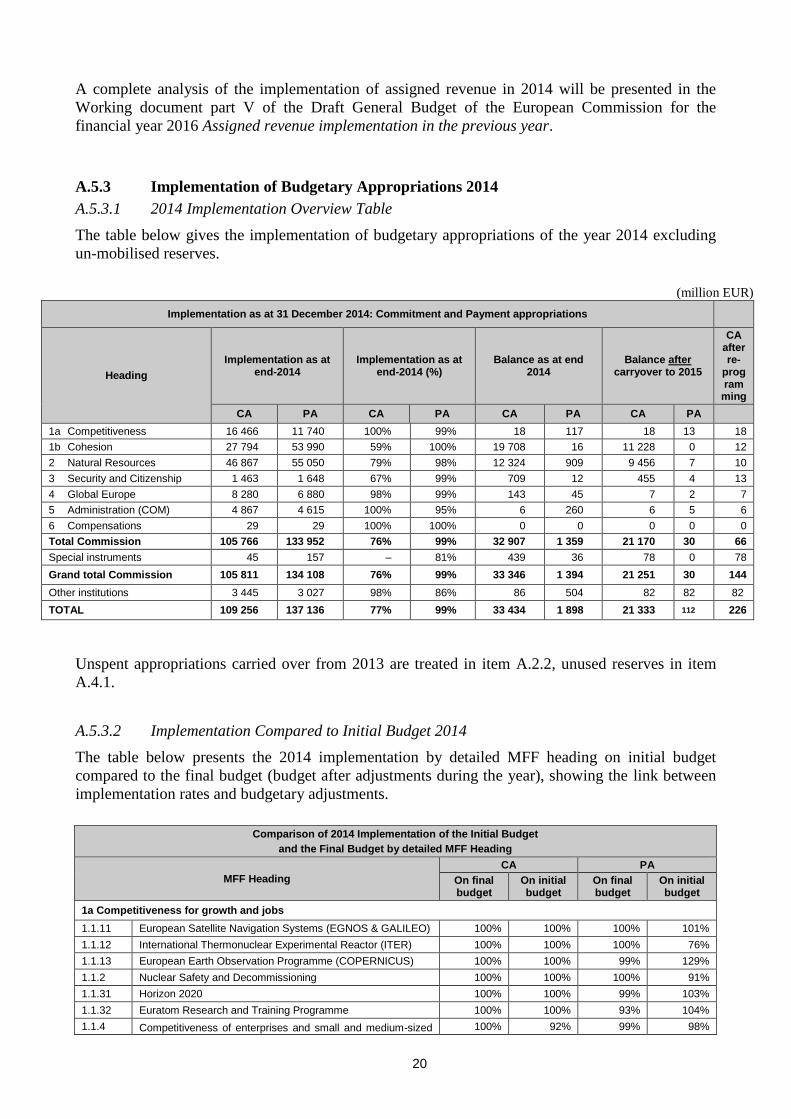
The table below gives the implementation of budgetary appropriations of the year 2014 excluding
un-mobilised reserves.
(million EUR)
Implementation as at 31 December 2014: Commitment and Payment appropriations
Heading
Implementation as at end-2014
Implementation as at end-2014 (%)
Balance as at end 2014
Balance after carryover to 2015
CA after re-
program
ming
CA PA CA PA CA PA CA PA
1a Competitiveness 16 466 11 740 100% 99% 18 117 18 13 18
1b Cohesion 27 794 53 990 59% 100% 19 708 16 11 228 0 12
2 Natural Resources 46 867 55 050 79% 98% 12 324 909 9 456 7 10
3 Security and Citizenship 1 463 1 648 67% 99% 709 12 455 4 13
4 Global Europe 8 280 6 880 98% 99% 143 45 7 2 7
5 Administration (COM) 4 867 4 615 100% 95% 6 260 6 5 6
6 Compensations 29 29 100% 100% 0 0 0 0 0
Total Commission 105 766 133 952 76% 99% 32 907 1 359 21 170 30 66
Special instruments 45 157 – 81% 439 36 78 0 78
Grand total Commission 105 811 134 108 76% 99% 33 346 1 394 21 251 30 144
Other institutions 3 445 3 027 98% 86% 86 504 82 82 82
TOTAL 109 256 137 136 77% 99% 33 434 1 898 21 333 112 226
Unspent appropriations carried over from 2013 are treated in item A.2.2, unused reserves in item
A.4.1.
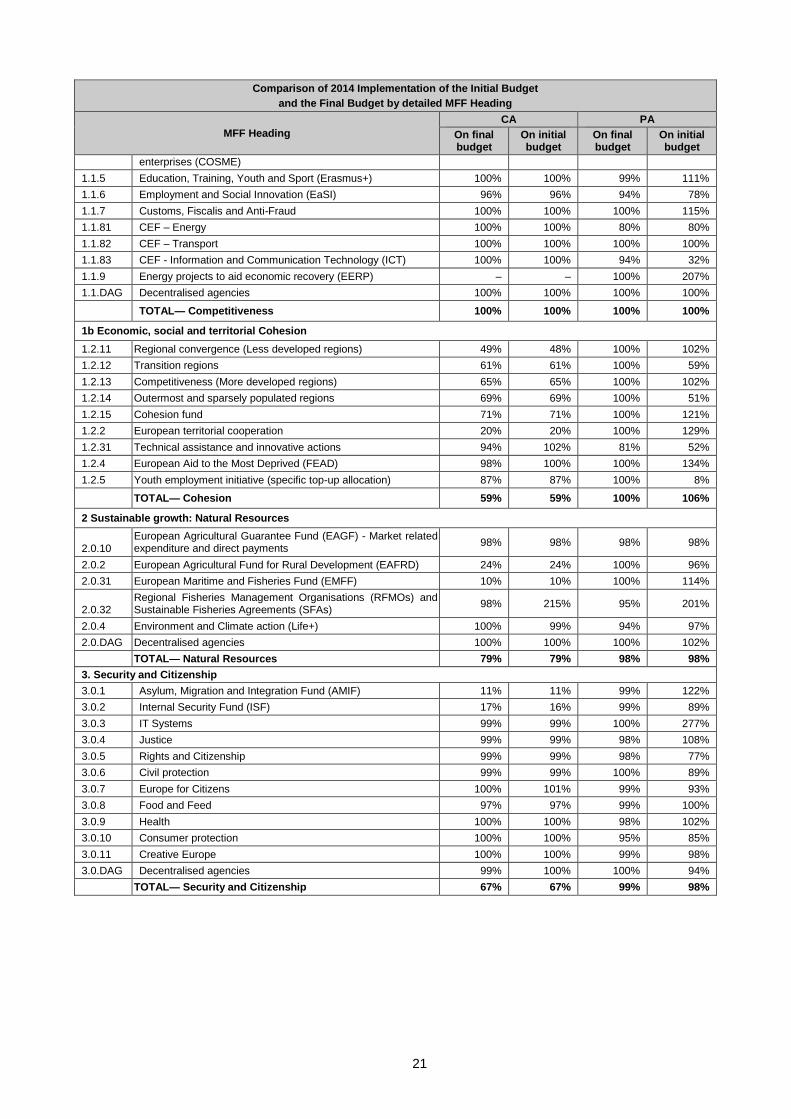
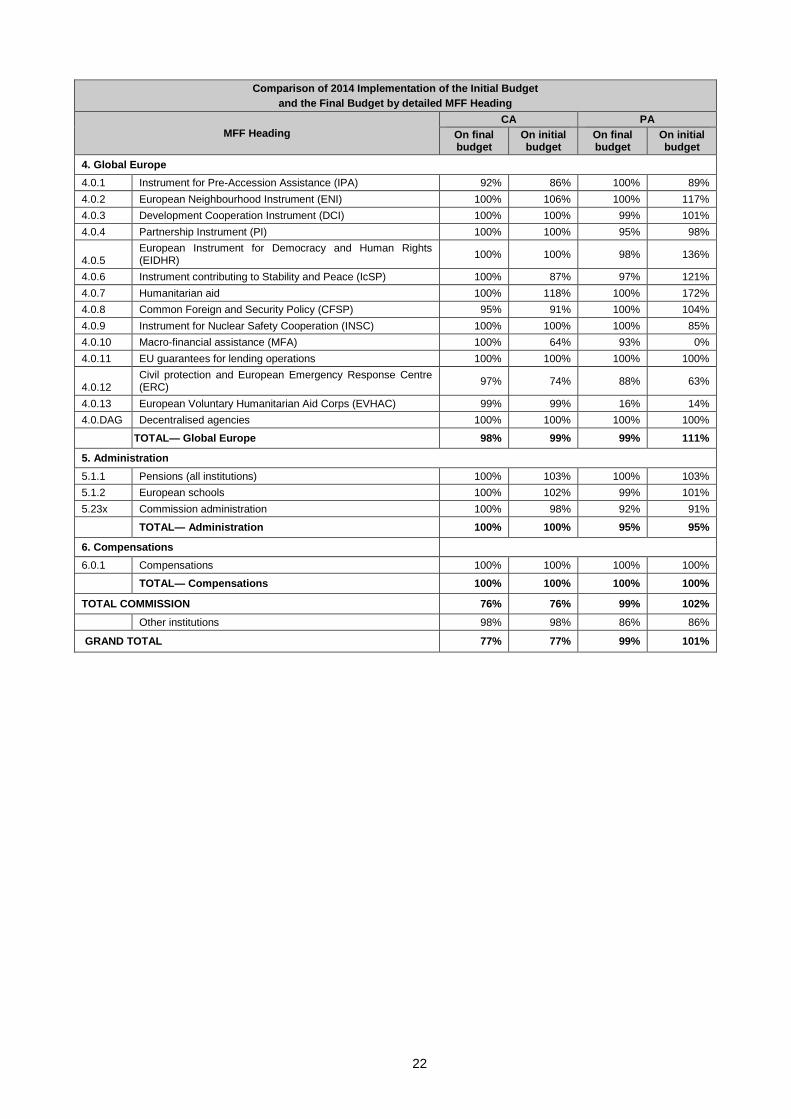
A.5.3.2 Implementation Compared to Initial Budget 2014
The table below presents the 2014 implementation by detailed MFF heading on initial budget
compared to the final budget (budget after adjustments during the year), showing the link between
implementation rates and budgetary adjustments.
Comparison of 2014 Implementation of the Initial Budget
and the Final Budget by detailed MFF Heading
MFF Heading
CA PA
On final budget
On initial budget
On final budget
On initial budget
1a Competitiveness for growth and jobs
1.1.11 European Satellite Navigation Systems (EGNOS & GALILEO) 100% 100% 100% 101%
1.1.12 International Thermonuclear Experimental Reactor (ITER) 100% 100% 100% 76%
1.1.13 European Earth Observation Programme (COPERNICUS) 100% 100% 99% 129%
1.1.2 Nuclear Safety and Decommissioning 100% 100% 100% 91%
1.1.31 Horizon 2020 100% 100% 99% 103%
1.1.32 Euratom Research and Training Programme 100% 100% 93% 104%
1.1.4 Competitiveness of enterprises and small and medium-sized 100% 92% 99% 98%
21
Comparison of 2014 Implementation of the Initial Budget
and the Final Budget by detailed MFF Heading
MFF Heading
CA PA
On final budget
On initial budget
On final budget
On initial budget
enterprises (COSME)
1.1.5 Education, Training, Youth and Sport (Erasmus+) 100% 100% 99% 111%
1.1.6 Employment and Social Innovation (EaSI) 96% 96% 94% 78%
1.1.7 Customs, Fiscalis and Anti-Fraud 100% 100% 100% 115%
1.1.81 CEF – Energy 100% 100% 80% 80%
1.1.82 CEF – Transport 100% 100% 100% 100%
1.1.83 CEF - Information and Communication Technology (ICT) 100% 100% 94% 32%
1.1.9 Energy projects to aid economic recovery (EERP) – – 100% 207%
1.1.DAG Decentralised agencies 100% 100% 100% 100%
TOTAL— Competitiveness 100% 100% 100% 100%
1b Economic, social and territorial Cohesion
1.2.11 Regional convergence (Less developed regions) 49% 48% 100% 102%
1.2.12 Transition regions 61% 61% 100% 59%
1.2.13 Competitiveness (More developed regions) 65% 65% 100% 102%
1.2.14 Outermost and sparsely populated regions 69% 69% 100% 51%
1.2.15 Cohesion fund 71% 71% 100% 121%
1.2.2 European territorial cooperation 20% 20% 100% 129%
1.2.31 Technical assistance and innovative actions 94% 102% 81% 52%
1.2.4 European Aid to the Most Deprived (FEAD) 98% 100% 100% 134%
1.2.5 Youth employment initiative (specific top-up allocation) 87% 87% 100% 8%
TOTAL— Cohesion 59% 59% 100% 106%
2 Sustainable growth: Natural Resources
2.0.10 European Agricultural Guarantee Fund (EAGF) - Market related expenditure and direct payments
98% 98% 98% 98%
2.0.2 European Agricultural Fund for Rural Development (EAFRD) 24% 24% 100% 96%
2.0.31 European Maritime and Fisheries Fund (EMFF) 10% 10% 100% 114%
2.0.32 Regional Fisheries Management Organisations (RFMOs) and Sustainable Fisheries Agreements (SFAs)
98% 215% 95% 201%
2.0.4 Environment and Climate action (Life+) 100% 99% 94% 97%
2.0.DAG Decentralised agencies 100% 100% 100% 102%
TOTAL— Natural Resources 79% 79% 98% 98%
3. Security and Citizenship
3.0.1 Asylum, Migration and Integration Fund (AMIF) 11% 11% 99% 122%
3.0.2 Internal Security Fund (ISF) 17% 16% 99% 89%
3.0.3 IT Systems 99% 99% 100% 277%
3.0.4 Justice 99% 99% 98% 108%
3.0.5 Rights and Citizenship 99% 99% 98% 77%
3.0.6 Civil protection 99% 99% 100% 89%
3.0.7 Europe for Citizens 100% 101% 99% 93%
3.0.8 Food and Feed 97% 97% 99% 100%
3.0.9 Health 100% 100% 98% 102%
3.0.10 Consumer protection 100% 100% 95% 85%
3.0.11 Creative Europe 100% 100% 99% 98%
3.0.DAG Decentralised agencies 99% 100% 100% 94%
TOTAL— Security and Citizenship 67% 67% 99% 98%
22
Comparison of 2014 Implementation of the Initial Budget
and the Final Budget by detailed MFF Heading
MFF Heading
CA PA
On final budget
On initial budget
On final budget
On initial budget
4. Global Europe
4.0.1 Instrument for Pre-Accession Assistance (IPA) 92% 86% 100% 89%
4.0.2 European Neighbourhood Instrument (ENI) 100% 106% 100% 117%
4.0.3 Development Cooperation Instrument (DCI) 100% 100% 99% 101%
4.0.4 Partnership Instrument (PI) 100% 100% 95% 98%
4.0.5 European Instrument for Democracy and Human Rights (EIDHR)
100% 100% 98% 136%
4.0.6 Instrument contributing to Stability and Peace (IcSP) 100% 87% 97% 121%
4.0.7 Humanitarian aid 100% 118% 100% 172%
4.0.8 Common Foreign and Security Policy (CFSP) 95% 91% 100% 104%
4.0.9 Instrument for Nuclear Safety Cooperation (INSC) 100% 100% 100% 85%
4.0.10 Macro-financial assistance (MFA) 100% 64% 93% 0%
4.0.11 EU guarantees for lending operations 100% 100% 100% 100%
4.0.12 Civil protection and European Emergency Response Centre (ERC)
97% 74% 88% 63%
4.0.13 European Voluntary Humanitarian Aid Corps (EVHAC) 99% 99% 16% 14%
4.0.DAG Decentralised agencies 100% 100% 100% 100%
TOTAL— Global Europe 98% 99% 99% 111%
5. Administration
5.1.1 Pensions (all institutions) 100% 103% 100% 103%
5.1.2 European schools 100% 102% 99% 101%
5.23x Commission administration 100% 98% 92% 91%
TOTAL— Administration 100% 100% 95% 95%
6. Compensations
6.0.1 Compensations 100% 100% 100% 100%
TOTAL— Compensations 100% 100% 100% 100%
TOTAL COMMISSION 76% 76% 99% 102%
Other institutions 98% 98% 86% 86%
GRAND TOTAL 77% 77% 99% 101%
23
A.6 RAL-SITUATION
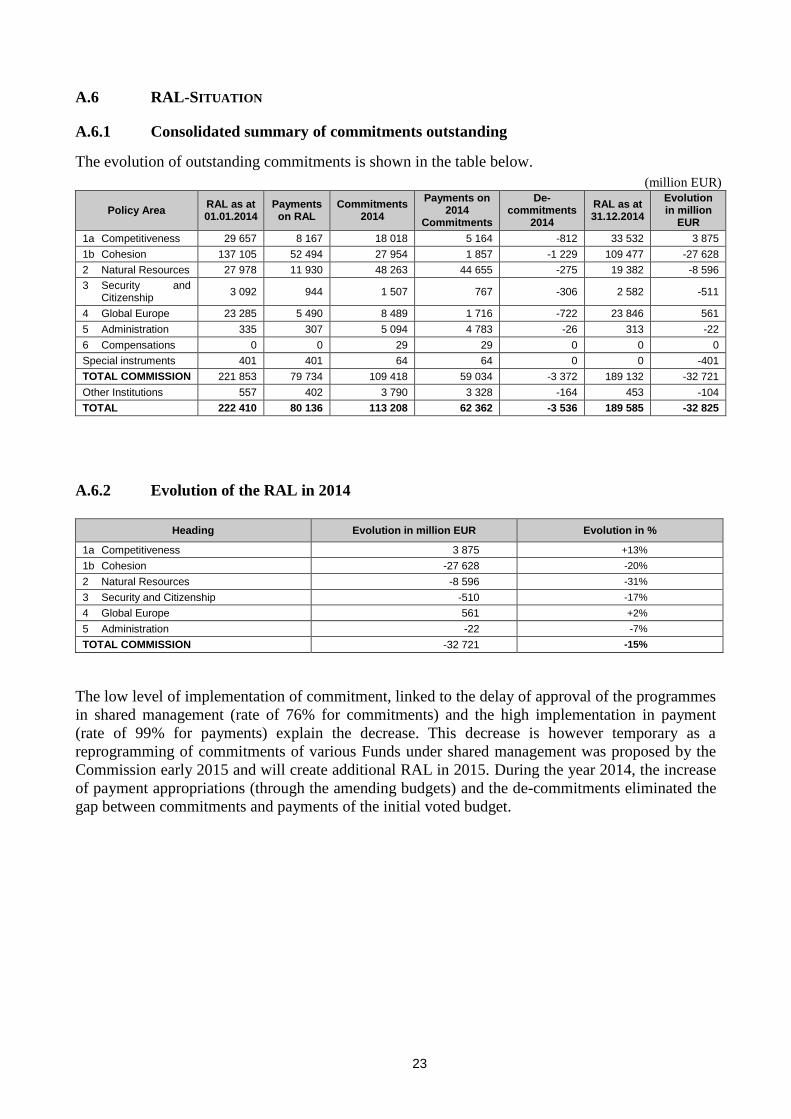
A.6.1 Consolidated summary of commitments outstanding
The evolution of outstanding commitments is shown in the table below.
(million EUR)
Policy Area RAL as at 01.01.2014
Payments on RAL
Commitments 2014
Payments on 2014
Commitments
De-commitments
2014
RAL as at 31.12.2014
Evolution in million
EUR
1a Competitiveness 29 657 8 167 18 018 5 164 -812 33 532 3 875
1b Cohesion 137 105 52 494 27 954 1 857 -1 229 109 477 -27 628
2 Natural Resources 27 978 11 930 48 263 44 655 -275 19 382 -8 596
3 Security and Citizenship
3 092 944 1 507 767 -306 2 582 -511
4 Global Europe 23 285 5 490 8 489 1 716 -722 23 846 561
5 Administration 335 307 5 094 4 783 -26 313 -22
6 Compensations 0 0 29 29 0 0 0
Special instruments 401 401 64 64 0 0 -401
TOTAL COMMISSION 221 853 79 734 109 418 59 034 -3 372 189 132 -32 721
Other Institutions 557 402 3 790 3 328 -164 453 -104
TOTAL 222 410 80 136 113 208 62 362 -3 536 189 585 -32 825
A.6.2 Evolution of the RAL in 2014
Heading Evolution in million EUR Evolution in %
1a Competitiveness 3 875 +13%
1b Cohesion -27 628 -20%
2 Natural Resources -8 596 -31%
3 Security and Citizenship -510 -17%
4 Global Europe 561 +2%
5 Administration -22 -7%
TOTAL COMMISSION -32 721 -15%
The low level of implementation of commitment, linked to the delay of approval of the programmes
in shared management (rate of 76% for commitments) and the high implementation in payment
(rate of 99% for payments) explain the decrease. This decrease is however temporary as a
reprogramming of commitments of various Funds under shared management was proposed by the
Commission early 2015 and will create additional RAL in 2015. During the year 2014, the increase
of payment appropriations (through the amending budgets) and the de-commitments eliminated the
gap between commitments and payments of the initial voted budget.
24
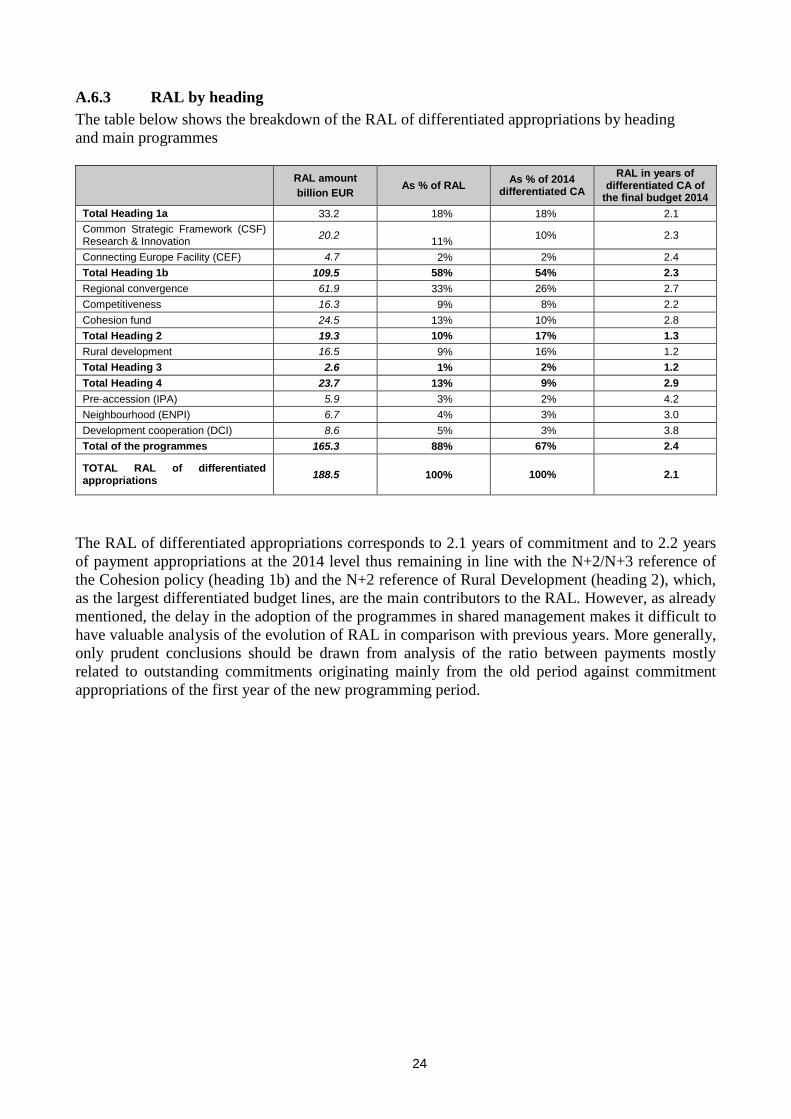
A.6.3 RAL by heading
The table below shows the breakdown of the RAL of differentiated appropriations by heading
and main programmes
RAL amount
billion EUR As % of RAL
As % of 2014 differentiated CA
RAL in years of differentiated CA of
the final budget 2014
Total Heading 1a 33.2 18% 18% 2.1
Common Strategic Framework (CSF) Research & Innovation
20.2 11%
10% 2.3
Connecting Europe Facility (CEF) 4.7 2% 2% 2.4
Total Heading 1b 109.5 58% 54% 2.3
Regional convergence 61.9 33% 26% 2.7
Competitiveness 16.3 9% 8% 2.2
Cohesion fund 24.5 13% 10% 2.8
Total Heading 2 19.3 10% 17% 1.3
Rural development 16.5 9% 16% 1.2
Total Heading 3 2.6 1% 2% 1.2
Total Heading 4 23.7 13% 9% 2.9
Pre-accession (IPA) 5.9 3% 2% 4.2
Neighbourhood (ENPI) 6.7 4% 3% 3.0
Development cooperation (DCI) 8.6 5% 3% 3.8
Total of the programmes 165.3 88% 67% 2.4
TOTAL RAL of differentiated appropriations
188.5 100% 100% 2.1
The RAL of differentiated appropriations corresponds to 2.1 years of commitment and to 2.2 years
of payment appropriations at the 2014 level thus remaining in line with the N+2/N+3 reference of
the Cohesion policy (heading 1b) and the N+2 reference of Rural Development (heading 2), which,
as the largest differentiated budget lines, are the main contributors to the RAL. However, as already
mentioned, the delay in the adoption of the programmes in shared management makes it difficult to
have valuable analysis of the evolution of RAL in comparison with previous years. More generally,
only prudent conclusions should be drawn from analysis of the ratio between payments mostly
related to outstanding commitments originating mainly from the old period against commitment
appropriations of the first year of the new programming period.
25
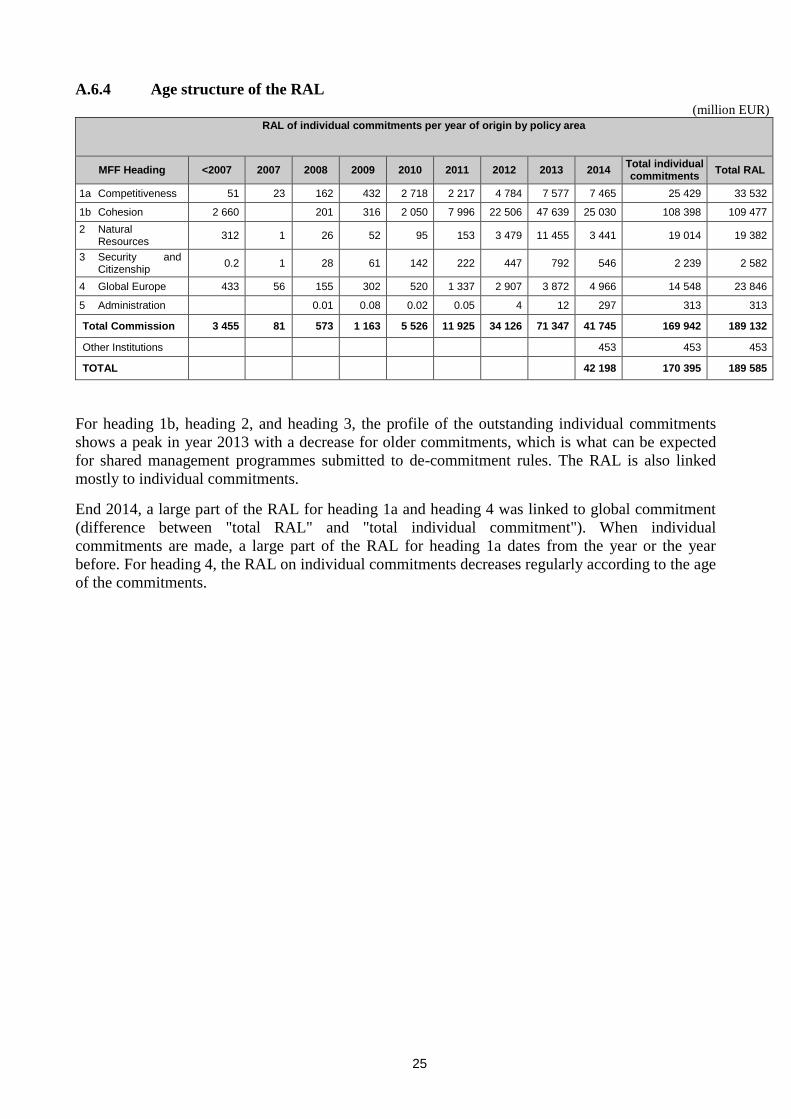
A.6.4 Age structure of the RAL
(million EUR) RAL of individual commitments per year of origin by policy area
MFF Heading <2007 2007 2008 2009 2010 2011 2012 2013 2014 Total individual commitments
Total RAL
1a Competitiveness 51 23 162 432 2 718 2 217 4 784 7 577 7 465 25 429 33 532
1b Cohesion 2 660 201 316 2 050 7 996 22 506 47 639 25 030 108 398 109 477
2 Natural Resources
312 1 26 52 95 153 3 479 11 455 3 441 19 014 19 382
3 Security and Citizenship
0.2 1 28 61 142 222 447 792 546 2 239 2 582
4 Global Europe 433 56 155 302 520 1 337 2 907 3 872 4 966 14 548 23 846
5 Administration 0.01 0.08 0.02 0.05 4 12 297 313 313
Total Commission 3 455 81 573 1 163 5 526 11 925 34 126 71 347 41 745 169 942 189 132
Other Institutions 453 453 453
TOTAL 42 198 170 395 189 585
For heading 1b, heading 2, and heading 3, the profile of the outstanding individual commitments
shows a peak in year 2013 with a decrease for older commitments, which is what can be expected
for shared management programmes submitted to de-commitment rules. The RAL is also linked
mostly to individual commitments.
End 2014, a large part of the RAL for heading 1a and heading 4 was linked to global commitment
(difference between "total RAL" and "total individual commitment"). When individual
commitments are made, a large part of the RAL for heading 1a dates from the year or the year
before. For heading 4, the RAL on individual commitments decreases regularly according to the age
of the commitments.

26
27
PART B - Overview: Budget 2014 by Heading

28
29
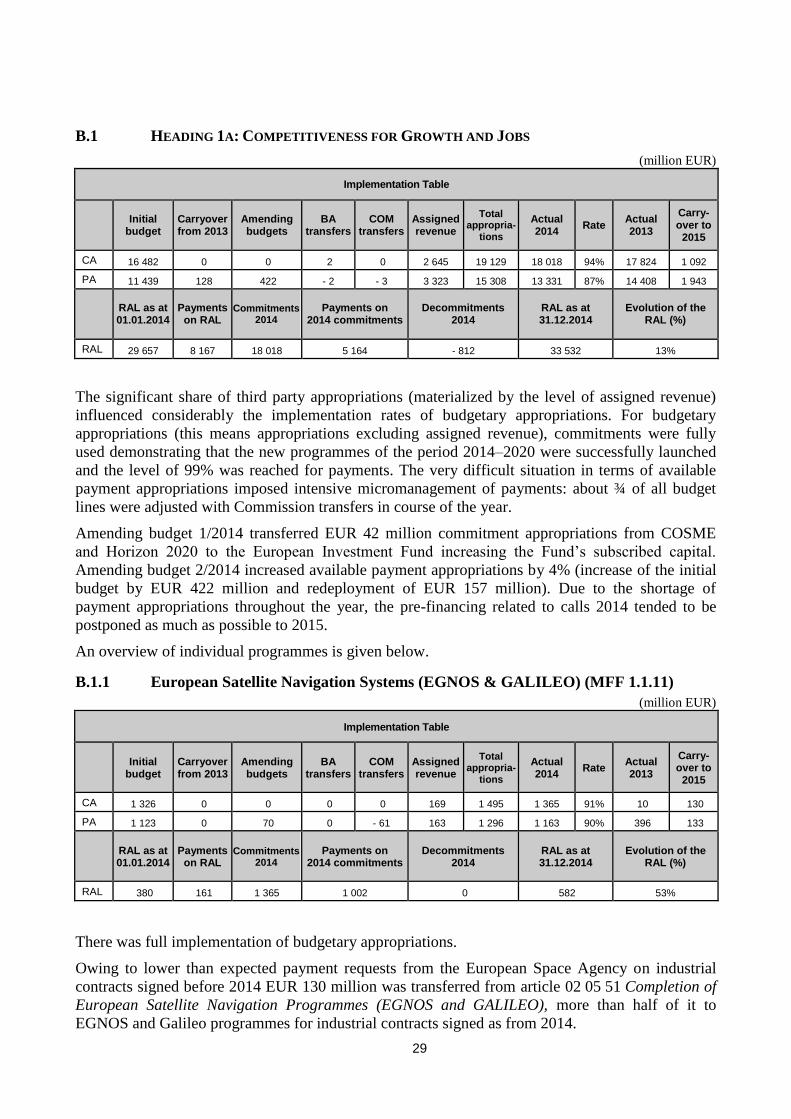
B.1 HEADING 1A: COMPETITIVENESS FOR GROWTH AND JOBS
(million EUR)
Implementation Table
Initial
budget Carryover from 2013
Amending budgets
BA transfers
COM transfers
Assigned revenue
Total appropria-
tions
Actual 2014
Rate Actual 2013
Carry-over to
2015
CA 16 482 0 0 2 0 2 645 19 129 18 018 94% 17 824 1 092
PA 11 439 128 422 - 2 - 3 3 323 15 308 13 331 87% 14 408 1 943
RAL as at 01.01.2014
Payments on RAL
Commitments 2014
Payments on 2014 commitments
Decommitments 2014
RAL as at 31.12.2014
Evolution of the RAL (%)
RAL 29 657 8 167 18 018 5 164 - 812 33 532 13%
The significant share of third party appropriations (materialized by the level of assigned revenue)
influenced considerably the implementation rates of budgetary appropriations. For budgetary
appropriations (this means appropriations excluding assigned revenue), commitments were fully
used demonstrating that the new programmes of the period 2014–2020 were successfully launched
and the level of 99% was reached for payments. The very difficult situation in terms of available
payment appropriations imposed intensive micromanagement of payments: about ¾ of all budget
lines were adjusted with Commission transfers in course of the year.
Amending budget 1/2014 transferred EUR 42 million commitment appropriations from COSME
and Horizon 2020 to the European Investment Fund increasing the Fund’s subscribed capital.
Amending budget 2/2014 increased available payment appropriations by 4% (increase of the initial
budget by EUR 422 million and redeployment of EUR 157 million). Due to the shortage of
payment appropriations throughout the year, the pre-financing related to calls 2014 tended to be
postponed as much as possible to 2015.
An overview of individual programmes is given below.
B.1.1 European Satellite Navigation Systems (EGNOS & GALILEO) (MFF 1.1.11)
(million EUR)
Implementation Table
Initial
budget Carryover from 2013
Amending budgets
BA transfers
COM transfers
Assigned revenue
Total appropria-
tions
Actual 2014
Rate Actual 2013
Carry-over to
2015
CA 1 326 0 0 0 0 169 1 495 1 365 91% 10 130
PA 1 123 0 70 0 - 61 163 1 296 1 163 90% 396 133
RAL as at 01.01.2014
Payments on RAL
Commitments 2014
Payments on 2014 commitments
Decommitments 2014
RAL as at 31.12.2014
Evolution of the RAL (%)
RAL 380 161 1 365 1 002 0 582 53%
There was full implementation of budgetary appropriations.
Owing to lower than expected payment requests from the European Space Agency on industrial
contracts signed before 2014 EUR 130 million was transferred from article 02 05 51 Completion of
European Satellite Navigation Programmes (EGNOS and GALILEO), more than half of it to
EGNOS and Galileo programmes for industrial contracts signed as from 2014.
30
(million EUR)
Cumulative Programme Table
Year
Pro
gra
mm
e
Allo
catio
n
Actu
al
Co
mm
itm
en
ts
Cu
mu
lati
ve
co
mm
itm
en
ts
Actu
al p
aym
en
ts
Cu
mu
lati
ve
paym
en
ts
Ou
tsta
nd
ing
co
mm
itm
en
ts o
f
cu
rren
t
pro
gra
mm
e
To
tal R
AL
of
the
deta
iled
MF
F
head
ing
Cu
rren
t P
rog
ram
me
sh
are
2014 1 326 1 326 977 349 582 60%
2015 1 061
2016 852
2017 899
2018 812
2019 756
2020 1 254
TOTAL 6 959
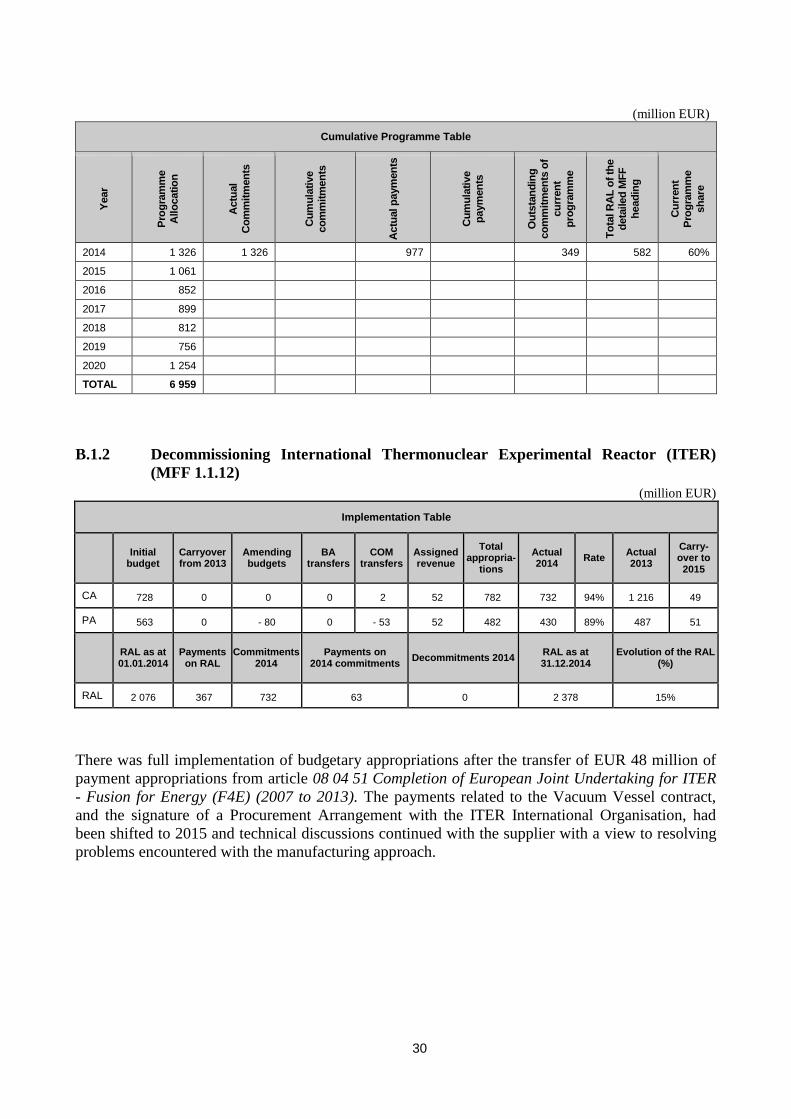
B.1.2 Decommissioning International Thermonuclear Experimental Reactor (ITER)
(MFF 1.1.12)
(million EUR)
Implementation Table
Initial
budget Carryover from 2013
Amending budgets
BA transfers
COM transfers
Assigned revenue
Total appropria-
tions
Actual 2014
Rate Actual 2013
Carry-over to 2015
CA 728 0 0 0 2 52 782 732 94% 1 216 49
PA 563 0 - 80 0 - 53 52 482 430 89% 487 51
RAL as at 01.01.2014
Payments on RAL
Commitments 2014
Payments on 2014 commitments
Decommitments 2014 RAL as at 31.12.2014
Evolution of the RAL (%)
RAL 2 076 367 732 63 0 2 378 15%
There was full implementation of budgetary appropriations after the transfer of EUR 48 million of
payment appropriations from article 08 04 51 Completion of European Joint Undertaking for ITER
- Fusion for Energy (F4E) (2007 to 2013). The payments related to the Vacuum Vessel contract,
and the signature of a Procurement Arrangement with the ITER International Organisation, had
been shifted to 2015 and technical discussions continued with the supplier with a view to resolving
problems encountered with the manufacturing approach.
31
(million EUR)
Cumulative Programme Table
Year
Pro
gra
mm
e
Allo
catio
n
Actu
al
Co
mm
itm
en
ts
Cu
mu
lati
ve
co
mm
itm
en
ts
Actu
al p
aym
en
ts
Cu
mu
lati
ve
paym
en
ts
Ou
tsta
nd
ing
co
mm
itm
en
ts o
f
cu
rren
t
pro
gra
mm
e
To
tal R
AL
of
the
deta
iled
MF
F
head
ing
Cu
rren
t P
rog
ram
me
sh
are
2014 730 730 62 668 2 378 28%
2015 892
2016 330
2017 327
2018 300
2019 272
2020 136
2 987
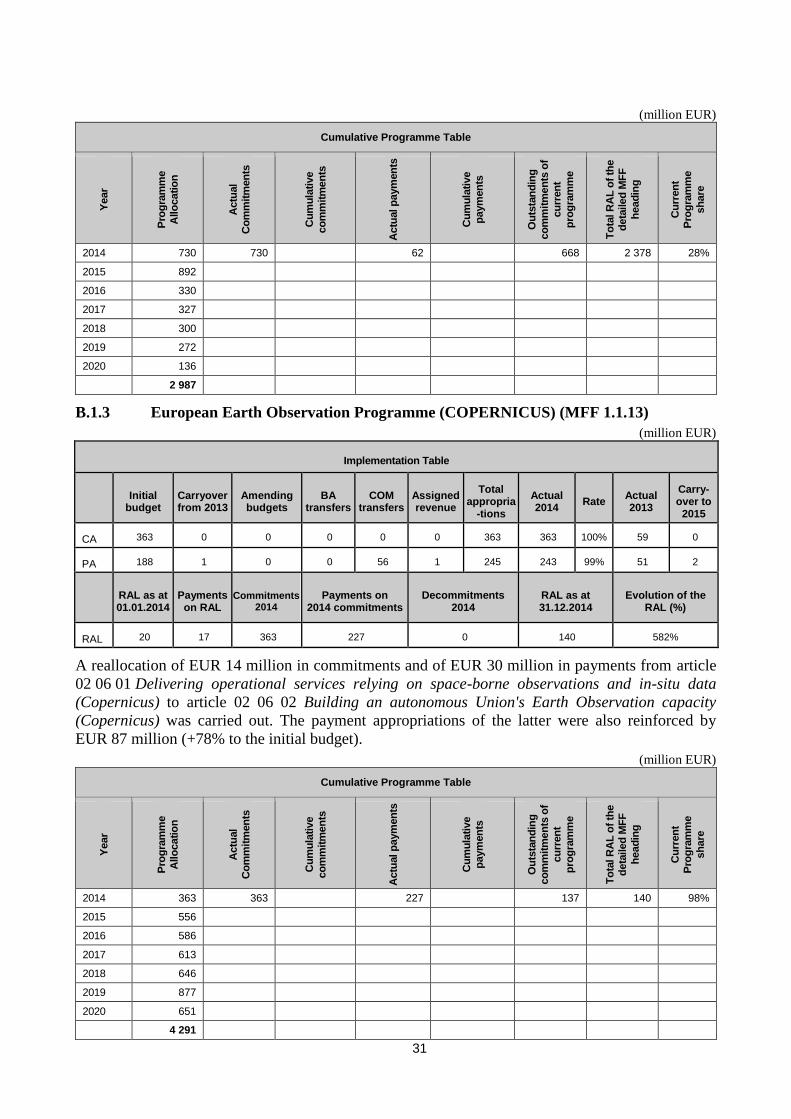
B.1.3 European Earth Observation Programme (COPERNICUS) (MFF 1.1.13)
(million EUR)
Implementation Table
Initial
budget Carryover from 2013
Amending budgets
BA transfers
COM transfers
Assigned revenue
Total appropria
-tions
Actual 2014
Rate Actual 2013
Carry-over to
2015
CA 363 0 0 0 0 0 363 363 100% 59 0
PA 188 1 0 0 56 1 245 243 99% 51 2
RAL as at 01.01.2014
Payments on RAL
Commitments 2014
Payments on 2014 commitments
Decommitments 2014
RAL as at 31.12.2014
Evolution of the RAL (%)
RAL 20 17 363 227 0 140 582%
A reallocation of EUR 14 million in commitments and of EUR 30 million in payments from article
02 06 01 Delivering operational services relying on space-borne observations and in-situ data
(Copernicus) to article 02 06 02 Building an autonomous Union's Earth Observation capacity
(Copernicus) was carried out. The payment appropriations of the latter were also reinforced by
EUR 87 million (+78% to the initial budget).
(million EUR)
Cumulative Programme Table
Year
Pro
gra
mm
e
Allo
catio
n
Actu
al
Co
mm
itm
en
ts
Cu
mu
lati
ve
co
mm
itm
en
ts
Actu
al p
aym
en
ts
Cu
mu
lati
ve
paym
en
ts
Ou
tsta
nd
ing
co
mm
itm
en
ts o
f
cu
rren
t
pro
gra
mm
e
To
tal R
AL
of
the
deta
iled
MF
F
head
ing
Cu
rren
t P
rog
ram
me
sh
are
2014 363 363 227 137 140 98%
2015 556
2016 586
2017 613
2018 646
2019 877
2020 651
4 291
32
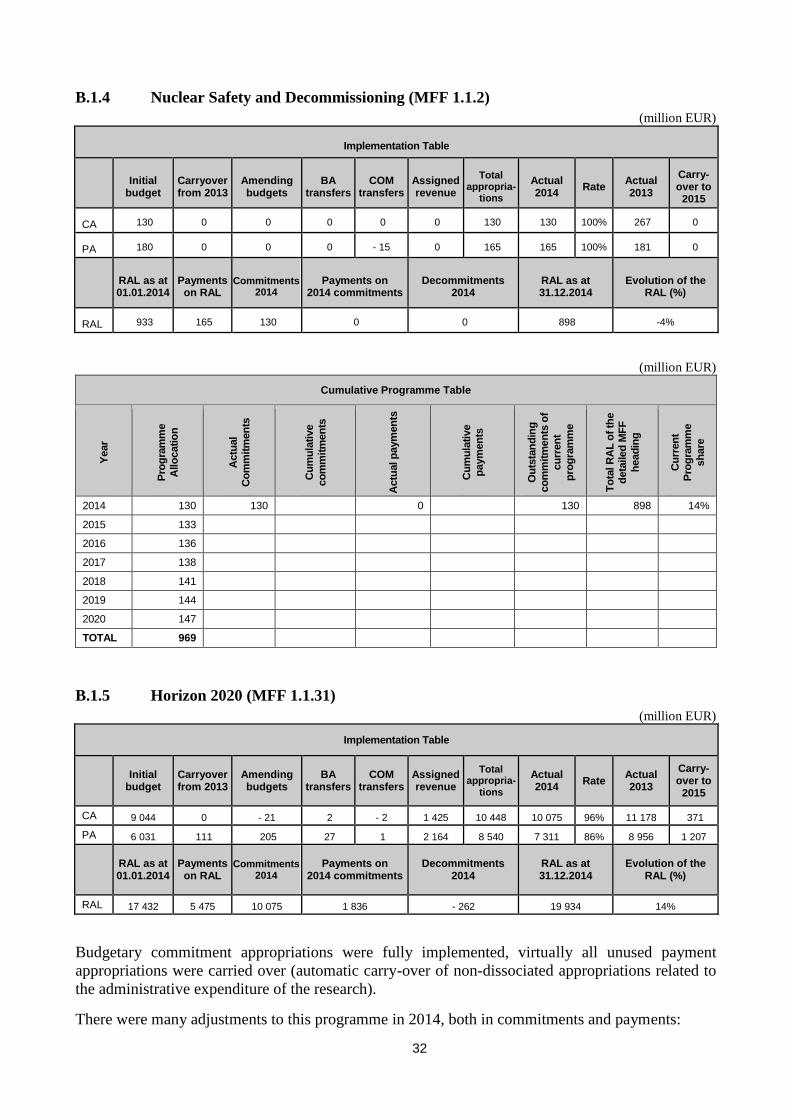
B.1.4 Nuclear Safety and Decommissioning (MFF 1.1.2)
(million EUR)
Implementation Table
Initial
budget Carryover from 2013
Amending budgets
BA transfers
COM transfers
Assigned revenue
Total appropria-
tions
Actual 2014
Rate Actual 2013
Carry-over to
2015
CA 130 0 0 0 0 0 130 130 100% 267 0
PA 180 0 0 0 - 15 0 165 165 100% 181 0
RAL as at 01.01.2014
Payments on RAL
Commitments 2014
Payments on 2014 commitments
Decommitments 2014
RAL as at 31.12.2014
Evolution of the RAL (%)
RAL 933 165 130 0 0 898 -4%
(million EUR)
Cumulative Programme Table
Year
Pro
gra
mm
e
Allo
catio
n
Actu
al
Co
mm
itm
en
ts
Cu
mu
lati
ve
co
mm
itm
en
ts
Actu
al p
aym
en
ts
Cu
mu
lati
ve
paym
en
ts
Ou
tsta
nd
ing
co
mm
itm
en
ts o
f
cu
rren
t
pro
gra
mm
e
To
tal R
AL
of
the
deta
iled
MF
F
head
ing
Cu
rren
t P
rog
ram
me
sh
are
2014 130 130 0 130 898 14%
2015 133
2016 136
2017 138
2018 141
2019 144
2020 147
TOTAL 969
B.1.5 Horizon 2020 (MFF 1.1.31)
(million EUR)
Implementation Table
Initial
budget Carryover from 2013
Amending budgets
BA transfers
COM transfers
Assigned revenue
Total appropria-
tions
Actual 2014
Rate Actual 2013
Carry-over to
2015
CA 9 044 0 - 21 2 - 2 1 425 10 448 10 075 96% 11 178 371
PA 6 031 111 205 27 1 2 164 8 540 7 311 86% 8 956 1 207
RAL as at 01.01.2014
Payments on RAL
Commitments 2014
Payments on 2014 commitments
Decommitments 2014
RAL as at 31.12.2014
Evolution of the RAL (%)
RAL 17 432 5 475 10 075 1 836 - 262 19 934 14%
Budgetary commitment appropriations were fully implemented, virtually all unused payment
appropriations were carried over (automatic carry-over of non-dissociated appropriations related to
the administrative expenditure of the research).
There were many adjustments to this programme in 2014, both in commitments and payments:
33
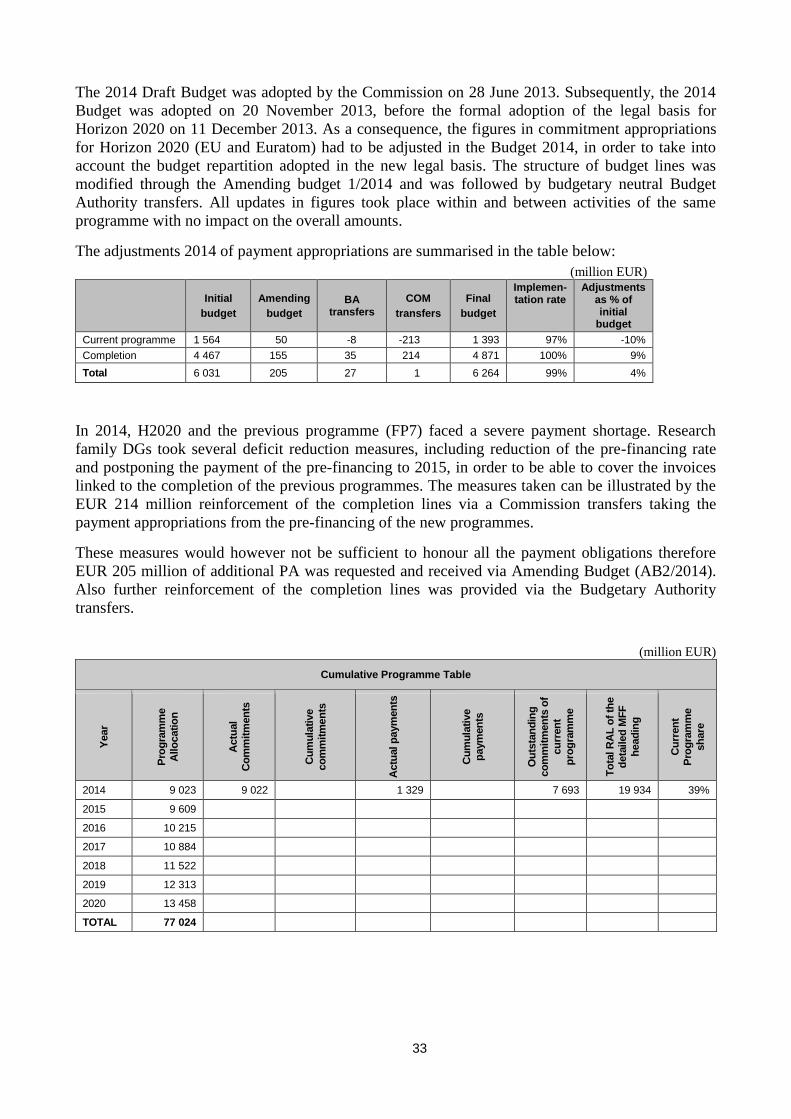
The 2014 Draft Budget was adopted by the Commission on 28 June 2013. Subsequently, the 2014
Budget was adopted on 20 November 2013, before the formal adoption of the legal basis for
Horizon 2020 on 11 December 2013. As a consequence, the figures in commitment appropriations
for Horizon 2020 (EU and Euratom) had to be adjusted in the Budget 2014, in order to take into
account the budget repartition adopted in the new legal basis. The structure of budget lines was
modified through the Amending budget 1/2014 and was followed by budgetary neutral Budget
Authority transfers. All updates in figures took place within and between activities of the same
programme with no impact on the overall amounts.
The adjustments 2014 of payment appropriations are summarised in the table below:
(million EUR)
Initial
budget
Amending
budget
BA transfers
COM
transfers
Final
budget
Implemen-tation rate
Adjustments as % of initial
budget
Current programme 1 564 50 -8 -213 1 393 97% -10%
Completion 4 467 155 35 214 4 871 100% 9%
Total 6 031 205 27 1 6 264 99% 4%
In 2014, H2020 and the previous programme (FP7) faced a severe payment shortage. Research
family DGs took several deficit reduction measures, including reduction of the pre-financing rate
and postponing the payment of the pre-financing to 2015, in order to be able to cover the invoices
linked to the completion of the previous programmes. The measures taken can be illustrated by the
EUR 214 million reinforcement of the completion lines via a Commission transfers taking the
payment appropriations from the pre-financing of the new programmes.
These measures would however not be sufficient to honour all the payment obligations therefore
EUR 205 million of additional PA was requested and received via Amending Budget (AB2/2014).
Also further reinforcement of the completion lines was provided via the Budgetary Authority
transfers.
(million EUR)
Cumulative Programme Table
Year
Pro
gra
mm
e
Allo
catio
n
Actu
al
Co
mm
itm
en
ts
Cu
mu
lati
ve
co
mm
itm
en
ts
Actu
al p
aym
en
ts
Cu
mu
lati
ve
paym
en
ts
Ou
tsta
nd
ing
co
mm
itm
en
ts o
f
cu
rren
t
pro
gra
mm
e
To
tal R
AL
of
the
deta
iled
MF
F
head
ing
Cu
rren
t P
rog
ram
me
sh
are
2014 9 023 9 022 1 329 7 693 19 934 39%
2015 9 609
2016 10 215
2017 10 884
2018 11 522
2019 12 313
2020 13 458
TOTAL 77 024
34
B.1.6 Euratom Research and Training Programme (MFF 1.1.32)
(million EUR)
Implementation Table
Initial
budget Carryover from 2013
Amending budgets
BA transfers
COM transfers
Assigned revenue
Total appropria
-tions
Actual 2014
Rate Actual 2013
Carry-over to
2015
CA 287 0 0 - 2 0 80 365 344 94% 522 21
PA 248 0 0 - 21 50 108 385 325 84% 456 61
RAL as at 01.01.2014
Payments on RAL
Commitments 2014
Payments on 2014 commitments
Decommitments 2014
RAL as at 31.12.2014
Evolution of the RAL (%)
RAL 179 77 344 248 - 6 192 7%
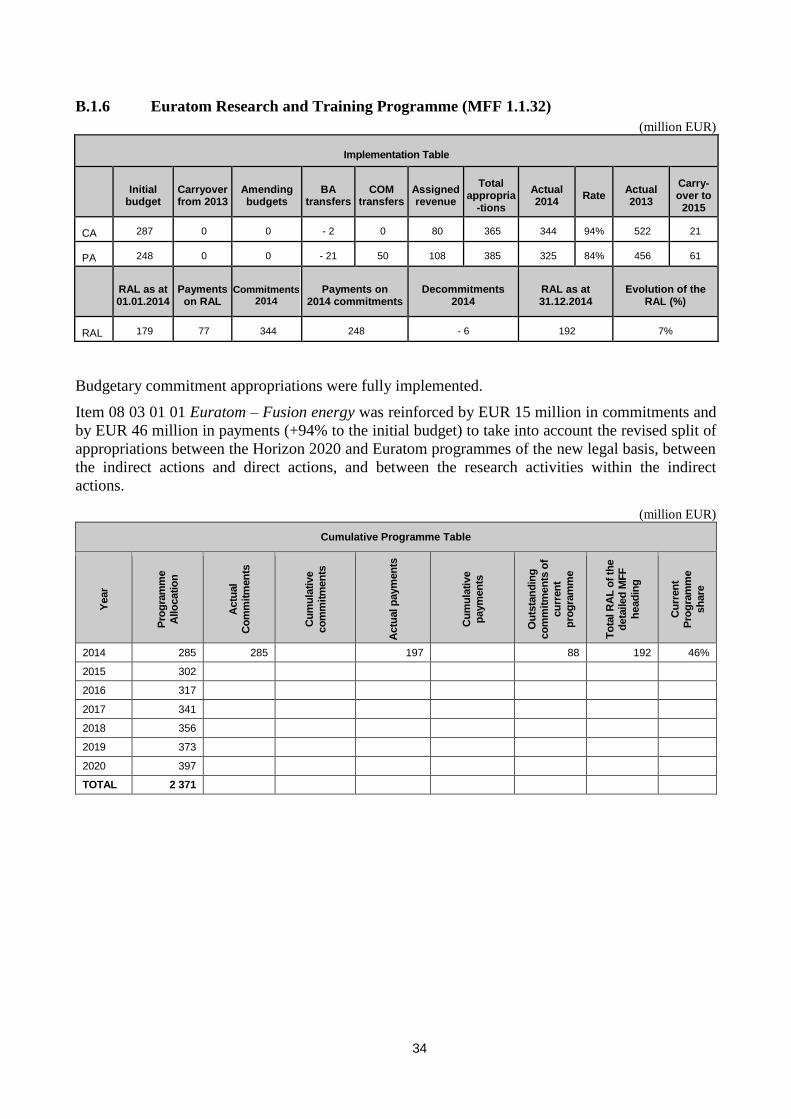
Budgetary commitment appropriations were fully implemented.
Item 08 03 01 01 Euratom – Fusion energy was reinforced by EUR 15 million in commitments and
by EUR 46 million in payments (+94% to the initial budget) to take into account the revised split of
appropriations between the Horizon 2020 and Euratom programmes of the new legal basis, between
the indirect actions and direct actions, and between the research activities within the indirect
actions.
(million EUR)
Cumulative Programme Table
Year
Pro
gra
mm
e
Allo
catio
n
Actu
al
Co
mm
itm
en
ts
Cu
mu
lati
ve
co
mm
itm
en
ts
Actu
al p
aym
en
ts
Cu
mu
lati
ve
paym
en
ts
Ou
tsta
nd
ing
co
mm
itm
en
ts o
f
cu
rren
t
pro
gra
mm
e
To
tal R
AL
of
the
deta
iled
MF
F
head
ing
Cu
rren
t P
rog
ram
me
sh
are
2014 285 285 197 88 192 46%
2015 302
2016 317
2017 341
2018 356
2019 373
2020 397
TOTAL 2 371
35
B.1.7 Competitiveness of enterprises and small and medium-sized enterprises (COSME)
(MFF 1.1.4)
(million EUR)
Implementation Table
Initial
budget Carryover from 2013
Amending budgets
BA transfers
COM transfers
Assigned revenue
Total appropria
-tions
Actual 2014
Rate Actual 2013
Carry-over to
2015
CA 275 0 - 21 0 0 6 260 258 99% 360 2
PA 233 3 - 5 0 2 15 248 237 96% 275 10
RAL as at 01.01.2014
Payments on RAL
Commitments 2014
Payments on 2014 commitments
Decommitments 2014
RAL as at 31.12.2014
Evolution of the RAL (%)
RAL 849 147 258 90 - 3 867 2%
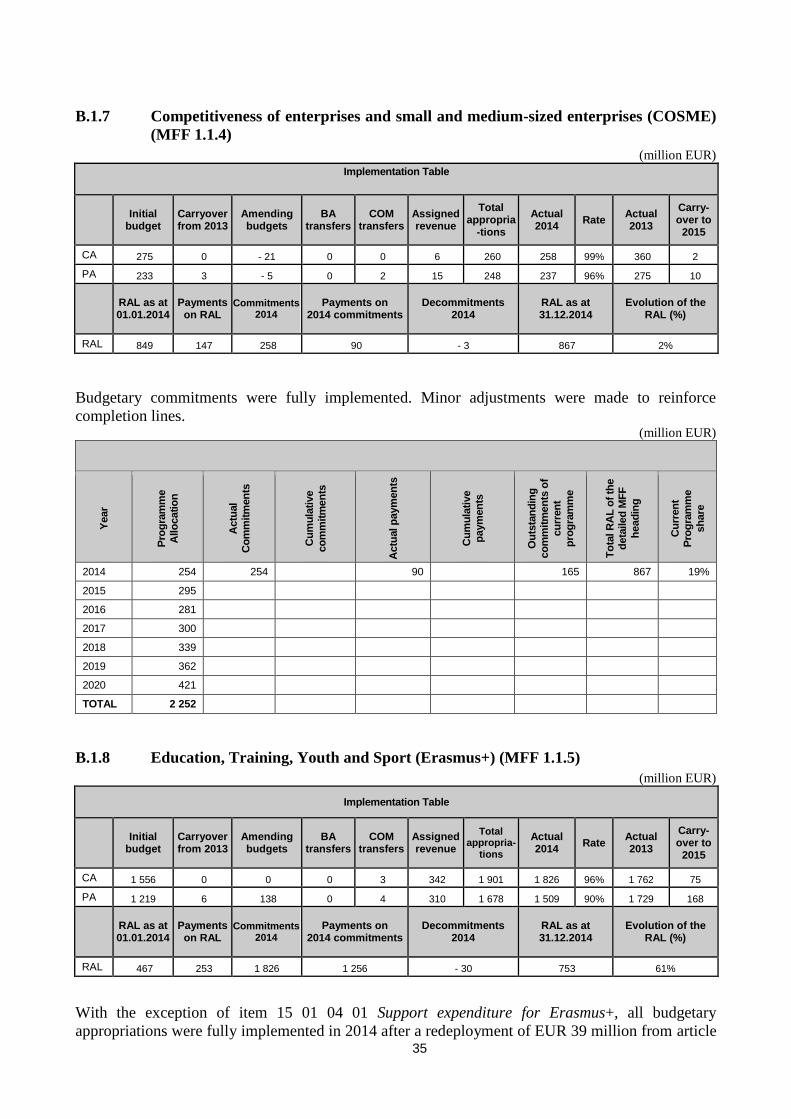
Budgetary commitments were fully implemented. Minor adjustments were made to reinforce
completion lines. (million EUR)
Year
Pro
gra
mm
e
Allo
catio
n
Actu
al
Co
mm
itm
en
ts
Cu
mu
lati
ve
co
mm
itm
en
ts
Actu
al p
aym
en
ts
Cu
mu
lati
ve
paym
en
ts
Ou
tsta
nd
ing
co
mm
itm
en
ts o
f
cu
rren
t
pro
gra
mm
e
To
tal R
AL
of
the
deta
iled
MF
F
head
ing
Cu
rren
t P
rog
ram
me
sh
are
2014 254 254 90 165 867 19%
2015 295
2016 281
2017 300
2018 339
2019 362
2020 421
TOTAL 2 252
B.1.8 Education, Training, Youth and Sport (Erasmus+) (MFF 1.1.5)
(million EUR)
Implementation Table
Initial
budget Carryover from 2013
Amending budgets
BA transfers
COM transfers
Assigned revenue
Total appropria-
tions
Actual 2014
Rate Actual 2013
Carry-over to
2015
CA 1 556 0 0 0 3 342 1 901 1 826 96% 1 762 75
PA 1 219 6 138 0 4 310 1 678 1 509 90% 1 729 168
RAL as at 01.01.2014
Payments on RAL
Commitments 2014
Payments on 2014 commitments
Decommitments 2014
RAL as at 31.12.2014
Evolution of the RAL (%)
RAL 467 253 1 826 1 256 - 30 753 61%
With the exception of item 15 01 04 01 Support expenditure for Erasmus+, all budgetary
appropriations were fully implemented in 2014 after a redeployment of EUR 39 million from article
36
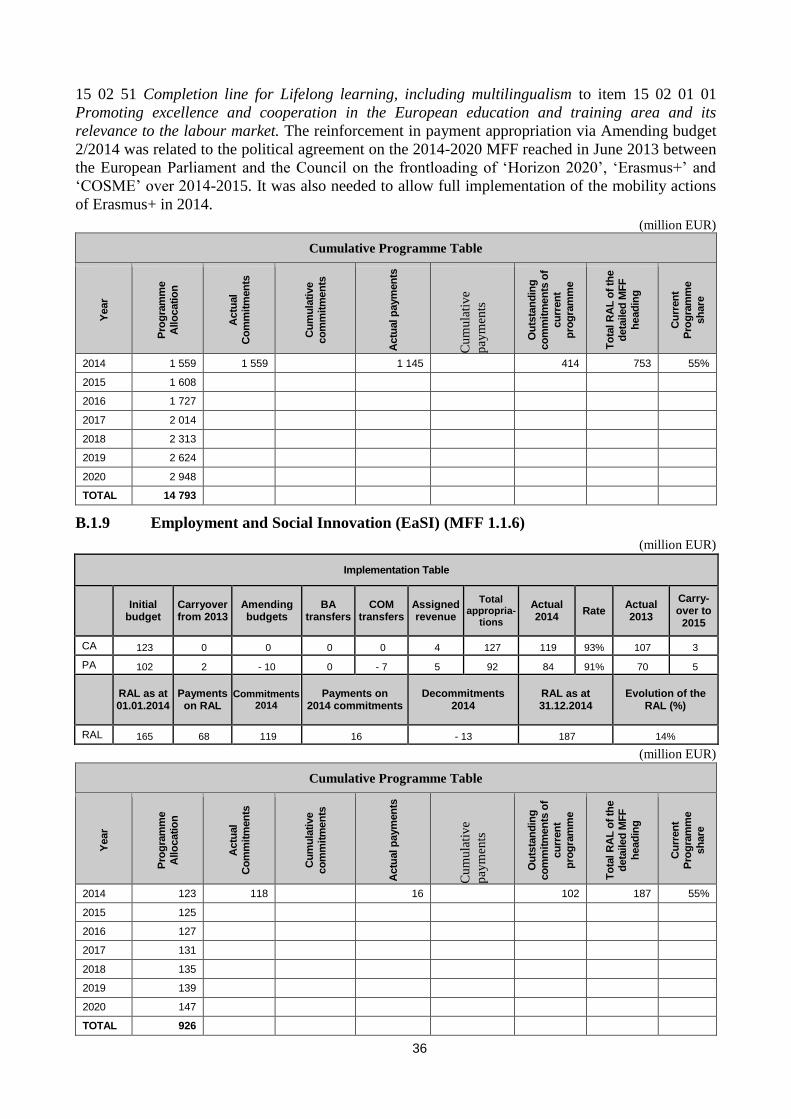
15 02 51 Completion line for Lifelong learning, including multilingualism to item 15 02 01 01
Promoting excellence and cooperation in the European education and training area and its
relevance to the labour market. The reinforcement in payment appropriation via Amending budget
2/2014 was related to the political agreement on the 2014-2020 MFF reached in June 2013 between
the European Parliament and the Council on the frontloading of ‘Horizon 2020’, ‘Erasmus+’ and
‘COSME’ over 2014-2015. It was also needed to allow full implementation of the mobility actions
of Erasmus+ in 2014.
(million EUR)
Cumulative Programme Table
Year
Pro
gra
mm
e
Allo
catio
n
Actu
al
Co
mm
itm
en
ts
Cu
mu
lati
ve
co
mm
itm
en
ts
Actu
al p
aym
en
ts
Cu
mu
lati
ve
pay
men
ts
Ou
tsta
nd
ing
co
mm
itm
en
ts o
f
cu
rren
t
pro
gra
mm
e
To
tal R
AL
of
the
deta
iled
MF
F
head
ing
Cu
rren
t P
rog
ram
me
sh
are
2014 1 559 1 559 1 145 414 753 55%
2015 1 608
2016 1 727
2017 2 014
2018 2 313
2019 2 624
2020 2 948
TOTAL 14 793
B.1.9 Employment and Social Innovation (EaSI) (MFF 1.1.6)
(million EUR)
Implementation Table
Initial
budget Carryover from 2013
Amending budgets
BA transfers
COM transfers
Assigned revenue
Total appropria-
tions
Actual 2014
Rate Actual 2013
Carry-over to
2015
CA 123 0 0 0 0 4 127 119 93% 107 3
PA 102 2 - 10 0 - 7 5 92 84 91% 70 5
RAL as at 01.01.2014
Payments on RAL
Commitments 2014
Payments on 2014 commitments
Decommitments 2014
RAL as at 31.12.2014
Evolution of the RAL (%)
RAL 165 68 119 16 - 13 187 14%
(million EUR)
Cumulative Programme Table
Year
Pro
gra
mm
e
Allo
catio
n
Actu
al
Co
mm
itm
en
ts
Cu
mu
lati
ve
co
mm
itm
en
ts
Actu
al p
aym
en
ts
Cu
mu
lati
ve
pay
men
ts
Ou
tsta
nd
ing
co
mm
itm
en
ts o
f
cu
rren
t
pro
gra
mm
e
To
tal R
AL
of
the
deta
iled
MF
F
head
ing
Cu
rren
t P
rog
ram
me
sh
are
2014 123 118 16 102 187 55%
2015 125
2016 127
2017 131
2018 135
2019 139
2020 147
TOTAL 926
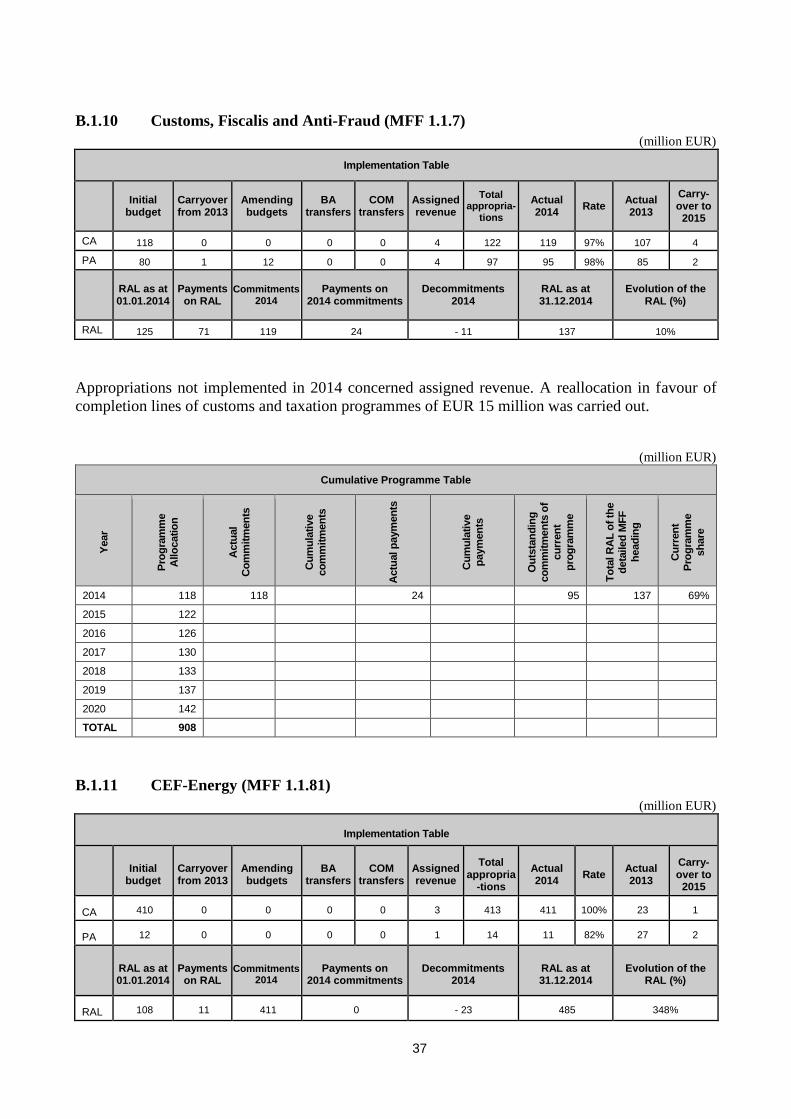
37
B.1.10 Customs, Fiscalis and Anti-Fraud (MFF 1.1.7)
(million EUR)
Implementation Table
Initial
budget Carryover from 2013
Amending budgets
BA transfers
COM transfers
Assigned revenue
Total appropria-
tions
Actual 2014
Rate Actual 2013
Carry-over to
2015
CA 118 0 0 0 0 4 122 119 97% 107 4
PA 80 1 12 0 0 4 97 95 98% 85 2
RAL as at 01.01.2014
Payments on RAL
Commitments 2014
Payments on 2014 commitments
Decommitments 2014
RAL as at 31.12.2014
Evolution of the RAL (%)
RAL 125 71 119 24 - 11 137 10%
Appropriations not implemented in 2014 concerned assigned revenue. A reallocation in favour of
completion lines of customs and taxation programmes of EUR 15 million was carried out.
(million EUR)
Cumulative Programme Table
Year
Pro
gra
mm
e
Allo
catio
n
Actu
al
Co
mm
itm
en
ts
Cu
mu
lati
ve
co
mm
itm
en
ts
Actu
al p
aym
en
ts
Cu
mu
lati
ve
paym
en
ts
Ou
tsta
nd
ing
co
mm
itm
en
ts o
f
cu
rren
t
pro
gra
mm
e
To
tal R
AL
of
the
deta
iled
MF
F
head
ing
Cu
rren
t P
rog
ram
me
sh
are
2014 118 118 24 95 137 69%
2015 122
2016 126
2017 130
2018 133
2019 137
2020 142
TOTAL 908
B.1.11 CEF-Energy (MFF 1.1.81)
(million EUR)
Implementation Table
Initial
budget Carryover from 2013
Amending budgets
BA transfers
COM transfers
Assigned revenue
Total appropria
-tions
Actual 2014
Rate Actual 2013
Carry-over to
2015
CA 410 0 0 0 0 3 413 411 100% 23 1
PA 12 0 0 0 0 1 14 11 82% 27 2
RAL as at 01.01.2014
Payments on RAL
Commitments 2014
Payments on 2014 commitments
Decommitments 2014
RAL as at 31.12.2014
Evolution of the RAL (%)
RAL 108 11 411 0 - 23 485 348%
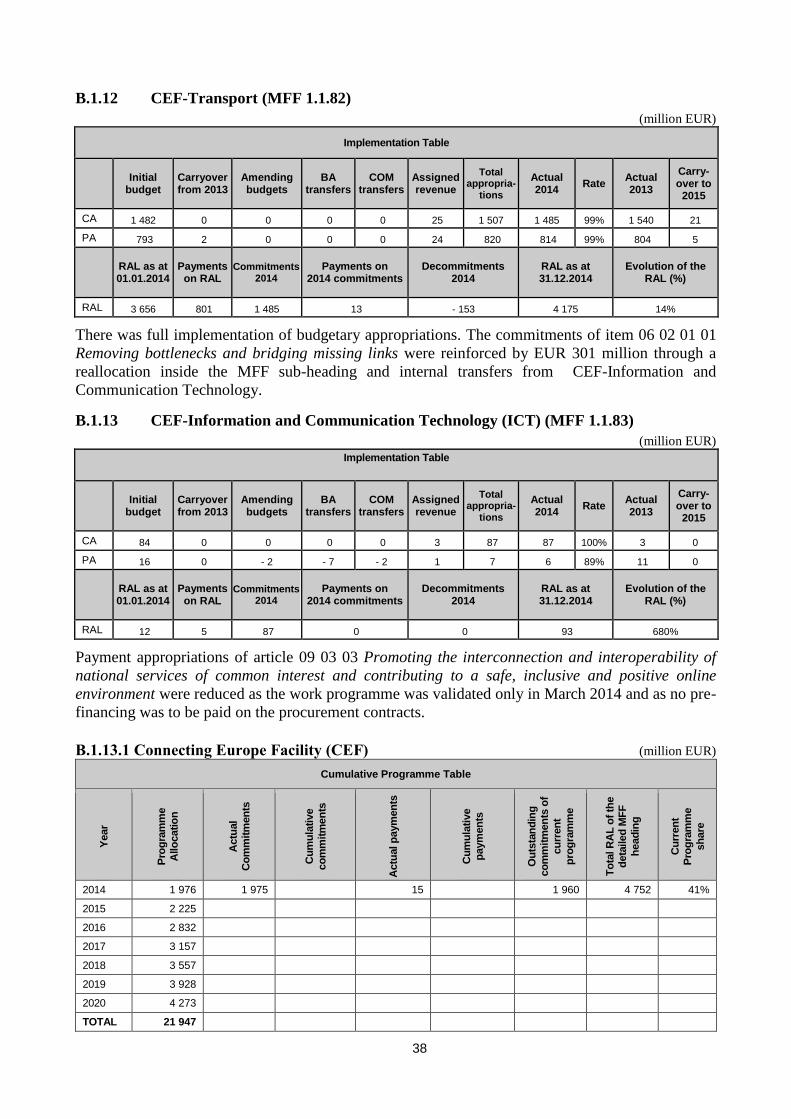
38
B.1.12 CEF-Transport (MFF 1.1.82)
(million EUR)
Implementation Table
Initial
budget Carryover from 2013
Amending budgets
BA transfers
COM transfers
Assigned revenue
Total appropria-
tions
Actual 2014
Rate Actual 2013
Carry-over to
2015
CA 1 482 0 0 0 0 25 1 507 1 485 99% 1 540 21
PA 793 2 0 0 0 24 820 814 99% 804 5
RAL as at 01.01.2014
Payments on RAL
Commitments 2014
Payments on 2014 commitments
Decommitments 2014
RAL as at 31.12.2014
Evolution of the RAL (%)
RAL 3 656 801 1 485 13 - 153 4 175 14%
There was full implementation of budgetary appropriations. The commitments of item 06 02 01 01
Removing bottlenecks and bridging missing links were reinforced by EUR 301 million through a
reallocation inside the MFF sub-heading and internal transfers from CEF-Information and
Communication Technology.
B.1.13 CEF-Information and Communication Technology (ICT) (MFF 1.1.83)
(million EUR) Implementation Table
Initial
budget Carryover from 2013
Amending budgets
BA transfers
COM transfers
Assigned revenue
Total appropria-
tions
Actual 2014
Rate Actual 2013
Carry-over to
2015
CA 84 0 0 0 0 3 87 87 100% 3 0
PA 16 0 - 2 - 7 - 2 1 7 6 89% 11 0
RAL as at 01.01.2014
Payments on RAL
Commitments 2014
Payments on 2014 commitments
Decommitments 2014
RAL as at 31.12.2014
Evolution of the RAL (%)
RAL 12 5 87 0 0 93 680%
Payment appropriations of article 09 03 03 Promoting the interconnection and interoperability of
national services of common interest and contributing to a safe, inclusive and positive online
environment were reduced as the work programme was validated only in March 2014 and as no pre-
financing was to be paid on the procurement contracts.
B.1.13.1 Connecting Europe Facility (CEF) (million EUR)
Cumulative Programme Table
Year
Pro
gra
mm
e
Allo
catio
n
Actu
al
Co
mm
itm
en
ts
Cu
mu
lati
ve
co
mm
itm
en
ts
Actu
al p
aym
en
ts
Cu
mu
lati
ve
paym
en
ts
Ou
tsta
nd
ing
co
mm
itm
en
ts o
f
cu
rren
t
pro
gra
mm
e
To
tal R
AL
of
the
deta
iled
MF
F
head
ing
Cu
rren
t P
rog
ram
me
sh
are
2014 1 976 1 975 15 1 960 4 752 41%
2015 2 225
2016 2 832
2017 3 157
2018 3 557
2019 3 928
2020 4 273
TOTAL 21 947
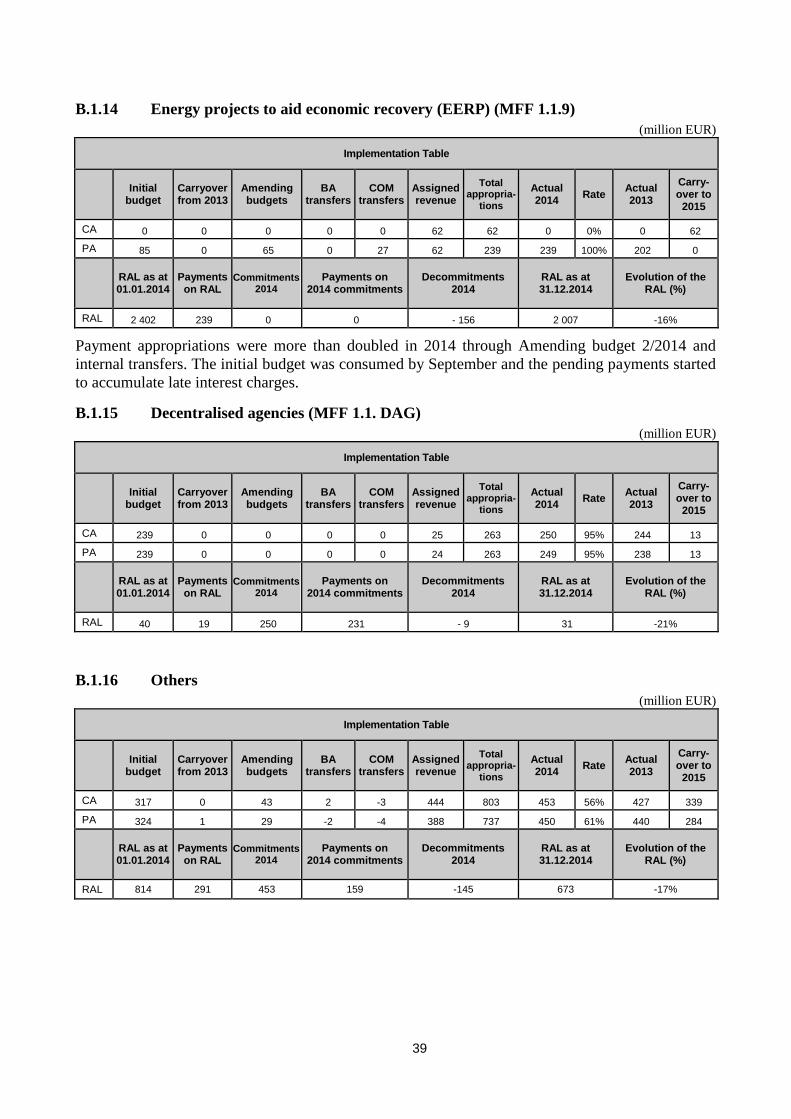
39
B.1.14 Energy projects to aid economic recovery (EERP) (MFF 1.1.9)
(million EUR)
Implementation Table
Initial
budget Carryover from 2013
Amending budgets
BA transfers
COM transfers
Assigned revenue
Total appropria-
tions
Actual 2014
Rate Actual 2013
Carry-over to
2015
CA 0 0 0 0 0 62 62 0 0% 0 62
PA 85 0 65 0 27 62 239 239 100% 202 0
RAL as at 01.01.2014
Payments on RAL
Commitments 2014
Payments on 2014 commitments
Decommitments 2014
RAL as at 31.12.2014
Evolution of the RAL (%)
RAL 2 402 239 0 0 - 156 2 007 -16%
Payment appropriations were more than doubled in 2014 through Amending budget 2/2014 and
internal transfers. The initial budget was consumed by September and the pending payments started
to accumulate late interest charges.
B.1.15 Decentralised agencies (MFF 1.1. DAG)
(million EUR)
Implementation Table
Initial
budget Carryover from 2013
Amending budgets
BA transfers
COM transfers
Assigned revenue
Total appropria-
tions
Actual 2014
Rate Actual 2013
Carry-over to
2015
CA 239 0 0 0 0 25 263 250 95% 244 13
PA 239 0 0 0 0 24 263 249 95% 238 13
RAL as at 01.01.2014
Payments on RAL
Commitments 2014
Payments on 2014 commitments
Decommitments 2014
RAL as at 31.12.2014
Evolution of the RAL (%)
RAL 40 19 250 231 - 9 31 -21%
B.1.16 Others
(million EUR)
Implementation Table
Initial
budget Carryover from 2013
Amending budgets
BA transfers
COM transfers
Assigned revenue
Total appropria-
tions
Actual 2014
Rate Actual 2013
Carry-over to
2015
CA 317 0 43 2 -3 444 803 453 56% 427 339
PA 324 1 29 -2 -4 388 737 450 61% 440 284
RAL as at 01.01.2014
Payments on RAL
Commitments 2014
Payments on 2014 commitments
Decommitments 2014
RAL as at 31.12.2014
Evolution of the RAL (%)
RAL 814 291 453 159 -145 673 -17%
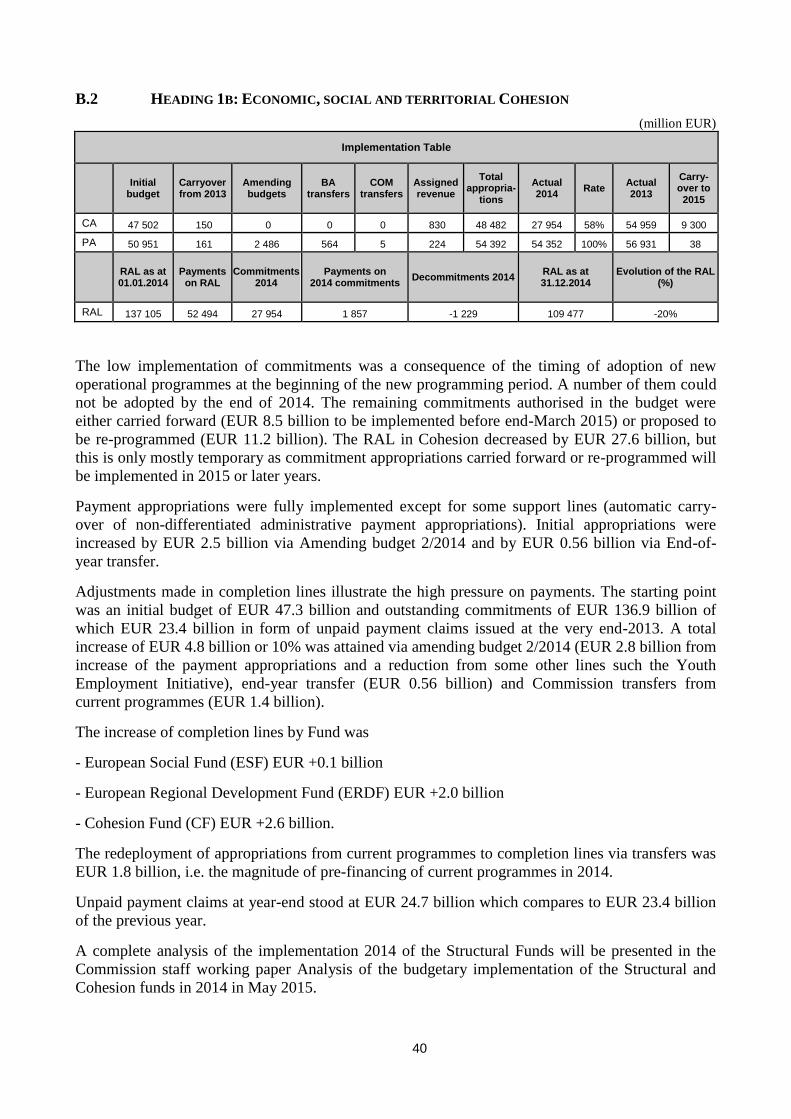
40
B.2 HEADING 1B: ECONOMIC, SOCIAL AND TERRITORIAL COHESION
(million EUR)
Implementation Table
Initial
budget Carryover from 2013
Amending budgets
BA transfers
COM transfers
Assigned revenue
Total appropria-
tions
Actual 2014
Rate Actual 2013
Carry-over to 2015
CA 47 502 150 0 0 0 830 48 482 27 954 58% 54 959 9 300
PA 50 951 161 2 486 564 5 224 54 392 54 352 100% 56 931 38
RAL as at 01.01.2014
Payments on RAL
Commitments 2014
Payments on 2014 commitments
Decommitments 2014 RAL as at 31.12.2014
Evolution of the RAL (%)
RAL 137 105 52 494 27 954 1 857 -1 229 109 477 -20%
The low implementation of commitments was a consequence of the timing of adoption of new
operational programmes at the beginning of the new programming period. A number of them could
not be adopted by the end of 2014. The remaining commitments authorised in the budget were
either carried forward (EUR 8.5 billion to be implemented before end-March 2015) or proposed to
be re-programmed (EUR 11.2 billion). The RAL in Cohesion decreased by EUR 27.6 billion, but
this is only mostly temporary as commitment appropriations carried forward or re-programmed will
be implemented in 2015 or later years.
Payment appropriations were fully implemented except for some support lines (automatic carry-
over of non-differentiated administrative payment appropriations). Initial appropriations were
increased by EUR 2.5 billion via Amending budget 2/2014 and by EUR 0.56 billion via End-of-
year transfer.
Adjustments made in completion lines illustrate the high pressure on payments. The starting point
was an initial budget of EUR 47.3 billion and outstanding commitments of EUR 136.9 billion of
which EUR 23.4 billion in form of unpaid payment claims issued at the very end-2013. A total
increase of EUR 4.8 billion or 10% was attained via amending budget 2/2014 (EUR 2.8 billion from
increase of the payment appropriations and a reduction from some other lines such the Youth
Employment Initiative), end-year transfer (EUR 0.56 billion) and Commission transfers from
current programmes (EUR 1.4 billion).
The increase of completion lines by Fund was
- European Social Fund (ESF) EUR +0.1 billion
- European Regional Development Fund (ERDF) EUR +2.0 billion
- Cohesion Fund (CF) EUR +2.6 billion.
The redeployment of appropriations from current programmes to completion lines via transfers was
EUR 1.8 billion, i.e. the magnitude of pre-financing of current programmes in 2014.
Unpaid payment claims at year-end stood at EUR 24.7 billion which compares to EUR 23.4 billion
of the previous year.
A complete analysis of the implementation 2014 of the Structural Funds will be presented in the
Commission staff working paper Analysis of the budgetary implementation of the Structural and
Cohesion funds in 2014 in May 2015.
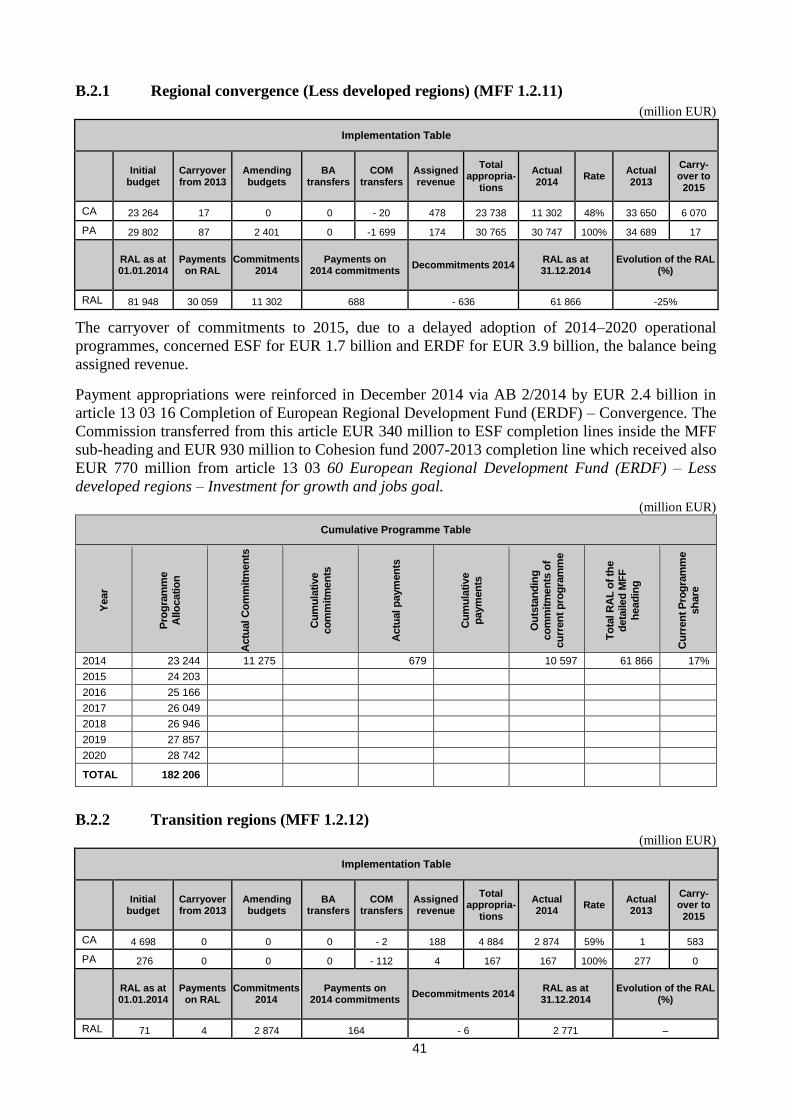
41
B.2.1 Regional convergence (Less developed regions) (MFF 1.2.11)
(million EUR)
Implementation Table
Initial
budget Carryover from 2013
Amending budgets
BA transfers
COM transfers
Assigned revenue
Total appropria-
tions
Actual 2014
Rate Actual 2013
Carry-over to 2015
CA 23 264 17 0 0 - 20 478 23 738 11 302 48% 33 650 6 070
PA 29 802 87 2 401 0 -1 699 174 30 765 30 747 100% 34 689 17
RAL as at 01.01.2014
Payments on RAL
Commitments 2014
Payments on 2014 commitments
Decommitments 2014 RAL as at 31.12.2014
Evolution of the RAL (%)
RAL 81 948 30 059 11 302 688 - 636 61 866 -25%
The carryover of commitments to 2015, due to a delayed adoption of 2014–2020 operational
programmes, concerned ESF for EUR 1.7 billion and ERDF for EUR 3.9 billion, the balance being
assigned revenue.
Payment appropriations were reinforced in December 2014 via AB 2/2014 by EUR 2.4 billion in
article 13 03 16 Completion of European Regional Development Fund (ERDF) – Convergence. The
Commission transferred from this article EUR 340 million to ESF completion lines inside the MFF
sub-heading and EUR 930 million to Cohesion fund 2007-2013 completion line which received also
EUR 770 million from article 13 03 60 European Regional Development Fund (ERDF) – Less
developed regions – Investment for growth and jobs goal.
(million EUR)
Cumulative Programme Table
Year
Pro
gra
mm
e
Allo
catio
n
Actu
al C
om
mit
men
ts
Cu
mu
lati
ve
co
mm
itm
en
ts
Actu
al p
aym
en
ts
Cu
mu
lati
ve
paym
en
ts
Ou
tsta
nd
ing
co
mm
itm
en
ts o
f
cu
rren
t p
rog
ram
me
To
tal R
AL
of
the
deta
iled
MF
F
head
ing
Cu
rren
t P
rog
ram
me
sh
are
2014 23 244 11 275 679 10 597 61 866 17%
2015 24 203
2016 25 166
2017 26 049
2018 26 946
2019 27 857
2020 28 742
TOTAL 182 206
B.2.2 Transition regions (MFF 1.2.12)
(million EUR)
Implementation Table
Initial
budget Carryover from 2013
Amending budgets
BA transfers
COM transfers
Assigned revenue
Total appropria-
tions
Actual 2014
Rate Actual 2013
Carry-over to 2015
CA 4 698 0 0 0 - 2 188 4 884 2 874 59% 1 583
PA 276 0 0 0 - 112 4 167 167 100% 277 0
RAL as at 01.01.2014
Payments on RAL
Commitments 2014
Payments on 2014 commitments
Decommitments 2014 RAL as at 31.12.2014
Evolution of the RAL (%)
RAL 71 4 2 874 164 - 6 2 771 –
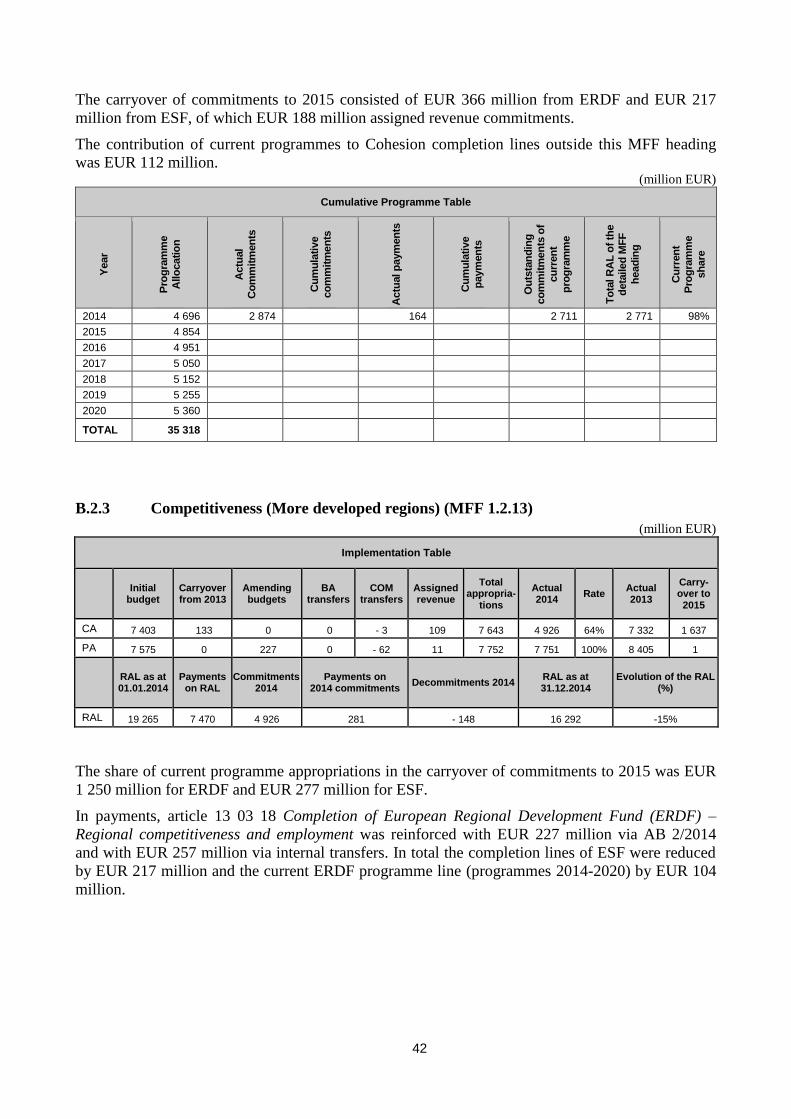
42
The carryover of commitments to 2015 consisted of EUR 366 million from ERDF and EUR 217
million from ESF, of which EUR 188 million assigned revenue commitments.
The contribution of current programmes to Cohesion completion lines outside this MFF heading
was EUR 112 million. (million EUR)
Cumulative Programme Table
Year
Pro
gra
mm
e
Allo
catio
n
Actu
al
Co
mm
itm
en
ts
Cu
mu
lati
ve
co
mm
itm
en
ts
Actu
al p
aym
en
ts
Cu
mu
lati
ve
paym
en
ts
Ou
tsta
nd
ing
co
mm
itm
en
ts o
f
cu
rren
t
pro
gra
mm
e
To
tal R
AL
of
the
deta
iled
MF
F
head
ing
Cu
rren
t P
rog
ram
me
sh
are
2014 4 696 2 874 164 2 711 2 771 98%
2015 4 854
2016 4 951
2017 5 050
2018 5 152
2019 5 255
2020 5 360
TOTAL 35 318
B.2.3 Competitiveness (More developed regions) (MFF 1.2.13)
(million EUR)
Implementation Table
Initial
budget Carryover from 2013
Amending budgets
BA transfers
COM transfers
Assigned revenue
Total appropria-
tions
Actual 2014
Rate Actual 2013
Carry-over to 2015
CA 7 403 133 0 0 - 3 109 7 643 4 926 64% 7 332 1 637
PA 7 575 0 227 0 - 62 11 7 752 7 751 100% 8 405 1
RAL as at 01.01.2014
Payments on RAL
Commitments 2014
Payments on 2014 commitments
Decommitments 2014 RAL as at 31.12.2014
Evolution of the RAL (%)
RAL 19 265 7 470 4 926 281 - 148 16 292 -15%
The share of current programme appropriations in the carryover of commitments to 2015 was EUR
1 250 million for ERDF and EUR 277 million for ESF.
In payments, article 13 03 18 Completion of European Regional Development Fund (ERDF) –
Regional competitiveness and employment was reinforced with EUR 227 million via AB 2/2014
and with EUR 257 million via internal transfers. In total the completion lines of ESF were reduced
by EUR 217 million and the current ERDF programme line (programmes 2014-2020) by EUR 104
million.
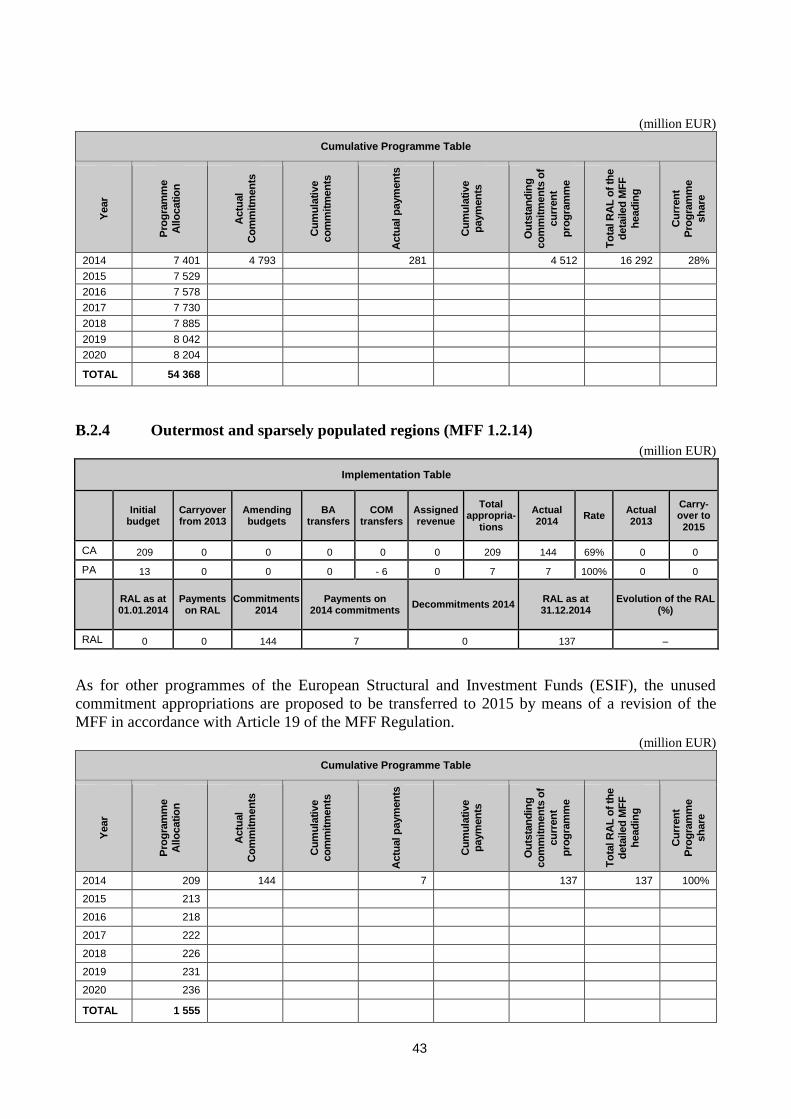
43
(million EUR)
Cumulative Programme Table
Year
Pro
gra
mm
e
Allo
catio
n
Actu
al
Co
mm
itm
en
ts
Cu
mu
lati
ve
co
mm
itm
en
ts
Actu
al p
aym
en
ts
Cu
mu
lati
ve
paym
en
ts
Ou
tsta
nd
ing
co
mm
itm
en
ts o
f
cu
rren
t
pro
gra
mm
e
To
tal R
AL
of
the
deta
iled
MF
F
head
ing
Cu
rren
t P
rog
ram
me
sh
are
2014 7 401 4 793 281 4 512 16 292 28%
2015 7 529
2016 7 578
2017 7 730
2018 7 885
2019 8 042
2020 8 204
TOTAL 54 368
B.2.4 Outermost and sparsely populated regions (MFF 1.2.14)
(million EUR)
Implementation Table
Initial
budget Carryover from 2013
Amending budgets
BA transfers
COM transfers
Assigned revenue
Total appropria-
tions
Actual 2014
Rate Actual 2013
Carry-over to 2015
CA 209 0 0 0 0 0 209 144 69% 0 0
PA 13 0 0 0 - 6 0 7 7 100% 0 0
RAL as at 01.01.2014
Payments on RAL
Commitments 2014
Payments on 2014 commitments
Decommitments 2014 RAL as at 31.12.2014
Evolution of the RAL (%)
RAL 0 0 144 7 0 137 –
As for other programmes of the European Structural and Investment Funds (ESIF), the unused
commitment appropriations are proposed to be transferred to 2015 by means of a revision of the
MFF in accordance with Article 19 of the MFF Regulation.
(million EUR)
Cumulative Programme Table
Year
Pro
gra
mm
e
Allo
catio
n
Actu
al
Co
mm
itm
en
ts
Cu
mu
lati
ve
co
mm
itm
en
ts
Actu
al p
aym
en
ts
Cu
mu
lati
ve
paym
en
ts
Ou
tsta
nd
ing
co
mm
itm
en
ts o
f
cu
rren
t
pro
gra
mm
e
To
tal R
AL
of
the
deta
iled
MF
F
head
ing
Cu
rren
t P
rog
ram
me
sh
are
2014 209 144 7 137 137 100%
2015 213
2016 218
2017 222
2018 226
2019 231
2020 236
TOTAL 1 555
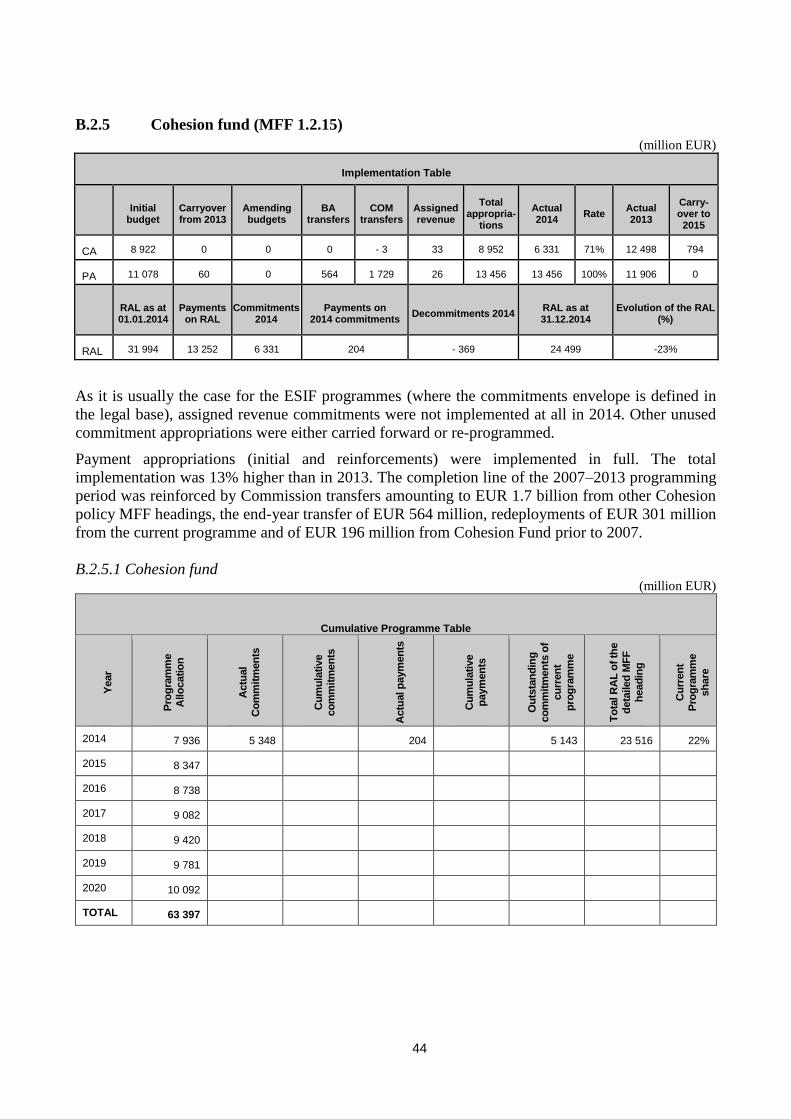
44
B.2.5 Cohesion fund (MFF 1.2.15)
(million EUR)
Implementation Table
Initial
budget Carryover from 2013
Amending budgets
BA transfers
COM transfers
Assigned revenue
Total appropria-
tions
Actual 2014
Rate Actual 2013
Carry-over to 2015
CA 8 922 0 0 0 - 3 33 8 952 6 331 71% 12 498 794
PA 11 078 60 0 564 1 729 26 13 456 13 456 100% 11 906 0
RAL as at 01.01.2014
Payments on RAL
Commitments 2014
Payments on 2014 commitments
Decommitments 2014 RAL as at 31.12.2014
Evolution of the RAL (%)
RAL 31 994 13 252 6 331 204 - 369 24 499 -23%
As it is usually the case for the ESIF programmes (where the commitments envelope is defined in
the legal base), assigned revenue commitments were not implemented at all in 2014. Other unused
commitment appropriations were either carried forward or re-programmed.
Payment appropriations (initial and reinforcements) were implemented in full. The total
implementation was 13% higher than in 2013. The completion line of the 2007–2013 programming
period was reinforced by Commission transfers amounting to EUR 1.7 billion from other Cohesion
policy MFF headings, the end-year transfer of EUR 564 million, redeployments of EUR 301 million
from the current programme and of EUR 196 million from Cohesion Fund prior to 2007.
B.2.5.1 Cohesion fund (million EUR)
Cumulative Programme Table
Year
Pro
gra
mm
e
Allo
catio
n
Actu
al
Co
mm
itm
en
ts
Cu
mu
lati
ve
co
mm
itm
en
ts
Actu
al p
aym
en
ts
Cu
mu
lati
ve
paym
en
ts
Ou
tsta
nd
ing
co
mm
itm
en
ts o
f
cu
rren
t
pro
gra
mm
e
To
tal R
AL
of
the
deta
iled
MF
F
head
ing
Cu
rren
t P
rog
ram
me
sh
are
2014 7 936 5 348 204 5 143 23 516 22%
2015 8 347
2016 8 738
2017 9 082
2018 9 420
2019 9 781
2020 10 092
TOTAL 63 397
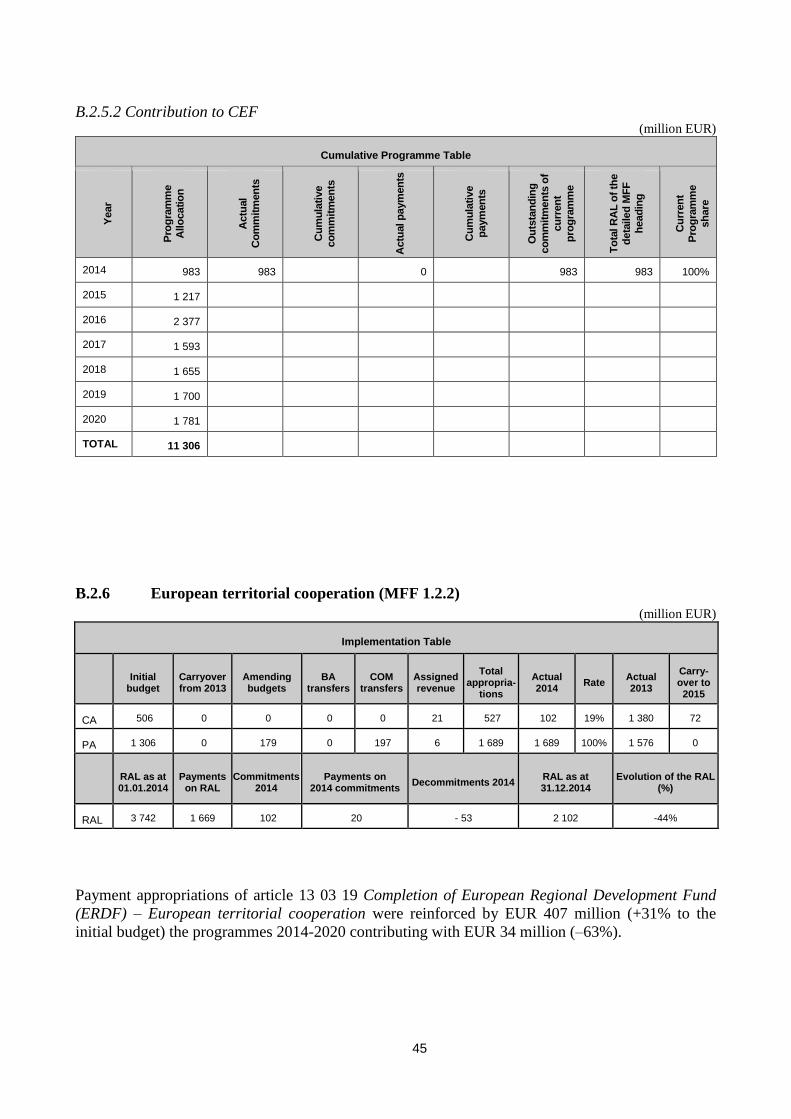
45
B.2.5.2 Contribution to CEF (million EUR)
Cumulative Programme Table
Year
Pro
gra
mm
e
Allo
catio
n
Actu
al
Co
mm
itm
en
ts
Cu
mu
lati
ve
co
mm
itm
en
ts
Actu
al p
aym
en
ts
Cu
mu
lati
ve
paym
en
ts
Ou
tsta
nd
ing
co
mm
itm
en
ts o
f
cu
rren
t
pro
gra
mm
e
To
tal R
AL
of
the
deta
iled
MF
F
head
ing
Cu
rren
t P
rog
ram
me
sh
are
2014 983 983 0 983 983 100%
2015 1 217
2016 2 377
2017 1 593
2018 1 655
2019 1 700
2020 1 781
TOTAL 11 306
B.2.6 European territorial cooperation (MFF 1.2.2)
(million EUR)
Implementation Table
Initial
budget Carryover from 2013
Amending budgets
BA transfers
COM transfers
Assigned revenue
Total appropria-
tions
Actual 2014
Rate Actual 2013
Carry-over to 2015
CA 506 0 0 0 0 21 527 102 19% 1 380 72
PA 1 306 0 179 0 197 6 1 689 1 689 100% 1 576 0
RAL as at 01.01.2014
Payments on RAL
Commitments 2014
Payments on 2014 commitments
Decommitments 2014 RAL as at 31.12.2014
Evolution of the RAL (%)
RAL 3 742 1 669 102 20 - 53 2 102 -44%
Payment appropriations of article 13 03 19 Completion of European Regional Development Fund
(ERDF) – European territorial cooperation were reinforced by EUR 407 million (+31% to the
initial budget) the programmes 2014-2020 contributing with EUR 34 million (–63%).
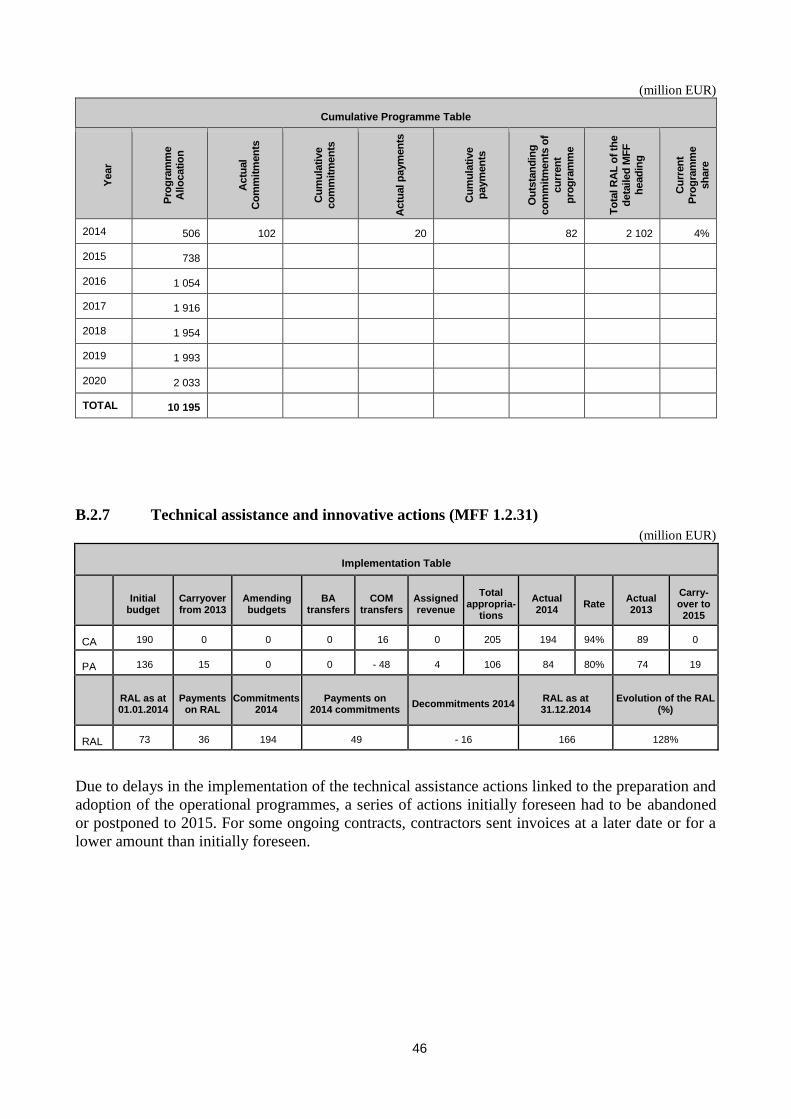
46
(million EUR)
Cumulative Programme Table Y
ear
Pro
gra
mm
e
Allo
catio
n
Actu
al
Co
mm
itm
en
ts
Cu
mu
lati
ve
co
mm
itm
en
ts
Actu
al p
aym
en
ts
Cu
mu
lati
ve
paym
en
ts
Ou
tsta
nd
ing
co
mm
itm
en
ts o
f
cu
rren
t
pro
gra
mm
e
To
tal R
AL
of
the
deta
iled
MF
F
head
ing
Cu
rren
t P
rog
ram
me
sh
are
2014 506 102 20 82 2 102 4%
2015 738
2016 1 054
2017 1 916
2018 1 954
2019 1 993
2020 2 033
TOTAL 10 195
B.2.7 Technical assistance and innovative actions (MFF 1.2.31)
(million EUR)
Implementation Table
Initial
budget Carryover from 2013
Amending budgets
BA transfers
COM transfers
Assigned revenue
Total appropria-
tions
Actual 2014
Rate Actual 2013
Carry-over to 2015
CA 190 0 0 0 16 0 205 194 94% 89 0
PA 136 15 0 0 - 48 4 106 84 80% 74 19
RAL as at 01.01.2014
Payments on RAL
Commitments 2014
Payments on 2014 commitments
Decommitments 2014 RAL as at 31.12.2014
Evolution of the RAL (%)
RAL 73 36 194 49 - 16 166 128%
Due to delays in the implementation of the technical assistance actions linked to the preparation and
adoption of the operational programmes, a series of actions initially foreseen had to be abandoned
or postponed to 2015. For some ongoing contracts, contractors sent invoices at a later date or for a
lower amount than initially foreseen.

47
(million EUR)
Cumulative Programme Table
Year
Pro
gra
mm
e
Allo
catio
n
Actu
al
Co
mm
itm
en
ts
Cu
mu
lati
ve
co
mm
itm
en
ts
Actu
al p
aym
en
ts
Cu
mu
lati
ve
paym
en
ts
Ou
tsta
nd
ing
co
mm
itm
en
ts o
f
cu
rren
t
pro
gra
mm
e
To
tal R
AL
of
the
deta
iled
MF
F
head
ing
Cu
rren
t P
rog
ram
me
sh
are
2014 205 194 49 146 166 88%
2015 193
2016 219
2017 229
2018 236
2019 242
2020 248
TOTAL 1 571
B.2.8 European Aid to the Most Deprived (FEAD) (MFF 1.2.4)
(million EUR)
Implementation Table
Initial
budget Carryover from 2013
Amending budgets
BA transfers
COM transfers
Assigned revenue
Total appropria-
tions
Actual 2014
Rate Actual 2013
Carry-over to 2015
CA 500 0 0 0 13 0 513 501 98% 0 12
PA 306 0 99 0 5 0 410 410 100% 0 0
RAL as at 01.01.2014
Payments on RAL
Commitments 2014
Payments on 2014 commitments
Decommitments 2014 RAL as at 31.12.2014
Evolution of the RAL (%)
RAL 0 0 513 410 0 93 –
The Amending budget 2/2014 covered the additional needs in payment appropriations of EUR 99
million in 2014. The legal base of the ‘Fund for European Aid to the Most Deprived’ (FEAD) was
adopted with a top up for 2014–2020 EUR 1 billion higher than the Commission proposal, resulting
to higher advance payments in 2014.
(million EUR)
Cumulative Programme Table
Year
Pro
gra
mm
e
Allo
catio
n
Actu
al
Co
mm
itm
en
ts
Cu
mu
lati
ve
co
mm
itm
en
ts
Actu
al p
aym
en
ts
Cu
mu
lati
ve
paym
en
ts
Ou
tsta
nd
ing
co
mm
itm
en
ts o
f
cu
rren
t
pro
gra
mm
e
To
tal R
AL
of
the
deta
iled
MF
F
head
ing
Cu
rren
t P
rog
ram
me
sh
are
2014 513 513 410 93 91 100%
2015 525
2016 536
2017 546
2018 557
2019 568
2020 580
TOTAL 3 827
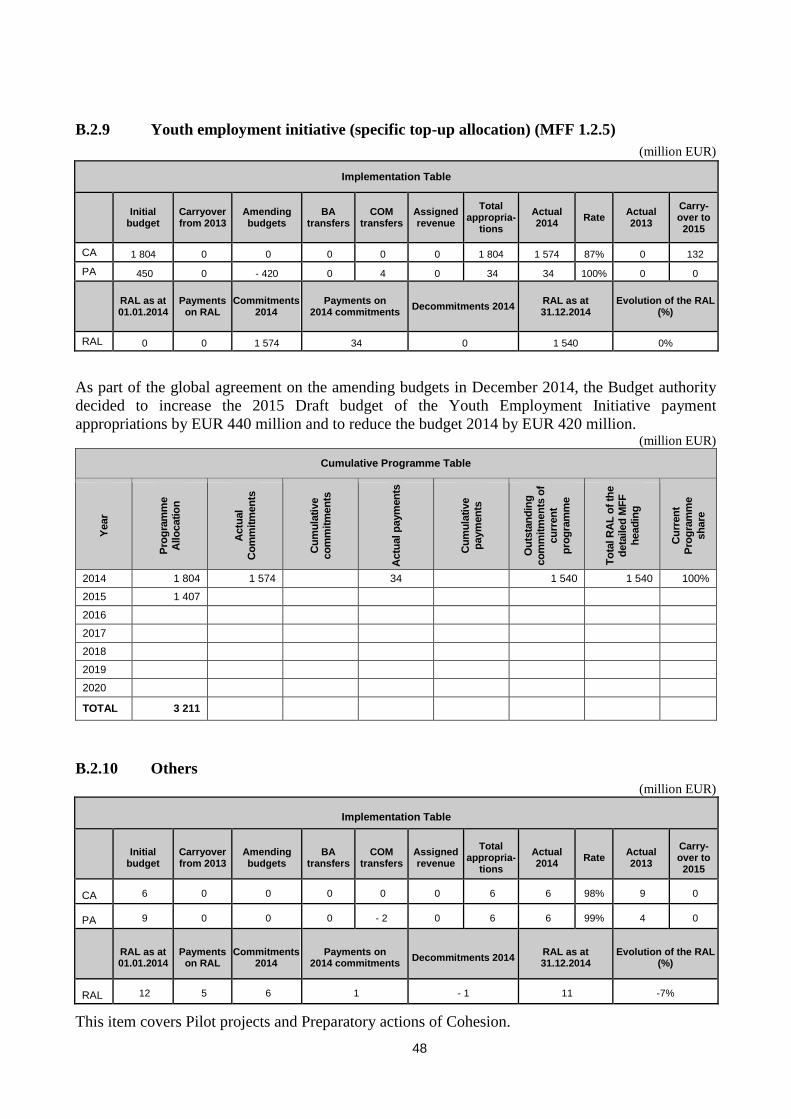
48
B.2.9 Youth employment initiative (specific top-up allocation) (MFF 1.2.5)
(million EUR)
Implementation Table
Initial
budget Carryover from 2013
Amending budgets
BA transfers
COM transfers
Assigned revenue
Total appropria-
tions
Actual 2014
Rate Actual 2013
Carry-over to 2015
CA 1 804 0 0 0 0 0 1 804 1 574 87% 0 132
PA 450 0 - 420 0 4 0 34 34 100% 0 0
RAL as at 01.01.2014
Payments on RAL
Commitments 2014
Payments on 2014 commitments
Decommitments 2014 RAL as at 31.12.2014
Evolution of the RAL (%)
RAL 0 0 1 574 34 0 1 540 0%
As part of the global agreement on the amending budgets in December 2014, the Budget authority
decided to increase the 2015 Draft budget of the Youth Employment Initiative payment
appropriations by EUR 440 million and to reduce the budget 2014 by EUR 420 million. (million EUR)
Cumulative Programme Table
Year
Pro
gra
mm
e
Allo
catio
n
Actu
al
Co
mm
itm
en
ts
Cu
mu
lati
ve
co
mm
itm
en
ts
Actu
al p
aym
en
ts
Cu
mu
lati
ve
paym
en
ts
Ou
tsta
nd
ing
co
mm
itm
en
ts o
f
cu
rren
t
pro
gra
mm
e
To
tal R
AL
of
the
deta
iled
MF
F
head
ing
Cu
rren
t P
rog
ram
me
sh
are
2014 1 804 1 574 34 1 540 1 540 100%
2015 1 407
2016
2017
2018
2019
2020
TOTAL 3 211
B.2.10 Others
(million EUR)
Implementation Table
Initial
budget Carryover from 2013
Amending budgets
BA transfers
COM transfers
Assigned revenue
Total appropria-
tions
Actual 2014
Rate Actual 2013
Carry-over to 2015
CA 6 0 0 0 0 0 6 6 98% 9 0
PA 9 0 0 0 - 2 0 6 6 99% 4 0
RAL as at 01.01.2014
Payments on RAL
Commitments 2014
Payments on 2014 commitments
Decommitments 2014 RAL as at 31.12.2014
Evolution of the RAL (%)
RAL 12 5 6 1 - 1 11 -7%
This item covers Pilot projects and Preparatory actions of Cohesion.
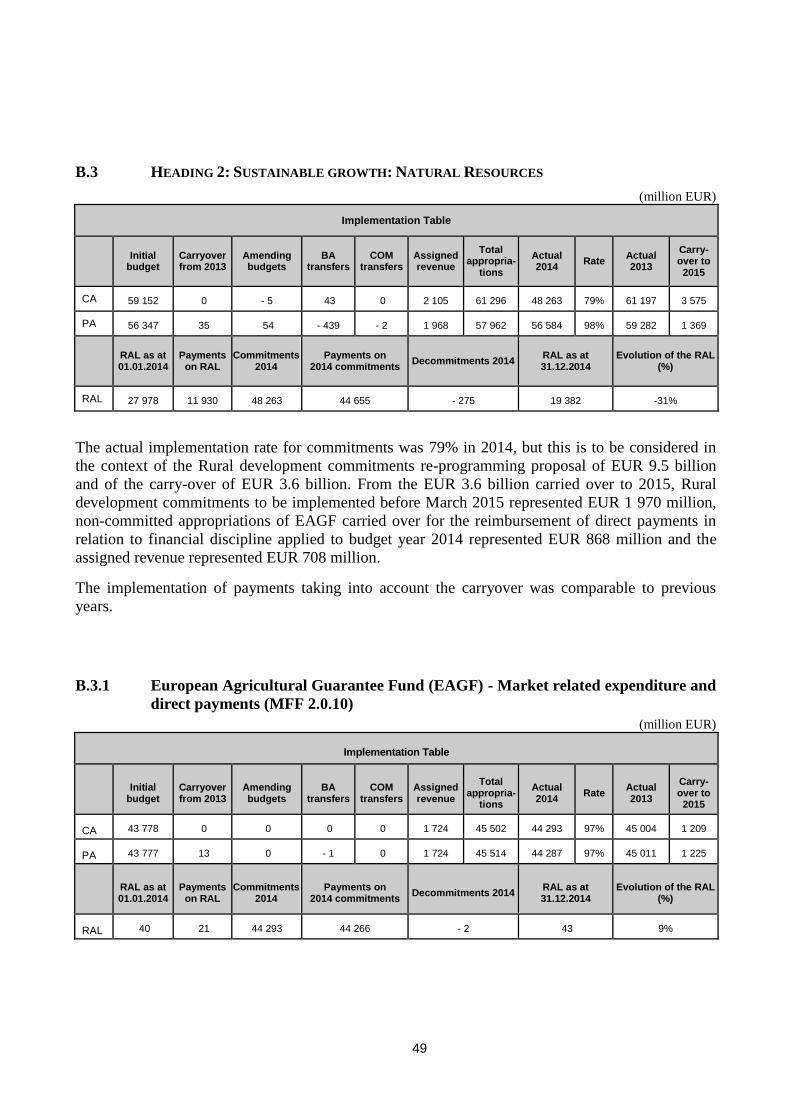
49
B.3 HEADING 2: SUSTAINABLE GROWTH: NATURAL RESOURCES
(million EUR)
Implementation Table
Initial
budget Carryover from 2013
Amending budgets
BA transfers
COM transfers
Assigned revenue
Total appropria-
tions
Actual 2014
Rate Actual 2013
Carry-over to 2015
CA 59 152 0 - 5 43 0 2 105 61 296 48 263 79% 61 197 3 575
PA 56 347 35 54 - 439 - 2 1 968 57 962 56 584 98% 59 282 1 369
RAL as at 01.01.2014
Payments on RAL
Commitments 2014
Payments on 2014 commitments
Decommitments 2014 RAL as at 31.12.2014
Evolution of the RAL (%)
RAL 27 978 11 930 48 263 44 655 - 275 19 382 -31%
The actual implementation rate for commitments was 79% in 2014, but this is to be considered in
the context of the Rural development commitments re-programming proposal of EUR 9.5 billion
and of the carry-over of EUR 3.6 billion. From the EUR 3.6 billion carried over to 2015, Rural
development commitments to be implemented before March 2015 represented EUR 1 970 million,
non-committed appropriations of EAGF carried over for the reimbursement of direct payments in
relation to financial discipline applied to budget year 2014 represented EUR 868 million and the
assigned revenue represented EUR 708 million.
The implementation of payments taking into account the carryover was comparable to previous
years.
B.3.1 European Agricultural Guarantee Fund (EAGF) - Market related expenditure and
direct payments (MFF 2.0.10)
(million EUR)
Implementation Table
Initial
budget Carryover from 2013
Amending budgets
BA transfers
COM transfers
Assigned revenue
Total appropria-
tions
Actual 2014
Rate Actual 2013
Carry-over to 2015
CA 43 778 0 0 0 0 1 724 45 502 44 293 97% 45 004 1 209
PA 43 777 13 0 - 1 0 1 724 45 514 44 287 97% 45 011 1 225
RAL as at 01.01.2014
Payments on RAL
Commitments 2014
Payments on 2014 commitments
Decommitments 2014 RAL as at 31.12.2014
Evolution of the RAL (%)
RAL 40 21 44 293 44 266 - 2 43 9%
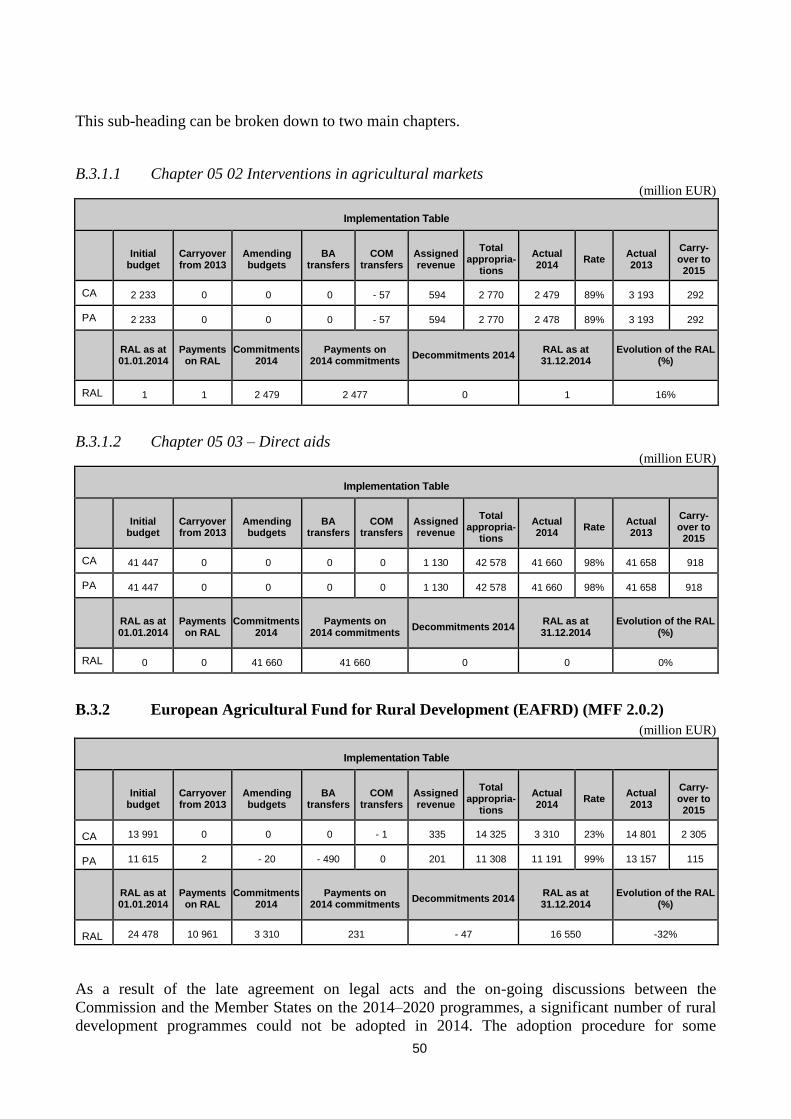
50
This sub-heading can be broken down to two main chapters.
B.3.1.1 Chapter 05 02 Interventions in agricultural markets (million EUR)
Implementation Table
Initial
budget Carryover from 2013
Amending budgets
BA transfers
COM transfers
Assigned revenue
Total appropria-
tions
Actual 2014
Rate Actual 2013
Carry-over to 2015
CA 2 233 0 0 0 - 57 594 2 770 2 479 89% 3 193 292
PA 2 233 0 0 0 - 57 594 2 770 2 478 89% 3 193 292
RAL as at 01.01.2014
Payments on RAL
Commitments 2014
Payments on 2014 commitments
Decommitments 2014 RAL as at 31.12.2014
Evolution of the RAL (%)
RAL 1 1 2 479 2 477 0 1 16%
B.3.1.2 Chapter 05 03 – Direct aids (million EUR)
Implementation Table
Initial
budget Carryover from 2013
Amending budgets
BA transfers
COM transfers
Assigned revenue
Total appropria-
tions
Actual 2014
Rate Actual 2013
Carry-over to 2015
CA 41 447 0 0 0 0 1 130 42 578 41 660 98% 41 658 918
PA 41 447 0 0 0 0 1 130 42 578 41 660 98% 41 658 918
RAL as at 01.01.2014
Payments on RAL
Commitments 2014
Payments on 2014 commitments
Decommitments 2014 RAL as at 31.12.2014
Evolution of the RAL (%)
RAL 0 0 41 660 41 660 0 0 0%
B.3.2 European Agricultural Fund for Rural Development (EAFRD) (MFF 2.0.2)
(million EUR)
Implementation Table
Initial
budget Carryover from 2013
Amending budgets
BA transfers
COM transfers
Assigned revenue
Total appropria-
tions
Actual 2014
Rate Actual 2013
Carry-over to 2015
CA 13 991 0 0 0 - 1 335 14 325 3 310 23% 14 801 2 305
PA 11 615 2 - 20 - 490 0 201 11 308 11 191 99% 13 157 115
RAL as at 01.01.2014
Payments on RAL
Commitments 2014
Payments on 2014 commitments
Decommitments 2014 RAL as at 31.12.2014
Evolution of the RAL (%)
RAL 24 478 10 961 3 310 231 - 47 16 550 -32%
As a result of the late agreement on legal acts and the on-going discussions between the
Commission and the Member States on the 2014–2020 programmes, a significant number of rural
development programmes could not be adopted in 2014. The adoption procedure for some
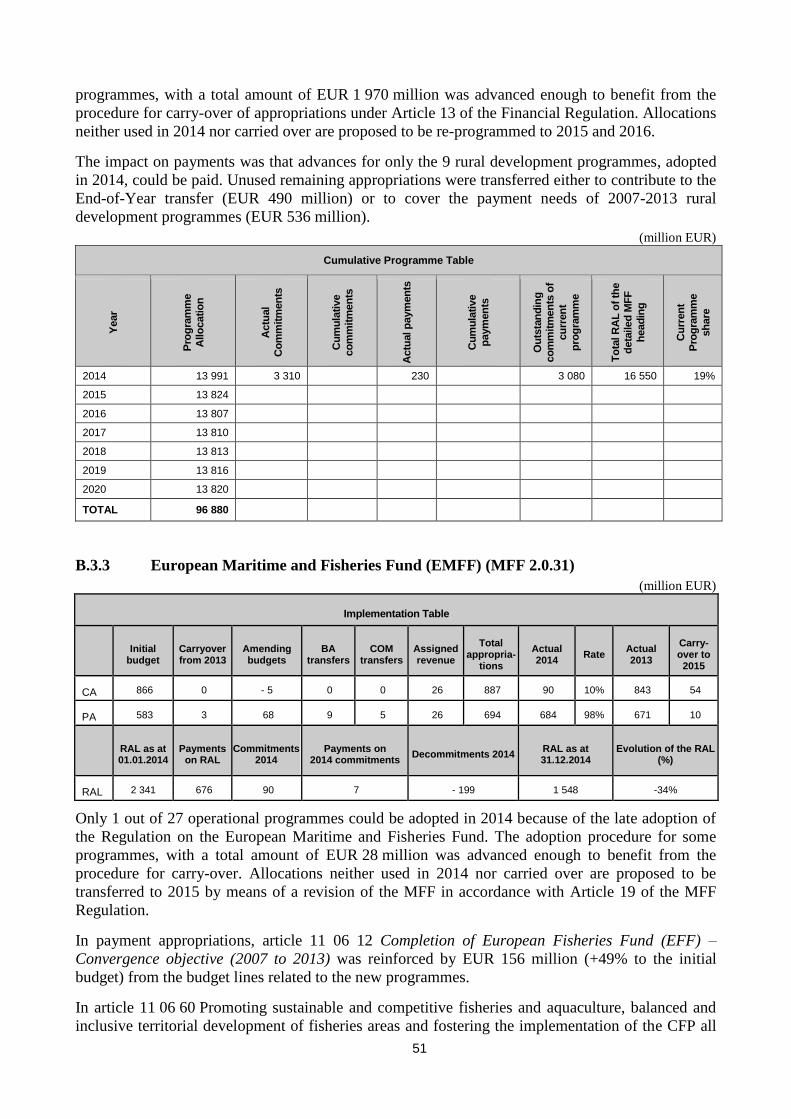
51
programmes, with a total amount of EUR 1 970 million was advanced enough to benefit from the
procedure for carry-over of appropriations under Article 13 of the Financial Regulation. Allocations
neither used in 2014 nor carried over are proposed to be re-programmed to 2015 and 2016.
The impact on payments was that advances for only the 9 rural development programmes, adopted
in 2014, could be paid. Unused remaining appropriations were transferred either to contribute to the
End-of-Year transfer (EUR 490 million) or to cover the payment needs of 2007-2013 rural
development programmes (EUR 536 million).
(million EUR)
Cumulative Programme Table
Year
Pro
gra
mm
e
Allo
catio
n
Actu
al
Co
mm
itm
en
ts
Cu
mu
lati
ve
co
mm
itm
en
ts
Actu
al p
aym
en
ts
Cu
mu
lati
ve
paym
en
ts
Ou
tsta
nd
ing
co
mm
itm
en
ts o
f
cu
rren
t
pro
gra
mm
e
To
tal R
AL
of
the
deta
iled
MF
F
head
ing
Cu
rren
t P
rog
ram
me
sh
are
2014 13 991 3 310 230 3 080 16 550 19%
2015 13 824
2016 13 807
2017 13 810
2018 13 813
2019 13 816
2020 13 820
TOTAL 96 880
B.3.3 European Maritime and Fisheries Fund (EMFF) (MFF 2.0.31)
(million EUR)
Implementation Table
Initial
budget Carryover from 2013
Amending budgets
BA transfers
COM transfers
Assigned revenue
Total appropria-
tions
Actual 2014
Rate Actual 2013
Carry-over to 2015
CA 866 0 - 5 0 0 26 887 90 10% 843 54
PA 583 3 68 9 5 26 694 684 98% 671 10
RAL as at 01.01.2014
Payments on RAL
Commitments 2014
Payments on 2014 commitments
Decommitments 2014 RAL as at 31.12.2014
Evolution of the RAL (%)
RAL 2 341 676 90 7 - 199 1 548 -34%
Only 1 out of 27 operational programmes could be adopted in 2014 because of the late adoption of
the Regulation on the European Maritime and Fisheries Fund. The adoption procedure for some
programmes, with a total amount of EUR 28 million was advanced enough to benefit from the
procedure for carry-over. Allocations neither used in 2014 nor carried over are proposed to be
transferred to 2015 by means of a revision of the MFF in accordance with Article 19 of the MFF
Regulation.
In payment appropriations, article 11 06 12 Completion of European Fisheries Fund (EFF) –
Convergence objective (2007 to 2013) was reinforced by EUR 156 million (+49% to the initial
budget) from the budget lines related to the new programmes.
In article 11 06 60 Promoting sustainable and competitive fisheries and aquaculture, balanced and
inclusive territorial development of fisheries areas and fostering the implementation of the CFP all
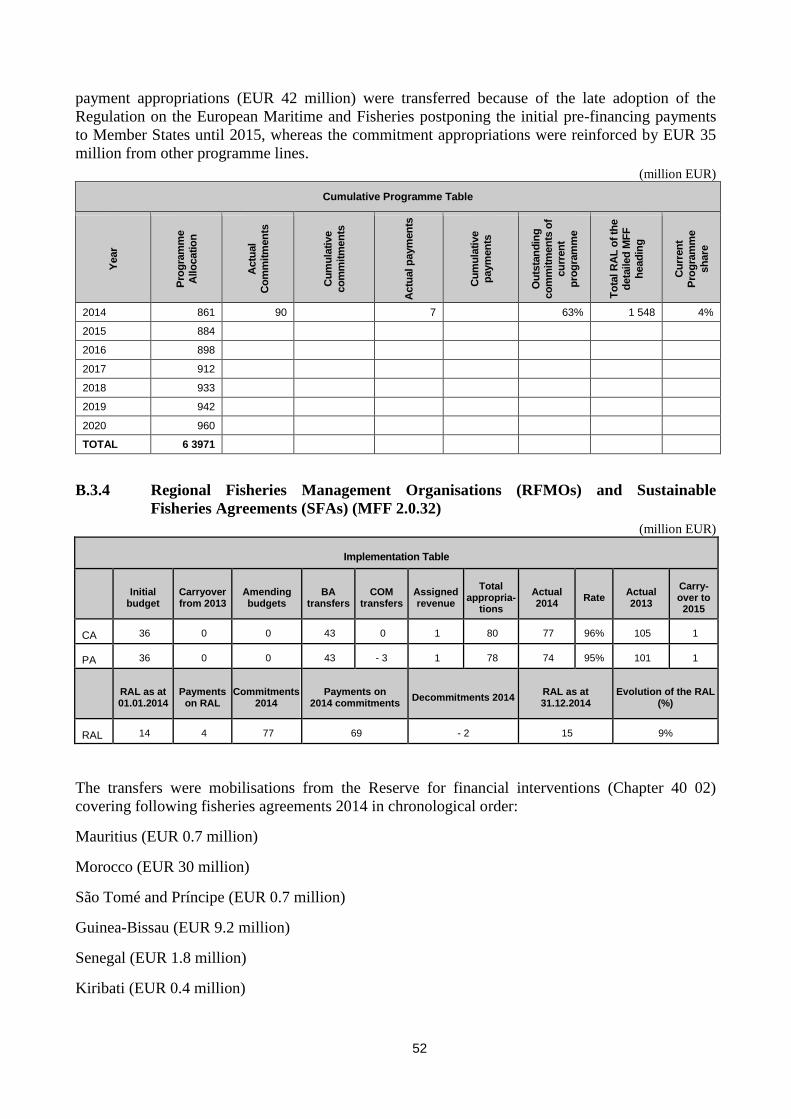
52
payment appropriations (EUR 42 million) were transferred because of the late adoption of the
Regulation on the European Maritime and Fisheries postponing the initial pre-financing payments
to Member States until 2015, whereas the commitment appropriations were reinforced by EUR 35
million from other programme lines.
(million EUR)
Cumulative Programme Table
Year
Pro
gra
mm
e
Allo
catio
n
Actu
al
Co
mm
itm
en
ts
Cu
mu
lati
ve
co
mm
itm
en
ts
Actu
al p
aym
en
ts
Cu
mu
lati
ve
paym
en
ts
Ou
tsta
nd
ing
co
mm
itm
en
ts o
f
cu
rren
t
pro
gra
mm
e
To
tal R
AL
of
the
deta
iled
MF
F
head
ing
Cu
rren
t P
rog
ram
me
sh
are
2014 861 90 7 63% 1 548 4%
2015 884
2016 898
2017 912
2018 933
2019 942
2020 960
TOTAL 6 3971
B.3.4 Regional Fisheries Management Organisations (RFMOs) and Sustainable
Fisheries Agreements (SFAs) (MFF 2.0.32)
(million EUR)
Implementation Table
Initial
budget Carryover from 2013
Amending budgets
BA transfers
COM transfers
Assigned revenue
Total appropria-
tions
Actual 2014
Rate Actual 2013
Carry-over to 2015
CA 36 0 0 43 0 1 80 77 96% 105 1
PA 36 0 0 43 - 3 1 78 74 95% 101 1
RAL as at 01.01.2014
Payments on RAL
Commitments 2014
Payments on 2014 commitments
Decommitments 2014 RAL as at 31.12.2014
Evolution of the RAL (%)
RAL 14 4 77 69 - 2 15 9%
The transfers were mobilisations from the Reserve for financial interventions (Chapter 40 02)
covering following fisheries agreements 2014 in chronological order:
Mauritius (EUR 0.7 million)
Morocco (EUR 30 million)
São Tomé and Príncipe (EUR 0.7 million)
Guinea-Bissau (EUR 9.2 million)
Senegal (EUR 1.8 million)
Kiribati (EUR 0.4 million)
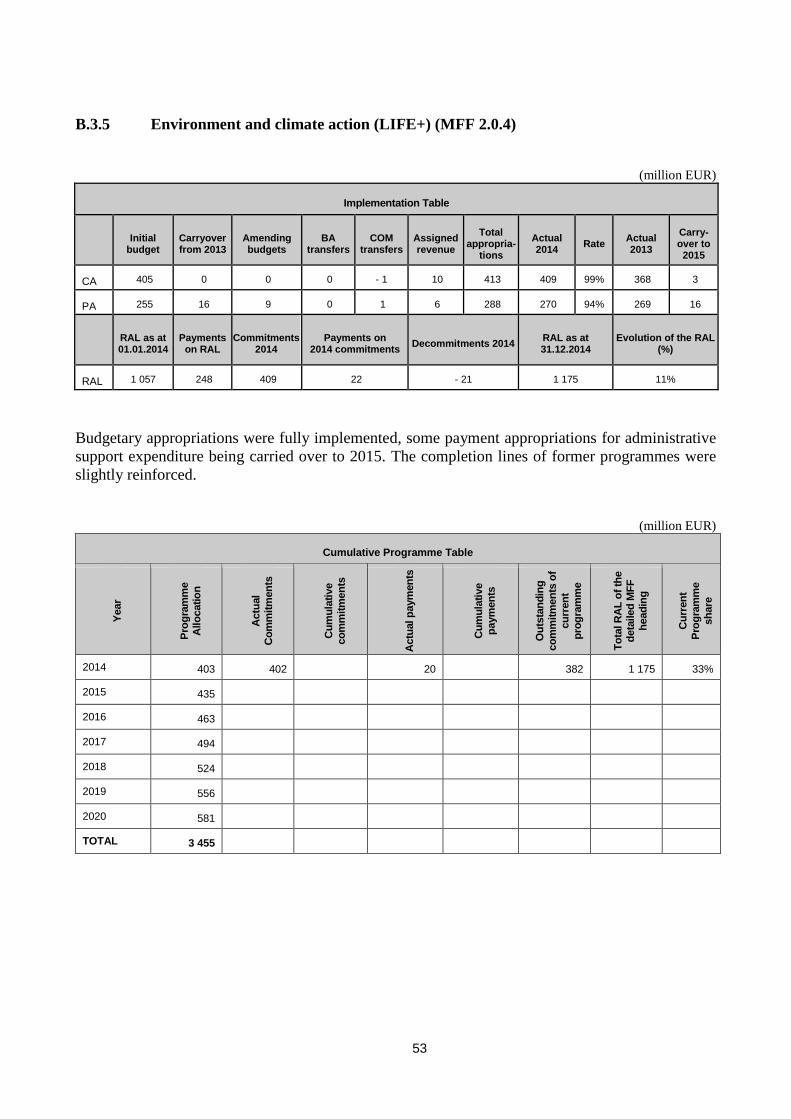
53
B.3.5 Environment and climate action (LIFE+) (MFF 2.0.4)
(million EUR)
Implementation Table
Initial
budget Carryover from 2013
Amending budgets
BA transfers
COM transfers
Assigned revenue
Total appropria-
tions
Actual 2014
Rate Actual 2013
Carry-over to 2015
CA 405 0 0 0 - 1 10 413 409 99% 368 3
PA 255 16 9 0 1 6 288 270 94% 269 16
RAL as at 01.01.2014
Payments on RAL
Commitments 2014
Payments on 2014 commitments
Decommitments 2014 RAL as at 31.12.2014
Evolution of the RAL (%)
RAL 1 057 248 409 22 - 21 1 175 11%
Budgetary appropriations were fully implemented, some payment appropriations for administrative
support expenditure being carried over to 2015. The completion lines of former programmes were
slightly reinforced.
(million EUR)
Cumulative Programme Table
Year
Pro
gra
mm
e
Allo
catio
n
Actu
al
Co
mm
itm
en
ts
Cu
mu
lati
ve
co
mm
itm
en
ts
Actu
al p
aym
en
ts
Cu
mu
lati
ve
paym
en
ts
Ou
tsta
nd
ing
co
mm
itm
en
ts o
f
cu
rren
t p
rog
ram
me
To
tal R
AL
of
the
deta
iled
MF
F
head
ing
Cu
rren
t
Pro
gra
mm
e
sh
are
2014 403 402 20 382 1 175 33%
2015 435
2016 463
2017 494
2018 524
2019 556
2020 581
TOTAL 3 455
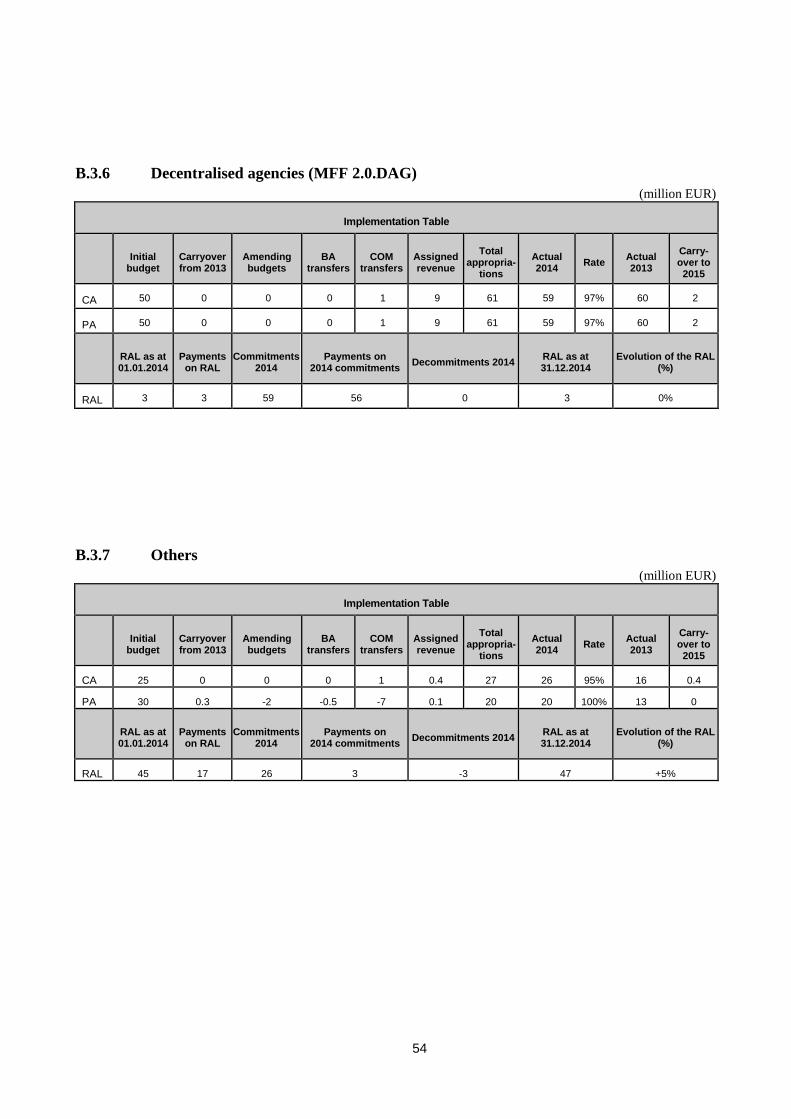
54
B.3.6 Decentralised agencies (MFF 2.0.DAG)
(million EUR)
Implementation Table
Initial
budget Carryover from 2013
Amending budgets
BA transfers
COM transfers
Assigned revenue
Total appropria-
tions
Actual 2014
Rate Actual 2013
Carry-over to 2015
CA 50 0 0 0 1 9 61 59 97% 60 2
PA 50 0 0 0 1 9 61 59 97% 60 2
RAL as at 01.01.2014
Payments on RAL
Commitments 2014
Payments on 2014 commitments
Decommitments 2014 RAL as at 31.12.2014
Evolution of the RAL (%)
RAL 3 3 59 56 0 3 0%
B.3.7 Others
(million EUR)
Implementation Table
Initial
budget Carryover from 2013
Amending budgets
BA transfers
COM transfers
Assigned revenue
Total appropria-
tions
Actual 2014
Rate Actual 2013
Carry-over to 2015
CA 25 0 0 0 1 0.4 27 26 95% 16 0.4
PA 30 0.3 -2 -0.5 -7 0.1 20 20 100% 13 0
RAL as at 01.01.2014
Payments on RAL
Commitments 2014
Payments on 2014 commitments
Decommitments 2014 RAL as at 31.12.2014
Evolution of the RAL (%)
RAL 45 17 26 3 -3 47 +5%
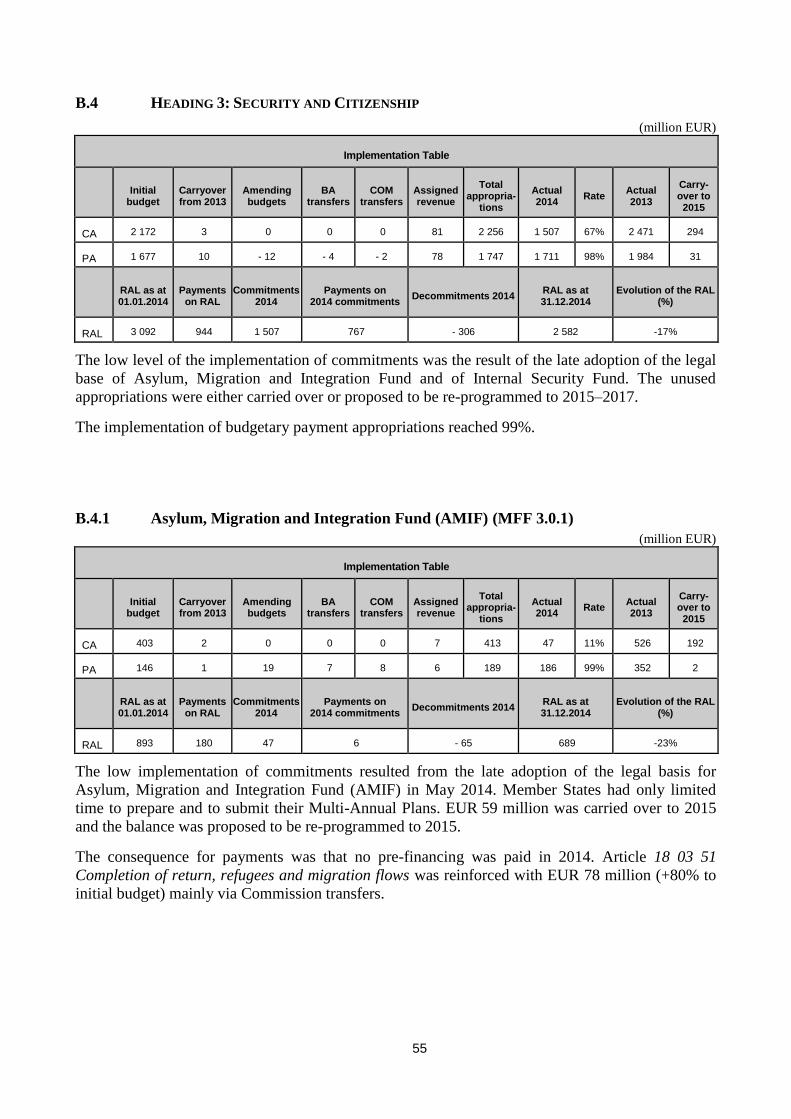
55
B.4 HEADING 3: SECURITY AND CITIZENSHIP
(million EUR)
Implementation Table
Initial
budget Carryover from 2013
Amending budgets
BA transfers
COM transfers
Assigned revenue
Total appropria-
tions
Actual 2014
Rate Actual 2013
Carry-over to 2015
CA 2 172 3 0 0 0 81 2 256 1 507 67% 2 471 294
PA 1 677 10 - 12 - 4 - 2 78 1 747 1 711 98% 1 984 31
RAL as at 01.01.2014
Payments on RAL
Commitments 2014
Payments on 2014 commitments
Decommitments 2014 RAL as at 31.12.2014
Evolution of the RAL (%)
RAL 3 092 944 1 507 767 - 306 2 582 -17%
The low level of the implementation of commitments was the result of the late adoption of the legal
base of Asylum, Migration and Integration Fund and of Internal Security Fund. The unused
appropriations were either carried over or proposed to be re-programmed to 2015–2017.
The implementation of budgetary payment appropriations reached 99%.
B.4.1 Asylum, Migration and Integration Fund (AMIF) (MFF 3.0.1)
(million EUR)
Implementation Table
Initial
budget Carryover from 2013
Amending budgets
BA transfers
COM transfers
Assigned revenue
Total appropria-
tions
Actual 2014
Rate Actual 2013
Carry-over to 2015
CA 403 2 0 0 0 7 413 47 11% 526 192
PA 146 1 19 7 8 6 189 186 99% 352 2
RAL as at 01.01.2014
Payments on RAL
Commitments 2014
Payments on 2014 commitments
Decommitments 2014 RAL as at 31.12.2014
Evolution of the RAL (%)
RAL 893 180 47 6 - 65 689 -23%
The low implementation of commitments resulted from the late adoption of the legal basis for
Asylum, Migration and Integration Fund (AMIF) in May 2014. Member States had only limited
time to prepare and to submit their Multi-Annual Plans. EUR 59 million was carried over to 2015
and the balance was proposed to be re-programmed to 2015.
The consequence for payments was that no pre-financing was paid in 2014. Article 18 03 51
Completion of return, refugees and migration flows was reinforced with EUR 78 million (+80% to
initial budget) mainly via Commission transfers.
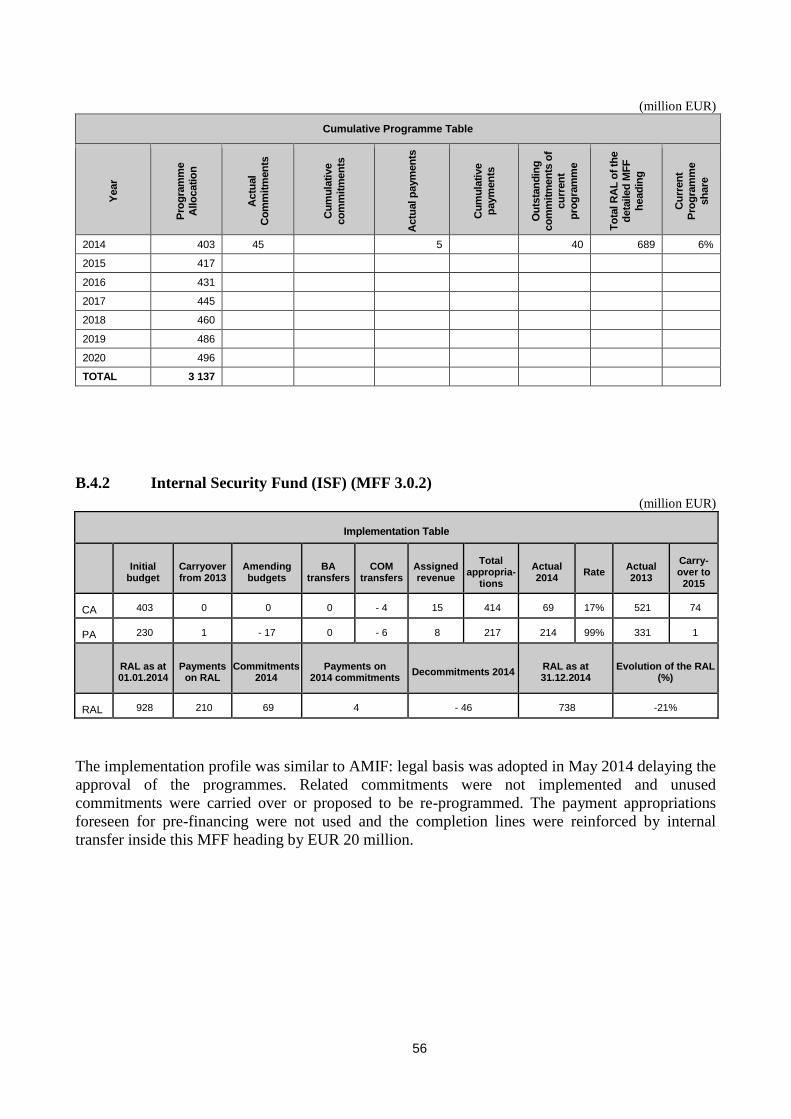
56
(million EUR)
Cumulative Programme Table
Year
Pro
gra
mm
e
Allo
catio
n
Actu
al
Co
mm
itm
en
ts
Cu
mu
lati
ve
co
mm
itm
en
ts
Actu
al p
aym
en
ts
Cu
mu
lati
ve
paym
en
ts
Ou
tsta
nd
ing
co
mm
itm
en
ts o
f
cu
rren
t
pro
gra
mm
e
To
tal R
AL
of
the
deta
iled
MF
F
head
ing
Cu
rren
t P
rog
ram
me
sh
are
2014 403 45 5 40 689 6%
2015 417
2016 431
2017 445
2018 460
2019 486
2020 496
TOTAL 3 137
B.4.2 Internal Security Fund (ISF) (MFF 3.0.2)
(million EUR)
Implementation Table
Initial
budget Carryover from 2013
Amending budgets
BA transfers
COM transfers
Assigned revenue
Total appropria-
tions
Actual 2014
Rate Actual 2013
Carry-over to 2015
CA 403 0 0 0 - 4 15 414 69 17% 521 74
PA 230 1 - 17 0 - 6 8 217 214 99% 331 1
RAL as at 01.01.2014
Payments on RAL
Commitments 2014
Payments on 2014 commitments
Decommitments 2014 RAL as at 31.12.2014
Evolution of the RAL (%)
RAL 928 210 69 4 - 46 738 -21%
The implementation profile was similar to AMIF: legal basis was adopted in May 2014 delaying the
approval of the programmes. Related commitments were not implemented and unused
commitments were carried over or proposed to be re-programmed. The payment appropriations
foreseen for pre-financing were not used and the completion lines were reinforced by internal
transfer inside this MFF heading by EUR 20 million.
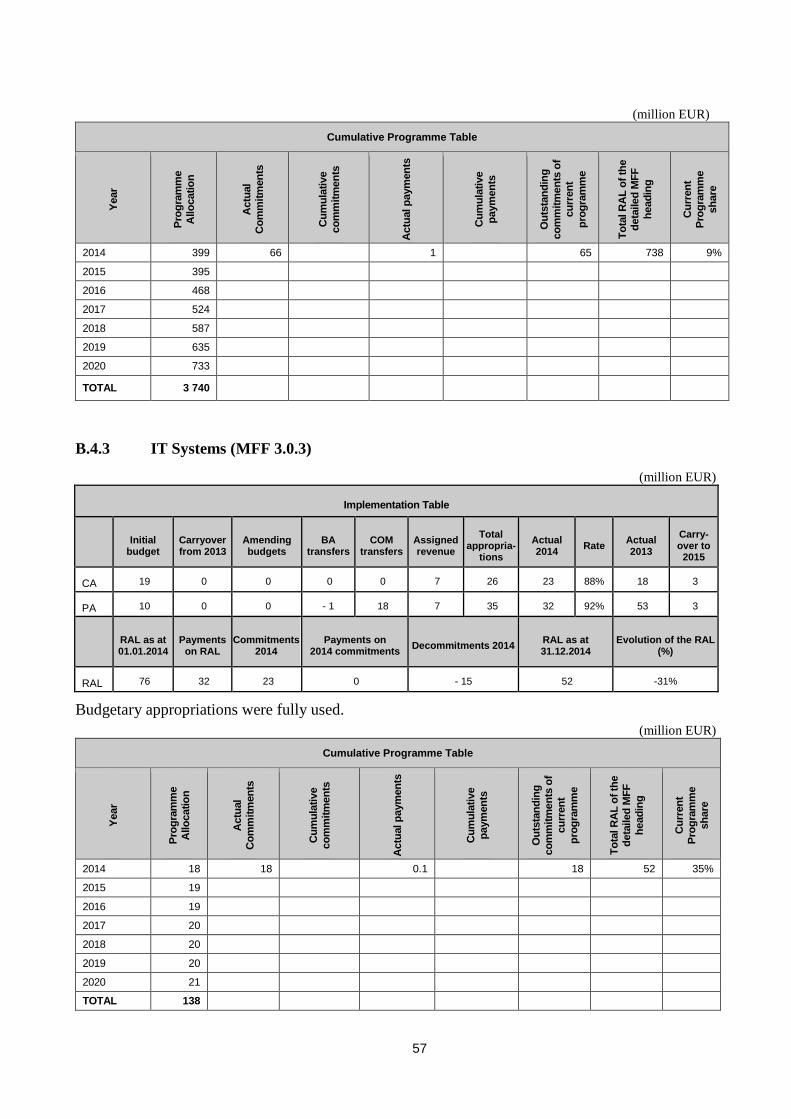
57
(million EUR)
Cumulative Programme Table
Year
Pro
gra
mm
e
Allo
catio
n
Actu
al
Co
mm
itm
en
ts
Cu
mu
lati
ve
co
mm
itm
en
ts
Actu
al p
aym
en
ts
Cu
mu
lati
ve
paym
en
ts
Ou
tsta
nd
ing
co
mm
itm
en
ts o
f cu
rren
t
pro
gra
mm
e
To
tal R
AL
of
the
deta
iled
MF
F
head
ing
Cu
rren
t P
rog
ram
me
sh
are
2014 399 66 1 65 738 9%
2015 395
2016 468
2017 524
2018 587
2019 635
2020 733
TOTAL 3 740
B.4.3 IT Systems (MFF 3.0.3)
(million EUR)
Implementation Table
Initial
budget Carryover from 2013
Amending budgets
BA transfers
COM transfers
Assigned revenue
Total appropria-
tions
Actual 2014
Rate Actual 2013
Carry-over to 2015
CA 19 0 0 0 0 7 26 23 88% 18 3
PA 10 0 0 - 1 18 7 35 32 92% 53 3
RAL as at 01.01.2014
Payments on RAL
Commitments 2014
Payments on 2014 commitments
Decommitments 2014 RAL as at 31.12.2014
Evolution of the RAL (%)
RAL 76 32 23 0 - 15 52 -31%
Budgetary appropriations were fully used.
(million EUR)
Cumulative Programme Table
Year
Pro
gra
mm
e
Allo
catio
n
Actu
al
Co
mm
itm
en
ts
Cu
mu
lati
ve
co
mm
itm
en
ts
Actu
al p
aym
en
ts
Cu
mu
lati
ve
paym
en
ts
Ou
tsta
nd
ing
co
mm
itm
en
ts o
f
cu
rren
t
pro
gra
mm
e
To
tal R
AL
of
the
deta
iled
MF
F
head
ing
Cu
rren
t P
rog
ram
me
sh
are
2014 18 18 0.1 18 52 35%
2015 19
2016 19
2017 20
2018 20
2019 20
2020 21
TOTAL 138
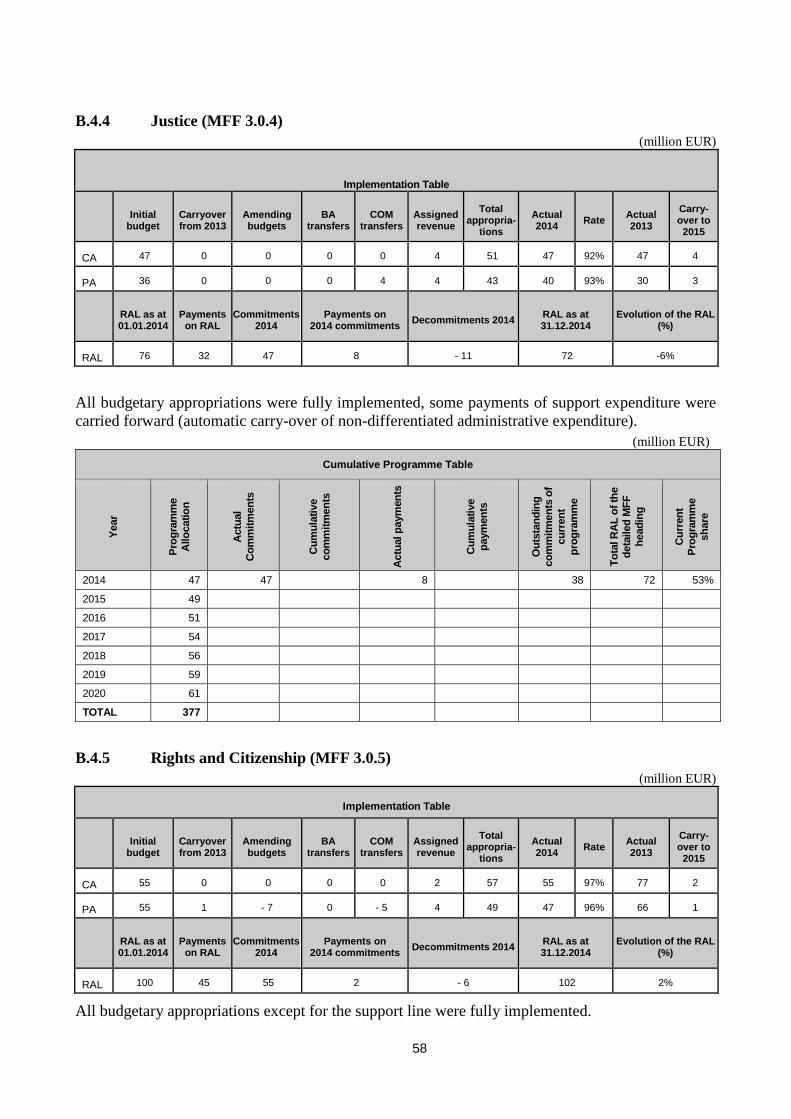
58
B.4.4 Justice (MFF 3.0.4)
(million EUR)
Implementation Table
Initial
budget Carryover from 2013
Amending budgets
BA transfers
COM transfers
Assigned revenue
Total appropria-
tions
Actual 2014
Rate Actual 2013
Carry-over to 2015
CA 47 0 0 0 0 4 51 47 92% 47 4
PA 36 0 0 0 4 4 43 40 93% 30 3
RAL as at 01.01.2014
Payments on RAL
Commitments 2014
Payments on 2014 commitments
Decommitments 2014 RAL as at 31.12.2014
Evolution of the RAL (%)
RAL 76 32 47 8 - 11 72 -6%
All budgetary appropriations were fully implemented, some payments of support expenditure were
carried forward (automatic carry-over of non-differentiated administrative expenditure).
(million EUR)
Cumulative Programme Table
Year
Pro
gra
mm
e
Allo
catio
n
Actu
al
Co
mm
itm
en
ts
Cu
mu
lati
ve
co
mm
itm
en
ts
Actu
al p
aym
en
ts
Cu
mu
lati
ve
paym
en
ts
Ou
tsta
nd
ing
co
mm
itm
en
ts o
f
cu
rren
t
pro
gra
mm
e
To
tal R
AL
of
the
deta
iled
MF
F
head
ing
Cu
rren
t P
rog
ram
me
sh
are
2014 47 47 8 38 72 53%
2015 49
2016 51
2017 54
2018 56
2019 59
2020 61
TOTAL 377
B.4.5 Rights and Citizenship (MFF 3.0.5)
(million EUR)
Implementation Table
Initial
budget Carryover from 2013
Amending budgets
BA transfers
COM transfers
Assigned revenue
Total appropria-
tions
Actual 2014
Rate Actual 2013
Carry-over to 2015
CA 55 0 0 0 0 2 57 55 97% 77 2
PA 55 1 - 7 0 - 5 4 49 47 96% 66 1
RAL as at 01.01.2014
Payments on RAL
Commitments 2014
Payments on 2014 commitments
Decommitments 2014 RAL as at 31.12.2014
Evolution of the RAL (%)
RAL 100 45 55 2 - 6 102 2%
All budgetary appropriations except for the support line were fully implemented.
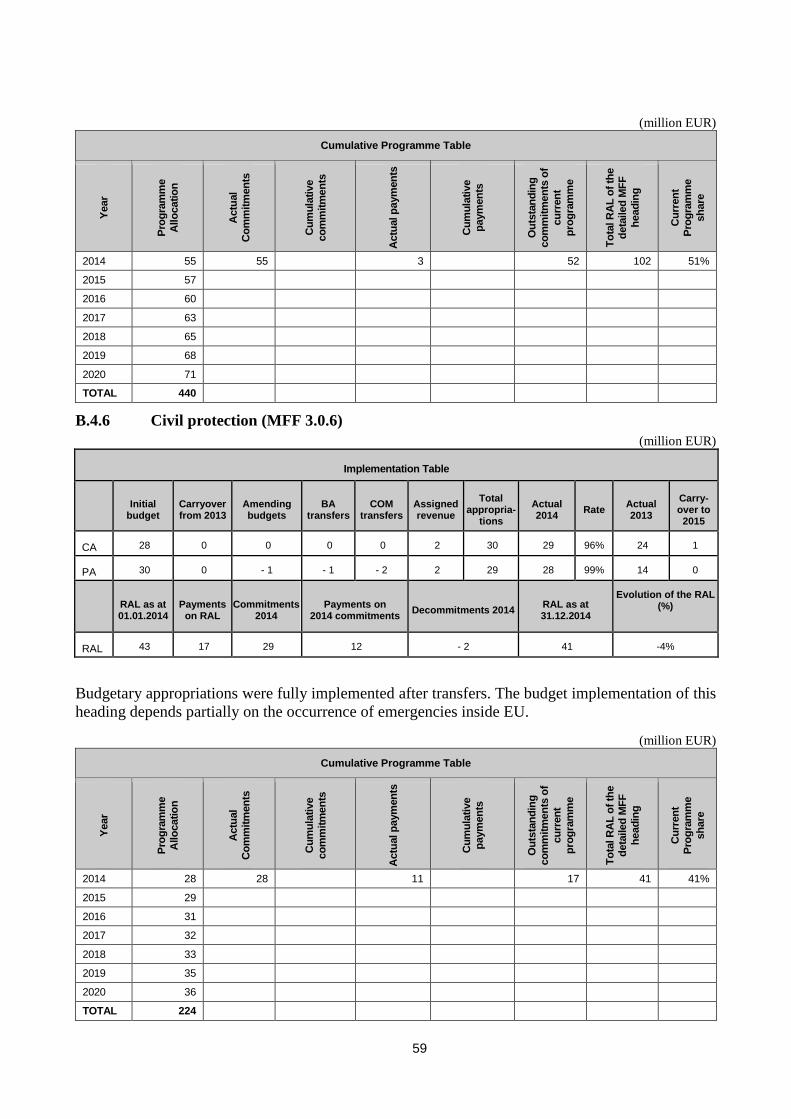
59
(million EUR)
Cumulative Programme Table
Year
Pro
gra
mm
e
Allo
catio
n
Actu
al
Co
mm
itm
en
ts
Cu
mu
lati
ve
co
mm
itm
en
ts
Actu
al p
aym
en
ts
Cu
mu
lati
ve
paym
en
ts
Ou
tsta
nd
ing
co
mm
itm
en
ts o
f
cu
rren
t
pro
gra
mm
e
To
tal R
AL
of
the
deta
iled
MF
F
head
ing
Cu
rren
t P
rog
ram
me
sh
are
2014 55 55 3 52 102 51%
2015 57
2016 60
2017 63
2018 65
2019 68
2020 71
TOTAL 440
B.4.6 Civil protection (MFF 3.0.6)
(million EUR)
Implementation Table
Initial
budget Carryover from 2013
Amending budgets
BA transfers
COM transfers
Assigned revenue
Total appropria-
tions
Actual 2014
Rate Actual 2013
Carry-over to 2015
CA 28 0 0 0 0 2 30 29 96% 24 1
PA 30 0 - 1 - 1 - 2 2 29 28 99% 14 0
RAL as at 01.01.2014
Payments on RAL
Commitments 2014
Payments on 2014 commitments
Decommitments 2014 RAL as at 31.12.2014
Evolution of the RAL (%)
RAL 43 17 29 12 - 2 41 -4%
Budgetary appropriations were fully implemented after transfers. The budget implementation of this
heading depends partially on the occurrence of emergencies inside EU.
(million EUR)
Cumulative Programme Table
Year
Pro
gra
mm
e
Allo
catio
n
Actu
al
Co
mm
itm
en
ts
Cu
mu
lati
ve
co
mm
itm
en
ts
Actu
al p
aym
en
ts
Cu
mu
lati
ve
paym
en
ts
Ou
tsta
nd
ing
co
mm
itm
en
ts o
f
cu
rren
t
pro
gra
mm
e
To
tal R
AL
of
the
deta
iled
MF
F
head
ing
Cu
rren
t P
rog
ram
me
sh
are
2014 28 28 11 17 41 41%
2015 29
2016 31
2017 32
2018 33
2019 35
2020 36
TOTAL 224
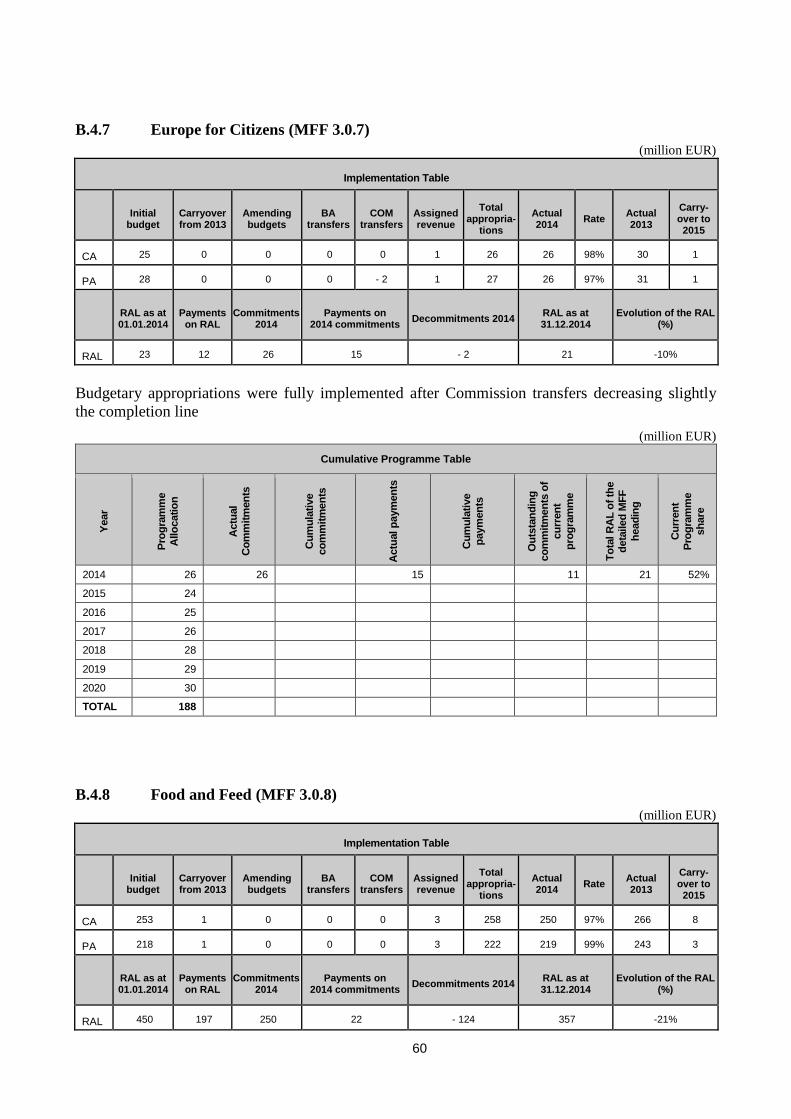
60
B.4.7 Europe for Citizens (MFF 3.0.7)
(million EUR)
Implementation Table
Initial
budget Carryover from 2013
Amending budgets
BA transfers
COM transfers
Assigned revenue
Total appropria-
tions
Actual 2014
Rate Actual 2013
Carry-over to 2015
CA 25 0 0 0 0 1 26 26 98% 30 1
PA 28 0 0 0 - 2 1 27 26 97% 31 1
RAL as at 01.01.2014
Payments on RAL
Commitments 2014
Payments on 2014 commitments
Decommitments 2014 RAL as at 31.12.2014
Evolution of the RAL (%)
RAL 23 12 26 15 - 2 21 -10%
Budgetary appropriations were fully implemented after Commission transfers decreasing slightly
the completion line
(million EUR)
Cumulative Programme Table
Year
Pro
gra
mm
e
Allo
catio
n
Actu
al
Co
mm
itm
en
ts
Cu
mu
lati
ve
co
mm
itm
en
ts
Actu
al p
aym
en
ts
Cu
mu
lati
ve
paym
en
ts
Ou
tsta
nd
ing
co
mm
itm
en
ts o
f
cu
rren
t
pro
gra
mm
e
To
tal R
AL
of
the
deta
iled
MF
F
head
ing
Cu
rren
t P
rog
ram
me
sh
are
2014 26 26 15 11 21 52%
2015 24
2016 25
2017 26
2018 28
2019 29
2020 30
TOTAL 188
B.4.8 Food and Feed (MFF 3.0.8)
(million EUR)
Implementation Table
Initial
budget Carryover from 2013
Amending budgets
BA transfers
COM transfers
Assigned revenue
Total appropria-
tions
Actual 2014
Rate Actual 2013
Carry-over to 2015
CA 253 1 0 0 0 3 258 250 97% 266 8
PA 218 1 0 0 0 3 222 219 99% 243 3
RAL as at 01.01.2014
Payments on RAL
Commitments 2014
Payments on 2014 commitments
Decommitments 2014 RAL as at 31.12.2014
Evolution of the RAL (%)
RAL 450 197 250 22 - 124 357 -21%
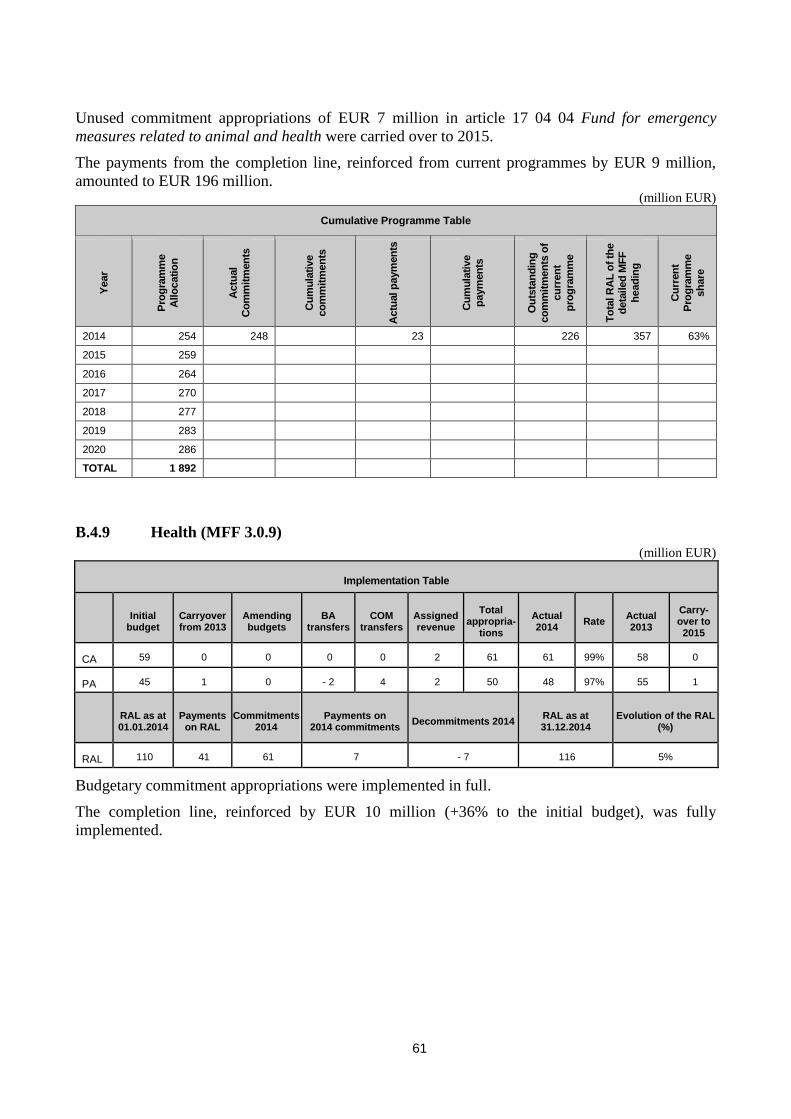
61
Unused commitment appropriations of EUR 7 million in article 17 04 04 Fund for emergency
measures related to animal and health were carried over to 2015.
The payments from the completion line, reinforced from current programmes by EUR 9 million,
amounted to EUR 196 million. (million EUR)
Cumulative Programme Table
Year
Pro
gra
mm
e
Allo
catio
n
Actu
al
Co
mm
itm
en
ts
Cu
mu
lati
ve
co
mm
itm
en
ts
Actu
al p
aym
en
ts
Cu
mu
lati
ve
paym
en
ts
Ou
tsta
nd
ing
co
mm
itm
en
ts o
f
cu
rren
t
pro
gra
mm
e
To
tal R
AL
of
the
deta
iled
MF
F
head
ing
Cu
rren
t P
rog
ram
me
sh
are
2014 254 248 23 226 357 63%
2015 259
2016 264
2017 270
2018 277
2019 283
2020 286
TOTAL 1 892
B.4.9 Health (MFF 3.0.9)
(million EUR)
Implementation Table
Initial
budget Carryover from 2013
Amending budgets
BA transfers
COM transfers
Assigned revenue
Total appropria-
tions
Actual 2014
Rate Actual 2013
Carry-over to 2015
CA 59 0 0 0 0 2 61 61 99% 58 0
PA 45 1 0 - 2 4 2 50 48 97% 55 1
RAL as at 01.01.2014
Payments on RAL
Commitments 2014
Payments on 2014 commitments
Decommitments 2014 RAL as at 31.12.2014
Evolution of the RAL (%)
RAL 110 41 61 7 - 7 116 5%
Budgetary commitment appropriations were implemented in full.
The completion line, reinforced by EUR 10 million (+36% to the initial budget), was fully
implemented.
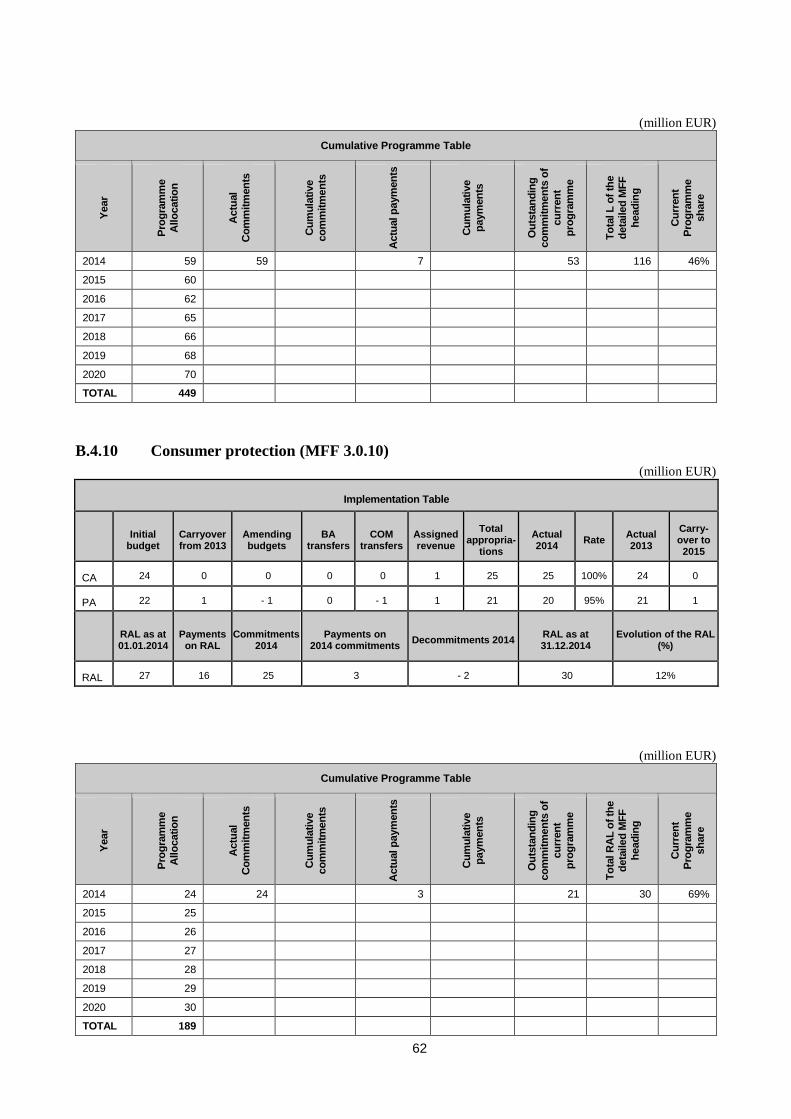
62
(million EUR)
Cumulative Programme Table
Year
Pro
gra
mm
e
Allo
catio
n
Actu
al
Co
mm
itm
en
ts
Cu
mu
lati
ve
co
mm
itm
en
ts
Actu
al p
aym
en
ts
Cu
mu
lati
ve
paym
en
ts
Ou
tsta
nd
ing
co
mm
itm
en
ts o
f
cu
rren
t
pro
gra
mm
e
To
tal L
of
the
deta
iled
MF
F
head
ing
Cu
rren
t P
rog
ram
me
sh
are
2014 59 59 7 53 116 46%
2015 60
2016 62
2017 65
2018 66
2019 68
2020 70
TOTAL 449
B.4.10 Consumer protection (MFF 3.0.10)
(million EUR)
Implementation Table
Initial
budget Carryover from 2013
Amending budgets
BA transfers
COM transfers
Assigned revenue
Total appropria-
tions
Actual 2014
Rate Actual 2013
Carry-over to 2015
CA 24 0 0 0 0 1 25 25 100% 24 0
PA 22 1 - 1 0 - 1 1 21 20 95% 21 1
RAL as at 01.01.2014
Payments on RAL
Commitments 2014
Payments on 2014 commitments
Decommitments 2014 RAL as at 31.12.2014
Evolution of the RAL (%)
RAL 27 16 25 3 - 2 30 12%
(million EUR)
Cumulative Programme Table
Year
Pro
gra
mm
e
Allo
catio
n
Actu
al
Co
mm
itm
en
ts
Cu
mu
lati
ve
co
mm
itm
en
ts
Actu
al p
aym
en
ts
Cu
mu
lati
ve
paym
en
ts
Ou
tsta
nd
ing
co
mm
itm
en
ts o
f
cu
rren
t
pro
gra
mm
e
To
tal R
AL
of
the
deta
iled
MF
F
head
ing
Cu
rren
t P
rog
ram
me
sh
are
2014 24 24 3 21 30 69%
2015 25
2016 26
2017 27
2018 28
2019 29
2020 30
TOTAL 189
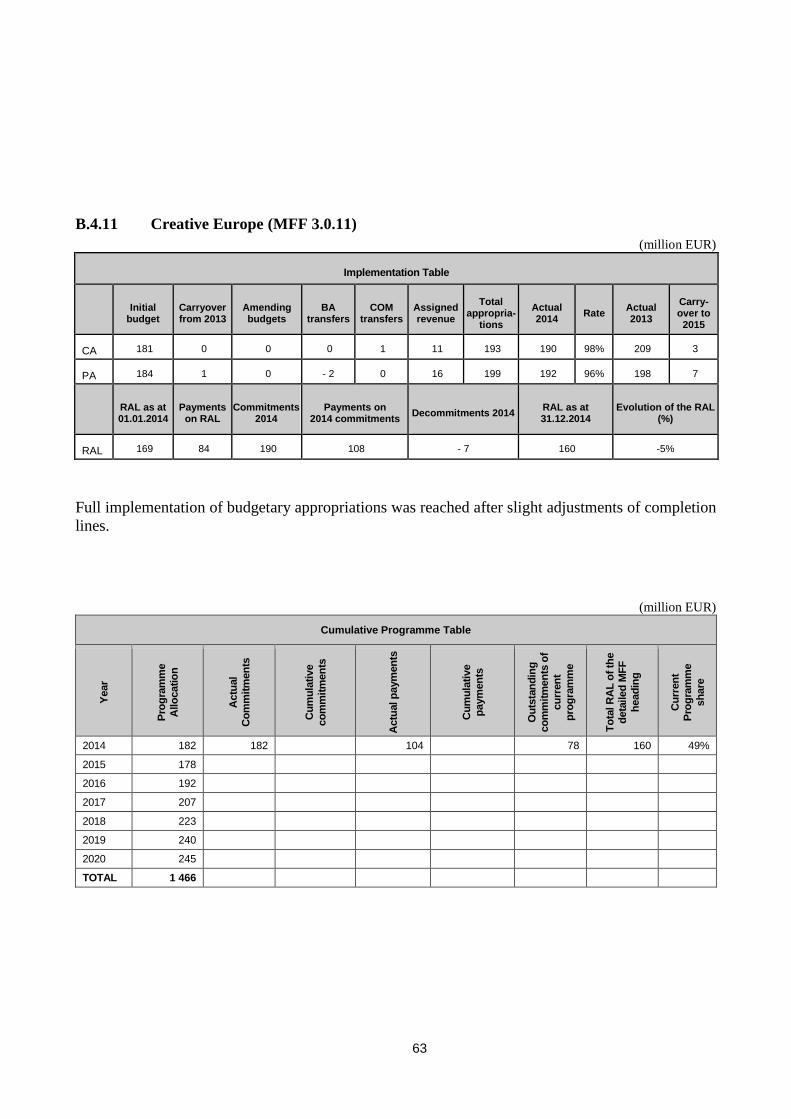
63
B.4.11 Creative Europe (MFF 3.0.11)
(million EUR)
Implementation Table
Initial
budget Carryover from 2013
Amending budgets
BA transfers
COM transfers
Assigned revenue
Total appropria-
tions
Actual 2014
Rate Actual 2013
Carry-over to 2015
CA 181 0 0 0 1 11 193 190 98% 209 3
PA 184 1 0 - 2 0 16 199 192 96% 198 7
RAL as at 01.01.2014
Payments on RAL
Commitments 2014
Payments on 2014 commitments
Decommitments 2014 RAL as at 31.12.2014
Evolution of the RAL (%)
RAL 169 84 190 108 - 7 160 -5%
Full implementation of budgetary appropriations was reached after slight adjustments of completion
lines.
(million EUR)
Cumulative Programme Table
Year
Pro
gra
mm
e
Allo
catio
n
Actu
al
Co
mm
itm
en
ts
Cu
mu
lati
ve
co
mm
itm
en
ts
Actu
al p
aym
en
ts
Cu
mu
lati
ve
paym
en
ts
Ou
tsta
nd
ing
co
mm
itm
en
ts o
f
cu
rren
t
pro
gra
mm
e
To
tal R
AL
of
the
deta
iled
MF
F
head
ing
Cu
rren
t P
rog
ram
me
sh
are
2014 182 182 104 78 160 49%
2015 178
2016 192
2017 207
2018 223
2019 240
2020 245
TOTAL 1 466
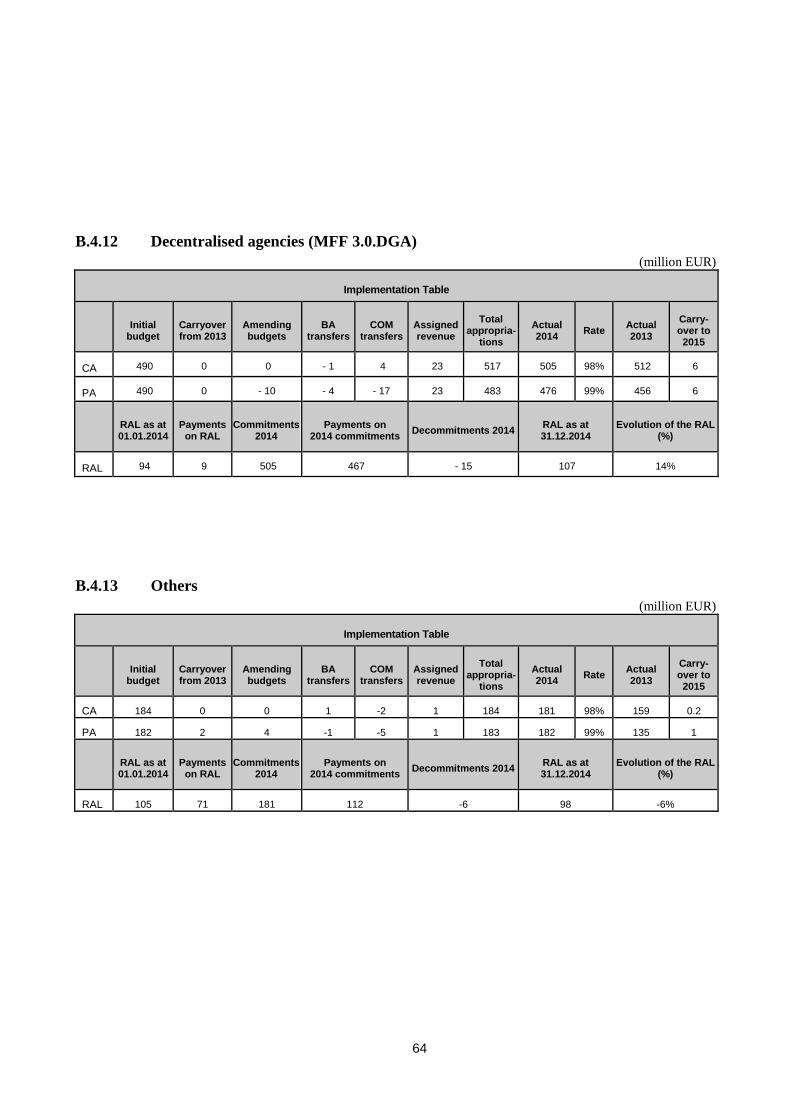
64
B.4.12 Decentralised agencies (MFF 3.0.DGA)
(million EUR)
Implementation Table
Initial
budget Carryover from 2013
Amending budgets
BA transfers
COM transfers
Assigned revenue
Total appropria-
tions
Actual 2014
Rate Actual 2013
Carry-over to 2015
CA 490 0 0 - 1 4 23 517 505 98% 512 6
PA 490 0 - 10 - 4 - 17 23 483 476 99% 456 6
RAL as at 01.01.2014
Payments on RAL
Commitments 2014
Payments on 2014 commitments
Decommitments 2014 RAL as at 31.12.2014
Evolution of the RAL (%)
RAL 94 9 505 467 - 15 107 14%
B.4.13 Others
(million EUR)
Implementation Table
Initial
budget Carryover from 2013
Amending budgets
BA transfers
COM transfers
Assigned revenue
Total appropria-
tions
Actual 2014
Rate Actual 2013
Carry-over to 2015
CA 184 0 0 1 -2 1 184 181 98% 159 0.2
PA 182 2 4 -1 -5 1 183 182 99% 135 1
RAL as at 01.01.2014
Payments on RAL
Commitments 2014
Payments on 2014 commitments
Decommitments 2014 RAL as at 31.12.2014
Evolution of the RAL (%)
RAL 105 71 181 112 -6 98 -6%
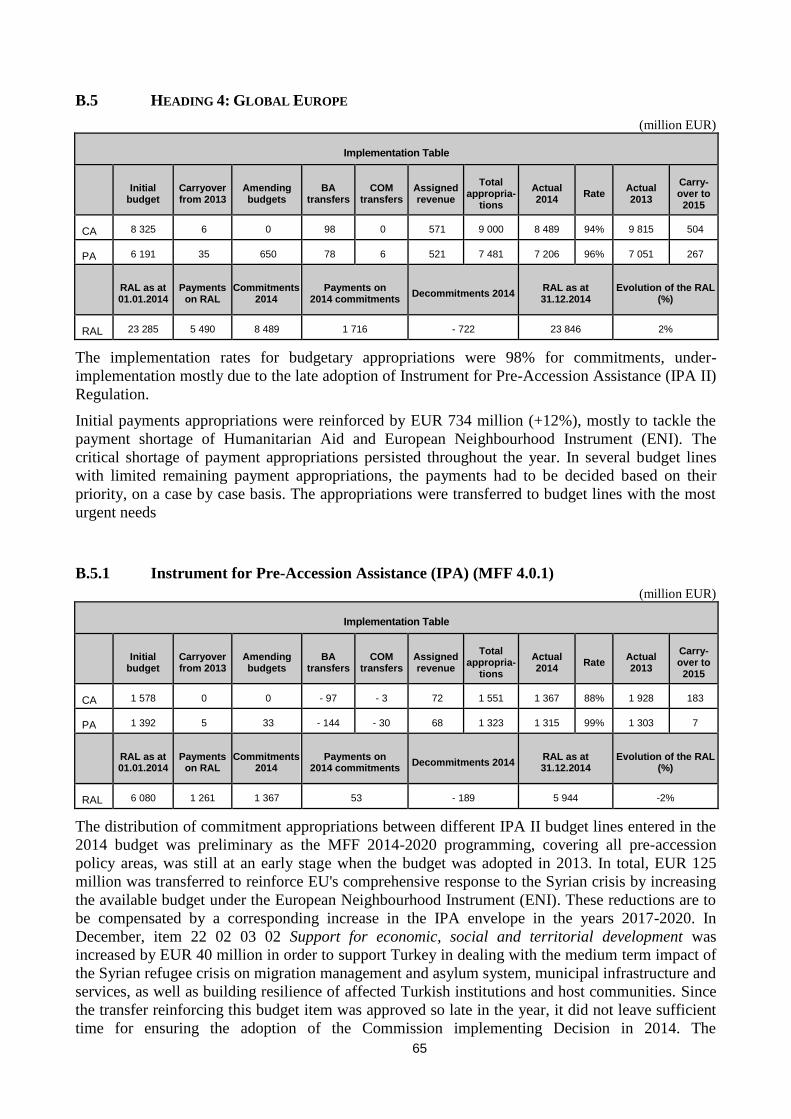
65
B.5 HEADING 4: GLOBAL EUROPE
(million EUR)
Implementation Table
Initial
budget Carryover from 2013
Amending budgets
BA transfers
COM transfers
Assigned revenue
Total appropria-
tions
Actual 2014
Rate Actual 2013
Carry-over to 2015
CA 8 325 6 0 98 0 571 9 000 8 489 94% 9 815 504
PA 6 191 35 650 78 6 521 7 481 7 206 96% 7 051 267
RAL as at 01.01.2014
Payments on RAL
Commitments 2014
Payments on 2014 commitments
Decommitments 2014 RAL as at 31.12.2014
Evolution of the RAL (%)
RAL 23 285 5 490 8 489 1 716 - 722 23 846 2%
The implementation rates for budgetary appropriations were 98% for commitments, under-
implementation mostly due to the late adoption of Instrument for Pre-Accession Assistance (IPA II)
Regulation.
Initial payments appropriations were reinforced by EUR 734 million (+12%), mostly to tackle the
payment shortage of Humanitarian Aid and European Neighbourhood Instrument (ENI). The
critical shortage of payment appropriations persisted throughout the year. In several budget lines
with limited remaining payment appropriations, the payments had to be decided based on their
priority, on a case by case basis. The appropriations were transferred to budget lines with the most
urgent needs
B.5.1 Instrument for Pre-Accession Assistance (IPA) (MFF 4.0.1)
(million EUR)
Implementation Table
Initial
budget Carryover from 2013
Amending budgets
BA transfers
COM transfers
Assigned revenue
Total appropria-
tions
Actual 2014
Rate Actual 2013
Carry-over to 2015
CA 1 578 0 0 - 97 - 3 72 1 551 1 367 88% 1 928 183
PA 1 392 5 33 - 144 - 30 68 1 323 1 315 99% 1 303 7
RAL as at 01.01.2014
Payments on RAL
Commitments 2014
Payments on 2014 commitments
Decommitments 2014 RAL as at 31.12.2014
Evolution of the RAL (%)
RAL 6 080 1 261 1 367 53 - 189 5 944 -2%
The distribution of commitment appropriations between different IPA II budget lines entered in the
2014 budget was preliminary as the MFF 2014-2020 programming, covering all pre-accession
policy areas, was still at an early stage when the budget was adopted in 2013. In total, EUR 125
million was transferred to reinforce EU's comprehensive response to the Syrian crisis by increasing
the available budget under the European Neighbourhood Instrument (ENI). These reductions are to
be compensated by a corresponding increase in the IPA envelope in the years 2017-2020. In
December, item 22 02 03 02 Support for economic, social and territorial development was
increased by EUR 40 million in order to support Turkey in dealing with the medium term impact of
the Syrian refugee crisis on migration management and asylum system, municipal infrastructure and
services, as well as building resilience of affected Turkish institutions and host communities. Since
the transfer reinforcing this budget item was approved so late in the year, it did not leave sufficient
time for ensuring the adoption of the Commission implementing Decision in 2014. The
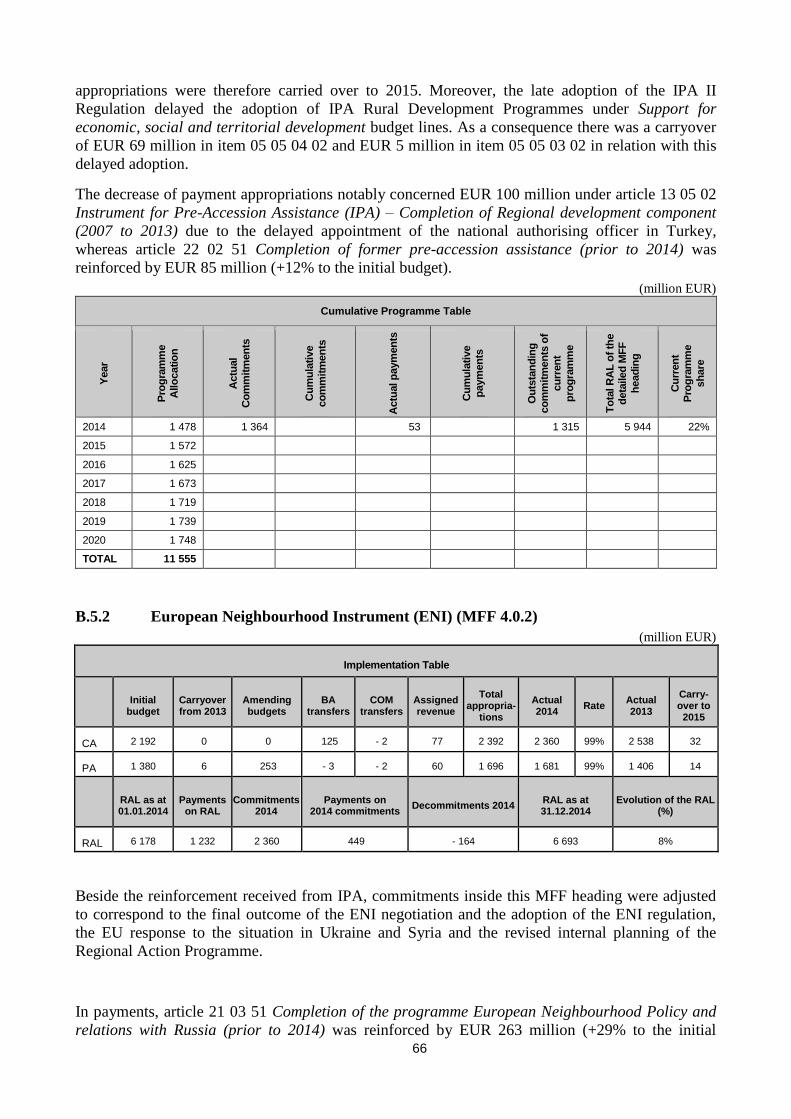
66
appropriations were therefore carried over to 2015. Moreover, the late adoption of the IPA II
Regulation delayed the adoption of IPA Rural Development Programmes under Support for
economic, social and territorial development budget lines. As a consequence there was a carryover
of EUR 69 million in item 05 05 04 02 and EUR 5 million in item 05 05 03 02 in relation with this
delayed adoption.
The decrease of payment appropriations notably concerned EUR 100 million under article 13 05 02
Instrument for Pre-Accession Assistance (IPA) – Completion of Regional development component
(2007 to 2013) due to the delayed appointment of the national authorising officer in Turkey,
whereas article 22 02 51 Completion of former pre-accession assistance (prior to 2014) was
reinforced by EUR 85 million (+12% to the initial budget).
(million EUR)
Cumulative Programme Table
Year
Pro
gra
mm
e
Allo
catio
n
Actu
al
Co
mm
itm
en
ts
Cu
mu
lati
ve
co
mm
itm
en
ts
Actu
al p
aym
en
ts
Cu
mu
lati
ve
paym
en
ts
Ou
tsta
nd
ing
co
mm
itm
en
ts o
f
cu
rren
t
pro
gra
mm
e
To
tal R
AL
of
the
deta
iled
MF
F
head
ing
Cu
rren
t P
rog
ram
me
sh
are
2014 1 478 1 364 53 1 315 5 944 22%
2015 1 572
2016 1 625
2017 1 673
2018 1 719
2019 1 739
2020 1 748
TOTAL 11 555
B.5.2 European Neighbourhood Instrument (ENI) (MFF 4.0.2)
(million EUR)
Implementation Table
Initial
budget Carryover from 2013
Amending budgets
BA transfers
COM transfers
Assigned revenue
Total appropria-
tions
Actual 2014
Rate Actual 2013
Carry-over to 2015
CA 2 192 0 0 125 - 2 77 2 392 2 360 99% 2 538 32
PA 1 380 6 253 - 3 - 2 60 1 696 1 681 99% 1 406 14
RAL as at 01.01.2014
Payments on RAL
Commitments 2014
Payments on 2014 commitments
Decommitments 2014 RAL as at 31.12.2014
Evolution of the RAL (%)
RAL 6 178 1 232 2 360 449 - 164 6 693 8%
Beside the reinforcement received from IPA, commitments inside this MFF heading were adjusted
to correspond to the final outcome of the ENI negotiation and the adoption of the ENI regulation,
the EU response to the situation in Ukraine and Syria and the revised internal planning of the
Regional Action Programme.
In payments, article 21 03 51 Completion of the programme European Neighbourhood Policy and
relations with Russia (prior to 2014) was reinforced by EUR 263 million (+29% to the initial
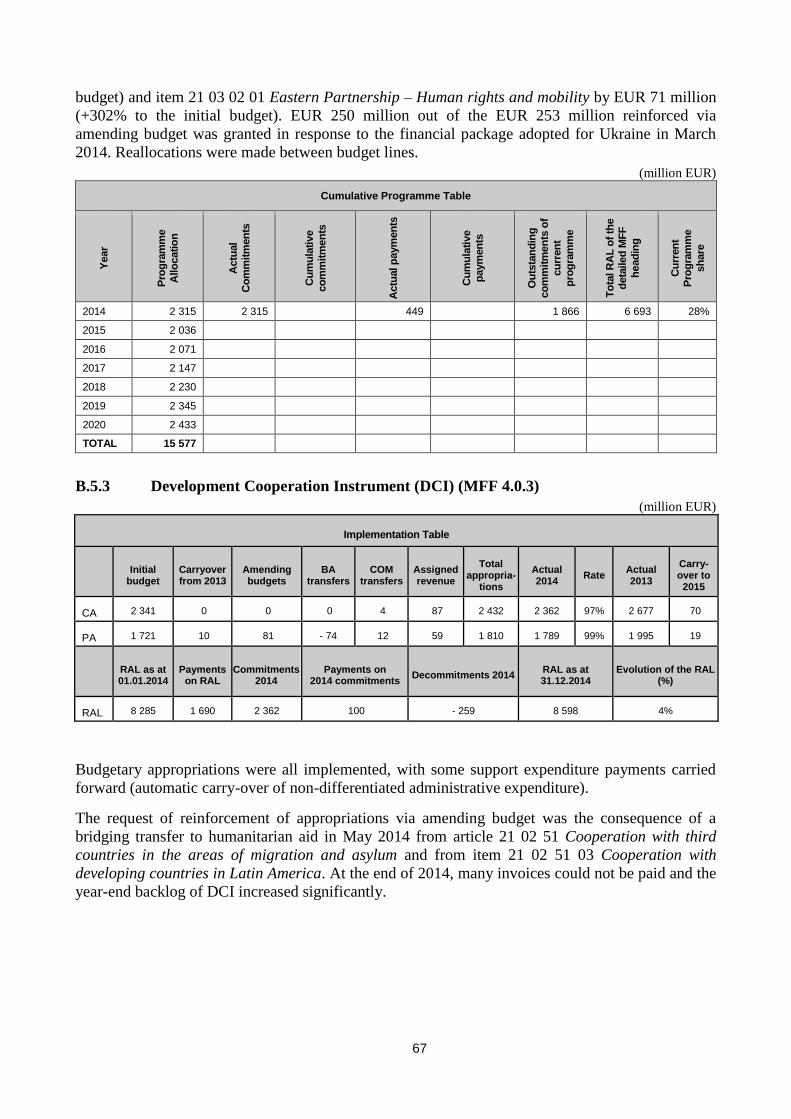
67
budget) and item 21 03 02 01 Eastern Partnership – Human rights and mobility by EUR 71 million
(+302% to the initial budget). EUR 250 million out of the EUR 253 million reinforced via
amending budget was granted in response to the financial package adopted for Ukraine in March
2014. Reallocations were made between budget lines.
(million EUR)
Cumulative Programme Table
Year
Pro
gra
mm
e
Allo
catio
n
Actu
al
Co
mm
itm
en
ts
Cu
mu
lati
ve
co
mm
itm
en
ts
Actu
al p
aym
en
ts
Cu
mu
lati
ve
paym
en
ts
Ou
tsta
nd
ing
co
mm
itm
en
ts o
f
cu
rren
t
pro
gra
mm
e
To
tal R
AL
of
the
deta
iled
MF
F
head
ing
Cu
rren
t P
rog
ram
me
sh
are
2014 2 315 2 315 449 1 866 6 693 28%
2015 2 036
2016 2 071
2017 2 147
2018 2 230
2019 2 345
2020 2 433
TOTAL 15 577
B.5.3 Development Cooperation Instrument (DCI) (MFF 4.0.3)
(million EUR)
Implementation Table
Initial
budget Carryover from 2013
Amending budgets
BA transfers
COM transfers
Assigned revenue
Total appropria-
tions
Actual 2014
Rate Actual 2013
Carry-over to 2015
CA 2 341 0 0 0 4 87 2 432 2 362 97% 2 677 70
PA 1 721 10 81 - 74 12 59 1 810 1 789 99% 1 995 19
RAL as at 01.01.2014
Payments on RAL
Commitments 2014
Payments on 2014 commitments
Decommitments 2014 RAL as at 31.12.2014
Evolution of the RAL (%)
RAL 8 285 1 690 2 362 100 - 259 8 598 4%
Budgetary appropriations were all implemented, with some support expenditure payments carried
forward (automatic carry-over of non-differentiated administrative expenditure).
The request of reinforcement of appropriations via amending budget was the consequence of a
bridging transfer to humanitarian aid in May 2014 from article 21 02 51 Cooperation with third
countries in the areas of migration and asylum and from item 21 02 51 03 Cooperation with
developing countries in Latin America. At the end of 2014, many invoices could not be paid and the
year-end backlog of DCI increased significantly.
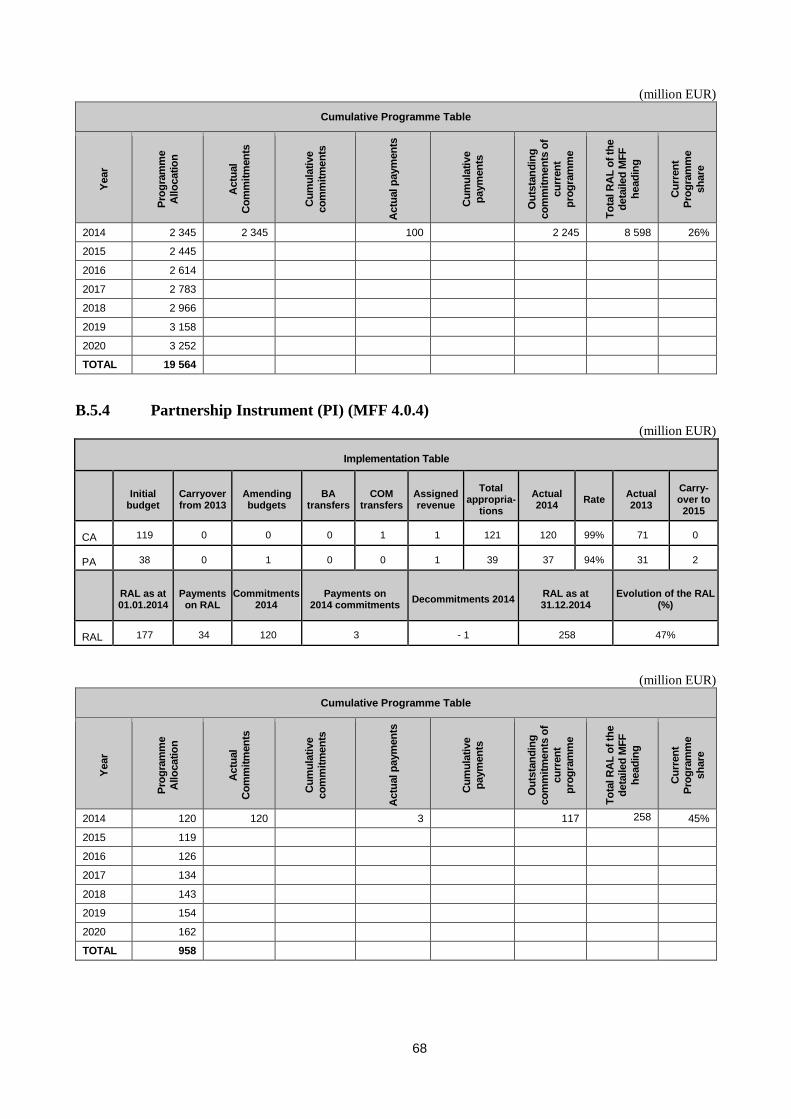
68
(million EUR)
Cumulative Programme Table
Year
Pro
gra
mm
e
Allo
catio
n
Actu
al
Co
mm
itm
en
ts
Cu
mu
lati
ve
co
mm
itm
en
ts
Actu
al p
aym
en
ts
Cu
mu
lati
ve
paym
en
ts
Ou
tsta
nd
ing
co
mm
itm
en
ts o
f
cu
rren
t
pro
gra
mm
e
To
tal R
AL
of
the
deta
iled
MF
F
head
ing
Cu
rren
t P
rog
ram
me
sh
are
2014 2 345 2 345 100 2 245 8 598 26%
2015 2 445
2016 2 614
2017 2 783
2018 2 966
2019 3 158
2020 3 252
TOTAL 19 564
B.5.4 Partnership Instrument (PI) (MFF 4.0.4)
(million EUR)
Implementation Table
Initial
budget Carryover from 2013
Amending budgets
BA transfers
COM transfers
Assigned revenue
Total appropria-
tions
Actual 2014
Rate Actual 2013
Carry-over to 2015
CA 119 0 0 0 1 1 121 120 99% 71 0
PA 38 0 1 0 0 1 39 37 94% 31 2
RAL as at 01.01.2014
Payments on RAL
Commitments 2014
Payments on 2014 commitments
Decommitments 2014 RAL as at 31.12.2014
Evolution of the RAL (%)
RAL 177 34 120 3 - 1 258 47%
(million EUR)
Cumulative Programme Table
Year
Pro
gra
mm
e
Allo
catio
n
Actu
al
Co
mm
itm
en
ts
Cu
mu
lati
ve
co
mm
itm
en
ts
Actu
al p
aym
en
ts
Cu
mu
lati
ve
paym
en
ts
Ou
tsta
nd
ing
co
mm
itm
en
ts o
f
cu
rren
t
pro
gra
mm
e
To
tal R
AL
of
the
deta
iled
MF
F
head
ing
Cu
rren
t P
rog
ram
me
sh
are
2014 120 120 3 117 258
45%
2015 119
2016 126
2017 134
2018 143
2019 154
2020 162
TOTAL 958
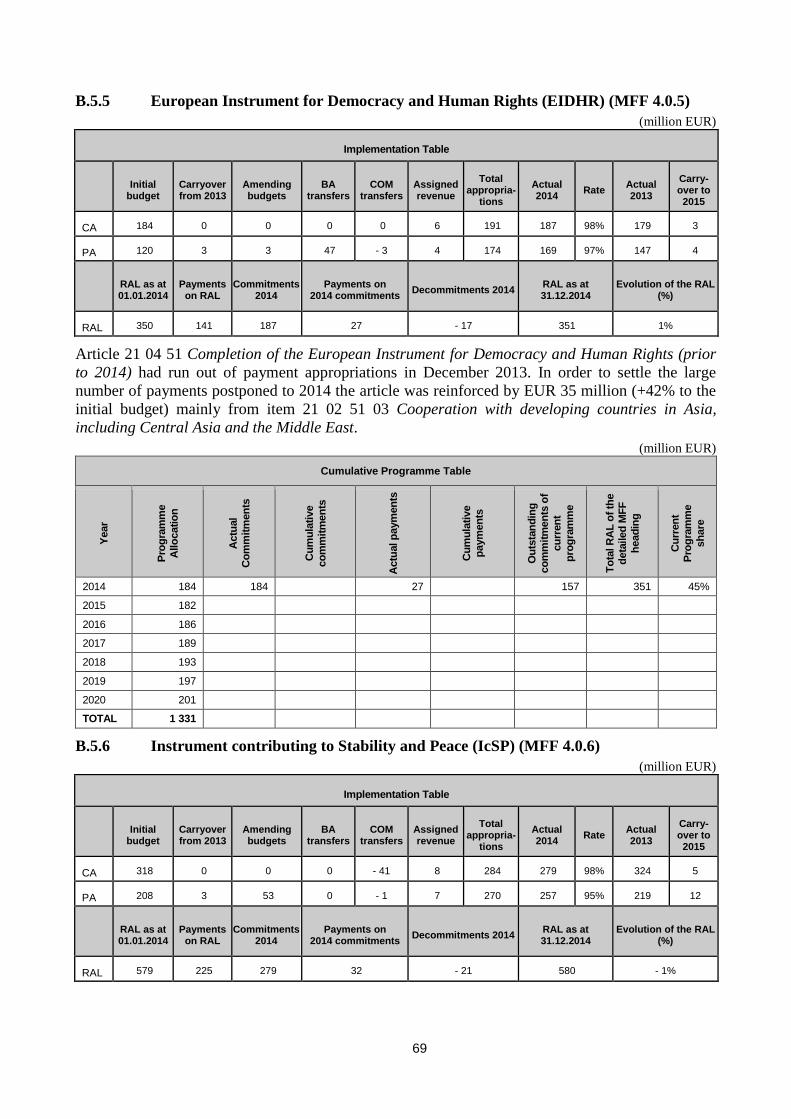
69
B.5.5 European Instrument for Democracy and Human Rights (EIDHR) (MFF 4.0.5)
(million EUR)
Implementation Table
Initial
budget Carryover from 2013
Amending budgets
BA transfers
COM transfers
Assigned revenue
Total appropria-
tions
Actual 2014
Rate Actual 2013
Carry-over to 2015
CA 184 0 0 0 0 6 191 187 98% 179 3
PA 120 3 3 47 - 3 4 174 169 97% 147 4
RAL as at 01.01.2014
Payments on RAL
Commitments 2014
Payments on 2014 commitments
Decommitments 2014 RAL as at 31.12.2014
Evolution of the RAL (%)
RAL 350 141 187 27 - 17 351 1%
Article 21 04 51 Completion of the European Instrument for Democracy and Human Rights (prior
to 2014) had run out of payment appropriations in December 2013. In order to settle the large
number of payments postponed to 2014 the article was reinforced by EUR 35 million (+42% to the
initial budget) mainly from item 21 02 51 03 Cooperation with developing countries in Asia,
including Central Asia and the Middle East.
(million EUR)
Cumulative Programme Table
Year
Pro
gra
mm
e
Allo
catio
n
Actu
al
Co
mm
itm
en
ts
Cu
mu
lati
ve
co
mm
itm
en
ts
Actu
al p
aym
en
ts
Cu
mu
lati
ve
paym
en
ts
Ou
tsta
nd
ing
co
mm
itm
en
ts o
f
cu
rren
t
pro
gra
mm
e
To
tal R
AL
of
the
deta
iled
MF
F
head
ing
Cu
rren
t P
rog
ram
me
sh
are
2014 184 184 27 157 351 45%
2015 182
2016 186
2017 189
2018 193
2019 197
2020 201
TOTAL 1 331
B.5.6 Instrument contributing to Stability and Peace (IcSP) (MFF 4.0.6)
(million EUR)
Implementation Table
Initial
budget Carryover from 2013
Amending budgets
BA transfers
COM transfers
Assigned revenue
Total appropria-
tions
Actual 2014
Rate Actual 2013
Carry-over to 2015
CA 318 0 0 0 - 41 8 284 279 98% 324 5
PA 208 3 53 0 - 1 7 270 257 95% 219 12
RAL as at 01.01.2014
Payments on RAL
Commitments 2014
Payments on 2014 commitments
Decommitments 2014 RAL as at 31.12.2014
Evolution of the RAL (%)
RAL 579 225 279 32 - 21 580 - 1%
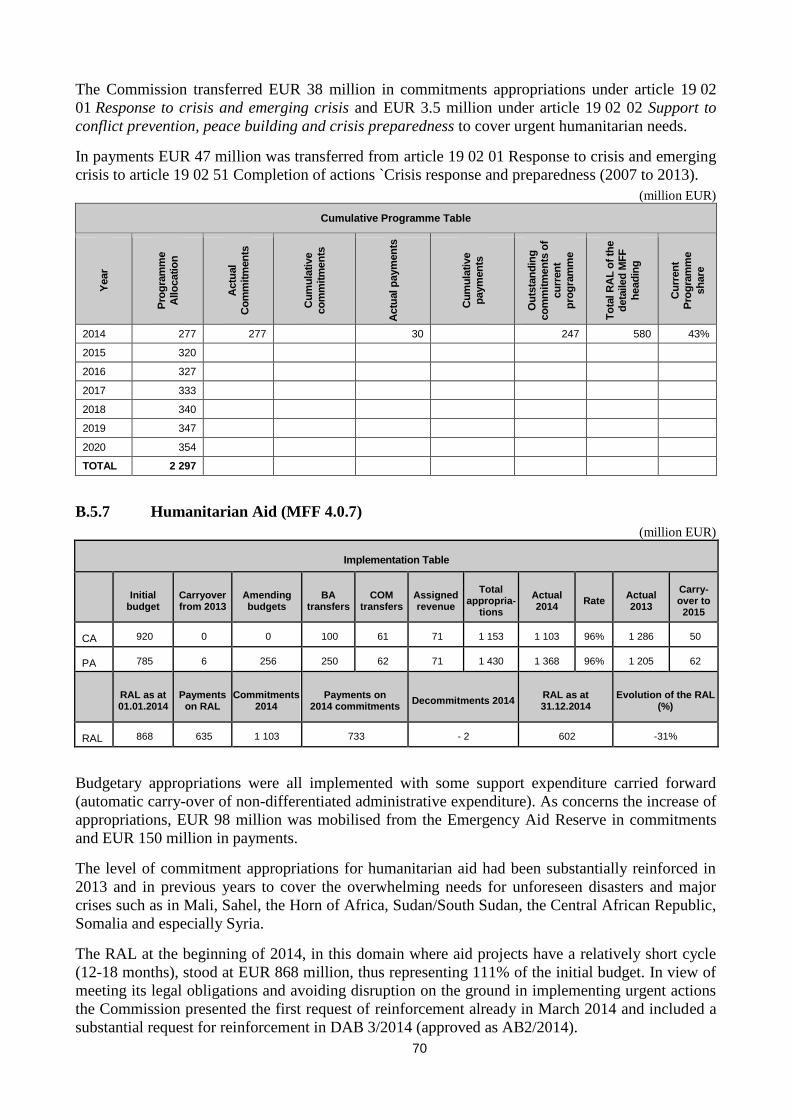
70
The Commission transferred EUR 38 million in commitments appropriations under article 19 02
01 Response to crisis and emerging crisis and EUR 3.5 million under article 19 02 02 Support to
conflict prevention, peace building and crisis preparedness to cover urgent humanitarian needs.
In payments EUR 47 million was transferred from article 19 02 01 Response to crisis and emerging
crisis to article 19 02 51 Completion of actions `Crisis response and preparedness (2007 to 2013).
(million EUR)
Cumulative Programme Table
Year
Pro
gra
mm
e
Allo
catio
n
Actu
al
Co
mm
itm
en
ts
Cu
mu
lati
ve
co
mm
itm
en
ts
Actu
al p
aym
en
ts
Cu
mu
lati
ve
paym
en
ts
Ou
tsta
nd
ing
co
mm
itm
en
ts o
f
cu
rren
t
pro
gra
mm
e
To
tal R
AL
of
the
deta
iled
MF
F
head
ing
Cu
rren
t P
rog
ram
me
sh
are
2014 277 277 30 247 580 43%
2015 320
2016 327
2017 333
2018 340
2019 347
2020 354
TOTAL 2 297
B.5.7 Humanitarian Aid (MFF 4.0.7)
(million EUR)
Implementation Table
Initial
budget Carryover from 2013
Amending budgets
BA transfers
COM transfers
Assigned revenue
Total appropria-
tions
Actual 2014
Rate Actual 2013
Carry-over to 2015
CA 920 0 0 100 61 71 1 153 1 103 96% 1 286 50
PA 785 6 256 250 62 71 1 430 1 368 96% 1 205 62
RAL as at 01.01.2014
Payments on RAL
Commitments 2014
Payments on 2014 commitments
Decommitments 2014 RAL as at 31.12.2014
Evolution of the RAL (%)
RAL 868 635 1 103 733 - 2 602 -31%
Budgetary appropriations were all implemented with some support expenditure carried forward
(automatic carry-over of non-differentiated administrative expenditure). As concerns the increase of
appropriations, EUR 98 million was mobilised from the Emergency Aid Reserve in commitments
and EUR 150 million in payments.
The level of commitment appropriations for humanitarian aid had been substantially reinforced in
2013 and in previous years to cover the overwhelming needs for unforeseen disasters and major
crises such as in Mali, Sahel, the Horn of Africa, Sudan/South Sudan, the Central African Republic,
Somalia and especially Syria.
The RAL at the beginning of 2014, in this domain where aid projects have a relatively short cycle
(12-18 months), stood at EUR 868 million, thus representing 111% of the initial budget. In view of
meeting its legal obligations and avoiding disruption on the ground in implementing urgent actions
the Commission presented the first request of reinforcement already in March 2014 and included a
substantial request for reinforcement in DAB 3/2014 (approved as AB2/2014).
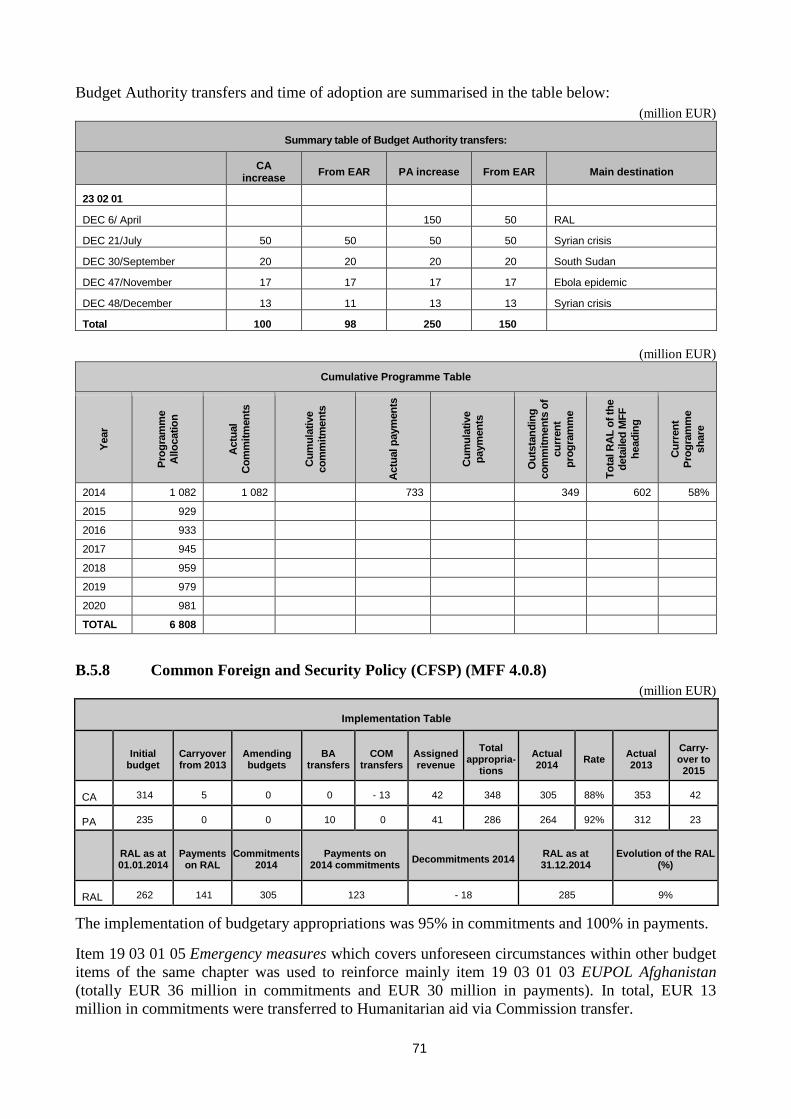
71
Budget Authority transfers and time of adoption are summarised in the table below:
(million EUR)
Summary table of Budget Authority transfers:
CA
increase From EAR PA increase From EAR Main destination
23 02 01
DEC 6/ April 150 50 RAL
DEC 21/July 50 50 50 50 Syrian crisis
DEC 30/September 20 20 20 20 South Sudan
DEC 47/November 17 17 17 17 Ebola epidemic
DEC 48/December 13 11 13 13 Syrian crisis
Total 100 98 250 150
(million EUR)
Cumulative Programme Table
Year
Pro
gra
mm
e
Allo
catio
n
Actu
al
Co
mm
itm
en
ts
Cu
mu
lati
ve
co
mm
itm
en
ts
Actu
al p
aym
en
ts
Cu
mu
lati
ve
paym
en
ts
Ou
tsta
nd
ing
co
mm
itm
en
ts o
f
cu
rren
t
pro
gra
mm
e
To
tal R
AL
of
the
deta
iled
MF
F
head
ing
Cu
rren
t P
rog
ram
me
sh
are
2014 1 082 1 082 733 349 602 58%
2015 929
2016 933
2017 945
2018 959
2019 979
2020 981
TOTAL 6 808
B.5.8 Common Foreign and Security Policy (CFSP) (MFF 4.0.8)
(million EUR)
Implementation Table
Initial
budget Carryover from 2013
Amending budgets
BA transfers
COM transfers
Assigned revenue
Total appropria-
tions
Actual 2014
Rate Actual 2013
Carry-over to 2015
CA 314 5 0 0 - 13 42 348 305 88% 353 42
PA 235 0 0 10 0 41 286 264 92% 312 23
RAL as at 01.01.2014
Payments on RAL
Commitments 2014
Payments on 2014 commitments
Decommitments 2014 RAL as at 31.12.2014
Evolution of the RAL (%)
RAL 262 141 305 123 - 18 285 9%
The implementation of budgetary appropriations was 95% in commitments and 100% in payments.
Item 19 03 01 05 Emergency measures which covers unforeseen circumstances within other budget
items of the same chapter was used to reinforce mainly item 19 03 01 03 EUPOL Afghanistan
(totally EUR 36 million in commitments and EUR 30 million in payments). In total, EUR 13
million in commitments were transferred to Humanitarian aid via Commission transfer.
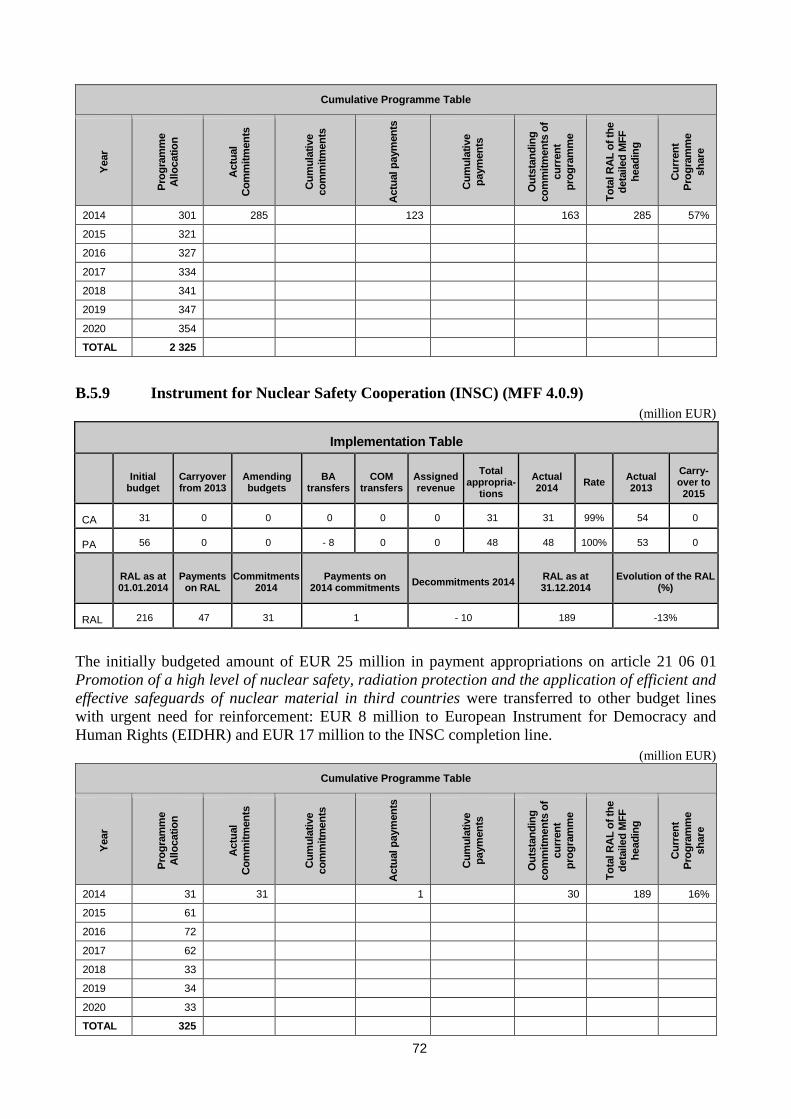
72
Cumulative Programme Table Y
ear
Pro
gra
mm
e
Allo
catio
n
Actu
al
Co
mm
itm
en
ts
Cu
mu
lati
ve
co
mm
itm
en
ts
Actu
al p
aym
en
ts
Cu
mu
lati
ve
paym
en
ts
Ou
tsta
nd
ing
co
mm
itm
en
ts o
f
cu
rren
t
pro
gra
mm
e
To
tal R
AL
of
the
deta
iled
MF
F
head
ing
Cu
rren
t P
rog
ram
me
sh
are
2014 301 285 123 163 285 57%
2015 321
2016 327
2017 334
2018 341
2019 347
2020 354
TOTAL 2 325
B.5.9 Instrument for Nuclear Safety Cooperation (INSC) (MFF 4.0.9)
(million EUR)
Implementation Table
Initial
budget Carryover from 2013
Amending budgets
BA transfers
COM transfers
Assigned revenue
Total appropria-
tions
Actual 2014
Rate Actual 2013
Carry-over to 2015
CA 31 0 0 0 0 0 31 31 99% 54 0
PA 56 0 0 - 8 0 0 48 48 100% 53 0
RAL as at 01.01.2014
Payments on RAL
Commitments 2014
Payments on 2014 commitments
Decommitments 2014 RAL as at 31.12.2014
Evolution of the RAL (%)
RAL 216 47 31 1 - 10 189 -13%
The initially budgeted amount of EUR 25 million in payment appropriations on article 21 06 01
Promotion of a high level of nuclear safety, radiation protection and the application of efficient and
effective safeguards of nuclear material in third countries were transferred to other budget lines
with urgent need for reinforcement: EUR 8 million to European Instrument for Democracy and
Human Rights (EIDHR) and EUR 17 million to the INSC completion line.
(million EUR)
Cumulative Programme Table
Year
Pro
gra
mm
e
Allo
catio
n
Actu
al
Co
mm
itm
en
ts
Cu
mu
lati
ve
co
mm
itm
en
ts
Actu
al p
aym
en
ts
Cu
mu
lati
ve
paym
en
ts
Ou
tsta
nd
ing
co
mm
itm
en
ts o
f
cu
rren
t
pro
gra
mm
e
To
tal R
AL
of
the
deta
iled
MF
F
head
ing
Cu
rren
t P
rog
ram
me
sh
are
2014 31 31 1 30 189 16%
2015 61
2016 72
2017 62
2018 33
2019 34
2020 33
TOTAL 325
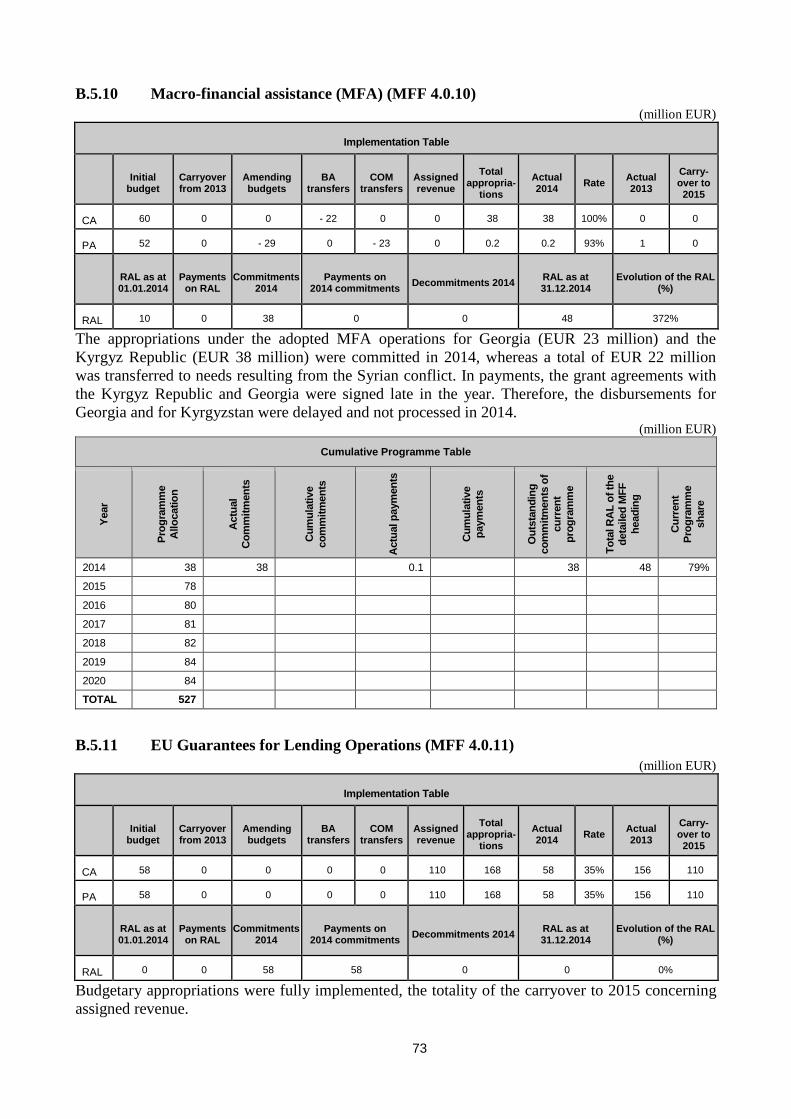
73
B.5.10 Macro-financial assistance (MFA) (MFF 4.0.10)
(million EUR)
Implementation Table
Initial
budget Carryover from 2013
Amending budgets
BA transfers
COM transfers
Assigned revenue
Total appropria-
tions
Actual 2014
Rate Actual 2013
Carry-over to 2015
CA 60 0 0 - 22 0 0 38 38 100% 0 0
PA 52 0 - 29 0 - 23 0 0.2 0.2 93% 1 0
RAL as at 01.01.2014
Payments on RAL
Commitments 2014
Payments on 2014 commitments
Decommitments 2014 RAL as at 31.12.2014
Evolution of the RAL (%)
RAL 10 0 38 0 0 48 372%
The appropriations under the adopted MFA operations for Georgia (EUR 23 million) and the
Kyrgyz Republic (EUR 38 million) were committed in 2014, whereas a total of EUR 22 million
was transferred to needs resulting from the Syrian conflict. In payments, the grant agreements with
the Kyrgyz Republic and Georgia were signed late in the year. Therefore, the disbursements for
Georgia and for Kyrgyzstan were delayed and not processed in 2014. (million EUR)
Cumulative Programme Table
Year
Pro
gra
mm
e
Allo
catio
n
Actu
al
Co
mm
itm
en
ts
Cu
mu
lati
ve
co
mm
itm
en
ts
Actu
al p
aym
en
ts
Cu
mu
lati
ve
paym
en
ts
Ou
tsta
nd
ing
co
mm
itm
en
ts o
f
cu
rren
t
pro
gra
mm
e
To
tal R
AL
of
the
deta
iled
MF
F
head
ing
Cu
rren
t P
rog
ram
me
sh
are
2014 38 38 0.1 38 48 79%
2015 78
2016 80
2017 81
2018 82
2019 84
2020 84
TOTAL 527
B.5.11 EU Guarantees for Lending Operations (MFF 4.0.11)
(million EUR)
Implementation Table
Initial
budget Carryover from 2013
Amending budgets
BA transfers
COM transfers
Assigned revenue
Total appropria-
tions
Actual 2014
Rate Actual 2013
Carry-over to 2015
CA 58 0 0 0 0 110 168 58 35% 156 110
PA 58 0 0 0 0 110 168 58 35% 156 110
RAL as at 01.01.2014
Payments on RAL
Commitments 2014
Payments on 2014 commitments
Decommitments 2014 RAL as at 31.12.2014
Evolution of the RAL (%)
RAL 0 0 58 58 0 0 0%
Budgetary appropriations were fully implemented, the totality of the carryover to 2015 concerning
assigned revenue.
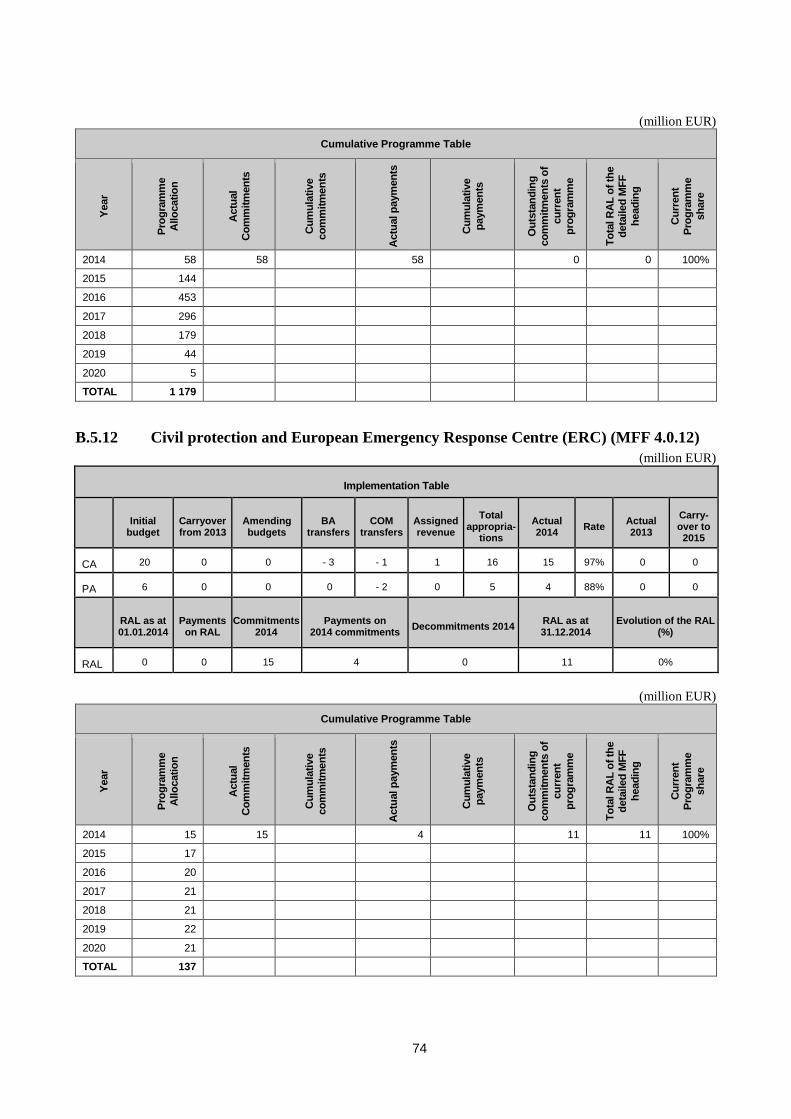
74
(million EUR)
Cumulative Programme Table
Year
Pro
gra
mm
e
Allo
catio
n
Actu
al
Co
mm
itm
en
ts
Cu
mu
lati
ve
co
mm
itm
en
ts
Actu
al p
aym
en
ts
Cu
mu
lati
ve
paym
en
ts
Ou
tsta
nd
ing
co
mm
itm
en
ts o
f
cu
rren
t
pro
gra
mm
e
To
tal R
AL
of
the
deta
iled
MF
F
head
ing
Cu
rren
t P
rog
ram
me
sh
are
2014 58 58 58 0 0 100%
2015 144
2016 453
2017 296
2018 179
2019 44
2020 5
TOTAL 1 179
B.5.12 Civil protection and European Emergency Response Centre (ERC) (MFF 4.0.12)
(million EUR)
Implementation Table
Initial
budget Carryover from 2013
Amending budgets
BA transfers
COM transfers
Assigned revenue
Total appropria-
tions
Actual 2014
Rate Actual 2013
Carry-over to 2015
CA 20 0 0 - 3 - 1 1 16 15 97% 0 0
PA 6 0 0 0 - 2 0 5 4 88% 0 0
RAL as at 01.01.2014
Payments on RAL
Commitments 2014
Payments on 2014 commitments
Decommitments 2014 RAL as at 31.12.2014
Evolution of the RAL (%)
RAL 0 0 15 4 0 11 0%
(million EUR)
Cumulative Programme Table
Year
Pro
gra
mm
e
Allo
catio
n
Actu
al
Co
mm
itm
en
ts
Cu
mu
lati
ve
co
mm
itm
en
ts
Actu
al p
aym
en
ts
Cu
mu
lati
ve
paym
en
ts
Ou
tsta
nd
ing
co
mm
itm
en
ts o
f
cu
rren
t
pro
gra
mm
e
To
tal R
AL
of
the
deta
iled
MF
F
head
ing
Cu
rren
t P
rog
ram
me
sh
are
2014 15 15 4 11 11 100%
2015 17
2016 20
2017 21
2018 21
2019 22
2020 21
TOTAL 137
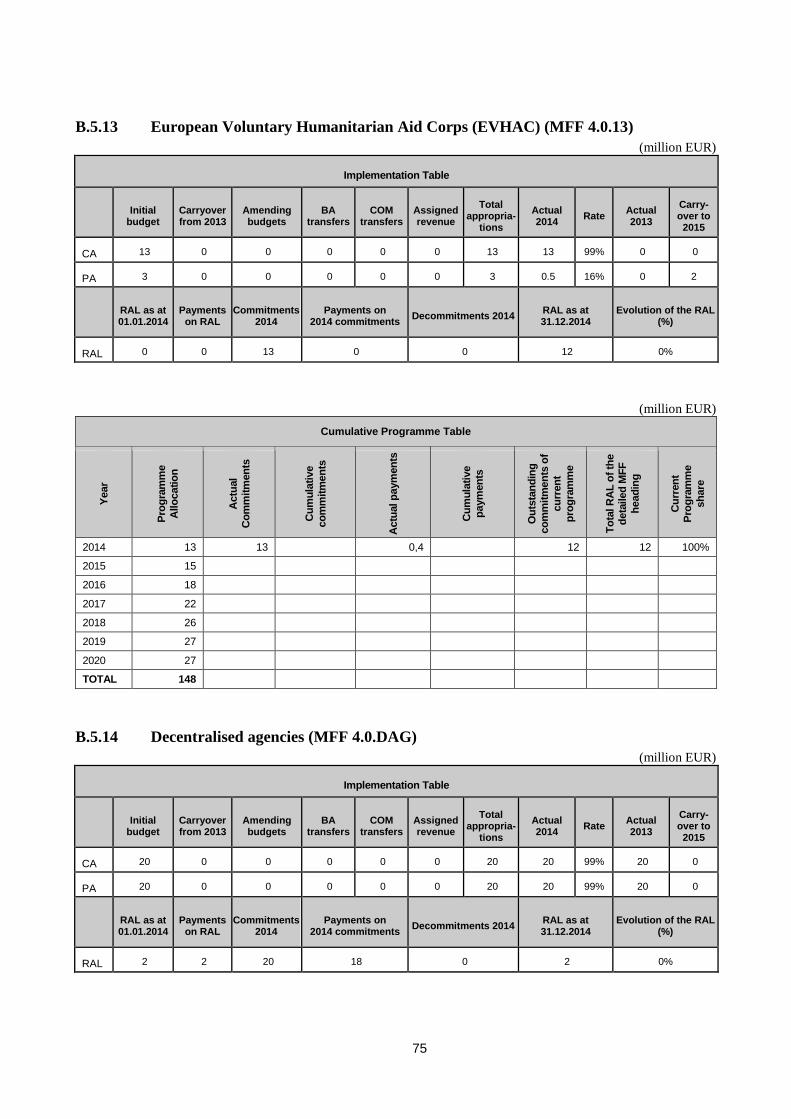
75
B.5.13 European Voluntary Humanitarian Aid Corps (EVHAC) (MFF 4.0.13)
(million EUR)
Implementation Table
Initial
budget Carryover from 2013
Amending budgets
BA transfers
COM transfers
Assigned revenue
Total appropria-
tions
Actual 2014
Rate Actual 2013
Carry-over to 2015
CA 13 0 0 0 0 0 13 13 99% 0 0
PA 3 0 0 0 0 0 3 0.5 16% 0 2
RAL as at 01.01.2014
Payments on RAL
Commitments 2014
Payments on 2014 commitments
Decommitments 2014 RAL as at 31.12.2014
Evolution of the RAL (%)
RAL 0 0 13 0 0 12 0%
(million EUR)
Cumulative Programme Table
Year
Pro
gra
mm
e
Allo
catio
n
Actu
al
Co
mm
itm
en
ts
Cu
mu
lati
ve
co
mm
itm
en
ts
Actu
al p
aym
en
ts
Cu
mu
lati
ve
paym
en
ts
Ou
tsta
nd
ing
co
mm
itm
en
ts o
f
cu
rren
t
pro
gra
mm
e
To
tal R
AL
of
the
deta
iled
MF
F
head
ing
Cu
rren
t P
rog
ram
me
sh
are
2014 13 13 0,4 12 12 100%
2015 15
2016 18
2017 22
2018 26
2019 27
2020 27
TOTAL 148
B.5.14 Decentralised agencies (MFF 4.0.DAG)
(million EUR)
Implementation Table
Initial
budget Carryover from 2013
Amending budgets
BA transfers
COM transfers
Assigned revenue
Total appropria-
tions
Actual 2014
Rate Actual 2013
Carry-over to 2015
CA 20 0 0 0 0 0 20 20 99% 20 0
PA 20 0 0 0 0 0 20 20 99% 20 0
RAL as at 01.01.2014
Payments on RAL
Commitments 2014
Payments on 2014 commitments
Decommitments 2014 RAL as at 31.12.2014
Evolution of the RAL (%)
RAL 2 2 20 18 0 2 0%
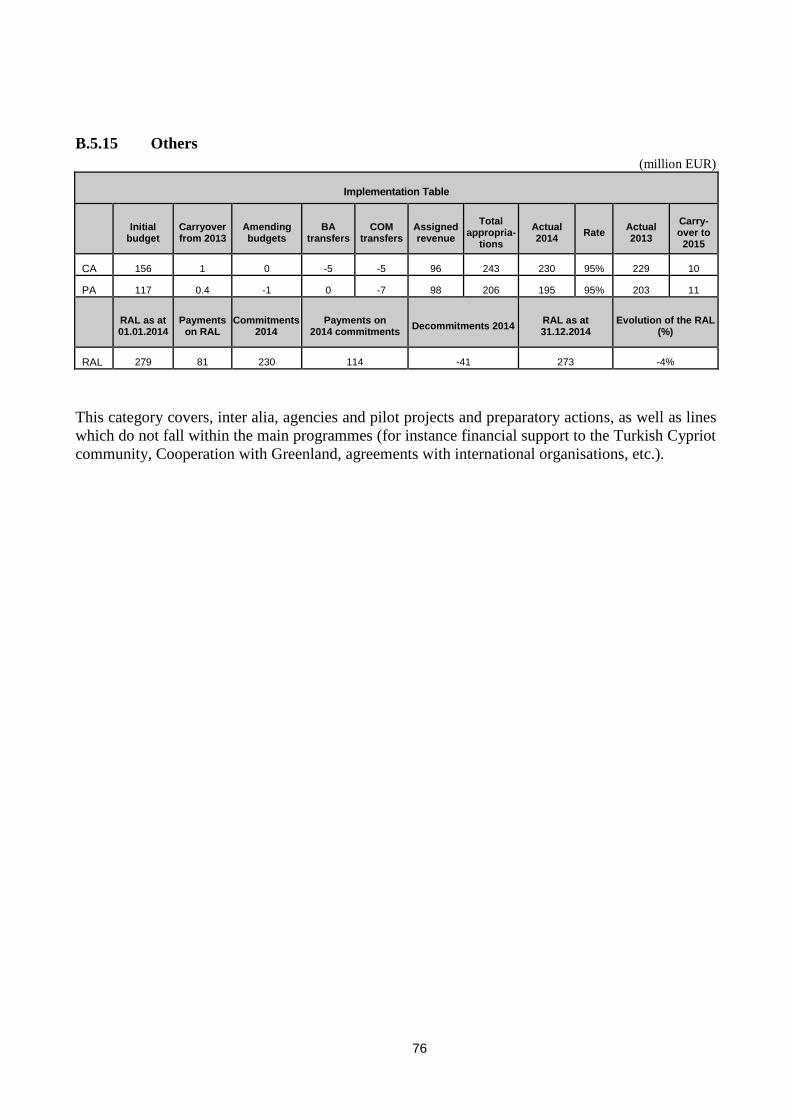
76
B.5.15 Others
(million EUR)
Implementation Table
Initial
budget Carryover from 2013
Amending budgets
BA transfers
COM transfers
Assigned revenue
Total appropria-
tions
Actual 2014
Rate Actual 2013
Carry-over to 2015
CA 156 1 0 -5 -5 96 243 230 95% 229 10
PA 117 0.4 -1 0 -7 98 206 195 95% 203 11
RAL as at 01.01.2014
Payments on RAL
Commitments 2014
Payments on 2014 commitments
Decommitments 2014 RAL as at 31.12.2014
Evolution of the RAL (%)
RAL 279 81 230 114 -41 273 -4%
This category covers, inter alia, agencies and pilot projects and preparatory actions, as well as lines
which do not fall within the main programmes (for instance financial support to the Turkish Cypriot
community, Cooperation with Greenland, agreements with international organisations, etc.).
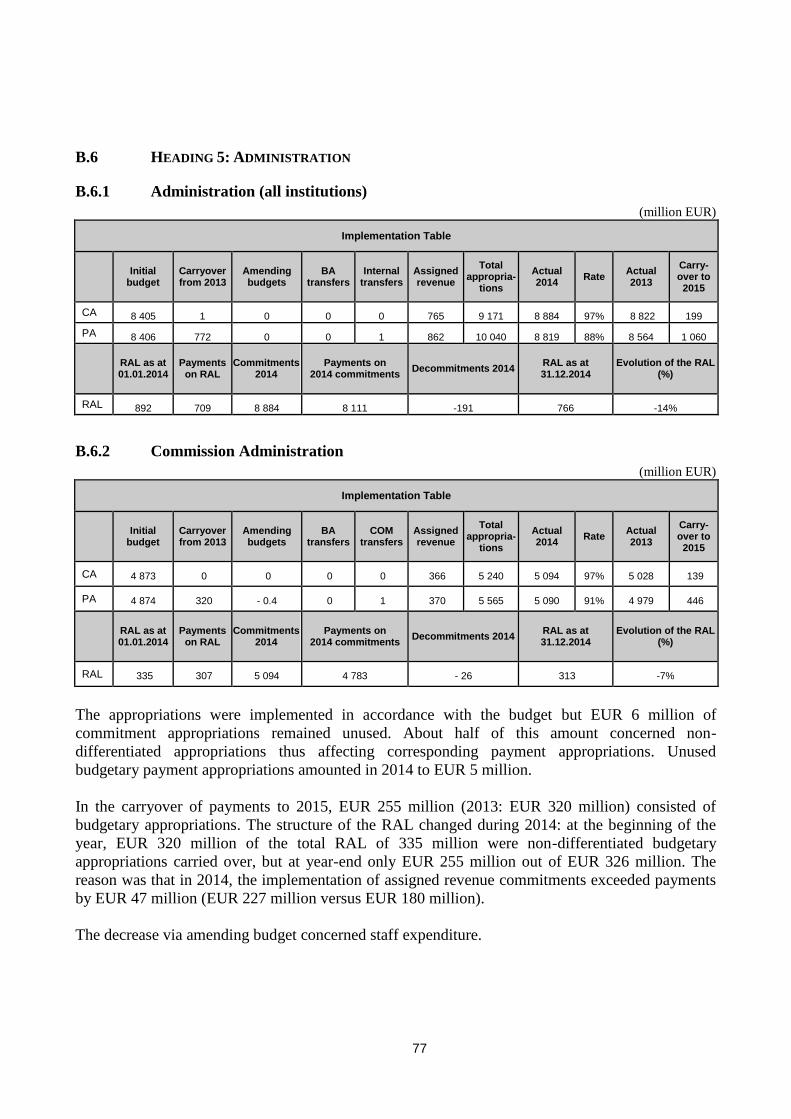
77
B.6 HEADING 5: ADMINISTRATION
B.6.1 Administration (all institutions)
(million EUR)
Implementation Table
Initial
budget Carryover from 2013
Amending budgets
BA transfers
Internal transfers
Assigned revenue
Total appropria-
tions
Actual 2014
Rate Actual 2013
Carry-over to 2015
CA 8 405 1 0 0 0 765 9 171 8 884 97% 8 822 199
PA 8 406 772 0 0 1 862 10 040 8 819 88% 8 564 1 060
RAL as at 01.01.2014
Payments on RAL
Commitments 2014
Payments on 2014 commitments
Decommitments 2014 RAL as at 31.12.2014
Evolution of the RAL (%)
RAL 892 709 8 884 8 111 -191 766 -14%
B.6.2 Commission Administration
(million EUR)
Implementation Table
Initial
budget Carryover from 2013
Amending budgets
BA transfers
COM transfers
Assigned revenue
Total appropria-
tions
Actual 2014
Rate Actual 2013
Carry-over to 2015
CA 4 873 0 0 0 0 366 5 240 5 094 97% 5 028 139
PA 4 874 320 - 0.4 0 1 370 5 565 5 090 91% 4 979 446
RAL as at 01.01.2014
Payments on RAL
Commitments 2014
Payments on 2014 commitments
Decommitments 2014 RAL as at 31.12.2014
Evolution of the RAL (%)
RAL 335 307 5 094 4 783 - 26 313 -7%
The appropriations were implemented in accordance with the budget but EUR 6 million of
commitment appropriations remained unused. About half of this amount concerned non-
differentiated appropriations thus affecting corresponding payment appropriations. Unused
budgetary payment appropriations amounted in 2014 to EUR 5 million.
In the carryover of payments to 2015, EUR 255 million (2013: EUR 320 million) consisted of
budgetary appropriations. The structure of the RAL changed during 2014: at the beginning of the
year, EUR 320 million of the total RAL of 335 million were non-differentiated budgetary
appropriations carried over, but at year-end only EUR 255 million out of EUR 326 million. The
reason was that in 2014, the implementation of assigned revenue commitments exceeded payments
by EUR 47 million (EUR 227 million versus EUR 180 million).
The decrease via amending budget concerned staff expenditure.
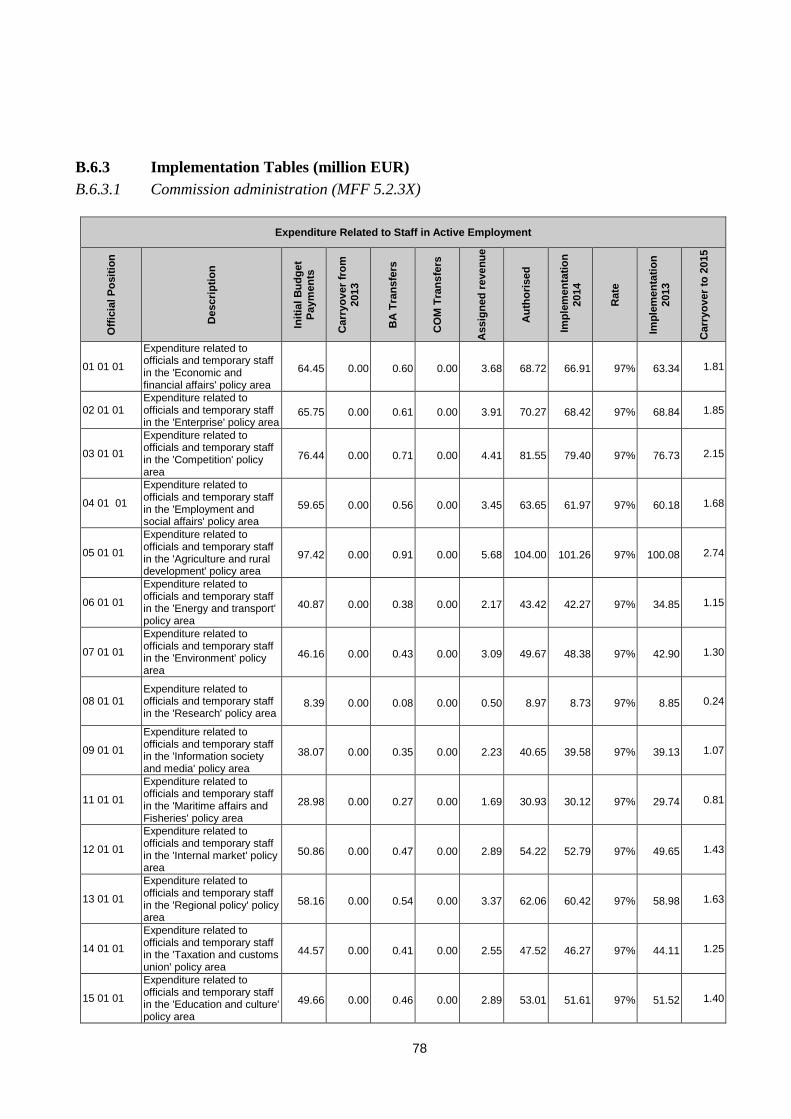
78
B.6.3 Implementation Tables (million EUR)
B.6.3.1 Commission administration (MFF 5.2.3X)
Expenditure Related to Staff in Active Employment
Off
icia
l P
osit
ion
Descri
pti
on
Init
ial
Bu
dg
et
Paym
en
ts
Carr
yo
ver
fro
m
2013
BA
Tra
ns
fers
CO
M T
ran
sfe
rs
Assig
ne
d r
even
ue
Au
tho
rised
Im
ple
men
tati
on
2014
Rate
Imp
lem
en
tati
on
2013
Carr
yo
ver
to 2
015
01 01 01
Expenditure related to officials and temporary staff in the 'Economic and financial affairs' policy area
64.45 0.00 0.60 0.00 3.68 68.72 66.91 97% 63.34 1.81
02 01 01 Expenditure related to officials and temporary staff in the 'Enterprise' policy area
65.75 0.00 0.61 0.00 3.91 70.27 68.42 97% 68.84 1.85
03 01 01
Expenditure related to officials and temporary staff in the 'Competition' policy area
76.44 0.00 0.71 0.00 4.41 81.55 79.40 97% 76.73 2.15
04 01 01
Expenditure related to officials and temporary staff in the 'Employment and social affairs' policy area
59.65 0.00 0.56 0.00 3.45 63.65 61.97 97% 60.18 1.68
05 01 01
Expenditure related to officials and temporary staff in the 'Agriculture and rural development' policy area
97.42 0.00 0.91 0.00 5.68 104.00 101.26 97% 100.08 2.74
06 01 01
Expenditure related to officials and temporary staff in the 'Energy and transport' policy area
40.87 0.00 0.38 0.00 2.17 43.42 42.27 97% 34.85 1.15
07 01 01
Expenditure related to officials and temporary staff in the 'Environment' policy area
46.16 0.00 0.43 0.00 3.09 49.67 48.38 97% 42.90 1.30
08 01 01 Expenditure related to officials and temporary staff in the 'Research' policy area
8.39 0.00 0.08 0.00 0.50 8.97 8.73 97% 8.85 0.24
09 01 01
Expenditure related to officials and temporary staff in the 'Information society and media' policy area
38.07 0.00 0.35 0.00 2.23 40.65 39.58 97% 39.13 1.07
11 01 01
Expenditure related to officials and temporary staff in the 'Maritime affairs and Fisheries' policy area
28.98 0.00 0.27 0.00 1.69 30.93 30.12 97% 29.74 0.81
12 01 01
Expenditure related to officials and temporary staff in the 'Internal market' policy area
50.86 0.00 0.47 0.00 2.89 54.22 52.79 97% 49.65 1.43
13 01 01
Expenditure related to officials and temporary staff in the 'Regional policy' policy area
58.16 0.00 0.54 0.00 3.37 62.06 60.42 97% 58.98 1.63
14 01 01
Expenditure related to officials and temporary staff in the 'Taxation and customs union' policy area
44.57 0.00 0.41 0.00 2.55 47.52 46.27 97% 44.11 1.25
15 01 01
Expenditure related to officials and temporary staff in the 'Education and culture' policy area
49.66 0.00 0.46 0.00 2.89 53.01 51.61 97% 51.52 1.40
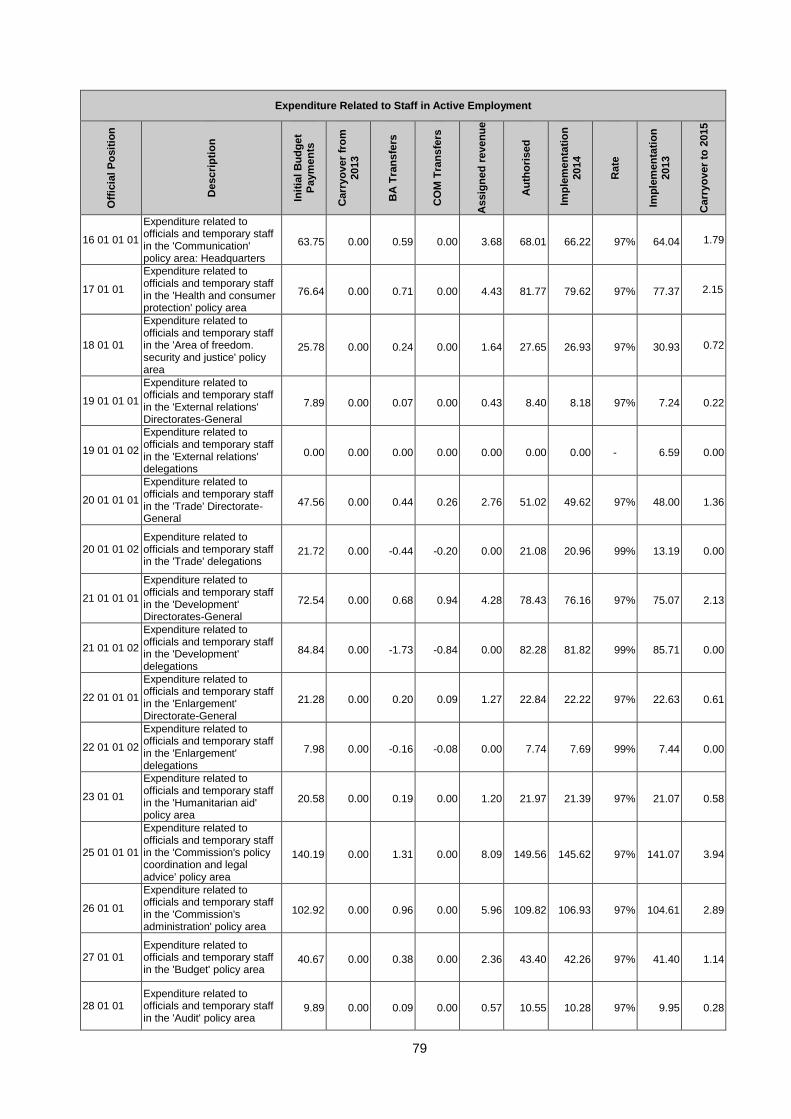
79
Expenditure Related to Staff in Active Employment O
ffic
ial P
osit
ion
Descri
pti
on
Init
ial
Bu
dg
et
Paym
en
ts
Carr
yo
ver
fro
m
2013
BA
Tra
ns
fers
CO
M T
ran
sfe
rs
Assig
ne
d r
even
ue
Au
tho
rised
Im
ple
men
tati
on
2014
Rate
Imp
lem
en
tati
on
2013
Carr
yo
ver
to 2
015
16 01 01 01
Expenditure related to officials and temporary staff in the 'Communication' policy area: Headquarters
63.75 0.00 0.59 0.00 3.68 68.01 66.22 97% 64.04 1.79
17 01 01
Expenditure related to officials and temporary staff in the 'Health and consumer protection' policy area
76.64 0.00 0.71 0.00 4.43 81.77 79.62 97% 77.37 2.15
18 01 01
Expenditure related to officials and temporary staff in the 'Area of freedom. security and justice' policy area
25.78 0.00 0.24 0.00 1.64 27.65 26.93 97% 30.93 0.72
19 01 01 01
Expenditure related to officials and temporary staff in the 'External relations' Directorates-General
7.89 0.00 0.07 0.00 0.43 8.40 8.18 97% 7.24 0.22
19 01 01 02
Expenditure related to officials and temporary staff in the 'External relations' delegations
0.00 0.00 0.00 0.00 0.00 0.00 0.00 - 6.59 0.00
20 01 01 01
Expenditure related to officials and temporary staff in the 'Trade' Directorate-General
47.56 0.00 0.44 0.26 2.76 51.02 49.62 97% 48.00 1.36
20 01 01 02 Expenditure related to officials and temporary staff in the 'Trade' delegations
21.72 0.00 -0.44 -0.20 0.00 21.08 20.96 99% 13.19 0.00
21 01 01 01
Expenditure related to officials and temporary staff in the 'Development' Directorates-General
72.54 0.00 0.68 0.94 4.28 78.43 76.16 97% 75.07 2.13
21 01 01 02
Expenditure related to officials and temporary staff in the 'Development' delegations
84.84 0.00 -1.73 -0.84 0.00 82.28 81.82 99% 85.71 0.00
22 01 01 01
Expenditure related to officials and temporary staff in the 'Enlargement' Directorate-General
21.28 0.00 0.20 0.09 1.27 22.84 22.22 97% 22.63 0.61
22 01 01 02
Expenditure related to officials and temporary staff in the 'Enlargement' delegations
7.98 0.00 -0.16 -0.08 0.00 7.74 7.69 99% 7.44 0.00
23 01 01
Expenditure related to officials and temporary staff in the 'Humanitarian aid' policy area
20.58 0.00 0.19 0.00 1.20 21.97 21.39 97% 21.07 0.58
25 01 01 01
Expenditure related to officials and temporary staff in the 'Commission's policy coordination and legal advice' policy area
140.19 0.00 1.31 0.00 8.09 149.56 145.62 97% 141.07 3.94
26 01 01
Expenditure related to officials and temporary staff in the 'Commission's administration' policy area
102.92 0.00 0.96 0.00 5.96 109.82 106.93 97% 104.61 2.89
27 01 01 Expenditure related to officials and temporary staff in the 'Budget' policy area
40.67 0.00 0.38 0.00 2.36 43.40 42.26 97% 41.40 1.14
28 01 01 Expenditure related to officials and temporary staff in the 'Audit' policy area
9.89 0.00 0.09 0.00 0.57 10.55 10.28 97% 9.95 0.28
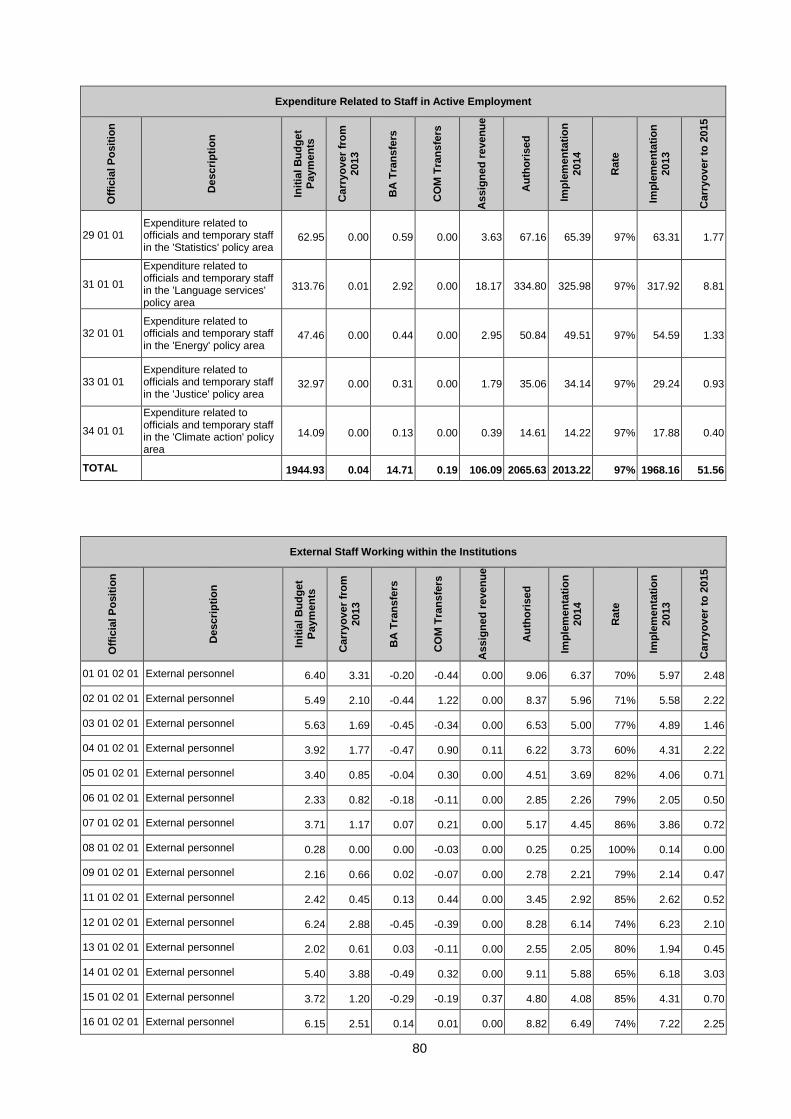
80
Expenditure Related to Staff in Active Employment O
ffic
ial P
osit
ion
Descri
pti
on
Init
ial
Bu
dg
et
Paym
en
ts
Carr
yo
ver
fro
m
2013
BA
Tra
ns
fers
CO
M T
ran
sfe
rs
Assig
ne
d r
even
ue
Au
tho
rised
Im
ple
men
tati
on
2014
Rate
Imp
lem
en
tati
on
2013
Carr
yo
ver
to 2
015
29 01 01 Expenditure related to officials and temporary staff in the 'Statistics' policy area
62.95 0.00 0.59 0.00 3.63 67.16 65.39 97% 63.31 1.77
31 01 01
Expenditure related to officials and temporary staff in the 'Language services' policy area
313.76 0.01 2.92 0.00 18.17 334.80 325.98 97% 317.92 8.81
32 01 01 Expenditure related to officials and temporary staff in the 'Energy' policy area
47.46 0.00 0.44 0.00 2.95 50.84 49.51 97% 54.59 1.33
33 01 01 Expenditure related to officials and temporary staff in the 'Justice' policy area
32.97 0.00 0.31 0.00 1.79 35.06 34.14 97% 29.24 0.93
34 01 01
Expenditure related to officials and temporary staff in the 'Climate action' policy area
14.09 0.00 0.13 0.00 0.39 14.61 14.22 97% 17.88 0.40
TOTAL 1944.93 0.04 14.71 0.19 106.09 2065.63 2013.22 97% 1968.16 51.56
External Staff Working within the Institutions
Off
icia
l P
osit
ion
Descri
pti
on
Init
ial
Bu
dg
et
Paym
en
ts
Carr
yo
ver
fro
m
2013
BA
Tra
ns
fers
CO
M T
ran
sfe
rs
Assig
ne
d r
even
ue
Au
tho
rised
Imp
lem
en
tati
on
2014
Rate
Imp
lem
en
tati
on
2013
Carr
yo
ver
to 2
015
01 01 02 01 External personnel 6.40 3.31 -0.20 -0.44 0.00 9.06 6.37 70% 5.97 2.48
02 01 02 01 External personnel 5.49 2.10 -0.44 1.22 0.00 8.37 5.96 71% 5.58 2.22
03 01 02 01 External personnel 5.63 1.69 -0.45 -0.34 0.00 6.53 5.00 77% 4.89 1.46
04 01 02 01 External personnel 3.92 1.77 -0.47 0.90 0.11 6.22 3.73 60% 4.31 2.22
05 01 02 01 External personnel 3.40 0.85 -0.04 0.30 0.00 4.51 3.69 82% 4.06 0.71
06 01 02 01 External personnel 2.33 0.82 -0.18 -0.11 0.00 2.85 2.26 79% 2.05 0.50
07 01 02 01 External personnel 3.71 1.17 0.07 0.21 0.00 5.17 4.45 86% 3.86 0.72
08 01 02 01 External personnel 0.28 0.00 0.00 -0.03 0.00 0.25 0.25 100% 0.14 0.00
09 01 02 01 External personnel 2.16 0.66 0.02 -0.07 0.00 2.78 2.21 79% 2.14 0.47
11 01 02 01 External personnel 2.42 0.45 0.13 0.44 0.00 3.45 2.92 85% 2.62 0.52
12 01 02 01 External personnel 6.24 2.88 -0.45 -0.39 0.00 8.28 6.14 74% 6.23 2.10
13 01 02 01 External personnel 2.02 0.61 0.03 -0.11 0.00 2.55 2.05 80% 1.94 0.45
14 01 02 01 External personnel 5.40 3.88 -0.49 0.32 0.00 9.11 5.88 65% 6.18 3.03
15 01 02 01 External personnel 3.72 1.20 -0.29 -0.19 0.37 4.80 4.08 85% 4.31 0.70
16 01 02 01 External personnel 6.15 2.51 0.14 0.01 0.00 8.82 6.49 74% 7.22 2.25
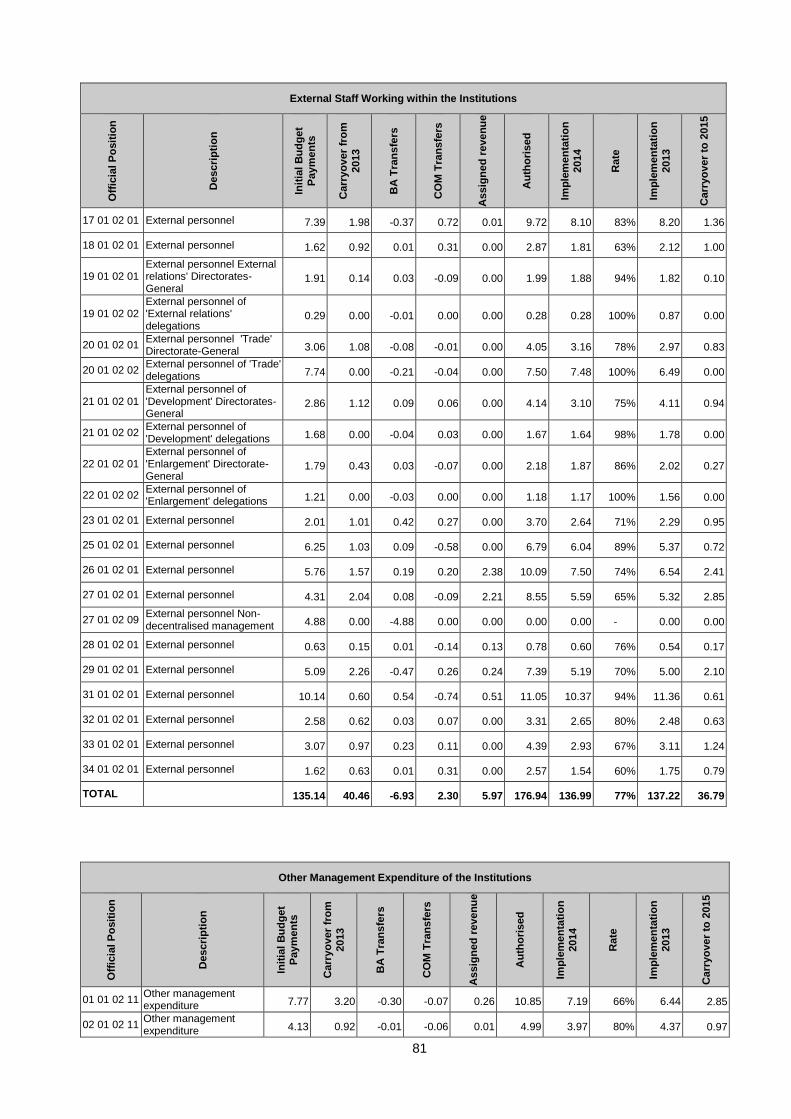
81
External Staff Working within the Institutions O
ffic
ial P
osit
ion
Descri
pti
on
Init
ial
Bu
dg
et
Paym
en
ts
Carr
yo
ver
fro
m
2013
BA
Tra
ns
fers
CO
M T
ran
sfe
rs
Assig
ne
d r
even
ue
Au
tho
rised
Imp
lem
en
tati
on
2014
Rate
Imp
lem
en
tati
on
2013
Carr
yo
ver
to 2
015
17 01 02 01 External personnel 7.39 1.98 -0.37 0.72 0.01 9.72 8.10 83% 8.20 1.36
18 01 02 01 External personnel 1.62 0.92 0.01 0.31 0.00 2.87 1.81 63% 2.12 1.00
19 01 02 01 External personnel External relations' Directorates-General
1.91 0.14 0.03 -0.09 0.00 1.99 1.88 94% 1.82 0.10
19 01 02 02 External personnel of 'External relations' delegations
0.29 0.00 -0.01 0.00 0.00 0.28 0.28 100% 0.87 0.00
20 01 02 01 External personnel 'Trade' Directorate-General 3.06 1.08 -0.08 -0.01 0.00 4.05 3.16 78% 2.97 0.83
20 01 02 02 External personnel of 'Trade' delegations 7.74 0.00 -0.21 -0.04 0.00 7.50 7.48 100% 6.49 0.00
21 01 02 01 External personnel of 'Development' Directorates-General
2.86 1.12 0.09 0.06 0.00 4.14 3.10 75% 4.11 0.94
21 01 02 02 External personnel of 'Development' delegations 1.68 0.00 -0.04 0.03 0.00 1.67 1.64 98% 1.78 0.00
22 01 02 01 External personnel of 'Enlargement' Directorate-General
1.79 0.43 0.03 -0.07 0.00 2.18 1.87 86% 2.02 0.27
22 01 02 02 External personnel of 'Enlargement' delegations 1.21 0.00 -0.03 0.00 0.00 1.18 1.17 100% 1.56 0.00
23 01 02 01 External personnel 2.01 1.01 0.42 0.27 0.00 3.70 2.64 71% 2.29 0.95
25 01 02 01 External personnel 6.25 1.03 0.09 -0.58 0.00 6.79 6.04 89% 5.37 0.72
26 01 02 01 External personnel 5.76 1.57 0.19 0.20 2.38 10.09 7.50 74% 6.54 2.41
27 01 02 01 External personnel 4.31 2.04 0.08 -0.09 2.21 8.55 5.59 65% 5.32 2.85
27 01 02 09 External personnel Non-decentralised management 4.88 0.00 -4.88 0.00 0.00 0.00 0.00 - 0.00 0.00
28 01 02 01 External personnel 0.63 0.15 0.01 -0.14 0.13 0.78 0.60 76% 0.54 0.17
29 01 02 01 External personnel 5.09 2.26 -0.47 0.26 0.24 7.39 5.19 70% 5.00 2.10
31 01 02 01 External personnel 10.14 0.60 0.54 -0.74 0.51 11.05 10.37 94% 11.36 0.61
32 01 02 01 External personnel 2.58 0.62 0.03 0.07 0.00 3.31 2.65 80% 2.48 0.63
33 01 02 01 External personnel 3.07 0.97 0.23 0.11 0.00 4.39 2.93 67% 3.11 1.24
34 01 02 01 External personnel 1.62 0.63 0.01 0.31 0.00 2.57 1.54 60% 1.75 0.79
TOTAL 135.14 40.46 -6.93 2.30 5.97 176.94 136.99 77% 137.22 36.79
Other Management Expenditure of the Institutions
Off
icia
l P
osit
ion
Descri
pti
on
Init
ial
Bu
dg
et
Paym
en
ts
Carr
yo
ver
fro
m
2013
BA
Tra
ns
fers
CO
M T
ran
sfe
rs
Assig
ne
d r
even
ue
Au
tho
rised
Imp
lem
en
tati
on
2014
Rate
Imp
lem
en
tati
on
2013
Carr
yo
ver
to 2
015
01 01 02 11 Other management expenditure 7.77 3.20 -0.30 -0.07 0.26 10.85 7.19 66% 6.44 2.85
02 01 02 11 Other management expenditure 4.13 0.92 -0.01 -0.06 0.01 4.99 3.97 80% 4.37 0.97
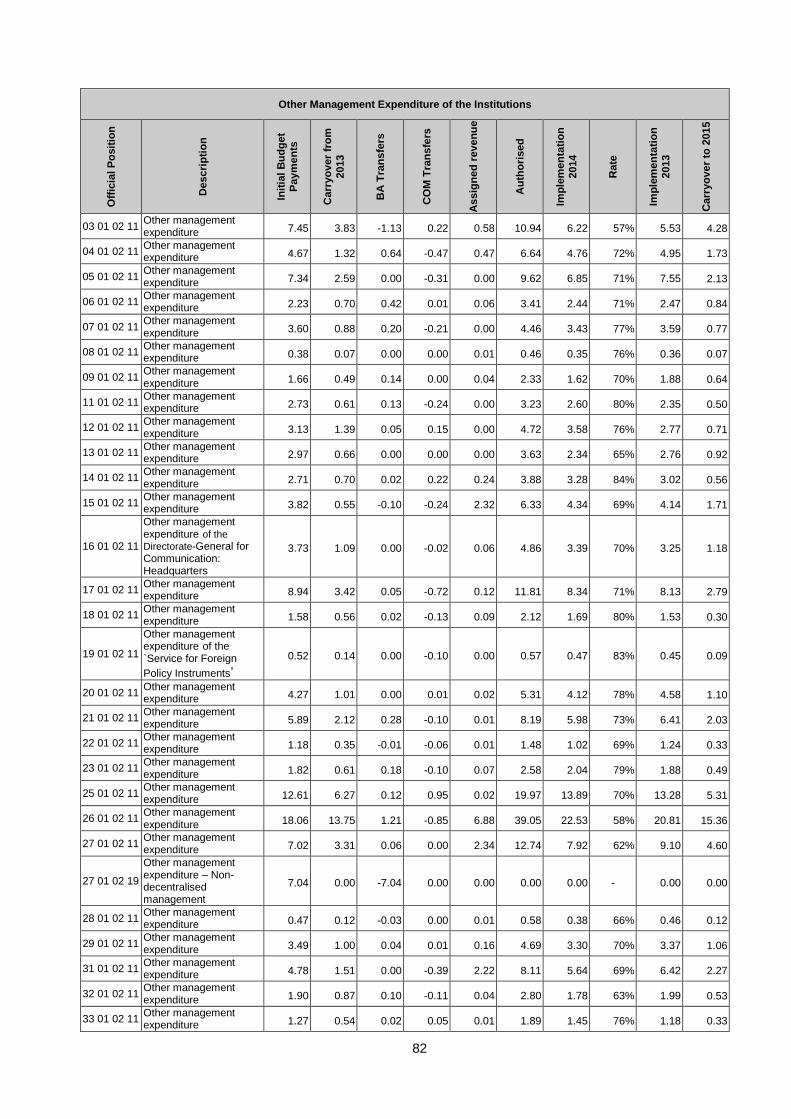
82
Other Management Expenditure of the Institutions O
ffic
ial P
osit
ion
Descri
pti
on
Init
ial
Bu
dg
et
Paym
en
ts
Carr
yo
ver
fro
m
2013
BA
Tra
ns
fers
CO
M T
ran
sfe
rs
Assig
ne
d r
even
ue
Au
tho
rised
Imp
lem
en
tati
on
2014
Rate
Imp
lem
en
tati
on
2013
Carr
yo
ver
to 2
015
03 01 02 11 Other management expenditure 7.45 3.83 -1.13 0.22 0.58 10.94 6.22 57% 5.53 4.28
04 01 02 11 Other management expenditure 4.67 1.32 0.64 -0.47 0.47 6.64 4.76 72% 4.95 1.73
05 01 02 11 Other management expenditure 7.34 2.59 0.00 -0.31 0.00 9.62 6.85 71% 7.55 2.13
06 01 02 11 Other management expenditure 2.23 0.70 0.42 0.01 0.06 3.41 2.44 71% 2.47 0.84
07 01 02 11 Other management expenditure 3.60 0.88 0.20 -0.21 0.00 4.46 3.43 77% 3.59 0.77
08 01 02 11 Other management expenditure 0.38 0.07 0.00 0.00 0.01 0.46 0.35 76% 0.36 0.07
09 01 02 11 Other management expenditure 1.66 0.49 0.14 0.00 0.04 2.33 1.62 70% 1.88 0.64
11 01 02 11 Other management expenditure 2.73 0.61 0.13 -0.24 0.00 3.23 2.60 80% 2.35 0.50
12 01 02 11 Other management expenditure 3.13 1.39 0.05 0.15 0.00 4.72 3.58 76% 2.77 0.71
13 01 02 11 Other management expenditure 2.97 0.66 0.00 0.00 0.00 3.63 2.34 65% 2.76 0.92
14 01 02 11 Other management expenditure 2.71 0.70 0.02 0.22 0.24 3.88 3.28 84% 3.02 0.56
15 01 02 11 Other management expenditure 3.82 0.55 -0.10 -0.24 2.32 6.33 4.34 69% 4.14 1.71
16 01 02 11
Other management expenditure of the
Directorate-General for Communication: Headquarters
3.73 1.09 0.00 -0.02 0.06 4.86 3.39 70% 3.25 1.18
17 01 02 11 Other management expenditure 8.94 3.42 0.05 -0.72 0.12 11.81 8.34 71% 8.13 2.79
18 01 02 11 Other management expenditure 1.58 0.56 0.02 -0.13 0.09 2.12 1.69 80% 1.53 0.30
19 01 02 11
Other management expenditure of the `Service for Foreign
Policy Instruments’
0.52 0.14 0.00 -0.10 0.00 0.57 0.47 83% 0.45 0.09
20 01 02 11 Other management expenditure 4.27 1.01 0.00 0.01 0.02 5.31 4.12 78% 4.58 1.10
21 01 02 11 Other management expenditure 5.89 2.12 0.28 -0.10 0.01 8.19 5.98 73% 6.41 2.03
22 01 02 11 Other management expenditure 1.18 0.35 -0.01 -0.06 0.01 1.48 1.02 69% 1.24 0.33
23 01 02 11 Other management expenditure 1.82 0.61 0.18 -0.10 0.07 2.58 2.04 79% 1.88 0.49
25 01 02 11 Other management expenditure 12.61 6.27 0.12 0.95 0.02 19.97 13.89 70% 13.28 5.31
26 01 02 11 Other management expenditure 18.06 13.75 1.21 -0.85 6.88 39.05 22.53 58% 20.81 15.36
27 01 02 11 Other management expenditure 7.02 3.31 0.06 0.00 2.34 12.74 7.92 62% 9.10 4.60
27 01 02 19
Other management expenditure – Non-decentralised management
7.04 0.00 -7.04 0.00 0.00 0.00 0.00 - 0.00 0.00
28 01 02 11 Other management expenditure 0.47 0.12 -0.03 0.00 0.01 0.58 0.38 66% 0.46 0.12
29 01 02 11 Other management expenditure 3.49 1.00 0.04 0.01 0.16 4.69 3.30 70% 3.37 1.06
31 01 02 11 Other management expenditure 4.78 1.51 0.00 -0.39 2.22 8.11 5.64 69% 6.42 2.27
32 01 02 11 Other management expenditure 1.90 0.87 0.10 -0.11 0.04 2.80 1.78 63% 1.99 0.53
33 01 02 11 Other management expenditure 1.27 0.54 0.02 0.05 0.01 1.89 1.45 76% 1.18 0.33
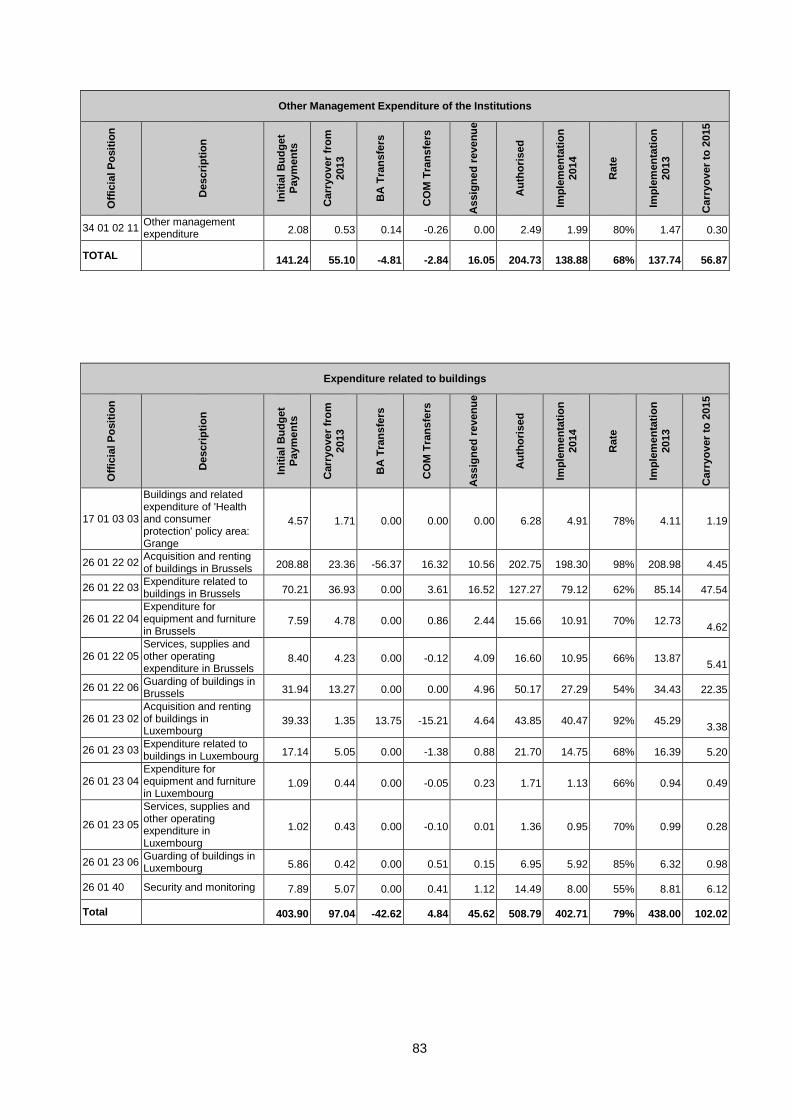
83
Other Management Expenditure of the Institutions O
ffic
ial P
osit
ion
Descri
pti
on
Init
ial
Bu
dg
et
Paym
en
ts
Carr
yo
ver
fro
m
2013
BA
Tra
ns
fers
CO
M T
ran
sfe
rs
Assig
ne
d r
even
ue
Au
tho
rised
Imp
lem
en
tati
on
2014
Rate
Imp
lem
en
tati
on
2013
Carr
yo
ver
to 2
015
34 01 02 11 Other management expenditure 2.08 0.53 0.14 -0.26 0.00 2.49 1.99 80% 1.47 0.30
TOTAL 141.24 55.10 -4.81 -2.84 16.05 204.73 138.88 68% 137.74 56.87
Expenditure related to buildings
Off
icia
l P
osit
ion
Descri
pti
on
Init
ial
Bu
dg
et
Paym
en
ts
Carr
yo
ver
fro
m
2013
BA
Tra
ns
fers
CO
M T
ran
sfe
rs
Assig
ne
d r
even
ue
Au
tho
rised
Imp
lem
en
tati
on
2014
Rate
Imp
lem
en
tati
on
2013
Carr
yo
ver
to 2
015
17 01 03 03
Buildings and related expenditure of 'Health and consumer protection' policy area: Grange
4.57 1.71 0.00 0.00 0.00 6.28 4.91 78% 4.11 1.19
26 01 22 02 Acquisition and renting of buildings in Brussels 208.88 23.36 -56.37 16.32 10.56 202.75 198.30 98% 208.98 4.45
26 01 22 03 Expenditure related to buildings in Brussels 70.21 36.93 0.00 3.61 16.52 127.27 79.12 62% 85.14 47.54
26 01 22 04 Expenditure for equipment and furniture in Brussels
7.59 4.78 0.00 0.86 2.44 15.66 10.91 70% 12.73 4.62
26 01 22 05 Services, supplies and other operating expenditure in Brussels
8.40 4.23 0.00 -0.12 4.09 16.60 10.95 66% 13.87 5.41
26 01 22 06 Guarding of buildings in Brussels 31.94 13.27 0.00 0.00 4.96 50.17 27.29 54% 34.43 22.35
26 01 23 02 Acquisition and renting of buildings in Luxembourg
39.33 1.35 13.75 -15.21 4.64 43.85 40.47 92% 45.29 3.38
26 01 23 03 Expenditure related to buildings in Luxembourg 17.14 5.05 0.00 -1.38 0.88 21.70 14.75 68% 16.39 5.20
26 01 23 04 Expenditure for equipment and furniture in Luxembourg
1.09 0.44 0.00 -0.05 0.23 1.71 1.13 66% 0.94 0.49
26 01 23 05
Services, supplies and other operating expenditure in Luxembourg
1.02 0.43 0.00 -0.10 0.01 1.36 0.95 70% 0.99 0.28
26 01 23 06 Guarding of buildings in Luxembourg 5.86 0.42 0.00 0.51 0.15 6.95 5.92 85% 6.32 0.98
26 01 40 Security and monitoring 7.89 5.07 0.00 0.41 1.12 14.49 8.00 55% 8.81 6.12
Total 403.90 97.04 -42.62 4.84 45.62 508.79 402.71 79% 438.00 102.02
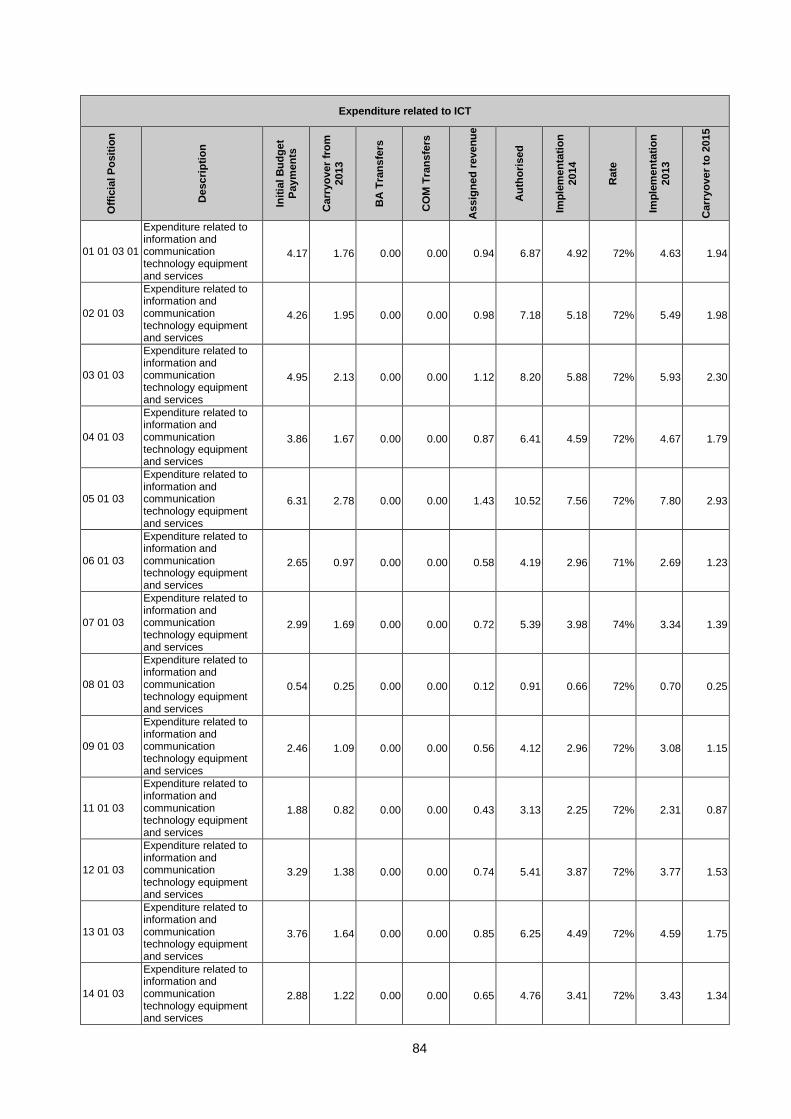
84
Expenditure related to ICT O
ffic
ial P
osit
ion
Descri
pti
on
Init
ial
Bu
dg
et
Paym
en
ts
Carr
yo
ver
fro
m
2013
BA
Tra
ns
fers
CO
M T
ran
sfe
rs
Assig
ne
d r
even
ue
Au
tho
rised
Imp
lem
en
tati
on
2014
Rate
Imp
lem
en
tati
on
2013
Carr
yo
ver
to 2
015
01 01 03 01
Expenditure related to information and communication technology equipment and services
4.17 1.76 0.00 0.00 0.94 6.87 4.92 72% 4.63 1.94
02 01 03
Expenditure related to information and communication technology equipment and services
4.26 1.95 0.00 0.00 0.98 7.18 5.18 72% 5.49 1.98
03 01 03
Expenditure related to information and communication technology equipment and services
4.95 2.13 0.00 0.00 1.12 8.20 5.88 72% 5.93 2.30
04 01 03
Expenditure related to information and communication technology equipment and services
3.86 1.67 0.00 0.00 0.87 6.41 4.59 72% 4.67 1.79
05 01 03
Expenditure related to information and communication technology equipment and services
6.31 2.78 0.00 0.00 1.43 10.52 7.56 72% 7.80 2.93
06 01 03
Expenditure related to information and communication technology equipment and services
2.65 0.97 0.00 0.00 0.58 4.19 2.96 71% 2.69 1.23
07 01 03
Expenditure related to information and communication technology equipment and services
2.99 1.69 0.00 0.00 0.72 5.39 3.98 74% 3.34 1.39
08 01 03
Expenditure related to information and communication technology equipment and services
0.54 0.25 0.00 0.00 0.12 0.91 0.66 72% 0.70 0.25
09 01 03
Expenditure related to information and communication technology equipment and services
2.46 1.09 0.00 0.00 0.56 4.12 2.96 72% 3.08 1.15
11 01 03
Expenditure related to information and communication technology equipment and services
1.88 0.82 0.00 0.00 0.43 3.13 2.25 72% 2.31 0.87
12 01 03
Expenditure related to information and communication technology equipment and services
3.29 1.38 0.00 0.00 0.74 5.41 3.87 72% 3.77 1.53
13 01 03
Expenditure related to information and communication technology equipment and services
3.76 1.64 0.00 0.00 0.85 6.25 4.49 72% 4.59 1.75
14 01 03
Expenditure related to information and communication technology equipment and services
2.88 1.22 0.00 0.00 0.65 4.76 3.41 72% 3.43 1.34
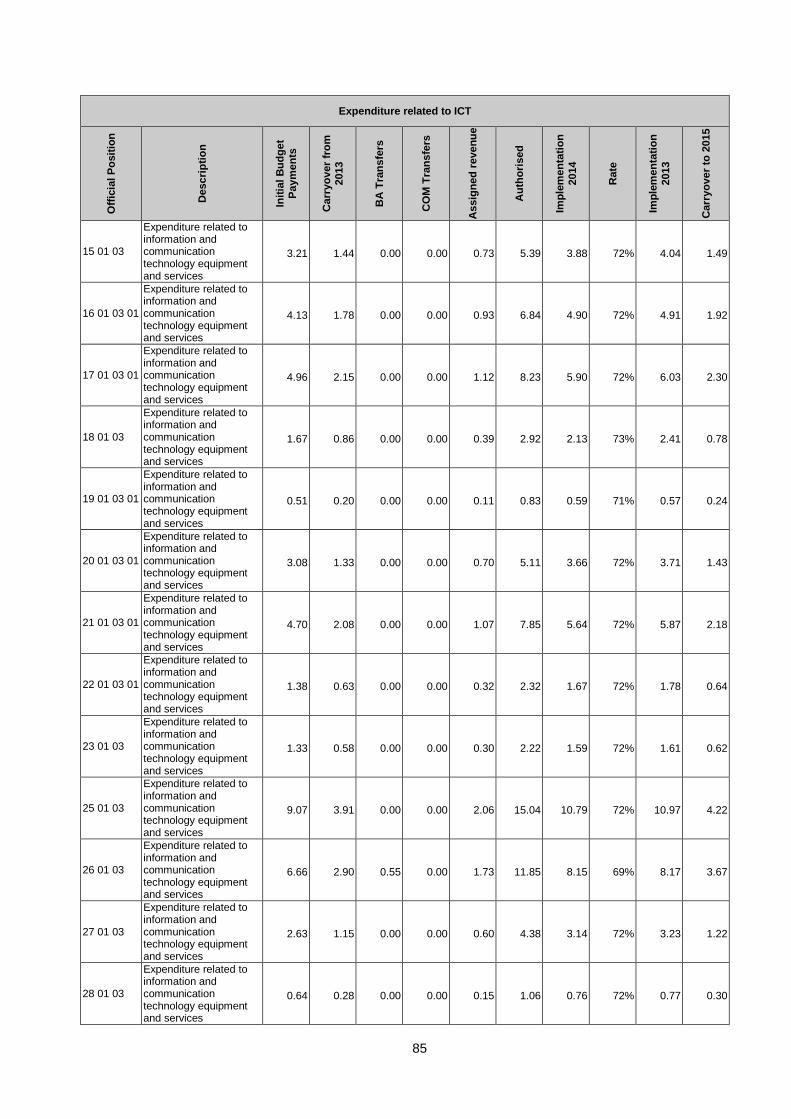
85
Expenditure related to ICT O
ffic
ial P
osit
ion
Descri
pti
on
Init
ial
Bu
dg
et
Paym
en
ts
Carr
yo
ver
fro
m
2013
BA
Tra
ns
fers
CO
M T
ran
sfe
rs
Assig
ne
d r
even
ue
Au
tho
rised
Imp
lem
en
tati
on
2014
Rate
Imp
lem
en
tati
on
2013
Carr
yo
ver
to 2
015
15 01 03
Expenditure related to information and communication technology equipment and services
3.21 1.44 0.00 0.00 0.73 5.39 3.88 72% 4.04 1.49
16 01 03 01
Expenditure related to information and communication technology equipment and services
4.13 1.78 0.00 0.00 0.93 6.84 4.90 72% 4.91 1.92
17 01 03 01
Expenditure related to information and communication technology equipment and services
4.96 2.15 0.00 0.00 1.12 8.23 5.90 72% 6.03 2.30
18 01 03
Expenditure related to information and communication technology equipment and services
1.67 0.86 0.00 0.00 0.39 2.92 2.13 73% 2.41 0.78
19 01 03 01
Expenditure related to information and communication technology equipment and services
0.51 0.20 0.00 0.00 0.11 0.83 0.59 71% 0.57 0.24
20 01 03 01
Expenditure related to information and communication technology equipment and services
3.08 1.33 0.00 0.00 0.70 5.11 3.66 72% 3.71 1.43
21 01 03 01
Expenditure related to information and communication technology equipment and services
4.70 2.08 0.00 0.00 1.07 7.85 5.64 72% 5.87 2.18
22 01 03 01
Expenditure related to information and communication technology equipment and services
1.38 0.63 0.00 0.00 0.32 2.32 1.67 72% 1.78 0.64
23 01 03
Expenditure related to information and communication technology equipment and services
1.33 0.58 0.00 0.00 0.30 2.22 1.59 72% 1.61 0.62
25 01 03
Expenditure related to information and communication technology equipment and services
9.07 3.91 0.00 0.00 2.06 15.04 10.79 72% 10.97 4.22
26 01 03
Expenditure related to information and communication technology equipment and services
6.66 2.90 0.55 0.00 1.73 11.85 8.15 69% 8.17 3.67
27 01 03
Expenditure related to information and communication technology equipment and services
2.63 1.15 0.00 0.00 0.60 4.38 3.14 72% 3.23 1.22
28 01 03
Expenditure related to information and communication technology equipment and services
0.64 0.28 0.00 0.00 0.15 1.06 0.76 72% 0.77 0.30
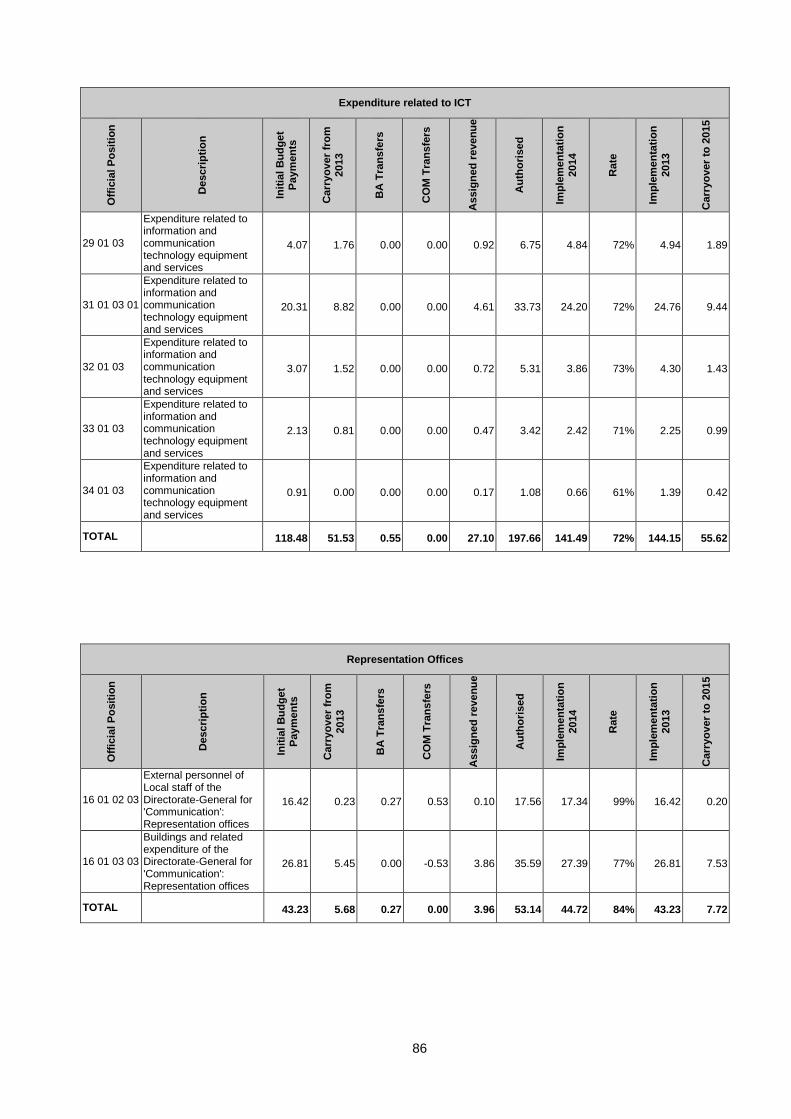
86
Expenditure related to ICT O
ffic
ial P
osit
ion
Descri
pti
on
Init
ial
Bu
dg
et
Paym
en
ts
Carr
yo
ver
fro
m
2013
BA
Tra
ns
fers
CO
M T
ran
sfe
rs
Assig
ne
d r
even
ue
Au
tho
rised
Imp
lem
en
tati
on
2014
Rate
Imp
lem
en
tati
on
2013
Carr
yo
ver
to 2
015
29 01 03
Expenditure related to information and communication technology equipment and services
4.07 1.76 0.00 0.00 0.92 6.75 4.84 72% 4.94 1.89
31 01 03 01
Expenditure related to information and communication technology equipment and services
20.31 8.82 0.00 0.00 4.61 33.73 24.20 72% 24.76 9.44
32 01 03
Expenditure related to information and communication technology equipment and services
3.07 1.52 0.00 0.00 0.72 5.31 3.86 73% 4.30 1.43
33 01 03
Expenditure related to information and communication technology equipment and services
2.13 0.81 0.00 0.00 0.47 3.42 2.42 71% 2.25 0.99
34 01 03
Expenditure related to information and communication technology equipment and services
0.91 0.00 0.00 0.00 0.17 1.08 0.66 61% 1.39 0.42
TOTAL 118.48 51.53 0.55 0.00 27.10 197.66 141.49 72% 144.15 55.62
Representation Offices
Off
icia
l P
osit
ion
Descri
pti
on
Init
ial
Bu
dg
et
Paym
en
ts
Carr
yo
ver
fro
m
2013
BA
Tra
ns
fers
CO
M T
ran
sfe
rs
Assig
ne
d r
even
ue
Au
tho
rised
Imp
lem
en
tati
on
2014
Rate
Imp
lem
en
tati
on
2013
Carr
yo
ver
to 2
015
16 01 02 03
External personnel of Local staff of the Directorate-General for 'Communication': Representation offices
16.42 0.23 0.27 0.53 0.10 17.56 17.34 99% 16.42 0.20
16 01 03 03
Buildings and related expenditure of the Directorate-General for 'Communication': Representation offices
26.81 5.45 0.00 -0.53 3.86 35.59 27.39 77% 26.81 7.53
TOTAL 43.23 5.68 0.27 0.00 3.96 53.14 44.72 84% 43.23 7.72
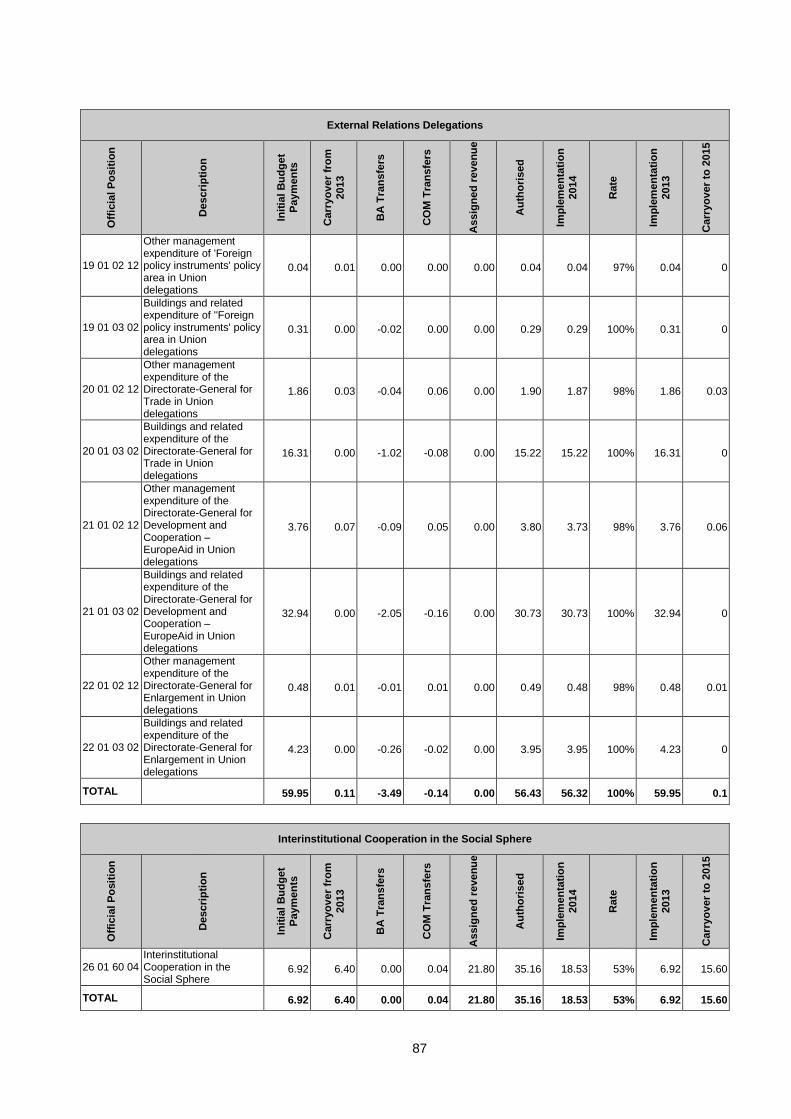
87
External Relations Delegations
Off
icia
l P
osit
ion
Descri
pti
on
Init
ial
Bu
dg
et
Paym
en
ts
Carr
yo
ver
fro
m
2013
BA
Tra
ns
fers
CO
M T
ran
sfe
rs
Assig
ne
d r
even
ue
Au
tho
rised
Imp
lem
en
tati
on
2014
Rate
Imp
lem
en
tati
on
2013
Carr
yo
ver
to 2
015
19 01 02 12
Other management expenditure of 'Foreign policy instruments' policy area in Union delegations
0.04 0.01 0.00 0.00 0.00 0.04 0.04 97% 0.04 0
19 01 03 02
Buildings and related expenditure of ''Foreign policy instruments' policy area in Union delegations
0.31 0.00 -0.02 0.00 0.00 0.29 0.29 100% 0.31 0
20 01 02 12
Other management expenditure of the Directorate-General for Trade in Union delegations
1.86 0.03 -0.04 0.06 0.00 1.90 1.87 98% 1.86 0.03
20 01 03 02
Buildings and related expenditure of the Directorate-General for Trade in Union delegations
16.31 0.00 -1.02 -0.08 0.00 15.22 15.22 100% 16.31 0
21 01 02 12
Other management expenditure of the Directorate-General for Development and Cooperation – EuropeAid in Union delegations
3.76 0.07 -0.09 0.05 0.00 3.80 3.73 98% 3.76 0.06
21 01 03 02
Buildings and related expenditure of the Directorate-General for Development and Cooperation – EuropeAid in Union delegations
32.94 0.00 -2.05 -0.16 0.00 30.73 30.73 100% 32.94 0
22 01 02 12
Other management expenditure of the Directorate-General for Enlargement in Union delegations
0.48 0.01 -0.01 0.01 0.00 0.49 0.48 98% 0.48 0.01
22 01 03 02
Buildings and related expenditure of the Directorate-General for Enlargement in Union delegations
4.23 0.00 -0.26 -0.02 0.00 3.95 3.95 100% 4.23 0
TOTAL 59.95 0.11 -3.49 -0.14 0.00 56.43 56.32 100% 59.95 0.1
Interinstitutional Cooperation in the Social Sphere
Off
icia
l P
osit
ion
Descri
pti
on
Init
ial
Bu
dg
et
Paym
en
ts
Carr
yo
ver
fro
m
2013
BA
Tra
ns
fers
CO
M T
ran
sfe
rs
Assig
ne
d r
even
ue
Au
tho
rised
Imp
lem
en
tati
on
2014
Rate
Imp
lem
en
tati
on
2013
Carr
yo
ver
to 2
015
26 01 60 04 Interinstitutional Cooperation in the Social Sphere
6.92 6.40 0.00 0.04 21.80 35.16 18.53 53% 6.92 15.60
TOTAL 6.92 6.40 0.00 0.04 21.80 35.16 18.53 53% 6.92 15.60
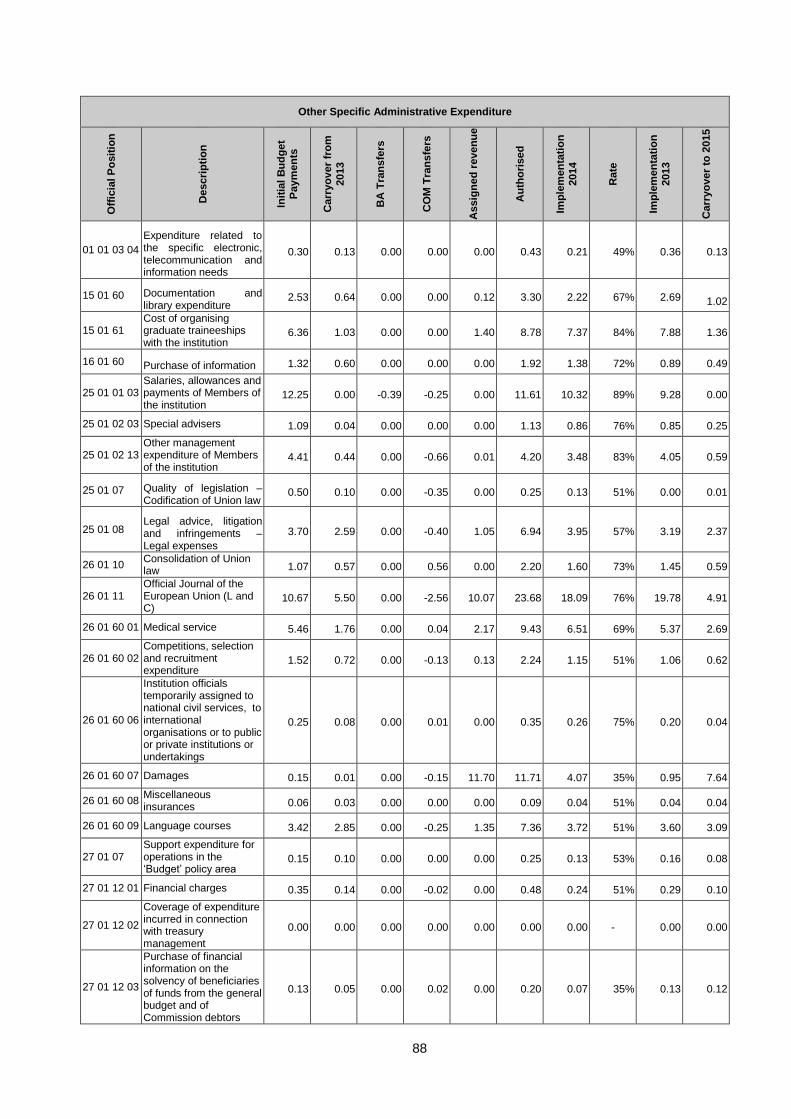
88
Other Specific Administrative Expenditure O
ffic
ial P
osit
ion
Descri
pti
on
Init
ial
Bu
dg
et
Paym
en
ts
Carr
yo
ver
fro
m
2013
BA
Tra
ns
fers
CO
M T
ran
sfe
rs
Assig
ne
d r
even
ue
Au
tho
rised
Imp
lem
en
tati
on
2014
Rate
Imp
lem
en
tati
on
2013
Carr
yo
ver
to 2
015
01 01 03 04
Expenditure related to the specific electronic, telecommunication and information needs
0.30 0.13 0.00 0.00 0.00 0.43 0.21 49% 0.36 0.13
15 01 60 Documentation and library expenditure
2.53 0.64 0.00 0.00 0.12 3.30 2.22 67% 2.69 1.02
15 01 61 Cost of organising graduate traineeships with the institution
6.36 1.03 0.00 0.00 1.40 8.78 7.37 84% 7.88 1.36
16 01 60 Purchase of information 1.32 0.60 0.00 0.00 0.00 1.92 1.38 72% 0.89 0.49
25 01 01 03 Salaries, allowances and payments of Members of the institution
12.25 0.00 -0.39 -0.25 0.00 11.61 10.32 89% 9.28 0.00
25 01 02 03 Special advisers 1.09 0.04 0.00 0.00 0.00 1.13 0.86 76% 0.85 0.25
25 01 02 13 Other management expenditure of Members of the institution
4.41 0.44 0.00 -0.66 0.01 4.20 3.48 83% 4.05 0.59
25 01 07 Quality of legislation – Codification of Union law
0.50 0.10 0.00 -0.35 0.00 0.25 0.13 51% 0.00 0.01
25 01 08 Legal advice, litigation and infringements – Legal expenses
3.70 2.59 0.00 -0.40 1.05 6.94 3.95 57% 3.19 2.37
26 01 10 Consolidation of Union law 1.07 0.57 0.00 0.56 0.00 2.20 1.60 73% 1.45 0.59
26 01 11 Official Journal of the European Union (L and C)
10.67 5.50 0.00 -2.56 10.07 23.68 18.09 76% 19.78 4.91
26 01 60 01 Medical service 5.46 1.76 0.00 0.04 2.17 9.43 6.51 69% 5.37 2.69
26 01 60 02 Competitions, selection and recruitment expenditure
1.52 0.72 0.00 -0.13 0.13 2.24 1.15 51% 1.06 0.62
26 01 60 06
Institution officials temporarily assigned to national civil services, to international organisations or to public or private institutions or undertakings
0.25 0.08 0.00 0.01 0.00 0.35 0.26 75% 0.20 0.04
26 01 60 07 Damages 0.15 0.01 0.00 -0.15 11.70 11.71 4.07 35% 0.95 7.64
26 01 60 08 Miscellaneous insurances 0.06 0.03 0.00 0.00 0.00 0.09 0.04 51% 0.04 0.04
26 01 60 09 Language courses 3.42 2.85 0.00 -0.25 1.35 7.36 3.72 51% 3.60 3.09
27 01 07 Support expenditure for operations in the ‘Budget’ policy area
0.15 0.10 0.00 0.00 0.00 0.25 0.13 53% 0.16 0.08
27 01 12 01 Financial charges 0.35 0.14 0.00 -0.02 0.00 0.48 0.24 51% 0.29 0.10
27 01 12 02
Coverage of expenditure incurred in connection with treasury management
0.00 0.00 0.00 0.00 0.00 0.00 0.00 - 0.00 0.00
27 01 12 03
Purchase of financial information on the solvency of beneficiaries of funds from the general budget and of Commission debtors
0.13 0.05 0.00 0.02 0.00 0.20 0.07 35% 0.13 0.12
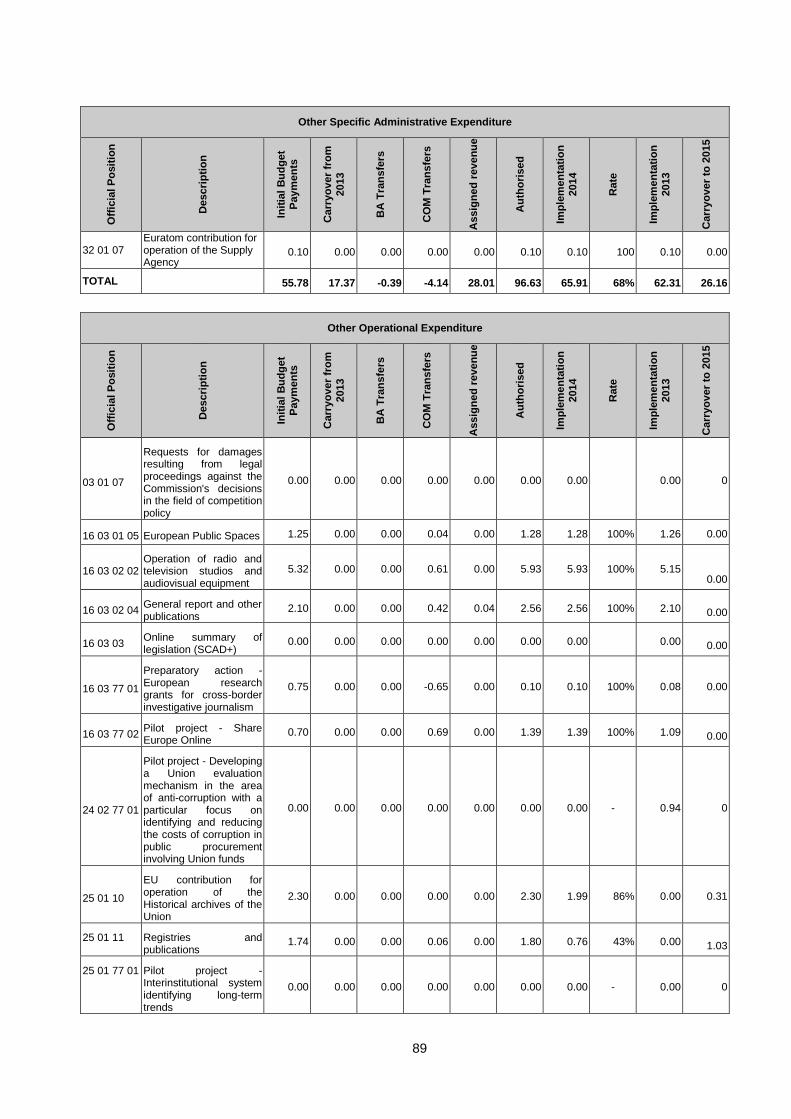
89
Other Specific Administrative Expenditure O
ffic
ial P
osit
ion
Descri
pti
on
Init
ial
Bu
dg
et
Paym
en
ts
Carr
yo
ver
fro
m
2013
BA
Tra
ns
fers
CO
M T
ran
sfe
rs
Assig
ne
d r
even
ue
Au
tho
rised
Imp
lem
en
tati
on
2014
Rate
Imp
lem
en
tati
on
2013
Carr
yo
ver
to 2
015
32 01 07 Euratom contribution for operation of the Supply Agency
0.10 0.00 0.00 0.00 0.00 0.10 0.10 100 0.10 0.00
TOTAL 55.78 17.37 -0.39 -4.14 28.01 96.63 65.91 68% 62.31 26.16
Other Operational Expenditure
Off
icia
l P
osit
ion
Descri
pti
on
Init
ial
Bu
dg
et
Paym
en
ts
Carr
yo
ver
fro
m
2013
BA
Tra
ns
fers
CO
M T
ran
sfe
rs
Assig
ne
d r
even
ue
Au
tho
rised
Imp
lem
en
tati
on
2014
Rate
Imp
lem
en
tati
on
2013
Carr
yo
ver
to 2
015
03 01 07
Requests for damages resulting from legal proceedings against the Commission's decisions in the field of competition policy
0.00 0.00 0.00 0.00 0.00 0.00 0.00 0.00 0
16 03 01 05 European Public Spaces 1.25 0.00 0.00 0.04 0.00 1.28 1.28 100% 1.26 0.00
16 03 02 02 Operation of radio and television studios and audiovisual equipment
5.32 0.00 0.00 0.61 0.00 5.93 5.93 100% 5.15 0.00
16 03 02 04 General report and other publications
2.10 0.00 0.00 0.42 0.04 2.56 2.56 100% 2.10 0.00
16 03 03 Online summary of legislation (SCAD+)
0.00 0.00 0.00 0.00 0.00 0.00 0.00 0.00 0.00
16 03 77 01
Preparatory action - European research grants for cross-border investigative journalism
0.75 0.00 0.00 -0.65 0.00 0.10 0.10 100% 0.08 0.00
16 03 77 02 Pilot project - Share Europe Online
0.70 0.00 0.00 0.69 0.00 1.39 1.39 100% 1.09 0.00
24 02 77 01
Pilot project - Developing a Union evaluation mechanism in the area of anti-corruption with a particular focus on identifying and reducing the costs of corruption in public procurement involving Union funds
0.00 0.00 0.00 0.00 0.00 0.00 0.00 - 0.94 0
25 01 10
EU contribution for operation of the Historical archives of the Union
2.30 0.00 0.00 0.00 0.00 2.30 1.99 86% 0.00 0.31
25 01 11 Registries and publications
1.74 0.00 0.00 0.06 0.00 1.80 0.76 43% 0.00 1.03
25 01 77 01 Pilot project - Interinstitutional system identifying long-term trends
0.00 0.00 0.00 0.00 0.00 0.00 0.00 - 0.00 0
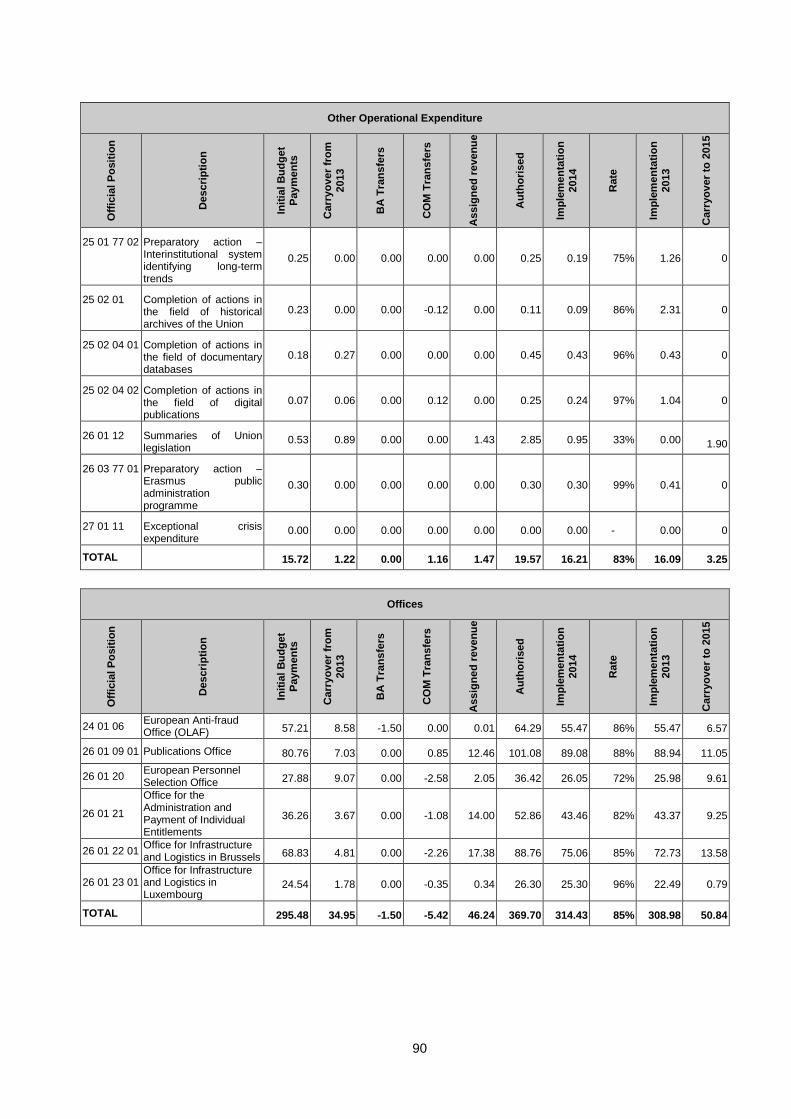
90
Other Operational Expenditure O
ffic
ial P
osit
ion
Descri
pti
on
Init
ial
Bu
dg
et
Paym
en
ts
Carr
yo
ver
fro
m
2013
BA
Tra
ns
fers
CO
M T
ran
sfe
rs
Assig
ne
d r
even
ue
Au
tho
rised
Imp
lem
en
tati
on
2014
Rate
Imp
lem
en
tati
on
2013
Carr
yo
ver
to 2
015
25 01 77 02 Preparatory action – Interinstitutional system identifying long-term trends
0.25 0.00 0.00 0.00 0.00 0.25 0.19 75% 1.26 0
25 02 01 Completion of actions in the field of historical archives of the Union
0.23 0.00 0.00 -0.12 0.00 0.11 0.09 86% 2.31 0
25 02 04 01 Completion of actions in the field of documentary databases
0.18 0.27 0.00 0.00 0.00 0.45 0.43 96% 0.43 0
25 02 04 02 Completion of actions in the field of digital publications
0.07 0.06 0.00 0.12 0.00 0.25 0.24 97% 1.04 0
26 01 12 Summaries of Union legislation
0.53 0.89 0.00 0.00 1.43 2.85 0.95 33% 0.00 1.90
26 03 77 01 Preparatory action – Erasmus public administration programme
0.30 0.00 0.00 0.00 0.00 0.30 0.30 99% 0.41 0
27 01 11 Exceptional crisis expenditure
0.00 0.00 0.00 0.00 0.00 0.00 0.00 - 0.00 0
TOTAL 15.72 1.22 0.00 1.16 1.47 19.57 16.21 83% 16.09 3.25
Offices
Off
icia
l P
osit
ion
Descri
pti
on
Init
ial
Bu
dg
et
Paym
en
ts
Carr
yo
ver
fro
m
2013
BA
Tra
ns
fers
CO
M T
ran
sfe
rs
Assig
ne
d r
even
ue
Au
tho
rised
Imp
lem
en
tati
on
2014
Rate
Imp
lem
en
tati
on
2013
Carr
yo
ver
to 2
015
24 01 06 European Anti-fraud Office (OLAF) 57.21 8.58 -1.50 0.00 0.01 64.29 55.47 86% 55.47 6.57
26 01 09 01 Publications Office 80.76 7.03 0.00 0.85 12.46 101.08 89.08 88% 88.94 11.05
26 01 20 European Personnel Selection Office 27.88 9.07 0.00 -2.58 2.05 36.42 26.05 72% 25.98 9.61
26 01 21
Office for the Administration and Payment of Individual Entitlements
36.26 3.67 0.00 -1.08 14.00 52.86 43.46 82% 43.37 9.25
26 01 22 01 Office for Infrastructure and Logistics in Brussels 68.83 4.81 0.00 -2.26 17.38 88.76 75.06 85% 72.73 13.58
26 01 23 01 Office for Infrastructure and Logistics in Luxembourg
24.54 1.78 0.00 -0.35 0.34 26.30 25.30 96% 22.49 0.79
TOTAL 295.48 34.95 -1.50 -5.42 46.24 369.70 314.43 85% 308.98 50.84
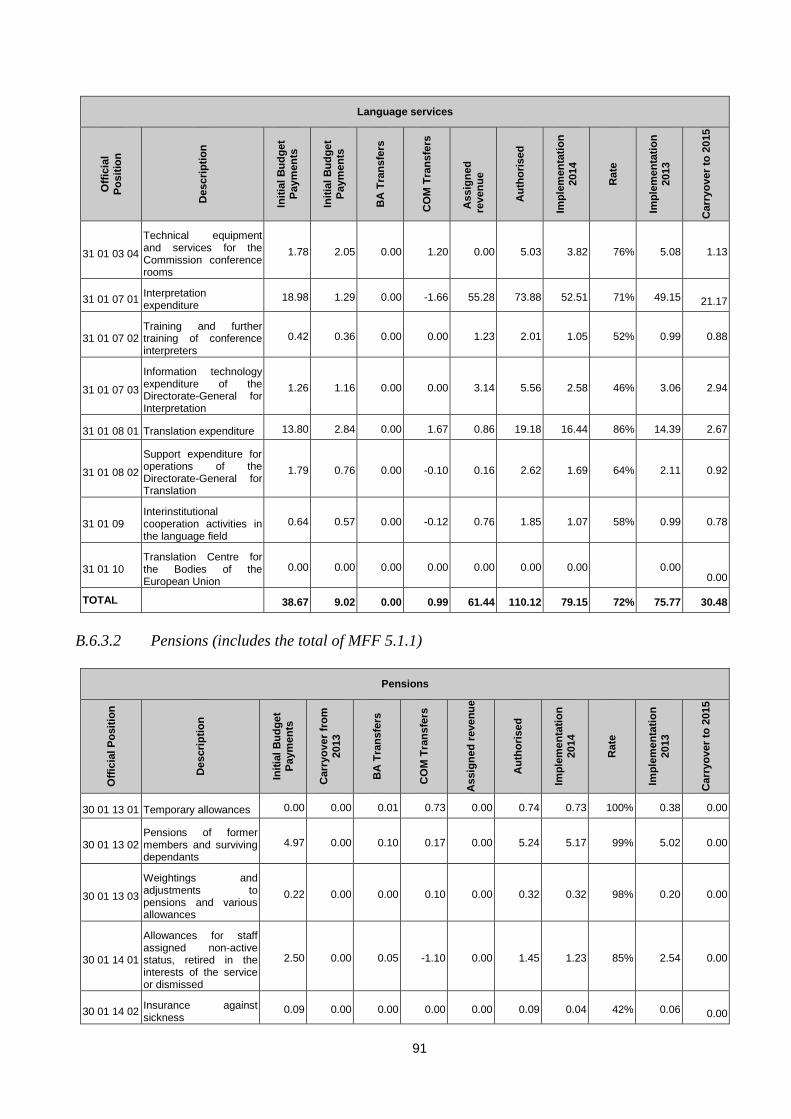
91
Language services O
ffic
ial
Po
sit
ion
Descri
pti
on
Init
ial
Bu
dg
et
Paym
en
ts
Init
ial
Bu
dg
et
Paym
en
ts
BA
Tra
ns
fers
CO
M T
ran
sfe
rs
Assig
ne
d
reven
ue
Au
tho
rised
Imp
lem
en
tati
on
2014
Rate
Imp
lem
en
tati
on
2013
Carr
yo
ver
to 2
015
31 01 03 04
Technical equipment and services for the Commission conference rooms
1.78 2.05 0.00 1.20 0.00 5.03 3.82 76% 5.08 1.13
31 01 07 01 Interpretation expenditure
18.98 1.29 0.00 -1.66 55.28 73.88 52.51 71% 49.15 21.17
31 01 07 02 Training and further training of conference interpreters
0.42 0.36 0.00 0.00 1.23 2.01 1.05 52% 0.99 0.88
31 01 07 03
Information technology expenditure of the Directorate-General for Interpretation
1.26 1.16 0.00 0.00 3.14 5.56 2.58 46% 3.06 2.94
31 01 08 01 Translation expenditure 13.80 2.84 0.00 1.67 0.86 19.18 16.44 86% 14.39 2.67
31 01 08 02
Support expenditure for operations of the Directorate-General for Translation
1.79 0.76 0.00 -0.10 0.16 2.62 1.69 64% 2.11 0.92
31 01 09 Interinstitutional cooperation activities in the language field
0.64 0.57 0.00 -0.12 0.76 1.85 1.07 58% 0.99 0.78
31 01 10 Translation Centre for the Bodies of the European Union
0.00 0.00 0.00 0.00 0.00 0.00 0.00 0.00 0.00
TOTAL 38.67 9.02 0.00 0.99 61.44 110.12 79.15 72% 75.77 30.48
B.6.3.2 Pensions (includes the total of MFF 5.1.1)
Pensions
Off
icia
l P
osit
ion
Descri
pti
on
Init
ial
Bu
dg
et
Paym
en
ts
Carr
yo
ver
fro
m
2013
BA
Tra
ns
fers
CO
M T
ran
sfe
rs
Assig
ne
d r
even
ue
Au
tho
rised
Imp
lem
en
tati
on
2014
Rate
Imp
lem
en
tati
on
2013
Carr
yo
ver
to 2
015
30 01 13 01 Temporary allowances 0.00 0.00 0.01 0.73 0.00 0.74 0.73 100% 0.38 0.00
30 01 13 02 Pensions of former members and surviving dependants
4.97 0.00 0.10 0.17 0.00 5.24 5.17 99% 5.02 0.00
30 01 13 03
Weightings and adjustments to pensions and various allowances
0.22 0.00 0.00 0.10 0.00 0.32 0.32 98% 0.20 0.00
30 01 14 01
Allowances for staff assigned non-active status, retired in the interests of the service or dismissed
2.50 0.00 0.05 -1.10 0.00 1.45 1.23 85% 2.54 0.00
30 01 14 02 Insurance against sickness
0.09 0.00 0.00 0.00 0.00 0.09 0.04 42% 0.06 0.00
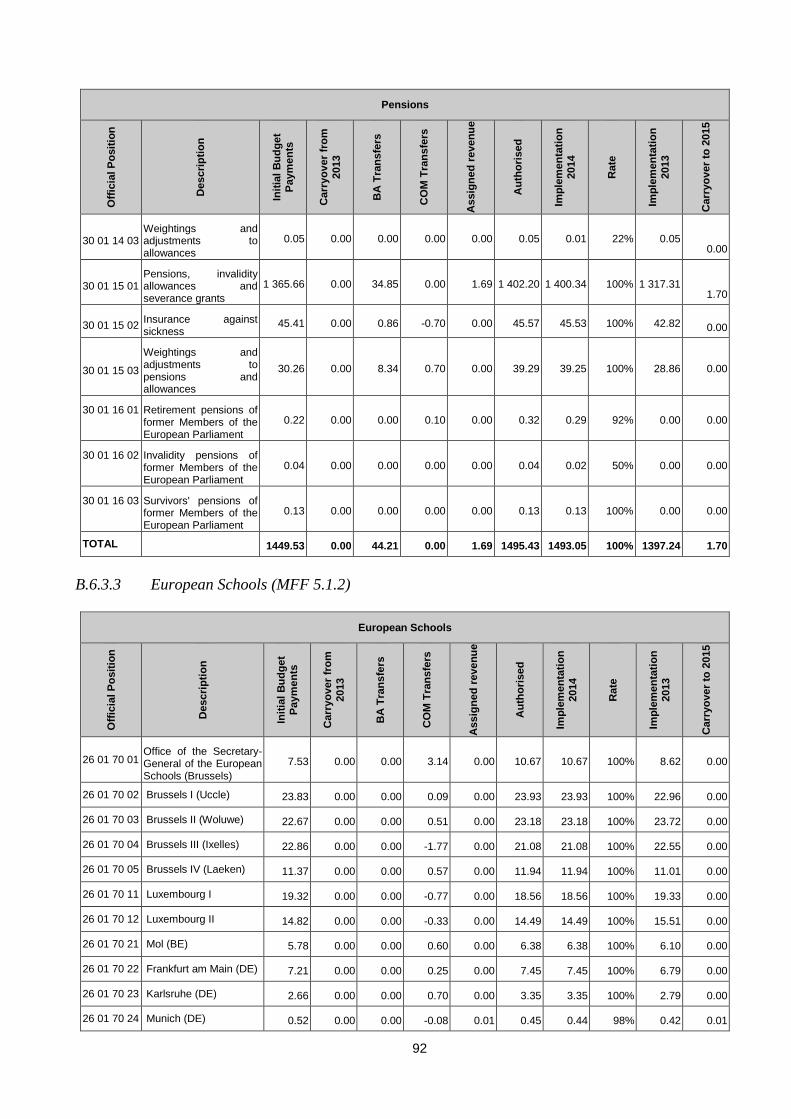
92
Pensions O
ffic
ial P
osit
ion
Descri
pti
on
Init
ial
Bu
dg
et
Paym
en
ts
Carr
yo
ver
fro
m
2013
BA
Tra
ns
fers
CO
M T
ran
sfe
rs
Assig
ne
d r
even
ue
Au
tho
rised
Imp
lem
en
tati
on
2014
Rate
Imp
lem
en
tati
on
2013
Carr
yo
ver
to 2
015
30 01 14 03 Weightings and adjustments to allowances
0.05 0.00 0.00 0.00 0.00 0.05 0.01 22% 0.05 0.00
30 01 15 01 Pensions, invalidity allowances and severance grants
1 365.66 0.00 34.85 0.00 1.69 1 402.20 1 400.34 100% 1 317.31 1.70
30 01 15 02 Insurance against sickness
45.41 0.00 0.86 -0.70 0.00 45.57 45.53 100% 42.82 0.00
30 01 15 03
Weightings and adjustments to pensions and allowances
30.26 0.00 8.34 0.70 0.00 39.29 39.25 100% 28.86 0.00
30 01 16 01 Retirement pensions of former Members of the European Parliament
0.22 0.00 0.00 0.10 0.00 0.32 0.29 92% 0.00 0.00
30 01 16 02 Invalidity pensions of former Members of the European Parliament
0.04 0.00 0.00 0.00 0.00 0.04 0.02 50% 0.00 0.00
30 01 16 03 Survivors' pensions of former Members of the European Parliament
0.13 0.00 0.00 0.00 0.00 0.13 0.13 100% 0.00 0.00
TOTAL 1449.53 0.00 44.21 0.00 1.69 1495.43 1493.05 100% 1397.24 1.70
B.6.3.3 European Schools (MFF 5.1.2)
European Schools
Off
icia
l P
osit
ion
Descri
pti
on
Init
ial
Bu
dg
et
Paym
en
ts
Carr
yo
ver
fro
m
2013
BA
Tra
ns
fers
CO
M T
ran
sfe
rs
Assig
ne
d r
even
ue
Au
tho
rised
Imp
lem
en
tati
on
2014
Rate
Imp
lem
en
tati
on
2013
Carr
yo
ver
to 2
015
26 01 70 01 Office of the Secretary-General of the European Schools (Brussels)
7.53 0.00 0.00 3.14 0.00 10.67 10.67 100% 8.62 0.00
26 01 70 02 Brussels I (Uccle) 23.83 0.00 0.00 0.09 0.00 23.93 23.93 100% 22.96 0.00
26 01 70 03 Brussels II (Woluwe) 22.67 0.00 0.00 0.51 0.00 23.18 23.18 100% 23.72 0.00
26 01 70 04 Brussels III (Ixelles) 22.86 0.00 0.00 -1.77 0.00 21.08 21.08 100% 22.55 0.00
26 01 70 05 Brussels IV (Laeken) 11.37 0.00 0.00 0.57 0.00 11.94 11.94 100% 11.01 0.00
26 01 70 11 Luxembourg I 19.32 0.00 0.00 -0.77 0.00 18.56 18.56 100% 19.33 0.00
26 01 70 12 Luxembourg II 14.82 0.00 0.00 -0.33 0.00 14.49 14.49 100% 15.51 0.00
26 01 70 21 Mol (BE) 5.78 0.00 0.00 0.60 0.00 6.38 6.38 100% 6.10 0.00
26 01 70 22 Frankfurt am Main (DE) 7.21 0.00 0.00 0.25 0.00 7.45 7.45 100% 6.79 0.00
26 01 70 23 Karlsruhe (DE) 2.66 0.00 0.00 0.70 0.00 3.35 3.35 100% 2.79 0.00
26 01 70 24 Munich (DE) 0.52 0.00 0.00 -0.08 0.01 0.45 0.44 98% 0.42 0.01
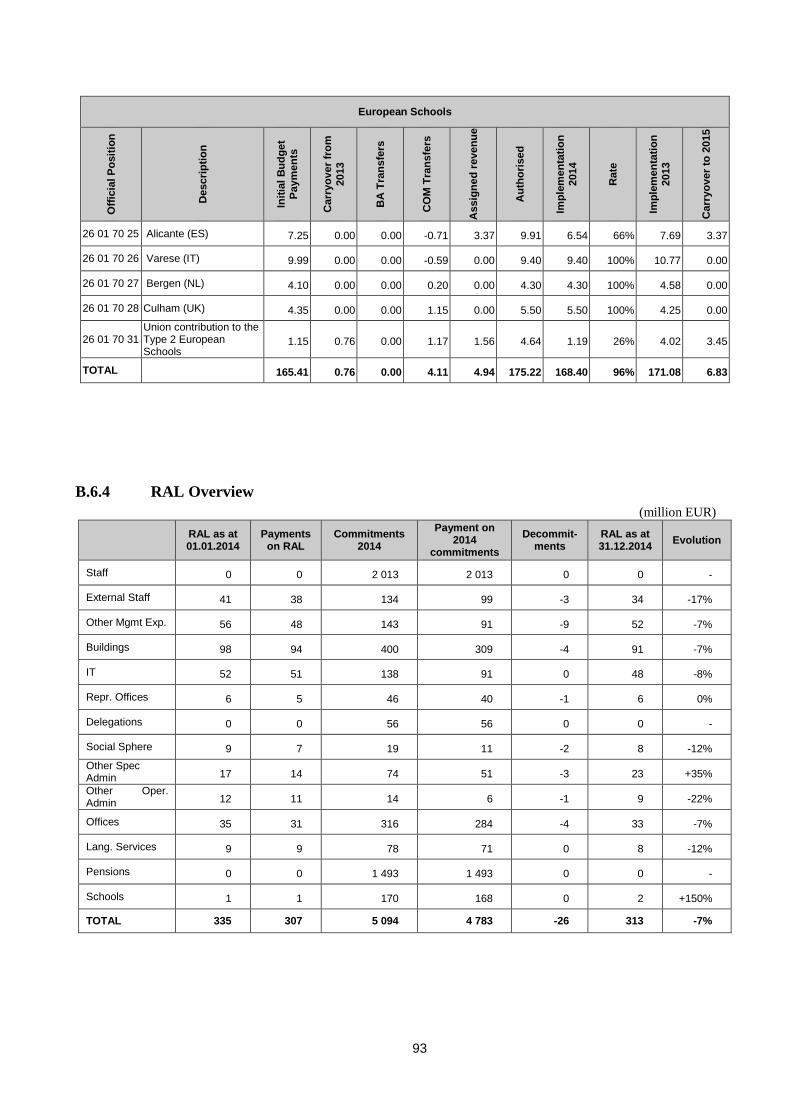
93
European Schools O
ffic
ial P
osit
ion
Descri
pti
on
Init
ial
Bu
dg
et
Paym
en
ts
Carr
yo
ver
fro
m
2013
BA
Tra
ns
fers
CO
M T
ran
sfe
rs
Assig
ne
d r
even
ue
Au
tho
rised
Imp
lem
en
tati
on
2014
Rate
Imp
lem
en
tati
on
2013
Carr
yo
ver
to 2
015
26 01 70 25 Alicante (ES) 7.25 0.00 0.00 -0.71 3.37 9.91 6.54 66% 7.69 3.37
26 01 70 26 Varese (IT) 9.99 0.00 0.00 -0.59 0.00 9.40 9.40 100% 10.77 0.00
26 01 70 27 Bergen (NL) 4.10 0.00 0.00 0.20 0.00 4.30 4.30 100% 4.58 0.00
26 01 70 28 Culham (UK) 4.35 0.00 0.00 1.15 0.00 5.50 5.50 100% 4.25 0.00
26 01 70 31 Union contribution to the Type 2 European Schools
1.15 0.76 0.00 1.17 1.56 4.64 1.19 26% 4.02 3.45
TOTAL 165.41 0.76 0.00 4.11 4.94 175.22 168.40 96% 171.08 6.83
B.6.4 RAL Overview
(million EUR)
RAL as at 01.01.2014
Payments on RAL
Commitments 2014
Payment on 2014
commitments
Decommit-ments
RAL as at 31.12.2014
Evolution
Staff 0 0 2 013 2 013 0 0 -
External Staff 41 38 134 99 -3 34 -17%
Other Mgmt Exp. 56 48 143 91 -9 52 -7%
Buildings 98 94 400 309 -4 91 -7%
IT 52 51 138 91 0 48 -8%
Repr. Offices 6 5 46 40 -1 6 0%
Delegations 0 0 56 56 0 0 -
Social Sphere 9 7 19 11 -2 8 -12%
Other Spec Admin 17 14 74 51 -3 23 +35%
Other Oper. Admin 12 11 14 6 -1 9 -22%
Offices 35 31 316 284 -4 33 -7%
Lang. Services 9 9 78 71 0 8 -12%
Pensions 0 0 1 493 1 493 0 0 -
Schools 1 1 170 168 0 2 +150%
TOTAL 335 307 5 094 4 783 -26 313 -7%
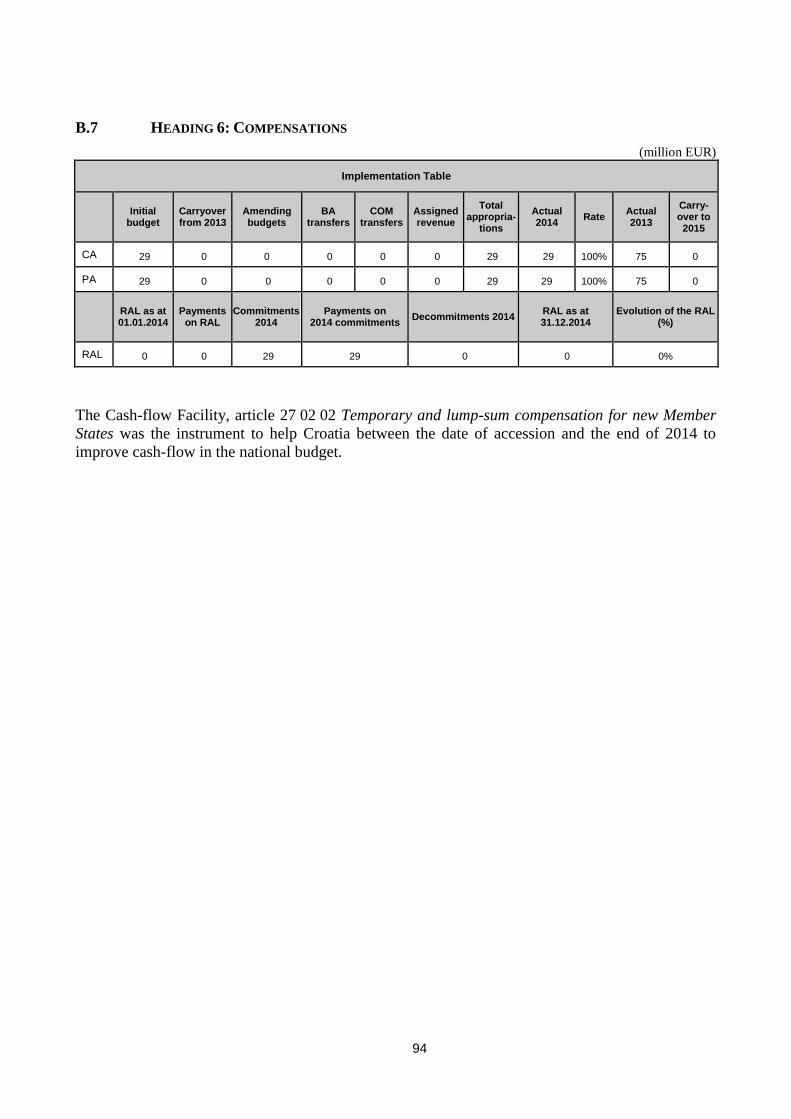
94
B.7 HEADING 6: COMPENSATIONS
(million EUR)
Implementation Table
Initial
budget Carryover from 2013
Amending budgets
BA transfers
COM transfers
Assigned revenue
Total appropria-
tions
Actual 2014
Rate Actual 2013
Carry-over to 2015
CA 29 0 0 0 0 0 29 29 100% 75 0
PA 29 0 0 0 0 0 29 29 100% 75 0
RAL as at 01.01.2014
Payments on RAL
Commitments 2014
Payments on 2014 commitments
Decommitments 2014 RAL as at 31.12.2014
Evolution of the RAL (%)
RAL 0 0 29 29 0 0 0%
The Cash-flow Facility, article 27 02 02 Temporary and lump-sum compensation for new Member
States was the instrument to help Croatia between the date of accession and the end of 2014 to
improve cash-flow in the national budget.
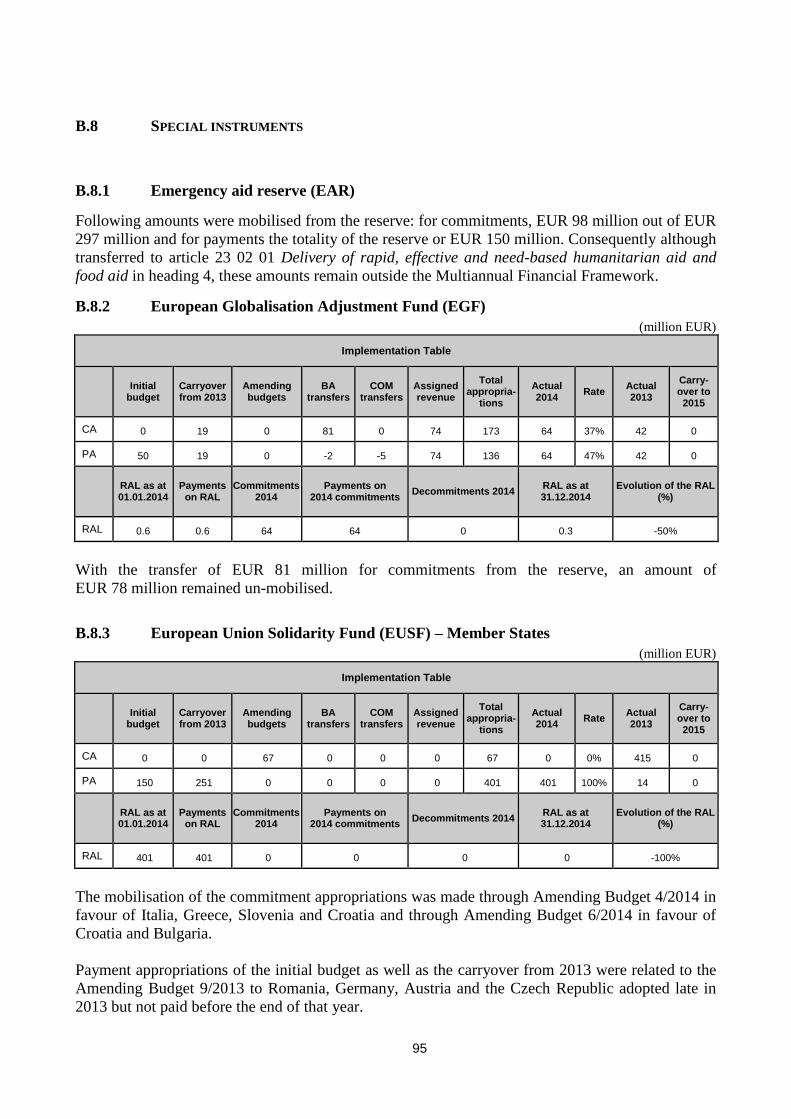
95
B.8 SPECIAL INSTRUMENTS
B.8.1 Emergency aid reserve (EAR)
Following amounts were mobilised from the reserve: for commitments, EUR 98 million out of EUR
297 million and for payments the totality of the reserve or EUR 150 million. Consequently although
transferred to article 23 02 01 Delivery of rapid, effective and need-based humanitarian aid and
food aid in heading 4, these amounts remain outside the Multiannual Financial Framework.
B.8.2 European Globalisation Adjustment Fund (EGF)
(million EUR)
Implementation Table
Initial
budget Carryover from 2013
Amending budgets
BA transfers
COM transfers
Assigned revenue
Total appropria-
tions
Actual 2014
Rate Actual 2013
Carry-over to 2015
CA 0 19 0 81 0 74 173 64 37% 42 0
PA 50 19 0 -2 -5 74 136 64 47% 42 0
RAL as at 01.01.2014
Payments on RAL
Commitments 2014
Payments on 2014 commitments
Decommitments 2014 RAL as at 31.12.2014
Evolution of the RAL (%)
RAL 0.6 0.6 64 64 0 0.3 -50%
With the transfer of EUR 81 million for commitments from the reserve, an amount of
EUR 78 million remained un-mobilised.
B.8.3 European Union Solidarity Fund (EUSF) – Member States
(million EUR)
Implementation Table
Initial
budget Carryover from 2013
Amending budgets
BA transfers
COM transfers
Assigned revenue
Total appropria-
tions
Actual 2014
Rate Actual 2013
Carry-over to 2015
CA 0 0 67 0 0 0 67 0 0% 415 0
PA 150 251 0 0 0 0 401 401 100% 14 0
RAL as at 01.01.2014
Payments on RAL
Commitments 2014
Payments on 2014 commitments
Decommitments 2014 RAL as at 31.12.2014
Evolution of the RAL (%)
RAL 401 401 0 0 0 0 -100%
The mobilisation of the commitment appropriations was made through Amending Budget 4/2014 in
favour of Italia, Greece, Slovenia and Croatia and through Amending Budget 6/2014 in favour of
Croatia and Bulgaria.
Payment appropriations of the initial budget as well as the carryover from 2013 were related to the
Amending Budget 9/2013 to Romania, Germany, Austria and the Czech Republic adopted late in
2013 but not paid before the end of that year.
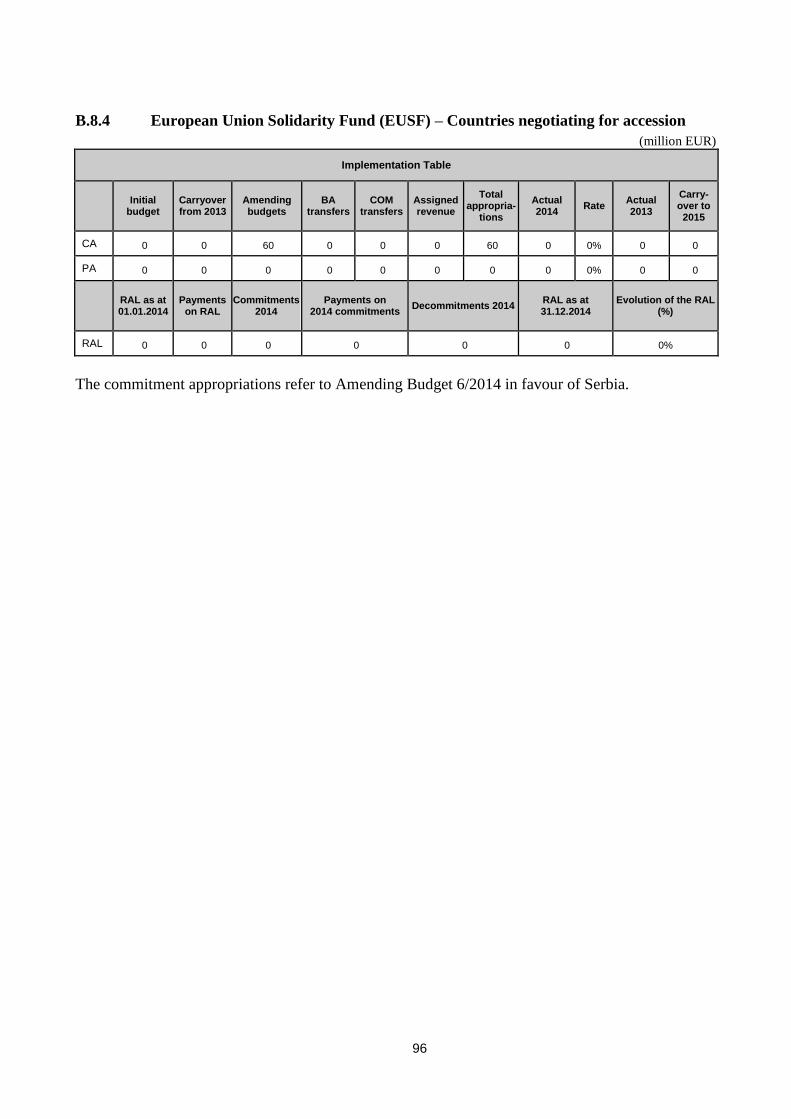
96
B.8.4 European Union Solidarity Fund (EUSF) – Countries negotiating for accession
(million EUR)
Implementation Table
Initial
budget Carryover from 2013
Amending budgets
BA transfers
COM transfers
Assigned revenue
Total appropria-
tions
Actual 2014
Rate Actual 2013
Carry-over to 2015
CA 0 0 60 0 0 0 60 0 0% 0 0
PA 0 0 0 0 0 0 0 0 0% 0 0
RAL as at 01.01.2014
Payments on RAL
Commitments 2014
Payments on 2014 commitments
Decommitments 2014 RAL as at 31.12.2014
Evolution of the RAL (%)
RAL 0 0 0 0 0 0 0%
The commitment appropriations refer to Amending Budget 6/2014 in favour of Serbia.
PART C – Own Resources

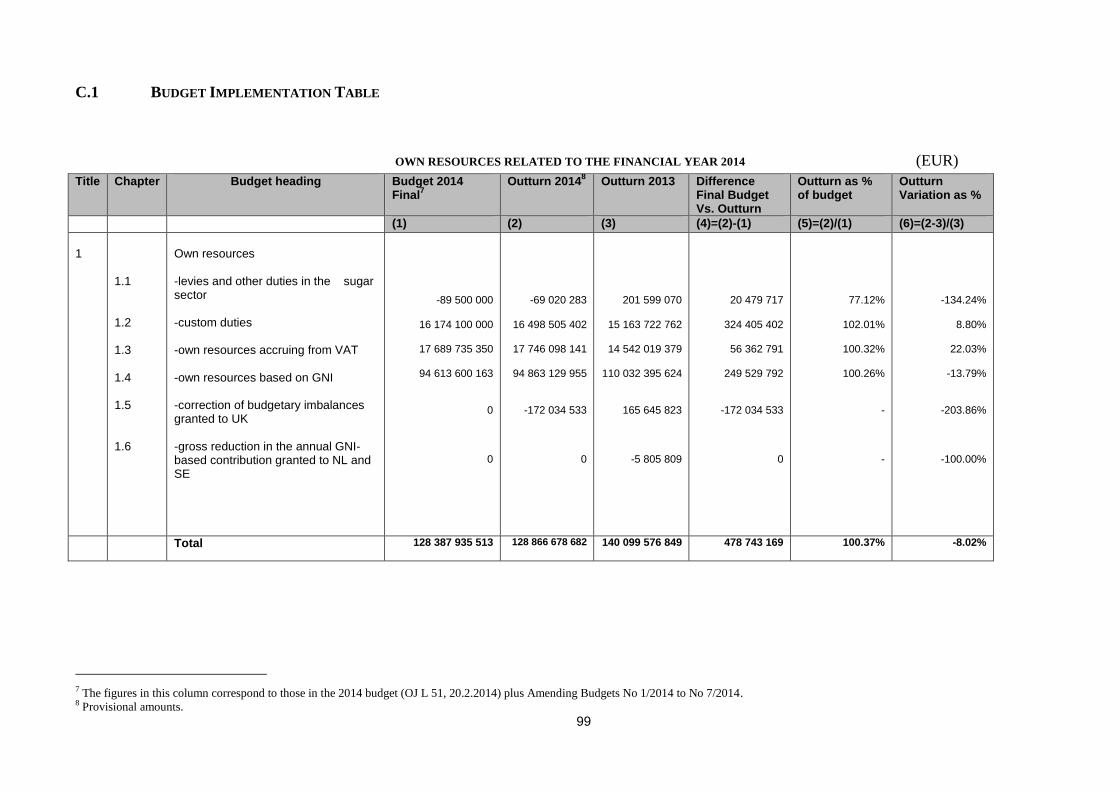
99
C.1 BUDGET IMPLEMENTATION TABLE
OWN RESOURCES RELATED TO THE FINANCIAL YEAR 2014 (EUR)
Title Chapter Budget heading Budget 2014 Final
7
Outturn 20148 Outturn 2013 Difference
Final Budget Vs. Outturn
Outturn as % of budget
Outturn Variation as %
(1) (2) (3) (4)=(2)-(1) (5)=(2)/(1) (6)=(2-3)/(3)
1
1.1 1.2 1.3 1.4 1.5 1.6
Own resources -levies and other duties in the sugar sector -custom duties -own resources accruing from VAT -own resources based on GNI -correction of budgetary imbalances granted to UK -gross reduction in the annual GNI-based contribution granted to NL and SE
-89 500 000
16 174 100 000
17 689 735 350
94 613 600 163
0
0
-69 020 283
16 498 505 402
17 746 098 141
94 863 129 955
-172 034 533
0
201 599 070
15 163 722 762
14 542 019 379
110 032 395 624
165 645 823
-5 805 809
20 479 717
324 405 402
56 362 791
249 529 792
-172 034 533
0
77.12%
102.01%
100.32%
100.26%
-
-
-134.24%
8.80%
22.03%
-13.79%
-203.86%
-100.00%
Total 128 387 935 513
128 866 678 682 140 099 576 849 478 743 169 100.37% -8.02%
7 The figures in this column correspond to those in the 2014 budget (OJ L 51, 20.2.2014) plus Amending Budgets No 1/2014 to No 7/2014. 8 Provisional amounts.
100
C.2 LEGAL BASIS
The basic rules of the system of the European Unions' own resources are laid down in Council
Decision 2007/436/EC, Euratom.
Own resources are budgeted in Title 1 of the General Statement of Revenue9 (see also the table
above) on the basis of a set of forecast data (see next section). The breakdown of the total amount of
own resources by type of own resource and by Member State results from the application of the
rules laid down in the Council Decision on own resources and its implementing regulations.
According to the Decision the total amount of own resources cannot exceed 1.23 % of the gross
national income (GNI) of the EU.
Own resources can be divided into the following categories:
traditional own resources (customs duties and sugar levies)
the VAT based resource
the GNI based resource ("the additional resource"). This resource ensures that total budgeted
revenue equals total budgeted expenditure, as required by the principle of equilibrium of the
EU budget. It is calculated as the difference between total expenditure and all other budgeted
revenue, including the other own resources.
Finally, a specific mechanism for correcting budgetary imbalances in favour of the United Kingdom
(the "UK correction") is also part of the own resources system.
C.3 THE BUDGETARY FORECAST OF OWN RESOURCES
The data necessary for establishing the budgetary forecast of own resources is discussed and
adopted at the annual forecasting meeting of the Advisory Committee on Own Resources
(ACOR)10
. Representatives of the Commission and of Member States participate in the meeting.
The discussions concern the forecasts for the VAT and GNI bases and traditional own resources
(customs duties and sugar levies). Furthermore, the Commission presents the results of its
calculations of the UK correction, which is also a necessary element for establishing the own
resources forecast. Both the forecasts for the draft budget 2015, as well as the updated forecasts for
the year 2014 were adopted at the same meeting.
The Commission’s forecasts of Member States' GNI and VAT bases are established on the basis of
the spring economic forecasts from the Directorate-General for Economic and Financial Affairs,
which have themselves been previously discussed with Member States' experts.
Sugar levies are forecasted by the Directorate-General for Agriculture in accordance with Article 51
of Council Regulation (EC) no 1234/2007. Customs duties are forecasted on the basis of the
weighted average rate of customs duties applied to import forecasts from the Directorate-General
for Economic and Financial Affairs' spring economic forecasts.
The forecasts mentioned above can be modified during the discussions with Member States at the
ACOR meeting.
9 The surplus of the previous exercise, which mainly results from the difference between own resources contributions and
implemented expenditure of the previous year, is included in Title 3. That title is, however, not examined here. 10 The ACOR is set up by Council Regulation No 1150/2000 of 22 May 2000 (Title VIII).
101
The updated data used for the 2014 own resources forecast were approved at the ACOR forecasts
meeting of 19 May 2014 and budgeted in the Amending Budget No 3/2014. The Amending Budget
no 5/2014 updated the budget forecast for traditional own resources a second time on the basis of
the trend in actual execution.
C.4 THE PROCESS OF ADOPTING THE BUDGET
According to the principle of equilibrium of the EU budget, the amounts of budget revenue and
payment appropriations must be in balance.
The amount of expenditure in the adopted budget, signed by the President of the European
Parliament on 20 November 2013, was fixed at EUR 135 505 million, which was EUR 561 million
lower than the EUR 136 066 million in the DB, presented by the Commission in June 2013. In order
to ensure equilibrium between budgeted revenue and expenditure this variation was compensated by
a decrease in the GNI-based resource, which is the "variable" resource that is used for balancing the
budget. The forecast amounts of all other own resources remained the same as in the DB.
Budgetary adjustments
The revenue and expenditure estimates in the initial budget are subject to modifications during the
budgetary year. Such modifications are budgeted in amending budgets. Adjustments in the Member
States GNI-based own resources payments ensure that budgeted revenue exactly matches budgeted
expenditure.
In 2014, altogether 7 amending budgets were adopted. Their impact on the revenue side of the 2014
budget is indicated in the next table.
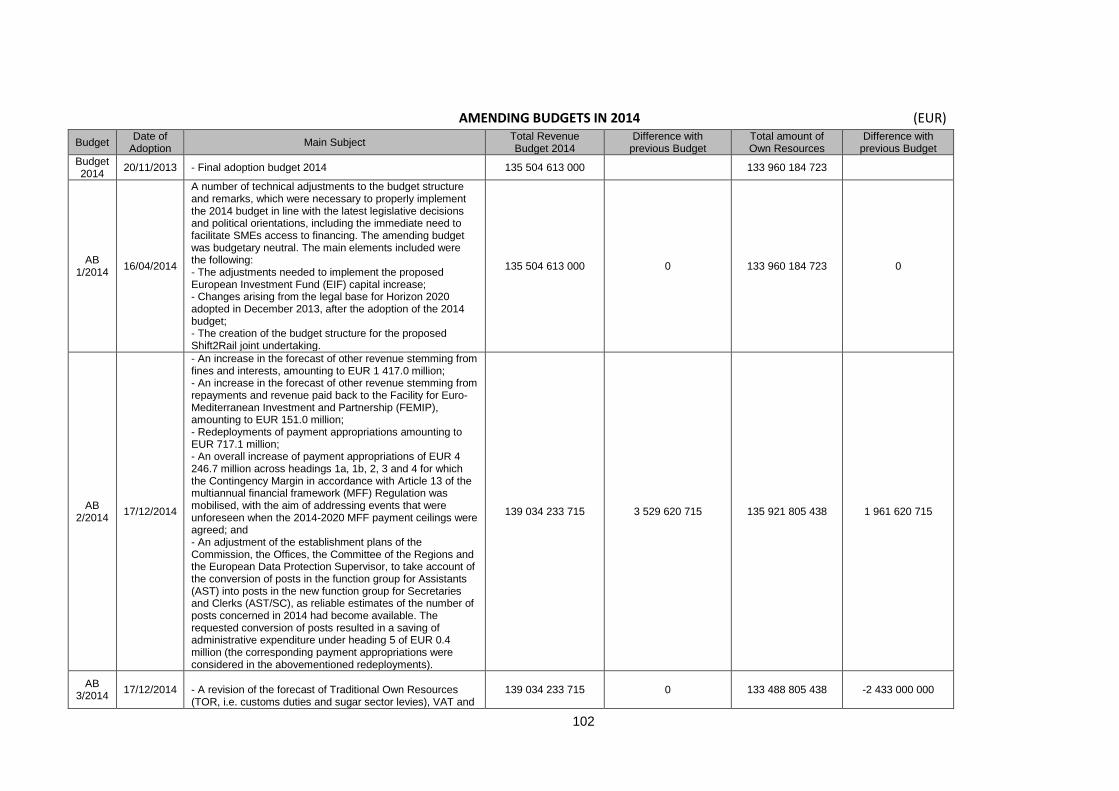
102
AMENDING BUDGETS IN 2014 (EUR)
Budget Date of
Adoption Main Subject
Total Revenue Budget 2014
Difference with previous Budget
Total amount of Own Resources
Difference with previous Budget
Budget 2014
20/11/2013 - Final adoption budget 2014 135 504 613 000 133 960 184 723
AB 1/2014
16/04/2014
A number of technical adjustments to the budget structure and remarks, which were necessary to properly implement the 2014 budget in line with the latest legislative decisions and political orientations, including the immediate need to facilitate SMEs access to financing. The amending budget was budgetary neutral. The main elements included were the following: - The adjustments needed to implement the proposed European Investment Fund (EIF) capital increase; - Changes arising from the legal base for Horizon 2020 adopted in December 2013, after the adoption of the 2014 budget; - The creation of the budget structure for the proposed Shift2Rail joint undertaking.
135 504 613 000 0 133 960 184 723 0
AB 2/2014
17/12/2014
- An increase in the forecast of other revenue stemming from fines and interests, amounting to EUR 1 417.0 million; - An increase in the forecast of other revenue stemming from repayments and revenue paid back to the Facility for Euro-Mediterranean Investment and Partnership (FEMIP), amounting to EUR 151.0 million; - Redeployments of payment appropriations amounting to EUR 717.1 million; - An overall increase of payment appropriations of EUR 4 246.7 million across headings 1a, 1b, 2, 3 and 4 for which the Contingency Margin in accordance with Article 13 of the multiannual financial framework (MFF) Regulation was mobilised, with the aim of addressing events that were unforeseen when the 2014-2020 MFF payment ceilings were agreed; and - An adjustment of the establishment plans of the Commission, the Offices, the Committee of the Regions and the European Data Protection Supervisor, to take account of the conversion of posts in the function group for Assistants (AST) into posts in the new function group for Secretaries and Clerks (AST/SC), as reliable estimates of the number of posts concerned in 2014 had become available. The requested conversion of posts resulted in a saving of administrative expenditure under heading 5 of EUR 0.4 million (the corresponding payment appropriations were considered in the abovementioned redeployments).
139 034 233 715 3 529 620 715 135 921 805 438 1 961 620 715
AB 3/2014
17/12/2014 - A revision of the forecast of Traditional Own Resources (TOR, i.e. customs duties and sugar sector levies), VAT and
139 034 233 715 0 133 488 805 438 -2 433 000 000
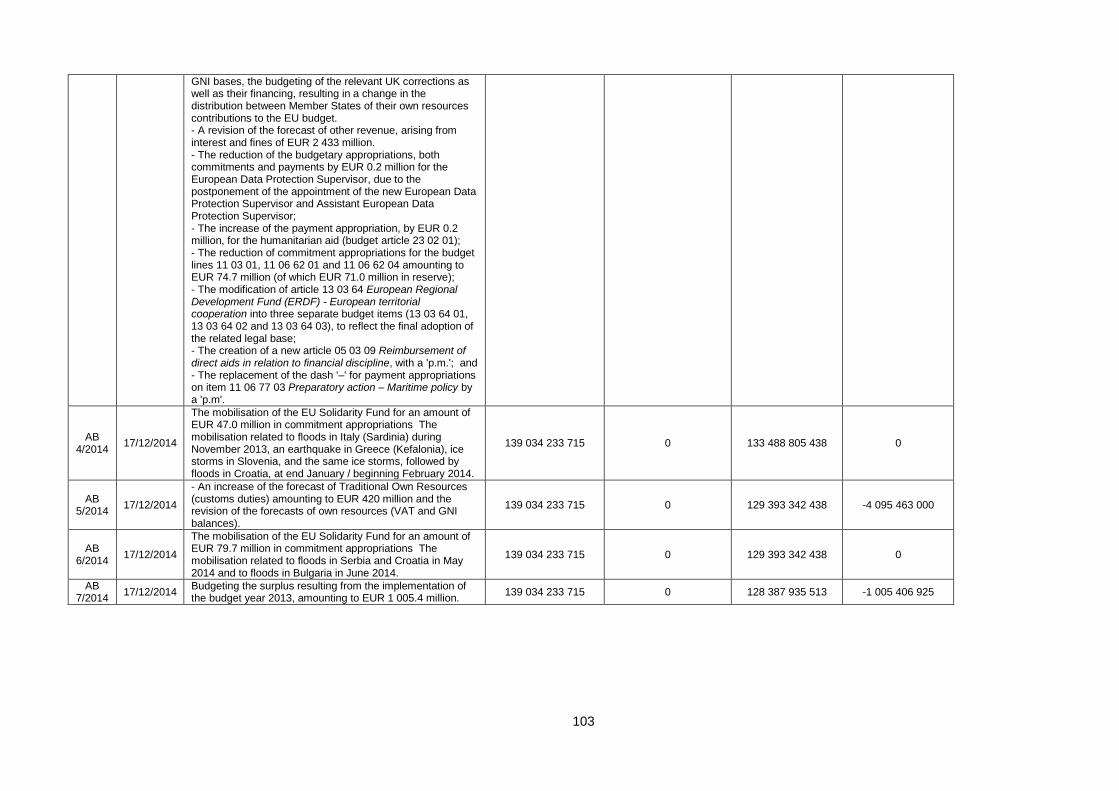
103
GNI bases, the budgeting of the relevant UK corrections as well as their financing, resulting in a change in the distribution between Member States of their own resources contributions to the EU budget. - A revision of the forecast of other revenue, arising from interest and fines of EUR 2 433 million. - The reduction of the budgetary appropriations, both commitments and payments by EUR 0.2 million for the European Data Protection Supervisor, due to the postponement of the appointment of the new European Data Protection Supervisor and Assistant European Data Protection Supervisor; - The increase of the payment appropriation, by EUR 0.2 million, for the humanitarian aid (budget article 23 02 01); - The reduction of commitment appropriations for the budget lines 11 03 01, 11 06 62 01 and 11 06 62 04 amounting to EUR 74.7 million (of which EUR 71.0 million in reserve); - The modification of article 13 03 64 European Regional Development Fund (ERDF) - European territorial cooperation into three separate budget items (13 03 64 01, 13 03 64 02 and 13 03 64 03), to reflect the final adoption of the related legal base; - The creation of a new article 05 03 09 Reimbursement of direct aids in relation to financial discipline, with a 'p.m.'; and - The replacement of the dash '–' for payment appropriations on item 11 06 77 03 Preparatory action – Maritime policy by a 'p.m'.
AB 4/2014
17/12/2014
The mobilisation of the EU Solidarity Fund for an amount of EUR 47.0 million in commitment appropriations The mobilisation related to floods in Italy (Sardinia) during November 2013, an earthquake in Greece (Kefalonia), ice storms in Slovenia, and the same ice storms, followed by floods in Croatia, at end January / beginning February 2014.
139 034 233 715 0 133 488 805 438 0
AB 5/2014
17/12/2014
- An increase of the forecast of Traditional Own Resources (customs duties) amounting to EUR 420 million and the revision of the forecasts of own resources (VAT and GNI balances).
139 034 233 715 0 129 393 342 438 -4 095 463 000
AB 6/2014
17/12/2014
The mobilisation of the EU Solidarity Fund for an amount of EUR 79.7 million in commitment appropriations The mobilisation related to floods in Serbia and Croatia in May 2014 and to floods in Bulgaria in June 2014.
139 034 233 715 0 129 393 342 438 0
AB 7/2014
17/12/2014 Budgeting the surplus resulting from the implementation of the budget year 2013, amounting to EUR 1 005.4 million.
139 034 233 715 0 128 387 935 513 -1 005 406 925
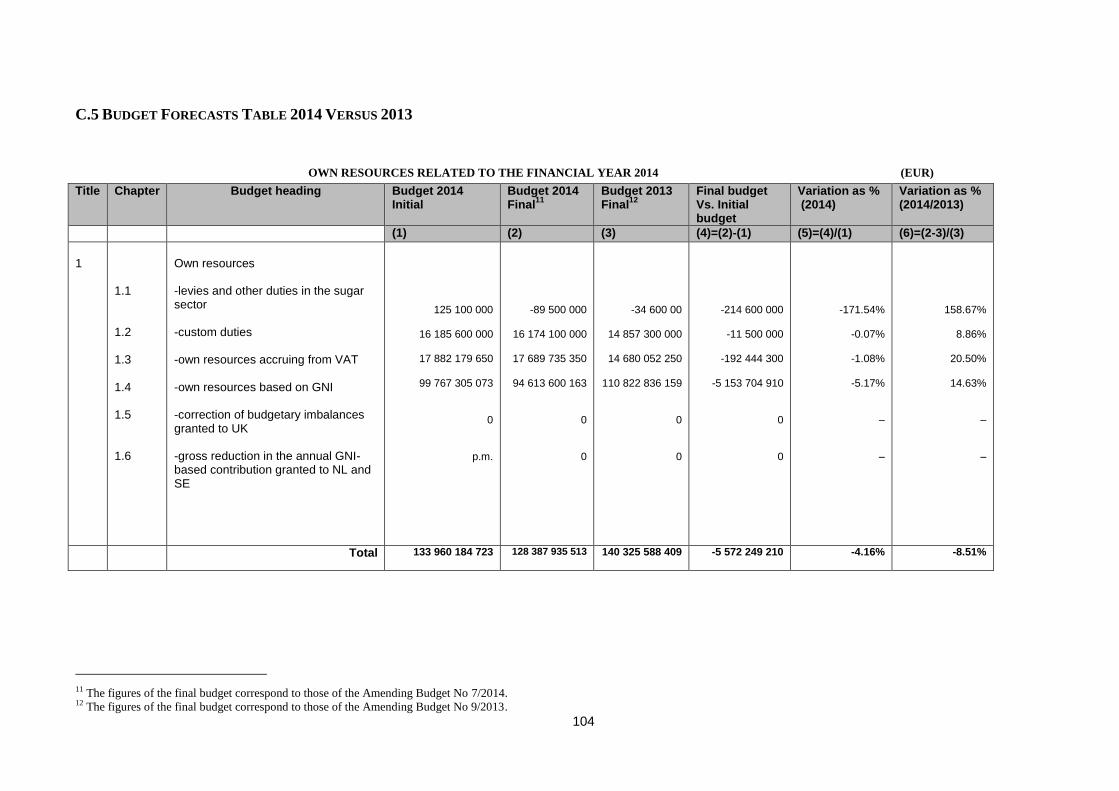
104
C.5 BUDGET FORECASTS TABLE 2014 VERSUS 2013
OWN RESOURCES RELATED TO THE FINANCIAL YEAR 2014 (EUR)
Title Chapter Budget heading Budget 2014 Initial
Budget 2014 Final
11
Budget 2013 Final
12
Final budget Vs. Initial budget
Variation as % (2014)
Variation as % (2014/2013)
(1) (2) (3) (4)=(2)-(1) (5)=(4)/(1) (6)=(2-3)/(3)
1
1.1 1.2 1.3 1.4 1.5 1.6
Own resources -levies and other duties in the sugar sector -custom duties -own resources accruing from VAT -own resources based on GNI -correction of budgetary imbalances granted to UK -gross reduction in the annual GNI-based contribution granted to NL and SE
125 100 000
16 185 600 000
17 882 179 650
99 767 305 073
0
p.m.
-89 500 000
16 174 100 000
17 689 735 350
94 613 600 163
0
0
-34 600 00
14 857 300 000
14 680 052 250
110 822 836 159
0
0
-214 600 000
-11 500 000
-192 444 300
-5 153 704 910
0
0
-171.54%
-0.07%
-1.08%
-5.17%
–
–
158.67%
8.86%
20.50%
14.63%
–
–
Total 133 960 184 723
128 387 935 513 140 325 588 409 -5 572 249 210 -4.16% -8.51%
11 The figures of the final budget correspond to those of the Amending Budget No 7/2014. 12 The figures of the final budget correspond to those of the Amending Budget No 9/2013.
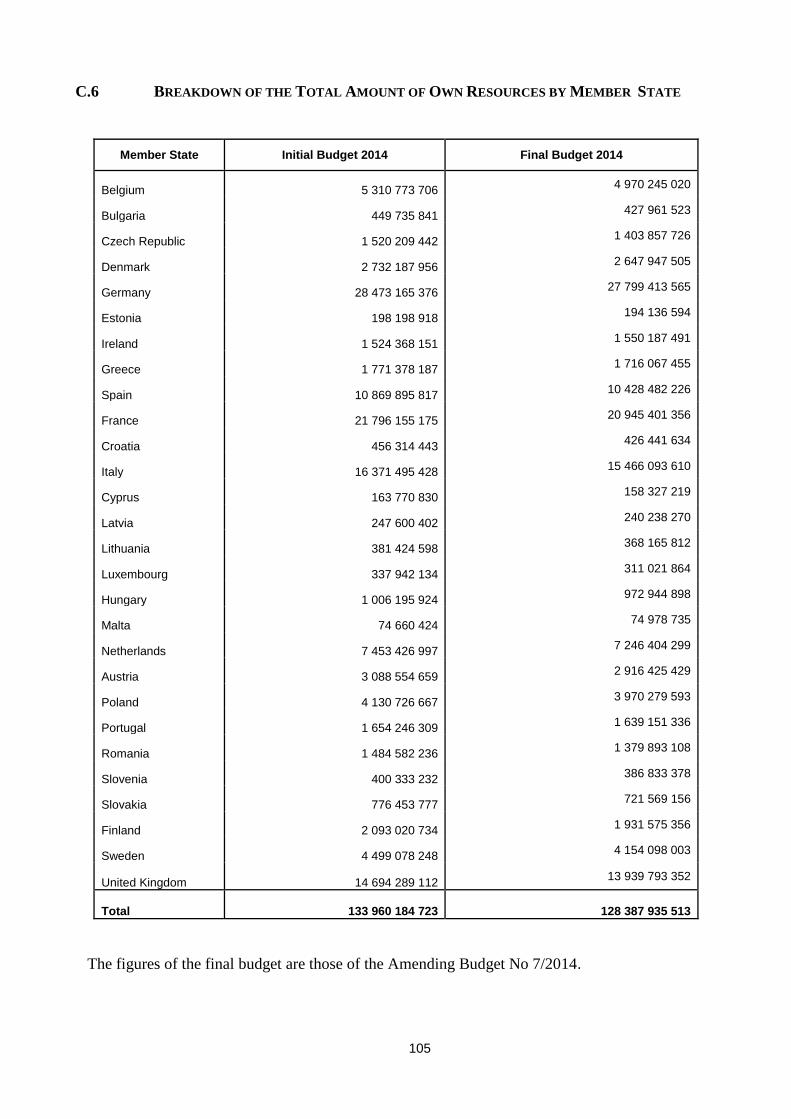
105
C.6 BREAKDOWN OF THE TOTAL AMOUNT OF OWN RESOURCES BY MEMBER STATE
Member State Initial Budget 2014 Final Budget 2014
Belgium 5 310 773 706 4 970 245 020
Bulgaria 449 735 841 427 961 523
Czech Republic 1 520 209 442 1 403 857 726
Denmark 2 732 187 956 2 647 947 505
Germany 28 473 165 376 27 799 413 565
Estonia 198 198 918 194 136 594
Ireland 1 524 368 151 1 550 187 491
Greece 1 771 378 187 1 716 067 455
Spain 10 869 895 817 10 428 482 226
France 21 796 155 175 20 945 401 356
Croatia 456 314 443 426 441 634
Italy 16 371 495 428 15 466 093 610
Cyprus 163 770 830 158 327 219
Latvia 247 600 402 240 238 270
Lithuania 381 424 598 368 165 812
Luxembourg 337 942 134 311 021 864
Hungary 1 006 195 924 972 944 898
Malta 74 660 424 74 978 735
Netherlands 7 453 426 997 7 246 404 299
Austria 3 088 554 659 2 916 425 429
Poland 4 130 726 667 3 970 279 593
Portugal 1 654 246 309 1 639 151 336
Romania 1 484 582 236 1 379 893 108
Slovenia 400 333 232 386 833 378
Slovakia 776 453 777 721 569 156
Finland 2 093 020 734 1 931 575 356
Sweden 4 499 078 248 4 154 098 003
United Kingdom 14 694 289 112 13 939 793 352
Total 133 960 184 723
128 387 935 513
The figures of the final budget are those of the Amending Budget No 7/2014.
106
C.7 IMPLEMENTATION OF OWN RESOURCES
The custom duties collected amounted to 102.01% of the amounts forecasted. The budgetary
estimates were modified by the Amending Budgets No 3/2014 and 5/2014 (they were first
decreased by EUR 431.5 million and later increased by EUR 420 million). These adjustments were
based respectively on the new macroeconomic forecasts of spring 2014 and on the evolution of the
customs duties collection over the first 9 months of the year.
The Member States' VAT and GNI payments corresponded closely to the updated budgetary
estimates. The difference are mainly explained by the differences in the euro rates used for
budgetary purposes (see Article 10 (3) of Regulation No 1150/2000) and the rates in force at the
time when the Member States (not part of the EMU) actually made their payments. The changes in
the exchange rates during 2014 had a positive impact of EUR 56.4 million and EUR 249.5 million
for VAT and GNI respectively.
The "UK correction" is financed by the other Member States, so there should be no net effect on the
budget. However, a negative amount of EUR 172 million was registered. This was caused by
differences in the exchange rates similar to those for the VAT/GNI resources.

ANNEXES
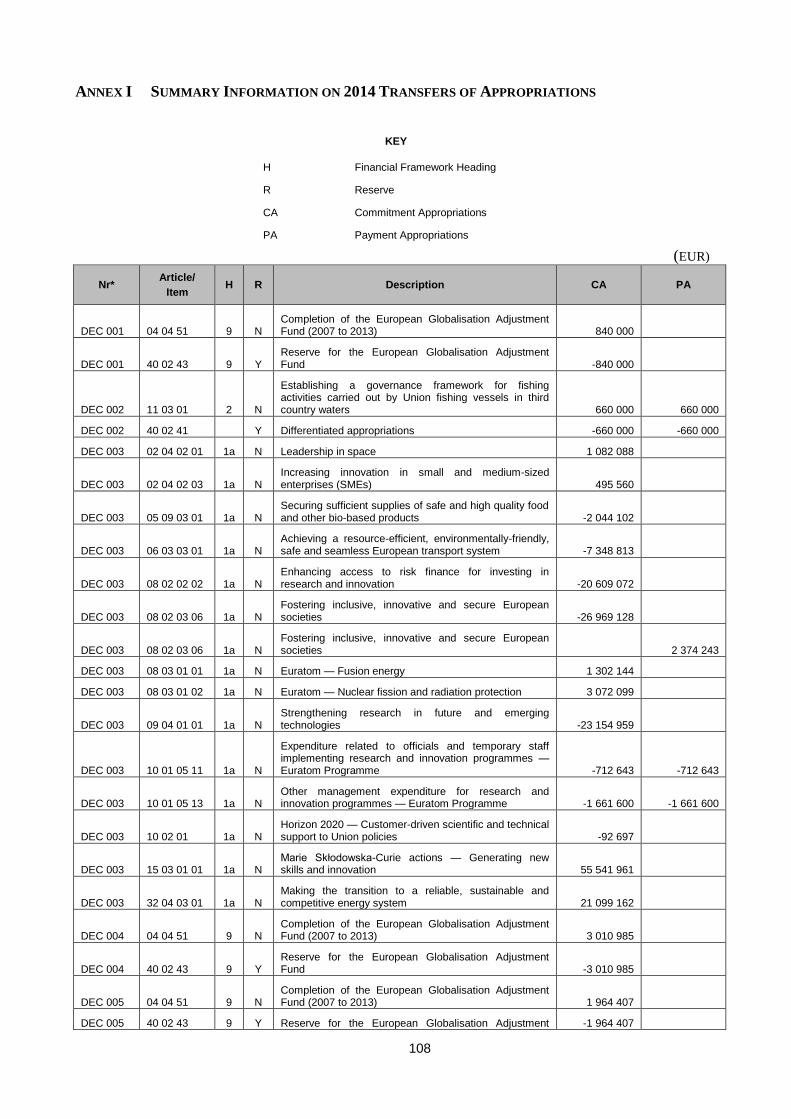
108
ANNEX I SUMMARY INFORMATION ON 2014 TRANSFERS OF APPROPRIATIONS
KEY
H Financial Framework Heading
R Reserve
CA Commitment Appropriations
PA Payment Appropriations
(EUR)
Nr* Article/
Item H R Description CA PA
DEC 001 04 04 51 9 N Completion of the European Globalisation Adjustment Fund (2007 to 2013) 840 000
DEC 001 40 02 43 9 Y Reserve for the European Globalisation Adjustment Fund -840 000
DEC 002 11 03 01 2 N
Establishing a governance framework for fishing activities carried out by Union fishing vessels in third country waters 660 000 660 000
DEC 002 40 02 41 Y Differentiated appropriations -660 000 -660 000
DEC 003 02 04 02 01 1a N Leadership in space 1 082 088
DEC 003 02 04 02 03 1a N Increasing innovation in small and medium-sized enterprises (SMEs) 495 560
DEC 003 05 09 03 01 1a N Securing sufficient supplies of safe and high quality food and other bio-based products -2 044 102
DEC 003 06 03 03 01 1a N Achieving a resource-efficient, environmentally-friendly, safe and seamless European transport system -7 348 813
DEC 003 08 02 02 02 1a N Enhancing access to risk finance for investing in research and innovation -20 609 072
DEC 003 08 02 03 06 1a N Fostering inclusive, innovative and secure European societies -26 969 128
DEC 003 08 02 03 06 1a N Fostering inclusive, innovative and secure European societies 2 374 243
DEC 003 08 03 01 01 1a N Euratom — Fusion energy 1 302 144
DEC 003 08 03 01 02 1a N Euratom — Nuclear fission and radiation protection 3 072 099
DEC 003 09 04 01 01 1a N Strengthening research in future and emerging technologies -23 154 959
DEC 003 10 01 05 11 1a N
Expenditure related to officials and temporary staff implementing research and innovation programmes — Euratom Programme -712 643 -712 643
DEC 003 10 01 05 13 1a N Other management expenditure for research and innovation programmes — Euratom Programme -1 661 600 -1 661 600
DEC 003 10 02 01 1a N Horizon 2020 — Customer-driven scientific and technical support to Union policies -92 697
DEC 003 15 03 01 01 1a N Marie Skłodowska-Curie actions — Generating new skills and innovation 55 541 961
DEC 003 32 04 03 01 1a N Making the transition to a reliable, sustainable and competitive energy system 21 099 162
DEC 004 04 04 51 9 N Completion of the European Globalisation Adjustment Fund (2007 to 2013) 3 010 985
DEC 004 40 02 43 9 Y Reserve for the European Globalisation Adjustment Fund -3 010 985
DEC 005 04 04 51 9 N Completion of the European Globalisation Adjustment Fund (2007 to 2013) 1 964 407
DEC 005 40 02 43 9 Y Reserve for the European Globalisation Adjustment -1 964 407
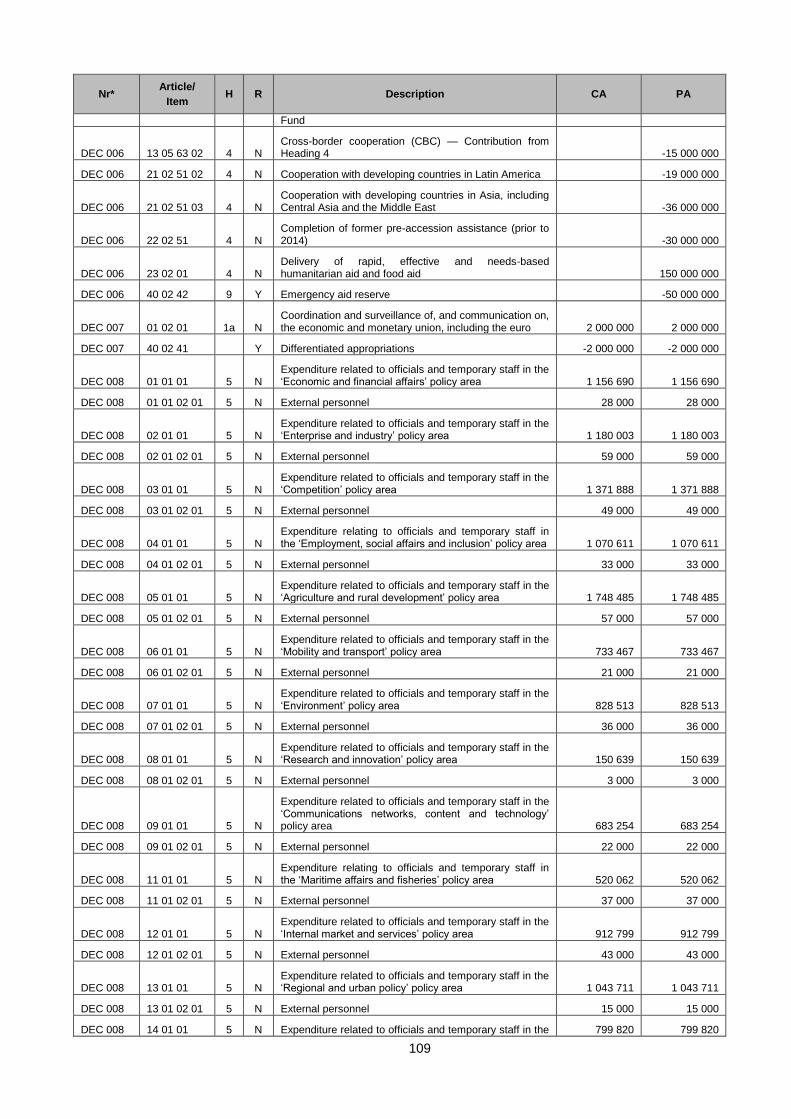
109
Nr* Article/
Item H R Description CA PA
Fund
DEC 006 13 05 63 02 4 N Cross-border cooperation (CBC) — Contribution from Heading 4 -15 000 000
DEC 006 21 02 51 02 4 N Cooperation with developing countries in Latin America -19 000 000
DEC 006 21 02 51 03 4 N Cooperation with developing countries in Asia, including Central Asia and the Middle East -36 000 000
DEC 006 22 02 51 4 N Completion of former pre-accession assistance (prior to 2014) -30 000 000
DEC 006 23 02 01 4 N Delivery of rapid, effective and needs-based humanitarian aid and food aid 150 000 000
DEC 006 40 02 42 9 Y Emergency aid reserve -50 000 000
DEC 007 01 02 01 1a N Coordination and surveillance of, and communication on, the economic and monetary union, including the euro 2 000 000 2 000 000
DEC 007 40 02 41 Y Differentiated appropriations -2 000 000 -2 000 000
DEC 008 01 01 01 5 N Expenditure related to officials and temporary staff in the ‘Economic and financial affairs’ policy area 1 156 690 1 156 690
DEC 008 01 01 02 01 5 N External personnel 28 000 28 000
DEC 008 02 01 01 5 N Expenditure related to officials and temporary staff in the ‘Enterprise and industry’ policy area 1 180 003 1 180 003
DEC 008 02 01 02 01 5 N External personnel 59 000 59 000
DEC 008 03 01 01 5 N Expenditure related to officials and temporary staff in the ‘Competition’ policy area 1 371 888 1 371 888
DEC 008 03 01 02 01 5 N External personnel 49 000 49 000
DEC 008 04 01 01 5 N Expenditure relating to officials and temporary staff in the ‘Employment, social affairs and inclusion’ policy area 1 070 611 1 070 611
DEC 008 04 01 02 01 5 N External personnel 33 000 33 000
DEC 008 05 01 01 5 N Expenditure related to officials and temporary staff in the ‘Agriculture and rural development’ policy area 1 748 485 1 748 485
DEC 008 05 01 02 01 5 N External personnel 57 000 57 000
DEC 008 06 01 01 5 N Expenditure related to officials and temporary staff in the ‘Mobility and transport’ policy area 733 467 733 467
DEC 008 06 01 02 01 5 N External personnel 21 000 21 000
DEC 008 07 01 01 5 N Expenditure related to officials and temporary staff in the ‘Environment’ policy area 828 513 828 513
DEC 008 07 01 02 01 5 N External personnel 36 000 36 000
DEC 008 08 01 01 5 N Expenditure related to officials and temporary staff in the ‘Research and innovation’ policy area 150 639 150 639
DEC 008 08 01 02 01 5 N External personnel 3 000 3 000
DEC 008 09 01 01 5 N
Expenditure related to officials and temporary staff in the ‘Communications networks, content and technology’ policy area 683 254 683 254
DEC 008 09 01 02 01 5 N External personnel 22 000 22 000
DEC 008 11 01 01 5 N Expenditure relating to officials and temporary staff in the ‘Maritime affairs and fisheries’ policy area 520 062 520 062
DEC 008 11 01 02 01 5 N External personnel 37 000 37 000
DEC 008 12 01 01 5 N Expenditure related to officials and temporary staff in the ‘Internal market and services’ policy area 912 799 912 799
DEC 008 12 01 02 01 5 N External personnel 43 000 43 000
DEC 008 13 01 01 5 N Expenditure related to officials and temporary staff in the ‘Regional and urban policy’ policy area 1 043 711 1 043 711
DEC 008 13 01 02 01 5 N External personnel 15 000 15 000
DEC 008 14 01 01 5 N Expenditure related to officials and temporary staff in the 799 820 799 820
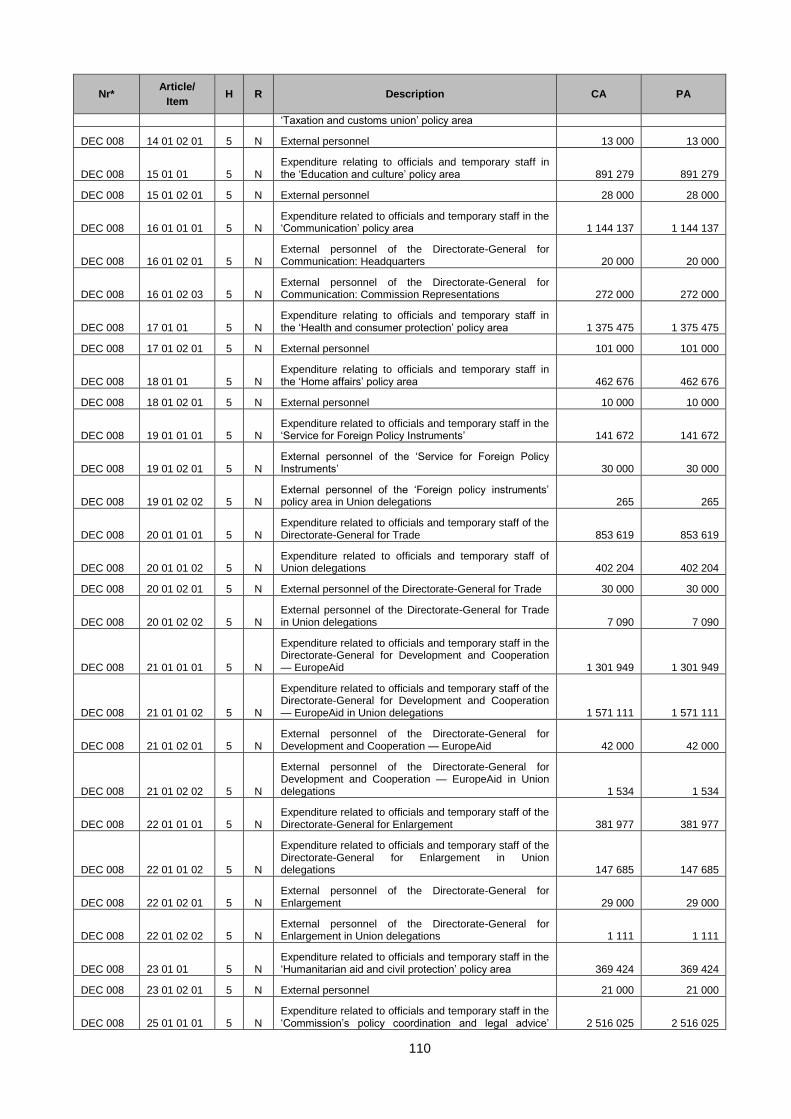
110
Nr* Article/
Item H R Description CA PA
‘Taxation and customs union’ policy area
DEC 008 14 01 02 01 5 N External personnel 13 000 13 000
DEC 008 15 01 01 5 N Expenditure relating to officials and temporary staff in the ‘Education and culture’ policy area 891 279 891 279
DEC 008 15 01 02 01 5 N External personnel 28 000 28 000
DEC 008 16 01 01 01 5 N Expenditure related to officials and temporary staff in the ‘Communication’ policy area 1 144 137 1 144 137
DEC 008 16 01 02 01 5 N External personnel of the Directorate-General for Communication: Headquarters 20 000 20 000
DEC 008 16 01 02 03 5 N External personnel of the Directorate-General for Communication: Commission Representations 272 000 272 000
DEC 008 17 01 01 5 N Expenditure relating to officials and temporary staff in the ‘Health and consumer protection’ policy area 1 375 475 1 375 475
DEC 008 17 01 02 01 5 N External personnel 101 000 101 000
DEC 008 18 01 01 5 N Expenditure relating to officials and temporary staff in the ‘Home affairs’ policy area 462 676 462 676
DEC 008 18 01 02 01 5 N External personnel 10 000 10 000
DEC 008 19 01 01 01 5 N Expenditure related to officials and temporary staff in the ‘Service for Foreign Policy Instruments’ 141 672 141 672
DEC 008 19 01 02 01 5 N External personnel of the ‘Service for Foreign Policy Instruments’ 30 000 30 000
DEC 008 19 01 02 02 5 N External personnel of the ‘Foreign policy instruments’ policy area in Union delegations 265 265
DEC 008 20 01 01 01 5 N Expenditure related to officials and temporary staff of the Directorate-General for Trade 853 619 853 619
DEC 008 20 01 01 02 5 N Expenditure related to officials and temporary staff of Union delegations 402 204 402 204
DEC 008 20 01 02 01 5 N External personnel of the Directorate-General for Trade 30 000 30 000
DEC 008 20 01 02 02 5 N External personnel of the Directorate-General for Trade in Union delegations 7 090 7 090
DEC 008 21 01 01 01 5 N
Expenditure related to officials and temporary staff in the Directorate-General for Development and Cooperation — EuropeAid 1 301 949 1 301 949
DEC 008 21 01 01 02 5 N
Expenditure related to officials and temporary staff of the Directorate-General for Development and Cooperation — EuropeAid in Union delegations 1 571 111 1 571 111
DEC 008 21 01 02 01 5 N External personnel of the Directorate-General for Development and Cooperation — EuropeAid 42 000 42 000
DEC 008 21 01 02 02 5 N
External personnel of the Directorate-General for Development and Cooperation — EuropeAid in Union delegations 1 534 1 534
DEC 008 22 01 01 01 5 N Expenditure related to officials and temporary staff of the Directorate-General for Enlargement 381 977 381 977
DEC 008 22 01 01 02 5 N
Expenditure related to officials and temporary staff of the Directorate-General for Enlargement in Union delegations 147 685 147 685
DEC 008 22 01 02 01 5 N External personnel of the Directorate-General for Enlargement 29 000 29 000
DEC 008 22 01 02 02 5 N External personnel of the Directorate-General for Enlargement in Union delegations 1 111 1 111
DEC 008 23 01 01 5 N Expenditure related to officials and temporary staff in the ‘Humanitarian aid and civil protection’ policy area 369 424 369 424
DEC 008 23 01 02 01 5 N External personnel 21 000 21 000
DEC 008 25 01 01 01 5 N Expenditure related to officials and temporary staff in the ‘Commission’s policy coordination and legal advice’ 2 516 025 2 516 025
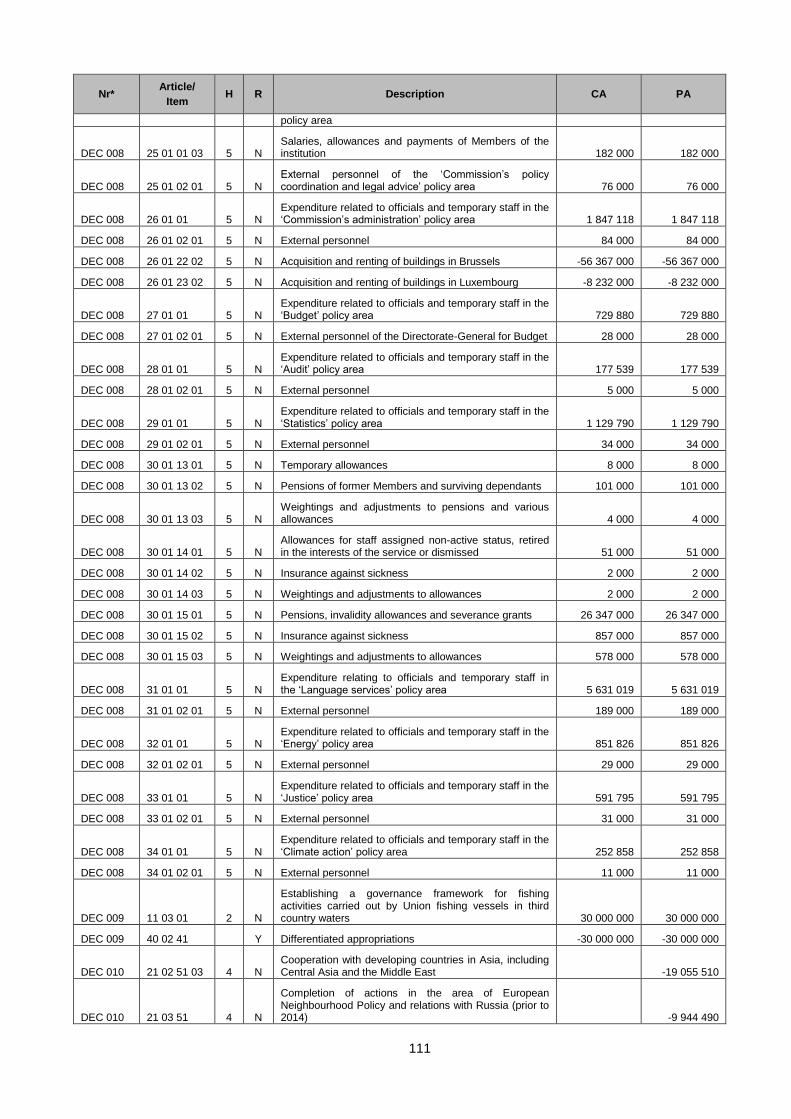
111
Nr* Article/
Item H R Description CA PA
policy area
DEC 008 25 01 01 03 5 N Salaries, allowances and payments of Members of the institution 182 000 182 000
DEC 008 25 01 02 01 5 N External personnel of the ‘Commission’s policy coordination and legal advice’ policy area 76 000 76 000
DEC 008 26 01 01 5 N Expenditure related to officials and temporary staff in the ‘Commission’s administration’ policy area 1 847 118 1 847 118
DEC 008 26 01 02 01 5 N External personnel 84 000 84 000
DEC 008 26 01 22 02 5 N Acquisition and renting of buildings in Brussels -56 367 000 -56 367 000
DEC 008 26 01 23 02 5 N Acquisition and renting of buildings in Luxembourg -8 232 000 -8 232 000
DEC 008 27 01 01 5 N Expenditure related to officials and temporary staff in the ‘Budget’ policy area 729 880 729 880
DEC 008 27 01 02 01 5 N External personnel of the Directorate-General for Budget 28 000 28 000
DEC 008 28 01 01 5 N Expenditure related to officials and temporary staff in the ‘Audit’ policy area 177 539 177 539
DEC 008 28 01 02 01 5 N External personnel 5 000 5 000
DEC 008 29 01 01 5 N Expenditure related to officials and temporary staff in the ‘Statistics’ policy area 1 129 790 1 129 790
DEC 008 29 01 02 01 5 N External personnel 34 000 34 000
DEC 008 30 01 13 01 5 N Temporary allowances 8 000 8 000
DEC 008 30 01 13 02 5 N Pensions of former Members and surviving dependants 101 000 101 000
DEC 008 30 01 13 03 5 N Weightings and adjustments to pensions and various allowances 4 000 4 000
DEC 008 30 01 14 01 5 N Allowances for staff assigned non-active status, retired in the interests of the service or dismissed 51 000 51 000
DEC 008 30 01 14 02 5 N Insurance against sickness 2 000 2 000
DEC 008 30 01 14 03 5 N Weightings and adjustments to allowances 2 000 2 000
DEC 008 30 01 15 01 5 N Pensions, invalidity allowances and severance grants 26 347 000 26 347 000
DEC 008 30 01 15 02 5 N Insurance against sickness 857 000 857 000
DEC 008 30 01 15 03 5 N Weightings and adjustments to allowances 578 000 578 000
DEC 008 31 01 01 5 N Expenditure relating to officials and temporary staff in the ‘Language services’ policy area 5 631 019 5 631 019
DEC 008 31 01 02 01 5 N External personnel 189 000 189 000
DEC 008 32 01 01 5 N Expenditure related to officials and temporary staff in the ‘Energy’ policy area 851 826 851 826
DEC 008 32 01 02 01 5 N External personnel 29 000 29 000
DEC 008 33 01 01 5 N Expenditure related to officials and temporary staff in the ‘Justice’ policy area 591 795 591 795
DEC 008 33 01 02 01 5 N External personnel 31 000 31 000
DEC 008 34 01 01 5 N Expenditure related to officials and temporary staff in the ‘Climate action’ policy area 252 858 252 858
DEC 008 34 01 02 01 5 N External personnel 11 000 11 000
DEC 009 11 03 01 2 N
Establishing a governance framework for fishing activities carried out by Union fishing vessels in third country waters 30 000 000 30 000 000
DEC 009 40 02 41 Y Differentiated appropriations -30 000 000 -30 000 000
DEC 010 21 02 51 03 4 N Cooperation with developing countries in Asia, including Central Asia and the Middle East -19 055 510
DEC 010 21 03 51 4 N
Completion of actions in the area of European Neighbourhood Policy and relations with Russia (prior to 2014) -9 944 490
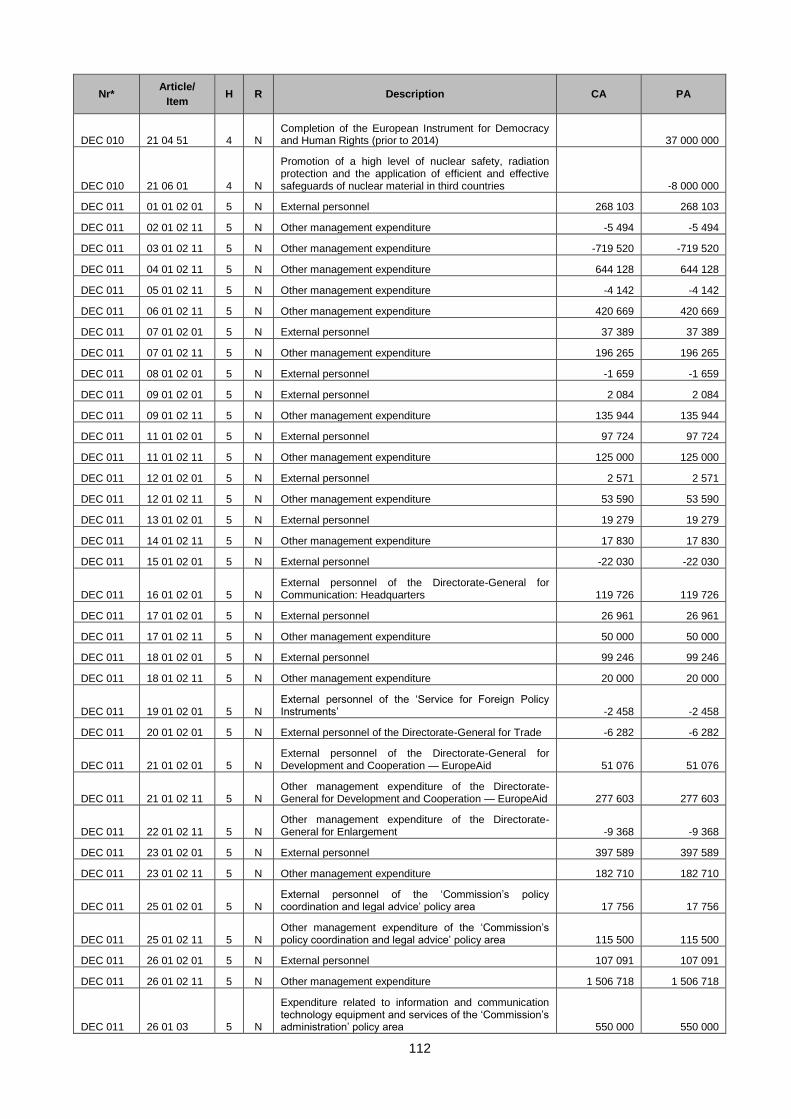
112
Nr* Article/
Item H R Description CA PA
DEC 010 21 04 51 4 N Completion of the European Instrument for Democracy and Human Rights (prior to 2014) 37 000 000
DEC 010 21 06 01 4 N
Promotion of a high level of nuclear safety, radiation protection and the application of efficient and effective safeguards of nuclear material in third countries -8 000 000
DEC 011 01 01 02 01 5 N External personnel 268 103 268 103
DEC 011 02 01 02 11 5 N Other management expenditure -5 494 -5 494
DEC 011 03 01 02 11 5 N Other management expenditure -719 520 -719 520
DEC 011 04 01 02 11 5 N Other management expenditure 644 128 644 128
DEC 011 05 01 02 11 5 N Other management expenditure -4 142 -4 142
DEC 011 06 01 02 11 5 N Other management expenditure 420 669 420 669
DEC 011 07 01 02 01 5 N External personnel 37 389 37 389
DEC 011 07 01 02 11 5 N Other management expenditure 196 265 196 265
DEC 011 08 01 02 01 5 N External personnel -1 659 -1 659
DEC 011 09 01 02 01 5 N External personnel 2 084 2 084
DEC 011 09 01 02 11 5 N Other management expenditure 135 944 135 944
DEC 011 11 01 02 01 5 N External personnel 97 724 97 724
DEC 011 11 01 02 11 5 N Other management expenditure 125 000 125 000
DEC 011 12 01 02 01 5 N External personnel 2 571 2 571
DEC 011 12 01 02 11 5 N Other management expenditure 53 590 53 590
DEC 011 13 01 02 01 5 N External personnel 19 279 19 279
DEC 011 14 01 02 11 5 N Other management expenditure 17 830 17 830
DEC 011 15 01 02 01 5 N External personnel -22 030 -22 030
DEC 011 16 01 02 01 5 N External personnel of the Directorate-General for Communication: Headquarters 119 726 119 726
DEC 011 17 01 02 01 5 N External personnel 26 961 26 961
DEC 011 17 01 02 11 5 N Other management expenditure 50 000 50 000
DEC 011 18 01 02 01 5 N External personnel 99 246 99 246
DEC 011 18 01 02 11 5 N Other management expenditure 20 000 20 000
DEC 011 19 01 02 01 5 N External personnel of the ‘Service for Foreign Policy Instruments’ -2 458 -2 458
DEC 011 20 01 02 01 5 N External personnel of the Directorate-General for Trade -6 282 -6 282
DEC 011 21 01 02 01 5 N External personnel of the Directorate-General for Development and Cooperation — EuropeAid 51 076 51 076
DEC 011 21 01 02 11 5 N Other management expenditure of the Directorate-General for Development and Cooperation — EuropeAid 277 603 277 603
DEC 011 22 01 02 11 5 N Other management expenditure of the Directorate-General for Enlargement -9 368 -9 368
DEC 011 23 01 02 01 5 N External personnel 397 589 397 589
DEC 011 23 01 02 11 5 N Other management expenditure 182 710 182 710
DEC 011 25 01 02 01 5 N External personnel of the ‘Commission’s policy coordination and legal advice’ policy area 17 756 17 756
DEC 011 25 01 02 11 5 N Other management expenditure of the ‘Commission’s policy coordination and legal advice’ policy area 115 500 115 500
DEC 011 26 01 02 01 5 N External personnel 107 091 107 091
DEC 011 26 01 02 11 5 N Other management expenditure 1 506 718 1 506 718
DEC 011 26 01 03 5 N
Expenditure related to information and communication technology equipment and services of the ‘Commission’s administration’ policy area 550 000 550 000
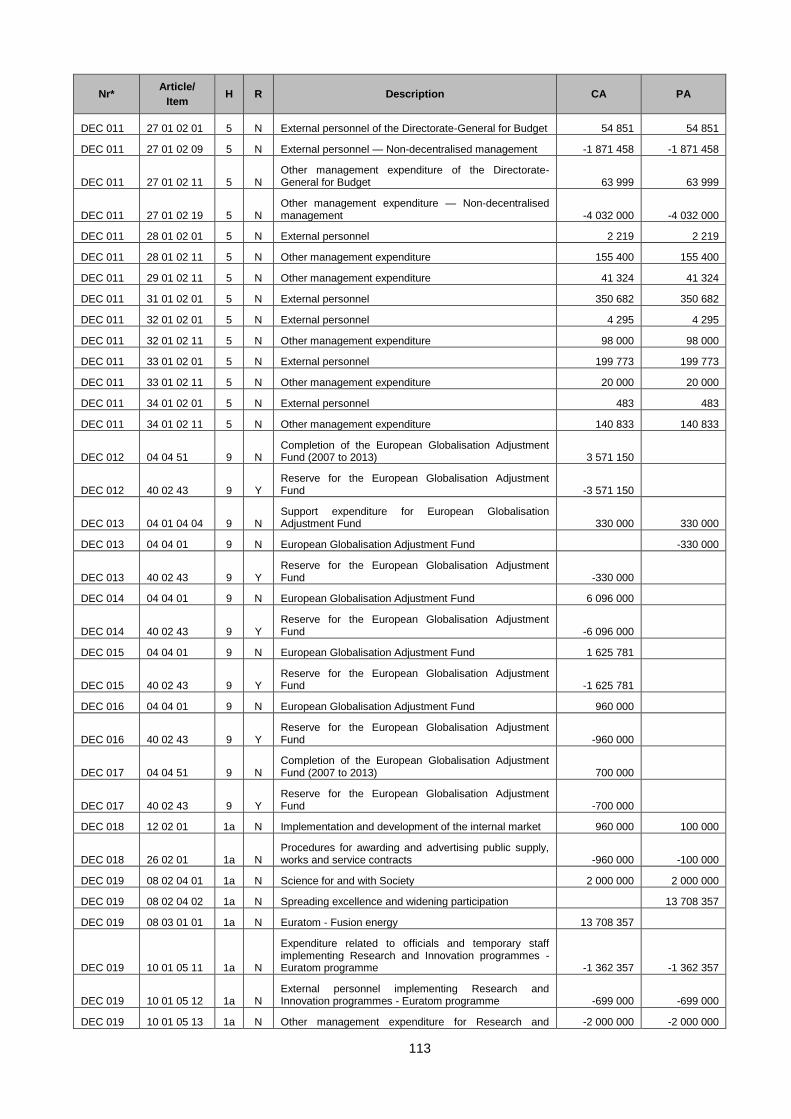
113
Nr* Article/
Item H R Description CA PA
DEC 011 27 01 02 01 5 N External personnel of the Directorate-General for Budget 54 851 54 851
DEC 011 27 01 02 09 5 N External personnel — Non-decentralised management -1 871 458 -1 871 458
DEC 011 27 01 02 11 5 N Other management expenditure of the Directorate-General for Budget 63 999 63 999
DEC 011 27 01 02 19 5 N Other management expenditure — Non-decentralised management -4 032 000 -4 032 000
DEC 011 28 01 02 01 5 N External personnel 2 219 2 219
DEC 011 28 01 02 11 5 N Other management expenditure 155 400 155 400
DEC 011 29 01 02 11 5 N Other management expenditure 41 324 41 324
DEC 011 31 01 02 01 5 N External personnel 350 682 350 682
DEC 011 32 01 02 01 5 N External personnel 4 295 4 295
DEC 011 32 01 02 11 5 N Other management expenditure 98 000 98 000
DEC 011 33 01 02 01 5 N External personnel 199 773 199 773
DEC 011 33 01 02 11 5 N Other management expenditure 20 000 20 000
DEC 011 34 01 02 01 5 N External personnel 483 483
DEC 011 34 01 02 11 5 N Other management expenditure 140 833 140 833
DEC 012 04 04 51 9 N Completion of the European Globalisation Adjustment Fund (2007 to 2013) 3 571 150
DEC 012 40 02 43 9 Y Reserve for the European Globalisation Adjustment Fund -3 571 150
DEC 013 04 01 04 04 9 N Support expenditure for European Globalisation Adjustment Fund 330 000 330 000
DEC 013 04 04 01 9 N European Globalisation Adjustment Fund -330 000
DEC 013 40 02 43 9 Y Reserve for the European Globalisation Adjustment Fund -330 000
DEC 014 04 04 01 9 N European Globalisation Adjustment Fund 6 096 000
DEC 014 40 02 43 9 Y Reserve for the European Globalisation Adjustment Fund -6 096 000
DEC 015 04 04 01 9 N European Globalisation Adjustment Fund 1 625 781
DEC 015 40 02 43 9 Y Reserve for the European Globalisation Adjustment Fund -1 625 781
DEC 016 04 04 01 9 N European Globalisation Adjustment Fund 960 000
DEC 016 40 02 43 9 Y Reserve for the European Globalisation Adjustment Fund -960 000
DEC 017 04 04 51 9 N Completion of the European Globalisation Adjustment Fund (2007 to 2013) 700 000
DEC 017 40 02 43 9 Y Reserve for the European Globalisation Adjustment Fund -700 000
DEC 018 12 02 01 1a N Implementation and development of the internal market 960 000 100 000
DEC 018 26 02 01 1a N Procedures for awarding and advertising public supply, works and service contracts -960 000 -100 000
DEC 019 08 02 04 01 1a N Science for and with Society 2 000 000 2 000 000
DEC 019 08 02 04 02 1a N Spreading excellence and widening participation 13 708 357
DEC 019 08 03 01 01 1a N Euratom - Fusion energy 13 708 357
DEC 019 10 01 05 11 1a N
Expenditure related to officials and temporary staff implementing Research and Innovation programmes - Euratom programme -1 362 357 -1 362 357
DEC 019 10 01 05 12 1a N External personnel implementing Research and Innovation programmes - Euratom programme -699 000 -699 000
DEC 019 10 01 05 13 1a N Other management expenditure for Research and -2 000 000 -2 000 000
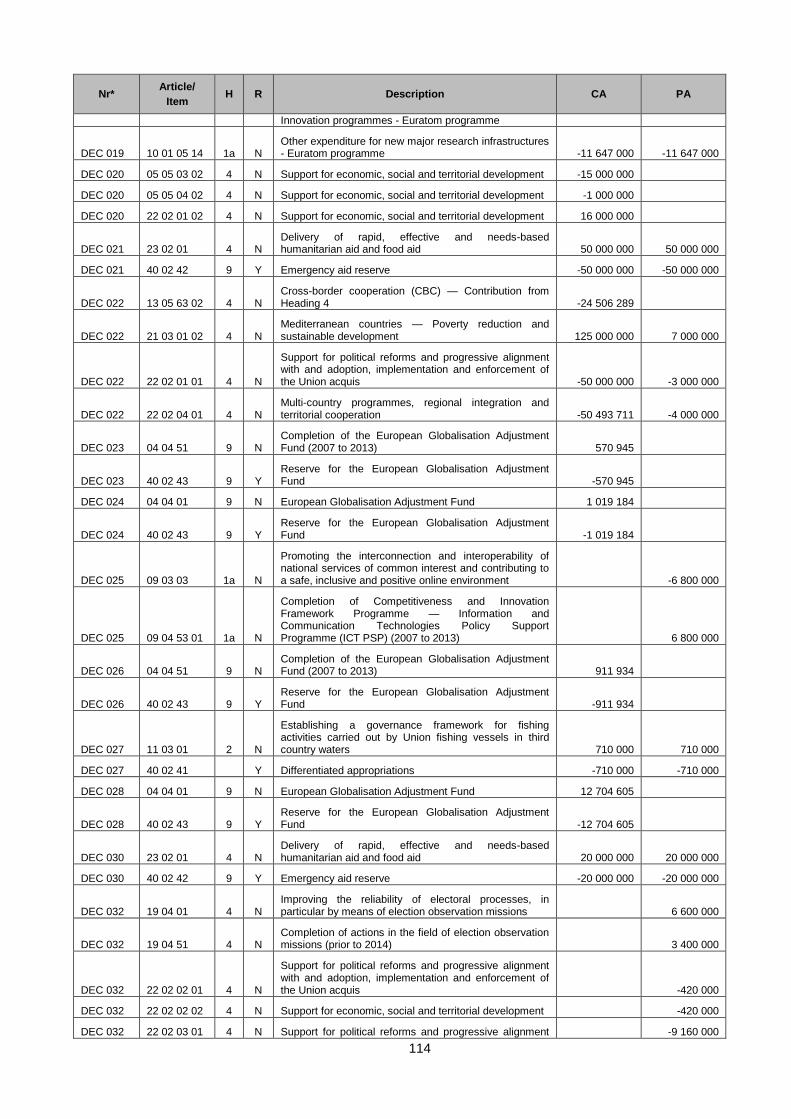
114
Nr* Article/
Item H R Description CA PA
Innovation programmes - Euratom programme
DEC 019 10 01 05 14 1a N Other expenditure for new major research infrastructures - Euratom programme -11 647 000 -11 647 000
DEC 020 05 05 03 02 4 N Support for economic, social and territorial development -15 000 000
DEC 020 05 05 04 02 4 N Support for economic, social and territorial development -1 000 000
DEC 020 22 02 01 02 4 N Support for economic, social and territorial development 16 000 000
DEC 021 23 02 01 4 N Delivery of rapid, effective and needs-based humanitarian aid and food aid 50 000 000 50 000 000
DEC 021 40 02 42 9 Y Emergency aid reserve -50 000 000 -50 000 000
DEC 022 13 05 63 02 4 N Cross-border cooperation (CBC) — Contribution from Heading 4 -24 506 289
DEC 022 21 03 01 02 4 N Mediterranean countries — Poverty reduction and sustainable development 125 000 000 7 000 000
DEC 022 22 02 01 01 4 N
Support for political reforms and progressive alignment with and adoption, implementation and enforcement of the Union acquis -50 000 000 -3 000 000
DEC 022 22 02 04 01 4 N Multi-country programmes, regional integration and territorial cooperation -50 493 711 -4 000 000
DEC 023 04 04 51 9 N Completion of the European Globalisation Adjustment Fund (2007 to 2013) 570 945
DEC 023 40 02 43 9 Y Reserve for the European Globalisation Adjustment Fund -570 945
DEC 024 04 04 01 9 N European Globalisation Adjustment Fund 1 019 184
DEC 024 40 02 43 9 Y Reserve for the European Globalisation Adjustment Fund -1 019 184
DEC 025 09 03 03 1a N
Promoting the interconnection and interoperability of national services of common interest and contributing to a safe, inclusive and positive online environment -6 800 000
DEC 025 09 04 53 01 1a N
Completion of Competitiveness and Innovation Framework Programme — Information and Communication Technologies Policy Support Programme (ICT PSP) (2007 to 2013) 6 800 000
DEC 026 04 04 51 9 N Completion of the European Globalisation Adjustment Fund (2007 to 2013) 911 934
DEC 026 40 02 43 9 Y Reserve for the European Globalisation Adjustment Fund -911 934
DEC 027 11 03 01 2 N
Establishing a governance framework for fishing activities carried out by Union fishing vessels in third country waters 710 000 710 000
DEC 027 40 02 41 Y Differentiated appropriations -710 000 -710 000
DEC 028 04 04 01 9 N European Globalisation Adjustment Fund 12 704 605
DEC 028 40 02 43 9 Y Reserve for the European Globalisation Adjustment Fund -12 704 605
DEC 030 23 02 01 4 N Delivery of rapid, effective and needs-based humanitarian aid and food aid 20 000 000 20 000 000
DEC 030 40 02 42 9 Y Emergency aid reserve -20 000 000 -20 000 000
DEC 032 19 04 01 4 N Improving the reliability of electoral processes, in particular by means of election observation missions 6 600 000
DEC 032 19 04 51 4 N Completion of actions in the field of election observation missions (prior to 2014) 3 400 000
DEC 032 22 02 02 01 4 N
Support for political reforms and progressive alignment with and adoption, implementation and enforcement of the Union acquis -420 000
DEC 032 22 02 02 02 4 N Support for economic, social and territorial development -420 000
DEC 032 22 02 03 01 4 N Support for political reforms and progressive alignment -9 160 000
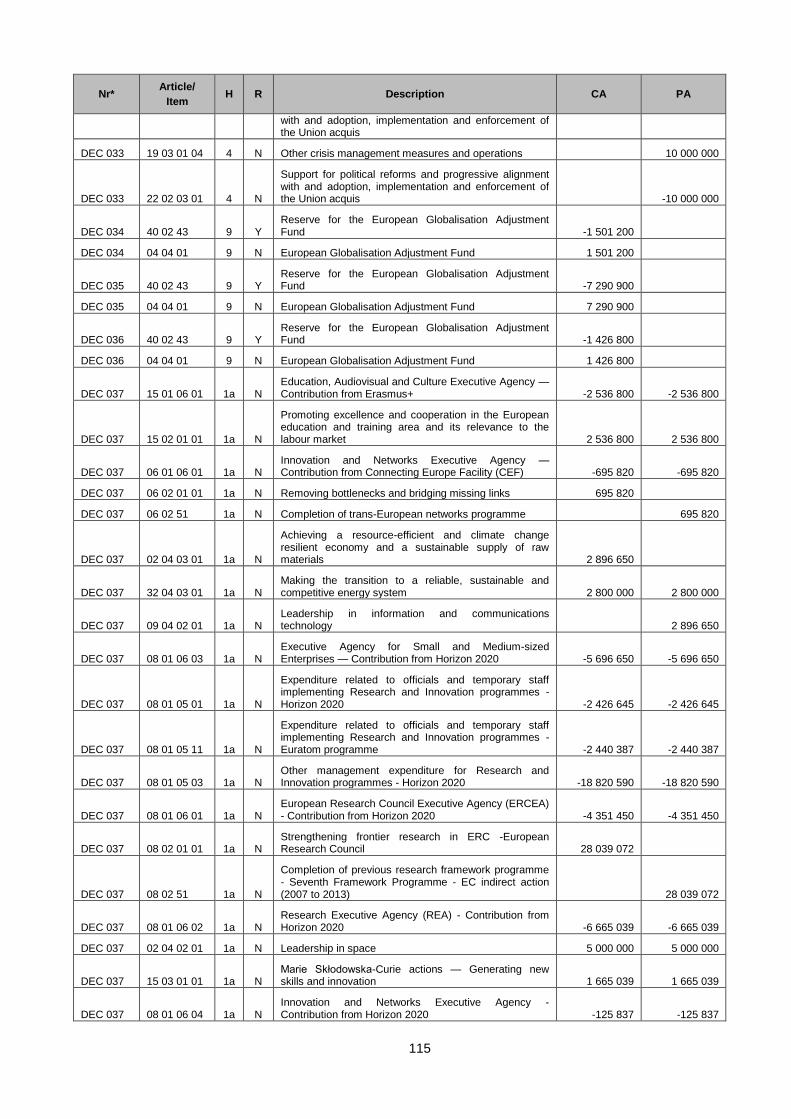
115
Nr* Article/
Item H R Description CA PA
with and adoption, implementation and enforcement of the Union acquis
DEC 033 19 03 01 04 4 N Other crisis management measures and operations 10 000 000
DEC 033 22 02 03 01 4 N
Support for political reforms and progressive alignment with and adoption, implementation and enforcement of the Union acquis -10 000 000
DEC 034 40 02 43 9 Y Reserve for the European Globalisation Adjustment Fund -1 501 200
DEC 034 04 04 01 9 N European Globalisation Adjustment Fund 1 501 200
DEC 035 40 02 43 9 Y Reserve for the European Globalisation Adjustment Fund -7 290 900
DEC 035 04 04 01 9 N European Globalisation Adjustment Fund 7 290 900
DEC 036 40 02 43 9 Y Reserve for the European Globalisation Adjustment Fund -1 426 800
DEC 036 04 04 01 9 N European Globalisation Adjustment Fund 1 426 800
DEC 037 15 01 06 01 1a N Education, Audiovisual and Culture Executive Agency — Contribution from Erasmus+ -2 536 800 -2 536 800
DEC 037 15 02 01 01 1a N
Promoting excellence and cooperation in the European education and training area and its relevance to the labour market 2 536 800 2 536 800
DEC 037 06 01 06 01 1a N Innovation and Networks Executive Agency — Contribution from Connecting Europe Facility (CEF) -695 820 -695 820
DEC 037 06 02 01 01 1a N Removing bottlenecks and bridging missing links 695 820
DEC 037 06 02 51 1a N Completion of trans-European networks programme 695 820
DEC 037 02 04 03 01 1a N
Achieving a resource-efficient and climate change resilient economy and a sustainable supply of raw materials 2 896 650
DEC 037 32 04 03 01 1a N Making the transition to a reliable, sustainable and competitive energy system 2 800 000 2 800 000
DEC 037 09 04 02 01 1a N Leadership in information and communications technology 2 896 650
DEC 037 08 01 06 03 1a N Executive Agency for Small and Medium-sized Enterprises — Contribution from Horizon 2020 -5 696 650 -5 696 650
DEC 037 08 01 05 01 1a N
Expenditure related to officials and temporary staff implementing Research and Innovation programmes - Horizon 2020 -2 426 645 -2 426 645
DEC 037 08 01 05 11 1a N
Expenditure related to officials and temporary staff implementing Research and Innovation programmes - Euratom programme -2 440 387 -2 440 387
DEC 037 08 01 05 03 1a N Other management expenditure for Research and Innovation programmes - Horizon 2020 -18 820 590 -18 820 590
DEC 037 08 01 06 01 1a N European Research Council Executive Agency (ERCEA) - Contribution from Horizon 2020 -4 351 450 -4 351 450
DEC 037 08 02 01 01 1a N Strengthening frontier research in ERC -European Research Council 28 039 072
DEC 037 08 02 51 1a N
Completion of previous research framework programme - Seventh Framework Programme - EC indirect action (2007 to 2013) 28 039 072
DEC 037 08 01 06 02 1a N Research Executive Agency (REA) - Contribution from Horizon 2020 -6 665 039 -6 665 039
DEC 037 02 04 02 01 1a N Leadership in space 5 000 000 5 000 000
DEC 037 15 03 01 01 1a N Marie Skłodowska-Curie actions — Generating new skills and innovation 1 665 039 1 665 039
DEC 037 08 01 06 04 1a N Innovation and Networks Executive Agency -Contribution from Horizon 2020 -125 837 -125 837
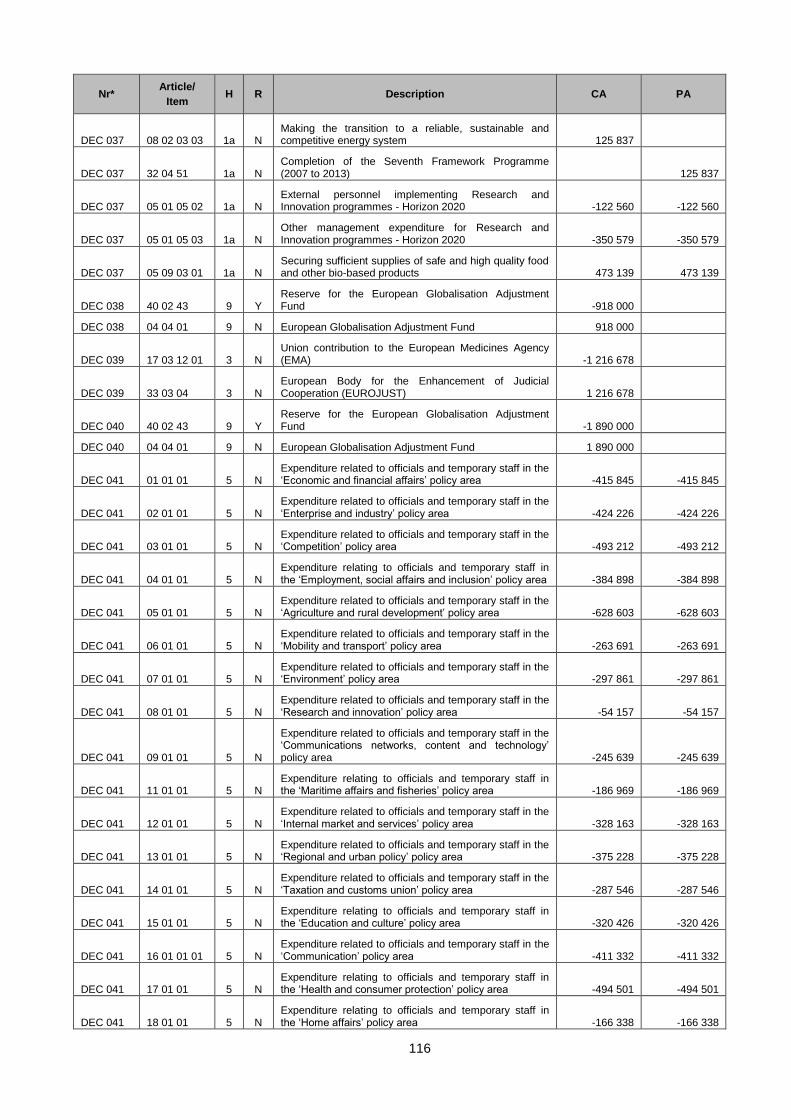
116
Nr* Article/
Item H R Description CA PA
DEC 037 08 02 03 03 1a N Making the transition to a reliable, sustainable and competitive energy system 125 837
DEC 037 32 04 51 1a N Completion of the Seventh Framework Programme (2007 to 2013) 125 837
DEC 037 05 01 05 02 1a N External personnel implementing Research and Innovation programmes - Horizon 2020 -122 560 -122 560
DEC 037 05 01 05 03 1a N Other management expenditure for Research and Innovation programmes - Horizon 2020 -350 579 -350 579
DEC 037 05 09 03 01 1a N Securing sufficient supplies of safe and high quality food and other bio-based products 473 139 473 139
DEC 038 40 02 43 9 Y Reserve for the European Globalisation Adjustment Fund -918 000
DEC 038 04 04 01 9 N European Globalisation Adjustment Fund 918 000
DEC 039 17 03 12 01 3 N Union contribution to the European Medicines Agency (EMA) -1 216 678
DEC 039 33 03 04 3 N European Body for the Enhancement of Judicial Cooperation (EUROJUST) 1 216 678
DEC 040 40 02 43 9 Y Reserve for the European Globalisation Adjustment Fund -1 890 000
DEC 040 04 04 01 9 N European Globalisation Adjustment Fund 1 890 000
DEC 041 01 01 01 5 N Expenditure related to officials and temporary staff in the ‘Economic and financial affairs’ policy area -415 845 -415 845
DEC 041 02 01 01 5 N Expenditure related to officials and temporary staff in the ‘Enterprise and industry’ policy area -424 226 -424 226
DEC 041 03 01 01 5 N Expenditure related to officials and temporary staff in the ‘Competition’ policy area -493 212 -493 212
DEC 041 04 01 01 5 N Expenditure relating to officials and temporary staff in the ‘Employment, social affairs and inclusion’ policy area -384 898 -384 898
DEC 041 05 01 01 5 N Expenditure related to officials and temporary staff in the ‘Agriculture and rural development’ policy area -628 603 -628 603
DEC 041 06 01 01 5 N Expenditure related to officials and temporary staff in the ‘Mobility and transport’ policy area -263 691 -263 691
DEC 041 07 01 01 5 N Expenditure related to officials and temporary staff in the ‘Environment’ policy area -297 861 -297 861
DEC 041 08 01 01 5 N Expenditure related to officials and temporary staff in the ‘Research and innovation’ policy area -54 157 -54 157
DEC 041 09 01 01 5 N
Expenditure related to officials and temporary staff in the ‘Communications networks, content and technology’ policy area -245 639 -245 639
DEC 041 11 01 01 5 N Expenditure relating to officials and temporary staff in the ‘Maritime affairs and fisheries’ policy area -186 969 -186 969
DEC 041 12 01 01 5 N Expenditure related to officials and temporary staff in the ‘Internal market and services’ policy area -328 163 -328 163
DEC 041 13 01 01 5 N Expenditure related to officials and temporary staff in the ‘Regional and urban policy’ policy area -375 228 -375 228
DEC 041 14 01 01 5 N Expenditure related to officials and temporary staff in the ‘Taxation and customs union’ policy area -287 546 -287 546
DEC 041 15 01 01 5 N Expenditure relating to officials and temporary staff in the ‘Education and culture’ policy area -320 426 -320 426
DEC 041 16 01 01 01 5 N Expenditure related to officials and temporary staff in the ‘Communication’ policy area -411 332 -411 332
DEC 041 17 01 01 5 N Expenditure relating to officials and temporary staff in the ‘Health and consumer protection’ policy area -494 501 -494 501
DEC 041 18 01 01 5 N Expenditure relating to officials and temporary staff in the ‘Home affairs’ policy area -166 338 -166 338
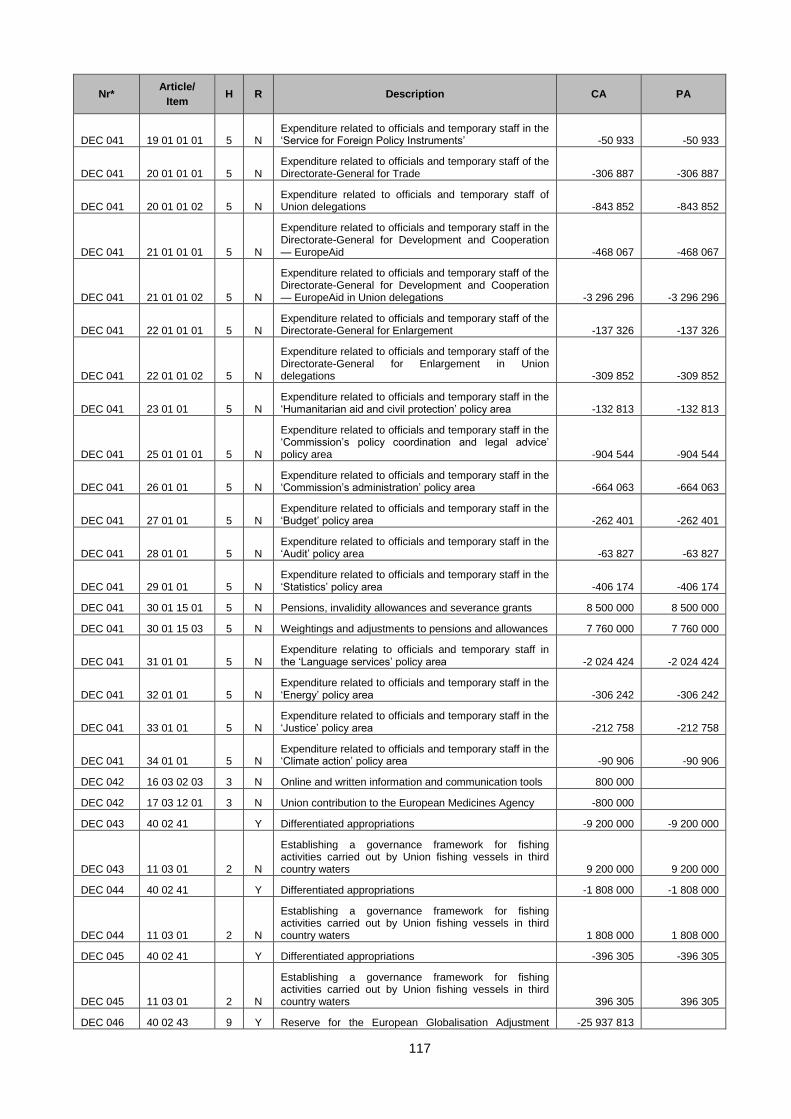
117
Nr* Article/
Item H R Description CA PA
DEC 041 19 01 01 01 5 N Expenditure related to officials and temporary staff in the ‘Service for Foreign Policy Instruments’ -50 933 -50 933
DEC 041 20 01 01 01 5 N Expenditure related to officials and temporary staff of the Directorate-General for Trade -306 887 -306 887
DEC 041 20 01 01 02 5 N Expenditure related to officials and temporary staff of Union delegations -843 852 -843 852
DEC 041 21 01 01 01 5 N
Expenditure related to officials and temporary staff in the Directorate-General for Development and Cooperation — EuropeAid -468 067 -468 067
DEC 041 21 01 01 02 5 N
Expenditure related to officials and temporary staff of the Directorate-General for Development and Cooperation — EuropeAid in Union delegations -3 296 296 -3 296 296
DEC 041 22 01 01 01 5 N Expenditure related to officials and temporary staff of the Directorate-General for Enlargement -137 326 -137 326
DEC 041 22 01 01 02 5 N
Expenditure related to officials and temporary staff of the Directorate-General for Enlargement in Union delegations -309 852 -309 852
DEC 041 23 01 01 5 N Expenditure related to officials and temporary staff in the ‘Humanitarian aid and civil protection’ policy area -132 813 -132 813
DEC 041 25 01 01 01 5 N
Expenditure related to officials and temporary staff in the ‘Commission’s policy coordination and legal advice’ policy area -904 544 -904 544
DEC 041 26 01 01 5 N Expenditure related to officials and temporary staff in the ‘Commission’s administration’ policy area -664 063 -664 063
DEC 041 27 01 01 5 N Expenditure related to officials and temporary staff in the ‘Budget’ policy area -262 401 -262 401
DEC 041 28 01 01 5 N Expenditure related to officials and temporary staff in the ‘Audit’ policy area -63 827 -63 827
DEC 041 29 01 01 5 N Expenditure related to officials and temporary staff in the ‘Statistics’ policy area -406 174 -406 174
DEC 041 30 01 15 01 5 N Pensions, invalidity allowances and severance grants 8 500 000 8 500 000
DEC 041 30 01 15 03 5 N Weightings and adjustments to pensions and allowances 7 760 000 7 760 000
DEC 041 31 01 01 5 N Expenditure relating to officials and temporary staff in the ‘Language services’ policy area -2 024 424 -2 024 424
DEC 041 32 01 01 5 N Expenditure related to officials and temporary staff in the ‘Energy’ policy area -306 242 -306 242
DEC 041 33 01 01 5 N Expenditure related to officials and temporary staff in the ‘Justice’ policy area -212 758 -212 758
DEC 041 34 01 01 5 N Expenditure related to officials and temporary staff in the ‘Climate action’ policy area -90 906 -90 906
DEC 042 16 03 02 03 3 N Online and written information and communication tools 800 000
DEC 042 17 03 12 01 3 N Union contribution to the European Medicines Agency -800 000
DEC 043 40 02 41 Y Differentiated appropriations -9 200 000 -9 200 000
DEC 043 11 03 01 2 N
Establishing a governance framework for fishing activities carried out by Union fishing vessels in third country waters 9 200 000 9 200 000
DEC 044 40 02 41 Y Differentiated appropriations -1 808 000 -1 808 000
DEC 044 11 03 01 2 N
Establishing a governance framework for fishing activities carried out by Union fishing vessels in third country waters 1 808 000 1 808 000
DEC 045 40 02 41 Y Differentiated appropriations -396 305 -396 305
DEC 045 11 03 01 2 N
Establishing a governance framework for fishing activities carried out by Union fishing vessels in third country waters 396 305 396 305
DEC 046 40 02 43 9 Y Reserve for the European Globalisation Adjustment -25 937 813
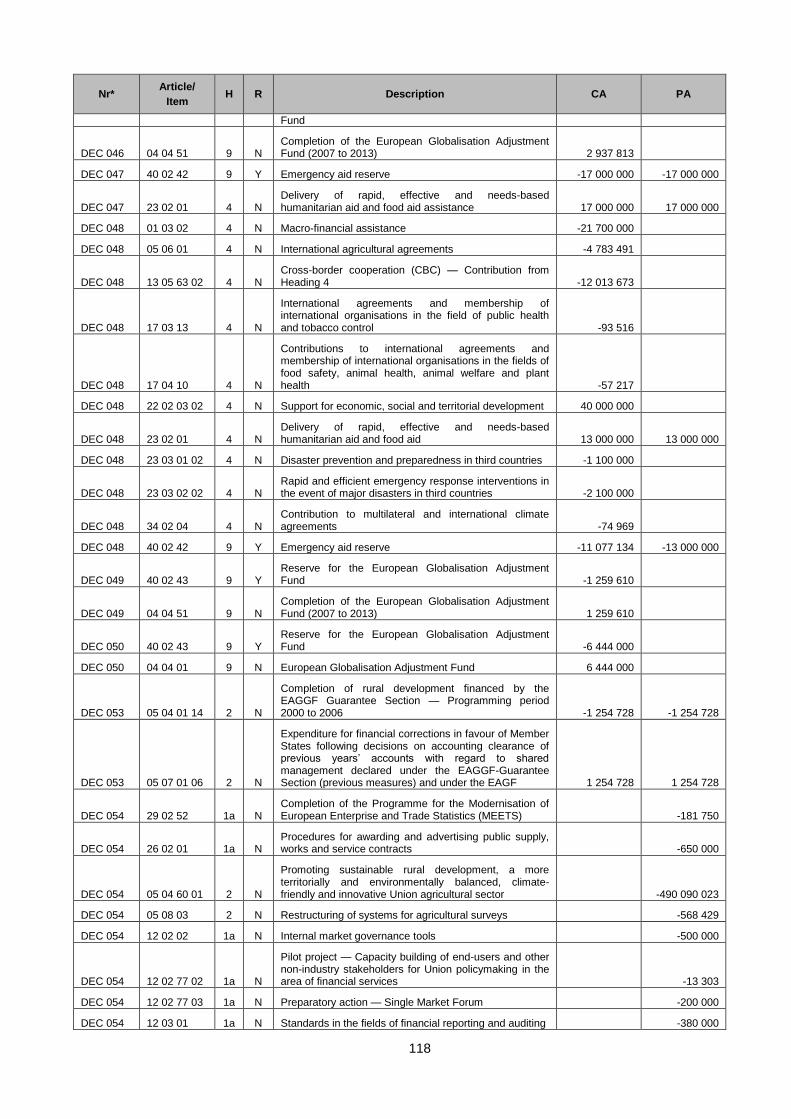
118
Nr* Article/
Item H R Description CA PA
Fund
DEC 046 04 04 51 9 N Completion of the European Globalisation Adjustment Fund (2007 to 2013) 2 937 813
DEC 047 40 02 42 9 Y Emergency aid reserve -17 000 000 -17 000 000
DEC 047 23 02 01 4 N Delivery of rapid, effective and needs-based humanitarian aid and food aid assistance 17 000 000 17 000 000
DEC 048 01 03 02 4 N Macro-financial assistance -21 700 000
DEC 048 05 06 01 4 N International agricultural agreements -4 783 491
DEC 048 13 05 63 02 4 N Cross-border cooperation (CBC) — Contribution from Heading 4 -12 013 673
DEC 048 17 03 13 4 N
International agreements and membership of international organisations in the field of public health and tobacco control -93 516
DEC 048 17 04 10 4 N
Contributions to international agreements and membership of international organisations in the fields of food safety, animal health, animal welfare and plant health -57 217
DEC 048 22 02 03 02 4 N Support for economic, social and territorial development 40 000 000
DEC 048 23 02 01 4 N Delivery of rapid, effective and needs-based humanitarian aid and food aid 13 000 000 13 000 000
DEC 048 23 03 01 02 4 N Disaster prevention and preparedness in third countries -1 100 000
DEC 048 23 03 02 02 4 N Rapid and efficient emergency response interventions in the event of major disasters in third countries -2 100 000
DEC 048 34 02 04 4 N Contribution to multilateral and international climate agreements -74 969
DEC 048 40 02 42 9 Y Emergency aid reserve -11 077 134 -13 000 000
DEC 049 40 02 43 9 Y Reserve for the European Globalisation Adjustment Fund -1 259 610
DEC 049 04 04 51 9 N Completion of the European Globalisation Adjustment Fund (2007 to 2013) 1 259 610
DEC 050 40 02 43 9 Y Reserve for the European Globalisation Adjustment Fund -6 444 000
DEC 050 04 04 01 9 N European Globalisation Adjustment Fund 6 444 000
DEC 053 05 04 01 14 2 N
Completion of rural development financed by the EAGGF Guarantee Section — Programming period 2000 to 2006 -1 254 728 -1 254 728
DEC 053 05 07 01 06 2 N
Expenditure for financial corrections in favour of Member States following decisions on accounting clearance of previous years’ accounts with regard to shared management declared under the EAGGF-Guarantee Section (previous measures) and under the EAGF 1 254 728 1 254 728
DEC 054 29 02 52 1a N Completion of the Programme for the Modernisation of European Enterprise and Trade Statistics (MEETS) -181 750
DEC 054 26 02 01 1a N Procedures for awarding and advertising public supply, works and service contracts -650 000
DEC 054 05 04 60 01 2 N
Promoting sustainable rural development, a more territorially and environmentally balanced, climate-friendly and innovative Union agricultural sector -490 090 023
DEC 054 05 08 03 2 N Restructuring of systems for agricultural surveys -568 429
DEC 054 12 02 02 1a N Internal market governance tools -500 000
DEC 054 12 02 77 02 1a N
Pilot project — Capacity building of end-users and other non-industry stakeholders for Union policymaking in the area of financial services -13 303
DEC 054 12 02 77 03 1a N Preparatory action — Single Market Forum -200 000
DEC 054 12 03 01 1a N Standards in the fields of financial reporting and auditing -380 000
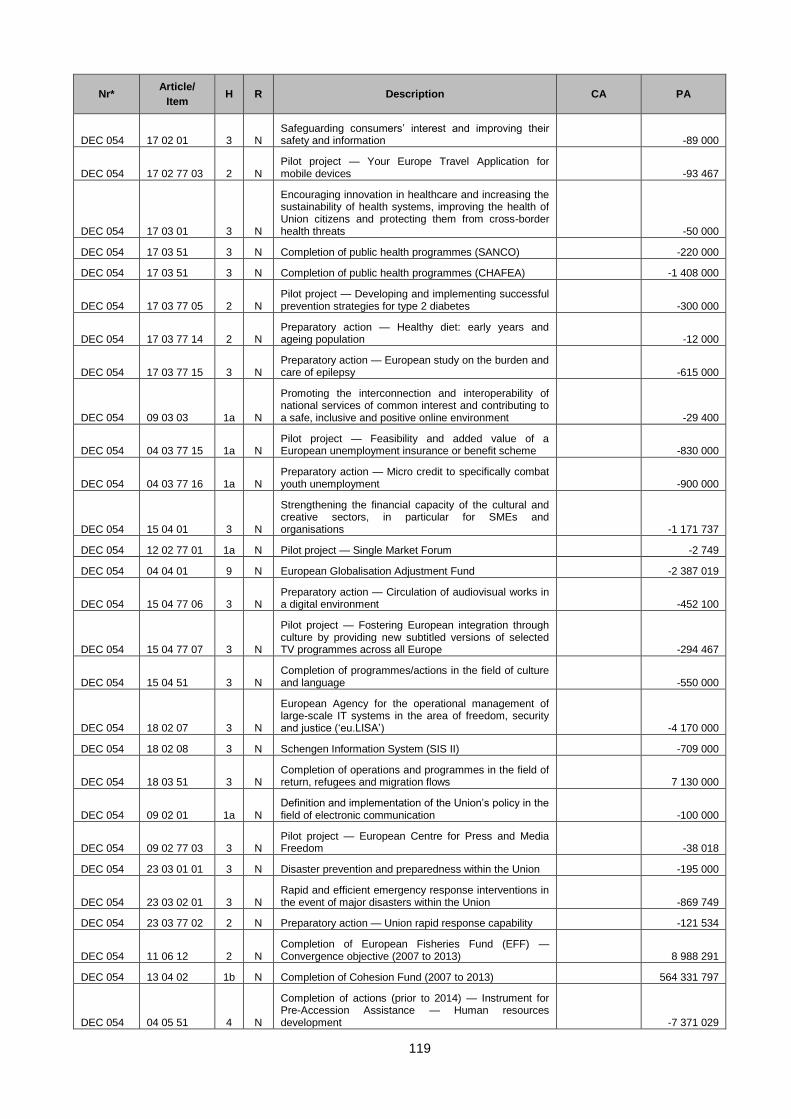
119
Nr* Article/
Item H R Description CA PA
DEC 054 17 02 01 3 N Safeguarding consumers’ interest and improving their safety and information -89 000
DEC 054 17 02 77 03 2 N Pilot project — Your Europe Travel Application for mobile devices -93 467
DEC 054 17 03 01 3 N
Encouraging innovation in healthcare and increasing the sustainability of health systems, improving the health of Union citizens and protecting them from cross-border health threats -50 000
DEC 054 17 03 51 3 N Completion of public health programmes (SANCO) -220 000
DEC 054 17 03 51 3 N Completion of public health programmes (CHAFEA) -1 408 000
DEC 054 17 03 77 05 2 N Pilot project — Developing and implementing successful prevention strategies for type 2 diabetes -300 000
DEC 054 17 03 77 14 2 N Preparatory action — Healthy diet: early years and ageing population -12 000
DEC 054 17 03 77 15 3 N Preparatory action — European study on the burden and care of epilepsy -615 000
DEC 054 09 03 03 1a N
Promoting the interconnection and interoperability of national services of common interest and contributing to a safe, inclusive and positive online environment -29 400
DEC 054 04 03 77 15 1a N Pilot project — Feasibility and added value of a European unemployment insurance or benefit scheme -830 000
DEC 054 04 03 77 16 1a N Preparatory action — Micro credit to specifically combat youth unemployment -900 000
DEC 054 15 04 01 3 N
Strengthening the financial capacity of the cultural and creative sectors, in particular for SMEs and organisations -1 171 737
DEC 054 12 02 77 01 1a N Pilot project — Single Market Forum -2 749
DEC 054 04 04 01 9 N European Globalisation Adjustment Fund -2 387 019
DEC 054 15 04 77 06 3 N Preparatory action — Circulation of audiovisual works in a digital environment -452 100
DEC 054 15 04 77 07 3 N
Pilot project — Fostering European integration through culture by providing new subtitled versions of selected TV programmes across all Europe -294 467
DEC 054 15 04 51 3 N Completion of programmes/actions in the field of culture and language -550 000
DEC 054 18 02 07 3 N
European Agency for the operational management of large-scale IT systems in the area of freedom, security and justice (‘eu.LISA’) -4 170 000
DEC 054 18 02 08 3 N Schengen Information System (SIS II) -709 000
DEC 054 18 03 51 3 N Completion of operations and programmes in the field of return, refugees and migration flows 7 130 000
DEC 054 09 02 01 1a N Definition and implementation of the Union’s policy in the field of electronic communication -100 000
DEC 054 09 02 77 03 3 N Pilot project — European Centre for Press and Media Freedom -38 018
DEC 054 23 03 01 01 3 N Disaster prevention and preparedness within the Union -195 000
DEC 054 23 03 02 01 3 N Rapid and efficient emergency response interventions in the event of major disasters within the Union -869 749
DEC 054 23 03 77 02 2 N Preparatory action — Union rapid response capability -121 534
DEC 054 11 06 12 2 N Completion of European Fisheries Fund (EFF) — Convergence objective (2007 to 2013) 8 988 291
DEC 054 13 04 02 1b N Completion of Cohesion Fund (2007 to 2013) 564 331 797
DEC 054 04 05 51 4 N
Completion of actions (prior to 2014) — Instrument for Pre-Accession Assistance — Human resources development -7 371 029
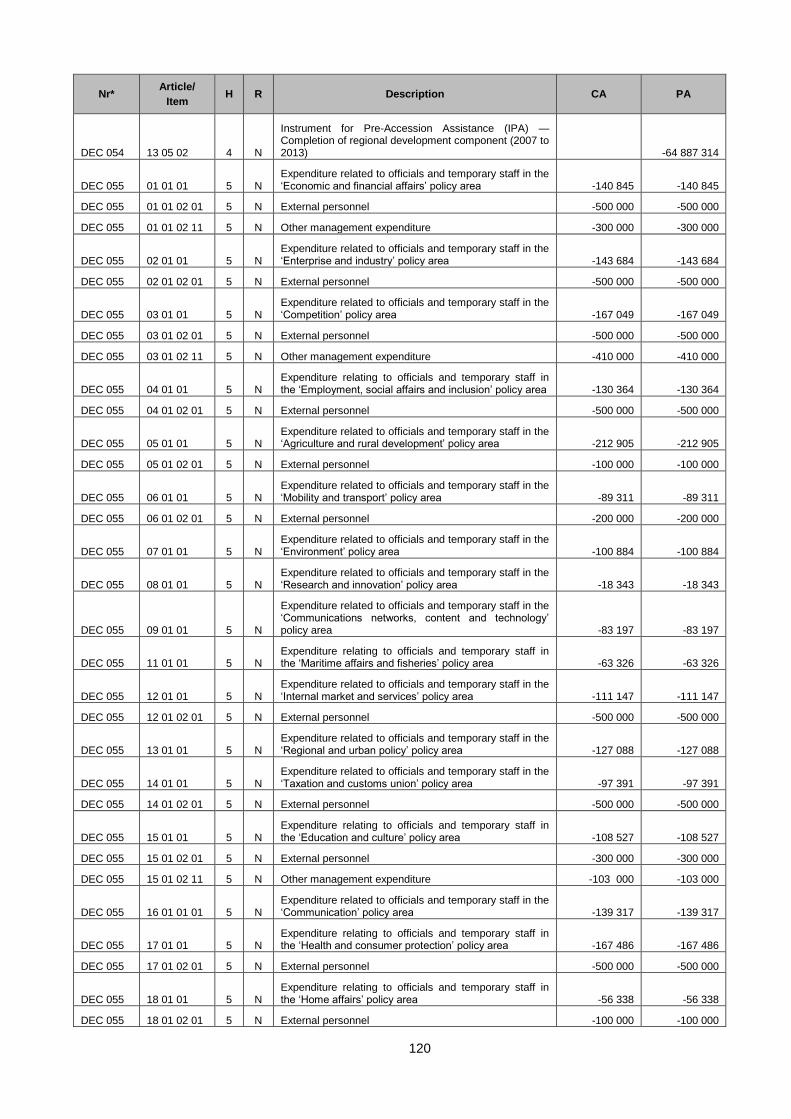
120
Nr* Article/
Item H R Description CA PA
DEC 054 13 05 02 4 N
Instrument for Pre-Accession Assistance (IPA) — Completion of regional development component (2007 to 2013) -64 887 314
DEC 055 01 01 01 5 N Expenditure related to officials and temporary staff in the ‘Economic and financial affairs’ policy area -140 845 -140 845
DEC 055 01 01 02 01 5 N External personnel -500 000 -500 000
DEC 055 01 01 02 11 5 N Other management expenditure -300 000 -300 000
DEC 055 02 01 01 5 N Expenditure related to officials and temporary staff in the ‘Enterprise and industry’ policy area -143 684 -143 684
DEC 055 02 01 02 01 5 N External personnel -500 000 -500 000
DEC 055 03 01 01 5 N Expenditure related to officials and temporary staff in the ‘Competition’ policy area -167 049 -167 049
DEC 055 03 01 02 01 5 N External personnel -500 000 -500 000
DEC 055 03 01 02 11 5 N Other management expenditure -410 000 -410 000
DEC 055 04 01 01 5 N Expenditure relating to officials and temporary staff in the ‘Employment, social affairs and inclusion’ policy area -130 364 -130 364
DEC 055 04 01 02 01 5 N External personnel -500 000 -500 000
DEC 055 05 01 01 5 N Expenditure related to officials and temporary staff in the ‘Agriculture and rural development’ policy area -212 905 -212 905
DEC 055 05 01 02 01 5 N External personnel -100 000 -100 000
DEC 055 06 01 01 5 N Expenditure related to officials and temporary staff in the ‘Mobility and transport’ policy area -89 311 -89 311
DEC 055 06 01 02 01 5 N External personnel -200 000 -200 000
DEC 055 07 01 01 5 N Expenditure related to officials and temporary staff in the ‘Environment’ policy area -100 884 -100 884
DEC 055 08 01 01 5 N Expenditure related to officials and temporary staff in the ‘Research and innovation’ policy area -18 343 -18 343
DEC 055 09 01 01 5 N
Expenditure related to officials and temporary staff in the ‘Communications networks, content and technology’ policy area -83 197 -83 197
DEC 055 11 01 01 5 N Expenditure relating to officials and temporary staff in the ‘Maritime affairs and fisheries’ policy area -63 326 -63 326
DEC 055 12 01 01 5 N Expenditure related to officials and temporary staff in the ‘Internal market and services’ policy area -111 147 -111 147
DEC 055 12 01 02 01 5 N External personnel -500 000 -500 000
DEC 055 13 01 01 5 N Expenditure related to officials and temporary staff in the ‘Regional and urban policy’ policy area -127 088 -127 088
DEC 055 14 01 01 5 N Expenditure related to officials and temporary staff in the ‘Taxation and customs union’ policy area -97 391 -97 391
DEC 055 14 01 02 01 5 N External personnel -500 000 -500 000
DEC 055 15 01 01 5 N Expenditure relating to officials and temporary staff in the ‘Education and culture’ policy area -108 527 -108 527
DEC 055 15 01 02 01 5 N External personnel -300 000 -300 000
DEC 055 15 01 02 11 5 N Other management expenditure -103 000 -103 000
DEC 055 16 01 01 01 5 N Expenditure related to officials and temporary staff in the ‘Communication’ policy area -139 317 -139 317
DEC 055 17 01 01 5 N Expenditure relating to officials and temporary staff in the ‘Health and consumer protection’ policy area -167 486 -167 486
DEC 055 17 01 02 01 5 N External personnel -500 000 -500 000
DEC 055 18 01 01 5 N Expenditure relating to officials and temporary staff in the ‘Home affairs’ policy area -56 338 -56 338
DEC 055 18 01 02 01 5 N External personnel -100 000 -100 000
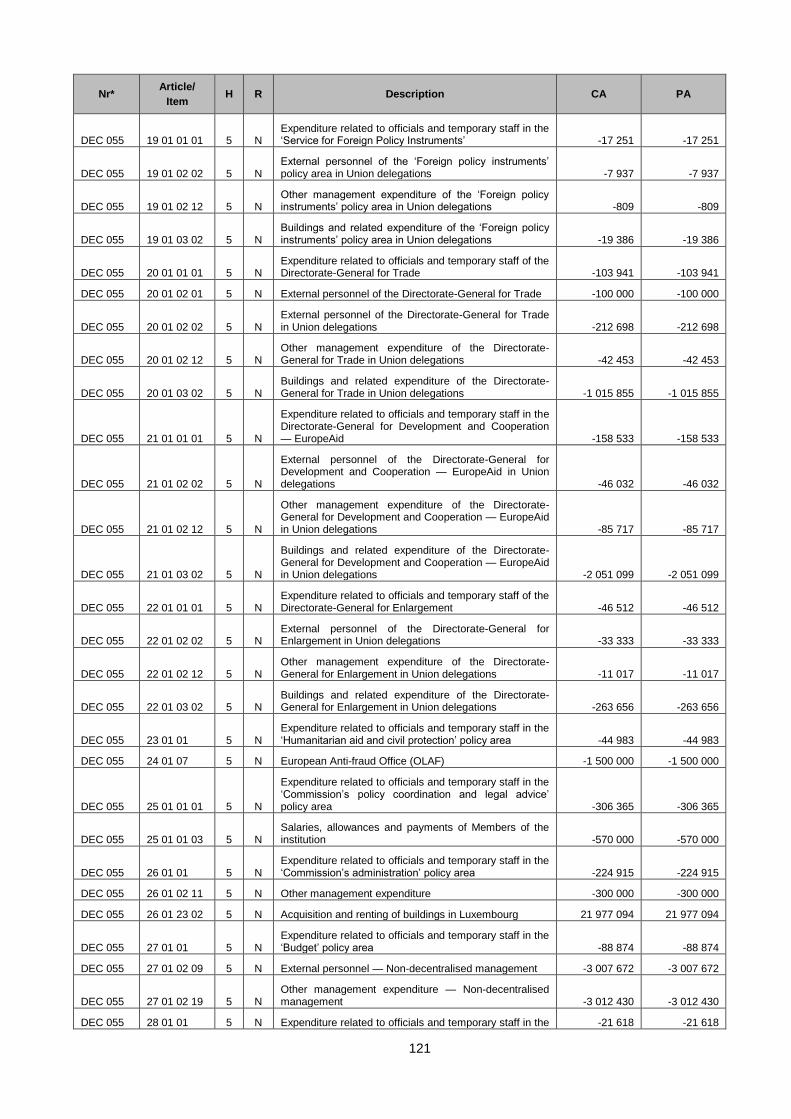
121
Nr* Article/
Item H R Description CA PA
DEC 055 19 01 01 01 5 N Expenditure related to officials and temporary staff in the ‘Service for Foreign Policy Instruments’ -17 251 -17 251
DEC 055 19 01 02 02 5 N External personnel of the ‘Foreign policy instruments’ policy area in Union delegations -7 937 -7 937
DEC 055 19 01 02 12 5 N Other management expenditure of the ‘Foreign policy instruments’ policy area in Union delegations -809 -809
DEC 055 19 01 03 02 5 N Buildings and related expenditure of the ‘Foreign policy instruments’ policy area in Union delegations -19 386 -19 386
DEC 055 20 01 01 01 5 N Expenditure related to officials and temporary staff of the Directorate-General for Trade -103 941 -103 941
DEC 055 20 01 02 01 5 N External personnel of the Directorate-General for Trade -100 000 -100 000
DEC 055 20 01 02 02 5 N External personnel of the Directorate-General for Trade in Union delegations -212 698 -212 698
DEC 055 20 01 02 12 5 N Other management expenditure of the Directorate-General for Trade in Union delegations -42 453 -42 453
DEC 055 20 01 03 02 5 N Buildings and related expenditure of the Directorate-General for Trade in Union delegations -1 015 855 -1 015 855
DEC 055 21 01 01 01 5 N
Expenditure related to officials and temporary staff in the Directorate-General for Development and Cooperation — EuropeAid -158 533 -158 533
DEC 055 21 01 02 02 5 N
External personnel of the Directorate-General for Development and Cooperation — EuropeAid in Union delegations -46 032 -46 032
DEC 055 21 01 02 12 5 N
Other management expenditure of the Directorate-General for Development and Cooperation — EuropeAid in Union delegations -85 717 -85 717
DEC 055 21 01 03 02 5 N
Buildings and related expenditure of the Directorate-General for Development and Cooperation — EuropeAid in Union delegations -2 051 099 -2 051 099
DEC 055 22 01 01 01 5 N Expenditure related to officials and temporary staff of the Directorate-General for Enlargement -46 512 -46 512
DEC 055 22 01 02 02 5 N External personnel of the Directorate-General for Enlargement in Union delegations -33 333 -33 333
DEC 055 22 01 02 12 5 N Other management expenditure of the Directorate-General for Enlargement in Union delegations -11 017 -11 017
DEC 055 22 01 03 02 5 N Buildings and related expenditure of the Directorate-General for Enlargement in Union delegations -263 656 -263 656
DEC 055 23 01 01 5 N Expenditure related to officials and temporary staff in the ‘Humanitarian aid and civil protection’ policy area -44 983 -44 983
DEC 055 24 01 07 5 N European Anti-fraud Office (OLAF) -1 500 000 -1 500 000
DEC 055 25 01 01 01 5 N
Expenditure related to officials and temporary staff in the ‘Commission’s policy coordination and legal advice’ policy area -306 365 -306 365
DEC 055 25 01 01 03 5 N Salaries, allowances and payments of Members of the institution -570 000 -570 000
DEC 055 26 01 01 5 N Expenditure related to officials and temporary staff in the ‘Commission’s administration’ policy area -224 915 -224 915
DEC 055 26 01 02 11 5 N Other management expenditure -300 000 -300 000
DEC 055 26 01 23 02 5 N Acquisition and renting of buildings in Luxembourg 21 977 094 21 977 094
DEC 055 27 01 01 5 N Expenditure related to officials and temporary staff in the ‘Budget’ policy area -88 874 -88 874
DEC 055 27 01 02 09 5 N External personnel — Non-decentralised management -3 007 672 -3 007 672
DEC 055 27 01 02 19 5 N Other management expenditure — Non-decentralised management -3 012 430 -3 012 430
DEC 055 28 01 01 5 N Expenditure related to officials and temporary staff in the -21 618 -21 618
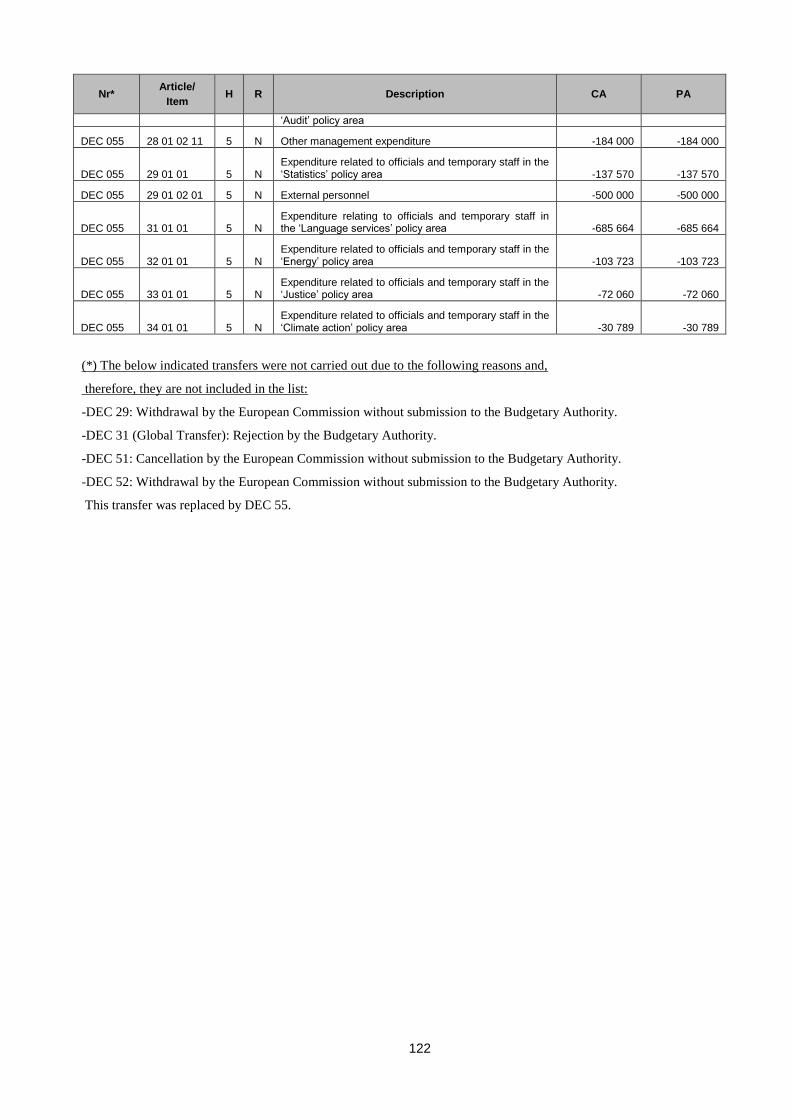
122
Nr* Article/
Item H R Description CA PA
‘Audit’ policy area
DEC 055 28 01 02 11 5 N Other management expenditure -184 000 -184 000
DEC 055 29 01 01 5 N Expenditure related to officials and temporary staff in the ‘Statistics’ policy area -137 570 -137 570
DEC 055 29 01 02 01 5 N External personnel -500 000 -500 000
DEC 055 31 01 01 5 N Expenditure relating to officials and temporary staff in the ‘Language services’ policy area -685 664 -685 664
DEC 055 32 01 01 5 N Expenditure related to officials and temporary staff in the ‘Energy’ policy area -103 723 -103 723
DEC 055 33 01 01 5 N Expenditure related to officials and temporary staff in the ‘Justice’ policy area -72 060 -72 060
DEC 055 34 01 01 5 N Expenditure related to officials and temporary staff in the ‘Climate action’ policy area -30 789 -30 789
(*) The below indicated transfers were not carried out due to the following reasons and,
therefore, they are not included in the list:
-DEC 29: Withdrawal by the European Commission without submission to the Budgetary Authority.
-DEC 31 (Global Transfer): Rejection by the Budgetary Authority.
-DEC 51: Cancellation by the European Commission without submission to the Budgetary Authority.
-DEC 52: Withdrawal by the European Commission without submission to the Budgetary Authority.
This transfer was replaced by DEC 55.
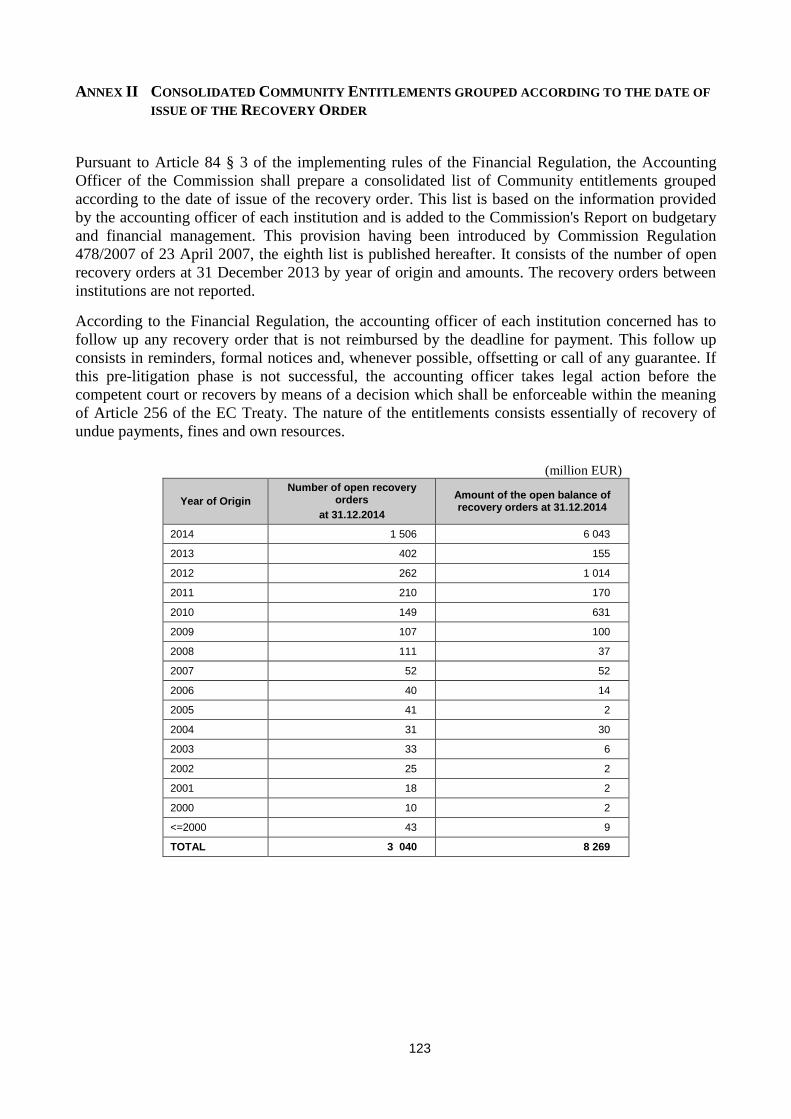
123
ANNEX II CONSOLIDATED COMMUNITY ENTITLEMENTS GROUPED ACCORDING TO THE DATE OF
ISSUE OF THE RECOVERY ORDER
Pursuant to Article 84 § 3 of the implementing rules of the Financial Regulation, the Accounting
Officer of the Commission shall prepare a consolidated list of Community entitlements grouped
according to the date of issue of the recovery order. This list is based on the information provided
by the accounting officer of each institution and is added to the Commission's Report on budgetary
and financial management. This provision having been introduced by Commission Regulation
478/2007 of 23 April 2007, the eighth list is published hereafter. It consists of the number of open
recovery orders at 31 December 2013 by year of origin and amounts. The recovery orders between
institutions are not reported.
According to the Financial Regulation, the accounting officer of each institution concerned has to
follow up any recovery order that is not reimbursed by the deadline for payment. This follow up
consists in reminders, formal notices and, whenever possible, offsetting or call of any guarantee. If
this pre-litigation phase is not successful, the accounting officer takes legal action before the
competent court or recovers by means of a decision which shall be enforceable within the meaning
of Article 256 of the EC Treaty. The nature of the entitlements consists essentially of recovery of
undue payments, fines and own resources.
(million EUR)
Year of Origin
Number of open recovery orders
at 31.12.2014
Amount of the open balance of recovery orders at 31.12.2014
2014 1 506 6 043
2013 402 155
2012 262 1 014
2011 210 170
2010 149 631
2009 107 100
2008 111 37
2007 52 52
2006 40 14
2005 41 2
2004 31 30
2003 33 6
2002 25 2
2001 18 2
2000 10 2
<=2000 43 9
TOTAL 3 040 8 269
124

![Cumulative Advantage in Online Markets - uni-muenchen.de · Cumulative Advantage (CA) "Cumulative advantage [...] refers to the social process through which various kinds of opportunities](https://img.pdfslide.tips/doc/110x75/5f1b6ac764c7a6690f5135c5/cumulative-advantage-in-online-markets-uni-cumulative-advantage-ca-cumulative.jpg)