Embed Size (px)
Citation preview
←文字上 /上から 70mm
←文字上 /下から 70mm
←文字上 /下から 95mm
←文字上 /上から 75mm
JRGE
14-067
REPUBLIC OF THE PHILIPPINESDEPARTMENT OF PUBLIC WORKSAND HIGHWAYS
REPUBLIC OF THE PHILIPPINES
PREPARATORY SURVEY FOR FLOOD RISKMANAGEMENT PROJECT FOR
CAGAYAN DE ORO RIVER (FRIMP-CDOR)
FINAL REPORT
VOLUME - IEXECUTIVE SUMMARY
FOR DISCLOSURE
MARCH 2014
JAPAN INTERNATIONAL COOPERATION AGENCY
NIPPON KOEI CO., LTD.CTI Engineering International Co., Ltd.
PASCO Corporation
REPUBLIC OF TH
E PHILIPPINES
PREPARATORY SURVEY FO
R FLOO
D RISK MANAG
EMENT PRO
JECTFO
R CAGAYAN DE O
RO RIVER (FRIM
P-CDOR)
MARCH
2014VO
LUME - I
EXECUTIVE SUMM
ARY/FOR DISCLO
SUREFINAL REPO
RT
CR(3)GE
14-068
REPUBLIC OF THE PHILIPPINESDEPARTMENT OF PUBLIC WORKSAND HIGHWAYS
REPUBLIC OF THE PHILIPPINES
PREPARATORY SURVEY FOR FLOOD RISKMANAGEMENT PROJECT FOR
CAGAYAN DE ORO RIVER (FRIMP-CDOR)
FINAL REPORT
VOLUME - IEXECUTIVE SUMMARY
MARCH 2014
JAPAN INTERNATIONAL COOPERATION AGENCY
NIPPON KOEI CO., LTD.CTI Engineering International Co., Ltd.
PASCO Corporation
REPUBLIC OF TH
E PHILIPPINES
PREPARATORY SURVEY FO
R FLOO
D RISK MANAG
EMENT PRO
JECTFO
R CAGAYAN DE O
RO RIVER (FRIM
P-CDOR)
MARCH
2014VO
LUME - I
EXECUTIVE SUMM
ARYFINAL REPO
RT
CR(3)GE
14-068
REPUBLIC OF THE PHILIPPINESDEPARTMENT OF PUBLIC WORKSAND HIGHWAYS
REPUBLIC OF THE PHILIPPINES
PREPARATORY SURVEY FOR FLOOD RISKMANAGEMENT PROJECT FOR
CAGAYAN DE ORO RIVER (FRIMP-CDOR)
FINAL REPORT
VOLUME - IIMAIN REPORT
MARCH 2014
JAPAN INTERNATIONAL COOPERATION AGENCY
NIPPON KOEI CO., LTD.CTI Engineering International Co., Ltd.
PASCO Corporation
REPUBLIC OF TH
E PHILIPPINES
PREPARATORY SURVEY FO
R FLOO
D RISK MANAG
EMENT PRO
JECTFO
R CAGAYAN DE O
RO RIVER (FRIM
P-CDOR)
MARCH
2014VO
LUME - II
MAIN REPO
RTFINAL REPO
RT
CR(3)GE
14-068
REPUBLIC OF THE PHILIPPINESDEPARTMENT OF PUBLIC WORKSAND HIGHWAYS
REPUBLIC OF THE PHILIPPINES
PREPARATORY SURVEY FOR FLOOD RISKMANAGEMENT PROJECT FOR
CAGAYAN DE ORO RIVER (FRIMP-CDOR)
FINAL REPORT
VOLUME - IIISUPPORTING REPORT (I)
MARCH 2014
JAPAN INTERNATIONAL COOPERATION AGENCY
NIPPON KOEI CO., LTD.CTI Engineering International Co., Ltd.
PASCO Corporation
REPUBLIC OF TH
E PHILIPPINES
PREPARATORY SURVEY FO
R FLOO
D RISK MANAG
EMENT PRO
JECTFO
R CAGAYAN DE O
RO RIVER (FRIM
P-CDOR)
MARCH
2014VO
LUME -III
SUPPORTING
REPORT (I )
FINAL REPORT
CR(3)GE
14-068
REPUBLIC OF THE PHILIPPINESDEPARTMENT OF PUBLIC WORKSAND HIGHWAYS
REPUBLIC OF THE PHILIPPINES
PREPARATORY SURVEY FOR FLOOD RISKMANAGEMENT PROJECT FOR
CAGAYAN DE ORO RIVER (FRIMP-CDOR)
FINAL REPORT
VOLUME - IVSUPPORTING REPORT (II)
MARCH 2014
JAPAN INTERNATIONAL COOPERATION AGENCY
NIPPON KOEI CO., LTD.CTI Engineering International Co., Ltd.
PASCO Corporation
REPUBLIC OF TH
E PHILIPPINES
PREPARATORY SURVEY FO
R FLOO
D RISK MANAG
EMENT PRO
JECTFO
R CAGAYAN DE O
RO RIVER (FRIM
P-CDOR)
MARCH
2014VO
LUME -IV
SUPPORTING
REPORT (II )
FINAL REPORT
JREI
14-112
The Project on IntegratedUrban Development Master Plan
for the City of Nairobiin the Republic of Kenya
December 2014
Technical Support FromJapan International Cooperation Agency (JICA)
Nippon Koei Co., Ltd.IDCJ Inc.EJEC Inc.
Final Report
Part II: The Master Plan
Nairobi City County(NCC)
JR(先)
環境
14-065
フィリピン共和国公共事業道路省
フィリピン共和国
洪水リスク管理事業(カガヤン・デ・オロ川)
準備調査
最終報告書
要 約(先行公表版)
平成 26 年 3 月
(2014年)
独立行政法人国際協力機構(JICA)
日本工営株式会社株式会社建設技研インターナショナル
株式会社パスコ
独立行政法人
国際協力機構
フィリピン共和国
洪水リスク管理事業(カガヤン・デ・オロ川)準備調査
最終報告書
要約(先行公表版)
CR(3)
環境
14-066
フィリピン共和国公共事業道路省
フィリピン共和国
洪水リスク管理事業(カガヤン・デ・オロ川)
準備調査
最終報告書
要 約
平成 26 年 3 月
(2014年)
独立行政法人国際協力機構(JICA)
日本工営株式会社株式会社建設技研インターナショナル
株式会社パスコ
独立行政法人
国際協力機構
フィリピン共和国
洪水リスク管理事業(カガヤン・デ・オロ川)準備調査
最終報告書
要約
CR(3)
環境
14-066
フィリピン共和国公共事業道路省
フィリピン共和国
洪水リスク管理事業(カガヤン・デ・オロ川)
準備調査
最終報告書
主報告書
平成 26 年 3 月
(2014年)
独立行政法人国際協力機構(JICA)
日本工営株式会社株式会社建設技研インターナショナル
株式会社パスコ
独立行政法人
国際協力機構
フィリピン共和国
洪水リスク管理事業(カガヤン・デ・オロ川)準備調査
最終報告書
主報告書

←文字上 /上から 70mm
←文字上 /下から 70mm
←文字上 /下から 95mm
←文字上 /上から 75mm
JRGE
14-067
REPUBLIC OF THE PHILIPPINESDEPARTMENT OF PUBLIC WORKSAND HIGHWAYS
REPUBLIC OF THE PHILIPPINES
PREPARATORY SURVEY FOR FLOOD RISKMANAGEMENT PROJECT FOR
CAGAYAN DE ORO RIVER (FRIMP-CDOR)
FINAL REPORT
VOLUME - IEXECUTIVE SUMMARY
FOR DISCLOSURE
MARCH 2014
JAPAN INTERNATIONAL COOPERATION AGENCY
NIPPON KOEI CO., LTD.CTI Engineering International Co., Ltd.
PASCO Corporation
REPUBLIC OF TH
E PHILIPPINES
PREPARATORY SURVEY FO
R FLOO
D RISK MANAG
EMENT PRO
JECTFO
R CAGAYAN DE O
RO RIVER (FRIM
P-CDOR)
MARCH
2014VO
LUME - I
EXECUTIVE SUMM
ARY/FOR DISCLO
SUREFINAL REPO
RT
CR(3)GE
14-068
REPUBLIC OF THE PHILIPPINESDEPARTMENT OF PUBLIC WORKSAND HIGHWAYS
REPUBLIC OF THE PHILIPPINES
PREPARATORY SURVEY FOR FLOOD RISKMANAGEMENT PROJECT FOR
CAGAYAN DE ORO RIVER (FRIMP-CDOR)
FINAL REPORT
VOLUME - IEXECUTIVE SUMMARY
MARCH 2014
JAPAN INTERNATIONAL COOPERATION AGENCY
NIPPON KOEI CO., LTD.CTI Engineering International Co., Ltd.
PASCO Corporation
REPUBLIC OF TH
E PHILIPPINES
PREPARATORY SURVEY FO
R FLOO
D RISK MANAG
EMENT PRO
JECTFO
R CAGAYAN DE O
RO RIVER (FRIM
P-CDOR)
MARCH
2014VO
LUME - I
EXECUTIVE SUMM
ARYFINAL REPO
RT
CR(3)GE
14-068
REPUBLIC OF THE PHILIPPINESDEPARTMENT OF PUBLIC WORKSAND HIGHWAYS
REPUBLIC OF THE PHILIPPINES
PREPARATORY SURVEY FOR FLOOD RISKMANAGEMENT PROJECT FOR
CAGAYAN DE ORO RIVER (FRIMP-CDOR)
FINAL REPORT
VOLUME - IIMAIN REPORT
MARCH 2014
JAPAN INTERNATIONAL COOPERATION AGENCY
NIPPON KOEI CO., LTD.CTI Engineering International Co., Ltd.
PASCO Corporation
REPUBLIC OF TH
E PHILIPPINES
PREPARATORY SURVEY FO
R FLOO
D RISK MANAG
EMENT PRO
JECTFO
R CAGAYAN DE O
RO RIVER (FRIM
P-CDOR)
MARCH
2014VO
LUME - II
MAIN REPO
RTFINAL REPO
RT
CR(3)GE
14-068
REPUBLIC OF THE PHILIPPINESDEPARTMENT OF PUBLIC WORKSAND HIGHWAYS
REPUBLIC OF THE PHILIPPINES
PREPARATORY SURVEY FOR FLOOD RISKMANAGEMENT PROJECT FOR
CAGAYAN DE ORO RIVER (FRIMP-CDOR)
FINAL REPORT
VOLUME - IIISUPPORTING REPORT (I)
MARCH 2014
JAPAN INTERNATIONAL COOPERATION AGENCY
NIPPON KOEI CO., LTD.CTI Engineering International Co., Ltd.
PASCO Corporation
REPUBLIC OF TH
E PHILIPPINES
PREPARATORY SURVEY FO
R FLOO
D RISK MANAG
EMENT PRO
JECTFO
R CAGAYAN DE O
RO RIVER (FRIM
P-CDOR)
MARCH
2014VO
LUME -III
SUPPORTING
REPORT (I )
FINAL REPORT
CR(3)GE
14-068
REPUBLIC OF THE PHILIPPINESDEPARTMENT OF PUBLIC WORKSAND HIGHWAYS
REPUBLIC OF THE PHILIPPINES
PREPARATORY SURVEY FOR FLOOD RISKMANAGEMENT PROJECT FOR
CAGAYAN DE ORO RIVER (FRIMP-CDOR)
FINAL REPORT
VOLUME - IVSUPPORTING REPORT (II)
MARCH 2014
JAPAN INTERNATIONAL COOPERATION AGENCY
NIPPON KOEI CO., LTD.CTI Engineering International Co., Ltd.
PASCO Corporation
REPUBLIC OF TH
E PHILIPPINES
PREPARATORY SURVEY FO
R FLOO
D RISK MANAG
EMENT PRO
JECTFO
R CAGAYAN DE O
RO RIVER (FRIM
P-CDOR)
MARCH
2014VO
LUME -IV
SUPPORTING
REPORT (II )
FINAL REPORT
The Project on IntegratedUrban Development Master Plan
for the City of Nairobiin the Republic of Kenya
December 2014
Technical Support FromJapan International Cooperation Agency (JICA)
Nippon Koei Co., Ltd.IDCJ Inc.EJEC Inc.
Final Report
Part II: The Master Plan
Nairobi City County(NCC)
JR(先)
環境
14-065
フィリピン共和国公共事業道路省
フィリピン共和国
洪水リスク管理事業(カガヤン・デ・オロ川)
準備調査
最終報告書
要 約(先行公表版)
平成 26 年 3 月
(2014年)
独立行政法人国際協力機構(JICA)
日本工営株式会社株式会社建設技研インターナショナル
株式会社パスコ
独立行政法人
国際協力機構
フィリピン共和国
洪水リスク管理事業(カガヤン・デ・オロ川)準備調査
最終報告書
要約(先行公表版)
CR(3)
環境
14-066
フィリピン共和国公共事業道路省
フィリピン共和国
洪水リスク管理事業(カガヤン・デ・オロ川)
準備調査
最終報告書
要 約
平成 26 年 3 月
(2014年)
独立行政法人国際協力機構(JICA)
日本工営株式会社株式会社建設技研インターナショナル
株式会社パスコ
独立行政法人
国際協力機構
フィリピン共和国
洪水リスク管理事業(カガヤン・デ・オロ川)準備調査
最終報告書
要約
CR(3)
環境
14-066
フィリピン共和国公共事業道路省
フィリピン共和国
洪水リスク管理事業(カガヤン・デ・オロ川)
準備調査
最終報告書
主報告書
平成 26 年 3 月
(2014年)
独立行政法人国際協力機構(JICA)
日本工営株式会社株式会社建設技研インターナショナル
株式会社パスコ
独立行政法人
国際協力機構
フィリピン共和国
洪水リスク管理事業(カガヤン・デ・オロ川)準備調査
最終報告書
主報告書

CONVERSION RATE (AT JULY 2014)
source:JICA HP
1 KES = 1.180 JPY, 1 JPY = 0.847 KES
1 USD = 103.41 JPY, 1 JPY = 0.0967 USD

LOCATION MAP

The Project on Integrated Urban Development Master Plan for the City of Nairobi in the Republic of Kenya
Nippon Koei Co., Ltd. i Final Report IDCJ Inc. EJEC Inc.
The Project on Integrated Urban Development Master Plan for the City of Nairobi in the Republic of Kenya
Final Report
LOCATION MAP EXECUTIVE SUMMARY TABLE OF CONTENTS LIST OF TABLES LIST OF FIGURES ABBREVIATIONS
TABLE OF CONTENTS Page
PART-I : The Current Conditions CHAPTER 1 BACKGROUND AND OBJECTIVE .............................................................. 1-1
1.1 Background 1-1
1.2 Outline of the Project 1-1
1.3 Project Area 1-2
1.4 Organisational Arrangements 1-3
1.4.1 Overall Organisational Arrangements 1-3
1.4.2 Individual Organisational Arrangements 1-4
1.4.3 List of Members for JCC, Thematic Working Group, and Secretariat 1-12
CHAPTER 2 SOCIOECONOMIC AND URBAN CONDITIONS ..................................... 2-1
2.1 Review of Current Natural and Socioeconomic Conditions 2-1
2.1.1 Current Natural Conditions 2-1
2.1.2 Population and Demography 2-2
2.1.3 Socioeconomy 2-7
2.1.4 Current Environmental Status of Nairobi City 2-20
2.2 Review of Urban Conditions 2-26
2.2.1 Analysis of Present Land Use 2-26
2.2.2 Urban Services 2-31
CHAPTER 3 INSTITUTION AND REGULATORY CONDITIONS ................................. 3-1 3.1 Review of Related Laws and Regulations 3-1
3.1.1 Urban Planning 3-1
3.1.2 Environment 3-12
3.1.3 Economy and Investment 3-14
3.1.4 Infrastructure 3-16
3.2 Roles and Tasks of Related Organisations 3-24

The Project on Integrated Urban Development Master Plan for the City of Nairobi in the Republic of Kenya
Nippon Koei Co., Ltd. ii Final Report IDCJ Inc. EJEC Inc.
3.2.1 Urban Planning 3-24
3.2.2 Environment 3-27
3.2.3 Economy and Investment 3-28
3.2.4 Infrastructure 3-31
3.3 Review of Existing Urban Master Plans 3-35
3.3.1 History of Nairobi 3-35
3.3.2 Urban Planning History of Nairobi 3-36
3.3.3 Nairobi City Development Ordinances and Zones 3-42
3.3.4 Strategy and Spatial Planning Concept for Nairobi Metropolitan Region 3-44
3.4 Human Resources Development 3-53
3.4.1 Introduction 3-53
CHAPTER 4 INFRASTRUCTURE CONDITION AND DONOR ACTIVITIES ............. 4-1
4.1 Review of Related Projects by the Development Partners 4-1
4.1.1 Multi-Sector Programme 4-1
4.1.2 Urban Transport 4-4
4.1.3 Railway 4-13
4.1.4 Airport 4-15
4.1.5 Water Supply 4-18
4.1.6 Stormwater Drainage and Sewerage 4-20
4.1.7 Power Supply 4-25
4.1.8 Solid Waste Management (SWM) 4-26
4.1.9 Telecommunications 4-27
4.2 Review of Current Infrastructure Conditions 4-28
4.2.1 Urban Transport 4-28
4.2.2 Railway 4-36
4.2.3 Airport 4-41
4.2.4 Water Supply 4-44
4.2.5 Stormwater Drainage and Sewerage 4-49
4.2.6 Power Supply 4-54
4.2.7 Solid Waste Management (SWM) 4-63
4.2.8 Telecommunications 4-70
CHAPTER 5 CONSTRAINTS AND PLANNING ISSUES ................................................. 5-1
5.1 Overview of Constraints and Planning Issues 5-1
5.2 Issues of the 1973 Nairobi Strategic Plan 5-4
5.3 Sector Constraints and Planning Issues 5-5
5.3.1 Constraints and Planning Issues for Land Use and Settlements 5-5
5.3.2 Constraints and Planning Issues for Urban Transport 5-7

The Project on Integrated Urban Development Master Plan for the City of Nairobi in the Republic of Kenya
Nippon Koei Co., Ltd. iii Final Report IDCJ Inc. EJEC Inc.
5.3.3 Constraints and Planning Issues for Infrastructure 5-10
5.3.4 Constraints and Planning Issues for Governance and Institution 5-19
5.3.5 Constraints and Planning Issues for Socioeconomy 5-20
5.3.6 Constraints and Planning Issues for Environment 5-21
PART-II : The Master Plan CHAPTER 6 DEVELOPMENT VISION, STRUCTURE PLAN, AND LAND USE
PLAN ............................................................................................................... 6-1 6.1 Socioeconomic Framework 6-1
6.1.1 Future Population of Kenya, Nairobi City and its Environs 6-1
6.1.2 Future Day-time Population of Nairobi City 6-5
6.1.3 Future Gross Domestic Product (GDP) per Capita of Kenya and Nairobi City6-7
6.2 Development Visions 6-7
6.2.1 Development Vision Formulation Procedure 6-7
6.2.2 Development Visions in the Related Plans and Strategies 6-8
6.2.3 Stakeholder Discussions on Development Vision 6-10
6.2.4 Vision for NCC 2030 6-12
6.3 Proposal and Discussion of Alternative Structure Plans 6-12
6.3.1 Structure Plan Formulation Procedure 6-12
6.3.2 Discussion of Alternative Prototypes of Structure Plans 6-13
6.3.3 Stakeholder Discussions on Structure Plan 6-14
6.3.4 Proposed Structure Plan 6-15
6.4 Formulation of Land Use Policy 6-17
6.4.1 Present Land Use and Buildings 6-17
6.4.2 Demand for Land Use 6-18
6.4.3 Urban Characteristics and Zonal Considerations 6-22
6.4.4 Principal Policy for Land Use Plan 2030 6-26
6.4.5 Central Business District Development 6-29
6.4.6 Sub-centres Development Concept 6-38
6.4.7 Priority Projects 6-50
CHAPTER 7 URBAN TRANSPORT DEVELOPMENT PLAN ......................................... 7-1 7.1 Urban Transport 7-1
7.1.1 General 7-1
7.1.2 Outline of Traffic Surveys 7-2
7.1.3 Zoning and Survey Points 7-3
7.1.4 Person Trip Survey 7-8
7.1.5 Formulation of Future Transport Demand 7-13
7.1.6 Formulation of Future Transport Network 7-16

The Project on Integrated Urban Development Master Plan for the City of Nairobi in the Republic of Kenya
Nippon Koei Co., Ltd. iv Final Report IDCJ Inc. EJEC Inc.
7.1.7 Ideas for Additional Priority Project for Urban Transport 7-47
7.2 Railway 7-52
7.2.1 Demand and Gap Analysis 7-52
7.2.2 Development Policy 7-52
7.2.3 Priority Projects 7-53
CHAPTER 8 URBAN INFRASTRUCTURE DEVELOPMENT STRATEGY ................. 8-1 8.1 Water Supply 8-1
8.1.1 Demand and Gap Analysis 8-1
8.1.2 Development Policy 8-8
8.1.3 Priority Project 8-9
8.2 Stormwater Drainage and Sewerage 8-11
8.2.1 Demand and Gap Analysis 8-11
8.2.2 Development Policy 8-20
8.2.3 Priority Projects 8-20
8.3 Power Supply 8-25
8.3.1 Demand and Gap Analysis 8-25
8.3.2 Development Policy 8-34
8.3.3 Priority Projects 8-34
8.4 Solid Waste Management 8-38
8.4.1 Demand and Gap Analysis 8-38
8.4.2 Development Policy 8-42
8.4.3 Priority Projects 8-45
8.5 Telecommunications 8-52
8.5.1 Demand and Gap Analysis 8-52
8.5.2 Development Policy 8-56
8.5.3 Priority Projects 8-57
CHAPTER 9 CROSS-CUTTING ISSUES ............................................................................ 9-1 9.1 Governance and Institution 9-1
9.1.1 Policy and Strategy for Institutions 9-1
9.1.2 Capacity Development Plan 9-4
9.1.3 Priority Projects 9-10
9.2 Industrial Development 9-11
9.2.1 Industrial Development Vision of Kenya for 2030 9-11
9.2.2 Industrial Development of Nairobi towards 2030 9-13
9.2.3 Prospects of Industrial Development in the Environs 9-29
9.2.4 Required Policy Measures and Expected Functions of Nairobi City County 9-30
9.3 Urban Facilities 9-32

The Project on Integrated Urban Development Master Plan for the City of Nairobi in the Republic of Kenya
Nippon Koei Co., Ltd. v Final Report IDCJ Inc. EJEC Inc.
9.3.1 Demand and Gap Analysis 9-32
9.3.2 Development Policy 9-37
9.4 Geographic Information System (GIS) 9-38
9.4.1 Background of the Issues 9-38
9.4.2 Situation of Nairobi’s GIS 9-38
9.4.3 Current Status of the GIS Data under the NIUPLAN 9-42
9.4.4 Current Status of Database under the NIUPLAN 9-45
9.4.5 The Management Proposal of GIS Data 9-47
9.4.6 Management Proposal of an Integrated GIS 9-48
9.4.7 Management Proposal for an Open Policy on GIS Data 9-49
CHAPTER 10 SOCIAL AND ENVIRONMENTAL CONSIDERATIONS ........................ 10-1 10.1 Social and Environmental Considerations for Master Plan Formulation 10-1
10.1.1 Basic Policy for Social and Environmental Considerations for Nairobi
Integrated Urban Development Master Plan (NIUPLAN) 10-1
10.1.2 Requirement of the Strategic Environmental Assessment (SEA) 10-1
10.1.3 Framework of SEA Study for NIUPLAN 10-2
10.2 SEA (Fundamental Version) 10-3
10.2.1 Development of the Terms of Reference reflecting the SEA Guideline 10-3
10.2.2 NCC Internal Preparatory Meeting 10-5
10.2.3 Preliminary Stakeholder Meeting 10-5
10.3 County Government Act and Public Participation 10-6
10.3.1 Development of Terms of Reference Reflecting the County Government Act 10-6
10.3.2 Public Advertisement 10-7
10.3.3 Public Meeting 10-8
10.3.4 Website Management 10-9
10.3.5 Civic Education 10-10
10.3.6 Civic Education 10-13
10.4 Analysis on Planning Alternatives (Structure Plan) 10-14
10.5 Integration of Public Comments in the Master Plan 10-18
10.6 Priority Project for Urban Environmental Sector 10-21
CHAPTER 11 PRIORITY PROGRAMS OF NIUPLAN ..................................................... 11-1 11.1 Justification of Priority Programs 11-1
11.2 Urban Development Program 11-3
11.2.1 CBD development program 11-4
11.2.2 Sub-centre Development Program (priority area) 11-6
11.2.3 Eastlands Urban Renewal Project 11-6
11.3 Urban Transport Development Program 11-7

The Project on Integrated Urban Development Master Plan for the City of Nairobi in the Republic of Kenya
Nippon Koei Co., Ltd. vi Final Report IDCJ Inc. EJEC Inc.
11.3.1 Road network development program 11-7
11.3.2 Public transport development program 11-10
11.3.3 Intelligent Transport System Development Program 11-12
11.4 Infrastructure Development Program 11-13
11.4.1 Water Supply 11-13
11.4.2 Power 11-14
11.4.3 Telecommunications 11-14
11.5 Environment Improvement Program 11-15
11.5.1 Storm water drainage and sewerage 11-15
11.5.2 Solid waste management 11-16
11.5.3 City-wide Air Quality Management Program 11-18
11.6 Urban Development Management Strengthening Program 11-18
CHAPTER 12 CONCLUSION AND RECOMMENDATION FOR IMPLEMENTATION OF THE MASTER PLAN ....................................... 12-1
12.1 Conclusion 12-1
12.2 Recommendation 12-1
PART-III: Appendix
APPENDIX 1 CONTRACT AND MINUTES OF MEETING FOR INCEPTION MEETING
APPENDIX 2 REVIEW OF URBAN DEVELOPMENT IN NEIGHBORING COUNTRIES
APPENDIX 3 RESULTS OF TRAFFIC SURVEYS
APPENDIX 4 FORMULATION OF FUTURE TRANSPORT DEMAND
APPENDIX 5 PROGRESS OF ROAD DEVELOPMENT AFTER 2006
APPENDIX 6 STRATEGIC ENVIRONMENTAL ASSESSMENT
APPENDIX 7 TYPICAL CROSS SECTION

The Project on Integrated Urban Development Master Plan for the City of Nairobi in the Republic of Kenya
Nippon Koei Co., Ltd. vii Final Report IDCJ Inc. EJEC Inc.
LIST OF FIGURES
Figure 1.3.1 Location Map ......................................................................................................... 1-2
Figure 1.3.2 Greater Nairobi Boundary ...................................................................................... 1-3
Figure 1.4.1 Project Organisational Chart Based on 1st RD ...................................................... 1-4
Figure 1.4.2 Project Organisation Chart based on the Revised RD ........................................... 1-4
Figure 1.4.3 Tiers of Discussion Structure ................................................................................. 1-5
Figure 2.1.1 Rainfall and Temperature in Nairobi City .............................................................. 2-2
Figure 2.1.2 Population Density per Hectare of Nairobi City in 2009 ....................................... 2-3
Figure 2.1.3 Average Annual Population Growth Rate of Nairobi City and its Environs in
Greater Nairobi from 1999 to 2009 (%) ......................................................... 2-3
Figure 2.1.4 Age Structure of the Population of Kenya Showing Nairobi in 2009 .................... 2-4
Figure 2.1.5 Age Structure of the Population of Nairobi in 2009 .............................................. 2-4
Figure 2.1.6 Nairobi City’s Age Structure Shifted by Ten Years from 1999 and Corresponding
Actual Population in 2009 .............................................................................. 2-5
Figure 2.1.7 Percentage of Households of Ownership by Household Assets ............................. 2-7
Figure 2.1.8 Share of Individuals below Poverty Line ............................................................... 2-8
Figure 2.1.9 Households by Main Source of Water and District ................................................ 2-9
Figure 2.1.10 Households by Main Mode of Human Waste Disposal and District .................... 2-9
Figure 2.1.11 Households by Main Type of Lighting Fuel and District ..................................... 2-10
Figure 2.1.12 Percentage of Households by Ownership of Household Assets and District ....... 2-10
Figure 2.1.13 Population and GNI per Capita in 2011 ............................................................... 2-11
Figure 2.1.14 Wage Employment by Industry in 2011 (Provisional) ......................................... 2-13
Figure 2.1.15 Estimated Distribution of Employees of Business Establishments Registered in
NCC ............................................................................................................... 2-14
Figure 2.1.16 Comparison of GDP per Capita and Typical Labour Cost ................................... 2-15
Figure 2.1.17 Gap Structure of Industries of Nairobi City ......................................................... 2-16
Figure 2.1.18 Doing Business Ranks of Kenya in 185 Economies in 2013 ............................... 2-19
Figure 2.1.19 Creation of Urban Wind Path through Design of Sustainable Urban Land Use
Pattern ............................................................................................................ 2-25
Figure 2.2.1 Land Use Map Done by Columbia University and Nairobi University ................. 2-27
Figure 2.2.2 Satellite Image of Ridgeways Area ........................................................................ 2-27
Figure 2.2.3 Satellite Image of Kasarani, Dandora Area ............................................................ 2-28
Figure 2.2.4 Satellite Image of Kilimani Area ........................................................................... 2-28
Figure 2.2.5 Satellite Image of Eastleigh South to Uhuru Estate ............................................... 2-28
Figure 2.2.6 Typical Development Pattern ................................................................................. 2-30
Figure 3.1.1 Structure of Concerned Laws and Plans ................................................................ 3-2
Figure 3.1.2 Land Control Scheme ............................................................................................ 3-10
Figure 3.2.1 Organisation Chart of NCC (Old System) ............................................................. 3-25
Figure 3.2.2 NCC Land, Housing, and Physical Planning Sector Organogram (tentative) ....... 3-26
Figure 3.3.1 First Plan of Nairobi City by A. F. Church in 1898 ............................................... 3-37

The Project on Integrated Urban Development Master Plan for the City of Nairobi in the Republic of Kenya
Nippon Koei Co., Ltd. viii Final Report IDCJ Inc. EJEC Inc.
Figure 3.3.2 Plan for Settler Capital in 1927 .............................................................................. 3-38
Figure 3.3.3 Master Plan for a Colonial Capital in 1948 ............................................................ 3-39
Figure 3.3.4 Recommended Distribution of Population in 2000 ................................................ 3-40
Figure 3.3.5 Nairobi Metropolitan Growth Strategy 1973 ......................................................... 3-42
Figure 3.3.6 Zone Map by JST ................................................................................................... 3-43
Figure 3.3.7 Hill Area Zoning Plan ............................................................................................ 3-43
Figure 3.3.8 Proposed Urban Settlements Pattern ...................................................................... 3-48
Figure 3.3.9 Location of New Town .......................................................................................... 3-48
Figure 3.3.10 Development Pattern, Settlement/Build Up 2009 and 2030 ................................ 3-50
Figure 3.3.11 CBD of Nairobi City County ............................................................................... 3-52
Figure 3.3.12 CBD and Its Linkage to Railway, Upper Hills ..................................................... 3-52
Figure 3.4.1 Relevance of Capacity Development Method ....................................................... 3-55
Figure 3.4.2 Capacity Development Issues ................................................................................ 3-59
Figure 3.4.3 Comparison between Non-Specific Target Groups and Specific Target Groups ... 3-60
Figure 4.1.1 Location of Study Sections for A104 ..................................................................... 4-5
Figure 4.1.2 Typical Cross Section JKIA – Haile Selassie Section ............................................ 4-5
Figure 4.1.3 Typical Cross Section from Just Before Haile Selassie Junction to Just After the
University Way Junction ................................................................................ 4-6
Figure 4.1.4 Typical Cross Section James Gichuru Junction – Uthiru Section and Gitaru -
Rironi Section ................................................................................................ 4-6
Figure 4.1.5 Proposed Stations in NRS-Ruiru Section ............................................................... 4-7
Figure 4.1.6 Proposed Stations in NRS-Kikuyu Section ............................................................ 4-7
Figure 4.1.7 Nairobi-Thika Highway Improvement Project Location Map ............................... 4-8
Figure 4.1.8 MRTS Corridors..................................................................................................... 4-10
Figure 4.1.9 Road Network in the Urban Area (Nairobi City) in 2005 ...................................... 4-11
Figure 4.1.10 Automated Ticket Gate (left) High Platform Construction (right) .................... 4-14
Figure 4.1.11 Proposed Standard Gauge Railway Corridor from Nairobi to Dagoretti (Blue
Line) ............................................................................................................... 4-15
Figure 4.2.1 Road Network in Nairobi City ............................................................................... 4-31
Figure 4.2.2 Number of Lanes of Existing Roads ...................................................................... 4-33
Figure 4.2.3 Road Length Density by Area of the Target Road Network .................................. 4-34
Figure 4.2.4 Road Length Density by Population of the Target Road Network ......................... 4-34
Figure 4.2.5 Comparison of Travel Mode by Trip Purpose between 2004 Survey and 2013
Survey ............................................................................................................ 4-36
Figure 4.2.6 Existing Track Condition (left), Existing Ruiru Station (right) .......................... 4-36
Figure 4.2.7 KRC Existing and Planned Lines........................................................................ 4-37
Figure 4.2.8 Horizontal and Vertical Alignment of MRT on Thika Road .................................. 4-38
Figure 4.2.9 Horizontal and Vertical Alignments of MRT on Juja Road ................................... 4-39
Figure 4.2.10 Horizontal and Vertical Alignments of LRT on Jogoo Road ............................... 4-39
Figure 4.2.11 Horizontal and Vertical Alignments of MRT on Ngong Road ............................. 4-40
Figure 4.2.12 Horizontal and Vertical Alignments of LRT on the Outer Ring Road ................. 4-40
Figure 4.2.13 Horizontal and Vertical Alignments of LRT on the Waiyaki Way ....................... 4-41
Figure 4.2.14 Locations of JKIA and Wilson Airport ................................................................ 4-42
The Project on Integrated Urban Development Master Plan for the City of Nairobi in the Republic of Kenya
Nippon Koei Co., Ltd. ix Final Report IDCJ Inc. EJEC Inc.
Figure 4.2.15 View of JKIA Terminal Area from Control Tower ............................................... 4-43
Figure 4.2.16 View of Wilson Airport Airlines Hangar and Taxiway from Control Tower ....... 4-44
Figure 4.2.17 Outline of Map of Water Supply to Nairobi City ................................................. 4-46
Figure 4.2.18 General Layout of the Zones ................................................................................ 4-48
Figure 4.2.19 Power Sector in Kenya ......................................................................................... 4-55
Figure 4.2.20 Classification of Power Plants by Installed Capacity .......................................... 4-57
Figure 4.2.21 Incidences per 1,000 Customers as of 29 April 2013 .......................................... 4-59
Figure 4.2.22 Countermeasure for Vandalism ............................................................................ 4-59
Figure 4.2.23 Demand Forecast from 2010 to 2031 ................................................................... 4-61
Figure 4.2.24 Least Cost Expansion Plan and Peak Demand ..................................................... 4-62
Figure 4.2.25 Solid Waste Flow in Nairobi City (2009) ............................................................ 4-63
Figure 4.2.26 Facilities Related to Solid Waste Management .................................................... 4-63
Figure 4.2.27 Organisation Structure of Department of Environment ....................................... 4-64
Figure 4.2.28 Physical Composition of Waste in Nairobi City .................................................. 4-65
Figure 4.2.29 Number of Fixed and Mobile Users in Kenya ..................................................... 4-71
Figure 4.2.30 Proportion of Fixed and Mobile Telephones in Kenya ........................................ 4-71
Figure 4.2.31 NOFBI Coverage ................................................................................................. 4-75
Figure 4.2.32 Percentage of Mobile Subscriptions Among Four Countries ............................... 4-78
Figure 4.2.33 Percentage of Individual Internet Use Among Four Countries ............................ 4-78
Figure 4.2.34 Percentage of Fixed Telephone Subscriptions Among Four Countries ................ 4-79
Figure 4.2.35 Penetration Ratio of Mobile Subscriptions in Kenya Compared Globally .......... 4-79
Figure 4.2.36 Penetration Ratio of Individual Internet Use in Kenya Compared Globally ....... 4-79
Figure 4.2.37 Penetration Ratio of Fixed Telephone Subscriptions in Kenya Compared
Globally .......................................................................................................... 4-80
Figure 4.2.38 Percentage of Household with Radio and Television Among Four Countries ..... 4-80
Figure 4.2.39 Price of Mobile Broadband Services, Early 2013 ................................................ 4-82
Figure 5.1.1 Urban Planning Issues in Nairobi City .................................................................. 5-2
Figure 5.1.2 Urban Transport Issues in Nairobi City ................................................................. 5-3
Figure 5.1.3 Socioeconomic Issues in Nairobi City ................................................................... 5-4
Figure 5.3.1 Existing Passenger Train Operation by RVR (left), Sample Photo of DMU (right) 5-9
Figure 5.3.2 Preliminary Identified Issues through the First Survey (Power Supply) ............... 5-15
Figure 5.3.3 Preliminary Identified Issues (Solid Waste Management) ..................................... 5-15
Figure 5.3.4 Pull-based and Push-based Information Dissemination ......................................... 5-16
Figure 5.3.5 Constraints and Planning Issues for Telecommunications ..................................... 5-18
Figure 6.1.1 Estimation of Population of Kenya ........................................................................ 6-1
Figure 6.1.2 Alternative Scenarios of Population Estimation of Nairobi City ........................... 6-2
Figure 6.1.3 Area and Population Density of Selected Cities .................................................... 6-4
Figure 6.2.1 Proposed Vision for NCC 2030 ............................................................................. 6-12
Figure 6.3.1 Discussion Results ................................................................................................. 6-14
Figure 6.3.2 Sub Centre System (Bi-polar Corridor Development) ........................................ 6-14
Figure 6.3.3 Road Network and Nodes ...................................................................................... 6-15
Figure 6.3.4 Railway and Road Transit Interchange .................................................................. 6-16
Figure 6.3.5 Proposed Structure Plan for Nairobi ...................................................................... 6-17

The Project on Integrated Urban Development Master Plan for the City of Nairobi in the Republic of Kenya
Nippon Koei Co., Ltd. x Final Report IDCJ Inc. EJEC Inc.
Figure 6.4.1 Current Land Use ................................................................................................... 6-18
Figure 6.4.2 Land Availability in Some Areas ........................................................................... 6-21
Figure 6.4.3 Cross-sectional Profile of Nairobi City .................................................................. 6-22
Figure 6.4.4 Basic Urban Character ........................................................................................... 6-22
Figure 6.4.5 Land Availability in Some Areas ........................................................................... 6-23
Figure 6.4.6 CBD and Sub-centres ............................................................................................. 6-27
Figure 6.4.7 Ecological Environment in Nairobi City ............................................................... 6-28
Figure 6.4.8 Industrial Land Use Restructuring ......................................................................... 6-28
Figure 6.4.9 Boundaries of the CBDs ........................................................................................ 6-29
Figure 6.4.10 Survey Area (Expanded CBD without Railway City) ......................................... 6-30
Figure 6.4.11 Floor Use Distribution ......................................................................................... 6-31
Figure 6.4.12 Consumed Plot Ratio of Each Zone in the Expanded CBD ................................. 6-32
Figure 6.4.13 Low-utilised Open-air Parking and Roadside Parking in the CBD ..................... 6-34
Figure 6.4.14 Development Vision of CBD ............................................................................... 6-35
Figure 6.4.15 Area of the Greater CBD ...................................................................................... 6-36
Figure 6.4.16 Road Network of the Greater CBD ...................................................................... 6-36
Figure 6.4.17 Land Use Concept of the Greater CBD ............................................................... 6-37
Figure 6.4.18 Spatial Development Plan for the Greater CBD .................................................. 6-38
Figure 6.4.19 Key Issues in Upper Hill South ........................................................................... 6-40
Figure 6.4.20 Proposed Urban Function Structure in Upper Hill South .................................... 6-41
Figure 6.4.21 Key Issues in Karen-Langata ............................................................................... 6-42
Figure 6.4.22 Proposed Urban Function Structure in Karen-Langata ........................................ 6-42
Figure 6.4.23 Key Issues in Runda-Ruaka ................................................................................. 6-43
Figure 6.4.24 Proposed Urban Function Structure in Runda-Ruaka .......................................... 6-44
Figure 6.4.25 Key Issues in Dandora ......................................................................................... 6-44
Figure 6.4.26 Suitable Land for Development in Dandora ........................................................ 6-45
Figure 6.4.27 Proposed Urban Function Structure in Dandora .................................................. 6-45
Figure 6.4.28 Key Issues in Imara-Daima .................................................................................. 6-46
Figure 6.4.29 Proposed Urban Function Structure in Imara-Daima ........................................... 6-47
Figure 6.4.30 Key Issues in Makadara ....................................................................................... 6-48
Figure 6.4.31 Proposed Urban Function Structure in Makadara ................................................ 6-48
Figure 6.4.32 Key Issues in Kasarani ......................................................................................... 6-49
Figure 6.4.33 Key Issues in Ruai ............................................................................................... 6-50
Figure 6.4.34 Development Image of Railway City................................................................... 6-51
Figure 6.4.35 Implementation Framework for the Railway City Project ................................... 6-51
Figure 6.4.36 Conversion of the Development Right................................................................. 6-52
Figure 7.1.1 Procedure for Urban Transport Development Plan ................................................ 7-1
Figure 7.1.2 Traffic Survey Schedule ......................................................................................... 7-3
Figure 7.1.3 Zone Map Inside the City of Nairobi ..................................................................... 7-4
Figure 7.1.4 Zone Map Around the City of Nairobi ................................................................... 7-4
Figure 7.1.5 Zone Map Outside the City of Nairobi .................................................................. 7-5
Figure 7.1.6 Traffic Survey Point in Nairobi Urban Area .......................................................... 7-6
Figure 7.1.7 Traffic Survey Point in Nairobi Urbanised Area .................................................... 7-6

The Project on Integrated Urban Development Master Plan for the City of Nairobi in the Republic of Kenya
Nippon Koei Co., Ltd. xi Final Report IDCJ Inc. EJEC Inc.
Figure 7.1.8 Location of Public Transport User Survey ............................................................. 7-7
Figure 7.1.9 Routes of Travel Speed Survey .............................................................................. 7-7
Figure 7.1.10 Trip Rate per Person by Car Ownership .............................................................. 7-9
Figure 7.1.11 Trip Rate per Person by Occupation .................................................................... 7-9
Figure 7.1.12 Comparison of Trip Rate between 2004 and 2013 ............................................... 7-9
Figure 7.1.13 Trip Generation by Trip Purpose in 2004 and 2013 ............................................. 7-10
Figure 7.1.14 Person Trip Movement in a Wider Area in 2004 and 2013 .................................. 7-10
Figure 7.1.15 Person Trip Desire Line inside Nairobi City in 2004 ........................................... 7-11
Figure 7.1.16 Person Trip Desire Line inside Nairobi City in 2013 ........................................... 7-11
Figure 7.1.17 Travel Mode Composition by Trip Purpose ......................................................... 7-12
Figure 7.1.18 Comparison of Number of Trips by Travel Mode between 2013 and 2004 ......... 7-12
Figure 7.1.19 Comparison of Composition of Travel Mode between 2013 and 2004 ............... 7-12
Figure 7.1.20 Flow of Four-Step Method ................................................................................... 7-13
Figure 7.1.21 Vehicle Assignment Result in “Existing Case” (2013) ........................................ 7-15
Figure 7.1.22 Vehicle Assignment Result in “Do-Nothing Case” (2030) .................................. 7-15
Figure 7.1.23 Recommended Road Development by the 2006 M/P (NUTRANS) .................... 7-18
Figure 7.1.24 Progress of Road Development after 2006 M/P .................................................. 7-19
Figure 7.1.25 Future Road Network (2030) ............................................................................... 7-20
Figure 7.1.26 Classification of Future Road Network (2030) .................................................... 7-21
Figure 7.1.27 Railway Network in Alternative 2 ....................................................................... 7-25
Figure 7.1.28 Public Transport Network in Alternative 3 .......................................................... 7-30
Figure 7.1.29 Vehicle Assignment Result of Alternative 0 in 2030 ........................................... 7-31
Figure 7.1.30 Railway Passenger Assignment Result of Alternative 2 in 2030 ......................... 7-31
Figure 7.1.31 Vehicle Assignment Result of Alternative 3 in 2030 ........................................... 7-32
Figure 7.1.32 Public Transport (Railway, BRT, and LRT) Passenger Assignment Result of
Alternative 3 in 2030 ...................................................................................... 7-32
Figure 7.1.33 Modal Share by Alternative Cases in 2030 .......................................................... 7-33
Figure 7.1.34 Road Length Distribution by VCR in Nairobi City ............................................. 7-34
Figure 7.1.35 Road Network in the Short Term (2018) .............................................................. 7-37
Figure 7.1.36 Road Network in the Medium Term (2023) ......................................................... 7-38
Figure 7.1.37 Public Transport Network in the Medium Term (2023) ....................................... 7-39
Figure 7.1.38 Road Network in the Long Term (2030) .............................................................. 7-40
Figure 7.1.39 Public Transport Network in the Long Term (2030) ............................................ 7-40
Figure 7.1.40 Vehicle Assignment Result of Short-term Plan in 2018 ....................................... 7-41
Figure 7.1.41 Vehicle Assignment Result of Medium-term Plan in 2023 .................................. 7-42
Figure 7.1.42 Public Transport (Railway and BRT) Passenger Assignment Result of
Medium-term Plan in 2023 ............................................................................ 7-42
Figure 7.1.43 Vehicle Assignment Result of Long-term Plan in 2030 ....................................... 7-43
Figure 7.1.44 Public Transport (Railway, BRT and LRT) Passenger Assignment Result of
Long-term Plan in 2030 ................................................................................. 7-43
Figure 7.1.45 Modal Share in the Short, Medium and Long Terms ........................................... 7-44
Figure 7.1.46 Road Length Distribution by VCR in the Short, Medium, and Long Terms
Nairobi City.................................................................................................... 7-45

The Project on Integrated Urban Development Master Plan for the City of Nairobi in the Republic of Kenya
Nippon Koei Co., Ltd. xii Final Report IDCJ Inc. EJEC Inc.
Figure 7.1.47 Routes of Viaduct-1 and Viaduct-2 ...................................................................... 7-48
Figure 7.1.48 Route of Widening of Enterprise Road ................................................................ 7-49
Figure 7.1.49 Supposed Route of Northern Part of Circumferential Road C-2 ......................... 7-50
Figure 7.1.50 Project Area for Creation of ITS City .................................................................. 7-51
Figure 7.2.1 Commuter Train Operation by RVR ...................................................................... 7-52
Figure 7.2.2 Planned MRTS Corridors ....................................................................................... 7-53
Figure 7.2.3 Existing KRL Lines and Planned MRT/LRT Lines ............................................... 7-54
Figure 7.2.4 Loop Line circulating CBD and Sub-centres ......................................................... 7-55
Figure 8.1.1 General Layout of the Existing and Planned Facilities .......................................... 8-6
Figure 8.1.2 Comparison between Water Demand and Capacity of Water Supply .................... 8-7
Figure 8.2.1 River and Localised Drainage Network ................................................................. 8-13
Figure 8.2.2 Comparison of Population Projections .................................................................. 8-13
Figure 8.2.3 Comparison of Water Demand Projections ............................................................ 8-14
Figure 8.2.4 Comparison of Sewerage Generation Estimates .................................................... 8-14
Figure 8.2.5 Comparison of Required Sewerage Treatment Capacity Estimates ....................... 8-15
Figure 8.2.6 Development of Sewerage Treatment Works ......................................................... 8-16
Figure 8.2.7 Planned Development of the Dandora Estate STW ............................................... 8-16
Figure 8.2.8 Existing and Planned Development of Trunk Sewers ............................................ 8-18
Figure 8.2.9 Estimate of Present Sewerage Generation, Collection and Conveyance ............... 8-19
Figure 8.3.1 Demand Forecast of Kenya by 2030 ...................................................................... 8-26
Figure 8.3.2 Demand Forecast of NCC Compared with the Project and LCPDP ...................... 8-27
Figure 8.3.3 Land around the Dandora Railway Station ............................................................ 8-28
Figure 8.3.4 Definition of Wayleaves ......................................................................................... 8-29
Figure 8.3.5 Comparison of Wayleaves between Kenya and Japan ........................................... 8-29
Figure 8.3.6 Comparison of Side Clearance ............................................................................... 8-30
Figure 8.3.7 GIS Data of Kenya Power ...................................................................................... 8-32
Figure 8.3.8 Combination of GIS Data of Kenya Power and JST.............................................. 8-33
Figure 8.3.9 Data of Power Facilities in Embakasi .................................................................... 8-33
Figure 8.3.10 Current Wayleaves of Transmission Lines ........................................................... 8-36
Figure 8.3.11 The Latest LCPDP ............................................................................................... 8-36
Figure 8.3.12 Proposed Industry Area along Kangundo Road in Dandora ................................ 8-37
Figure 8.4.1 Waste Generation Project based on Population ...................................................... 8-38
Figure 8.4.2 Map of Each Collection Zone ................................................................................ 8-39
Figure 8.4.3 Estimated Solid Waste Projection .......................................................................... 8-39
Figure 8.4.4 Estimated Solid Waste Projection .......................................................................... 8-41
Figure 8.4.5 Estimated Solid Waste Projection in 2023 ............................................................. 8-42
Figure 8.4.6 Estimated Solid Waste Projection in 2030 ............................................................. 8-42
Figure 8.4.7 Candidate Sites of New Landfill Site and Restriction Areas ................................. 8-47
Figure 8.4.8 Image of a Cell Method Operation ........................................................................ 8-47
Figure 8.4.9 Image of Landfill Operation Options ..................................................................... 8-47
Figure 8.4.10 Layout Plan of Decommissioning of the Dandora Dump Site ............................. 8-48
Figure 8.4.11 Image of the Operation of MRF ........................................................................... 8-49
Figure 8.4.12 Collection Zone and Proposed Four Areas for the Transportation System .......... 8-50
The Project on Integrated Urban Development Master Plan for the City of Nairobi in the Republic of Kenya
Nippon Koei Co., Ltd. xiii Final Report IDCJ Inc. EJEC Inc.
Figure 8.4.13 Proposed Collection Methods and Equipment ..................................................... 8-51
Figure 8.4.14 Image of Future Institutional System for Solid Waste Management ................... 8-52
Figure 8.5.1 Mobile Phone Penetration Ratio of African Countries .......................................... 8-53
Figure 8.5.2 Penetration of Internet Use of Developed Countries ............................................. 8-54
Figure 8.5.3 Penetration of Internet Use of Nordic Countries ................................................... 8-54
Figure 8.5.4 International Communication Bandwidth Capacity Demand ................................ 8-55
Figure 8.5.5 Conceptual Diagram of the Telecommunications Network ................................... 8-58
Figure 8.5.6 Network Construction Plan .................................................................................... 8-58
Figure 8.5.7 Network Construction Plan .................................................................................... 8-60
Figure 8.5.8 Conceptual Diagram of a Dedicated Government Network for Government
Offices ............................................................................................................ 8-61
Figure 8.5.9 Conceptual Diagram of the Disaster Information Gathering and Dissemination
System ............................................................................................................ 8-62
Figure 8.5.10 Cyber Security ..................................................................................................... 8-63
Figure 8.5.11 Upgraded National Addressing System ............................................................... 8-65
Figure 8.5.12 Framework on Construction Supervision and Maintenance Works ..................... 8-67
Figure 9.1.1 Institutional Framework to be Developed .............................................................. 9-1
Figure 9.1.2 Overview of the Development Control Mechanism .............................................. 9-2
Figure 9.1.3 Image of the Land Readjustment Project ............................................................... 9-3
Figure 9.1.4 Framework of Capacity Development Plan ........................................................... 9-5
Figure 9.1.5 Relation between Goal and Approaches of Capacity Development Plan .............. 9-7
Figure 9.2.1 Correspondence between Priorities of Kenya and Nairobi City ............................ 9-15
Figure 9.2.2 Expected Structure of the Industries of Nairobi in 2030 ........................................ 9-16
Figure 9.2.3 Expected Scenario of Employment Distribution by Type of Industry ................... 9-17
Figure 9.2.4 Market Locations ................................................................................................... 9-21
Figure 9.2.5 School Locations .................................................................................................... 9-25
Figure 9.2.6 Location-specific Agenda for Industrial and Tourism Development ..................... 9-28
Figure 9.2.7 District Demarcation in the Environs of Nairobi City within Greater Nairobi ...... 9-29
Figure 9.3.1 Map Showing Shortage of Primary Schools .......................................................... 9-33
Figure 9.3.2 Map Showing Shortage of Secondary Schools in Nairobi ..................................... 9-34
Figure 9.3.3 Map Showing Distribution of Universities in Nairobi City ................................... 9-35
Figure 9.3.4 Map Showing the Proposed Fire Stations .............................................................. 9-36
Figure 9.3.5 Map Showing Shortage of Community Facilities .................................................. 9-37
Figure 9.4.1 Difference in the Satellite Image ........................................................................... 9-39
Figure 9.4.2 Topographic GIS Map (1:5000) ............................................................................. 9-40
Figure 9.4.3 Census Map 2009 ................................................................................................... 9-41
Figure 9.4.4 Land Use Map from the Columbia University ....................................................... 9-41
Figure 9.4.5 Cadastral Map (held by NCC) ............................................................................... 9-42
Figure 9.4.6 Aerial Photos of Nairobi City ................................................................................ 9-43
Figure 9.4.7 Fair Consistency between the Imagery and Land Use, Buildings, Roads Shape
File ................................................................................................................. 9-44
Figure 9.4.8 Land Use Map ........................................................................................................ 9-45
Figure 9.4.9 Image of an Integrated GIS .................................................................................... 9-48
The Project on Integrated Urban Development Master Plan for the City of Nairobi in the Republic of Kenya
Nippon Koei Co., Ltd. xiv Final Report IDCJ Inc. EJEC Inc.
Figure 9.4.10 Cooperation with External Organisations(Data Sharing) ............................... 9-49
Figure 9.4.11 Image of an Open-type GIS ................................................................................. 9-50
Figure 10.1.1 SEA Implementation Framework......................................................................... 10-2
Figure 10.3.1 Photo Records of SEA Stakeholder Validation Workshop ................................... 10-9
Figure 10.3.2 Website Architecture ............................................................................................ 10-11
Figure 10.3.3 Front Page of the Website of NIUPLAN ............................................................. 10-11
Figure 10.3.4 Monthly Website Number of Visits ...................................................................... 10-13
Figure 10.3.5 Photo Records of the Civic Education Program .................................................. 10-13
Figure 10.3.6 Number of Daily Visitors during the Civic Education ......................................... 10-14
Figure 11.1.1 Priority Program Structure ............................................................................. 11-2

The Project on Integrated Urban Development Master Plan for the City of Nairobi in the Republic of Kenya
Nippon Koei Co., Ltd. xv Final Report IDCJ Inc. EJEC Inc.
LIST OF TABLES
Table 1.3.1 Greater Nairobi (Division List) ............................................................................... 1-3
Table 1.4.1 JCC Meeting Record ............................................................................................... 1-5
Table 1.4.2 Thematic Working Group ........................................................................................ 1-6
Table 1.4.3 Technical Working Group Meeting Record ............................................................. 1-6
Table 1.4.4 Secretariat Meeting Record ..................................................................................... 1-12
Table 1.4.5 JCC Members .......................................................................................................... 1-13
Table 1.4.6 NIUPLAN Secretariat ............................................................................................. 1-13
Table 1.4.7 Technical Working Group Members ........................................................................ 1-14
Table 2.1.1 Population, Area, and Density of Nairobi City and its Environs in 2009 ................ 2-2
Table 2.1.2 Distribution of Enrolment of Primary Schools, Pre-Schools, Special Units, and
Secondary Schools in Nairobi City by Division in 2012 (Preliminary) ......... 2-6
Table 2.1.3 Position of Nairobi City in Comparison with Kenya ............................................... 2-7
Table 2.1.4 References and their Implications ........................................................................ 2-8
Table 2.1.5 Definitions of the Four Districts in Nairobi City According to 2009 Census .......... 2-9
Table 2.1.6 GDP Shares in 2011 (Provisional) ........................................................................... 2-12
Table 2.1.7 Real GDP Growth Rates in 2011 (Provisional) ....................................................... 2-12
Table 2.1.8 Shares in Export in 2011 (Provisional) .................................................................... 2-12
Table 2.1.9 Growth Rates in Export in 2011 (Provisional) ........................................................ 2-12
Table 2.1.10 General Issues and Directions for Improvement of Industries in Nairobi City ..... 2-14
Table 2.1.11 Some Causes for Lack of Public Safety and Candidate Measures ........................ 2-16
Table 2.1.12 Gini Index of Selected Countries ........................................................................... 2-17
Table 2.1.13 Doing Business Ranks of Kenya in 185 Economies in 2013 ................................ 2-20
Table 2.1.14 Environmental Issues of Nairobi City ................................................................... 2-21
Table 2.1.15 Top Ten Major Causes of Mortality in Nairobi City (1998- 2000) ........................ 2-24
Table 2.2.1 Land Use by Land Hold in Nairobi City ................................................................. 2-26
Table 2.2.2 Land Use Composition ......................................................................................... 2-26
Table 2.2.3 Number of Schools and Students in Primary Schools in Nairobi City, 2012 .......... 2-31
Table 2.2.4 Percentage of Type of Schools by District in Nairobi City, 2012 ............................ 2-31
Table 2.2.5 Type of Health Care Providers Preferred by Sick Population in Nairobi City ........ 2-32
Table 2.2.6 Number of Major Health Facilities by District ........................................................ 2-32
Table 2.2.7 Beds/1,000 People for All Health Facilities by District .......................................... 2-32
Table 2.2.8 Stadiums and Sport Facilities .................................................................................. 2-33
Table 2.2.9 Public Playgrounds .................................................................................................. 2-33
Table 2.2.10 Community Centres by District and Capacity ....................................................... 2-33
Table 2.2.11 Types and Capacity of City Council Markets by Ward .......................................... 2-34
Table 3.1.1 Management of Urban Development ...................................................................... 3-3
Table 3.1.2 Maximum Permissible Noise Levels (Leq) ............................................................. 3-13
Table 3.2.1 Ministries Related to Urban Planning (Old Structure) ............................................ 3-24
Table 3.2.2 Ministries Related to Urban Planning (New Structure) ........................................... 3-24
Table 3.2.3 Tasks of Sections in the City Planning Department ................................................ 3-26

The Project on Integrated Urban Development Master Plan for the City of Nairobi in the Republic of Kenya
Nippon Koei Co., Ltd. xvi Final Report IDCJ Inc. EJEC Inc.
Table 3.3.1 Historical Population Change of Nairobi City ......................................................... 3-36
Table 3.3.2 Part of Nairobi City Development Ordinances and Zones ...................................... 3-44
Table 3.3.3 Delineation of the Nairobi Metro Boundary ............................................................ 3-45
Table 3.3.4 Population of NMR ................................................................................................. 3-47
Table 3.3.5 Settlement Hierarchy of NMR ................................................................................. 3-47
Table 3.3.6 List of New Towns Proposed ................................................................................... 3-49
Table 3.3.7 Proposed Land Use Classification ........................................................................... 3-50
Table 3.3.8 Proposed Urban Land Use Classification for NMR and Distribution for NCC ...... 3-51
Table 3.4.1 Number of Officials and Training Needs ................................................................. 3-54
Table 3.4.2 Number of Employee in City Planning Dept. CCN ................................................ 3-54
Table 3.4.3 Critical Skills Identified in Sample Survey ............................................................. 3-55
Table 3.4.4 Overview of Capacity Assessment Results.............................................................. 3-56
Table 3.4.5 Strong and Weak Category of Skills by Section ...................................................... 3-57
Table 3.4.6 Strong and Weak Skills by Section .......................................................................... 3-57
Table 3.4.7 Fundamental Skills to be Acquired .......................................................................... 3-61
Table 4.1.1 Studies Conducted on A104 by KeNHA ................................................................. 4-5
Table 4.1.2 Results of Economic Evaluation .............................................................................. 4-10
Table 4.1.3 Staging Plan Proposed in the Master Plan and its Current Progress ....................... 4-12
Table 4.1.4 Chinese Assistance on Road Development in Nairobi City .................................... 4-13
Table 4.1.5 Ongoing Projects Relevant to Infrastructure Development for Stormwater
Drainage and Sewerage in Nairobi City ......................................................... 4-20
Table 4.1.6 Major Infrastructure Developments for Wastewater and Sanitation Facilities
in Nairobi City under the WaSSIP ................................................................. 4-21
Table 4.1.7 Major Ongoing Infrastructure Developments in Nairobi City under the Sewerage
Improvement Project ...................................................................................... 4-25
Table 4.1.8 Power Sector Projects .............................................................................................. 4-25
Table 4.2.1 Summary of Road Classification in Kenya Road Classification Manual ................ 4-29
Table 4.2.2 Classified Roads in Nairobi City and Their Functions ............................................ 4-30
Table 4.2.3 Major Facilities of JKIA .......................................................................................... 4-42
Table 4.2.4 Major Facilities of Wilson Airport ........................................................................... 4-43
Table 4.2.5 Existing Water Resources of Water Supply for Nairobi City .................................. 4-44
Table 4.2.6 Existing Facilities of Sasumua System .................................................................... 4-45
Table 4.2.7 Existing Facilities of Ruiru System ......................................................................... 4-45
Table 4.2.8 Existing Facilities of Mwagu System ...................................................................... 4-45
Table 4.2.9 Existing Facilities of Kikuyu System ...................................................................... 4-45
Table 4.2.10 Zones of the Distribution System in Nairobi City ................................................. 4-46
Table 4.2.11 Operating Conditions of Existing Major STPs in Nairobi City ............................. 4-52
Table 4.2.12 Power Demand and Supply in Kenya .................................................................... 4-56
Table 4.2.13 Power Demand and Supply in Nairobi Region...................................................... 4-56
Table 4.2.14 Sales for Type of Customers Covered by Tariff .................................................... 4-57
Table 4.2.15 Power-generating Facilities ................................................................................... 4-58
Table 4.2.16 Daily Monitoring of Blackout Incidence ............................................................... 4-59
Table 4.2.17 Underground Cable Projects .................................................................................. 4-59

The Project on Integrated Urban Development Master Plan for the City of Nairobi in the Republic of Kenya
Nippon Koei Co., Ltd. xvii Final Report IDCJ Inc. EJEC Inc.
Table 4.2.18 Retail Electricity Tariff Structure .......................................................................... 4-60
Table 4.2.19 Number of Staff in Each Section ........................................................................... 4-64
Table 4.2.20 Amount of Waste Generation ................................................................................. 4-65
Table 4.2.21 Collection System in Nairobi City ......................................................................... 4-66
Table 4.2.22 Collected Waste in Nairobi City ............................................................................ 4-66
Table 4.2.23 Amount of Recyclables .......................................................................................... 4-67
Table 4.2.24 Dumping Sites in Nairobi City .............................................................................. 4-68
Table 4.2.25 Financial Condition of CCN and DOE .................................................................. 4-69
Table 4.2.26 Subscriptions of Internet Users .............................................................................. 4-72
Table 4.2.27 Subscriptions of Broadband Services .................................................................... 4-72
Table 4.2.28 Penetration Ratio of Telecommunications in Nairobi City and the Provinces ...... 4-72
Table 4.2.29 Major Operators ..................................................................................................... 4-73
Table 4.2.30 Number of Licensed Postal and Courier Operators ............................................... 4-74
Table 4.2.31 Number of ICT Equipment and Computer Users .................................................. 4-75
Table 4.2.32 Minimum Broadband Speed .................................................................................. 4-76
Table 4.2.33 Broadband Penetration Targets .............................................................................. 4-77
Table 4.2.34 Key Outputs and Outcomes ................................................................................... 4-77
Table 4.2.35 Number of Licensed Postal and Courier Operators Among Four Countries ......... 4-81
Table 5.3.1 Major Telecommunications Indicators .................................................................... 5-16
Table 6.1.1 Alternative Scenarios of Population Estimation of Nairobi City ............................. 6-3
Table 6.1.2 Comparison of Nairobi City’s Annual Average Growth Rate and Population
Density in 2030 .............................................................................................. 6-4
Table 6.1.3 Estimation of Cross-border Commuters in 2013 ..................................................... 6-6
Table 6.1.4 Estimation of Employees and Jobs in Nairobi City ................................................. 6-6
Table 6.1.5 Estimation of Day-time Population in Nairobi City ................................................ 6-7
Table 6.1.6 Alternative Cases of Future GDP per Capita of Kenya and Nairobi City ............... 6-7
Table 6.3.1 Comparison of Types of Structure Plan ................................................................... 6-13
Table 6.4.1 Conditions for Capacity Estimation ........................................................................ 6-19
Table 6.4.2 Employment Estimation for 2030 ............................................................................ 6-19
Table 6.4.3 Zonal Considerations of Large Land Occupants ..................................................... 6-21
Table 6.4.4 Obstacle Lands for Urban Planning ......................................................................... 6-23
Table 6.4.5 Zonal Considerations ............................................................................................... 6-24
Table 6.4.6 Principal Policy for Nairobi Land Use Plan ............................................................ 6-26
Table 6.4.7 GC and PR in the Expanded CBD ........................................................................... 6-31
Table 6.4.8 Comparison between Development Ordinance and Ground Situation .................... 6-32
Table 6.4.9 Remaining Developable Floor Area ........................................................................ 6-32
Table 6.4.10 Estimation of Value at Real Estate Market for Rent in the CBD ........................... 6-33
Table 6.4.11 Estimation of the Number of Parking Spaces in the CBD ..................................... 6-33
Table 6.4.12 Comparison between Japanese and Kenyan Parking Regulation .......................... 6-33
Table 6.4.13 Process of Discussion about Development Visions in Thematic Working Group . 6-34
Table 6.4.14 Priority of Sub-centres Development .................................................................... 6-39
Table 7.1.1 Summary of Traffic Survey ..................................................................................... 7-2
Table 7.1.2 Total Number of Traffic Zones ................................................................................ 7-3

The Project on Integrated Urban Development Master Plan for the City of Nairobi in the Republic of Kenya
Nippon Koei Co., Ltd. xviii Final Report IDCJ Inc. EJEC Inc.
Table 7.1.3 Interview Items in Person Trip Survey .................................................................... 7-8
Table 7.1.4 Increase in Population, Household, and Trip Generation from 2004 to 2013 ......... 7-9
Table 7.1.5 Number of Trips by Trip Purpose by Travel Mode.................................................. 7-12
Table 7.1.6 Primary Indices by Vehicle Assignment Results in Existing Case and Do-Nothing
Case ................................................................................................................ 7-14
Table 7.1.7 Road Classification and Definition .......................................................................... 7-21
Table 7.1.8 Summary of Existing Public Transport Network Plans ........................................... 7-22
Table 7.1.9 Summary of Alternative Cases ................................................................................ 7-23
Table 7.1.10 Evaluation of Priority of MRTS Corridors ............................................................ 7-26
Table 7.1.11 Selection of Mode for MRTS Corridors ................................................................ 7-28
Table 7.1.12 Number of Trips by Mode by Alternative Case in 2030 ........................................ 7-33
Table 7.1.13 Major Indices by Vehicle Traffic Assignment ....................................................... 7-34
Table 7.1.14 Road Length Distribution by VCR in Nairobi City Unit: km ................................ 7-34
Table 7.1.15 Strategy for Staging Plan of Urban Transport Development ................................. 7-35
Table 7.1.16 Road Development Length in the Short Term (2018) ........................................... 7-36
Table 7.1.17 Road Development Length in the Medium Term (2023)....................................... 7-37
Table 7.1.18 Road Development Length in the Long Term ....................................................... 7-39
Table 7.1.19 Number of Trips by Mode in the Short, Medium, and Long Terms ...................... 7-44
Table 7.1.20 Major Indices by Vehicle Traffic Assignment in Nairobi City .............................. 7-44
Table 7.1.21 Road Length Distributions by VCR in the Short, Medium and Long Terms in
Nairobi City.................................................................................................... 7-45
Table 7.2.1 Existing Condition of Planned MRT/LRT Routes ................................................... 7-54
Table 8.1.1 Population Projection of Nairobi City ..................................................................... 8-1
Table 8.1.2 Basis of the Residential Water Demand from the WRMA Guidelines .................... 8-2
Table 8.1.3 Ratio of the High-, Medium-, and Low-Class Housing ........................................... 8-2
Table 8.1.4 Ratio of the High-, Medium-, and Low-class Housing ........................................... 8-2
Table 8.1.5 Residential Unit Demand without Water Loss ........................................................ 8-3
Table 8.1.6 Industrial Demand ................................................................................................... 8-3
Table 8.1.7 Water Demand of Nairobi City ................................................................................ 8-4
Table 8.1.8 Water Demand of FSMPNWS ................................................................................. 8-4
Table 8.1.9 Recommended Water Resources Development Plan of Nairobi City ..................... 8-4
Table 8.1.10 Summary of Demand Projections and Capacity of Water Supply ......................... 8-7
Table 8.2.1 Comparison of Population Projections .................................................................... 8-13
Table 8.2.2 Comparison of Water Demand Projections ............................................................. 8-14
Table 8.2.3 Comparison of Sewerage Generation Estimates ...................................................... 8-14
Table 8.2.4 Comparison of Required Sewerage Treatment Estimates ....................................... 8-15
Table 8.2.5 Summary of Estimated Required Sewerage Treatment Capacity (2030) ................ 8-15
Table 8.2.6 Existing Trunk Sewers (Separated Sewers) in Nairobi City .................................... 8-17
Table 8.2.7 Planned Development of Trunk Sewers under NaRSIP .......................................... 8-17
Table 8.3.1 Demand Forecast of Kenya by 2030 ....................................................................... 8-26
Table 8.3.2 Existing Demand Forecast of LCPDP ..................................................................... 8-27
Table 8.3.3 Project Demand Forecast of NCC and Kenya ......................................................... 8-27
Table 8.3.4 Features of Underground Cable ............................................................................... 8-31
The Project on Integrated Urban Development Master Plan for the City of Nairobi in the Republic of Kenya
Nippon Koei Co., Ltd. xix Final Report IDCJ Inc. EJEC Inc.
Table 8.3.5 Priority Projects ....................................................................................................... 8-35
Table 8.4.1 Projected Population in Each Collection Zone ........................................................ 8-38
Table 8.4.2 Current Situation of Solid Waste Management and its Gaps between Desirable
Situations ........................................................................................................ 8-40
Table 8.4.3 Target Indicators for Future Waste Stream .............................................................. 8-41
Table 8.4.4 Responsibility of Relevant Organisations and Stakeholders ................................... 8-43
Table 8.4.5 Merit and Demerit of Each Technical Option for Treatment and Disposal ............. 8-45
Table 8.4.6 Outline of the New Sanitary Landfill Structure ....................................................... 8-46
Table 8.4.7 Outline of the Decommissioning of the Dandora Dumping Site ............................. 8-48
Table 8.5.1 Penetration Ratio of Developed Countries .............................................................. 8-53
Table 8.5.2 Mobile Telephone Demand ...................................................................................... 8-53
Table 8.5.3 Internet Use Demand ............................................................................................... 8-54
Table 8.5.4 International Communication Bandwidth Capacity Demand .................................. 8-55
Table 8.5.5 Current Operators Who have their Own Infrastructure ........................................... 8-60
Table 8.5.6 Countermeasures against Cyber Security ................................................................ 8-64
Table 8.5.7 Basic ICT Literacy Education ................................................................................. 8-66
Table 8.5.8 Evaluation of the Project ......................................................................................... 8-68
Table 9.1.1 Activities and Methods on Capacity Development ................................................. 9-9
Table 9.1.2 Image of Plan of Operations for Capacity Development Activities (Sample) ......... 9-10
Table 9.2.1 Major Investment Projects of Kenya Vision 2030 ................................................... 9-12
Table 9.2.2 Other Project Proposals related to Kenya Vision 2030 presented by the Kenya
Investment Authority ...................................................................................... 9-12
Table 9.2.3 Expected Scenario of Employment Distribution by Type of Industry ..................... 9-17
Table 9.2.4 Correspondence between Categories in the Person Trip Survey and Industrial
Classification .................................................................................................. 9-18
Table 9.2.5 Number of Primary and Secondary Schools ............................................................ 9-25
Table 9.2.6 Estimation of Population and Employment of the Environs in Greater Nairob ...... 9-30
Table 9.3.1 Number of NCC Health Centres and Dispensaries by District ................................ 9-32
Table 9.3.2 Types and Capacity of City Council Markets by Ward ........................................... 9-32
Table 9.4.1 Contents of the Geodatabase ................................................................................... 9-40
Table 9.4.2 Specifications of the Satellite Imagery (WorldView-2) ........................................... 9-42
Table 10.2.1 Main Tasks of SEA specified by the SEA Guideline of Kenya ............................. 10-3
Table 10.2.2 Three Preparatory Meetings .................................................................................. 10-5
Table 10.2.3 Schedule of 18 Preliminary Stakeholder Meetings ............................................... 10-6
Table 10.2.4 Meeting Program of Preliminary Stakeholder Meeting held at Dagoretti District 10-6
Table 10.3.1 Newly Added Task to Previous SEA ..................................................................... 10-6
Table 10.3.2 Main Tasks of SEA, specified by both SEA Guideline of Kenya and CGA ......... 10-7
Table 10.3.3 Summary of Public Advertisement ........................................................................ 10-7
Table 10.3.4 Summary of the First Stakeholder Meeting (Detailed SEA Study) ....................... 10-8
Table 10.3.5 Summary of the Second Stakeholder Meeting (Selected sectoral group, Detailed
SEA Study) ..................................................................................................... 10-8
Table 10.3.6 Summary of the Third Stakeholder Meeting (Detailed SEA Study)...................... 10-9
Table 10.3.7 Website Operation Policy ...................................................................................... 10-11

The Project on Integrated Urban Development Master Plan for the City of Nairobi in the Republic of Kenya
Nippon Koei Co., Ltd. xx Final Report IDCJ Inc. EJEC Inc.
Table 10.3.8 Summary of Approved Contents for Website Updating ........................................ 10-12
Table 10.3.9 Summary of Website Management Meeting ......................................................... 10-12
Table 10.4.1 Summary of Proposed Development Structure Alternative Plans ......................... 10-14
Table 10.4.2 Evaluation Factors for SEA (draft) ........................................................................ 10-15
Table 10.4.3 Compound Matrix for Selected Development Structure Alternatives ................... 10-16
Table10.4.4 Environmental Risk and Opportunity Matrix for Selected Development Structure
Alternative ...................................................................................................... 10-16
Table 10.5.1 Schedule of NCC’s 23 Public Consultation Meetings ........................................... 10-18
Table 10.5.2 Major NIUPLAN Remarks obtained from Public Consultation (Urban Transport) 10-19
Table 10.5.3 Major NIUPLAN Remarks obtained from Public Consultation (Urban
Infrastructure) ................................................................................................. 10-19
Table 10.5.4 Major NIUPLAN Remarks obtained from Public Consultation (Land Use,
Resettlement, and Social Service) .................................................................. 10-19
Table 10.5.5 Major NIUPLAN Remarks obtained from Public Consultation (Governance,
Legislation, and Institutional Aspects) ........................................................... 10-19
Table 10.5.6 Major NIUPLAN Remarks obtained from Public Consultation (Cross-cutting
Issues) ............................................................................................................ 10-20
Table 11.1.1 List of All Priority Programs ................................................................................. 11-2

The Project on Integrated Urban Development Master Plan for the City of Nairobi in the Republic of Kenya
Nippon Koei Co., Ltd. xxi Final Report IDCJ Inc. EJEC Inc.
ABBREVIATIONS
AAK Architectural Association of KenyaADC Austrian Development CorporationAFD Agence Francaise Developpement (French development agency)AfDB African Development BankAMRF Africa Medical and Research FoundationAPL Adaptable Program LendingASAL Arid and Semi-Arid LandASCAS Accumulated Savings and Credit AssociationsAWSB Athi Water Services BoardBADEA Arab Bank for Economic Development in AfricaBOD Biochemical Oxygen DemandBPO Business Process OutsourcingBPO Business Process Off-shoringBRT Bus Rapid Transit C/R Circumferential/Radial CAA Civil Aviation Authority CBD Central Business DistrictCCK Communications Commission of KenyaCCN City Council of Nairobi CFAs Community Forest AssociationsCGA County Government Act CMA Capital Market AuthorityCOD Chemical Oxygen DemandCOK Constitution of Kenya CPD City Planning DepartmentCSUD Centre of Sustainable Urban DevelopmentCWSB Coast Water Services BoardDANIDA Danish International Development AgencyDC Development Control DCG Donor Coordination GroupDESTW Dandora Estate STW DfID UK Department of International Development DFIs Development Finance InstitutionsDGIS Netherlands Ministry of Foreign Affairs (of Netherland)DID Department of International Development (of UK)DMU Diesel Multiple-Units DOE Department of EnvironmentDRSRS Department of Resource Surveys and Remote SensingDSL Digital Subscriber Line EA Environmental Audit EAC East African CommunityEC European Commission ECM Executive Committee MemberEEPCO Ethiopia Electric Power CorporationEIA Environmental Impact AssessmentEMCA Environment Management Coordination ActEOI Expressions of Interest EPZA Export Processing Zones AuthorityERC Energy Regulation CommissionERSWEC Economic Recovery Strategy for Wealth and Employment CreationEU European Union FAO Food and Agriculture OrganizationFSMPNWS Feasibility Study and Master Plan for Developing New Water Sources for Nairobi and
Satellite Towns GC Gross Coverage Ratio

The Project on Integrated Urban Development Master Plan for the City of Nairobi in the Republic of Kenya
Nippon Koei Co., Ltd. xxii Final Report IDCJ Inc. EJEC Inc.
GCCN Government Common Core NetworkGDC Geothermal Development CompanyGDP Gross National Product GIS Geographical Information SystemGNI Gross National Income GOK Government of Kenya GRDP Gross Regional Domestic ProductHAC Harmonization Alignment and CoordinationICB International Competitive BiddingICT Information Communication TechnologyIDA International Development AssociationIPP Independent Power ProducersITCZ Inter Tropical Convergence ZoneITS Intelligent Transport SystemJCC Joint Coordinating CommitteeJDA Joint Development AgreementJICA Japan International Corporation AgencyJKIA Jomo Kenyatta International AirportJKUAT Jomo Kenyatta University of Agriculture and TechnologyJST JICA Study Team KAA Kenya Airport Authority KAM Kenya Association of ManufacturersKBC Kenya Broadcasting CorporationKCAA Kenya Civil Aviation AuthorityKDN Kenya Data Network KDN Kenya Data Network KEBS Kenya Bureau of StandardsKen Gen Kenya Power Generating CompanyKeNHA Kenya National Highways AuthorityKENIC Kenya Network Information CenterKENSUP Kenya Slum Upgrading ProgramKEPSA Kenya Private Sector AllianceKETRACO Kenya Electricity Transmission CompanyKFS Kenya Forest Service KfW Kreditanstalt für Wiederaufbau (German government-owned development bank) KIA Kenya Investment AuthorityKIE Kenya Industrial Estate LtdKIP Kenya Institute of PlannersKIPI Kenya Industrial Property InstituteKIPPRA Kenya Institute of Public Policy Research an AnalysisKIRDI Kenya Industrial Research and Development InstituteKISIP Kenya Informal Settlements Improvement ProjectKMP Kenya Municipal ProgramKNBS Kenya National Bureau of StatisticsKNCC&I Kenya National Chamber of Commerce and IndustryKPC Kenya Pipeline CorporationKPDA Kenya Property Developers AssociationKPLC Kenya Power and Lighting CompanyKPPRA Kenya Institute of Public Policy Research an AnalysisKPTC Kenya Post and Telecommunication Company’sKRC Kenya Railways CorporationKTB Kenya Tourist Board KTDC Kenya Tourist Development CorporationKURA Kenya Urban Roads AuthorityKWS Kenya Wildlife Service LCPDP Least Cost Power Development PlanLPDP Local Physical Development Plan

The Project on Integrated Urban Development Master Plan for the City of Nairobi in the Republic of Kenya
Nippon Koei Co., Ltd. xxiii Final Report IDCJ Inc. EJEC Inc.
LRT Light Rail Transit MAF Mission Aviation FellowshipMEMR Ministry of Environment and Mineral ResourcesMEWNR Ministry of Environment, Water and Natural ResourcesMFIs Microfinance InstitutionsMLH&UD Ministry of Lands, housing and Urban DevelopmentMNPDV2030 Ministry of National Planning and Vision 2030MODP Ministry of Development and PlanningMOE Ministry of Energy MOE&P Ministry of Energy and PetroleumMOH Ministry of Health MOIC Ministry of Information and CommunicationMOICT Ministry of ICT MOL Ministry of Land MOLG Ministry of Local GovernmentMOLHUD Ministry Of Lands, Housing And Urban Development MONMD Ministry of Nairobi Metropolitan DevelopmentMOPHS Ministry of Public Health and SanitationMOR Ministry of Roads MORPW Ministry of Roads and Public WorksMOTI Ministry of Transport and InfrastructureMOW&I Ministry of Water and IrrigationMRF Material Recovery FacilityMRTS Mass Rapid Transit SystemMSD Medium Speed Diesel MSEA Micro and Small Enterprises AuthorityMSMEs Micro Small and Medium EnterprisesMSL Mean Sea Level MWI Ministry of Water and IrrigationNaMSIP Nairobi Metropolitan Service Improvement ProjectNaRSIP Nairobi Rivers Rehabilitation and Restoration Program: Sewerage Improvement ProjectNASP National Airports System PlanNBS National Broad Band StrategyNCBA Nairobi County Business AssociationNCBDA Nairobi Central Business District AssociationNCC Nairobi City County NCWSC Nairobi City Water and Sewerage CompanyNEMA National Environment Management AuthorityNES National Environment SecretariatNESC Nairobi City Water and Sewerage CompanyNHC National Housing CorporationNIUPLAN Nairobi Integrated Urban Development Master PlanNMR Nairobi Metropolitan RegionNMT Non-Motorized TransportNOFBI National Optic Fiber Backbone InfrastructureNRS Nairobi Rail Station NSSF National Social Security FundNTSA National Transport and Safety AuthorityNUTRANS The Study on Master Plan for Urban Transport in the Nairobi Metropolitan Area in the
Republic of Kenya, March 2006NUTRIP National Urban Transport Improvement ProjectO&M Operation and MaintenanceOD Origin Destination OJT On-the-Job Training OPM Office of the Prime MinisterPCU Passenger Car Unit PDF Project Demand Forecast

The Project on Integrated Urban Development Master Plan for the City of Nairobi in the Republic of Kenya
Nippon Koei Co., Ltd. xxiv Final Report IDCJ Inc. EJEC Inc.
PDP Project Development PlanPHPDT Peak Hour Peak Direction TrafficPID Project Information DocumentPIDG Private Infrastructure Development Group TrustPIS Policy Implementation SectionPMU Project Management UnitPPCSCA Permanent Presidential Commission on Soil Conservation and Afforestation PPP Public-Private PartnershipPR Plot Ratio PS Permanent Secretary PSP Private Service Provider PT Person Trip PVSs Public Service Vehicles QCBS Quality- and Cost-Based SelectionRD Record of Discussion REA Rural Electricity AuthorityRFC Regional Financial CentreROSCAs Rotating Savings and Credit AssociationsROW Right of Way RTA Research Triangle AfricaRVR Rift Valley Railways SACCOs Savings and Credit Cooperative SocietiesSEA Strategic Environmental AssessmentSECE Swiss State Secretariat for Foreign AffairsSHM Stakeholder Meetings SIDA Swedish International Development CooperationSMEs Small and Medium EnterprisesSOK Survey of Kenya SSL Salary Scale Level STI Science, technology and innovation STP Sewerage Treatment PlantSTRADA System for Traffic Demand AnalysisSTW Sewerage Treatment WorkSWM Solid Waste ManagementSWPC Solid Waste Public CorporationTOD Transit Oriented Development TSS Total Suspended Solids TWG Technical Working GroupUfW Unaccounted for Water UNDP United Nations Development ProgrammeUNEP United Nations Environment ProgrammeUN-HABITAT United Nations Human Settlements ProgrammeUNHCR Office of the United Nations High Commissioner for RefugeesUON University of Nairobi USAID United States Agency for International DevelopmentVCR Vehicle Capacity Ratio VRC Volume Capacity Ratio WASP Wien Automatic Simulation PackageWaSSIP Water and Sanitation Service Improvement ProjectWATSAN Kibera Integrated Water, Sanitation and Waste Management ProjectWB World Bank WRMA Water Resources Management AuthorityWSB Water Service Board WSP Water Service Providers WSRB Water Service Regulatory BoardWTP Water Treatment Plant WVK World Vision Kenya

The Project on Integrated Urban Development Master Plan for the City of Nairobi in the Republic of Kenya
Nippon Koei Co., Ltd. 6-1 Final Report
IDCJ Inc.
EJEC Inc.
CHAPTER6 DEVELOPMENT VISION, STRUCTURE PLAN, AND LAND USE PLAN
6.1 Socioeconomic Framework
6.1.1 Future Population of Kenya, Nairobi City and its Environs
The populations of Nairobi City, Kenya and its environs are projected for the target year of 2030 as well as the intermediate years of 2013, 2018, and 2023.
(1) Future Population of Kenya
1) Alternative Scenarios
Three alternative scenarios are prepared as follows:
i) Past Trend Scenario In this scenario, it is assumed that the average annual growth rate during 1999-2009, which is 3.0%, will be unchanged until 2030. Then, the population of Kenya will exceed 70 million before the target year.
ii) Rapidly Decelerating Scenario toward a Middle Income Country
In this scenario, it is assumed that the population growth rate will drop to the average level of the low income countries (2.1%) from 2009 and to an average level of the lower middle income countries (1.6%) from 2018. Then, the population of Kenya in the target year will be 56 million.
iii) Gradually Decelerating Scenario
In this scenario, it is assumed that the population growth will gradually decelerate from 3.0% to 2.3% toward 2030. Then, the population of Kenya in the target year will be 66 million.
0
10
20
30
40
50
60
70
80
1960 1970 1980 1990 2000 2010 2020 2030
mill
ion
Past trend
Rapid deceleration
Gradual deceleration
Sources: Kenya Census 2009, World Development Indicators website (2013), and the
JICA Study Team (JST) Figure 6.1.1 Estimation of Population of Kenya
2) Recommended Scenario
The “Gradually Decelerating Scenario” is recommended for the following reasons:

The Project on Integrated Urban Development Master Plan for the City of Nairobi in the Republic of Kenya
Nippon Koei Co., Ltd. 6-2 Final Report
IDCJ Inc.
EJEC Inc.
(i) The projection coincides with the projection in the World Population Prospects 2011 by the United Nations (66 million in 2030).
(ii) It is between the Past Trend Scenario and the Rapidly Decelerating Scenario. (iii) The birth rate seems to be lowering but the life expectancy will be extended, and
there is no indication of sudden deceleration of the population growth.
(2) Future Population of Nairobi City and its Environs
1) Alternative Scenarios
The population growth of Greater Nairobi has been considerably higher than that of Kenya. Within Greater Nairobi, Nairobi City was growing faster in the 1990s than its environs, then in the 2000s, conversely, the environs were growing faster. Considering the past trends and future development ideas of the area, five alternative scenarios are defined as follows:
Case 1 1999-2009 Growth Rate Scenario
This scenario adopts the latest growth rates of the city (3.9% per year) and the environs (4.1% per year) for the whole period until the target year of 2030.
Case 2 Decelerating City Population Scenario
This scenario assumes that the population growth of the city will gradually decrease from 3.9% per year to 2.7% per year toward 2030, while the environs will keep the past high growth rate at 4.1%.
Case 3 Containing City Population Scenario
This scenario assumes a rather contained population growth of Nairobi City as in the fourth scenario and the past trend of the environs’ population growth at 4.1% per year.
Case 4 Nairobi Metropolitan Development Scenario
In this scenario, the population forecast for 2030 of the “Spatial Planning Concept for Nairobi Metropolitan Region” (2013) is assumed. The 2030 population of the city is contained to 5,212,500 according to the plan. Part of the forecast population for the Nairobi Metropolitan Region falls into the Greater Nairobi outside the city and that is counted as the population of the environs within Greater Nairobi.
Case 5 Aggressively Containing City Population Scenario
This scenario assumes an aggressive containment of the population growth in Nairobi City so that the population should not exceed 4.5 million in 2030. Outside of the city, this scenario assumes the forecast population of the fourth scenario.
The following figures summarise the outcomes of the scenarios.
0
1
2
3
4
5
6
7
8
1960 1970 1980 1990 2000 2010 2020 2030
mill
ion
Case 1
Case 2
Cases 3 and 4
Case 5
City without migration
Sources: Kenya Censuses 1989, 1999 and 2009, Spatial Planning Concept for Nairobi Metropolitan
Region 2013, and the JICA Study Team (JST) Figure 6.1.2 Alternative Scenarios of Population Estimation of Nairobi City

The Project on Integrated Urban Development Master Plan for the City of Nairobi in the Republic of Kenya
Nippon Koei Co., Ltd. 6-3 Final Report
IDCJ Inc.
EJEC Inc.
Table 6.1.1 Alternative Scenarios of Population Estimation of Nairobi City Unit: number of people, %: percentage of annual growth rate
Census Data Estimates Annual Growth
Rate 2009-2030
(%)
(2030 pop.)/ (2009 pop.)
Pop. - City
Without Migration
in 2030 Year 1989 1999 2009 2013 2018 2023 2030
Kenya 21,448,047 28,686,607 38,610,097 43,300,000 49,500,000 56,000,000 65,600,000 2.6 1.7 % 3.4 3.0 3.0 2.9 2.7 2.5 2.3 City Without Migration Nairobi City 3,138,369 3,415,468 3,741,728 4,044,460 4,423,682 1.6 1.4 0 % 2.1 1.8 1.6 1.3 Case 1 1999-2009 Growth Rate Scenario Nairobi City 1,324,570 2,143,254 3,138,369 3,657,347 4,428,370 5,361,937 7,008,588 3.9 2.2 2,584,906 % 4.8 4.9 3.9 3.9 3.9 3.9 3.9 Outside City 935,854 1,259,569 1,877,652 2,205,048 2,695,701 3,295,530 4,365,967 4.1 2.3 % 3.0 4.1 4.1 4.1 4.1 4.1 Greater Nairobi 2,260,424 3,402,823 5,016,021 5,862,395 7,124,071 8,657,467 11,374,554 4.0 2.3 % 4.2 4.0 4.0 4.0 4.0 4.0 Case 2 Decelerating City Population Scenario Nairobi City 1,324,570 2,143,254 3,138,369 3,629,268 4,289,649 4,997,066 6,021,548 3.2 1.9 1,597,866 % 4.8 4.9 3.9 3.7 3.4 3.1 2.7 Outside City 935,854 1,259,569 1,877,652 2,205,048 2,695,701 3,295,530 4,365,967 4.1 2.3 % 3.0 4.1 4.1 4.1 4.1 4.1 Greater Nairobi 2,260,424 3,402,823 5,016,021 5,834,316 6,985,349 8,292,596 10,387,515 3.5 2.1 % 4.2 4.0 3.9 3.7 3.5 3.3 Case 3 Containing City Population Scenario Nairobi City 1,324,570 2,143,254 3,138,369 3,601,351 4,174,952 4,677,671 5,212,500 2.4 1.7 788,818 % 4.8 4.9 3.9 3.5 3.0 2.3 1.6 Outside City 935,854 1,259,569 1,877,652 2,205,048 2,695,701 3,295,530 4,365,967 4.1 2.3 % 3.0 4.1 4.1 4.1 4.1 4.1 Greater Nairobi 2,260,424 3,402,823 5,016,021 5,806,398 6,870,653 7,973,202 9,578,466 3.1 1.9 % 4.2 4.0 3.7 3.4 3.0 2.7 Case 4 Nairobi Metropolitan Development Scenario Nairobi City 1,324,570 2,143,254 3,138,369 3,601,351 4,174,952 4,677,671 5,212,500 2.4 1.7 788,818 % 4.8 4.9 3.9 3.5 3.0 2.3 1.6 Outside City 935,854 1,259,569 1,877,652 2,423,734 3,318,544 4,574,701 7,049,832 6.5 3.8 % 3.0 4.1 6.6 6.5 6.6 6.4 Greater Nairobi 2,260,424 3,402,823 5,016,021 6,025,084 7,493,496 9,252,373 12,262,332 4.3 2.4 % 4.2 4.0 4.7 4.5 4.3 4.1 Case 5 Aggressively Containing City Population Scenario Nairobi City 1,324,570 2,143,254 3,138,369 3,601,351 4,015,317 4,304,371 4,488,441 1.7 1.4 64,759 % 4.8 4.9 3.9 3.5 2.2 1.4 0.6 Outside City 935,854 1,259,569 1,877,652 2,423,734 3,318,544 4,574,701 7,049,832 6.5 3.8 % 3.0 4.1 6.6 6.5 6.6 6.4 Greater Nairobi 2,260,424 3,402,823 5,016,021 6,025,084 7,333,861 8,879,072 11,538,273 4.0 2.3 % 4.2 4.0 4.7 4.0 3.9 3.8 Note: Nairobi City can experience net in-migration even if its population growth rate is lower than the national rate, due
the city’s relatively low birth rate. Sources: Kenya Censuses 1989, 1999 and 2009, Spatial Planning Concept for Nairobi Metropolitan Region 2013, and the
JICA Study Team (JST)
2) Comparison of Nairobi City’s Annual Average Growth Rate and the Population Density in 2030
The annual average growth rate of Nairobi City in each alternative is summarised below, and the resultant population density in 2030 is shown. Area and population density of selected cities are depicted for reference. Unlike Nairobi City, the population growth of the environs in Greater Nairobi consists of changes in both urban and rural population and so the growth is not necessarily urban population growth.

The Project on Integrated Urban Development Master Plan for the City of Nairobi in the Republic of Kenya
Nippon Koei Co., Ltd. 6-4 Final Report
IDCJ Inc.
EJEC Inc.
Table 6.1.2 Comparison of Nairobi City’s Annual Average Growth Rate and Population Density in 2030 Recent Years Case 1 Case 2 Cases 3 and 4 Case 5 Annual average growth rate of Nairobi City 3.9% 3.2% 2.4% 2.4% 1.7% Population density of Nairobi City in 2030 (The density in brackets is based on the city area excluding 117 km2 of Nairobi National Park.)
4,515/km2 (5,429/km2)
10,000/km2 (12,000/km2)
8,700/km2 (10,000/km2)
7,500/km2 (9,000/km2)
6,500/km2 (7,800/km2)
Source: JICA Study Team (JST)
0
2,000
4,000
6,000
8,000
10,000
12,000
14,000
16,000
18,000
20,000
0 200 400 600 800 1,000 1,200 1,400 1,600 1,800
Pop
ulat
ion
dens
ity
per
km2
Area (km2)
Area and Population Density Source: Websites of the cities
Nairobi
Dar es Salaam
Kampala
Kigali
Bujumbura
Addis Ababa
Metro Manila
Bangkok
Tokyo Wards
Johannesburg
Sources: Websites of the cities (2013)
Figure 6.1.3 Area and Population Density of Selected Cities
3) Implications of the Alternative Scenarios
i) 1999-2009 Growth Rate Scenario
The estimated population of Nairobi City in this scenario is by far larger than the no-migration-case population. A total of 2.6 million net in-migrants and their children are expected. This scenario presents perhaps excessively rapid population growth of the city. It will require huge incremental supply of infrastructure and public services. Lack of them may jeopardise the urban functions and cause uncontrollable expansion of slums. The population growth of the environs is also high but it would be necessary to respond to Kenya’s momentum of industrial development including a shift from agriculture to secondary and tertiary industries, accompanying urbanisation, and migration pressure on Nairobi City.
ii) Decelerating City Population Scenario
This scenario assumes that the city’s population in 2030 would be one million less than the population in the previous scenario. The estimated population is much larger than the no-migration-case population. A total of 1.6 million net in-migrants and their children are expected. The city’s population growth may be still too high under the current conditions. But it may be the lowest possible range in view of the population and migration trends of Kenya, where substantial rural to urban population shift takes place to push up the urban population in large cities like Nairobi City. Therefore, this may be a realistic scenario, but it faces two challenges: how to decelerate the population growth and how to properly accommodate nearly double the current population within the city boundary.
iii) Containing City Population Scenario
This scenario is to divert the city’s population trend from a rapid expansion to a relatively moderate growth. The total number of net in-migrants and their children needs to be contained within 800,000. This may be ideal but how realistic it is remains as a challenge. Curbing the in-migration to the city requires a set of strong policy measures including, but not limited to, containment of the slum expansion.
iv) Nairobi Metropolitan Development Scenario
A basic idea of this scenario is to contain the city population and promote the environs to absorb increasing urban population in Greater Nairobi. Thus the migration pressure on Nairobi City would be largely absorbed in the environs. The reality of this scenario depends largely on creation of proposed new towns and satellite cities so as to absorb the incremental population over five million outside the city. As in the previous scenario iii, Nairobi City’s total number of net in-migrants and their children needs to be contained within 800,000.
v) Aggressively Containing City Population Scenario
In this scenario, the estimated population of Nairobi City in 2030 is close to the no-migration-case population with no substantial net in-migration. This is an extreme scenario in which the population growth rate of the city will be flattened out immediately. In addition to the question of its reality, whether it contributes positively to the national economy is an immediate question.

The Project on Integrated Urban Development Master Plan for the City of Nairobi in the Republic of Kenya
Nippon Koei Co., Ltd. 6-5 Final Report
IDCJ Inc.
EJEC Inc.
4) Recommended Scenario
The comparison of the above alternative scenarios was discussed in Thematic Groups by the Kenyan and Japanese sides. In conclusion, in view of the basic concept that Nairobi City should contain its population growth while its environs should rapidly develop to function as part of the expanding national capital to be called the Greater Nairobi, the Nairobi Metropolitan Development Scenario, or scenario iv above, is adopted. The estimated population of Nairobi City in 2030 is 5,212,500.
6.1.2 Future Day-time Population of Nairobi City
(1) Conditions for Estimation
1) Employees
The share of workforce in population of each census district of Nairobi City in the 2009 Census is assumed to be unchanged until 2030. On the other hand, the unemployment rate of each district in the 2009 Census is assumed to decrease from 15% in 2009 to 7% in 2030. Thus, the number of employees is calculated as the difference between the workforce and the unemployed. The number of employee will grow from 1,411,000 in 2009 to 2,555,000 in 2030, which is faster than the growth of the population.
2) Pupils and Students
The total number of pupils and students living in Nairobi City in 2009 is estimated at 780,000 consisting of pre-primary schools (109,200 based on the assumed enrolment rate of 50%), primary schools (396,400 based on the rate of 90%), secondary schools (122,500 based on the rate of 65%), and others, namely: youth polytechnic, tertiary, university, etc. (152,300 based on the 2009 Census).
The number of pupils and students of each census district in the 2009 Census is revised by multiplying the ratio of the estimated total to the census-based total. Then, the share of the revised number of pupils and students in the population in each district in 2009 is assumed to increase by 0.4% point per year due to rising enrolment rates. This way, the city’s share of pupils and students in the population will rise from 25% in 2009 to 33% in 2030 and the total number of pupils and students will grow much faster than the population from 780,000 in 2009 to 1,737,000 in 2030.
3) Others
There are a total of 947,000 people not counted as “employees” nor “pupils and students” in the 2009 Census. They are people less than 3 years old, those who are of school-age but do not go to school, the unemployed, and those out of the workforce including housewives and elder people. This category of population will decrease to 920,000 in 2030 due to higher school enrolment rates and lower unemployment rates in spite of the population growth.
(2) Day-time Population
The number of cross-border commuters is estimated based on the cordon line survey and the person trip survey conducted in 2013. The inflow and outflow of pupils and students are thought to be relatively small and assumed to be equal.

The Project on Integrated Urban Development Master Plan for the City of Nairobi in the Republic of Kenya
Nippon Koei Co., Ltd. 6-6 Final Report IDCJ Inc. EJEC Inc.
Table 6.1.3 Estimation of Cross-border Commuters in 2013 Inflow Outflow Net
Inflow References or Assumptions
Inflow Outflow Cross-border commuters 206,136 41,136 165,000
Cordon line survey considering missed number of commuters Person trip survey
Commuting workers 187,102 22,102 165,000 Approximately 90% of the commuters
Person trip survey
Commuting pupils, students and others
19,034 19,034 0 In=Out Person trip survey
Source: JICA Study Team (JST)
1) Work Places
The total number of jobs in Nairobi City in 2013 is estimated at 1,813,000 by adding the number of employees from Nairobi City and the net inflow of workers from outside of Nairobi City, who are assumed to be formal workers. Amongst the jobs in Nairobi City in 2013, there are approximately one million formal jobs according to an estimation based on the business registration data of the Nairobi City County (NCC) and so the remaining 813,000 jobs are informal as discussed in Chapter 2.1.2.
By assuming that the growth rate of the total number of jobs in Nairobi City is equal to that of the total number of employees and that the growth rate of the informal jobs is half the rate of the total number of employees, the total number of jobs in 2030 is estimated at 2,811,000, consisting of 1,797,000 formal jobs and 1,014,000 informal jobs.
Table 6.1.4 Estimation of Employees and Jobs in Nairobi City 2009 2013 2018 2023 2030
Total number of employees living in Nairobi City 1,411,229 1,647,869 1,950,933 2,230,666 2,554,768 Annual growth rate (%) 4.0 3.4 2.7 2.0 Total number of employees Total number of employees
Total number of jobs in Nairobi City 1,552,534 1,812,869 2,146,279 2,454,021 2,810,575 Annual growth rate (%) 4.0 3.4 2.7 2.0 Total number of jobs in NairobiTotal number of jobs in Nairobi
Informal jobs (=Informal workers from Nairobi City)
751,678 812,869 885,095 946,850 1,013,636
Annual growth rate (%) 2.0 1.7 1.4 1.0 Formal jobs 800,856 1,000,000 1,261,183 1,507,172 1,796,939 Annual growth rate (%) 5.7 4.8 3.6 2.5 Formal workers from Nairobi City 659,551 835,000 1,065,838 1,283,816 1,541,131 Annual growth rate (%) 6.1 5.0 3.8 2.6 Net inflow of formal workers from outside of Nairobi City 141,305 165,000 195,346 223,355 255,807
Annual growth rate (%) 4.0 3.4 2.7 2.0 Source: JICA Study Team (JST)
2) School Enrolment
Based on the assumption that the inflow and outflow of pupils and students are equal, the total school enrolment of Nairobi City is equal to the total number of pupils and students, although in reality they are generally different at the zone level as shown by the person trip survey.
3) Others
Day population and night population of this category are thought to be equal.
4) Day-time Population
The day-time population of Nairobi City is estimated to grow from 3,280,000 in 2009 to 5,468,000 in 2030, by simply adding the net inflow of commuters from outside of the city to the night-time population. It is also equal to the total of the number of jobs, school enrolment and others.

The Project on Integrated Urban Development Master Plan for the City of Nairobi in the Republic of Kenya
Nippon Koei Co., Ltd. 6-7 Final Report IDCJ Inc. EJEC Inc.
Table 6.1.5 Estimation of Day-time Population in Nairobi City 2009 2013 2018 2023 2030
Total number of jobs in Nairobi City 1,552,534 1,812,869 2,146,279 2,454,021 2,810,575 Annual growth rate (%) 4.0 3.4 2.7 2.0 Total school enrolment 780,379 953,813 1,190,009 1,427,494 1,737,357 Annual growth rate (%) 5.1 4.5 3.7 2.8 Others 946,760 999,669 1,034,010 1,019,511 920,375 Annual growth rate (%) 1.4 0.7 -0.3 -1.5
Day-time population 3,279,673 3,766,351 4,370,298 4,901,026 5,468,307 Annual growth rate (%) 3.5 3.0 2.3 1.6 Source: JICA Study Team (JST)
6.1.3 Future Gross Domestic Product (GDP) per Capita of Kenya and Nairobi City
Three sets of cases of future GDP per capita of Kenya and gross regional domestic product (GRDP) per capita of Nairobi City are examined assuming that the GRDP per capita will continue to be three times the GDP per capita of Kenya.
Although the Kenya Vision 2030 has set a target of 10% continuous growth, it seems safer to set a lower assumption in view of the past trend of Kenya and experiences of other countries. Therefore, Case 3, which is in between the current growth and the challenging Case 2, is thought to be a realistic and appropriate target.
Table 6.1.6 Alternative Cases of Future GDP per Capita of Kenya and Nairobi City Case 1 Case 2 Case 3
Bottom Case to achieve the lowest GNI (GDP) per capita for the lower middle income ($1,026 at 2011 prices) countries in 2030
GDP 10% Growth Case (Target of Kenya Vision 2030)
GDP 7% Growth Case (between Case 1 and Case 2)
Kenya In 2011 Population: 40,881,954 GDP: KSh3,024,782 million GDP growth rate: 4.4% (Average GDP growth rate from 2006 to 2011: 4.3%) GDP per capita: KSh73,988
Average GDP growth rate 3.7% 10.0% 7.0%
Average GDP per capita growth rate
1.2% 7.3% 4.4%
GDP per capita in 2030 at 2011 prices
KSh92,575 (1.3 times the 2011 level)
KSh281,963 (3.8 times the 2011 level)
KSh166,733 (2.3 times the 2011 level)
Nairobi City In 2011 Population: 3,361,899 GRDP: KSh746,223 million GRDP per capita: KSh221,965
Average GRDP growth rate 3.6% 9.8% 6.8%
Average GRDP per capita growth rate
1.2% 7.3% 4.4%
GRDP per capita in 2030 at 2011 prices
KSh277,726 (1.3 times the 2011 level)
KSh845,888 (3.8 times the 2011 level)
KSh500,200 (2.3 times the 2011 level)
Sources: Kenya Vision 2030 (2008) and JICA Study Team (JST)
6.2 Development Visions
6.2.1 Development Vision Formulation Procedure
Development vision of Nairobi City is formulated with reference to the related plans and inputs from stakeholders. The following are the steps for development vision formulation:
Share and understand the development vision of “Kenya Vision 2030” and “Metropolitan Vision 2030”, and the position of Nairobi City in the East Africa Region amongst stakeholders.

The Project on Integrated Urban Development Master Plan for the City of Nairobi in the Republic of Kenya
Nippon Koei Co., Ltd. 6-8 Final Report
IDCJ Inc.
EJEC Inc.
Discuss the ideas and image of Nairobi City in 2030 through technical working group and stakeholders meetings.
Compile various ideas and prepare development vision based on technical working group discussion and stakeholder meetings.
6.2.2 Development Visions in the Related Plans and Strategies
(1) Kenya Vision 2030
Kenya Vision 2030 was formulated in 2007 and provides the baseline of the economic, social, and political frameworks, and also shows action to be taken to achieve the development goals such as the Millennium Development Goals (MDGs). The following box shows the outline of the Kenya Vision 2030.
Overarching Vision: Overarching vision: A globally competitive and prosperous nation with a high quality of life by 2030 Foundation for Kenya Vision 2030 on which Three Pillars (Economic, Social, Political) are based:
(1) Macroeconomic stability for long-term development (2) Continuity in governance reforms (3) Enhance equity and wealth-creation opportunities for the poor (4) Infrastructure (5) Energy (6) Science, technology, and innovation (STI) (7) Land reform (8) Human resources development (9) Security (10) Public service
Three Pillars of Kenya Vision 2030 Economic: To maintain a sustained economic growth of 10% p.a. over the next 25 years
(1) Tourism (2) Increase in value in agriculture (3) A better and more inclusive wholesale and retail trading sector (4) Manufacturing for regional market (5) Business process off-shoring (BPO) (6) Financial service
Social: A just and cohesive society enjoying equitable social development in a clean and secure environment
(1) Education and training (2) Health sector (3) Water and sanitation (4) Environment (5) Housing and urbanisation (6) Gender, youth, and vulnerable groups (7) Equity and poverty elimination
Political: An issue-based, people centred, result oriented, and accountable democratic political
(1) Rule of law (2) Electoral and political process (3) Democracy and public service delivery (4) Transparency and accountability (5) Security, peace-building, and conflict management

The Project on Integrated Urban Development Master Plan for the City of Nairobi in the Republic of Kenya
Nippon Koei Co., Ltd. 6-9 Final Report
IDCJ Inc.
EJEC Inc.
(2) Nairobi Metro 2030
Nairobi Metro 2030, which was prepared by the Ministry of Nairobi Metropolitan Development and approved in 2008, states that it aims at developing Nairobi into a world-class African Region that is able to create sustainable wealth and offer a high quality of life for its residents, the people of Kenya, investors, and visitors.
The following box shows the outline of the vision of Nairobi Metro 2030.
Metropolitan Vision 2030: To be a world-class African metropolis, supportive of the overall national agenda articulated in Kenya Vision 2030 Four Principles: (1) A world-class working environment (2) A world-class living environment (3) A world-class business environment (4) World-class metropolitan governance Key Foundations for Metropolitan Vision 2030 (1) Building internationally competitive and inclusive economy for prosperity (2) Deploying world-class infrastructure and utilised for the region (3) Optimising mobility through effective transportation (4) Enhancing the quality of life and inclusive in the region (5) Delivering a unique image and identity through effective place branding (6) Ensuring a safe and secure region (7) Building world-class governance system
(3) Position of Nairobi City in the East Africa Region
Nairobi City has been described as the gateway to Eastern and Central Africa, almost equidistant to Cairo and Cape Town (3,538 km and 4,107 km by road, respectively). Factors that make Nairobi City the hub for Eastern Africa are summarised below:
Nairobi City as a transport hub: • Due to its access to the Port of Mombasa, much of inland-transit freight passes through Nairobi City
by rail and by road to Kampala, by road to Kigali, Juba, Dar es Salaam and Addis Ababa. • Jomo Kenyatta International Airport (JKIA) is the busiest airport in Eastern Africa with more than 5
million passengers using it per year. This acts as the gateway for most tourists and businessmen coming to the East African Region. Various international airlines use JKIA as a regional centre.
• Persons using smaller aircraft use the Wilson Airport, which is one of the busiest airports in Africa to access the rest of Kenya and the rest of Eastern Africa.
• The headquarters of the former East Africa Railways that served Kenya and Uganda, now Kenya Railways, is also located in Nairobi City.
Environmental conservation and management role played by Nairobi City in the region: • It is the only capital city in the world that boasts of a national park that still offers natural habitat for
environmental and wildlife conservation. • Nairobi City has two natural forests within its boundaries which remain models for ecosystem
conservation in the region. • The city of Nairobi also has an arboretum, green recreational parks in the city and the central business
district (CBD). Socio-political and administrative roles of Nairobi City: • Global headquarters of the United Nations Human Settlements Programme (UN-HABITAT) and the
United Nations Environment Programme (UNEP). It also has the regional headquarters for the United Nations Development Programme (UNDP), United Nations High Commissioner for Refugees

The Project on Integrated Urban Development Master Plan for the City of Nairobi in the Republic of Kenya
Nippon Koei Co., Ltd. 6-10 Final Report
IDCJ Inc.
EJEC Inc.
(UNHCR), Food and Agriculture Organization (FAO) and other United Nations (UN0 agencies. • Several international development agencies like the United States Agency for International
Development (USAID), Japan International Cooperation Agency (JICA), Department for International Development (DfID), Swedish International Development Cooperation Agency (SIDA), etc. run their Eastern Africa functions from Nairobi City.
Nairobi City as a centre for industrialisation, commerce and trade: • Multinational companies, industries, banks and commercial enterprises have their regional
headquarters located in Nairobi City. • Nairobi City is an incubation centre for small- and medium-sized enterprises (SME) technologies in
Eastern Africa. • People and traders come from East African capitals like Kampala and Dar es Salaam to access goods
and services from Nairobi City.
6.2.3 Stakeholder Discussions on Development Vision
A technical working group attended by the NCC staff, experts from university, consultants and national government organisations was held to discuss development visions. Discussion was conducted in the following manner:
Provide information on Kenya Vision 2030, Nairobi Metropolitan Region 2030, points of preparation of development vision (uniqueness and characteristics of Nairobi City).
Conduct a brainstorming session for vision, expectation, and pillars of vision, which was facilitated by the secretary of the working group and a working group member.
Compile the results and prepare development vision and discuss at stakeholder meetings.
The input from the participants is summarised below.
(1) Ideas for Development Vision
Key Words: World-class, Attractive, Sustainable, Competitive, Livable Other Inputs: • Safe • Inclusive • Demonstrate excellence in city planning • World-class and competitive city • Planned and vibrant leading city • City that respects rights of all • Livelihood opportunities for all • Friendly city • Famous city where analogue and digital generation can contribute to the growth of city • High-yielding city that is safe and sustainable • World-class and unique city with functional features • Attractive city with excellent spatial order • World-class city of opportunities for all • Livable city appreciating all spheres of economic ,social ,environmental, and political • Coexistence of city with national park • Green and sustainable city • Able to generate employment, attractive to investors • Economically vibrant • Adequate housing for all residents • Water supply and waste management system that supports the population

The Project on Integrated Urban Development Master Plan for the City of Nairobi in the Republic of Kenya
Nippon Koei Co., Ltd. 6-11 Final Report
IDCJ Inc.
EJEC Inc.
(2) Expectation of NCC in 2030
Key Words: • Balance of nature and humanity to achieve a world-class city • City of champions (long distance athletes)-world class stadiums and sports facilities • SAFARI city through addressing related facilities. • City in the Sun City of Jua Kali where residents work under the sun
Other Inputs: General: • Equity in resource access • Well planned and functioning city for all • Inclusive and non-discriminatory, provide livelihood for all • Safe and friendly city, orderly city, security in city, equity, and security • Accommodating to diverse culture, religion, and robust governance structure • Fully engaged public • Efficient • Resilient • Competitive
Economy: • Economically vibrant • Investor-friendly environment, financial empowerment for county to deliver services, and
governance systems promote ease of business • Job opportunities • Better paying jobs • Planned environment Living condition: • Sustainability of built environment • Liveability of the city, high standards of living • Decent housing • Reliable and safe public transport system • Address issues of traffic and affordable housing • Pedestrian walkways • Clean city
Governance: • City with public awareness • Well planned city with clear demarcation of all trade and business activities • Provide capacity building and development for unskilled population, qualified and adequate
personnel
(3) Pillars of the Development Vision
Key Words: • Economic • Political • Governance • Socio-cultural • Environment
Other Inputs: • Security, Social justice • Economic, social, cultural environment, and governance • Infrastructure, economic, social, cultural, and political • Economic, social, political, environment • Cultural, inclusiveness/equity, safety and security • Governance, economic/infrastructure, social cultural environment • Sustainable and environmental • Good governance and sustainability of the environment • Governance, economic social environment • Economic, social, political, and environment • Good governance and sustainable environment • Economic, social, political and environment • Good governance economic environment
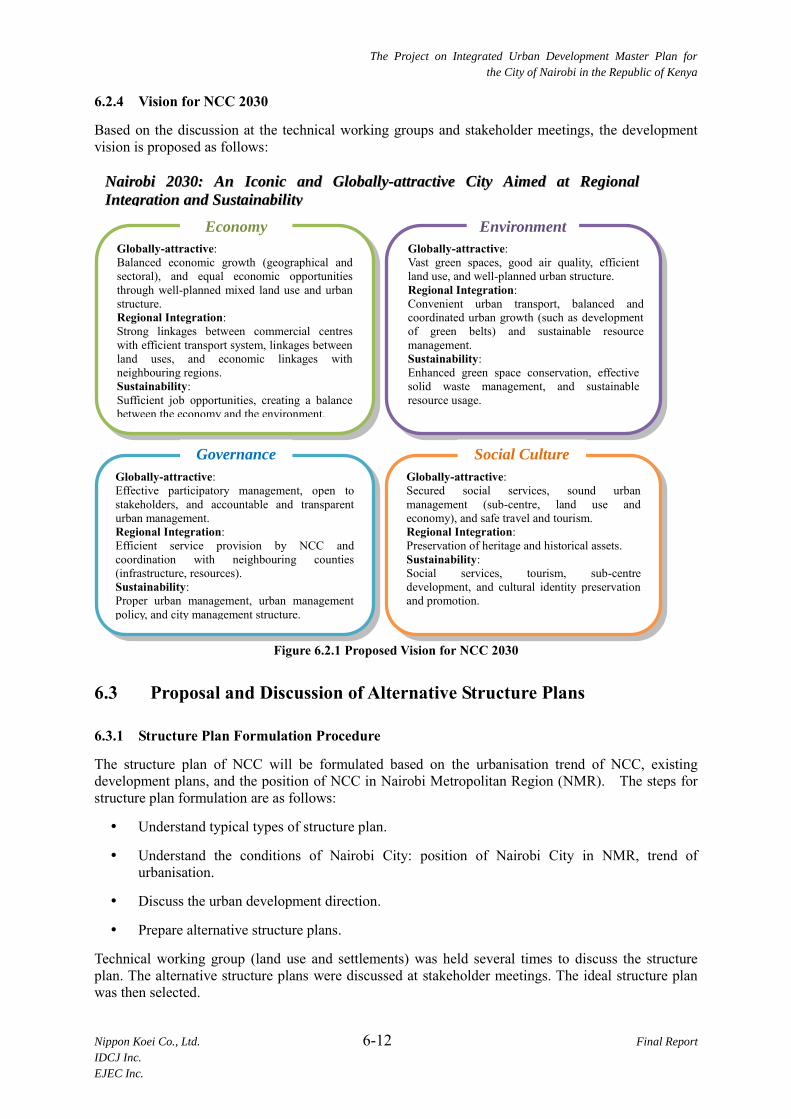
The Project on Integrated Urban Development Master Plan for the City of Nairobi in the Republic of Kenya
Nippon Koei Co., Ltd. 6-12 Final Report
IDCJ Inc.
EJEC Inc.
6.2.4 Vision for NCC 2030
Based on the discussion at the technical working groups and stakeholder meetings, the development vision is proposed as follows:
Figure 6.2.1 Proposed Vision for NCC 2030
6.3 Proposal and Discussion of Alternative Structure Plans
6.3.1 Structure Plan Formulation Procedure
The structure plan of NCC will be formulated based on the urbanisation trend of NCC, existing development plans, and the position of NCC in Nairobi Metropolitan Region (NMR). The steps for structure plan formulation are as follows:
Understand typical types of structure plan.
Understand the conditions of Nairobi City: position of Nairobi City in NMR, trend of urbanisation.
Discuss the urban development direction.
Prepare alternative structure plans.
Technical working group (land use and settlements) was held several times to discuss the structure plan. The alternative structure plans were discussed at stakeholder meetings. The ideal structure plan was then selected.
Globally-attractive: Balanced economic growth (geographical and sectoral), and equal economic opportunities through well-planned mixed land use and urban structure. Regional Integration: Strong linkages between commercial centres with efficient transport system, linkages between land uses, and economic linkages with neighbouring regions. Sustainability: Sufficient job opportunities, creating a balance between the economy and the environment.
Globally-attractive: Vast green spaces, good air quality, efficient land use, and well-planned urban structure. Regional Integration: Convenient urban transport, balanced and coordinated urban growth (such as development of green belts) and sustainable resource management. Sustainability: Enhanced green space conservation, effective solid waste management, and sustainable resource usage.
Globally-attractive: Secured social services, sound urban management (sub-centre, land use and economy), and safe travel and tourism. Regional Integration: Preservation of heritage and historical assets. Sustainability: Social services, tourism, sub-centre development, and cultural identity preservation and promotion.
Globally-attractive: Effective participatory management, open to stakeholders, and accountable and transparent urban management. Regional Integration: Efficient service provision by NCC and coordination with neighbouring counties (infrastructure, resources). Sustainability: Proper urban management, urban management policy, and city management structure.
Economy Environment
Governance Social Culture
NNaaiirroobbii 22003300:: AAnn IIccoonniicc aanndd GGlloobbaallllyy--aattttrraaccttiivvee CCiittyy AAiimmeedd aatt RReeggiioonnaall
IInntteeggrraattiioonn aanndd SSuussttaaiinnaabbiilliittyy

The Project on Integrated Urban Development Master Plan for the City of Nairobi in the Republic of Kenya
Nippon Koei Co., Ltd. 6-13 Final Report IDCJ Inc. EJEC Inc.
6.3.2 Discussion of Alternative Prototypes of Structure Plans
Several prototypes of structure plan can be conceived for NCC. For discussion purposes, typical prototypes are introduced. The following Table 6.3.1 shows the types and characteristics of structure plans.
Table 6.3.1 Comparison of Types of Structure Plan Types of Structure
Plan Image of Structure Characteristics
CBD One Core System (Mono Core) (present trend) Only one strong nucleus which develops and there is no existing or important function in other centres
[Positive aspect] Strong growth of CBD with urban function
concentrated in CBD Effectiveness for the early stage of development [Negative aspect] Stagnation on the surrounding areas causing
disparity in living condition (CBD has easy access to urban function)
Heavy traffic congestion and further worsening Less environmental consideration
Sub-centre System (Poly Nucleated Development) There is no dominating single settlement; all nodes of the polycentric network have the same relevance of “spatial participation”
[Positive aspect] Better mobility will be maintained by
decentralising the CBD Accelerated growth of sub-centres Living condition in CBD will be maintained and
more people will live in the suburbs with better living condition and lifestyle
Sub-centre System (Bi-polar Corridor Development) Development of minor settlements along the transport corridor connecting two strong nodes.
[Positive aspect] Better mobility will be maintained by
decentralising the CBD Living condition in CBD will be maintained and
more people will live in the suburbs with better living condition and lifestyle
Strong axial development with strong polar forms.
[Other feature] Multi modal transport along corridors is required
Sub-centre System (Corridor cum Ring Development) Development of settlements along the corridor and ring
[Positive aspect] High intensity development along city
sub-centres Medium capacity transport system Network of transport (sectoral and regional
centres) [Negative aspect] Requires high investment on transport
infrastructure. Diffused Development System Development of two levels of corridor (within NCC and Greater Nairobi)
[Negative aspect] High investment cost [Other features] Self contained or independent development Dispersal development
Source: JICA Study Team (JST)
CBD
CBD
: Nairobi City Boundary
: Greater Nairobi
CBD
CBD
CBD

The Project on Integrated Urban Development Master Plan for the City of Nairobi in the Republic of Kenya
Nippon Koei Co., Ltd. 6-14 Final Report IDCJ Inc. EJEC Inc.
6.3.3 Stakeholder Discussions on Structure Plan
(1) Technical Working Group for Structure System
The technical working group for land use planning discussed alternative structure plans using some drawings showing analytical structural aspect, as shown below.
Source: JICA Study Team (JST)
Figure 6.3.1 Discussion Results
The key issues discussed during the technical working group meeting are as follows:
Key Issues: • Proper density control • Green conservation for recreation • Historical building conservation • Rearrangement of industrial areas • Redevelopment of CBD to deliver accommodation and work place for increasing population • Eco-friendly city centre with new transport system • Sub-centre development in Karen, Westland, near JKIA, Kasarani and Njiru • New sports facility for Nairobi City • Sub-centre system (multi core development) is ideal for future of Nairobi City
(2) Selection of Prototype of Structure Plan
Current structure of NCC is characterised as “one core type” and already facing problems of heavy concentration of social and economic activities in CBD and heavy traffic congestion. Development of Nairobi is shifting from “one core system” to “dispersion of urban function type” then to “ring road type”. CB
Considering the urban development trend and problems that Nairobi City is facing, “Sub-centre System (Bi-polar Corridor Development)” is adopted as the type of structure plan of Nairobi City.
CBD
Figure 6.3.2 Sub Centre System (Bi-polar Corridor Development)

The Project on Integrated Urban Development Master Plan for the City of Nairobi in the Republic of Kenya
Nippon Koei Co., Ltd. 6-15 Final Report
IDCJ Inc.
EJEC Inc.
6.3.4 Proposed Structure Plan
Based on the selected Sub-centre System (Bi-polar Corridor Development) structure, the technical working group on land use and settlement discussed the structure plan with the existing conditions and location. The following sections are the results of a series of discussions:
(1) Road Network and Node
Several nodes which are located on the interchange of expected road network were proposed as sub-centres. The features and locations of each sub-centre are shown as follows:
Residential and Commercial : Runda-Ruaka, Ruiru, Ruai, Karen and Langata
Office and Commercial : Uthiru and Kabete
Industrial and Commercial : Donholm and Airport, north
Residential, Commercial and Entertainment (Sports Facilities) : Ruaraka (Kasarani)
Source: JICA Study Team (JST)
Figure 6.3.3 Road Network and Nodes
(2) Railway and Road Transit Interchange
The red line in Figure 6.3.5 shows a railway corridor which is proposed in the Nairobi Metropolitan Services Improvement Project (NaMSIP). As the railway stations are assumed to be utilised by a large number of passengers from surrounding areas, they have development potentials. It is expected to develop the area around main stations as sub-centres.

The Project on Integrated Urban Development Master Plan for the City of Nairobi in the Republic of Kenya
Nippon Koei Co., Ltd. 6-16 Final Report
IDCJ Inc.
EJEC Inc.
Source: JICA Study Team (JST)
Figure 6.3.4 Railway and Road Transit Interchange
(3) Proposed Structure Plan
A structure plan for Nairobi City is proposed based on the urban conditions including CBD, transport, and proposed development vision. Justification of the structure plan is summarised below.
To realise a symbolic status as the centre of Kenya, and a gateway to East Africa Region by strengthening the function of Nairobi City’s CBD;
To strengthen sub-centres to promote balanced development: narrowing the east-west gap, easing development pressure for the existing CBD, and dispersing social economic activities throughout NCC; and
To establish sub-centres along the interchanges of urban transport system to synchronise urban development and urban transport development: interchanges of major road network, interchanges of road and railway (including Light Rail Transit (LRT)).
The sub-centres (Runda-Ruaka, Ruiru, Kasarani, Uthiru, Kabete, Ruai, Karen, Langata, Airport north, Githurai, Dandora, Dagoretti, Woodley, Makadara, Imara-daima, and Shokimau) are located on interchanges in consideration of the road network and railway corridor. It is expected to make economic activity more efficient by the promotion of distribution of daytime population which is concentrated in CBD currently. The location of proposed sub-centres is shown in Figure 6.3.6.
Hierarchy of sub-centres will be considered in the following Section 6.4.6 based on importance and priority for development.
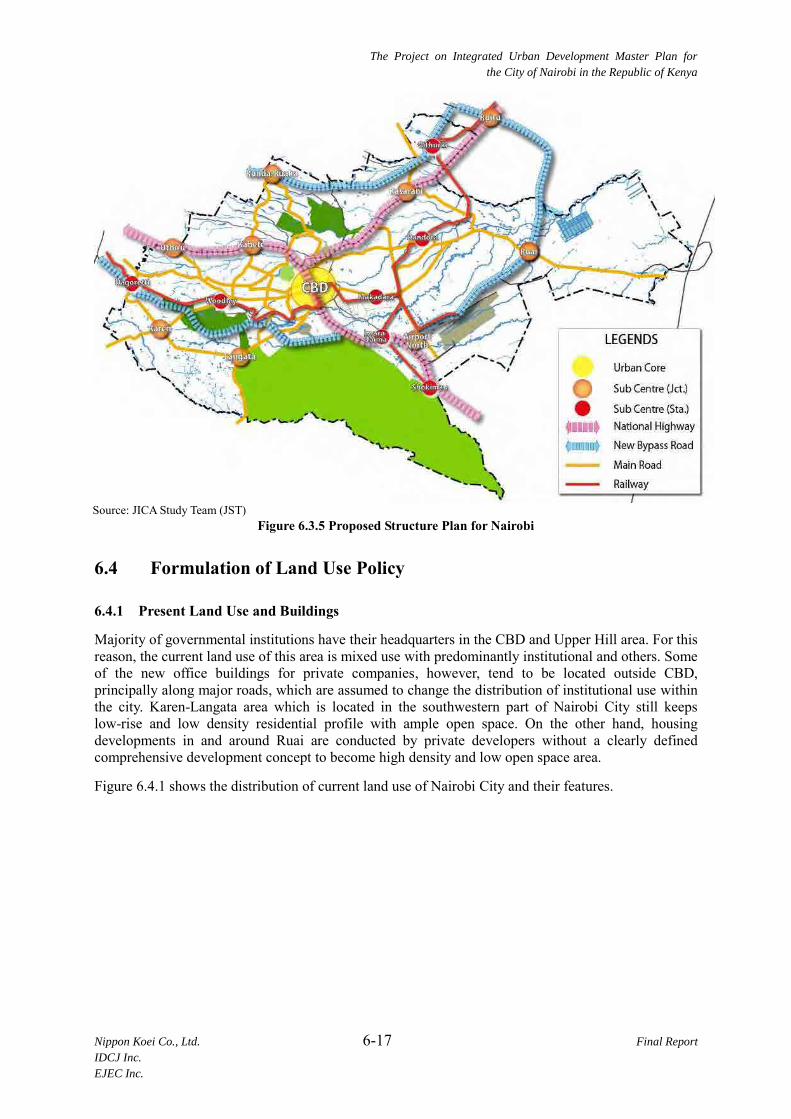
The Project on Integrated Urban Development Master Plan for the City of Nairobi in the Republic of Kenya
Nippon Koei Co., Ltd. 6-17 Final Report
IDCJ Inc.
EJEC Inc.
Source: JICA Study Team (JST)
Figure 6.3.5 Proposed Structure Plan for Nairobi
6.4 Formulation of Land Use Policy
6.4.1 Present Land Use and Buildings
Majority of governmental institutions have their headquarters in the CBD and Upper Hill area. For this reason, the current land use of this area is mixed use with predominantly institutional and others. Some of the new office buildings for private companies, however, tend to be located outside CBD, principally along major roads, which are assumed to change the distribution of institutional use within the city. Karen-Langata area which is located in the southwestern part of Nairobi City still keeps low-rise and low density residential profile with ample open space. On the other hand, housing developments in and around Ruai are conducted by private developers without a clearly defined comprehensive development concept to become high density and low open space area.
Figure 6.4.1 shows the distribution of current land use of Nairobi City and their features.

The Project on Integrated Urban Development Master Plan for the City of Nairobi in the Republic of Kenya
Nippon Koei Co., Ltd. 6-18 Final Report
IDCJ Inc.
EJEC Inc.
Source: JICA Study Team (JST)
Figure 6.4.1 Current Land Use
6.4.2 Demand for Land Use
(1) Capacity of Existing Regulation
Based on the existing regulation, entitled “A guide of Nairobi City Development Ordinances and Zones” and population densities in each sub-location, the JICA Study Team (JST) made an estimate of the population capacity of Nairobi City.
1) Conditions for capacity estimation
The conditions of estimation are described in the following Table 6.4.1.
Low-rise and low density area
Candidate site for logistics facilities
Institutional area (CBD, Upper Hill)
Industrial area New housing development
along Thika Super Highway
Expansion of urban area to east side

The Project on Integrated Urban Development Master Plan for the City of Nairobi in the Republic of Kenya
Nippon Koei Co., Ltd. 6-19 Final Report IDCJ Inc. EJEC Inc.
Table 6.4.1 Conditions for Capacity Estimation Calculation Accuracy
Population capacity is calculated based on the 106 sub-regions as shown below.
Conditions for estimation of livable area 1) Plot ratio
Assumed to follow the existing land use zoning in “Development Ordinances and Zones”. Assumed to follow the plot ratio (PR) in“Development Ordinances and Zones”. This means to
keep the existing development image, i.e., low-density green residence in upper land, high density in east land, and low density in eastern area other than east land.
2) Livable land Population distributed on“livable land” which was allotted based on the Land Use GIS data by
Colombia University. Informal settlement areas are not to be expanded. Agricultural lands in suburban area are to be conserved. And institutional, transportation,
recreational, natural reserve, and water land uses are also to be kept as they are. Open space and unknown land uses are counted as livable land.
Assumed population density Assumed to follow the existing population density. Regarding informal settlement area, the plot ratio is estimated from census data (higher than
development ordinance). Calculation formula is shown as below:
“Estimated population capacity” = “Assumed population density” * “Livable floor area”
2) Estimation result
Based on the above conditions, the maximum capacity of population of NCC is estimated to be approximately five million.
This result means that if Nairobi City needs to accommodate more than five million population, the existing regulation in the Development Ordinance should be revised to change land use, i.e., to convert some non-residential land use to residential use, and also the plot ratio should be changed to higher value to promote higher population density to accommodate future population.
(2) Business Land Use
Based on the employment forecast, the number of employment will increase by approximately one million up to 2030. Amongst the forecasted increase, the office-employed population in priority industry, as shown in shadow in the following Table 6.4.2, comes to around 583,900.
Table 6.4.2 Employment Estimation for 2030
Type of Industry 2013 2013
(%) Point
Change 2030 (%) 2030 Increment
2030-2013

The Project on Integrated Urban Development Master Plan for the City of Nairobi in the Republic of Kenya
Nippon Koei Co., Ltd. 6-20 Final Report IDCJ Inc. EJEC Inc.
1 Agriculture and forestry 43,831 2.4 -1.5 0.9 26,000 -17,800
2 Mining and quarrying 11,571 0.6 -0.2 0.4 12,000 430
3 Manufacturing 91,053 5.0 -1.0 4.0 113,000 21,950
4 Electricity, gas, and water supply 40,807 2.3 0.2 2.5 69,000 28,190
5 Construction 66,807 3.7 1.5 5.2 146,000 79,190
6 Wholesale and retail trade 307,061 16.9 0.0 16.9 476,000 168,940
7 Repair of vehicles, personal and household goods 71,205 3.9 0.0 3.9 110,000 38,800
8 Transportation, storage, and communication 86,471 4.8 1.0 5.8 162,000 75,530
9 Hotels and restaurants 160,013 8.8 1.0 9.8 276,000 116,000
10 Financial intermediation 102,413 5.6 0.8 6.4 181,000 78,600
11 Real estate and renting 32,518 1.8 0.0 1.8 51,000 18,500
12 Public administration 86,202 4.8 -1.0 3.8 106,000 19,800
13 Education 140,332 7.7 1.6 9.3 263,000 122,700
14 Health and social work 94,294 5.2 1.0 6.2 174,000 79,700
15 Other service industry 347,825 19.2 0.5 19.7 553,000 205,200
16 Private households 130,465 7.2 -3.9 3.3 93,000 -37,500
Total 1,812,869 100.0 0.0 100.0 2,811,000 998,100
Priority Industry 583,900
Source: JICA Study Team (JST) Colored columns indicate priority industry, which was identified based on Kenya Vision 2030 and through Thematic
Working Group.
JST estimated the office floor demand based on the employment gap as follows:
Apply 30 m2, which includes common facility area, for one office worker. 583,900 x 30 m2 = 17.52 million m2 = 1,752 ha. If PR (Plot Ratio) = 300%, land demand = 1,752/3 = 584 ha.
Approximately 600 ha of land will be necessary for the office demand.
(3) Available Land for Development
Figure 6.4.2 below shows the areas of some of the proposed sub-centres. For example, Upper Hill South area has approximately 260 ha. Most of the area is already somewhat developed or developing.
Upper Hill South Railway City (CBD South)
Available land limited. Need land use change from residence to commercial. Approx. 25 ha can be converted to office use. But there are historical buildings in the area to be conserved for the future.
KR land = 112 ha Need land use change from industry to commercial.
Karen Runda-Ruaka

The Project on Integrated Urban Development Master Plan for the City of Nairobi in the Republic of Kenya
Nippon Koei Co., Ltd. 6-21 Final Report IDCJ Inc. EJEC Inc.
Certain portion of undeveloped land in Karen. Land use is changing to business and institutional along Langata Road.
Development project proposed at former coffee plantation. Road hub of Northern Bypass, Limuru Road and ring road from Waiyaki Way.
Source: Google Earth, JICA Study Team (JST) Figure 6.4.2 Land Availability in Some Areas
(4) Large Land Occupants
Public institutions and facilities in Nairobi City County occupy a large size of land. Most of those lands are not utilised efficiently. The summary of zonal considerations of large land occupants is described in Table 6.4.3 below. These public service lands can be utilised partly for urban development, transportation facilities, or public activities by way of redevelopment or agglomeration.
Table 6.4.3 Zonal Considerations of Large Land Occupants Location Consideration
1 KRC (Kenya Railway Corporation)
Nairobi central station yard Industrial area (Makadara) yard Railway workers residential estates (Makongeni, Muturwa)
2 NCC (Nairobi City County)
Old housing scheme estates with low density in Eastland (Kaloleni, Shauri Moyo, and so forth)
3 KPLC (Kenya Power and Lighting Company)
Power lines occupy large plot especially in Dandora area because of the main substation located in the area.
Restriction regulation of power line is old and strict for development near lines.
4 Schools Private schools especially in western part of Nairobi City (e.g., Lenana School, Nairobi School, and so forth.)
5 Police stations Police stations are also occupying large plot with low density.
6 Military Airbase occupies huge land east of Eastland. Barracks also occupy large land at important location.
7 Church Churches have huge land for parking, used only in weekends.
8 Land buying company There is no clear information available. However, their active businesses are well known.
Source: JICA Study Team (JST)
6.4.3 Urban Characteristics and Zonal Considerations
(1) Urban Characteristics
1) Basic Urban Character
Nairobi City’s cross-sectional profile is shown in Figure 6.4.3 below. Northeast to southwest axis is urban activity core areas. Northern and western areas are environmental value areas including agricultural activities. Eastern and southern parts are rapid urban growth areas.

The Project on Integrated Urban Development Master Plan for the City of Nairobi in the Republic of Kenya
Nippon Koei Co., Ltd. 6-22 Final Report
IDCJ Inc.
EJEC Inc.
Source: NaMSIP Consultant
Figure 6.4.3 Cross-sectional Profile of Nairobi City
This urban profile can be simplified on a map as shown in Figure 6.4.4 below. Red colour shows Nairobi Metropolitan Fabric; green colour shows an environmental value area; and yellow colour shows a metropolitan growth area.
Source: NaMSIP Consultant PPT
Figure 6.4.4 Basic Urban Character
2) Population Distribution
Basically, population distribution in Nairobi tends to be low density in the west and high density in the east. Extremely high density areas are mainly slums or informal settlements.
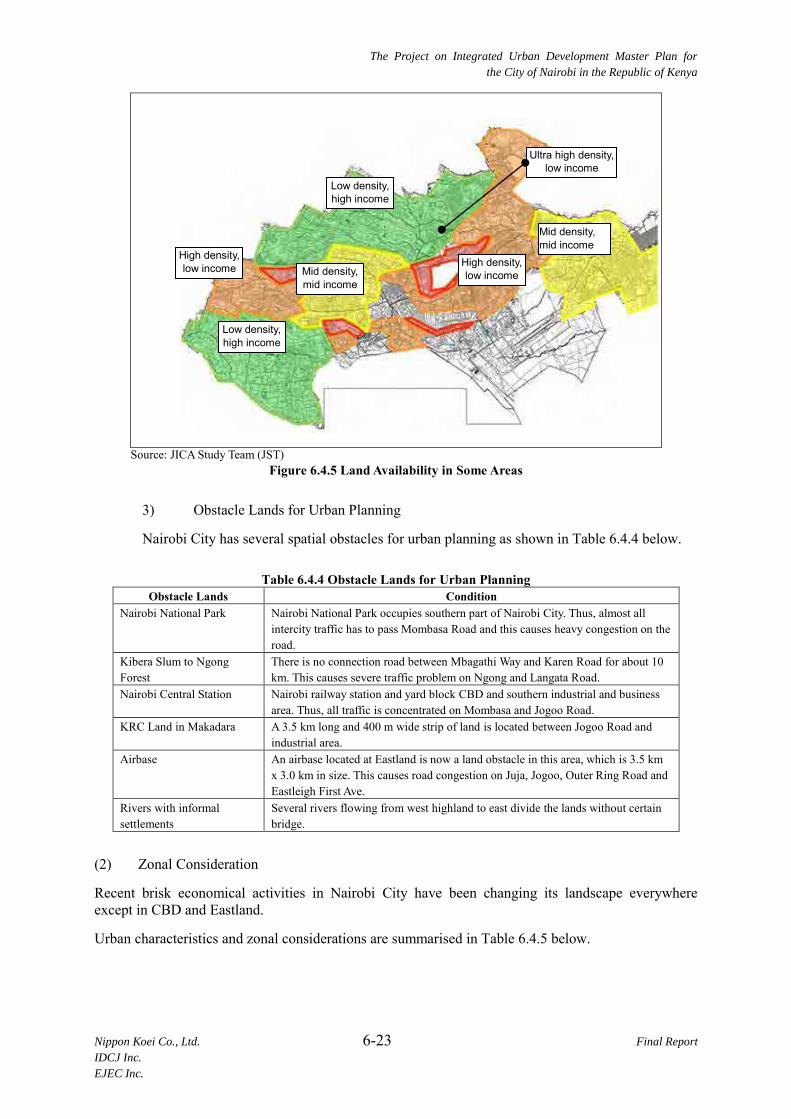
The Project on Integrated Urban Development Master Plan for the City of Nairobi in the Republic of Kenya
Nippon Koei Co., Ltd. 6-23 Final Report
IDCJ Inc.
EJEC Inc.
Source: JICA Study Team (JST) Figure 6.4.5 Land Availability in Some Areas
3) Obstacle Lands for Urban Planning
Nairobi City has several spatial obstacles for urban planning as shown in Table 6.4.4 below.
Table 6.4.4 Obstacle Lands for Urban Planning Obstacle Lands Condition
Nairobi National Park Nairobi National Park occupies southern part of Nairobi City. Thus, almost all intercity traffic has to pass Mombasa Road and this causes heavy congestion on the road.
Kibera Slum to Ngong Forest
There is no connection road between Mbagathi Way and Karen Road for about 10 km. This causes severe traffic problem on Ngong and Langata Road.
Nairobi Central Station Nairobi railway station and yard block CBD and southern industrial and business area. Thus, all traffic is concentrated on Mombasa and Jogoo Road.
KRC Land in Makadara A 3.5 km long and 400 m wide strip of land is located between Jogoo Road and industrial area.
Airbase An airbase located at Eastland is now a land obstacle in this area, which is 3.5 km x 3.0 km in size. This causes road congestion on Juja, Jogoo, Outer Ring Road and Eastleigh First Ave.
Rivers with informal settlements
Several rivers flowing from west highland to east divide the lands without certain bridge.
(2) Zonal Consideration
Recent brisk economical activities in Nairobi City have been changing its landscape everywhere except in CBD and Eastland.
Urban characteristics and zonal considerations are summarised in Table 6.4.5 below.
Low density, high income
Mid density, mid income
Mid density, mid income
High density, low income
Ultra high density, low income
High density, low income
Low density, high income

The Project on Integrated Urban Development Master Plan for the City of Nairobi in the Republic of Kenya
Nippon Koei Co., Ltd. 6-24 Final Report IDCJ Inc. EJEC Inc.
Table 6.4.5 Zonal Considerations Zone Status Ideas/Consideration 1A Central Business District
(CBD) Business and commercial centre
Has three subzones (1) Core – Kenyatta Avenue/Uhuru Highway/ Hail Salesia
Edge – University area/Polytechnic Two peripherals – (2) Tom Mboya- Nairobi River
has small plots and narrow streets low density/commercial
development – no onsite parking general decay/urban blight
(3) Ngara/Kamukjni/Gikomba no new investments for commercial
/ngara many garages –
- choking with informality - very vibrant - vehicular mobility is a problem
Overall
No major investment in CBD in recent decades.
Heavy traffic jam is serious problem in CBD.
Promote higher
level/densification/compactness Promote compatible mixed use incl.
residential Land readjustment Pedestrianisation of CBD Need enhanced plot ratio to enable
higher development/zoning is restrictive
Limited funding
1. Before residential – not viable anymore
2. Promote localised economic zone
1E Upper Hill Area Office, government, hospital
New office building and other development projects are quite active in this area.
Road network improvement projects are also ongoing.
Trend for offices – catering for onsite parking
Apartments give low plot ratio Area is inaccessible
Allow higher density Tending towards predominantly offices Promote mixed used Open alternative access/exit Transform to city character – no
boundary walls
2 Eastleagh, Ziwani, Sterehe, Pangani, High-rise residential area
Population density is growing to 500 p/ha. Constructions of high-rise apartment are active
Has a district centre with a core with higher plot ratio- challenge in parking
Private development encroaching on the public way
Land readjustment Pangani needs provision of parking Enhance the plot ratio and regulate Urban renewal for Ziwani and Starehe
with enhanced plot ratio Model development in Pangani -
Chinese 3 Parklands, Westland
Commercial, residence and office
Commercial concentration in Westland CBD. New shopping centre and office building appeared in recent years.
Growth of medical industry connected to Agha Khan and MP Shah
Current development trends exceeding allowed levels
Road network improvement required. Land readjustment to enable high rise
with open spaces Discourage regularisation as a
method of zoning (catching up).
4 Upper Spring Valley,
Kileleshwa, Kilimani, Thompsons, Woodley, etc. Medium-density residential for middle income level
Detached houses are converting to high-rise apartments or office buildings.
Some apartments seem not following height regulation (regulation states four storeys maximum).
Very diverse – mixed characteristics – needs separation
Kileleshwa fast growing but no shopping centre
Very diverse – mixed characteristics needs separation to maintain high
density mixed with low density
5 Lower Spring Valley, Loresho, Lavington, Benard Low density residential for high income level
Generally low density development with few designated local centres (dying)
Have strong neighbourhood associations Some plots are converted to apartment
buildings.
Maintain the character/conservation
6 Muthaiga Low density residential for diplomats and high income level
Situation in this area has not changed. This area should be kept as it is. Do not want consular offices
Maintain the character/conservation

The Project on Integrated Urban Development Master Plan for the City of Nairobi in the Republic of Kenya
Nippon Koei Co., Ltd. 6-25 Final Report IDCJ Inc. EJEC Inc.
Zone Status Ideas/Consideration 7 Mathare Valley, Lower
Haruma, Kariobangi, Dandora High density flats and informal settlements
Very high density sometimes over 1,000 p/ha.
High-rise flat construction is active in this area.
Land readjustment
8 Old Eastland, Komarock, Kayole Old city council housing scheme.
High-rise and high-density redevelopments are planned.
Promote mixed use
9 Main Industrial Area Industries and godowns developed area
Transportation services change from rail to motor vehicle.
Some factories are moving out of Nairobi City.
Investment flight/with conversions/decay
Revitalisation of industrial area
9E Other Industrial Area (Dandora, Kariobangi, Mathare North) All area developed.
Some industrial area changing to mixed development.
Promote mixed development
10 Nairobi West, Madaraka, South ‘B’, Medium-density, low-rise residential in mixed type development
Lower density developments for middle-income families (less than 200 p/ha) are occurring in large area.
Promote residential environmental improvement for middle-income families
10E Villa Franca, Imara-Daima, Embakasi Planned max. 35 units/ha
Some area Imara-Daima station area need higher density development as sub-centre.
11 Kibera Slum, NHC
Estates Informal mixed residential
Informal mixed residential improvement development schemes are ongoing.
12 Karen, Langata Low density residential for high income level
Land use change to office purpose along Langata Road can be seen.
Growth of universities and related developments – hostels
Existing plan to be reviewed to reflect recent changes
13 Gigiri, Garden Estate, Safari Park Low density residential for diplomats and high income level
Unauthorised conversions of use but the building remain
More UN and missions influx Hostels in Safari Park for University
Review to zone for low density and mixed development
14 Roysambu, Thome, Marurui Low density residential
Variety character – high rise, comprehensive development
Former plantations converted into housing, land for public uses and circulation network/social infrastructure was irregularly allocated
Re-zoned into two – high density mixed development and low density
Provide for public uses and circulation network/social infrastructure
15 Dagoretti High-density residential and agricultural land use
Changing to high-rise residential development.
Sections under agricultural land use. Tenure is freehold, rapid subdivision.
At district level planning policy and zoning of land use with regard to land use
16 Baba Dogo, Ngumba, Ruaraka Industrial zone, residential mixed
Big shopping mall and residential project started at former factory site.
Newly development should be well organized
17 Githurai, Zimmerman, Kahawa West Industrial zone, residential mixed
High-density residential mixed development is spreading.
Thika Super Highway affects impact of magnitude.
Development ordinance should be re-considered
18 Kasarani (Cray work, Cray City, Kasarani, Mwiki, Ruai)
Many land subdivision without certain infrastructures can be seen in this area.
Areas along main roads are already developed as residential mixed area.
Last mile infrastructure is required
19 Special Scheduled Area outside Nairobi City Boundary Njiru area for detached housing site development
Many land subdivision without certain infrastructures can be seen in this area.
Solid waste dumping site is planned east of sewerage treatment plant.
Infrastructure installation is required.

The Project on Integrated Urban Development Master Plan for the City of Nairobi in the Republic of Kenya
Nippon Koei Co., Ltd. 6-26 Final Report IDCJ Inc. EJEC Inc.
Zone Status Ideas/Consideration 20 Public/Strategic Reserved
Area Include statehouse, airports, military sites
This land will remain to have the same purpose.
Expansion area of JKIA will be reserved.
Military site located north of JKIA might be considered for urban development.
20E Recreational & Forest, National Park, Stadiums, Park
Basically, these areas should be conserved as they are.
Area between Mombasa Road and National Park will be used for industrial and transport purposes.
Source: JICA Study Team (JST)
6.4.4 Principal Policy for Land Use Plan 2030
(1) Principal Policy for the Nairobi Land Use Plan 2030
The following are the principal policies for the Nairobi Land Use Plan 2030.
Table 6.4.6 Principal Policy for Nairobi Land Use Plan 1 Decentralise business,
administrative and commerce functions
Sub-centre system (bi-polar corridor development *See Table 6.3.1) will be adopted with new urban transport network to subdivide business functions.
Land use regulation for sub-centre areas will be revised to activate their function and to accommodate growing population.
CBD should be re-developed to revitalise city centre. 2 Expand and renovate CBD KRC’s railway yard to be developed for new urban core. 3 Supply appropriate housing
for all Urban re-development from low density residence to medium
to high density residence is necessary. Appropriate housing scheme for low income is necessary as
social services. 4 Preserve and restore green and
water environment to create ecological network
Existing forests and woods should be preserved. River and river banks will be restored to open recreational
space. 5 Conserve agricultural
activities Agricultural activities should be conserved for diversification
of the land use. 6 Restructure industrial area
New industrial areas will be allocated in southern part of the
city. Existing industrial area should be re-developed for new urban
function. 7 Beautify the city for Kenyan
pride Urban landscape regulation should be established to keep
historical beauty for the citizen.
(2) Decentralise Business, administrative and Commerce Function
The land use zoning and plot ratio of sub-centres will be changed to promote the decentralisation of business, administrative and commerce functions from the central to suburban locations.

The Project on Integrated Urban Development Master Plan for the City of Nairobi in the Republic of Kenya
Nippon Koei Co., Ltd. 6-27 Final Report
IDCJ Inc.
EJEC Inc.
Source: JICA Study Team (JST)
Figure 6.4.6 CBD and Sub-centres
(3) Supply Appropriate Housing for All
The Constitution of Kenya, 2010 states in Clause (b) of Section (1) in Article 43 that “Every person has the right to accessible and adequate housing and to reasonable standards of sanitation”. And the National Land Policy also states in Clause 213 in Section 3.6.9 the following: “(c) Put in place appropriate mechanisms for removal of squatters from unsuitable land and their resettlement,” and “(e) Ensure that land subject to informal settlement is developed in an ordered and sustainable manner”.
Provision of housing for low income people is an important responsibility of the central and county governments.
Appropriate allocation of residential land use and its densification setting is important to accommodate required housing in Nairobi City.
(4) Create Ecological Network
Nairobi City has rich forests, woods, extensive national park, and river network. These ecological environments should be connected for animal friendly network and biodiversity.

The Project on Integrated Urban Development Master Plan for the City of Nairobi in the Republic of Kenya
Nippon Koei Co., Ltd. 6-28 Final Report IDCJ Inc. EJEC Inc.
Source: JICA Study Team (JST)
Figure 6.4.7 Ecological Environment in Nairobi City
(5) Conserve Agricultural Activities
Historically, the western part of Nairobi City was developed as a farm land with rich soil and rainfall. Staple agricultural activities should remain for the sake of land use diversity.
(6) Restructure Industrial Areas
The industrial area of Nairobi City will be expanded to the south near JKIA and the planned new railway freight station in Embakasi.
Source: JICA Study Team (JST)
Figure 6.4.8 Industrial Land Use Restructuring
Embakasi: Industrial area expansion utilizing air and rail connectivity
Ruai: Proposed solid waste dumping site
North of Lusaka Road: Land use transfer from industrial use

The Project on Integrated Urban Development Master Plan for the City of Nairobi in the Republic of Kenya
Nippon Koei Co., Ltd. 6-29 Final Report
IDCJ Inc.
EJEC Inc.
6.4.5 Central Business District Development
(1) Position and Issues of the Nairobi City’s CBD
As discussed in the Development Vision of Nairobi City County 2030, Nairobi City is not only the capital city of Kenya but also one of the leading economic centres of East Africa Region, and thus its CBD should become a symbol of active economy and its function should be strengthened to match the vision. The strengthening of CBD is also critical to support an efficient urban transport system. Nairobi City has a predominantly radial road network structure which originates to and from CBD, and the proposed LRT and Bus Rapid Transit (BRT) are also concentrated to and from CBD.
Yet, the current condition of CBD is not as efficient as it should be, due mainly to a lack of coordination amongst stakeholders including the proposed Railway City Development and concentration of transport modes around Nairobi Station area. There are a few large inter-city bus terminals in one area within CBD, and this creates acute traffic congestion in CBD.
(2) Expansion of Nairobi City’s CBD
The current CBD boundary is marked by roads such as Uhuru Highway on the west, University Avenue on the north and Haile Selassie Avenue. Throughout its history, CBD has been developed as an administrative centre and a market place. It was the hub for buying and selling of goods and services. As the city grew, CBD also developed, and CBD turned out to be a commercial and retail centre. In the mid-20th century, CBD developed into a centre of finance and provided for private and public office space. Additionally, a number of tall buildings made the area denser and lifted its skyline. Under the influence of this economic growth, the expanded CBD, which is shown in Figure 6.4.9, was proposed to consider the collective development strategy under the Spatial Planning Concept for Nairobi Metropolitan Region, which was adopted by JST.
Source: Spatial Planning Concept for Nairobi Metropolitan Region
Figure 6.4.9 Boundaries of the CBDs
(3) Building Survey for the Expanded CBD
Despite the fact that CBD plays important urban functions in Nairobi City, it was difficult to grasp the current situation closely, due to the absence of detailed investigation for this entire area. For this reason, a building survey for the expanded CBD has been implemented from 17 to 21 June 2013 by JST and NCC jointly to clarify the actual situation of the area and analyse obstacles for the economic
Current CBD
Expanded CBD

The Project on Integrated Urban Development Master Plan for the City of Nairobi in the Republic of Kenya
Nippon Koei Co., Ltd. 6-30 Final Report
IDCJ Inc.
EJEC Inc.
activities. This building survey covers most of the area of the expanded CBD except for Railway City area around Nairobi Station. The survey area is shown in Figure 6.4.10.
Source: JICA Study Team (JST) Figure 6.4.10 Survey Area (Expanded CBD without Railway City)
The following are some of the observations from the survey:
1) Floor Use Distribution
In case of Nairobi City’s CBD, more than 75% of the floor is utilised for commercial use (office, commercial and accommodation facilities including hotels and guest houses). This feature is a general feature of CBD, and it shows that commercial facilities and offices are accumulated in this area. One of the interesting features of the Nairobi City’s CBD is the ratio of educational floor. The Nairobi City’s CBD has the University of Nairobi and satellite campus of some other universities in its northern part called “University District”. This area provides some potential opportunity for collaboration of the researching facilities and private companies, and provide for creating a new business by using the new skills, knowledge and human resources from the “University District”. The residential buildings which are located in Nairobi City’s CBD are medium/low-rise units standing on small lots (200 m2 – 250 m2). For this reason, Nairobi City’s CBD does not provide much residential space, and the percentage of the residential use is low (4.7%).

The Project on Integrated Urban Development Master Plan for the City of Nairobi in the Republic of Kenya
Nippon Koei Co., Ltd. 6-31 Final Report
IDCJ Inc.
EJEC Inc.
Note: In case of Chuo District of Tokyo, floor area of parking is included in each floor use. However, it is
estimated at 10% from the “Land Use of Tokyo” published by Tokyo Prefecture in 2012. Source: JICA Study Team and Land Use of Tokyo in 2013
Figure 6.4.11 Floor Use Distribution
2) Current Ground Coverage Situation (Plot Ratio)
According to the Development Ordinance of Nairobi City, the maximum values of ground coverage (GC) and plot ratio (PR) of subzones are specified in the following Table 6.4.7.
Table 6.4.7 GC and PR in the Expanded CBD Areas Covered GC (%) PR (%) Type(s) of Development
Allowed Min. Area
(ha) Core CBD 80 600
Commercial Residential Light Industry
0.05
Peri- CBD 80 500 West of Tom Mboya Street 60 600 East of Tom Mboya Street 80 350 Uhuru H/W, University Way, Kipande Road 80 500
Source: A Guide of Nairobi City Development Ordinances and Zones
Figure 6.4.12 shows the average value of PR for each zone. In case of zone C, in spite of the PR specified by Development Ordinance as 600%, the current PR is 385%. The usage ratio of PR is only 64%. Majority of the zones in CBD have not adequately used up the maximum PR. Especially the average PR east of Tom Mboya Street is about 200% (zone E = 209%, zone F = 185%), and this ratio is for the low-rise residential area rather than for CBD. While CBD is generally supposed to have higher development potential than other areas, Nairobi City’s CBD does not utilise its full potential, and it has low-rise buildings in some crowded plots. It is expected to further extend the CBD vertically (or higher in the skyline) to solve the low-utilisation issue.

The Project on Integrated Urban Development Master Plan for the City of Nairobi in the Republic of Kenya
Nippon Koei Co., Ltd. 6-32 Final Report
IDCJ Inc.
EJEC Inc.
Source: JICA Study Team (JST)
Figure 6.4.12 Consumed Plot Ratio of Each Zone in the Expanded CBD
Table 6.4.8 Comparison between Development Ordinance and Ground Situation
Zone Development Ordinance
Specification Current Ground Situation B/A
GC (%) PR (%) A GC (%) PR (%) B A 80 500 30 87 17% B 80 500 51 375 75% C 80 600 36 386 64% D 60 600 53 272 45% E 80 350 59 210 60% F 80 350 58 185 53% G 50 75 23 26 34% H 50 75 33 80 107%
Source: JICA Study Team (JST)
According to this survey, approximately 353 million m2 in total of floors are remaining as unused and can be developed in the CBD. The remaining developable floors have a huge value, which is estimated to be equivalent to KSh466 billion/month, if rented at the market price.
Table 6.4.9 Remaining Developable Floor Area
Zone A B C D E F G H Total
Current 21,922 95,814 187,493 21,557 46,647 50,200 6,054 12,441 442
Potential 126,276 127,879 291,689 47,522 77,902 94,768 17,764 11,607 795
Remaining 104,354 32,064 104,196 25,965 31,254 44,568 11,710 -834 353
Unit (1,000sqm)
Source: JICA Study Team (JST)

The Project on Integrated Urban Development Master Plan for the City of Nairobi in the Republic of Kenya
Nippon Koei Co., Ltd. 6-33 Final Report
IDCJ Inc.
EJEC Inc.
Table 6.4.10 Estimation of Value at Real Estate Market for Rent in the CBD Floor Use % Remaining (1,000㎡) Unit Price (ksh/sqm) Amount (bln ksh)
Office 47.7% 168,390 1,000 168.4Commercial 20.0% 70,602 2,500 176.5Accommodation 8.4% 29,792 2,500 74.5Educational 6.6% 23,167 1,000 23.2Residential 4.7% 16,468 640 10.5Parking 3.5% 12,443 300ksh/lot 5.2Industrial 2.0% 6,929 300 2.1Health 1.7% 5,939 1,000 5.9Worships 1.1% 3,798 0 0.0Caltural 0.6% 2,256 0 0.0Recreational 0.5% 1,917 0 0.0Other 3.3% 11,576 0 0.0Total 100.0% 353,277 466.3 Source: JICA Study Team (JST)
3) Parking Analysis
The number of parking spaces in the CBD is estimated in Table 6.4.11 from their total area. Generally, the size of a parking lot for one ordinary vehicle is 30.0 m2. This size includes a parking lot (2.5 m * 6.0 m) and an area for driveway and appurtenant facility such as a staircase. Therefore, approximately 6,000 lots are now available in CBD for visitors or workers that come to the CBD. (This figure does not include roadside parking.)
Table 6.4.11 Estimation of the Number of Parking Spaces in the CBD Multi-level Parking Open-air Parking
Area 152,842 m2 31,779 m2 Parking Space 5,095 spaces 1,059 spaces
Total 6,154 spaces Source: JICA Study Team (JST)
According to the Building Regulation which is published by MoL, a total of 129,000 parking spaces will be required for the existing buildings, resulting in a gap of 123,000 parking spaces.
Table 6.4.12 Comparison between Japanese and Kenyan Parking Regulation
Land UseFloor Area for 1parking Space Land Use
Floor Area for 1parking Space
Commericial & Hospital 250 sqm Commericial & Public 50 sqmOffice 300 sqm Office 25 sqmResidential and Others 300 sqm Residential and Others 100 sqmResult 14,129 spaces Result 128,906 spacesGap 7,975 spaces Gap 122,752 spaces
Kenyan StandardJapanese Standard
Source: JICA Study Team (JST)
This gap means that a large number of cars cannot park in either multilevel parking or public open-air parking in CBD. These cars, together with waiting taxies and matatu, are hindering traffic flow in major roads in CBD. For this reason, it is necessary to construct new multilevel parking and/or to develop a public transportation system instead of private cars.

The Project on Integrated Urban Development Master Plan for the City of Nairobi in the Republic of Kenya
Nippon Koei Co., Ltd. 6-34 Final Report
IDCJ Inc.
EJEC Inc.
Source: JICA Study Team
Figure 6.4.13 Low-utilised Open-air Parking and Roadside Parking in the CBD
(4) Development Concept for the CBD
1) Development Visions for the CBD
The development visions for CBD were discussed by the members in the Thematic Working Group (land use and human settlement) for a few occasions. Table 6.4.13 summarised the process of discussion. As a result, the Thematic Working Group created the following vision (No. 3) for CBD. One of the characteristic features of this development vision is to develop a pedestrian-friendly urban space which was strongly supported by the participants. As a result, a vision for “Urban Space” is elected independently.
Additionally, in the Thematic Working Group which was held on 1 October 2013, three important factors to implement the development plan, namely: 1) importance of a good master plan, 2) need of a strong commitment, and 3) multi-disciplinary approach, were shared from the development management method of world-class cities (Docklands of London, La Défense of Paris and West Shinjuku of Tokyo).
Table 6.4.13 Process of Discussion about Development Visions in Thematic Working Group # Date Ideas
1 28th May
Group 1 : Vibrant Green (and) 24-hr (attractive) city Group 2 : High Density Centre of Commerce Group 3 : Creative, Smart and Secure City that Promotes Vibrant Green Spaces and Efficient Transport System
2 12th June Vibrant, Efficient, Compact, Creative, Smart, Green, Competitive, Inclusive and Livable City
3 6th Sep
1) Economy : Promote an inclusive urban economy 2) Transport : Efficient, effective, and inclusive transport system 3) Environment : Healthy, green, thriving, and secure Nairobi City 4) Urban Space : Pedestrian-friendly urban space
4 1st Oct
Inportant factors to implement the development plan 1) Importance of a good master plan 2) Need of a strong commitment 3) Multi-disciplinary approach
Source: JICA Study Team
Based on the discussion, the development vision of CBD is proposed as “compact urban centre that is creative, livable, green, efficient, competitive and inclusive”. “Compact” means that a variety of urban functions is available in the limited area which provides

The Project on Integrated Urban Development Master Plan for the City of Nairobi in the Republic of Kenya
Nippon Koei Co., Ltd. 6-35 Final Report IDCJ Inc. EJEC Inc.
pedestrian-friendly environment and promotes efficient land utilisation for commercial, residential, and social activities.
Four pillars of development are identified as follows:
1) Economy : Promote an inclusive urban economy 2) Transport : Efficient, effective, and inclusive transport system 3) Environment : Healthy, green, thriving, and secure Nairobi City 4) Urban Space : Pedestrian-friendly urban space
The development vision and four pillars of development are illustrated in Figure 6.4.14 below.
Figure 6.4.14 Development Vision of CBD
The functions of CBD are proposed to include business and commerce, residential, public, transport, art and culture, and academic functions.
2) Concept of the Greater CBD Development
In order to strengthen the CBD function, a comprehensive approach is necessary including enhancing the road network, possible introduction of a monorail, installation of new urban facilities, and promoting spatial development. In addition, the surrounding area of CBD including the Upper Hill and area along Lusaka Road should be consolidated to the existing CBD to make a greater and stronger CBD under this comprehensive approach. For this reason, JST proposed the greater CBD as shown in Figure 6.4.15 below.
“Compact urban centre that is creative, livable, green, efficient, competitive and inclusive”

The Project on Integrated Urban Development Master Plan for the City of Nairobi in the Republic of Kenya
Nippon Koei Co., Ltd. 6-36 Final Report
IDCJ Inc.
EJEC Inc.
Figure 6.4.15 Area of the Greater CBD
The following components are proposed for CBD development:
i) Road network:
The road network is to be developed to strengthen linkage in CBD (CBD and railway city, and other areas), and based on hierarchy of types of roads to promote smooth traffic flow. The current poor and partial road connectivity causes heavy traffic concentration to particular roads and results in traffic congestion. Thus, JST proposes access roads to improve road connectivity in the Greater CBD as shown in Figure 6.4.16 below.
Figure 6.4.16 Road Network of the Greater CBD
In addition, pedestrian walkways will be developed because one of the characteristics of Nairobi CBD identified is a large number of pedestrians (pedestrian walkways will link CBD with open space and green corridor).
Greater CBD
Expanded CBD
Existing network Proposed new road Expansion of road
Elevated road

The Project on Integrated Urban Development Master Plan for the City of Nairobi in the Republic of Kenya
Nippon Koei Co., Ltd. 6-37 Final Report IDCJ Inc. EJEC Inc.
ii) New Urban Transport System (Loop Monorail Line)
A monorail line is proposed for consideration in a circular route in CBD, which will link Railway City and Upper Hill to reduce inflow of traffic to the existing CBD. Monorail stations also function as junction of radial roads that are concentrated around Nairobi Station.
iii) Urban Facilities
Urban facilities include bus terminal, Nairobi Station Square, open space, and green corridor.
• Relocation of bus terminal: one of the major causes of traffic congestion in and around CBD is the existence of a number of bus terminals in CBD. Bus terminals are located in the centre of CBD and all bus routes terminate at this bus terminal. Bus terminals will be relocated and dispersed depending on the destination.
• Nairobi Station Square: Nairobi Station is a gateway of the city. Nairobi Station Square will be developed to provide multimodal function as well as serve the urban amenity for enhancing livable environment not only to residents but also to visitors.
• Open space and green corridor: Public parks (City Park, Uhuru Park) and enhanced green corridor are proposed to improve urban amenity for both residents and visitors. Together with Nairobi Station Square development, open space and green corridor are expected to create livable and green environment. Pedestrian path improvement is also implemented together.
iv) Future Land Use Concept and Development Ordinance
To clarify development policy for the Greater CBD, land use concept is proposed as below. The area where Nairobi Station is currently located is proposed for mixed commercial and institutional use to enhance urbanisation of CBD and utilise its development potential. Residential area and mixed residential and commercial use area are proposed for the periphery of the Greater CBD to ensure space for residents. Regarding the residential use, it should be noted that the southern part of the Upper Hill area has a potential as a residential area for middle-high income families.
Note: Mixed Use of RC: means mixed use of residential and commercial use Mixed Use of CI: means mixed use of commercial and institutional use
Figure 6.4.17 Land Use Concept of the Greater CBD
Educational
Mixed Use of CI
Mixed Use of RC
Mixed Use of RC
Residential
Mixed Use of CI
Educational
Recreational RecreationalRecreationalResidential

The Project on Integrated Urban Development Master Plan for the City of Nairobi in the Republic of Kenya
Nippon Koei Co., Ltd. 6-38 Final Report IDCJ Inc. EJEC Inc.
As mentioned in Subsection 6.4.5 (3), current development ordinance (plot ratio and ground coverage) is not fully utilised. For this reason, it is necessary to encourage maximum utilisation of the current development ordinance, rather than to increase the current development ordinance.
v) Spatial Development
Spatial development here means urban development in the selected area, and covers all aspects of urban development, infrastructure development, land management, and financing of the development. Land re-adjustment project and urban renewal projects are proposed to accelerate the spatial development in CBD. In addition, new land use zones for efficient land utilisation will be developed.
Source: JICA Study Team (JST)
Figure 6.4.18 Spatial Development Plan for the Greater CBD
6.4.6 Sub-centres Development Concept
(1) Sub-centres Discussion
Development directions of sub-centres were discussed during two Technical Working Group (TWG) meetings on 25 July and 27 August. The proposed sub-centres are as follows:
(i) Upper Hill South
(ii) Karen-Langata
(iii) Runda-Ruaka
(iv) Dandora
(v) Imara-Daima
(vi) Makadara
(vii) Kasarani
(viii) Ruai
(ix) Other Sub-centres
The following are the main recommendations from the TWG members:
Monorail Line
Railway City
Land Readjustment Area
Urban Renewal Area (Housing)

The Project on Integrated Urban Development Master Plan for the City of Nairobi in the Republic of Kenya
Nippon Koei Co., Ltd. 6-39 Final Report IDCJ Inc. EJEC Inc.
(i) Recognise restrictions and challenges in areas such as Karen: Involve resident’s associations
(ii) Encourage sustainable mixed use development in proposed nodes: Safety, connectivity, walkability
(iii) Harmonise plot ratios in targeted areas: Explore possibilities for developer incentives
(iv) Involve Kenya Railways: Increase connectivity from CBD to industrial area and link with KRC Master Plan
(v) Considerations for Upper Hill: Conservation of historic areas, road connectivity, increased plot ratios
(vi) Provide more nodes for Eastland Areas: Increasing nodes in Eastland to manage high volume of trips
(vii) Need sub-centre around JKIA and Embakasi: Hotel demand near JKIA and industrial potential also high in this area
(2) Priority of Sub-centres Development
The development hierarchy of sub-centres is summarised based on location, land use, and transportation connectivity for development potential as shown in Table 6.4.14 below.
Table 6.4.14 Priority of Sub-centres Development Sub-centre Location and Land Use Transportation Connectivity Priority Upper Hill South
Close to CBD Concentration of governmental functions A
Ngong Road is main access road to this area. Accessibility is required. A A
Westland Existing commercial and business concentration
A Node of Waiyaki Way and Ring Road
A A
Makadara and Eastland
Located at centre of Eastland is residential area and southern part is NRC unused land
A Node of Makadara Railway Station
and Jogoo Road A A
Dandora Located south of Dandora estate where more than 130,000 people are living A
Dandora Railway Station and Koma Rock Road A B
Donholm Residential and commercial B Node of Jogoo Road, Outer Ring
Road and Railway C B
Imara-Daima Located between residential area and industrial area
B Node of railway and Mombasa Road
A B
Kasarani Sport complex, commercial and
residential mixed A Node of Thika Super Highway and
Kamiti road connecting to Northern Bypass
B B
Guithurai Residential and military barrack C Node of Guithurai Railway Station
and Northern Bypass C C
Langata Commercial, residential, and institutional use B
Node of Langata Road and Magadi Road A B
Karen
Residential and commercial use Located in low density residential
B
Node of Ngong Road and Langata Road
Southern Bypass will connect to Ngon Road soon.
B B
Woodley Institutional, commercial and residential B Node of Woodley Railway Station
and Ngong Road B B
Dagoretti Residential C Node of Dagoretti Railway Station
and Dagoretti-Karen Road C C
Kabete Office and commercial use Recently developing as office area
B Node of Waiyaki Way and James
Gichure Road B C
Uthiru Institutional and commercial B Node of Waiyaki Way and Naivasha
Road C C-

The Project on Integrated Urban Development Master Plan for the City of Nairobi in the Republic of Kenya
Nippon Koei Co., Ltd. 6-40 Final Report IDCJ Inc. EJEC Inc.
Sub-centre Location and Land Use Transportation Connectivity Priority
Runda-Ruaka Residential and agricultural use B
Node of Northern Bypass and missing Ring Road
C B-
Airport North Industrial and residential B Node of Eastern Bypass and Outer Ring Road
B B
Shokimau
Industrial use and undeveloped land
B
Node of Shokimau Railway Station and Mombasa Road
Park and ride station facility for the southern area of Nairobi City
A B
Ruai Residential and undeveloped land but developing rapidly
C Node of Eastern Bypass and Kangundo Road
B B-
Source: JICA Study Team (JST)
(3) Sub-centres Development
1) Upper Hill South
i) Key Issues
The land use zoning of this area was revised in 1993 in the Upper Hill Rezoning Plan, and was studied again in 2008.
A number of large size buildings are under construction, mainly for offices and hotels. Development pressure is significantly high especially for financial offices.
Road upgrading work is ongoing. Connectivity to Ngong Road is improving but connections to other roads such as Uhuru Highway, Langata Road and Mbagathi Road are insufficient.
The southern fringe of the hill is for the single dwelling land use, and there are several historical housing buildings remaining, although some of them were demolished for redevelopment.
Accessibility to Kenya National Hospital is a problem especially the access from Wilson Airport in case of emergency.
Source: JICA Study Team (JST)
Figure 6.4.19 Key Issues in Upper Hill South

The Project on Integrated Urban Development Master Plan for the City of Nairobi in the Republic of Kenya
Nippon Koei Co., Ltd. 6-41 Final Report
IDCJ Inc.
EJEC Inc.
ii) Proposed Urban Function Structure
Main part of the area is business mixed use zone including some apartment land use. Additional access roads are necessary, especially to the west, east, and south. Historical single dwelling buildings should be preserved for the next generation.
Source: JICA Study Team (JST)
Figure 6.4.20 Proposed Urban Function Structure in Upper Hill South
iii) Discussion
Maximum height in this area should be determined from the aviation regulation.
2) Karen-Langata
i) Key Issues
Local Physical Development Plan (LPDP) for Zone 6, 12 and 20 B was studied. Langata Road is planned to be widened to a four-lane road. Three office complex developments and some car garages can be seen along Langata
Road. Some landowners plan to convert a part of their land for commercial purpose.

The Project on Integrated Urban Development Master Plan for the City of Nairobi in the Republic of Kenya
Nippon Koei Co., Ltd. 6-42 Final Report
IDCJ Inc.
EJEC Inc.
Source: JICA Study Team (JST)
Figure 6.4.21 Key Issues in Karen-Langata
ii) Proposed Urban Function Structure
An existing shopping centre at the junction of Ngong Road and Langata Road will remain the same.
The triangle area west of Karen Road will be developed for a new urban function. PR and maximum storey will be increased.
Commercial activities will be allowed along the widened Langata Road to avoid land use change in other residential area.
Source: JICA Study Team (JST)
Figure 6.4.22 Proposed Urban Function Structure in Karen-Langata

The Project on Integrated Urban Development Master Plan for the City of Nairobi in the Republic of Kenya
Nippon Koei Co., Ltd. 6-43 Final Report
IDCJ Inc.
EJEC Inc.
3) Runda-Ruaka
i) Key Issues
There is a UN compound and several embassies including the United States Embassy in Runda and Gigiri estates.
The area’s character is a low density residential district for high income residents including diplomats and UN staffs.
Northern Bypass has been opened north of this area, connecting to Limuru Road. Development projects for farm lands, which were formerly plantation, have applied for
permissions with high-rise apartments. There are residents around this area who are against big projects which may change its
environment. New road construction is planned to connect to Waiyaki Way and James Gichuru Road.
Source: JICA Study Team (JST)
Figure 6.4.23 Key Issues in Runda-Ruaka
ii) Proposed Urban Function Structure
Some area near Northern Bypass and Limuru Road can be for residential and commercial mixed land use, but low density and low rise buildings.
Northern part of the area should be for low density and low rise residential land use. The road from Waiyaki Way should be connected to near the junction of Northern
Bypass and Limuru Road.

The Project on Integrated Urban Development Master Plan for the City of Nairobi in the Republic of Kenya
Nippon Koei Co., Ltd. 6-44 Final Report
IDCJ Inc.
EJEC Inc.
Source: JICA Study Team (JST)
Figure 6.4.24 Proposed Urban Function Structure in Runda-Ruaka
4) Dandora
i) Key Issues
Railway to Thika passes through a high population density residential area. Koma Rock Road serves the transport function poorly for high density Dandora. Public institutions’ facilities and factories occupy a large plot around Dandora Station.
Total of 80 ha of lands are suitable for sub-centre development. Power line wayleave is also occupying much area especially along Kangundo Road. Dandora Dumping Site will be closed soon because of its capacity.
Source: JICA Study Team (JST)
Figure 6.4.25 Key Issues in Dandora

The Project on Integrated Urban Development Master Plan for the City of Nairobi in the Republic of Kenya
Nippon Koei Co., Ltd. 6-45 Final Report
IDCJ Inc.
EJEC Inc.
Source: JICA Study Team (JST)
Figure 6.4.26 Suitable Land for Development in Dandora
ii) Proposed Urban Function Structure
Surrounding areas of Dandora Station should be developed into a high density residential and commercial mixed development.
Access roads between Kangundo and Koma Rock roads are necessary. If PR=300% is to be applied, housing for about 24,000 population can be
accommodated. Underground installation of power lines should be considered to utilise its wayleaves
which account for more than 30 ha area. Koma Rock Road should be improved together with Dandora Station development.
Source: JICA Study Team (JST)
Figure 6.4.27 Proposed Urban Function Structure in Dandora

The Project on Integrated Urban Development Master Plan for the City of Nairobi in the Republic of Kenya
Nippon Koei Co., Ltd. 6-46 Final Report
IDCJ Inc.
EJEC Inc.
iii) Discussion
Land ownership of power line wayleaves should be considered. Also, an attractive development scheme is required for redevelopment.
5) Imara-Daima
i) Key Issues
Construction of the Kenya Railways Corporation (KRC’s) commuter railway station is ongoing.
Originally, zoning of this area is for light industrial land use. It should be changed to commercial and residential mixed use including social functions.
The access road to the station is weak and is not adequate. North to east area of the station is Mukuru informal settlement area. Large numbers of informal settler live on the wayleave of railway and power line. Mukuru settlers need an access road to the main roads. Kenya Power Authority and a church occupy a large land near the station. The church (International Christian Church) has their development plan approved by
NCC. Planning coordination is required. About 37 ha of land can be developed for urban function.
Source: JICA Study Team (JST)
Figure 6.4.28 Key Issues in Imara-Daima
ii) Proposed Urban Function Structure
Direct access roads to the station from Mombasa Road and Enterprise Road should be installed.
It is necessary to renovate the overpass of Mombasa Road to widen the underpass space and to secure the safety of pedestrian.

The Project on Integrated Urban Development Master Plan for the City of Nairobi in the Republic of Kenya
Nippon Koei Co., Ltd. 6-47 Final Report
IDCJ Inc.
EJEC Inc.
Source: JICA Study Team (JST)
Figure 6.4.29 Proposed Urban Function Structure in Imara-Daima
iii) Discussion
Access road from Imara-Daima residential area and Mukuru informal settlement should be developed.
6) Makadara
i) Key Issues
Most part of Eastland is constructed for African residents before the independence and is planned for re-development by NCC.
Construction of KRC commuter rail station at Makadara is ongoing. More than 110 ha of the large KRC railway yard (3.5 km x 400 m) is located between
existing railway and industrial area. The industrial area was developed with railway network during the British rule.
However, the rail is seldom utilised nowadays.

The Project on Integrated Urban Development Master Plan for the City of Nairobi in the Republic of Kenya
Nippon Koei Co., Ltd. 6-48 Final Report
IDCJ Inc.
EJEC Inc.
Source: JICA Study Team (JST)
Figure 6.4.30 Key Issues in Makadara
(ii) Proposed Urban Function Structure
Station square should be developed next to Makadara Station to connect to Jogoo Road.
Railway yard function of Nairobi Central Station should be relocated to a part of this area.
Other part is developed as residential and commercial mixed land use. This area can be the relocation place for Eastland redevelopment project.
Source: JICA Study Team (JST)
Figure 6.4.31 Proposed Urban Function Structure in Makadara

The Project on Integrated Urban Development Master Plan for the City of Nairobi in the Republic of Kenya
Nippon Koei Co., Ltd. 6-49 Final Report
IDCJ Inc.
EJEC Inc.
iii) Discussion
Connection function between industrial area and Eastland should be considered especially connectivity to Makadara Station.
7) Kasarani
i) Key Issues
Thika Super Highway construction was completed in 2012, which improved traffic flow along this road.
However, the area was divided by Thika Super Highway with limited crossing points. The division causes unnecessary traffic movements.
Development activities along Thika Super Highway are lively, and population growth in this area is quite high.
A 2.5 km2 reserve land is located next to Moi Sports Complex. District development concept is required.
Garden City development is ongoing at the site where a beer factory previously stood.
Source: JICA Study Team (JST)
Figure 6.4.32 Key Issues in Kasarani
ii) Proposed Urban Function Structure
Kasarani Sports Complex should be developed to invite international sports competition event. Surrounding vacant land could be utilised for accommodation and other sports and commercial facilities.
Collector road network should be designed. iii) Discussion
Undeveloped 8.5 ha land located next to Thika Road Mall can be utilised for sub-centre function.
Functional network system as a sub-centre is required in this district. Development concept for Moi Sports Complex District is required.

The Project on Integrated Urban Development Master Plan for the City of Nairobi in the Republic of Kenya
Nippon Koei Co., Ltd. 6-50 Final Report
IDCJ Inc.
EJEC Inc.
8) Ruai
i) Key Issues
There are plenty of undeveloped lands in Ruai and Njiru areas. However, most of the lands near the junction of Southern Bypass and Kangundo Road
are subdivided for detached housing, not for large development such as apartment or commercial building.
Urban function such as commercial, business, institutions, and traffic terminal are not planned well in this area.
ii) Proposed Urban Function Structure
Urban function zone should be planned near the Ruai junction to serve urban services. Collector road network is necessary to avoid traffic jam at the junction.
Source: JICA Study Team (JST)
Figure 6.4.33 Key Issues in Ruai
iii) Discussion
Alternative location for Ruai Sub-centre should be considered. Ruai Town centre along Kangundo Road is recommended.
6.4.7 Priority Projects
(1) CBD Development
Amongst the development components, four priority projects for CBD development are selected to form CBD as follows:
1) Railway City Project
Utilisation of existing railway land by public-private partnership with KRC

The Project on Integrated Urban Development Master Plan for the City of Nairobi in the Republic of Kenya
Nippon Koei Co., Ltd. 6-51 Final Report IDCJ Inc. EJEC Inc.
Figure 6.4.34 Development Image of Railway City
2) Land readjustment project for east of Tom Mboya Street (* long term project) Improvement of existing road conditions, intensive land use, etc.
The land for Railway City project is owned by KRC, and the size is about 100 ha. In the Thematic Working Group held on 1st October, the participants shared a common view for the CBD development which was reconsideration about regeneration for this 100 ha area that was required to link with other functions and utilise the potential effectively. For the implementation, the linkage and coordination amongst national government including Ministry of Lands, Housing and Urban Planning, KRC, NCC, and private development partners are necessary.
The proposed implementation framework for the Railway City is shown as follows:
Figure 6.4.35 Implementation Framework for the Railway City Project
In order for securing smooth development, new implementing measures are introduced.
Conversion of the Development Right
Take the land use in core CBD for a historical building, such as the parliament as an example. Because of the heritage building, it is difficult and inappropriate to reconstruct the buildings in this area. Instead of reconstruction, a new regulation can be devised to make it possible for the landowner to sell/lease the right of the development (remaining plot ratio) to another party
Flyover
Railway City (100ha)
Nairobi Sta.

The Project on Integrated Urban Development Master Plan for the City of Nairobi in the Republic of Kenya
Nippon Koei Co., Ltd. 6-52 Final Report
IDCJ Inc.
EJEC Inc.
in some specific area like inside of the extended CBD or sub-centre. Therefore, this regulation can support to utilise the idle PR, if there is a land which is difficult to use up the PR.
Figure 6.4.36 Conversion of the Development Right
Relaxation of Plot Ratio by Construction of Additional Car Parking
Parking survey showed a shortage of parking spaces in CBD. For this reason, it is necessary to construct new parking spaces to cater to the people’s need for parking and remove roadside parking. With a scarce budget, it may be difficult to build new parking spaces. Thus, a new regulation can be devised to allow the developer to receive additional PR if they undertake additional parking spaces beyond the obligated.
(2) Sub-centre Development
JST picked up several sub-centre development areas in the above section. Some areas already have some development activities in progress or in preparation of development project plans. Consideration of detailed land use plan and urban facilities plan is necessary. The development areas listed below are priority development zones to be planned in the short-term period.
1) Objectives
To draw up the sub-centre development detailed plan to improve transportation network and to utilise development potential of these areas.
2) Possible area
(i) Dandora Station area
Dandora area is one of the inconvenient areas to commute to the city centre because of bad road condition and road network. Dandora Station is one of the commuter rail stations and there is a certain space for development around the station. It is a good case for re-development around rail stations.
(ii) Eastlands (including Makadara Station)
Re-development projects are going to start soon and new Makadara Station for commuter rail has just opened. It is good opportunity to change urban structure of this area. Certain detailed master plan for this area is necessary to manage all related projects.

The Project on Integrated Urban Development Master Plan for the City of Nairobi in the Republic of Kenya
Nippon Koei Co., Ltd. 6-53 Final Report
IDCJ Inc.
EJEC Inc.
(iii) Imara-Daima Station area
Imara-Daima Station has just opened as a commuter rail station. Large informal settlement area is just near the station. However, road connectivity and detailed plan have not been considered. Thus, it is necessary to consider detailed plan for this area.
(iv) Embakasi New Railway Station area
Construction of new railway line connecting Mombasa and Nairobi City has just started. New freight station is planned in Embakasi. Revision of land use regulation and detailed plan are necessary for this area to maximise the industrial potential of Nairobi City.
(v) Woodley Station area
Ngong Road is planned to be widened to a 4-lane road with the JICA fund. Also, new transport line is planned on Ngong Road. Woodley Station will be the transfer terminal station of these transportation networks. Detailed plan is required.
3) Development Items
• Detailed land use plan
• Road and transportation plan
• Implementation plan
4) Responsible Organisations
NCC will be the main responsible organisation. Others are possibly Kenya Railway Corporation, National Roads Authority (newly merged road authority), and National Housing Corporation.
(3) Local Physical Development Plan (LPDP)
NCC has currently been stopping approval of many development projects during the drafting period of the Nairobi Integrated Urban Development Master Plan (NIUPLAN) and consequently facing high pressure from developers to ease existing regulation and approve their plan especially in Zone 3 (Westland, Parkland), Zone 4 (Spring Valley, Kileleshwa, Kilimani), and Zone 5 (Upper Spring Valley, Lavington) areas. LPDPs or detailed land use plan studies are required immediately for control development activities.

The Project on Integrated Urban Development Master Plan for the City of Nairobi in the Republic of Kenya
Nippon Koei Co., Ltd. 6-54 Final Report
IDCJ Inc.
EJEC Inc.
Braxton Atamu, Martin Luther Primary School (Rank 3 of Class 5)

The Project on Integrated Urban Development Master Plan for the City of Nairobi in the Republic of Kenya
Nippon Koei Co., Ltd. 7-1 Final Report IDCJ Inc. EJEC Inc.
CHAPTER7 URBAN TRANSPORT DEVELOPMENT PLAN
7.1 Urban Transport
7.1.1 General
(1) Objective of Study on Urban Transport
Future transport network system is investigated taking into consideration the present network, road development projects, land and facility development projects, and land use plan. The basic level of the study is a conceptual plan and it identifies the gap between the existing and necessary capacity estimated by demand forecast, shows the direction about how to fill the gap, and suggests system and institutions for implementation.
(2) Study Procedure
The study procedure for urban transport development plan is shown in Figure 7.1.1.
Source: JICA Study Team (JST) Figure 7.1.1 Procedure for Urban Transport Development Plan

The Project on Integrated Urban Development Master Plan for the City of Nairobi in the Republic of Kenya
Nippon Koei Co., Ltd. 7-2 Final Report IDCJ Inc. EJEC Inc.
7.1.2 Outline of Traffic Surveys
A comprehensive traffic survey was conducted by the previous Japan International Corporation Agency (JICA) project on urban transport for Nairobi, namely, The Study on Master Plan for Urban Transport in the Nairobi Metropolitan Area in the Republic of Kenya, March 2006 (hereinafter called NUTRANS). The actual traffic survey was conducted from March to September 2004.
The aim of the traffic surveys in the present Project is to update the result of the previous traffic surveys of 2006 and evaluate the variation of traffic movements thereafter.
(1) Objectives of the Traffic Survey
The major objectives of the traffic surveys in the Nairobi Integrated Urban Development Master Plan (NIUPLAN) are as follows:
(i) To update the result of the previous survey and evaluate the variation of traffic movement.
(ii) To analyse the effect of the transport infrastructure development after 2006.
(iii) To formulate the database for traffic forecast in 2030 because the target year of previous study was 2025.
(2) Outline of Traffic Survey
Seven types of surveys were conducted as shown in Table 7.1.1. Selection of survey types and survey methods was done in consideration of consistency with the 2006 Master Plan surveys. All the surveys were conducted from the beginning to the end of February 2013 to avoid the influence of the general election on 4th March.
Table 7.1.1 Summary of Traffic Survey No. Type of
Survey Purpose Method Contents of Survey 1 Person trip
survey To acquire information on the travel activities of residents such as origin, destination, trip purpose, travel time, etc.
Interview to sampled household members at their home and make questions
Interview to 10,000 households in Nairobi City
2 Stated preference survey
To obtain factors for preference of traffic mode selection to enhance use of public transport.
Interview to household members in the person trip survey.
2,000 samples
3 Cordon line survey
To capture traffic movement from/to Nairobi City area and complement the person trip survey
Interview to person at the major road crossing the cordon line of Nairobi City
Roadside interview survey (12 hr, 6:30-18:30): 14 survey points on one workdayRoadside traffic counts (12 hr, 6:30-18:30): 10 survey points on one workday Roadside traffic counts (24 hr, 6:00-6:00): 4 survey points on one workday
4 Screen line survey
To complement the person trip survey by capturing vehicle type, hourly variation, etc.
Traffic counts at the road crossing the screen line
Roadside traffic counts (12 hr, 6:30-18:30): 10 survey points on one workday Roadside traffic counts (24 hr, 6:00-6:00): 5 survey points on one workday
5 Traffic counts survey
To grasp general movement of traffic and to complement the traffic model
Roadside: traffic counts at major roads
Roadside traffic counts (12 hr, 6:30-18:30): 30 survey points on one workday
Traffic counts by direction at major intersections
Intersection traffic counts (12 hr, 6:30-18:30): 20 intersections on one workday
6 Public transport user survey
To acquire information on the movement and requirement of public transport passengers
Interview at the bus terminals to public transport passengers.
Interview to 1,500 passengers at major terminals in Nairobi city centre.
7 Travel speed survey
To analyse vehicle speed affected by traffic congestion
Investigation of travel time by running each route
Survey route: 15 routes, three times a day (morning, afternoon, and evening)
Source: JICA Study Team (JST)

The Project on Integrated Urban Development Master Plan for the City of Nairobi in the Republic of Kenya
Nippon Koei Co., Ltd. 7-3 Final Report IDCJ Inc. EJEC Inc.
(3) Survey Schedule
Traffic survey was conducted by re-entrustment to national consultants. Traffic survey commenced in the middle of January. January was devoted to preparation of survey including stationing of police officer and training of surveyors. The entire field survey was conducted during February to avoid the unexpected occurrence of the election held on 4th March. The survey schedule is shown in Figure 7.1.2.
7.1.3 Zoning and Survey Points
(1) Zoning System
Zoning inside the study area is based on the locations defined by the 2009 Population and Housing Census. Zoning system has three sizes, namely: large zone, medium zone, and small zone.
Small Zone: Small zone in Nairobi City corresponds to the sub location of census.
Medium Zone: Medium zone in Nairobi City corresponds to the location of census
Large Zone: Large zone in Nairobi City corresponds to the division in 2006.
The extent of the surrounding area of the city of Nairobi corresponds to the area in the 2006 NUTRANS Study, but slight modification was made due to the variation of area of wards. In this way, the total number of zones is shown in Table7.1.2. Detailed zone code table is attached in Appendix 3.
Table 7.1.2 Total Number of Traffic Zones Small Zone Medium Zone Large Zone Nairobi City area 106 49 8
Surrounding area of Nairobi City
21 9 3
Outside area 23 16 4
Total 150 74 15 Source: JICA Study Team
Zone maps of Nairobi City area, surrounding area of Nairobi City, and the outside area are shown in Figures 7.1.3, 7.1.4, and 7.1.5, respectively.
Source: JICA Study Team Figure 7.1.2 Traffic Survey Schedule

The Project on Integrated Urban Development Master Plan for the City of Nairobi in the Republic of Kenya
Nippon Koei Co., Ltd. 7-4 Final Report IDCJ Inc. EJEC Inc.
Source: JICA Study Team (JST) Figure 7.1.3 Zone Map Inside the City of Nairobi
Source: JICA Study Team (JST) Figure 7.1.4 Zone Map Around the City of Nairobi

The Project on Integrated Urban Development Master Plan for the City of Nairobi in the Republic of Kenya
Nippon Koei Co., Ltd. 7-5 Final Report IDCJ Inc. EJEC Inc.
Source: JICA Study Team (JST) Figure 7.1.5 Zone Map Outside the City of Nairobi
(2) Survey Points
Amongst seven types of traffic surveys, five surveys were conducted at fixed survey points and routes.
1) Cordon Line Survey
Survey points for cordon line survey are located at the boundary of Nairobi City area along the major arterial roads.
2) Screen Line Survey
Survey locations of screen line survey were set in consistency with the 2006 NUTRANS. Generally, screen line is conducted at the traffic barrier such as the river, but the objective of 2006 NUTRANS was to grasp the inflow and outflow from the densely urbanised area of Nairobi City.
3) Traffic Count Survey
The traffic count survey was conducted based on two objectives. One is to capture the traffic movement/congestion inside Nairobi City centre area, and the other is to grasp the traffic volume along the arterial roads including outside the Nairobi City area.
The locations of the three types of traffic survey are shown in Figure 7.1.6 and Figure 7.1.7.

The Project on Integrated Urban Development Master Plan for the City of Nairobi in the Republic of Kenya
Nippon Koei Co., Ltd. 7-6 Final Report IDCJ Inc. EJEC Inc.
Source: JICA Study Team (JST) Figure 7.1.6 Traffic Survey Point in Nairobi Urban Area
Source: JICA Study Team (JST) Figure 7.1.7 Traffic Survey Point in Nairobi Urbanised Area

The Project on Integrated Urban Development Master Plan for the City of Nairobi in the Republic of Kenya
Nippon Koei Co., Ltd. 7-7 Final Report IDCJ Inc. EJEC Inc.
4) Public Transport User Survey
The objectives of public transport user survey was to collect public transport users’ information regarding trip movement, fare, reason to use public transport, and required improvement in services. Survey location was in the centre of Nairobi City where various bus services are operated.
Source: JICA Study Team (JST)
Figure 7.1.8 Location of Public Transport User Survey
5) Travel Speed Survey
In total, 15 routes were selected for the travel speed survey as shown in Figure 7.1.9.
Source: JICA Study Team (JST) Figure 7.1.9 Routes of Travel Speed Survey

The Project on Integrated Urban Development Master Plan for the City of Nairobi in the Republic of Kenya
Nippon Koei Co., Ltd. 7-8 Final Report IDCJ Inc. EJEC Inc.
7.1.4 Person Trip Survey
(1) Survey Method
1) General
Person trip survey is a method for analysing transport by capturing people’s individual movement based on the concept that person’s movement is the source of traffic. In order to capture the movement of persons, surveyors will visit households in the survey area and conduct interview about the movements (trips) of household members on a certain day. This was a sample survey, and the targeted households were selected randomly from the households of the survey area.
2) Survey Method
The survey area of the person trip survey is within the city of Nairobi. Total number of households to be interviewed shall be 10,000 households. According to the 2009 Census, the total households in Nairobi City was 985,016; therefore, the sampling rate of household is 1.02%.
The interview was made when the household head was present at home. The questionnaire is categorised into three, namely: household information, household member information, and trip information. Interview was made to cover persons 5 years old and above. Trip information was for trips made on workdays.
Interview items in the person trip survey are shown in Table 7.1.3.
Table 7.1.3 Interview Items in Person Trip Survey Household Information Household Member Information Trip Information
Home address Number of household members Household income Vehicle ownership Land and house ownership
Address of workplace and/or school Sex and age Occupation Personal income Vehicle of its own use Driving license
Origin and destination Trip purpose Travel mode Departing time and arrival time
Source: JICA Study Team (JST)
(2) Survey Results Analysis
1) Trip Rate per Person
Trip rate per person is a fundamental and constant index by which the total number of trips in the future traffic demand will be controlled. Amongst the attributes obtained from the household information and the household member information by the person trip survey, car ownership and occupation can reflect a variation of characteristics of attributes in the future. As a result of the survey, car owner shows higher trip rate than non-car owner. As for the occupation, employee shows the highest trip rate amongst the three occupation categories.
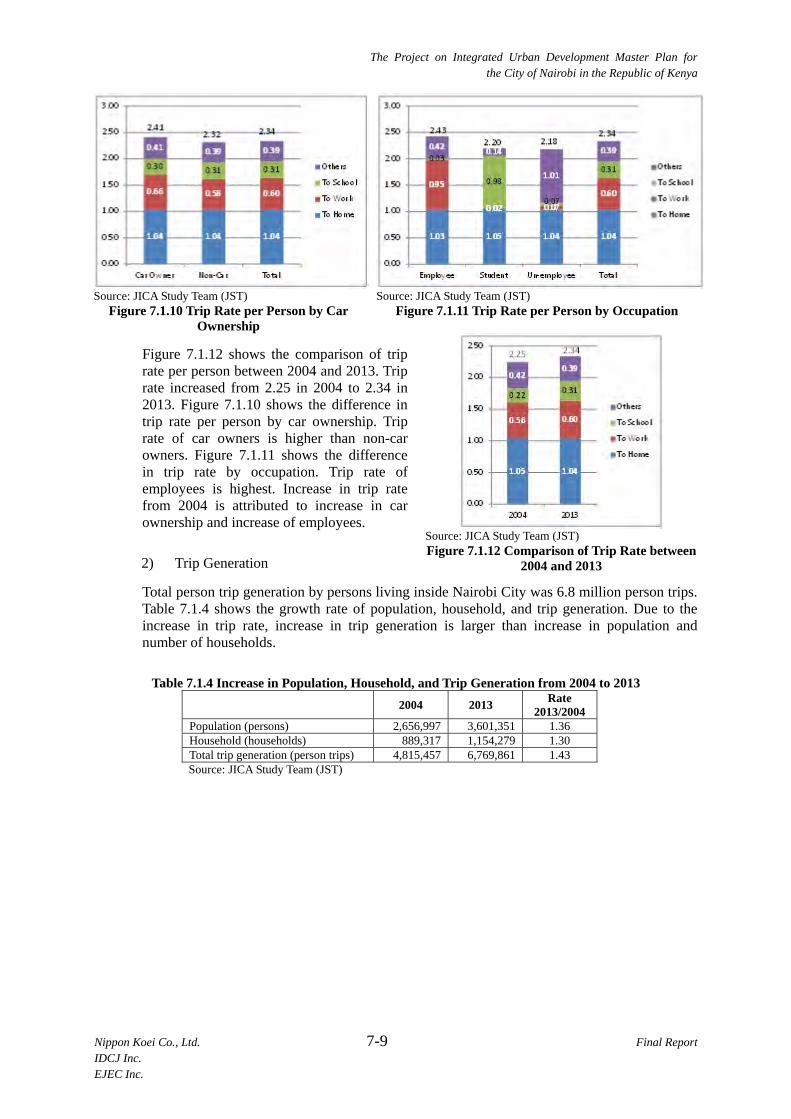
The Project on Integrated Urban Development Master Plan for the City of Nairobi in the Republic of Kenya
Nippon Koei Co., Ltd. 7-9 Final Report IDCJ Inc. EJEC Inc.
Source: JICA Study Team (JST) Source: JICA Study Team (JST) Figure 7.1.10 Trip Rate per Person by Car
Ownership Figure 7.1.11 Trip Rate per Person by Occupation
Figure 7.1.12 shows the comparison of trip rate per person between 2004 and 2013. Trip rate increased from 2.25 in 2004 to 2.34 in 2013. Figure 7.1.10 shows the difference in trip rate per person by car ownership. Trip rate of car owners is higher than non-car owners. Figure 7.1.11 shows the difference in trip rate by occupation. Trip rate of employees is highest. Increase in trip rate from 2004 is attributed to increase in car ownership and increase of employees.
2) Trip Generation
Total person trip generation by persons living inside Nairobi City was 6.8 million person trips. Table 7.1.4 shows the growth rate of population, household, and trip generation. Due to the increase in trip rate, increase in trip generation is larger than increase in population and number of households.
Table 7.1.4 Increase in Population, Household, and Trip Generation from 2004 to 2013 2004 2013 Rate
2013/2004 Population (persons) 2,656,997 3,601,351 1.36 Household (households) 889,317 1,154,279 1.30 Total trip generation (person trips) 4,815,457 6,769,861 1.43 Source: JICA Study Team (JST)
Source: JICA Study Team (JST) Figure 7.1.12 Comparison of Trip Rate between
2004 and 2013

The Project on Integrated Urban Development Master Plan for the City of Nairobi in the Republic of Kenya
Nippon Koei Co., Ltd. 7-10 Final Report IDCJ Inc. EJEC Inc.
Source: JICA Study Team (JST) Figure 7.1.13 Trip Generation by Trip Purpose in 2004 and 2013
3) Trip Distribution
Figure 7.1.14 shows the person trip movement inside a wider area in 2004 and 2013. In 2013, the total number of trips coming to/from the outside of Nairobi City was 98,000 which occupied 1.4% of total trips. Compared with 1.2% in 2004, person trip movement in the wider area became more active.
Source: JICA Study Team (JST) Figure 7.1.14 Person Trip Movement in a Wider Area in 2004 and 2013
Figures 7.1.15 and 7.1.16 show the person trip “desire line” inside Nairobi City in 2004 and 2013, respectively. Due to the distribution of recent population increase in the city area, trip movement in the east-west direction increased more than in the south-north direction. (Refer to Figure 2.1.2)

The Project on Integrated Urban Development Master Plan for the City of Nairobi in the Republic of Kenya
Nippon Koei Co., Ltd. 7-11 Final Report IDCJ Inc. EJEC Inc.
Source: JICA Study Team (JST)
Figure 7.1.15 Person Trip Desire Line inside Nairobi City in 2004
Source: JICA Study Team (JST)
Figure 7.1.16 Person Trip Desire Line inside Nairobi City in 2013
4) Travel Mode
Selection of travel mode has close relationship with trip purpose. Figure 7.1.17 shows the travel mode composition by trip purpose. In every trip purpose, except for “To Work”, walking occupies the largest share. Matatu occupies the largest share of “To Work” trip purpose, and has the second largest share for other trip purposes.

The Project on Integrated Urban Development Master Plan for the City of Nairobi in the Republic of Kenya
Nippon Koei Co., Ltd. 7-12 Final Report IDCJ Inc. EJEC Inc.
38.8%
27.5%
51.8%
51.3%
39.7%
5.5%
6.5%
4.1%
4.6%
5.4%
13.1%
20.1%
5.5%
11.4%
13.6%
29.1%
34.1%
20.6%
23.8%
28.4%
12.8%
11.2%
16.5%
8.7%
12.2%
0% 20% 40% 60% 80% 100%
To Home
To Work
To School
Others
Total
Walk
Two‐wheel Mode
Private car/Taxi/Truck
Matatu
Bus
Railway
Source: JICA Study Team (JST)
Figure 7.1.17 Travel Mode Composition by Trip Purpose
Table 7.1.5 Number of Trips by Trip Purpose by Travel Mode
WalkTwo-wheel
Mode
Privatecar/Taxi/Tr
uckMatatu Bus Railway Others TOTAL
To Home 1,170,560 165,266 392,633 878,839 383,876 5,512 17,349 3,014,035
To Work 479,317 112,098 347,084 591,842 195,493 6,708 2,313 1,734,855
To School 470,579 37,303 49,781 188,539 150,558 1,087 13,695 911,542
Others 568,351 50,332 125,901 266,587 95,424 699 2,135 1,109,429
Total 2,688,807 364,999 915,399 1,925,807 825,351 14,006 35,492 6,769,861 Source: JICA Study Team (JST)
Figures 7.1.18 and 7.1.19 show the comparison of travel modes between 2013 and 2004. Compared with 2002, walking decreased and bus and matatu increased. Between matatu and bus, the share of bus increased due to the promotion policy of the government.
2,267
55
738
1,396
32922
8
2,689
365
915
1,926
825
1435
0
500
1,000
1,500
2,000
2,500
3,000
Walk
Two‐w
heel
Mode
Private car/
Taxi/Truck
Matatu
Bus
Railway
Others
2004
2013
Unit: 1000 person trips
Source: JICA Study Team (JST)
47.1%
39.7%
1.2%
5.4%
15.3%
13.5%
29.0%
28.4%
6.8%
12.2%
0% 20% 40% 60% 80% 100%
2004
2013
Walk
Two‐wheelMode
Private car/Taxi/Truck
Matatu
Source: JICA Study Team (JST)
Figure 7.1.18 Comparison of Number of Trips by Travel Mode between 2013 and 2004
Figure 7.1.19 Comparison of Composition of Travel Mode between 2013 and 2004

The Project on Integrated Urban Development Master Plan for the City of Nairobi in the Republic of Kenya
Nippon Koei Co., Ltd. 7-13 Final Report IDCJ Inc. EJEC Inc.
7.1.5 Formulation of Future Transport Demand
(1) Methodology
Transportation network is important in delineating the urban structure function as the base of urban development and growth. In parallel with transportation planning, clarifying the necessity for an improvement of the transportation facility is required. Therefore, it is important to forecast the future transport demand and to provide transportation facilities responding to it. Investment for appropriate transportation facilities will be discussed in this study.
A widely practiced method in transport demand forecasting is the four-step method. This study will also forecast transport demand in the future based on the four-step method. The method has four processes, namely: i) trip generated and attracted, ii) trip distribution, iii) modal split, and iv) trip assignment. The flow and outline of the four-step method are shown in Figure 7.1.20. Reproducibility of present condition by the models and detailed calculations of each step are shown in Appendix-4.
Source: JICA Study Team (JST)
Figure 7.1.20 Flow of Four-Step Method
(2) Target Area and Zoning
In the future demand forecast, target area is mainly Nairobi City area, but some of its peripheral area is also considered in the calculation to reflect the movement of traffic from the outside area. The latter case will be referred to as Greater Nairobi hereinafter, as opposed to the former case of Nairobi City.
Zoning system for the forecast is basically a medium zone system which is described in Section 7.1.2 (1). Since the sample rate of person trip survey is relatively low, the number of zones of small zone system is too large for keeping the accuracy in the prediction. To this end, the medium zone system is selected for demand forecast although traffic survey was conducted based on the small zone system.
(3) Forecasting System
Software called JICA System for Traffic Demand Analysis (STRADA) and spreadsheets are used for the calculation of the model building and transport demand forecasting. The JICA STRADA is capable
Estimation of Future Population, etc.
Trip Generated and Attracted
Trip Distribution
Modal Split
Trip Assignment
Future Traffic Volume
The trip generated and attracted volume by zone is forecasted from the trip production.
OD matrix which set the trip generated and attracted volume to an origin/destination is calculated.
The traffic amongst zones is split by transportation modes.
OD matrix by modes is assigned to the transportation network
Trip Production The purpose-oriented trip produced in the overall area is forecasted.

The Project on Integrated Urban Development Master Plan for the City of Nairobi in the Republic of Kenya
Nippon Koei Co., Ltd. 7-14 Final Report IDCJ Inc. EJEC Inc.
of assigning future traffic volumes and showing the results visually. Then, Excel spreadsheets are used in the process in which traffic is assigned based on the person trip survey data. The traffic assignment method is the user equilibrium assignment method, which is also widely practiced.
(4) Traffic Assessments to Present Transport Network
Traffic demand forecast to present transport network is conducted for model building and analysis of present traffic condition.
1) Present traffic demand (2013) to present transport network (Existing Case)
This case is calculated to confirm the accuracy of traffic models and to analyse the traffic movement.
2) Future traffic demand (2030) to present transport network (Do-Nothing Case)
This case is calculated to analyse where traffic issues appear if the network is not improved. Based on the analysis, policy for future transport network shall be established.
The calculation of the demand forecast is shown in Appendix-4.
The primary indices of demand forecast for the Existing Case and the Do-Nothing Case are summarised in Table 7.1.6. Traffic assignment results for the Existing Case and Do-Nothing Case are shown in Figure 7.1.21 and Figure 7.1.22, respectively.
Table 7.1.6 Primary Indices by Vehicle Assignment Results in Existing Case and Do-Nothing Case
Area Case Year of Traffic
Demand
Year of Network
Vehicle-km Total
(PCU-km)(‘000)(Increase rate)
Vehicle-hours Total
(PCU-Hour)(Increase rate)
Average Speed (km/h)
Average VCR(Volume
Capacity Ratio)
Greater Nairobi
Existing Case 2013 2013 17,780(1.00)
431,690(1.00)
41.2 0.54
Do-Nothing Case
2030 2013 39,110(2.20)
1,692,480(3.92)
23.1 1.19
Nairobi City
Existing Case 2013 2013 10,960(1.00)
273,910(1.00)
40.0 0.69
Do-Nothing Case
2030 2013 25,320(2.31)
1,254,120(4.58)
20.2 1.60
Source: JICA Study Team (JST)
In the Do-Nothing Case, almost all the radial roads going to city centre, the circumferential roads, and the bypass roads such as Outer Ring Road and Eastern Bypass are heavily congested. Also, radial roads connecting the southern area of Nairobi City are heavily congested. Comparing the Do-Nothing Case and Existing Case, total vehicle-hours inside Nairobi City will increase by 5.3 times due to congestion while total vehicle-km will increase by 2.4 times. Congestion in Nairobi City will be more serious than in Greater Nairobi.
It is definite that the congestion of roads will become much more intense. Traffic volume will increase rapidly and road service level will become poorer than the existing condition. Therefore, several countermeasures which will decrease automobile traffic in the future and increase public transportation will be extremely necessary.

The Project on Integrated Urban Development Master Plan for the City of Nairobi in the Republic of Kenya
Nippon Koei Co., Ltd. 7-15 Final Report IDCJ Inc. EJEC Inc.
Source: JICA Study Team (JST)
Figure 7.1.21 Vehicle Assignment Result in “Existing Case” (2013)
Source: JICA Study Team (JST)
Figure 7.1.22 Vehicle Assignment Result in “Do-Nothing Case” (2030)
20000(PCU)
The Project on Integrated Urban Development Master Plan for the City of Nairobi in the Republic of Kenya
Nippon Koei Co., Ltd. 7-16 Final Report IDCJ Inc. EJEC Inc.
7.1.6 Formulation of Future Transport Network
(1) Basic Approach
1) Coordination with Proposed Land Use Plan
Since the future land use plan has been proposed by the JICA Study Team in Chapter 6, the land use plan shall be dealt with a major premise for the establishment of transport development policy.
2) Consistency with NUTRANS, 2006
JICA conducted NUTRANS from 2004 and issued the final report in March 2006. Since then, economic and social conditions have changed a great deal, but the roots of the transport issue did not change much and some of the proposals in the NUTRANS are still effective and valid. Therefore, this study shall be consistent with NUTRANS.
3) Conformity with Government Policies
Transport development policy should be in conformity with the government visions and policies. Kenya Vision 2030, Nairobi Metro Vision 2030, and Integrated National Transport Policy are essential policies in this aspect.
4) Preparation of Alternative Case for Evaluation
After the publication of NUTRANS in 2006, the Consultancy Service for Feasibility Study and Technical Assistance for Mass Rapid Transit System for the Nairobi Metropolitan Region (MRTS) was publicised by MOT. The concept of network of MRTS is reflected in the Nairobi Metro Vision 2030. Nairobi Metropolitan Services Improvement Project (NaMSIP), which emphasised the use of rail line, was issued by WB in 2012. In order to evaluate the measures in terms of reality and effectiveness, the JICA Study Team will prepare alternative cases in reference to MRTS and NaMSIP proposals.
5) Selection of Optimum Alternative Case
By conducting traffic demand forecast, alternative cases will be evaluated by indices regarding road congestion, possibility of coexistence of public and private modes, and mobility of person trips.
6) Staging Plan for Implementation
After selection of the alternative case, short-term plan (2018) and medium-term plan (2023) will be prepared and evaluated by the traffic demand forecast. As a result of evaluation, short-term plan and medium-term plan will be established.
(2) Basic Policy
Based on the present constraints and planning issues, and the policies articulated in the government plans and visions, the urban transport development policy in NIUPLAN is formulated as follows:

The Project on Integrated Urban Development Master Plan for the City of Nairobi in the Republic of Kenya
Nippon Koei Co., Ltd. 7-17 Final Report IDCJ Inc. EJEC Inc.
1) Key Concept: Ensuring World-class Mobility
Since the Nairobi Metro 2030 envisages a world-class metropolis, transport system should ensure the mobility enabling lively activity of citizens and industries.
2) Road Network Development Policy
i) Establishment of Circumferential/Radial (C/R) Network System
NUTRANS and the Spatial Planning Concept of Nairobi Metropolitan Region recommended the network system comprising radial and circumferential/orbital roads. Especially around the CBD area and in the peripheral area of the city centre, circumferential road is essential to divert the traffic which does not have origin or destination inside the city centre.
iii) Establishment of Hierarchical Classification of Roads
The Former Ministry of Road issued Road Classification Manual in 2009 and the manual classifies urban roads into class H to P. But existing road functions are not corresponding to the classification and the road density is not consistent with population distribution or industry distribution. Classification shall be reviewed considering the function of each road and improvement of road should be conducted by the classification.
iii) Exclusion of Through Traffic from Urban Traffic
According to the cordon survey result, about 46,000 vehicles passed through the Nairobi City area in 2013. As the development in the surrounding area of Nairobi City progresses, through traffic will increase more. Therefore, exclusion of through traffic from urban traffic by sufficient bypass will be required.
3) Public Transport Development Policy
i) Enhancement of Modal Shift to Public Transport
In reference to the demand forecast shown in Section 7.1.4, traffic demand in 2030 is estimated to increase to about two times of the traffic demand in 2013. To cope with the increasing traffic demand, increase in road capacity by road development is limited by the amount of investment and restriction in land acquisition. Modal shift to public transport with large capacity and high convenience is required. To this end, introduction of new public transport system as well as improvement of existing bus/matatu service will be examined.
ii) Strengthening of the Existing Railway
Railway is an existing infrastructure which should be utilised more. Although rolling stock is in aging and unreliable condition, infrastructure of railway is in good condition. Concept of commuter railway network is proposed by KR and Ministry of Nairobi Metropolitan Development (MONMD) and FS for commuter rail will be commenced soon. In this study, revamping of existing railway will be investigated as a measure to promote public transport.
iii) Promotion of Transit Oriented Development (TOD)
Viability of public transport depends on the concentration of passenger demand which has relationship with land use. The land use system which enhances public transport and thus reduces the use of private vehicles is called transit oriented development (TOD) and has been introduced to many countries. Land use plan will be established taking into account of this aspect.

The Project on Integrated Urban Development Master Plan for the City of Nairobi in the Republic of Kenya
Nippon Koei Co., Ltd. 7-18 Final Report IDCJ Inc. EJEC Inc.
4) Non-motorised Transport (NMT)
i) NMT as Prerequisite
According to the person trip survey result, 40% of travel mode is walking. Additionally, walking is invariably necessary for bus, matatu and railway trips as the access/egress trip. Given this condition, facility for NMT is a prerequisite; therefore, development/improvement of facility is required in the entire Nairobi City area.
In developing the NMT facility, priority is given to the roads where demand is concentrated. Detailed description for the priority facilities will be shown in (4) NMT network plan.
(3) Road Network Plan
1) Progress of Road Development after 2006 M/P (NUTRANS)
Target years of the 2006 M/P (NUTRANS) are 2010 (short term), 2015 (medium term), and 2025 (long term). Figure 7.1.23 shows the road development/improvement in each target year by the NUTRANS.
Source: The Study on Master Plan for Urban Transport in the Nairobi Metropolitan Area in the Republic of Kenya, Final Report, 2006
Figure 7.1.23 Recommended Road Development by the 2006 M/P (NUTRANS)
After issuance of 2006 NUTRANS, various developments/improvements of trunk roads made progress. Figure 7.1.24 shows the road developments/improvements after 2006. These developments/improvements are mainly financed by the Kenyan government, African Development Bank (AfDB), World Bank (WB), EU, Japan, and China. In the 2006 M/P, first priority was given to roads around the city centre area, and second priority was given to roads in the suburban area. On the contrary, road development made progress both around the city

The Project on Integrated Urban Development Master Plan for the City of Nairobi in the Republic of Kenya
Nippon Koei Co., Ltd. 7-19 Final Report IDCJ Inc. EJEC Inc.
centre area and outside the urbanised area. Considering the distribution of future traffic demand, development of roads around the city centre is still urgent; therefore, following the future network and the priority recommended by the 2006 M/P is one of the basic policy in this study.
Detailed information on NUTRANS and progress of development is attached in Appendix-5.
Source: Website of KURA, JICA Study Team (JST)
Figure 7.1.24 Progress of Road Development after 2006 M/P
2) Review of the Traffic Assignment of Future Traffic Demand
Since the target year in this study is 2030, which exceeds the target year of NUTRANS by five years, increase in traffic demand from 2025 to 2030 should be considered. By reviewing the traffic assignment for Do-Nothing Case shown in Figure 7.1.22, analysis on distribution of future traffic demand can be conducted.
Widening of the following roads which are not expected in 2025 is required for future network in 2030:
- Eastern Bypass (Mombasa Road-Thika Road)
- Ngong Road (Dagoretti-)
- Langata Road (Uhuru Highway-Magadi Road crossing)
- Jogoo Road (Lusaka Road-Outer Ring Road)
- Naivasha Road (Dagoretti-Kikkuyu Road crossing)
- Kiambu Road (Thika Rd.-Northern Bypass)

The Project on Integrated Urban Development Master Plan for the City of Nairobi in the Republic of Kenya
Nippon Koei Co., Ltd. 7-20 Final Report IDCJ Inc. EJEC Inc.
- James Gichuru Road (Waiyaki Way-Ngong Road)
3) Future Road Network
Based on the aforesaid analysis, future road network is established as shown in Figure 7.1.25. Modifications were made at the following two routes from NUTRANS:
- Route of circumferential road C-2 was altered due to the present land use.
- Widening of Limuru Road was avoided due to the present land use and instead Peponi Road will be widened.
Source: JICA Study Team (JST) Figure 7.1.25 Future Road Network (2030)
4) Road Classification of Future Network
Road classification was proposed in NUTRANS in 2006. In 2009, Kenya Roads Classification Manual was issued by the MOR. The classified existing road network is shown in Table 4.2.2 and Figure 4.2.1. Future road network in 2030 will be defined taking account of the manual as shown in Table 7.1.7 and Figure 7.1.26. Typical road cross section based on NUTRANS for each classification is shown in Appendix-7.
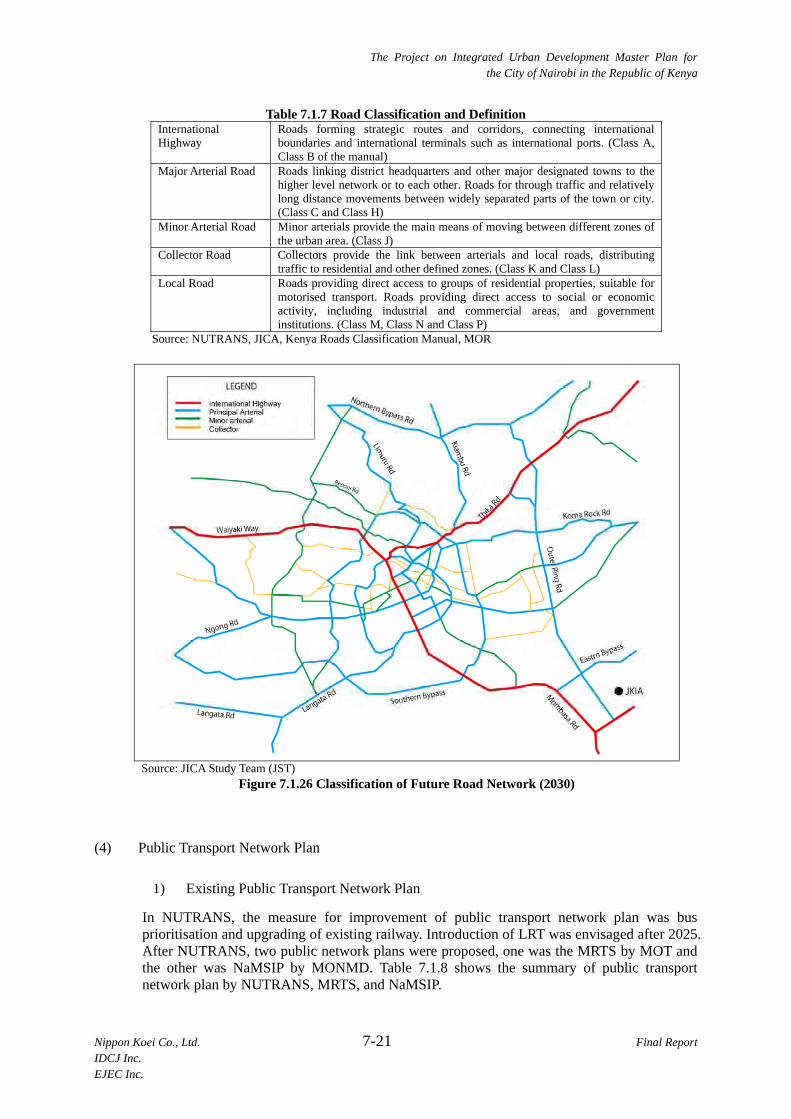
The Project on Integrated Urban Development Master Plan for the City of Nairobi in the Republic of Kenya
Nippon Koei Co., Ltd. 7-21 Final Report IDCJ Inc. EJEC Inc.
Table 7.1.7 Road Classification and Definition International Highway
Roads forming strategic routes and corridors, connecting international boundaries and international terminals such as international ports. (Class A, Class B of the manual)
Major Arterial Road Roads linking district headquarters and other major designated towns to the higher level network or to each other. Roads for through traffic and relatively long distance movements between widely separated parts of the town or city. (Class C and Class H)
Minor Arterial Road Minor arterials provide the main means of moving between different zones of the urban area. (Class J)
Collector Road Collectors provide the link between arterials and local roads, distributing traffic to residential and other defined zones. (Class K and Class L)
Local Road Roads providing direct access to groups of residential properties, suitable for motorised transport. Roads providing direct access to social or economic activity, including industrial and commercial areas, and government institutions. (Class M, Class N and Class P)
Source: NUTRANS, JICA, Kenya Roads Classification Manual, MOR
Source: JICA Study Team (JST) Figure 7.1.26 Classification of Future Road Network (2030)
(4) Public Transport Network Plan
1) Existing Public Transport Network Plan
In NUTRANS, the measure for improvement of public transport network plan was bus prioritisation and upgrading of existing railway. Introduction of LRT was envisaged after 2025. After NUTRANS, two public network plans were proposed, one was the MRTS by MOT and the other was NaMSIP by MONMD. Table 7.1.8 shows the summary of public transport network plan by NUTRANS, MRTS, and NaMSIP.

The Project on Integrated Urban Development Master Plan for the City of Nairobi in the Republic of Kenya
Nippon Koei Co., Ltd. 7-22 Final Report IDCJ Inc. EJEC Inc.
Table 7.1.8 Summary of Existing Public Transport Network Plans NUTRANS*1 MRTS*2 NaMSIP*3
Issued 2006 2011 2011 Ministry Ministry of Road and
Infrastructure Ministry of Transport Ministry of Nairobi
Metropolitan Development Assisted by JICA AfDB WB Project outline Bus priority/exclusive lane and
busway on the following corridors: 1) Northern corridor (Thika
Road) 2) Eastern corridor (Juja Road
and Jogoo Road) 3) Southwestern corridor
(Mombasa Road) 4) Southwestern corridor
(Langata Road) 5) Western corridor (Ngong
Road, etc.) 6) Northwestern corridor
(Waiyaki Way)
Introduction of LRT to the following corridors: 1) Waiyaki Way corridor 2) Jogoo Road corridor 3) Outer Ring Road corridorIntroduction of METRO to the following corridors: 1) Thika Road corridor
(NRS-Githurai) 2) Thika Road corridor
(Githurai-Ruai) 3) Juja Road corridor 4) Ngong Road corridor Introduction of BRT to the following corridors: 1) Limuru Road corridor 2) Langata Road corridor 3) Mombasa Road corridor Introduction of BRT to METRO corridor extension
Improvement of existing railway to commuter train 1) NRS-Ruiru section
11 stations (including NRS)
2) NRS-Kikuyu section 9 stations (excluding NRS)
3) NRS-Syokimau 4) Introduction of Diesel
Multiple Unit (DMU) Land development is associated with the opening of new station.
Total cost KSh34,795 million (including all roads)
BRT: KSh74,441 million LRT: KSh134,740 million Metro: KSh218,969 million
KSh8,000/12,000 million *4
Target year 2025 2030 2012 Source: *1: The Study on Master Plan for Urban Transport in the Nairobi Metropolitan Area in the Republic of Kenya, March
2006 *2: Consultancy Services for Feasibility Study and Technical Assistance for Mass Rapid Transit system for the
Nairobi Metropolitan Region, June 2011 *3: NaMSIP, Nairobi Metropolitan Leadership (Presentation document for 2 July meeting)
Remark: Since NamSIP is in the conceptual stage, cost estimation was roughly conducted.
2) Future Public Transport Network
MRTS has its implementation schedule divided into two phases: the first phase is from 2011 to 2022, and the second phase is from 2019 to 2030. After the issuance of MRTS report, development of roads for the MRTS corridor has made progress such as Ngong Road and Juja Road, but the necessary process for the realisation of MRTS has not made much progress. This is because investment for MRTS, which was expected to be by PPP, is too large to handle easily. Considering this condition, future public transport network shall be based on NUTRANS incorporating the concept of MaMSIP. As for the proposal by the MRTS, BRT will be introduced to possible corridors and selected LRT corridors will be introduced until the target year.
Evaluation of the public transport system will be conducted by traffic demand forecast of alternative cases.
3) Public Transport Terminal Plan
Currently, most of the terminals for bus and matatu are concentrated in the city centre area. As a result, access roads to bus/matatu terminals are heavily congested. To alleviate the congestion by bus/matatu, the following measures are required:

The Project on Integrated Urban Development Master Plan for the City of Nairobi in the Republic of Kenya
Nippon Koei Co., Ltd. 7-23 Final Report IDCJ Inc. EJEC Inc.
i) Development of New Terminal at the City Centre
The location and the size of new terminal will be scrutinised through the detailed plan of city centre development.
ii) Removal of Long Distance Bus Terminals to Outside the City Centre
Disposition of the new terminals will be examined considering the location of sub-centres by the land use plan because new bus terminal will become the core of the sub-centre.
iii) Development of Sub-terminal at the City Sub-centre
During the stage when MRTS is the major public transport in the city, existing matatu will operate as feeder service mode and cover the area which MRTS will not cover. Therefore, sub-terminal is expected to function as transfer terminal from matatu to MRTS or large bus.
(5) Future Network Alternatives
(i) Objective of Evaluation of Alternative Case
In this study, road network is fundamentally based on the network recommended by NUTRANS. The basic policy for the network plan declares that enhancement of modal shift to public transport is requisite to address the increasing traffic demand. On the other hand, several public transport plans are proposed by the studies financed by development partners. Introduction of new public transport system will be studied under the MOTI initiative. Hence, the objectives of the evaluation of alternatives are as follows:
1) Evaluation of traffic condition by development of road network.
2) Evaluation of effect by introduction of public transport systems in decreasing vehicle traffic.
3) Proposal of a concept for introduction of new public transport, and the presentation of the demand forecast result.
(ii) Establishment of Alternative Cases
Since the future road network is based on NUTRANS with updates, the objective of network alternative case in 2030 is for the evaluation of the effectiveness and viability of public transport systems. Based on this concept, four alternative cases shown in Table 7.1.9 are established.
Table 7.1.9 Summary of Alternative Cases Name Road Network Public Transport
Network Remark
Alternative 0 On-going Project Case
Existing network and on-going road project
Existing network
Alternative 1 Road Development Oriented Case
Future road network shown in Figure 7.1.15
Existing network
Alternative 2 Utilisation of Commuter Rail Case
Same as Alternative 1 Existing network and introduction of commuter rail
Three commuter rail lines
Alternative 3 Introduction of Selective MRTS Case
Same as Alternative 1 Commuter rail and introduction of BRT, LRT
Four BRT routes and one LRT route

The Project on Integrated Urban Development Master Plan for the City of Nairobi in the Republic of Kenya
Nippon Koei Co., Ltd. 7-24 Final Report IDCJ Inc. EJEC Inc.
1) Alternative 0 (Ongoing Project)
Road network of alternative 0 is the existing network with the ongoing projects shown in Figure 7.1.24. This case is the base case for the comparison of effectiveness of measures selected in each alternative.
The following projects are included in the ongoing projects:
Expanding and Upgrading of the Northern Corridor Road including the Elevated Highway over the Uhuru Highway
Construction of Southern Bypass Road Construction of Missing Link Nos. 1, 5, 10, 15a, 15b, and 16 Dualling of Outer Ring Road Construction of Western Ring Roads Widening of Ngong Road from Kenyatta Avenue Intersection to Dagoretti Widening of Juja Road Upgrading of Langata Road of KWS Gate-Bomas Junction Section Widening of Outer Ring Road
2) Alternative 1 (Road Development Oriented Case)
The objective of alternative 1 is to solve the transport issues solely by road development. Road network for alternative 1 is shown in Figure 7.1.25.
3) Alternative 2 (Utilisation of Commuter Rail Case)
To solve the transport issues, strengthening of public transport is inevitable. In alternative 2, commuter railway plan proposed by NaMSIP is introduced as the essential measure for public transport reinforcement. Proposed railway network is shown in Figure 7.1.27.
Introduction of diesel multiple unit (DMU), which is flexible for the variation of passenger demand, is recommended. On this premise, the assumption in this study is that the railway track is existing single with double track at the stations, the number of services per hour is two, and the schedule speed is 30 km per hour.

The Project on Integrated Urban Development Master Plan for the City of Nairobi in the Republic of Kenya
Nippon Koei Co., Ltd. 7-25 Final Report IDCJ Inc. EJEC Inc.
Source: NaMSIP, Nairobi Metropolitan Leadership (Presentation document for 2 July meeting) Figure 7.1.27 Railway Network in Alternative 2
4) Alternative 3 (Introduction of Selective MRTS Case)
i) Evaluation of Priority Corridor
The objective of introduction of new public transport systems proposed by MRTS is to enhance modal shift to public transport and consequently to alleviate traffic congestion. Nine corridors are proposed for MRTS corridors. In this study, priority corridors are evaluated based on the following aspects:
(i) Vehicle traffic volume: Concentration of large amount of vehicle traffic requires shifting to public transport because countermeasure by road development is limited against the increasing traffic.
(ii) Vehicle capacity ratio (VCR): VCR also indicates the concentration of vehicle traffic demand in comparison with the road capacity.
(iii) Demand overlapping with commuter rail: Commuter railway by NaMSIP was publicised after the MRTS, and thus nine corridors proposed by MRTS did not take into account the commuter rail. Therefore, routes for MRTS should be examined in terms of overlap with commuter rail. BRT will be introduced to the route with extremely large vehicle demand even if the route overlaps with the commuter rail.
(iv) Possibility of widening to more than six lanes: On the MRTS corridors, roads with more than four lanes should be secured for the general vehicles. Decreasing road capacity for general vehicles into two lanes will give too large an impact and make it impossible to obtain consensus amongst the citizens.
Detailed evaluation of priority corridor is shown in Table 7.1.10.

Nippon K
oei Co., L
td 7-26 F
inal Report
IDC
J Inc. E
JEC
Inc
The P
roject on Integrated Urban D
evelopment M
aster Plan for
the City of N
airobi in the Republic of K
enya
Table 7.1.10 Evaluation of Priority of MRTS Corridors
No. Road Name Starting Station
Ending Station
Traffic Demand in Alt. 1 (Max)
(‘000)
VCR in Alt. 1 (Max)
Overlap with Commuter Rail
Possibility of Widening Evaluation Priority
1 Thika RoadNRS Kasarani 253 >1.50 No overlap Existing
Vehicle traffic demand is extremely large and VCR is highest. No route overlaps with commuter rail. Highest
Kasarani Eastern Bypass
141 1.50> >1.20
Overlap Existing Vehicle traffic demand is very large and VCR is high. Route overlaps with commuter rail.
High
2 Juja Road NRS Outer Ring 77 >1.50 No overlap Ongoing Vehicle traffic demand is large and VCR is highest. No
route overlaps with commuter rail. Highest
Outer Ring Kayole 56 >1.50 Overlap Possible Vehicle traffic demand is large and VCR is highest. Route overlaps with commuter rail. High
3 Jogoo RoadNRS Outer Ring 96 >1.50 Overlap Possible Vehicle traffic demand is very large and VCR is
highest. Route overlaps with commuter rail.High
Outer Ring Kayole 49 1.50> >1.20 No overlap Possible Vehicle traffic demand is not large and VCR is high.
No route overlaps with commuter rail. Low
4 Mombasa Road-Athi River
NRS JKIA North 243 >1.50 Overlap Existing Vehicle traffic demand is extremely large and VCR is highest. Route overlaps with commuter rail. Highest
JKIA North Athi River 123 >1.50 Overlap Ongoing Vehicle traffic demand is very large and VCR is highest. Route overlaps with commuter rail.
High
5 Langata Road NRS Bomas of
Kenya 105 >1.50 No overlap Possible Vehicle traffic demand is very large and VCR is highest. No route overlaps with commuter rail. Highest
6 Ngong RoadNRS
Dagoretti Corner 53
1.50> >1.20 Overlap Ongoing
Vehicle traffic demand is large and VCR is high. Route overlaps with commuter rail. Low
Dagoretti Corner
Karen Bus Stop
32 1.50> >1.20
No overlap Possible Vehicle traffic demand is not large and VCR is High. No route overlaps with commuter rail.
Low
7 Waiyaki Way
NRS Kabete 198 >1.50 No overlap Existing Vehicle traffic demand is extremely large and VCR is highest. No route overlaps with commuter rail. Highest
Kabete Kikuyu 61 1.20> >1.00 No overlap Ongoing
Vehicle traffic demand is large and VCR is low. No route overlaps with commuter rail. Low
8 Limuru Road
NRS Ruaka Bus Station
66 1.50> >1.20
No overlap Difficult(Forest)
Vehicle traffic demand is large and VCR is high. No route overlaps with commuter rail.
High
9 Outer Ring Road GSU Mombasa
Road 98 >1.50 No overlap Ongoing Vehicle traffic demand is very large and VCR is highest. No route overlaps with commuter rail. Highest
Source: JICA Study Team (JST) Remark: Traffic demand - Extremely large: more than 150,000
Very large: more than 90,000 Large: more than 50,000

The Project on Integrated Urban Development Master Plan for the City of Nairobi in the Republic of Kenya
Nippon Koei Co., Ltd. 7-27 Final Report IDCJ Inc. EJEC Inc.
As a result of the evaluation, the following six corridors are selected as the priority corridors:
(i) Thika Corridor (from Nairobi Station to Kasarani);
(ii) Juja Corridor (from Nairobi Station to Outer Ring Road);
(iii) Mombasa Corridor (from Nairobi Station to JKIA North);
(iv) Waiyaki Corridor (from Nairobi Station to Kabete);
(v) Langata Corridor (from Magadi Road Crossing to Nyayo Stadium); and
(vi) Outer Ring Corridor (from Thika Road to Mombasa Road).
Additionally, circular mass transit route surrounding Central Business District (CBD) area is proposed by the CBD development policy in order to create high accessibility in CBD and reduce the vehicle traffic in CBD. This route is taken into consideration as one of the transit corridors.
ii) Selection of Transport Mode
The mode to be introduced to each corridor is re-examined through the following aspects:
(i) Physical condition: In case of elevated LRT, a strip with sufficient width for the construction of piers is required.
(ii) Progress of related project: Several roads which are supposed to be MRTS route are in the design stage. Design condition for the road development should be taken into consideration.
Table 7.1.11 shows the result of examination of transportation mode.

Nippon K
oei Co., L
td 7-28
Final R
eport
IDC
J Inc. E
JEC
Inc
The P
roject on Integrated Urban D
evelopment M
aster Plan for
the City of N
airobi in the Republic of K
enya
Table 7.1.11 Selection of Mode for MRTS Corridors
No. Road Name
Starting Station
Ending Station
Proposed Mode by MRTS
Physical Condition for MRT/LRT Progress of Related Project
Implementation Phase Medium
Term (2023)
Long Term (2030)
Long-long Term
(after 2030)
1 Thika RoadNRS Kasarani Metro The width of the existing median
strip is not enough for the construction of viaduct piers.
Completed by AfDB finance BRT Metro
Kasarani Eastern Bypass Metro Completed by AfDB finance Metro
2 Juja Road NRS Outer Ring Metro
There seems to be no difficulty in the construction.
Design stage by WB finance including BRT lane BRT LRT
Outer Ring Kayole Metro Design stage by WB finance including BRT lane
BRT
3 Jogoo Road
NRS Outer Ring LRT Jogoo Road has a wide median strip enough for the construction of LRT piers up to the crossing with the Outer Ring Road.
Not implemented LRT
Outer Ring Kayole LRT Not implemented LRT
4 Mombasa Road-Athi River
NRS JKIA North BRT (BRT by MRTS)
Design stage by WB finance including BRT lane BRT BRT BRT
JKIA North Athi River BRT Design Stage by WB finance
including BRT lane BRT
5 Langata Road
NRS Bomas of Kenya
BRT (BRT by MRTS) Not implemented BRT BRT
6 Ngong Road
NRS Dagoretti Corner Metro There is a steep slope of 5.5%
between Railway Golf Course and Upper Hill. It is necessary to introduce system using rubber tire.
Design stage by Japanese finance including LRT lane LRT
Dagoretti Corner
Karen Bus Stop Metro
Design stage by Japanese finance including LRT lane LRT
7 Waiyaki Way
NRS Kabete LRT There will be no difficulty in the construction of LRT along this road except for overpassing interchanges with crossing road.
Design stage by WB finance including BRT lane
BRT BRT BRT
Kabete Kikuyu BRT Design stage by WB finance including BRT lane BRT
8 Limuru Road NRS
Ruaka Bus Station BRT (BRT by MRTS) Not implemented BRT
9 Outer Ring Road GSU
Mombasa Road LRT
Prior to the construction of LRT, the road shall be widened with a median strip for future pier construction.
Design stage by AfDB finance including BRT lane BRT BRT
CBDCircular Route
NRS NRS - There is a steep slope of 5.5% between Railway Golf Course and Upper Hill.
None LRT LRT
Source: JICA Study Team (JST)

The Project on Integrated Urban Development Master Plan for the City of Nairobi in the Republic of Kenya
Nippon Koei Co., Ltd. 7 - 29 Final Report IDCJ Inc. EJEC Inc.
As a result of evaluation of priority corridors and examination of transportation mode, the following six routes are selected as the public transport development plan in the target year:
(i) BRT Route 1 (Thika Road, from Nairobi Station to Kasarani)
Development of Thika Highway was already completed, but the future traffic demand will exceed the capacity. In order to address this issue, introduction of BRT from Nairobi Station via Ring Road Ngara along Thika Road is a necessary measure. The route will attract passenger demand from the northeast direction.
(ii) BRT Route 2 (Juja Road, from Nairobi Station to Outer Ring Road)
Westward vehicle traffic demand is concentrated to Juja Road. Road widening including MRTS corridor is ongoing under WB finance. The BRT will attract passenger demand and improve the traffic condition in the western part of CBD.
(iii) BRT Route 3 (Mombasa Road, from Nairobi Station to JKIA North)
This is the route where traffic demand is concentrated. Road widening is under design by KeNHA including BRT route in the median. The BRT route will attract passenger demand from the south and east to CBD.
(iv) BRT Route 4 (Waiyaki Way, from Nairobi Station to Kabete)
This is the route where traffic demand is concentrated. Road widening is under design by KeNHA including BRT route in the median. The BRT route will attract passenger demand from the western area of CBD.
(v) BRT Route 5 (Langata Road, from Magadi Road Crossing to Nyayo Stadium)
Based on the future traffic assignment, traffic demand exceeds the current capacity and expansion of road to six lanes is required. In this case, by shifting two lanes to the BRT route, road capacity will increase. The route will attract passenger demand from the southwest direction.
(vi) BRT Route 6 (Outer Ring Road, from Thika Road to Mombasa Road)
Vehicle traffic demand is large throughout the route. Introduction of BRT will disperse the traffic demand and ease the traffic demand on radial roads.
In addition to the six BRT routes shown above, the following option is added by the JICA Study Team for the smooth transportation in the city centre area.
(vii) LRT Circular Route in City Centre
Introduction of LRT in the city centre is based on the policy to realise world-class city centre. To create safe and high mobility city centre, LRT will provide the service around the city centre. Area inside the LRT route will be the NMT zone, where pedestrians and bicycles can move without obstacles by vehicles.
Based on the above concept, public transport network for alternative 3 is shown in Figure 7.1.28.

The Project on Integrated Urban Development Master Plan for the City of Nairobi in the Republic of Kenya
Nippon Koei Co., Ltd. 7-30 Final Report IDCJ Inc. EJEC Inc.
Source: JICA Study Team (JST) Figure 7.1.28 Public Transport Network in Alternative 3
iii) Traffic Demand Forecast for the Alternative Cases
Future traffic demand in 2030 is forecasted by the traffic models established in Section 7.1.4. Results of vehicle assignment for alternative case 0, case 2, and case 3 are shown in Figures 7.1.29, 7.1.30, and 7.1.31, respectively. Results of passenger assignment of public transport (railway, BRT, and LRT) for case 3 are shown in Figure 7.1.32.

The Project on Integrated Urban Development Master Plan for the City of Nairobi in the Republic of Kenya
Nippon Koei Co., Ltd. 7-31 Final Report IDCJ Inc. EJEC Inc.
Source: JICA Study Team (JST)
Figure 7.1.29 Vehicle Assignment Result of Alternative 0 in 2030
Source: JICA Study Team (JST)
Figure 7.1.30 Railway Passenger Assignment Result of Alternative 2 in 2030
20000(PCU)

The Project on Integrated Urban Development Master Plan for the City of Nairobi in the Republic of Kenya
Nippon Koei Co., Ltd. 7-32 Final Report IDCJ Inc. EJEC Inc.
Source: JICA Study Team (JST)
Figure 7.1.31 Vehicle Assignment Result of Alternative 3 in 2030
Source: JICA Study Team (JST) Figure 7.1.32 Public Transport (Railway, BRT, and LRT) Passenger Assignment Result of Alternative 3 in
2030
20000(PCU)

The Project on Integrated Urban Development Master Plan for the City of Nairobi in the Republic of Kenya
Nippon Koei Co., Ltd. 7-33 Final Report IDCJ Inc. EJEC Inc.
(6) Evaluation of Alternative Cases
1) Modal Share by Alternative Case
The number of trips by transport mode forecasted for each alternative case is shown in Table 7.1.12 and modal share for each alternative case is shown in Figure 7.1.33. In alternative 2, the number of railway trips is 215,000, and the number of private mode trips decreases by 58,000 from alternative 1. In alternative 3, the number of bus trips increases by 366,000 from alternative 2, and the number of new transport trips is 46,000. On the other hand, the number of private mode trips decreases by 388,000 and the modal share decreases by 3.9% from alternative 2.
Table 7.1.12 Number of Trips by Mode by Alternative Case in 2030 (Unit: km)
Alternative Year WALK PRIVATE BUS New Transport RAIL TOTAL
Existing Case 2013 3,090,103 916,624 2,754,489 - 14,006 6,775,222
Do Nothing 2030 3,951,711 2,161,718 3,885,662 - 18,587 10,017,678
0 Ongoing Project 2030 3,951,711 2,195,331 3,852,215 - 18,421 10,017,678
1 Road Development Oriented
2030 3,951,711 2,213,695 3,833,869 - 18,403 10,017,678
2 Utilisation of Commuter Rail
2030 3,951,711 2,155,726 3,695,692 - 214,549 10,017,678
3 Introduction of Selective MRTS
2030 3,951,711 1,767,773 4,062,046 45,692 190,456 10,017,678
Source: JICA Study Team (JST)
45.6%
39.4%
39.4%
39.4%
39.4%
39.4%
13.5%
21.6%
21.9%
22.1%
21.5%
17.6%
40.7%
38.8%
38.5%
38.3%
36.9%
40.5%
0.2%
0.2%
0.2%
0.2%
2.1%
1.9%0.5%
0% 20% 40% 60% 80% 100%
2013
Do Nothing2030
Alternative 02030
Alternative 12030
Alternative 22030
Alternative 32030
WALK PRIVATE BUS RAIL New Transport Source: JICA Study Team (JST)
Figure 7.1.33 Modal Share by Alternative Cases in 2030
2) Average Speed and Average VCR by Alternative Case
As a result of vehicle traffic assignment, future traffic condition is indicated by total vehicle-km, total vehicle-hours, average speed, and average VCR as shown in Table 7.1.13. Compared with the existing case in 2013, the average speed and VCR worsen in the Do-Nothing case in 2030. But due to the measures introduced by the alternatives, the indices improve in alternatives 0–3.

The Project on Integrated Urban Development Master Plan for the City of Nairobi in the Republic of Kenya
Nippon Koei Co., Ltd. 7-34 Final Report IDCJ Inc. EJEC Inc.
In alternative 3, in which maximum measures are introduced, the average speed improves compared with the existing case. As for VCR, alternative 3 shows the least value, which is still larger than the existing case.
Table 7.1.13 Major Indices by Vehicle Traffic Assignment
Alternative YearTotal
Vehicle-km PCU-km(‘000)
Total Vehicle-hours
PCU-Hour
Average Speed (km/h)
Average VCR(Volume
Capacity Ratio)
Study Area
Existing Case 2013 17,780 431,690 41.2 0.54 Do Nothing Case 2030 39,110 1,692,480 23.1 1.190 Ongoing Project Case 2030 37,670 1,173,180 32.1 1.021 Road Development Oriented Case 2030 36,510 928,970 39.3 0.85
2 Utilisation of Commuter Rail Case 2030 35,100 879,350 39.9 0.81
3 Introduction of Selective MRTS Case 2030 30,500 723,920 42.1 0.71
Nairobi City
Existing Case 2013 10,960 273,910 40.0 0.69 Do Nothing Case 2030 25,320 1,254,120 20.2 1.60
0 Ongoing Project Case 2030 25,520 805,560 31.7 1.321 Road Development Oriented Case 2030 24,850 620,560 40.1 1.042 Utilisation of Commuter Rail Case 2030 23,780 581,190 40.9 1.003 Introduction of Selective MRTS Case 2030 19,430 432,490 44.9 0.82
Source: JICA Study Team (JST)
3) Distribution of VCR
Table 7.1.14 shows the road length distribution by VCR value in Nairobi City. It is observed that the roads with low VCR value increase as more measures to improve traffic condition are introduced from alternatives 1 to 3. Although average VCR of alternative 3 increases from the present, roads with high VCR value decrease.
Table 7.1.14 Road Length Distribution by VCR in Nairobi City Unit: km VCR Existing in
2013 Do Nothing in
2030 Alternative 0
in 2030 Alternative 1
in 2030 Alternative 2
in 2030 Alternative 3
in 2030 -0.8 510.2 171.1 243.3 337.8 358.5 469.7
0.8 - 1.0 81.0 69.2 81.8 132.1 143.8 151.4 1.0 - 1.2 69.5 80.6 87.2 124.2 115.8 106.7 1.2 - 1.5 62.3 85.8 139.1 126.2 132.3 77.6
1.5 - 28.1 344.5 227.4 99.6 69.4 14.4 TOTAL 751.2 751.2 778.9 819.8 819.8 819.8
Source: JICA Study Team (JST)
67.9%
22.8%
31.2%
41.2%
43.7%
57.3%
10.8%
9.2%
10.5%
16.1%
17.5%
18.5%
9.3%
10.7%
11.2%
15.2%
14.1%
13.0%
8.3%
11.4%
17.9%
15.4%
16.1%
9.5%
3.7%
45.9%
29.2%
12.1%
8.5%
1.8%
0% 20% 40% 60% 80% 100%
Existing2013
Do‐Nothing Case2030
Alternative 02030
Alternative 12030
Alternative 22030
Alternative 32030
‐0.8 0.8 ‐ 1.0 1.0 ‐ 1.2 1.2 ‐ 1.5 1.5 ‐ Source: JICA Study Team (JST)
Figure 7.1.34 Road Length Distribution by VCR in Nairobi City

The Project on Integrated Urban Development Master Plan for the City of Nairobi in the Republic of Kenya
Nippon Koei Co., Ltd. 7-35 Final Report IDCJ Inc. EJEC Inc.
4) Conclusion of Evaluation of Alternative Cases
(i) Comparing the indices of alternatives 0 to 3, vehicle-km, vehicle-hours, and average VCR decrease due to the development of mass transit.
(ii) Development of roads alone cannot solve the traffic congestion as shown in Figure 7.1.30. Reinforcement of mass transit and introduction of new transit system are requisite.
(iii) By reinforcement of commuter rail and introduction of BRT to six corridors, traffic congestion is eased especially in the eastern area of the city centre.
(iv) As a result, alternative 3 is recommended as the solution against the future increasing traffic demand.
(7) Staging Plan
1) Basic Strategy for Staging Plan
In the NUTRANS, staging plan for the short term (2010), medium term (2015), and long term (2025) was proposed. But in the years from 2006, conditions for network formation changed greatly, such as development of bypasses and Thika Highway. Therefore, staging plan by NUTRANS will be reviewed and reorganised in this study.
The target of road and urban transport development is:
(i) Network in coordination with land use: The land use structure plan proposes to strengthen the function in CBD and to dispose the sub-centres. Road and urban transport network should support the formation of planned land use structure by harmonious flow of people and fleet.
(ii) Network for world-class mobility: Nairobi Metro 2030 envisages a world-class metropolis. To encourage the realisation of world-class metropolis, road and urban transport network should have high mobility. To this end, principal measures to promote high mobility are expansion of efficient public transport network and establishment of circumferential/radial (C/R) road network.
In order to achieve the target, the required strategy in each phase is described in Table 7.1.15.
Table 7.1.15 Strategy for Staging Plan of Urban Transport Development 1st Phase
Present to 2018 2nd Phase
2019 to 2023 3rd Phase
2024 to 2030 Network in coordination with land use
Study/technical assistance for development of infrastructure in CBD, sub-centres / Railway City.
Development of infrastructure in CBD, sub-centres / Railway City.
Network development to connect sub-centres.
Network for world-class mobility
Improvement of network to solve existing issues.
Institutional arrangement for strengthening public transport.
Introduction of MRTS to pilot corridors.
Development of road corridors to introduce MRTS.
Strengthening of circumferential roads to form the C/R network.
Expand introduction of MRTS to plural corridors.
Establishment of C/R network system.
Source: JICA Study Team (JST)

The Project on Integrated Urban Development Master Plan for the City of Nairobi in the Republic of Kenya
Nippon Koei Co., Ltd. 7-36 Final Report IDCJ Inc. EJEC Inc.
2) Transport Network in the Short Term (2018)
i) Road Network
The road network in the short term is basically composed of the present network and ongoing projects. Name and length of roads to be developed in the short term are shown in Table 7.1.16, and the road network is shown in Figure 7.1.35.
Table 7.1.16 Road Development Length in the Short Term (2018)
Type Road Name Section Inside
Nairobi (km)
Outside Nairobi
(km)
Total (km)
New Construction Southern Bypass Road 20.7 7.8 28.5
Western Bypass Link Road
Northern Bypass - Waiyaki Way 6.5 6.5
Missing Link M-3 0.8 0.8 M-6 2.9 2.9 M-7 3.0 3.0 M-10 1.5 1.5 M-15a 1.8 1.8 M-15b 1.5 1.5 M-5 3.2 3.2 M-16 1.1 1.1 M-15b to M-5 0.8 0.8 Total 43.8 7.8 51.6
Widening Langata Road KWS Gate - Karen Shopping Centre 2.0 2.0
Outer Ring Road Thika Road – Eastern Bypass 13.0 13.0
Ring Road Kilimani Argwings Kodheck –Ngong Road 1.7 1.7
Missing Link M-16 (Ring Road Parklands) 1.8 1.8 Ngong Road Kenyatta Ave – Adams Arcade 4.5 4.5
Juja Road Ring Road Ngara – Outer Ring Road
5.0 5.0
Park Road Muranga Road – Ngra Road 0.8 0.8
Koma Rock Road Outer Ring Road – Kangundo
Road 4.5 4.5
Total 33.3 0.0 33.3Source: JICA Study Team (JST)

The Project on Integrated Urban Development Master Plan for the City of Nairobi in the Republic of Kenya
Nippon Koei Co., Ltd. 7-37 Final Report IDCJ Inc. EJEC Inc.
Source: JICA Study Team (JST)
Figure 7.1.35 Road Network in the Short Term (2018)
ii) Public Transport Network
Improvement of existing railway to commuter rail and development of BRT system including establishment of operator is thought to take more than five years. Therefore, public transport system in the short term is the same as the existing public transport network.
3) Transport Network in Medium Term (2023)
i) Road Network
The road network in the medium term consists of roads of the following four categories:
a) Ongoing road projects to be completed until 2018;
b) Roads which assist in the creation of the Railway City;
c) Roads which form the C/R network system; and
d) Roads which connect the proposed sub-centres.
Name and length of roads to be developed in the medium term are shown in Table 7.1.17, and the road network is shown in Figure 7.1.36.
Table 7.1.17 Road Development Length in the Medium Term (2023)
Type Road Name Section Inside
Nairobi (km)
Outside Nairobi
(km)
Total (km)
New Construction Missing Link M-12 (Ngong Road – Langata Road) 4.5 4.5
M-15c 1.7 1.7
Circumferential Road C-2 (Uhuru Highway – State House Road)
2.4 2.4
C-2 (Arwings Kodek – Magathi Way) 0.7 0.7
Railway Viaduct Over NRS 1.9 1.9
Factory Street 0.3 0.3

The Project on Integrated Urban Development Master Plan for the City of Nairobi in the Republic of Kenya
Nippon Koei Co., Ltd. 7-38 Final Report IDCJ Inc. EJEC Inc.
Type Road Name Section Inside
Nairobi (km)
Outside Nairobi
(km)
Total (km)
Extension of M-5 M-5 – Eastleigh 1st Road 1.5 1.5
Total 13.0 0.0 13.0
Widening Mombasa Road JKIA – James Gichuru Road 7.0 7.0
Enterprise Road Factory Street – Lusaka Road 2.5 2.5
Homa Bay Rd – Mombasa Road 4.3 4.3
Kiambu Road Thika Road – Northern Bypass 5.5 5.5
Ngong Road Adams Arcade – Dagoretti Corner 2.1 2.1
Dagoretti Corner – Langata Road 6.7 6.7
Circumferential Road C-2 (State House Road – Woodlands Road)
1.7 1.7
Lusaka Road Enterprise Road – Uhuru Highway 1.3 1.3
Factory Street Enterprise Road – Railway 0.7 0.7
Kayole Road Outer Ring Road – Kangundo Road 6.1 6.1
Airport South Road Eastern Bypass – Airport Terminal Road
2.7 2.7
Ngara Road Museum Hill – Muranga Road 1.1 1.1
Park Road – Park Road Ngara 0.8
Total 42.5 0.0 42.5 Source: JICA Study Team (JST)
Source: JICA Study Team (JST)
Figure 7.1.36 Road Network in the Medium Term (2023)
ii) Public Transport Network
Public transport network in the medium term is composed of commuter rail and BRT pilot route. Location of sub-centres envisaged in the land use plan is connected to stations of commuter rail line. Therefore, in order to induce the creation of sub-centres, development of commuter rail line is prioritised. Because passenger demand is large and road development will progress on Waiyaki Corridor and Mombasa Corridor, these corridors are selected as the pilot corridor for BRT. The selected medium-term public transport network is shown in Figure 7.1.37.

The Project on Integrated Urban Development Master Plan for the City of Nairobi in the Republic of Kenya
Nippon Koei Co., Ltd. 7-39 Final Report IDCJ Inc. EJEC Inc.
Source: JICA Study Team (JST)
Figure 7.1.37 Public Transport Network in the Medium Term (2023)
4) Transport Network in the Long Term (2030)
i) Road Network
Road network in the long term is the future road network in 2030. Roads to be developed in the 3rd phase (2024-2030) are shown in Table 7.1.18 and Figure 7.1.38.
Table 7.1.18 Road Development Length in the Long Term
Type Road Name Section Inside
Nairobi (km)
Outside Nairobi
(km)
Total (km)
New Construction
Outer Ring Extension Outer Ring Road – Northern Bypass 4.8 4.8 Western Bypass Link Road Ngong Road – Missing Link M-12 5.0 5.0 Dandora Road Extension Eastleigh 1st Ave – Outer Ring Road 3.6 3.6
Riverside Road M-5 Extension – Waiyaki Way 4.7 4.7 Total 18.1 0.0 18.1 Widening Langata Road Mombasa Road – Magadi Road 8.3 8.3 Magadi Road – Ngong Road 7.4 7.4 Magadi Road Langata Road – Ongata Rongai 13.8 3.6 17.4 Eastern Bypass Airport North Road – Thika Road 13.0 9.2 22.2 Kangundo Road Outer Ring Road – Eastern Bypass 12.0 12.0 Mombasa Road JKIA - Athi River 12.7 10.8 23.5 Naivasha Road Dragotti Corner – Waiyaki Way 7.0 7.0 Jogoo Road Lusaka Road – Outer Ring Road 5.2 5.2 Likoni Road Jogoo Road – Enterprise Road 2.1 2.1 Lunga Lunga Road Likoni Road – Outer Ring Road 4.0 4.0
Peponi Road Ring Road Parkland - Western Bypass Link Road
4.3 4.3
Lower Kabete Road Ring Road Parkland - Gitaru/ndernderu Road
7.8 4.2 12.0
Kamiti Road Yhika Road – Northern Bypass 3.1 3.1 Kasarani Road Thika Road – Koma Rock Road 8.0 8.0 James Gichuru Road Waiyaki Way – Ngong Road 5.2 5.2
Total 105.6 27.8 141.7 Source: JICA Study Team (JST)

The Project on Integrated Urban Development Master Plan for the City of Nairobi in the Republic of Kenya
Nippon Koei Co., Ltd. 7-40 Final Report IDCJ Inc. EJEC Inc.
Source: JICA Study Team (JST)
Figure 7.1.38 Road Network in the Long Term (2030)
ii) Public Transport Network
Public transport network in the long term is shown in Figure 7.1.39. Development of four BRT corridors and development of LRT Circular Route are the major developments in the 3rd phase.
Source: JICA Study Team (JST) Figure 7.1.39 Public Transport Network in the Long Term (2030)

The Project on Integrated Urban Development Master Plan for the City of Nairobi in the Republic of Kenya
Nippon Koei Co., Ltd. 7-41 Final Report IDCJ Inc. EJEC Inc.
5) Traffic Demand Forecast in the Short Term, Medium Term and Long Term
Based on the established network staging plan, traffic demand forecast is conducted.
i) Traffic Assignment
Results of vehicle traffic assignment in the short term, medium term, and long term are shown in Figures 7.1.40, 7.1.41, and 7.1.43, respectively. Public transport passenger assignment results in the medium term and long term are shown in Figures 7.1.42 and 7.1.44, respectively.
Source: JICA Study Team (JST) Figure 7.1.40 Vehicle Assignment Result of Short-term Plan in 2018

The Project on Integrated Urban Development Master Plan for the City of Nairobi in the Republic of Kenya
Nippon Koei Co., Ltd. 7-42 Final Report IDCJ Inc. EJEC Inc.
Source: JICA Study Team (JST) Figure 7.1.41 Vehicle Assignment Result of Medium-term Plan in 2023
Source: JICA Study Team (JST) Figure 7.1.42 Public Transport (Railway and BRT) Passenger Assignment Result of Medium-term Plan in
2023
Commuter Rail Bus Rapid Transit New Transport

The Project on Integrated Urban Development Master Plan for the City of Nairobi in the Republic of Kenya
Nippon Koei Co., Ltd. 7-43 Final Report IDCJ Inc. EJEC Inc.
Source: JICA Study Team (JST)
Figure 7.1.43 Vehicle Assignment Result of Long-term Plan in 2030
Source: JICA Study Team (JST) Figure 7.1.44 Public Transport (Railway, BRT and LRT) Passenger Assignment Result of Long-term Plan
in 2030
20000(PCU)
Commuter Rail Bus Rapid Transit New Transport

The Project on Integrated Urban Development Master Plan for the City of Nairobi in the Republic of Kenya
Nippon Koei Co., Ltd. 7-44 Final Report IDCJ Inc. EJEC Inc.
ii) Transition of Modal Share
Table 7.1.19 and Figure 7.1.45 show the transition of modal share in the short, medium and long terms. Due to the increase in the number of vehicles, modal share of private mode gradually increases. But by the introduction of new public transport system, total share of bus and railway increases in the medium term and long term.
Table 7.1.19 Number of Trips by Mode in the Short, Medium, and Long Terms Unit: Trips
Alternatives and Target Year
Walk Private Public Rail New Transport Total
2013 3,090,103 916,624 2,754,489 14,006 -- 6,775,222Alternative 3
2018 3,246,051 1,289,796 3,281,824 14,416 -- 7,832,087
Alternative 3 2023
3,606,326 1,506,186 3,564,101 181,736 -- 8,858,349
Alternative 3 2030
3,951,711 1,767,773 4,062,046 190,456 45,692 10,017,678
Source: JICA Study Team (JST)
45.6%
41.4%
40.7%
39.4%
13.5%
16.5%
17.0%
17.6%
40.7%
41.9%
40.2%
40.5%
0.2%
0.2%
2.1%
1.9%
0.5%
0% 20% 40% 60% 80% 100%
2013
Alternative 32018
Alternative 32023
Alternative 32030
WALK PRIVATE BUS RAIL New Transport Source: JICA Study Team (JST)
Figure 7.1.45 Modal Share in the Short, Medium and Long Terms
iii) Transition of Average Speed and Average VCR
Table 7.1.20 shows the future traffic condition by total vehicle-km, total vehicle-hours, average speed, and average VCR. In the short term, average speed and average VCR worsen because improvement of network cannot catch up with the increasing traffic demand. In the medium term and long term, average speed and average VCR gradually improve compared with the short term condition.
Table 7.1.20 Major Indices by Vehicle Traffic Assignment in Nairobi City
Alternative Year Vehicle-km
Total PCU-km(‘000)
Vehicle-hours Total PCU-Hour
Average Speed (km/h)
Average VCR (Volume
Capacity Ratio) Existing Case 2013 10,960 273,910 40.0 0.69 3 Introduction of
Selective MRTS Case 2018 16,210 424,160 38.2 0.92
3 Introduction of Selective MRrTS Case
2023 18,040 444,960 40.6 0.90
3 Introduction of Selective MRTS Case
2030 19,430 432,490 44.9 0.82
Source: JICA Study Team (JST)

The Project on Integrated Urban Development Master Plan for the City of Nairobi in the Republic of Kenya
Nippon Koei Co., Ltd. 7-45 Final Report IDCJ Inc. EJEC Inc.
iv) Distribution of VCR
Table 7.1.21 and Figure 7.1.46 show the road length distribution by VCR value in the short, medium, and long terms in Nairobi City. In the short term, the road length with VCR value of more than 1.0 increases. But in the medium term and long term, condition of congestion will be gradually improved.
Table 7.1.21 Road Length Distributions by VCR in the Short, Medium and Long Terms in Nairobi City Unit: km
VCR Existing in 2013 Alternative 3 in 2018
Alternative 3 in 2023
Alternative 3 in 2030
-0.8 510.2 404.6 431.4 469.7 0.8 - 1.0 81.0 122.6 116.9 151.4 1.0 - 1.2 69.5 77.7 95.9 106.7 1.2 - 1.5 62.3 100.9 93.1 77.6
1.5 - 28.1 83.0 64.3 14.4 TOTAL 751.2 788.7 801.7 819.8 Source: JICA Study Team (JST)
67.9%
51.3%
53.8%
57.3%
10.8%
15.6%
14.6%
18.5%
9.3%
9.8%
12.0%
13.0%
8.3%
12.8%
11.6%
9.5%
3.7%
10.5%
8.0%
1.8%
0% 20% 40% 60% 80% 100%
Existing2013
Alternative 32018
Alternative 32023
Alternative 32030
‐0.8 0.8 ‐ 1.0 1.0 ‐ 1.2 1.2 ‐ 1.5 1.5 ‐
Source: JICA Study Team (JST) Figure 7.1.46 Road Length Distribution by VCR in the Short, Medium,
and Long Terms Nairobi City
(8) Conclusion and Recommendation
1) Conclusion
General
(i) In the short term and medium term, traffic condition will worsen because improvement of transport network cannot catch up with the increasing traffic demand. In this regard, various measures should be implemented to avoid heavy traffic jam. Proposed measures are described in the recommendation.
(ii) Under the condition that the proposed plan is implemented, transport condition will be improved in the target year of 2030. But road development alone cannot improve the traffic condition. The strengthening of public transport network is essential to improve the future transport condition.

The Project on Integrated Urban Development Master Plan for the City of Nairobi in the Republic of Kenya
Nippon Koei Co., Ltd. 7-46 Final Report IDCJ Inc. EJEC Inc.
Road Network
(i) Road development/improvement shall be implemented based on the consistent programme. In this regard, implementation schedule by NUTRANS was not followed. In this study, the JICA Study Team presented the implementation schedule for the efficient and effective solution of the traffic issues and it is the most essential output of the study. Therefore, establishment of consensus amongst the stakeholders is expected in the next stage.
Public Transport Network
(i) Public transport plan in this study is a recommendation based on the traffic survey results and their analysis. From now on, many studies and discussions will be conducted for the development of public transport. The JICA Study Team hopes that the recommendation will contribute to clarify the necessity and the effect of development of public transport.
(ii) At present, for the introduction of the new public transport, relevant organisations are conducting studies individually but consistent policy for the development is not established, such as priority mode, priority corridor, physical standard for each mode, and financial method to attract investment. Comprehensive study for introduction of new public transport is required.
(iii) In order to materialise the MRTS plan, not only the physical infrastructure but also institutional framework, especially establishment of operator, is the most crucial challenge requested to the relevant authorities.
(iv) Obtaining general consensus for the improvement of transport network, especially introduction of BRT, amongst the passengers and operators of bus/matatu is highly requested.
2) Recommendation
Road Development
(i) Currently, through traffic of heavy vehicles are passing through international highways, and obstructing traffic inside the city. After the completion of the Southern Bypass, heavy vehicles should be restricted in entering into the area surrounded by Eastern Bypass, Northern Bypass, and Southern Bypass.
(ii) Land use policy emphasises the development of the central business district. Road development which will improve the accessibility in the central business district is required to be enhanced. Likewise, creation of circumferential/radial (C/R) road network system which enables diversion of traffic unnecessary to pass through CBD should be promoted.
Public Transport Development
(i) Since the beneficiaries and the most affected participants of the public transport projects are the citizens of Nairobi City, deeper involvement of Nairobi City County (NCC) in the projects is essential. Moreover, NCC established the land use plan which should harmonise with the transport system. Therefore, NCC should be the prime member of transport development project team and the opinions from NCC should be reflected in the project.
(ii) In order to demonstrate the effectiveness of the introduction of new system for public transport and to obtain the consensus amongst the citizens, pilot experiment is an effective way which was introduced to many countries. For the introduction of BRT

The Project on Integrated Urban Development Master Plan for the City of Nairobi in the Republic of Kenya
Nippon Koei Co., Ltd. 7-47 Final Report IDCJ Inc. EJEC Inc.
system, pilot experiment shall be implemented for a certain period, and effects will be evaluated after the implementation.
Short-term Measures
Result of traffic demand forecast shows that the traffic congestion will worsen in the short term and medium term. To cope with the issue, various measures should be undertaken.
i) System Signal Control
the Integrated Urban Surveillance System (IUSS) is now introduced to the CBD area. But because traffic congestion occurs in wider area, especially along the radial trunk road in the city, system signal control in the whole city area is expected.
ii) Introduction of Bus-exclusive Lane
Even before introduction of BRT, bus-exclusive lane is effective to enhance the use of public transport.
iii) Staggered Working Hours
During morning peak, more than 20% of private car arrival is from 7:00 to 8:00. But before and after the peak hour, traffic volume decreases to only 5%. The transport facilities can be used more efficiently in case of staggered working hours.
iv) Streamline the Freight Carrier
In the information age, volume of commodity has become smaller but frequency has become high. Introduction of cooperating distribution system is highly required to decrease the number of vehicle trips in the business area.
v) Development of Freight Terminal
Together with the policy to exclude heavy trucks within the city area, development of freight terminal outside urban area is required. Basic function of freight terminal is to consolidate freight at a port or a rail yard before onward shipment. Terminals may also be points of interchange involving the same mode of transport. In this regard, the Nairobi Freight Terminal will have two functions. One is modal exchange from freight train for the transport by trucks. The other is exchange of freight within trucks, from heavy trucks to light trucks for delivery in the urban area.
vi) Relocation of Bus Terminals
Along with the land use plan for development of sub-centres in the outskirts area, disposition of bus terminals is expected. These terminals will function as the transfer terminal from matatu to large bus.
7.1.7 Ideas for Additional Priority Project for Urban Transport
Considering the objective of the study, urban transport projects which promote the realisation of the land use plan are prioritised. Based on the future land use plan and future traffic demand, the following projects are recommended as the priority project for urban transport:

The Project on Integrated Urban Development Master Plan for the City of Nairobi in the Republic of Kenya
Nippon Koei Co., Ltd. 7-48 Final Report IDCJ Inc. EJEC Inc.
(1) Flyover in CBD for Railway City
1) Objective and Necessity of the Project
This project aims at the development of Railway City by harmonious planning of land use and urban transport.
(i) To encourage development potential in the southern part of the Nairobi Station by improvement of accessibility to the area; consequently remove the functions unnecessary in the CBD; and promote the creation of the Railway City.
(ii) To alleviate traffic congestion in the northern part of the station by means of relocation of the bus and matatu terminals to the new terminal in the Railway City.
(iii) To guide traffic flow from the southern part of Nairobi City promptly and decongest the traffic in the peripheral area.
2) Relevant Organisation
KURA, NCC Engineering Department
3) Summary of the Project
i) Viaduct-1 (Length: 1,000 m, 4-lane, Project cost: US$30-40 million)
The viaduct connects Moi Avenue, which is the trunk road of CBD, and Enterprise Road, which is the trunk road of the southern area of the station. Moreover, the viaduct together with the widening of Enterprise Road to four lanes will disperse the traffic on Mombasa Road.
ii) Viaduct-2 (Length: 400 m, 2-lanes, Project cost: US$10 million)
The viaduct guides bus and matatu traffic to the new terminal in the Railway City, removes the traffic on Landhies Road and thus alleviates the congestion around the terminus in the northern part of the station.
Source: JICA Study Team (JST)
Figure 7.1.47 Routes of Viaduct-1 and Viaduct-2
Viaduct-1
Viaduct-2
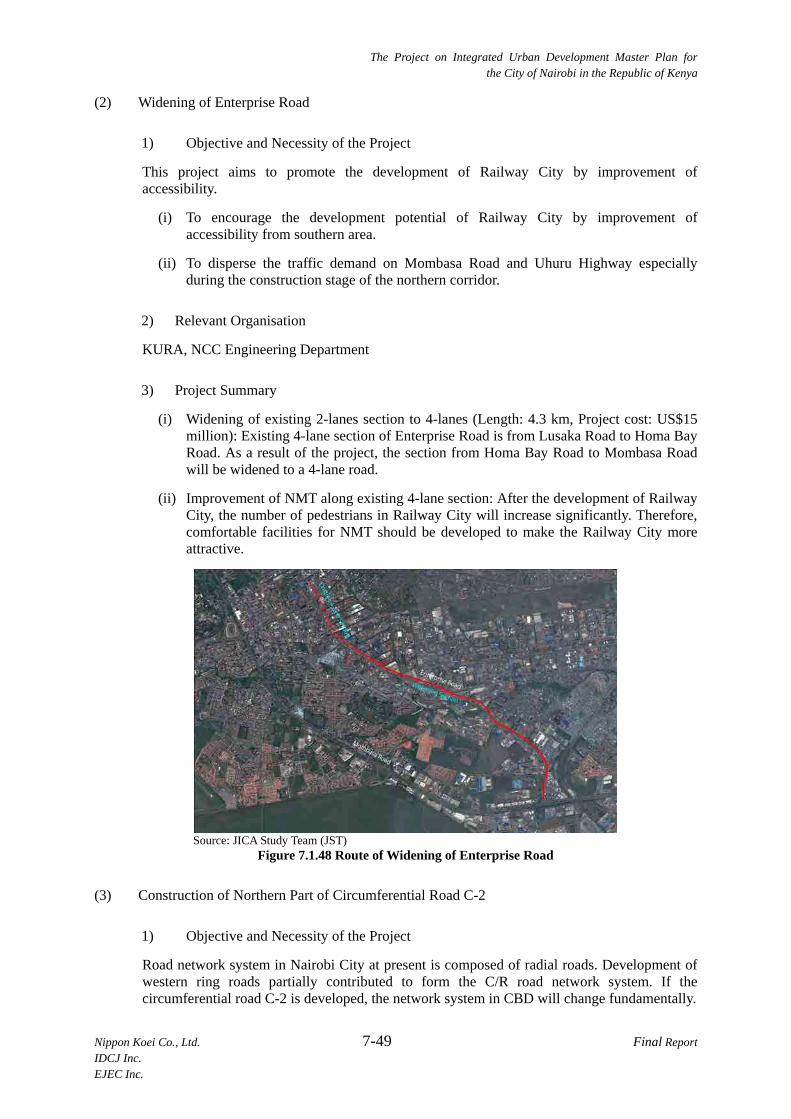
The Project on Integrated Urban Development Master Plan for the City of Nairobi in the Republic of Kenya
Nippon Koei Co., Ltd. 7-49 Final Report IDCJ Inc. EJEC Inc.
(2) Widening of Enterprise Road
1) Objective and Necessity of the Project
This project aims to promote the development of Railway City by improvement of accessibility.
(i) To encourage the development potential of Railway City by improvement of accessibility from southern area.
(ii) To disperse the traffic demand on Mombasa Road and Uhuru Highway especially during the construction stage of the northern corridor.
2) Relevant Organisation
KURA, NCC Engineering Department
3) Project Summary
(i) Widening of existing 2-lanes section to 4-lanes (Length: 4.3 km, Project cost: US$15 million): Existing 4-lane section of Enterprise Road is from Lusaka Road to Homa Bay Road. As a result of the project, the section from Homa Bay Road to Mombasa Road will be widened to a 4-lane road.
(ii) Improvement of NMT along existing 4-lane section: After the development of Railway City, the number of pedestrians in Railway City will increase significantly. Therefore, comfortable facilities for NMT should be developed to make the Railway City more attractive.
Source: JICA Study Team (JST)
Figure 7.1.48 Route of Widening of Enterprise Road
(3) Construction of Northern Part of Circumferential Road C-2
1) Objective and Necessity of the Project
Road network system in Nairobi City at present is composed of radial roads. Development of western ring roads partially contributed to form the C/R road network system. If the circumferential road C-2 is developed, the network system in CBD will change fundamentally.

The Project on Integrated Urban Development Master Plan for the City of Nairobi in the Republic of Kenya
Nippon Koei Co., Ltd. 7-50 Final Report IDCJ Inc. EJEC Inc.
Additionally, the circumferential road C-2 will encircle the CBD area, and will ease the traffic movement around the CBD.
2) Relevant Organisation
KURA, NCC Engineering Department
3) Summary of the Project
Development of Circumferential Road C-2
Beginning Point: Thika Road/Uhuru Highway Intersection
Ending Point: Crossing with Mbagathi Way
Distance: (Widening) 2.2 km
(New construction) 1.5 km
Number of Lanes: 4 lanes
Source: JICA Study Team (JST) Figure 7.1.49 Supposed Route of Northern Part of Circumferential Road C-2

The Project on Integrated Urban Development Master Plan for the City of Nairobi in the Republic of Kenya
Nippon Koei Co., Ltd. 7-51 Final Report IDCJ Inc. EJEC Inc.
(4) Creation of ITS City
1) Objective and Necessity of the Project
(i) Traffic demand in Nairobi City is increasing in the entire area, and congestion of road is also spreading in the whole area. Through traffic in CBD is deteriorating the traffic congestion in CBD area. By introduction of ITS technology to Nairobi City area, traffic flow will be improved and traffic concentration to CBD will be rectified.
(ii) In the current circumstances, ITS is introduced individually such as installation of CCTV. Comprehensive policy for development of ITS in Nairobi City does not exist. Hence, the project aims at the establishment of a comprehensive plan for the development of ITS in Nairobi City including the installation and management of ITS facilities.
2) Relevant Organisation
NCC Engineering Department, Police
3) Summary of the Project
i) Establishment of ITS Master Plan, Dispatch of Expert
ii) Expected Component Technology
Traffic Control and Surveillance System (TCSS) Centre, Traffic Signal Optimisation System, Illegal Parking Control System, Traffic Accident Detection System, Bus Location System, Public Transport Transfer Information System, Flooding Detector System, Parking Guidance System, Variable Message Sign (VMS) Information System, and Transport Database (road and facility, statistics for traffic accident, etc.).
iii) Other Supplemental Function
Traffic Demand Management (TDM), Traffic Safety
iv) The ITS project in CBD will play a role as a showcase of this project.
Figure 7.1.50 Project Area for Creation of ITS City
CBD

The Project on Integrated Urban Development Master Plan for the City of Nairobi in the Republic of Kenya
Nippon Koei Co., Ltd. 7-52 Final Report IDCJ Inc. EJEC Inc.
7.2 Railway
7.2.1 Demand and Gap Analysis
There is no doubt that the potential demands for the commuter train operation in Nairobi City and surrounding areas are always higher than actual capacities. Due to the insufficient locomotives and wagons, RVR is operating only one or two commuter trains on each line in the morning. Due to the poor condition of railway track, trains are running at a very low speed and the quality of service is not good enough so that a number of commuters are using bus transportation rather than the railway. Unless substantial improvement is made on the railway system, the present situation would not change much.
Source: Nairaland Forum (http://www.nairaland.com/51356/nairobi-photos-kenya-beautiful-east/103)
Figure 7.2.1 Commuter Train Operation by RVR
7.2.2 Development Policy
There seems to be insufficient coordination between the Ministry of Transportation and Kenya Railways Corporation (KRC) on the planning of urban transportation by rail. MRT/LRT lines planned in MRTS (2011) were not considered in the new line construction plan recently prepared by KRC. In order to avoid overlapping of projects, close coordination and communication shall be kept amongst those authorities concerned.
Since railway projects have time and cost consuming natures, projects shall be classified into short-, medium-, and long-term plans.
The projects utilising the existing railway facilities and equipment, such as introduction of DMU on the existing lines, can be categorised under short-term projects. Those new line constructions, such as MRT/LRT construction, shall be categorised as medium- or long-term projects.

The Project on Integrated Urban Development Master Plan for the City of Nairobi in the Republic of Kenya
Nippon Koei Co., Ltd. 7-53 Final Report IDCJ Inc. EJEC Inc.
Source: MRTS Report
Figure 7.2.2 Planned MRTS Corridors
7.2.3 Priority Projects
Considering current transportation demands, development policy and site conditions, higher priority to the following projects shall be given:
(1) Introduction of DMU for the Existing KRC Lines
As described in Section 7.2.1, the existing commuter train operation by RVR using diesel locomotives and wagons is insufficient in the aspects of capacity, speed, and riding comfort. Because of the high demands and low capacity, trains are always fully loaded and passengers are forced to tolerate the uncomfortable condition.
In order to ease such situation, introduction of DMU is suggested. It was calculated by a preliminary analysis that three train sets (consisting of six cars each) can carry 7,000 to 10,000 passengers within two hours in the morning between Ruiru-Nairobi, Kikuyu-Nairobi, and the Athi River–Nairobi, respectively.
Introduction of DMU does not mean procurement of DMU only, but also provision of the maintenance facilities and equipment, spare parts, and staff training.
(2) Track Rehabilitation of Existing KRC Lines
Rehabilitation of the existing track is another way to increase the transportation capacity of a railway. If the schedule speed (average speed including stopping time at stations) can be doubled, transportation capacity of the train will be doubled. Due to the existing poor condition of track, the schedule speed at this moment is less than 20 km/h. If the rail is welded and placed on properly shaped ballast, the schedule speed can be doubled easily. This track rehabilitation project shall include staff training and provision of track maintenance equipment, if required.

The Project on Integrated Urban Development Master Plan for the City of Nairobi in the Republic of Kenya
Nippon Koei Co., Ltd. 7-54 Final Report IDCJ Inc. EJEC Inc.
(3) Introduction of Signaling System for DMrU Operation
When introduction of DMU and track rehabilitation are planned, introduction of a modern signaling system shall also be planned in order to keep the safety of train operation. At this moment, there is no signal system existing on the KRC Lines. Train operation is controlled by telephone communication between stations and using a paper sheet instead of tablet for the confirmation of track occupancy. Radio communication system can be adopted for communication between stations and between station and train driver. GPS can be utilised for positioning of trains.
(4) Feasibility Study for the East-West Corridor MRT Line
The MRTS report has been prepared in June 2011. Three MRT lines and three LRT lines along the existing major roads are planned in the report, and the first priority was given to a MRT line along Thika Road.
Table 7.2.1 Existing Condition of Planned MRT/LRT Routes Priority inNMRTS
Route Construction Existing Condition of the Route
1 Thika Road 2013-2016 Expressway is completed. KRC line is available.
2 Juja Road 2015-2018 Road widening is required at east side of the route.
3 Jogoo Road 2017-2020 Road widening is required at east side of the route.
4 Ngong Road 2019-2022 90% of the route is ready for construction.
5 Waiyaki Way 2021-2024 80% of the route is ready for construction.
5 Outer Ring Road 2021-2024 Road widening is required at whole route. Source: JICA Study Team (JST)
Source: JICA Study Team (JST)
Figure 7.2.3 Existing KRL Lines and Planned MRT/LRT Lines

The Project on Integrated Urban Development Master Plan for the City of Nairobi in the Republic of Kenya
Nippon Koei Co., Ltd. 7-55 Final Report IDCJ Inc. EJEC Inc.
According to the results of the site visits, it was found that the 6-lane expressway between Nairobi and Ruiru and the 4-lane expressway between Ruiru and Thika were completed. In addition, KRC is planning to improve the commuter train operation up to Thika. Therefore, the first priority of MRT construction between Nairobi and Ruiru can be reduced.
There seems to be right of way problems at the second priority MRT route (Juja Road) and the third priority LRT route (Jogoo Road).
The site is ready for construction at the fourth priority MRT route (Ngong Road) and the fifth priority LRT route (Waiyaki Way).
The whole section of LRT route (Outer Ring Road) requires road widening. It will take time for it to be ready for construction.
Considering demand forecast and site condition, the first priority MRT/LRT route shall be selected for a feasibility study for construction purpose.
(5) Feasibility Study for the Ring Line
All the urban railway lines radiating from Nairobi station proposed in NMRTS study. It may cause severe traffic congestion at CBD area. In order to avoid the concentration at CBD near Nairobi station, provision of a Loop Line can be considered. AGT or Monorail system will be suitable for the Loop Line circulating sub-centers which may be formed at the interchange stations.
The blue line shown on the following map is an example of the Loop Line.
Source: JICA Study team Figure 7.2.4 Loop Line circulating CBD and Sub-centres
At the same time of the feasibility study for the first MRT Line, this Loop Line shall also be studied.

The Project on Integrated Urban Development Master Plan for the City of Nairobi in the Republic of Kenya
Nippon Koei Co., Ltd. 7-56 Final Report IDCJ Inc. EJEC Inc.
Bovins Otieno, Martin Luther Primary School (Rank 1 of Class 6)

The Project on Integrated Urban Development Master Plan for the City of Nairobi in the Republic of Kenya
Nippon Koei Co., Ltd. 8-1 Final Report IDCJ Inc. EJEC Inc.
CHAPTER8 URBAN INFRASTRUCTURE DEVELOPMENT STRATEGY
8.1 Water Supply
8.1.1 Demand and Gap Analysis
(1) Water Demand Projection
1) Population
The projected population in this study has adopted the water demand projection. The projected population is presented in Table 8.1.1.
Table 8.1.1 Population Projection of Nairobi City City 2009 2013 2018 2023 2030
Nairobi City 3,138,372 3,601,351 4,174,952 4,677,677 5,212,500 Source: JICA Study Team (JST) and Census 2009 data
2) Unit demand
i) Residential, institutional, and commercial demand
The residential demand was based on the figures stipulated in the Guidelines for Water Allocation issued by the Water Resources Management Authority (WRMA) 2009 (hereafter referred to as the WRMA guidelines).
The allowance of water loss stipulated in the WRMA guidelines was deducted from the residential unit demand. Enough information on water loss of water treatment plants, raw water pipelines, treated water pipelines, pump stations, and distribution network for Nairobi City is not available. The rate of unaccounted for water (UfW) in 2008 reported in Impact No. 3 (Water Services Regulatory Board (WSRB), 2010) is twice the allowable rate, although UfW includes the amount caused by the maloperation of water tariff. Thus, water loss in the projection does not simply utilise the allowable rate. It will be discussed in the latter sections.
The minimum requirement of unit demand at 25 litres/capita/day mentioned in the draft of Water Act 2012 was adopted as an adjustment to the figure. The basis of the residential water demand from the WRMA guidelines is presented in Table 8.1.2.

The Project on Integrated Urban Development Master Plan for the City of Nairobi in the Republic of Kenya
Nippon Koei Co., Ltd. 8-2 Final Report IDCJ Inc. EJEC Inc.
Table 8.1.2 Basis of the Residential Water Demand from the WRMA Guidelines
Category of Area
For High-class Housing (litres/capita/day)
For Medium-class Housing (litres/capita/day)
For Low-class Housing (litres/capita/day)
Including 20% of Water Loss*1)
Without Water Loss
Including 20% of Water Loss
Without Water Loss
Including 20% of Water Loss
Without Water Loss
With Individual Connection
250 200 150 120 75 60
Without Individual Connection
- - - - 30 30
Note *1): Allowance for water loss stipulated in the guidelines is 20%. Source: JICA Study Team (JST) and the Guidelines for Water Allocation (WRMA 2009)
As there is not enough information for demand projection on the population of the high-, medium- and low-class housing, the population ratio of the income level proposed in the Feasibility Study and Master Plan for Developing New Water Sources for Nairobi City and Satellite Towns (FSMPNWS) was utilised for the projection.
In the study, the high-, medium-, and low-income groups are regarded as the high-, medium- and low-class housing, respectively.
Categorising the low-class housing with/without individual connection was based on the coverage ratio of water supply by the Nairobi City Water and Sewerage Company Limited (NCWSC). The ratio of the high-, medium-, and low-class housing is presented in Table 8.1.3 and the calculated residential demand based on the ratio is presented in Table 8.1.4.
Table 8.1.3 Ratio of the High-, Medium-, and Low-Class Housing Class 2009 2013 2018 2023 2030 High-class Housing 6 % 6 % 6 % 6 % 6 %
Medium-class Housing 50 % 50 % 50 % 50 % 50 %
Low-class Housing
With Individual Connection 9 % 12 % 16 % 18 % 22 %
Without Individual Connection 35 % 32 % 28 % 26 % 22 % Source: JICA Study Team (JST) and FSMPNWS
Table 8.1.4 Ratio of the High-, Medium-, and Low-class Housing
Class Unit
Demand
2009 2013 2018 2023 2030 Rati
o Demand
Ratio
DemandRati
o Deman
d Rati
o Demand Ratio Demand
High-class Housing 200 6 12 6 12 6 12 6 12 6 12
Medium-class Housing 120 50 60 50 60 50 60 50 60 50 60
Low-class Housing
With Individual Connection
60 9 5 12 7 16 10 18 11 22 13
Without Individual Connection
30 35 11 32 10 28 8 26 8 22 7
Total (litres/capita/day) 88 89 90 91 92 Source: JICA Study Team (JST) and FSMPNWS
Institutional and commercial demand was assumed at 10% and 15% of the residential demand by the study team, respectively. The assumption was adopted from the projection to cover the lack of raw date in line with international practice.
From the conditions showed in this section, the residential unit demands were set without water loss as presented in Table 8.1.5.

The Project on Integrated Urban Development Master Plan for the City of Nairobi in the Republic of Kenya
Nippon Koei Co., Ltd. 8-3 Final Report IDCJ Inc. EJEC Inc.
Table 8.1.5 Residential Unit Demand without Water Loss Year 2009 2013 2018 2023 2030 Residential Unit Demand (litres/capita/day)
88 89 90 91 92
Institutional Unit Demand (litres/capita/day) (10% of Residential Demand)
9 9 9 9 9
Commercial Unit Demand (litres/capita/day) (15% of Residential Demand)
13 13 14 14 14
Total (litres/capita/day) 110 111 113 114 115
Source: JICA Study Team (JST)
ii) Industrial Demand
In the projection of industrial demand, the rate of residential demand for the current demand and growth of gross domestic product (GDP) in Nairobi City for future demand were adopted, considering the following situations:
Industrial demand depends on the type and size of the firm's activity. The data such as number of workers, type of products, process taken by the factory, and water demand of the existing industries for each type of industry are necessary to evaluate and analyse industrial demand. On that note, there is not enough data available for evaluation.
An approach was taken from the Aftercare Study 1998 on the National Water Master Plan in 1992 to set the ratio of residential demand for Nairobi City at 25%. In this study, the approach is adopted to consider the current industrial demand.
From the above conditions, the industrial demand is presented in Table 8.1.6.
Table 8.1.6 Industrial Demand Year 2009 2013 2018 2023 2030Industrial Demand (litres/capita/day) 22 22 23 23 23
Source: JICA Study Team (JST)
3) Water loss
According to the WRMA guidelines, water loss is defined as the total leakage and wastage with an allowance of 20%. The targeted non-revenue water (NRW) was declared in the Water Service Strategic Plan 2009 prepared by the Ministry of Water and Irrigation (MWI) based on Kenya Vision 2030. From the two facts mentioned above, the targeted water loss in 2030 is 20%.
In line with the current water loss, there is not enough information available to evaluate its ratio.
The UfW was 40% in 2008 as reported by Impact No. 3 (WSRB, 2010). Since UfW includes part of the amount of supplied water such as illegal connection and human error in the operation of water tariff, the total amount of UfW is larger than water loss. In the demand projection, the study team, however, considered that the adoption of UfW in the current situation is applicable to evaluate higher risk than the actual.
From the situation described above, the water loss in 2009 is 40% or the same as the UfW reported in 2010 and is linearly reduced to 20% in 2030 in the demand projection.
4) Summary of water demand
Based on the conditions mentioned above, the water demand of Nairobi City is presented in Table 8.1.7.

The Project on Integrated Urban Development Master Plan for the City of Nairobi in the Republic of Kenya
Nippon Koei Co., Ltd. 8-4 Final Report IDCJ Inc. EJEC Inc.
Table 8.1.7 Water Demand of Nairobi City Class 2009 2013 2018 2023 2030Population (capita) 3,138,372 3,601,351 4,174,952 4,677,677 5,212,500
Residential, Institutional, and Commercial Demand
Unit Demand (litres/capita/day) 110 111 113 114 115
Demand (m3/day) 345,221 399,750 471,770 533,255 599,437
Industrial Demand
Unit Demand (litres/capita/day) 22 22 23 23 23
Demand (m3/day) 69,044 79,229 96,024 96,024 119,888
NRW Ratio (%) 39 35 31 26 20 Total 576,000 647,000 744,000 808,000 864,000
Source: JICA Study Team (JST)
(2) Existing Demand Projection and Development Plan
As mentioned in Subsection 4.1.5, FSMPNWS was carried out under the Athi Water Services Board (AWSB) with the assistance of the World Bank (WB) and the French Development Agency (Agence Francaise de Developpement: AFD). The demand projection and development plan recommended in FSMPNWS are presented as follows:
1) Demand Projection
The characteristic conditions of demand projection in FSMPNWS are as follows:
(i) Demand projection in FSMPNWS utilised the method pursuant to the WRMA guidelines,
(ii) Projected population is the same as that of this study, and
(iii) Water loss is set by the study team of FSMPNWS.
The projected water demand in FSMPNWS is presented in Table 8.1.8.
Table 8.1.8 Water Demand of FSMPNWS Class 2010 2017 2020 2030
Population (capita) 3,250,338 4,0040,325 4,403,791 5,693,457 Water Demand (m3/day) 378,495 480,068 533,560 746,174 NRW (%) 53 40 37 37 Total (m3/day) 579,000 672,000 731,000 1,022,000
Source: FSMPNWS
2) Development Plan of the Water Resources and Water Supply System in FSMPNWS
In order to meet the requirement presented in Table 8.1.8, one plan was recommended by FSMPNWS after reviewing and evaluating several alternative scenarios.
The recommended plan comprises five phases and its components are presented in Table 8.1.9 and the general layout is presented in Figure 8.1.1.
Table 8.1.9 Recommended Water Resources Development Plan of Nairobi City Phase Component Financer Completion
Year Planned Capacity
(m3/day) Status of the Plan
as of September 20131 Well Field in Kunyu WB 2014 34,560
Detailed Design Well Field in Uriru WB 2015 30,240 2 Northern Collector Tunnel
Phase I to Thika Dam WB 2016120,960 Detailed Design Ngorongo WTP AFD 2016
3 S. Mathioya Transfer
- 2020 132,192 Master Plan Maragua Dam

The Project on Integrated Urban Development Master Plan for the City of Nairobi in the Republic of Kenya
Nippon Koei Co., Ltd. 8-5 Final Report IDCJ Inc. EJEC Inc.
Ndunyu Chege WTP 4 Northern Collector Tunnel
Phase II to Tika Dam - 2026 120,096 Master Plan 5 Ndarugu Dam
- 2029 216,000 Master Plan
Raw Water PS Ndarugu WTP
Treated Water PS Kasarani BPS
Total 654,000 Source: FSMPNWS

The Project on Integrated Urban Development Master Plan for the City of Nairobi in the Republic of Kenya
Nippon Koei Co., Ltd. 8-6 Final Report IDCJ Inc. EJEC Inc.
Figure 8.1.1 General Layout of the Existing and Planned Facilities
Northern Collector Phase I
Northern Collector Phase II
Nairobi City Water Supply System
WTP
Thika Dam
NgorongoWTP
WTPNdunyu WTP
Maraqua Dam
N. Mathioya River
Githugi River
Hembe River
S. Mathioya River
Maragua River
Gikigie River
Irati River
Thika River
Chania River
Komu River
Ndarugu River
Legend
Existing Facilities
Phase I (Detailed Design)
Phase I I (Detailed Design)
Phase III (Master Plan)
Phase IV(Master Plan)
Phase V(Master Plan)
Dam
Situation of Plan
Facilities
Pipeline, Box culvert
Weir, Intake
WTP, PS
Reservoir
Well Field
PS
WTP
WTP
Ruiru River
Ngethu WTP
Sasumua Dam
Ruiru Dam
Gigiri RV. Kabete RV.
Kikuyu Spring 1 & 2
Sasumua WTP
Kiambu RV.
Kiunyu Wellfield
Ruiru Wellfield
Ndarugu WTP
Ndarugu
PS
WTP
PS

The Project on Integrated Urban Development Master Plan for the City of Nairobi in the Republic of Kenya
Nippon Koei Co., Ltd. 8-7 Final Report IDCJ Inc. EJEC Inc.
(3) Gap of Demand Projection between FSMPNWS and this Project and its Analysis
1) Summary of Demand Projection and Water Supply Capacity
The comparison amongst the demand projected in FSMPNWS (hereafter referred to as the demand by WB) and that of the study team (hereafter referred to as the demand by the study team) is presented in this section.
The trend of the demand by WB is in almost gradual increment until 2035 and the capacity of water supply is developed to cover the demand.
On the other hand, the demand by the study team gradually increases until 2017 and the degree of increment falls down until 2030.
Until 2023, the trends of the two projections will be kept almost on the same line. After 2023, the gap between the projections will occur and expand year by year. The demand by WB is higher with 158,000 m3/day than that of the study team. The summary of demand projections and the capacity of water supply is presented in Table 8.1.10 whereas the comparison between water demands and capacity of water supply is presented in Figure 8.1.2.
Table 8.1.10 Summary of Demand Projections and Capacity of Water Supply Class 2009 2010 2013 2017 2020 2023 2030 Population (capita)
WB 3,250,338 4,0040,325 4,403,791 5,693,457
ST1) 3,138,372 3,601,351 4,677,677 5,212,500
Water Demand (m3/day)
WB 579,000 672,000 731,000 1,022,000
ST 576,000 647,000 808,000 864,000
Water loss (%)
WB 53 40 37 37
ST 39 35 26 20 Source: JICA Study Team (JST) and FSMPNWS
Note: ST (the Study Team) Source: JICA Study Team
Figure 8.1.2 Comparison between Water Demand and Capacity of Water Supply
2) Gap Analysis
The main reason of the gap between the water demand by WB and that of the study team is the difference on water loss assumptions included in the demands. As presented in Table 8.1.10, the adopted water loss in the demand by WB is much higher than that of the study team. The difference approximately accounts for the gaps.
Phase I (640,000 m3/day)
Phase II (761,000 m3/day)Phase III (893,000 m3/day)
Phase V (1,229,000m3/day)
Phase IV (1,013,000m3/day)
(m3/day) Capacity of Water Supply
Demand by WB
Demand by Study Team
2005 2010 2015 2020 2025 2030 2035
500,000
1,000,000
1,500,000

The Project on Integrated Urban Development Master Plan for the City of Nairobi in the Republic of Kenya
Nippon Koei Co., Ltd. 8-8 Final Report IDCJ Inc. EJEC Inc.
The water loss adopted in the demand by WB was estimated based on the current situation in Nairobi City as of July 2012. The water loss composed of distribution losses, transmission losses, and treatment losses. In the study, the transmission loss and treatment loss were fixed. The improvement of distribution loss changed from 40% in 2010 to 25% in 2020. The distribution loss is fixed at 25% in the period from 2020 to 2035. The total water loss adopted in FSMPNWS is presented in Table 8.1.10.
According to Impact No. 3 (WSRB, 2010), the UfW in Nairobi City was 40% in 2008. The amount is the same as the distribution loss in 2010 adopted in the demand by WB. The UfW composes physical loss, illegal connection losses, and administrative mistakes in the operation of water tariff. As the amount of illegal connection losses and administrative mistakes is the water supplied to people without collecting fees, it is not included in the water demand. The reason of the adoption is assumed that the lack of data on water loss in the water supply system of Nairobi City and the portion was regarded as the allowance of the projection.
On the other hand, the study team set the transition of water loss as declining from 40% in 2008 to 20% in 2030 as mentioned in Item (1) 3) of Subsection 8.1.1.
From the situation described above, the difference on water loss accounts to the gaps as presented in Table 8.1.10 and Figure 8.1.2.
8.1.2 Development Policy
The master plan of water supply in the area including Nairobi City with the target for completion in 2035 (FSMPNWS) has been prepared by AWSB supported by WB and AFD. The development of water supply is carried out in accordance with the master plan.
As mentioned in Item (2) of Subsection 8.1.1, the development plan of water resources and facilities for intake, raw water transmission, water treatment plant, and treated water transmission has already been established and is expected to be conducted in five phases.
Phase I is the well field development in Kiunyu and Ruiru and Phase II of the northern collector and water supply system including Ngorongo Water Treatment Plant (WTP) have commenced with WB and AFD funds. Although the development includes raw water transmission, water treatment plant, and treated water transmission, the distribution network to cover the expanded capacity of water supply has not been included in the proposed plan under FSMPNWS. Thus, the development plan of the distribution network needs to be studied separately.
Phase III of the S. Mathioya River transfer, Maragua Dam, and Ndunyu Chege WTP is under planning stage. Expanding the capacity through development is necessary to cover water demand after 2020. The water resources and facilities are located outside Nairobi City. Thus, an agreement between counties on the development of the water supply facilities for Nairobi City is indispensable. Phases IV and V of the northern collector’s second phase and Ndarugu Dam, Ndarugu WTP, three pump stations, and pipelines are planned on the basis of the demand projection by WB for 2030 and 2035, respectively. Phases IV and V could be postponed after 2035 subject to the improvement of water loss. The projected demand with 20% of the water loss will be below the total capacity of Phases I, II, and III as presented in Figure 8.1.2. Depending on the improvement level of water loss, revision of the master plan of the development needs to be studied.

The Project on Integrated Urban Development Master Plan for the City of Nairobi in the Republic of Kenya
Nippon Koei Co., Ltd. 8-9 Final Report IDCJ Inc. EJEC Inc.
8.1.3 Priority Project
(1) Background
The comprehensive plan of the distribution network in Nairobi City needs to be considered as a priority project for the following reasons;
According to the information presented by NCWSC participated in by the working group of the water sector, the pipelines and reservoirs of the distribution network need to be rehabilitated due to overage and unsuitable material for potable water as well as construction of buildings for pipeline alignments.
The necessity of expanding the distribution network has become significant year by year in response to the drastic urbanisation of Nairobi City, especially in the area along Thika Road.
The development of the water supply system up to the main reservoirs of Nairobi City has commenced with the support of WB and AFD. To cover the strengthened capacity based on the development, the comprehensive plan of the distribution network is urgently required.
According to the Water Service Strategic Plan 2009 prepared by MWI, the UfW rate should be improved to 20% from the current UfW of 40% in 2008 for efficient water use. As physical water losses of UfW mainly occur in the distribution network, the comprehensive plan of the distribution network is one of efficient activities to improve UfW.
(2) Outline of the Project
In order to establish the policy and direction of the distribution network in Nairobi City, the master plan of the distribution network is meaningful and necessary considering the situation described above.
Since the construction works of pipelines in the distribution network need to be carried out stepwise due to budgetary requirements and the necessity to coordinate with other activities in the city such as transportation, the master plan followed by detailed design of the immediate phase of implementation is indispensable.
In the master plan, technical issues such as arrangement of pipelines and its pressure are mainly discussed. Expected activities to complete the project are presented below.
1) Survey of the Current Situation
To prepare a concrete plan of expansion, rehabilitation, and replacement of the distribution network, concrete technical information is indispensable. For this purpose a detailed site survey to complement the existing information needs to be carried out.
(i) Location of pipeline, diameter, and material,
(ii) Water pressure in distribution network,
(iii) Topographic information including road, administrative, and distribution network boundaries, and
(iv) Existing facilities and equipment such as reservoirs and pumps.
2) Study of Pipeline Arrangement in the Distribution Network
Some alternatives of the pipeline arrangement are prepared and evaluated on the reduction of NRW and the possibility of its realisation.

The Project on Integrated Urban Development Master Plan for the City of Nairobi in the Republic of Kenya
Nippon Koei Co., Ltd. 8-10 Final Report IDCJ Inc. EJEC Inc.
The arrangement of pipeline is studied considering the following:
(i) Clustering of looped pipelines to main distribution pipeline for identification of problems such as physical leakage, illegal connection, and malfunctioning water meter,
(ii) Arrangement of reservoirs to keep regular release pressure between the main pipeline and pipelines connected to each customer,
(iii) Utilisation of the existing pipelines, and
(iv) Stepwise development based on the development of water resources.
3) Preparation of Direction on the Rehabilitation and Replacement of Pipelines
The direction for the evaluation of existing pipelines for its required rehabilitation and replacement needs to be studied and recommended in the master plan.
In the existing distribution network, overaged pipes, harmful materials such as asbestos pipe, and unsuitable location of pipelines installed under buildings are reported through the interview with NCWSC. These problems on the existing pipes are evaluated in order to clarify the direction of improvement.
4) Preliminary cost estimates to complete the development of the distribution network
Based on the above, preliminary cost for the proposed development of the distribution network shall be estimated.
(3) Rainwater Collection Equipment for Buildings
The Urban Development Department of the Nairobi City County (NCC) is interested in introducing the equipment or instrument for the collection of rain water in urban development in order to use the water for non-drinking purposes such as gardening and washing cars.
While the quantification of its effect has not been carried out due to lack of sufficient information such as the number of buildings that have the instrument, its capacity, legal framework for enforcement to equip the instrument in urban development, and responsible organisation, the effects of the instrument have not been reflected in the projection of water demand.
The issue on law enforcement and organisation on NCC's recommendation need to be discussed in the department which is in charge of building development.
In relation to the issue, comprehensive development of recycled water in the sewerage system and rain water in the drainage system as alternative source of water will be discussed in the section on sewerage and drainage in Nairobi City.
(4) Priority Project Operated by AWSB
With regard to water supply for Nairobi City, many projects by AWSB are in progress to meet the demand for water. NCC needs to monitor its progress in order to update the comprehensive information on urban development for its provision to other sectors such as transportation, electricity, and telecommunications.
1) Development of the Spring Fields and the Northern Collector Phase I
In Nairobi City, the lack of water supply has been one of the most serious problems due to the drastic expansion of its population. The capacity of the water supply system is below the demand, which causes the development of private boreholes in Nairobi City.

The Project on Integrated Urban Development Master Plan for the City of Nairobi in the Republic of Kenya
Nippon Koei Co., Ltd. 8-11 Final Report IDCJ Inc. EJEC Inc.
The development of new water resources and water supply system is one of the main measurements to meet the demand. From the above situation, the project is considered a high priority.
2) Improvement of Operation on Leakage Detection, Repair and Water Tariff
One of the causes of water shortage in Nairobi City is UfW based on physical leakage, illegal connection, and malfunctioning/non-installation of water meter. Reinforcement of skillful organisation in terms of technical and administrative activity is one of the priority projects.
On the above issue, AWSB, in cooperation with NCWSC and financial aid of AFD, set some pilot areas in Nairobi City and has carried out a survey on the condition of pipelines, valves, and water meters as well as the performance on collecting water tariff.
The MWI and Kenya Water Institute supported by JICA have carried out the Technical Cooperation Project for the Project for Management of Non-revenue Water in Kenya. Some pilot areas in the satellite city of Nairobi City were set in the project and transferring of engineering skills on leak detection methods in the distribution network.
8.2 Stormwater Drainage and Sewerage
8.2.1 Demand and Gap Analysis
(1) Stormwater Drainage
1) Management of Rivers
In Nairobi City, stormwater is collected through both natural and man-made drainage systems and drained to the Nairobi River system comprising the Gitathuru, Rui Ruaka, Nairobi, and Ngong rivers and then discharged through the main stream of the Nairobi River.
The development and maintenance of these rivers should be regarded as a primary task for the management of stormwater drainage in Nairobi City. Each of these rivers should be maintained with a hydraulic capacity sufficient for discharging stormwater runoff concentrated from its catchment area. Within the catchment area of the river, the stormwater drainage systems draining the individual subcatchment areas should be designed in conformity with the hydraulic capacity of the river. In the meantime, the riparian reserves need to be delineated and secured to maintain better river environment.
The principal activities for the development and maintenance of these rivers are as follows:
(i) Longitudinal and cross section survey of the river,
(ii) Investigation of associated works (e.g., dikes, revetments, drainage outfalls, bridges, culverts, etc.),
(iii) Evaluation of stormwater runoff from catchment area and hydraulic capacity of the river,
(iv) Identification of river stretches to be developed and/or maintenance requirements,
(v) Plan, design, and implementation of river training works,
(vi) Maintenance of river and associated works, and
(vii) Monitoring and feedbacks.

The Project on Integrated Urban Development Master Plan for the City of Nairobi in the Republic of Kenya
Nippon Koei Co., Ltd. 8-12 Final Report IDCJ Inc. EJEC Inc.
Within the catchment area of each river, stormwater drainage systems draining the subcatchment areas should be designed in conformity with the hydraulic capacity of the river.
The regional office of WRMA is responsible for the abovementioned activities, but the status of the activities is not clearly identified as there is no sharing of information or coordination with the City Engineering Department of NCC regarding such activities in Nairobi City.
2) Management of Drains and Sewers
The stormwater drainage system comprises a network of canalised trunk drains, ditches, and storm sewers for draining a subdivided catchment area. The City Engineering Department is responsible for checking the design of the stormwater drainage system and/or elements in the appraisal of construction works. Moreover, it is also responsible for carrying out the maintenance of the stormwater drainage systems constructed by the public sector.
These activities of the City Engineering Department, however, are not functioning satisfactory due to the following situations that are attributable to the essential problems on stormwater drainage in Nairobi City as previously described in Subsection 4.2.5:
(i) Most of the technical data (master plan, project documents, as-built drawings, etc.) for the existing stormwater drainage systems were lost in a fire which engulfed the city hall in 2004. The loss of technical data makes it hard for the City Engineering Department to carry out proper maintenance of the existing stormwater drainage systems;
(ii) The appraisal of construction works including stormwater drainage by the City Engineering Department is difficult, as the report on the master plan for stormwater drainage in 1998 was misplaced and often neglected; and
(iii) The development of stormwater drainage in Nairobi City is envisaged by the government under the ongoing projects; the Kenya Municipal Programme (KMP) and Nairobi Metropolitan Services Improvement Project (NaMSIP) financed by WB. But the involvement of the City Engineering Department in the projects is limited and details of the projects (project descriptions, schedule, current progress, etc.) are not available in their department.
3) Major Issues
At present, the development of stormwater drainage in Nairobi City is likely to focus on the localised drainage network consisting of canalised trunk drains, ditches, and storm sewers in the urban areas individually. Due to the manner of development, in the future, it is anticipated that an integrated stormwater runoff drained from the localised drainage networks developed and extended toward the future would be excessive and inconsistent with the hydraulic capacity of the river. Therefore, the stormwater drainage should be developed by integrating the river and localised drainage networks as a system.

The Project on Integrated Urban Development Master Plan for the City of Nairobi in the Republic of Kenya
Nippon Koei Co., Ltd. 8-13 Final Report IDCJ Inc. EJEC Inc.
Nairobi River and Tributaries Localised Drainage Network in CBD
Nairobi River
Ruiruak River
CBD
SewerSewer (Planned)
DrainDrain (Planned)
Source: JICA Study Team (JST) Source: NCWSC
Figure 8.2.1 River and Localised Drainage Network
The City Engineering Department should restore its functions to manage the stormwater drainage systems in Nairobi City. The principal needs are the following: (i) collection, review, and update of technical data for the maintenance of the existing stormwater drainage systems, (ii) involvement in the development of the stormwater drainage under KMP and NaMSIP, and (iii) development of capability for the appraisal of construction works including stormwater drainage and maintenance of the existing stormwater drainage systems.
(2) Sewerage
1) Estimates of the Required Sewerage Treatment Capacity
i) Population
The Final Feasibility Study Report of the Nairobi Rivers Rehabilitation and Restoration Program: Sewerage Improvement Project (NaRSIP) indicates that the population in Nairobi City is projected to be 6.35 million by year 2030. This estimate is lower than the 5.21 million projected by Nairobi Integrated Urban Development Master Plan (NIUPLAN).
The Final Feasibility Study Report of NaRSIP used 3.8% for 2011-2020 and 3.0% for 2021-2030, while NIUPLAN applies a population growth rate of 2.4%/year for the period of 2009-2030.
0
1,000,000
2,000,000
3,000,000
4,000,000
5,000,000
6,000,000
7,000,000
2005 2010 2015 2020 2025 2030 2035
Popu
latio
n
Year
Final F/S Report, AWSB (2010)
NIUPLAN, JICA (2013)
Source: JICA Study Team (JST)
Figure 8.2.2 Comparison of Population Projections
Table 8.2.1 Comparison of Population Projections Final F/S Report Year 2010 2015 2020 2025 2030AWSB (2010) Population 3,251,219 3,917,716 4,720,845 5,472,753 6,352,396NIUPLAN Year 2009 2013 2018 2023 2030JICA (2013) Population 3,138,372 3,601,351 4,174,952 4,677,677 5,212,500Source: JICA Study Team (JST)

The Project on Integrated Urban Development Master Plan for the City of Nairobi in the Republic of Kenya
Nippon Koei Co., Ltd. 8-14 Final Report IDCJ Inc. EJEC Inc.
ii) Water Demand
The Final Feasibility Study Report of NaRSIP estimated that the water demand in Nairobi City excluding UfW would increase up to 914,812 m3/day by year 2030.
The water demand projection by NIUPLAN is discussed in Subsection 4.4 previous to this chapter. The water demand in year 2030 is projected to be 719,000 m3/day excluding UfW.
0
200,000
400,000
600,000
800,000
1,000,000
2005 2010 2015 2020 2025 2030 2035
Wat
er D
eman
d (m
3 /day
)
Year
Final F/S Report, AWSB (2010)
NIUPLAN, JICA (2013)
Source: JICA Study Team (JST)
Figure 8.2.3 Comparison of Water Demand Projections
Table 8.2.2 Comparison of Water Demand Projections Unit: m3/day
Final F/S Report Year 2010 2015 2020 2025 2030AWSB (2010) Demand 366,418 474,199 603,493 719,529 914,812NIUPLAN Year 2009 2013 2018 2023 2030JICA (2013) Demand 414,000 479,000 568,000 641,000 719,000Source: JICA Study Team (JST)
iii) Sewerage Generation
For the purpose of sewerage development planning, AWSB assumes that sewerage generation would be 80% of water demand. Accordingly, the Final Feasibility Study Report of NaRSIP estimated that the sewerage generation in Nairobi City would be 731,850 m3/day in year 2030.
NIUPLAN estimates the sewerage generation in the same manner as above. The estimated sewerage generation is 575,200 m3/day in year 2030.
0
200,000
400,000
600,000
800,000
2005 2010 2015 2020 2025 2030 2035
Sew
erag
e Gen
erat
ion
(m3 /d
ay)
Year
Final F/S Report, AWSB (2010)
NIUPLAN, JICA (2013)
Source: JICA Study Team (JST)
Figure 8.2.4 Comparison of Sewerage Generation Estimates
Table 8.2.3 Comparison of Sewerage Generation Estimates Unit: m3/day
Final F/S Report Year 2010 2015 2020 2025 2030 AWSB (2010) Sewerage 293,134 379,359 482,794 575,623 731,850NIUPLAN Year 2009 2013 2018 2023 2030JICA (2013) Sewerage 331,200 383,200 454,400 512,800 575,200Source: JICA Study Team (JST)

The Project on Integrated Urban Development Master Plan for the City of Nairobi in the Republic of Kenya
Nippon Koei Co., Ltd. 8-15 Final Report IDCJ Inc. EJEC Inc.
iv) Required Sewerage Treatment Capacity
In the Final Feasibility Study Report of NaRSIP, a service coverage rate of the existing sewerage system was estimated at 40% in year 2010 and assumed to increase up to 75% by year 2030. The required sewerage treatment capacity in year 2030 was estimated at 548,887 m3/day accordingly.
NIUPLAN estimates the required sewerage treatment capacity in the same manner as above. The estimated sewerage generation is 431,400 m3/day in year 2030.
0
100,000
200,000
300,000
400,000
500,000
600,000
2005 2010 2015 2020 2025 2030 2035
Req
uire
d Se
wer
age T
reat
men
t (m
3 /day
)
Year
Final F/S Report, AWSB (2010)
NIUPLAN, JICA (2013)
Source: JICA Study Team (JST)
Figure 8.2.5 Comparison of Required Sewerage Treatment Capacity Estimates
Table 8.2.4 Comparison of Required Sewerage Treatment Estimates Final F/S Report Year 2010 2015 2020 2025 2030 AWSB (2010) Coverage 40% 56% 60% 70% 75% Treatment 117,254 212,441 289,677 402,936 548,887NIUPLAN Year 2009 2013 2018 2023 2030JICA (2013) Coverage 37% 50% 58% 66% 75% Treatment 121,882 190,067 265,370 338,448 431,400Source: JICA Study Team (JST)
v) Summary
The estimates of required sewerage treatment capacity in year 2030 are summarised below. Based on the socioeconomic framework prepared by NIUPLAN, results showed that the required sewerage treatment capacity is lower in comparison with the Final Feasibility Study Report of NaRSIP.
Table 8.2.5 Summary of Estimated Required Sewerage Treatment Capacity (2030)
Planning IndicatorsNaRSIP
AWSB (2010)NIUPLAN
JICA (2013)Remarks
(i) Population 6,352,396 5,212,500
(ii) Water Demand, m3/day 914,812 719,000 Excluding UFW
(iii) Sewerage Generation, m3/day 731,850 575,200 80% of (ii)
(iv) Required Sewerage Treatment Capacity, m3/day 548,887 431,400 75% of (iii)
Source: JICA Study Team (JST)
2) Development of Sewerage Treatment Works
The Final Feasibility Study Report of NaRSIP describes the development of sewerage treatment works (STWs) toward year 2030. The total capacity of STWs is planned to be incremented from 131,000 m3/day in 2010 to 572,000 m3/day utilising the extension of the Dandora Estate STW (DESTW) and rehabilitation of the Kariobangi STW. The planned development of sewerage treatment capacity by 2030 is enough to meet the required sewerage treatment capacity of 431,400 m3/day estimated by NIUPLAN.

The Project on Integrated Urban Development Master Plan for the City of Nairobi in the Republic of Kenya
Nippon Koei Co., Ltd. 8-16 Final Report IDCJ Inc. EJEC Inc.
Of the planned development of STWs, the improvement of DESTW Phase I and II was completed by the Water and Sanitation Service Improvement Project (WaSSIP). The NaRSIP includes the rehabilitation of Kariobangi STW and part of the development of DESTW Phase III.
0
100,000
200,000
300,000
400,000
500,000
600,000
2005 2010 2015 2020 2025 2030 2035
Sew
erag
e Tre
atm
ent C
apac
ity (m
3 /day
)
Year
DESTW Phase IIExtension D120,000 m3/day
DESTW Phase IIExtension A, B & C120,000 m3/day
DESTW Phase IIIExtension60,000 m3/day
DESTW Phase III100,000 m3/day
KariobangiSTWRehabilitation21,000 m3/day
DESTW Phase I & IIImprovement20,000 m3/day
Proposed Sewerage DevelopmentNaRSIP, AWSB (2010)
NaRSIP, AWSB (2010)
NIUPLAN, JICA (2013)
431,400
572,000
131,000
Source: JICA Study Team (JST)
Figure 8.2.6 Development of Sewerage Treatment Works
Nairobi River
Kamiti River
Gatharani River
Existing DESTWPhase I & II140,000 m3/day
DESTW Phase IIExtension A, B & C120,000 m3/day (2025)
DESTW Phase II Extension D120,000 m3/day (2030)
DESTW Phase III100,000 m3/day (2014)
DESTW Phase III Extension 60,000 m3/day (2020)
Source: Nairobi City Water and Sewerage Company Limited (NCWSC)
Figure 8.2.7 Planned Development of the Dandora Estate STW
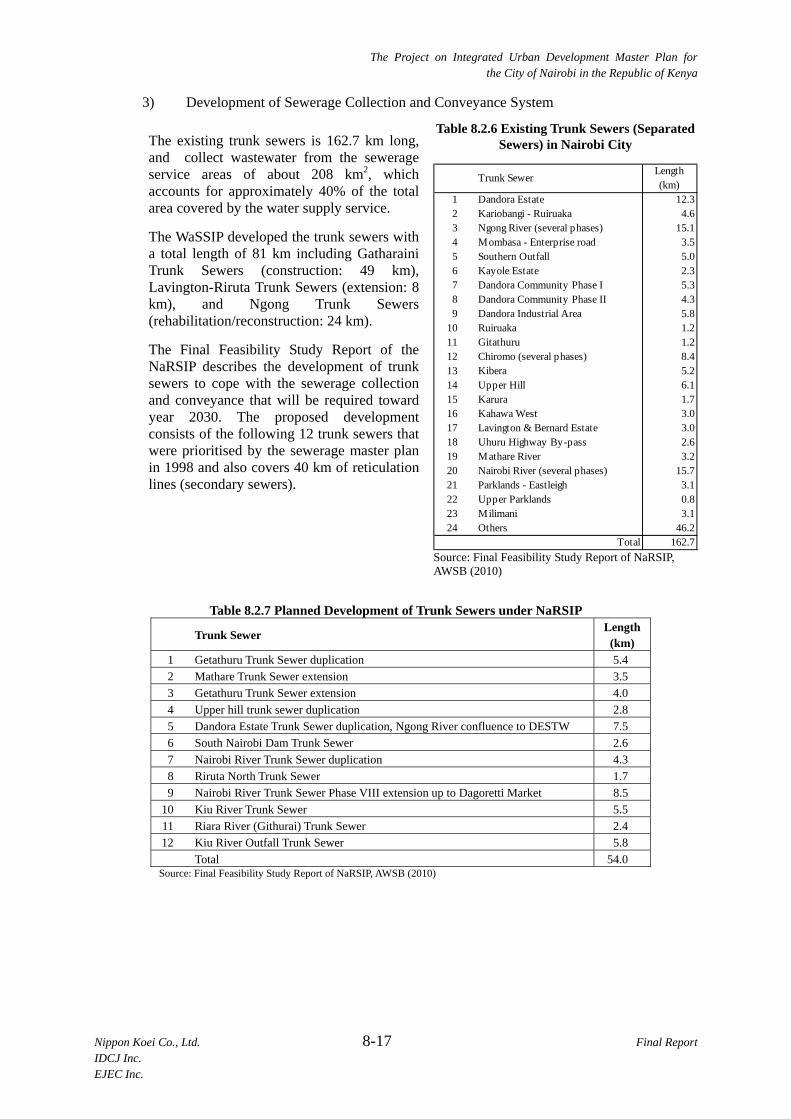
The Project on Integrated Urban Development Master Plan for the City of Nairobi in the Republic of Kenya
Nippon Koei Co., Ltd. 8-17 Final Report IDCJ Inc. EJEC Inc.
3) Development of Sewerage Collection and Conveyance System
The existing trunk sewers is 162.7 km long, and collect wastewater from the sewerage service areas of about 208 km2, which accounts for approximately 40% of the total area covered by the water supply service.
The WaSSIP developed the trunk sewers with a total length of 81 km including Gatharaini Trunk Sewers (construction: 49 km), Lavington-Riruta Trunk Sewers (extension: 8 km), and Ngong Trunk Sewers (rehabilitation/reconstruction: 24 km).
The Final Feasibility Study Report of the NaRSIP describes the development of trunk sewers to cope with the sewerage collection and conveyance that will be required toward year 2030. The proposed development consists of the following 12 trunk sewers that were prioritised by the sewerage master plan in 1998 and also covers 40 km of reticulation lines (secondary sewers).
Table 8.2.6 Existing Trunk Sewers (Separated Sewers) in Nairobi City
Trunk SewerLength(km)
1 Dandora Estate 12.32 Kariobangi - Ruiruaka 4.63 Ngong River (several phases) 15.14 Mombasa - Enterprise road 3.55 Southern Outfall 5.06 Kayole Estate 2.37 Dandora Community Phase I 5.38 Dandora Community Phase II 4.39 Dandora Industrial Area 5.8
10 Ruiruaka 1.211 Gitathuru 1.212 Chiromo (several phases) 8.413 Kibera 5.214 Upper Hill 6.115 Karura 1.716 Kahawa West 3.017 Lavington & Bernard Estate 3.018 Uhuru Highway By-pass 2.619 Mathare River 3.220 Nairobi River (several phases) 15.721 Parklands - Eastleigh 3.122 Upper Parklands 0.823 Milimani 3.124 Others 46.2
Total 162.7
Source: Final Feasibility Study Report of NaRSIP, AWSB (2010)
Table 8.2.7 Planned Development of Trunk Sewers under NaRSIP
Trunk Sewer Length (km)
1 Getathuru Trunk Sewer duplication 5.4
2 Mathare Trunk Sewer extension 3.5
3 Getathuru Trunk Sewer extension 4.0
4 Upper hill trunk sewer duplication 2.8
5 Dandora Estate Trunk Sewer duplication, Ngong River confluence to DESTW 7.5
6 South Nairobi Dam Trunk Sewer 2.6
7 Nairobi River Trunk Sewer duplication 4.3
8 Riruta North Trunk Sewer 1.7
9 Nairobi River Trunk Sewer Phase VIII extension up to Dagoretti Market 8.5
10 Kiu River Trunk Sewer 5.5
11 Riara River (Githurai) Trunk Sewer 2.4
12 Kiu River Outfall Trunk Sewer 5.8
Total 54.0 Source: Final Feasibility Study Report of NaRSIP, AWSB (2010)

The Project on Integrated Urban Development Master Plan for the City of Nairobi in the Republic of Kenya
Nippon Koei Co., Ltd. 8-18 Final Report IDCJ Inc. EJEC Inc.
KariobangiSTW
Dandora EstateSTW
Existing STW
Existing STWRehabilitation by WaSSIP
Existing STWRehabilitation by NaRSIP
Extension of STW by NaRSIP
Extension of STW (Year 2030)
Sewarage Treatment Works (STW)
Existing TSRehabilitation / Reconstruction by WaSSIP
Existing TS
Existing TSRehabilitation by / Reconstruction by NaRSIP
Extension of TS by NaRSIP
Trunk Sewers (TS)
Extension of TS by WaSSIP
Source: Nairobi City Water and Sewerage Company Limited (NCWSC)
Figure 8.2.8 Existing and Planned Development of Trunk Sewers

The Project on Integrated Urban Development Master Plan for the City of Nairobi in the Republic of Kenya
Nippon Koei Co., Ltd. 8-19 Final Report IDCJ Inc. EJEC Inc.
4) Major Issues
i) Effluent Quality from Dandora Estate STW
The development of STWs is planned to cope with the estimated sewerage generation in year 2030. Early stages of the development have already been implemented and/or on-going under WaSSIP and NaRSIP.
Most of the sewerage generated within Nairobi City is planned to be conveyed to and treated in the Dandora Estate STW. In the early stage of the development of STWs, the rehabilitation of the Dandora Estate STW was implemented under WaSSIP. However, the water quality data of the effluent from STW (for the period of July-September 2011) indicates that the values of biological oxygen demand (BOD), chemical oxygen demand (COD), and total suspended solids (TSS) do not meet the effluent standards of Kenya even after the completion of the rehabilitation works. During NIUPLAN, NCWSC reported that the effluent quality still remains unimproved for the period of April-June 2013.
It is presumed that some trouble still remains in the Dandora Estate STW even after the rehabilitation by WaSSIP. The cause of low treatment efficiency at the Dandora Estate STW should be investigated in pursuit of countermeasures to improve the effluent quality in order to meet the effluent standards of Kenya. Consequently, feedbacks from the investigation should be taken into account for operation and maintenance (O&M) and further sewerage development.
ii) Sewerage Collection and Conveyance
The available data suggests that the total water distribution in Nairobi City is around 400,000 m3/day during the recent years. The billed water consumption was 295,597 m3/day as of 2010/2011. The sum of the recorded sewerage inflows to the Dandora Estate STW and Kariobangi STW in 2010 was 102,803 m3/day accounting for 35% of the billed water consumption. Assuming that the sewerage generation would be equivalent to the billed water consumption, the sewerage collection rate is approximately 35% (= 102,803 / 295,597).
(A)Water Distribution
(B)Billed WaterConsumption
(D)Sewerage
Discharged throughNetwork
(F)Sewerage Inflow
to STW
(B) x 70% (D) x 50%400,000 300,000 210,000 105,000
(G)Loss fromNetwork
(D) x 50%105,000
(C)UFW
100,000
SewerageCollected and
Conveyed to STW35%
(Unknown)
(E)Sewerage not Discharged
through Network
90,000(B) x 30%
SewerageDischarged toEnvironment
65%
Assumedequivalent to
SewerageGeneration
Source: Prepared by the JICA Study Team (JST) Figure 8.2.9 Estimate of Present Sewerage Generation,
Collection and Conveyance
The NCWSC has around 240,000 of the water supply service connections and 170,000 of the sewerage service connections as of 2013. In terms of service connections, the service coverage rate of the sewerage system is approximately 70% (= 170,000 / 240,000).
From the above figures, the following points are identified regarding the sewerage collection and conveyance:

The Project on Integrated Urban Development Master Plan for the City of Nairobi in the Republic of Kenya
Nippon Koei Co., Ltd. 8-20 Final Report IDCJ Inc. EJEC Inc.
(i) Volume of sewerage collected and conveyed to STWs accounts for 35% of the sewerage generation and the remaining 65% are discharged to the environment without treatment.
(ii) 70% of the sewerage generated is collected once by the sewerage network but half of the volume is lost from the sewerage network.
(iii) 30% of the sewerage generated is not collected by the sewerage network and is discharged directly to the environment.
Assuming that the sewerage collection rate should be equivalent to the percentage of service coverage area as planned, the sewerage development will need to attain a sewerage collection rate of 75% by 2030. The sewerage collection rate should be improved with the rehabilitation and development of the sewerage network comprising trunk sewers, reticulation lines, and service connections accordingly. Effects of sewerage development (trunk sewers and reticulation lines) by WaSSIP and NaRSIP should be monitored continuously. And then feedbacks from the monitoring should be taken into account for O&M and further sewerage development.
8.2.2 Development Policy
The stormwater drainage in Nairobi City should be developed by integrating the river and localised drainage networks. Within the catchment area of the river, the development and maintenance of the river should be initially planned and implemented to ensure the required hydraulic capacity for the stormwater drainage as well as the riparian reserves in order to maintain better water environment. The localised drainage networks should be developed under these conditions given by the plan for the development and maintenance of the river.
The sewerage development is currently implemented to extend the capacity of treatment. Moreover, the sewerage system in Nairobi City needs to improve its performance in terms of effluent quality from STWs and sewerage collection/conveyance.
The comprehensive framework for water environment management in Nairobi City was elaborated by the former Nairobi River Basin Programme (NRBP) supported by the United Nations Environment Programme (UNEP) during the last decade. Under the said framework, the development of stormwater drainage and sewerage should be recognised as part of the subsequent activities being taken by the Nairobi Rivers Basin Rehabilitation and Restoration Programme. At present, the activities relevant to the water environment management in Nairobi City are taken by the initiatives of the government organisations in charge. For further enhancement of the activities, NCC should increase its involvements with such activities through its capacity development.
8.2.3 Priority Projects
(1) River Improvement Project
1) Objectives
The project aims at the following: (i) establishment of a river management master plan for integrating the river and localised drainage networks as a stormwater drainage system and; (ii) development of the river channels and riparian reserves to restore and maintain better water environment. The target areas are the river stretches and corresponding riparian areas of the Nairobi River and its major tributaries.

The Project on Integrated Urban Development Master Plan for the City of Nairobi in the Republic of Kenya
Nippon Koei Co., Ltd. 8-21 Final Report IDCJ Inc. EJEC Inc.
2) Descriptions
i) Phase-1: Preparation of the master plan and feasibility study,
(i) Longitudinal profile and cross section survey of river stretches,
(ii) Investigation of associated works (e.g., dikes, revetments, drainage outfalls, bridges, culverts, etc.) along the surveyed river stretches,
(iii) Estimates of stormwater runoff drained from catchment area to the river,
(iv) Analysis of hydraulic capacity required for each of the river stretches,
(v) Preparation of design discharge and water level for each of the river stretches,
(vi) Identification of the river stretches to be improved,
(vii) Delineation of riparian reserve to be secured,
(viii) Preliminary design of river training works, riparian reserves, and associated works including localised drainage networks,
(ix) Evaluation for justification of the works through cost-benefit analysis and social/environmental impact assessment, and
(x) Preparation of implementation plan for river training works, riparian reserves, and associated works including localised drainage networks.
ii) Phase-2: Detailed Design and Implementation
(i) Detailed surveys and investigations for the detailed design of the selected river stretches (e.g., topographic mapping, longitudinal profiles and cross sections, soils, utilities, associated works, resettlement requirements, etc.);
(ii) Detailed design of river training works, riparian reserves, and associated works including localised drainage networks;
(iii) Preparation of construction plan and cost estimates;
(iv) Preparation of O&M plan, environment management plan (EMP), and resettlement action plan (RAP);
(v) Preparation of tender documents;
(vi) Procurement; and
(vii) Implementation.
3) Implementation Arrangements
The regional office of WRMA will be the responsible organisation for implementing the project. Meanwhile, it is recommended that WRMA should focus on sharing the responsibility for the management of the rivers within Nairobi City to NCC in the future. Therefore, a project management unit (PMU) needs to be jointly organised by the representatives of WRMA and NCC.
The project will formulate the river management master plan for each of the Nairobi River and its major tributaries. The subsequent stormwater drainage developments in the individual subcatchment areas will need to be kept consistent with the river improvement master plan. Furthermore, the project will need to coordinate closely with the stormwater drainage master
The Project on Integrated Urban Development Master Plan for the City of Nairobi in the Republic of Kenya
Nippon Koei Co., Ltd. 8-22 Final Report IDCJ Inc. EJEC Inc.
plan that will be prepared under KMP for common understanding of the basic planning conditions amongst each other.
4) Outcomes/Benefits
The project will prepare a river management master plan to define clear guidelines for the systematic development of the stormwater drainage systems in different urban centres in Nairobi City. The development and maintenance of the river channels and riparian reserves will provide a basic framework to practice a series of activities for the betterment of the water environment.
(2) Sewerage Improvement Project
1) Objectives
The project aims at the following: (i) carrying out countermeasures to improve the effluent quality from the Dandora Estate STW to comply with the effluent standards of Kenya and; (ii) improving sewerage collection and conveyance through the sewerage network comprising trunk sewers, reticulation lines, and sewerage connections.
2) Descriptions
i) Phase-1: Preparation of Improvement Plan
(i) Monitoring and analysis of the sewerage treatment performance of the Dandora Estate STW to identify the needs for improvement;
(ii) Investigation and analysis of trunk sewers, reticulation lines, and sewerage connections to identify the needs for improvement;
(iii) Plan and design the improvements for the Dandora Estate STW;
(iv) Plan and design the improvements for trunk sewers, reticulation lines, and sewerage connections; and
(v) Preparation of the implementation plan including cost estimates and budgetary arrangement.
ii) Phase-2: Implementation
(vi) Implementation of the improvement for the Dandora Estate STW;
(vii) Implementation of the improvement for trunk sewers, reticulation lines, and sewerage connections;
(viii) Monitoring, review, and analysis of the sewerage treatment performance of the Dandora Estate STW;
(ix) Monitoring, review, and analysis of the sewerage collection and conveyance by the sewerage network comprising trunk sewers, reticulation lines, and sewerage connections; and
(x) Preparation of feedbacks for O&M and further sewerage development.
3) Implementation Arrangements
The AWSB will be the responsible organisation for implementing the project. Meanwhile, it is recommended that AWSB should focus on sharing the responsibility for managing the
The Project on Integrated Urban Development Master Plan for the City of Nairobi in the Republic of Kenya
Nippon Koei Co., Ltd. 8-23 Final Report IDCJ Inc. EJEC Inc.
sewerage system within Nairobi City to NCC in the future. Therefore, a PMU needs to be jointly organised with the representatives of AWSB and NCC. NCWSC as the operator of the sewerage system will also be essentially involved with the project management.
4) Outcomes/Benefits
The project will contribute to: (i) alleviating the water pollution in the Nairobi River and its tributaries through an increase in the sewerage collection and conveyance as well as improvement of the sewerage treatment performance to cope with the effluent standards of Kenya; and (ii) evolving further improvements of the sewerage system through feedbacks.
(3) Capacity Development Project for Water Environment Management
1) Objectives
The project consists of the following three components:
Component 1 – Water Environment Management, aims at supporting capacity development for NCC; (i) to establish an administrative framework for implementing the water environment management in Nairobi City; and (ii) to strengthen the administrative capability of the county departments to implement water environment management.
Component 2 – Storm Water Drainage Management, aims at supporting capacity development for the City Engineering Department; (i) to restore its administrative functions to maintain the stormwater drainage systems; (ii) to establish its administrative capability to manage the plan, design, and construction of stormwater drainage works within the catchment areas of the Nairobi River and its major tributaries in conformity with a river management master plan of the proposed river improvement project.
Component 3 – Sewerage Management, aims at supporting capacity development for the City Engineering Department; (i) to establish its administrative capability to manage the plan, design, construction, and O&M of the sewerage system; and (ii) to supervise NCWSC to carry out O&M of the sewerage system in order to ensure the improvements through the proposed Sewerage Improvement Project.
2) Descriptions
i) Component 1 – Water Environment Management
(i) Review of the actions to be taken by the county under the Nairobi Rivers Basin Rehabilitation and Restoration Programme and update the issues and approaches for implementing the water environment management in Nairobi City;
(ii) Study on the administrative system comprising the county’s departments to perform their roles for water environment management;
(iii) Practices for operating the administrative system, e.g., water quality monitoring, regulation of industrial effluent, riparian reserve conservation and utilisation, and information, education, and communication (IEC) for creating social understandings; and
(iv) Review of outcomes from the practices and feedbacks.

The Project on Integrated Urban Development Master Plan for the City of Nairobi in the Republic of Kenya
Nippon Koei Co., Ltd. 8-24 Final Report IDCJ Inc. EJEC Inc.
ii) Component 2 – Stormwater Drainage Management
(i) Collection, review, and update of technical data (master plan, project documents, as-built drawings, etc.) for the maintenance of the existing stormwater drainage systems;
(ii) City Engineering Department to practice the maintenance of the existing stormwater drainage systems in the systematic approaches based on the technical data;
(iii) Organisational reform for the City Engineering Department to take the responsibility for managing the Nairobi River and its major tributaries and associated stormwater drainage systems in the individual subcatchment areas;
(iv) City Engineering Department to be involved in the proposed river improvement project to prepare the river management master plan for integrating the river and localised drainage networks and securing the riparian reserves; and
(v) Review, update, and application of design standards and specifications for the stormwater drainage works through O&M practices and feedbacks.
iii) Component 3 – Sewerage Management
(i) Organisational reform for the City Engineering Department to take the responsibility for the administrative management of plan, design, construction, and O&M of the sewerage system in Nairobi City;
(ii) City Engineering Department to be involved in the proposed sewerage improvement project to improve the performance of the sewerage system;
(iii) City Engineering Department to supervise NCWSC to practice O&M methods applied resulting from the sewerage improvement project and feedbacks; and
(iv) Review, update, and application of design standards and specifications for the sewerage works through O&M practices and feedbacks.
3) Implementation Arrangements
The NCC will be the responsible organisation for implementing the project with the support from relevant organisations including Ministry of Environment and Mineral Resources (MEMR), National Environmental Management Authority (NEMA), WRMA, Road Authorities, AWSB, and NCWSC. Because the project will include technical, organisational, and institutional subjects to be coordinated with different organisations, the council will need to organise a project coordination committee with the representatives of the council and relevant organisations.
In preparing the project, further details on stakeholder coordination should be discussed in conformity with the comprehensive framework for water environment management under the Nairobi Rivers Rehabilitation and Restoration Programme.
4) Outcomes/Benefits
The administrative system for water environment management will be clearly defined and activated under the responsibility of NCC. The council’s departments will be able to activate their respective roles for the betterment of the water environment as envisaged by the Nairobi Rivers Rehabilitation and Restoration Programme. The City Engineering Department will be able to take the initiatives in managing the stormwater drainage and sewerage in Nairobi City through its involvement in the proposed projects.

The Project on Integrated Urban Development Master Plan for the City of Nairobi in the Republic of Kenya
Nippon Koei Co., Ltd. 8-25 Final Report IDCJ Inc. EJEC Inc.
8.3 Power Supply
8.3.1 Demand and Gap Analysis
(1) Power Demand Forecast
The existing power demand forecast described in Section 4.1.7 is based on the Updated Least Cost Power Development Plan Study Period: 2011-2031 (LCPDP). JST reviewed the GDP growth rate and the future population, and reviewed the demand forecast using the GDP growth rate and future population projected by NIUPLAN in order to study appropriate demand forecast. The demand forecast by NIUPLAN will be called the project demand forecast (PDF).
The PDF will follow the method of projection by LCPDP. According to the structure of LCPDP, first of all, the power demand forecast of Kenya will be calculated. Secondly, the power demand forecast of NCC will be examined. The sequence in calculating PDF is as follows:
(i) Calculate the rate of power demand at 7% GDP growth rate each year from the power demand at 8% GDP growth rate (low scenario), 9% (reference scenario), and 10% (high scenario) in LCPDP,
(ii) Calculate the power demand of Kenya by 2030 from the demand of Kenya at the first year and the rate of power demand calculated above,
(iii) Estimate the rate of population number of the PDF in Kenya to LCPDP, (iv) Calculate the PDF of Kenya from the ratio of (iii) and power demand of (ii), (v) Calculate the proportion of power demand of NCC to Kenya in order to seek the PDF of
NCC, and (vi) Grasp the PDF of NCC from the proportion calculated in (v) and the PDF of Kenya
calculated in (iv).
The following description evaluates the concrete value of the PDF of Kenya and of NCC:
1) Power Demand Forecast for Kenya
The PDF of LCPDP has three scenarios, namely, high scenario, reference scenario, and low scenario. The difference of the three scenarios is due to the difference of the GDP growth rate. For example, high scenario is 10% as the GDP growth rate in 2030. This is because Kenya Vision 2030 assumes the GDP growth rate at 10% by 2030 and high scenario adopts the GDP growth rate of Kenya Vision 2030. Reference scenario’s and low scenario’s GDP growth rate are 9% and 8%, respectively, based on high scenario. On the other hand, NIUPLAN sets GDP growth rate at 7% as discussed in Section 6.3.3, therefore, PDF adopts 7% as GDP growth rate.
Regarding population, the existing demand forecast assumes that the population will increase to 60.5 million by 2030 in reference to the Kenya Vision 2030 and all scenarios assume this population. While the project sets the future population as 65.6 million as discussed in Section 6.1.1, PDF assumes the population to be 65.6 million by 2030.
Table 8.3.1 and Figure 8.3.1 show the PDF by 2030 with using the GDP growth rate and the future population forecast assumed by JST. From the figure, it is confirmed that PDF is always the lowest in the scenarios. The table also shows 9,343 MW as the value of PDF in 2030 is less than 70% of 15,026 MW as the reference scenario’s value.
The result is due to following reasons: Regarding the assumption of future population, the values of NIUPLAN forecast are larger than the LCPDP forecast. The proportion of the population in the Project forecast to LCPDP forecast is 8.4% larger. This result brings PDF to a higher figure. However, regarding the assumption of GDP growth rate, the Project forecast is the lowest in all scenarios. The proportion of GDP growth rate in the Project forecast (7%) to

The Project on Integrated Urban Development Master Plan for the City of Nairobi in the Republic of Kenya
Nippon Koei Co., Ltd. 8-26 Final Report IDCJ Inc. EJEC Inc.
low scenario (8%) is 12.5% lower. This result effectively brings PDF to a lower figure. Therefore, even the assumption of future population of the Project forecast is higher than the LCPDP forecast, PDF becomes lower because of the low rate of GDP growth.
Table 8.3.1 Demand Forecast of Kenya by 2030
YEAR Project Demand
Forecast Low Scenario Reference Scenario High Scenario
MW 2010 1,227 1,227 1,227 1,227 2015 2,292 2,398 2,511 2,760 2020 3,800 4,220 4,755 5,703 2025 6,069 7,050 8,528 10,778 2030 9,343 11,510 15,026 20,156
Source: JICA Study Team (JST)
0
5,000
10,000
15,000
20,000
25,000
2005 2010 2015 2020 2025 2030 2035
Peak Load
(MW)
Year
High Scenario
Reference Scenario
Low Scenario
The project Demand Forecast
Source: JICA Study Team (JST)
Figure 8.3.1 Demand Forecast of Kenya by 2030
2) Demand Forecast of NCC
The LCPDP also forecasts the power demand of NCC as indicated in Table 8.3.2. The table shows the demand forecast of NCC and Kenya. However, the numbers of Kenya in the table below is different from the previous numbers of Kenya shown in Table 8.3.1. This is because the approach to the demands is different. The previous data is calculated based on a model simulation but the latter data is based on the section of the transmission line network project in LCPDP. Yet the power demand of NCC is described only in the latter data, therefore, the latter data will be used as the existing power demand of NCC.

The Project on Integrated Urban Development Master Plan for the City of Nairobi in the Republic of Kenya
Nippon Koei Co., Ltd. 8-27 Final Report IDCJ Inc. EJEC Inc.
Table 8.3.2 Existing Demand Forecast of LCPDP Region Year 2015 2020 2025 2030 Nairobi
(MW) 1,241 2,214 3,726 5,996
Kenya 2,386 4,519 8,102 14,273 Demand Ratio of Nairobi to Kenya
52% 49% 46% 42%
Source: LCPDP
In order to calculate the PDF of Nairobi City, first of all, the ratio of NCC demand to Kenya demand as existing data will be calculated. Table 8.3.3 below describes the demand forecast ratio of NCC to Kenya, so the PDF adopts the ratio in the table. From the table, it is confirmed that the ratio is decreasing as time advances. This is because LCPDP assumes lower demand growth of NCC compared with other regions in the longer term.
As already discussed, the PDF of Kenya has been assumed. Therefore, it is possible to calculate the PDF of NCC by utilising the PDF of Kenya and the ratio of NCC demand to Kenya demand. As a result of calculation, the PDF of NCC is shown in Table 8.3.3 and Figure 8.3.2.
Table 8.3.3 shows the PDF of Nairobi City and Kenya. As a result, the PDF assumes approximately 4,000 MW of demand in Nairobi City by 2030. The maximum demand of Nairobi City in 2011/12 was 662 MW, so the demand in 2030 is expected to increase six times as compared with the demand in 2011/12.
Table 8.3.3 Project Demand Forecast of NCC and Kenya Region Year 2015 2020 2025 2030
Nairobi City (MW)
1,192 1,862 2,791 3,925 Kenya 2,292 3,800 6,069 9,343
Source: JICA Study Team (JST)
Moreover, the following chart describes the demand forecast of NCC. One is the existing data from LCPDP and the other is from the Project forecast. From the chart, PDF is lower than the LCPDP forecast at any time. The Project forecast of NCC is assumed to be two-thirds of the LCPDP forecast by 2030.
0
1,000
2,000
3,000
4,000
5,000
6,000
7,000
2015 2020 2025 2030
Peak load
(MW)
Year
LCPDP forecast
The project demand forecast
Source: JICA Study Team (JST)
Figure 8.3.2 Demand Forecast of NCC Compared with the Project and LCPDP
According to the above consideration, the PDF of NCC and Kenya is assumed to be less than the current power sector forecast. The demand of NCC in 2030 is estimated to be 4,000 MW

The Project on Integrated Urban Development Master Plan for the City of Nairobi in the Republic of Kenya
Nippon Koei Co., Ltd. 8-28 Final Report IDCJ Inc. EJEC Inc.
and the number equals to two-thirds of the LCPDP forecast. The main reason for this is that the GDP growth rate of the Project is lower than the LCPDP assumption.
By the way, NCC and the infrastructure sectors hope for the realisation of electric trains. Although some trains are running as commuter train, the trains in NCC are operated using diesel locomotives. In addition, the priority project of railway does not consider adopting the electric railroad system in the immediate future. Diesel locomotives do not consume electricity, so there is no need to consider the electric requirement for railway at the current situation.
Moreover, at present, the new building is supposed to have solar water heating system under certain conditions due to the Energy Act published in 2012. This is one of the provisions to suppress electricity demand. Like this example, if regulations to restrain electricity demand become effective, it will contribute to the taming of the sharp increase in electricity demand.
The recommendation to the power sector, therefore, is to review the demand projection with the setting of the GDP growth rate and future population forecast. It may be important to ensure adequate power equipment, but excess forecast may lead to excess construction of power equipment, which would result to the increase in electricity cost.
(2) Development of Land around the Dandora Railway Station
The JST proposes the Dandora Railway Station area to be one of sub-centres to supplement the present central business district (CBD). Figure 8.3.3 below shows the land around the Dandora Station with some pictures of the site. The orange lines show the roads and the yellow belts show the power line areas. From this figure, the power lines occupy quite sizable areas. Picture No. 1 and No. 2 show 132 kV transmission lines and picture no. 3 shows five 66 kV transmission lines and one 11 kV distribution line. This area is the sub-centre for NIUPLAN, so the land of power line needs to be effectively utilised. Regarding the problem on land use, the following two measures are considered: 1) reviewing regulations, and 2) laying underground.
Source: JICA Study Team (JST)
Figure 8.3.3 Land around the Dandora Railway Station
① ②
③
①
②
③

The Project on Integrated Urban Development Master Plan for the City of Nairobi in the Republic of Kenya
Nippon Koei Co., Ltd. 8-29 Final Report IDCJ Inc. EJEC Inc.
1) Reviewing Regulation
Reviewing the regulation concerning transmission lines could be one of the solutions for using land effectively. Figure 8.3.3 shows the pictures of the 132 kV transmission line shown as No. 1 and No. 2. From these pictures, the ample vacant land is spread around the transmission line. Therefore, if the regulation changes, it may be possible to use the land for buildings or houses. Concerning regulation, the contention is divided into two points, i.e., wayleaves and minimum clearance.
First, consideration of the regulation focuses on the wayleaves. Wayleaves are defined by Kenya Power as follows:
Source: Design Standards and Guidelines (Kenya Power and Lighting Company)
Figure 8.3.4 Definition of Wayleaves
It seems that the range of wayleaves in Kenya are too large. Figure 8.3.5 shows the comparative chart of Kenya and Japan, showing the range of wayleaves from 11 kV to 220 kV. Apparently, in all the ranges, the wayleaves of Kenya are higher than that of Japan. In more detail, 11 kV and 33 kV of a range of wayleaves is of the same distance as 10 m. However, a range of wayleaves that is more than 33 kV increases as the voltage increases and finally, a range is 40 m at 220 kV. On the other hand, Japan’s regulation reaches 30 m at 220 kV. Particularly, the difference of Kenya and Japan at 132 kV is as large as 20 m, so it can be said that a range of wayleaves in Kenya is wide, and may need to be reviewed.
0
10
20
30
40
11 33 66 132 220
A range
of wayleaves (m
)
Voltage (kV)
Kenya
Japan
Source: JICA Study Team (JST) based on the following documents: Wayleaves trace for power lines (Kenya Power), Kenya Electricity Expansion Project (EASP)-KPLC Distribution Component (Kenya Power), The Survey on the Transition from Overhead Line to Underground Cable 2010 (Geo-space Engineering Center).
Figure 8.3.5 Comparison of Wayleaves between Kenya and Japan
The second point is the minimum clearance. Minimum clearance is the distance from the overhead lines to buildings, trees, and vegetation. Especially, the side clearance from the overhead lines to buildings is discussed here. The comparison of minimum side clearance is

The Project on Integrated Urban Development Master Plan for the City of Nairobi in the Republic of Kenya
Nippon Koei Co., Ltd. 8-30 Final Report IDCJ Inc. EJEC Inc.
shown in Figure 8.3.6 below. The side clearance of 66 kV or less in Kenya is almost the same as that of other countries, yet the requirement in Kenya over 66 kV is much higher than that of other countries. As a result, minimum clearance over 132 kV of Kenya might also be large.
0
2
4
6
8
10
12
14
16
18
20
11 33 66 132 220
Side Clearance (m)
Voltage (kV)
Kenya
Japan
USA
Canada
France
Germany
Source: JICA Study Team (JST) based on the following documents: Design Standards and Guidelines (Kenya Power) Wayleaves Trace for Power Lines (Kenya Power), Clearance of Transmission Line over 170 kV
(Japan Electrotechnical Standards and Codes Committee) * Side clearance of Kenya 132 kV and over is the distance from center of wayleaves, while the
others assume the distance from the edge of wires. * Side clearance of Kenya 132 kV and over is based on “Wayleaves Trace for Power Lines” as a
result of hearing from an official of Kenya Power. Figure 8.3.6 Comparison of Side Clearance
According to these examinations, there might be opportunities to review the regulations concerning transmission lines, which could lead to increase of usable lands along the transmission lines. This could be advantageous for NCC as well as for Kenya Power. Therefore, it is recommended to review regulations.
2) Developing Underground Cable
Another method for effective use of land along the transmission lines is to adopt underground cables. By laying cables underground, overhead lines can be removed and the land after removal can be used for other purposes such as commercial facilities or for industry area.

The Project on Integrated Urban Development Master Plan for the City of Nairobi in the Republic of Kenya
Nippon Koei Co., Ltd. 8-31 Final Report IDCJ Inc. EJEC Inc.
Table 8.3.4 Features of Underground Cable Direct Buried System Duct System Common Duct
Low cost High cost Very high cost Disadvantageous for addition
and removal of cables Possible for addition and removal of
cables Advantageous for many cables
Disadvantageous for maintenance Advantageous for maintenance Advantageous especially for maintenance
Source: Transmission and Distribution Engineering (Denki-gakkai)
The underground cable is divided into three types, namely, direct buried system, duct system, and common duct system. The features of the underground cables are shown in Table 8.3.4 above. Direct buried system is common in Kenya, as it can be constructed at a low cost. However, additional cables and maintenance for cables are troublesome, posing a disadvantage. Furthermore, it may incur high cost for the duct system but additional cables and maintenance are easier than direct buried system. The common duct is the most expensive method, but the system can offer easy maintenance and easy addition of cables. Moreover, the common duct system is shared by some other sectors such as the telecommunications sector and road sector. Consequently, even the cables for street lighting or communication cables can be kept in the same duct.
According to an official of Kenya Power, the area which is shown in picture No. 3 along Kangundo Road in Figure 8.3.3 seems to have a plan to install more overhead lines in the future. Under such circumstances, the duct system or common duct is suitable for the area because these two ways have the opportunities to install additional cables after construction.
(3) Information Sharing of Map
In the Technical Working Group (TWG), NCC requested for the geographic information system (GIS) data from the power sector because NCC needed the information on the location of the power equipment in order to make the land use plan. On the other hand, Kenya Power also wants to obtain other sector’s mapping data because underground cables are related to the facilities of other sectors such as telecommunications, water, drainage, and gas. From the TWG discussions, it was noted that
Power cable (Power company)
Telecommunication cable (Telecommunication Company)
66kV
154kV
Cable
Maintenance hatch
Cable
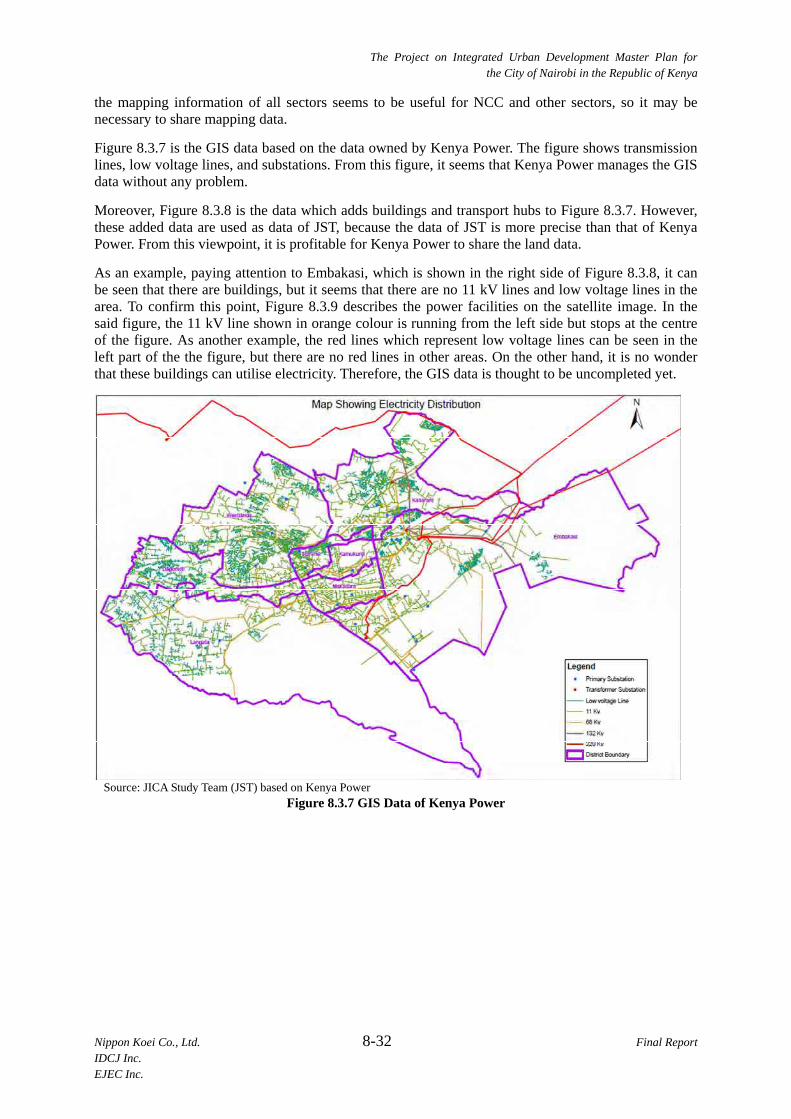
The Project on Integrated Urban Development Master Plan for the City of Nairobi in the Republic of Kenya
Nippon Koei Co., Ltd. 8-32 Final Report IDCJ Inc. EJEC Inc.
the mapping information of all sectors seems to be useful for NCC and other sectors, so it may be necessary to share mapping data.
Figure 8.3.7 is the GIS data based on the data owned by Kenya Power. The figure shows transmission lines, low voltage lines, and substations. From this figure, it seems that Kenya Power manages the GIS data without any problem.
Moreover, Figure 8.3.8 is the data which adds buildings and transport hubs to Figure 8.3.7. However, these added data are used as data of JST, because the data of JST is more precise than that of Kenya Power. From this viewpoint, it is profitable for Kenya Power to share the land data.
As an example, paying attention to Embakasi, which is shown in the right side of Figure 8.3.8, it can be seen that there are buildings, but it seems that there are no 11 kV lines and low voltage lines in the area. To confirm this point, Figure 8.3.9 describes the power facilities on the satellite image. In the said figure, the 11 kV line shown in orange colour is running from the left side but stops at the centre of the figure. As another example, the red lines which represent low voltage lines can be seen in the left part of the the figure, but there are no red lines in other areas. On the other hand, it is no wonder that these buildings can utilise electricity. Therefore, the GIS data is thought to be uncompleted yet.
Source: JICA Study Team (JST) based on Kenya Power
Figure 8.3.7 GIS Data of Kenya Power

The Project on Integrated Urban Development Master Plan for the City of Nairobi in the Republic of Kenya
Nippon Koei Co., Ltd. 8-33 Final Report IDCJ Inc. EJEC Inc.
Source: JICA Study Team (JST)
Figure 8.3.8 Combination of GIS Data of Kenya Power and JST
Source: JICA Study Team (JST)
Figure 8.3.9 Data of Power Facilities in Embakasi
From this, it is required to forward the GIS data to Kenya Power. According to an official of Kenya Power, progress has been seen in the current GIS data, and continuous updating work is expected. Besides, the current GIS data has no underground information, so the information is recommended to be added to GIS.

The Project on Integrated Urban Development Master Plan for the City of Nairobi in the Republic of Kenya
Nippon Koei Co., Ltd. 8-34 Final Report IDCJ Inc. EJEC Inc.
(4) Gas Distribution for Buildings
Liquefied petroleum gas (LPG) which is a product of fractional distillation of crude oil has wide and increasing domestic and commercial use in Nairobi City. Various oil companies have facilities where they fill the LPG into gas cylinders of 6 kg, 13 kg, 25 kg, and 50 kg which are sold to consumers.
In Kenya, there are no gas pipelines for distributing gas to household and commercial premises. When gas is exhausted in the cylinders, the consumers exchange the empty cylinders with filled ones at a cost. Even though consumers do not bring cylinders to a facility for filling gas, a person from the oil company comes to the consumer’s house or shop and exchange empty cylinders with full cylinders. The average cost for refilling 6 kg and 13 kg cylinders is KSh1,200 and KSh2,500, respectively. The various oil companies have different retail names for their LPG products like TotalGaz, K Gas, Hashi Gas.
Taking into account this condition, NCC and the infrastructure sectors discussed the problem and hoped to realise the construction of distribution pipelines to eliminate use of gas cylinders. In Kenya there are more than ten oil companies that sell LPG to customers, and it does not seem easy to implement the distributed pipeline in NCC. If the pipelines will be constructed by development partners such as WB or JICA for a particular gas company to utilise, it would be unfair for other companies. Because of the competition amongst gas companies, constructing the pipelines does not seem to be an easy task for NCC.
8.3.2 Development Policy
From the demand and gap analysis, two points are set for development policy of the power sector, i.e., appropriate planning for the energy sector and development based on the concept of sub-centres.
(1) Appropriate Planning for the Energy Sector
This is the policy for effective and appropriate planning, not to plan with excess design. From the previous section, there seems to be excessive capacity in planning and design. For example, according to the analysis of demand forecast, the existing demand forecast is substantially higher than the PDF. As another example, the wayleaves and minimum clearance of overhead lines are higher than the regulation of other countries. Therefore, appropriate planning is needed for the current energy sector.
(2) Development based on the Concept of Sub-centres
The main overall objective of NIUPLAN is to implement sustainable urban development and the improvement of living conditions in Nairobi City. Hence, the energy sector needs to assist partly in this objective. For example, as already mentioned, the Dandora area can be the place to be assisted by the power sector. Although there is much area of power-line wayleaves in Dandora under the current condition, this area is assumed to become sub-centres. Therefore, effective use of the lands currently used for power lines may be considered.
8.3.3 Priority Projects
As the priority project, the following table can be listed.

The Project on Integrated Urban Development Master Plan for the City of Nairobi in the Republic of Kenya
Nippon Koei Co., Ltd. 8-35 Final Report IDCJ Inc. EJEC Inc.
Table 8.3.5 Priority Projects Priority Project Estimated Cost Implementing Organisation Possible Funding Source
1st Amendment for Technical
Criteria of the Overhead Line US$0.5 million Kenya Power
ODA (Technical Cooperation)
2nd Reviewing the LCPDP US$0.5 million Energy Regulatory
Commission ODA
(Technical Cooperation)
3rd Development of the System
for Map Information Sharing Refer to Section 9.4.2 Management Proposal of GIS Data
4th Development of
Underground Cable in Dandora Area
US$10 million NCC ODA Loan
5th Power Supply for
Dandora Industrial Area US$5 million NCC ODA Loan
Source: JICA Study Team (JST)
The first, second, and third projects are for appropriate planning for the energy sector in line with the development policy. The rest of the projects are for development based on the concept of sub-centres. These projects are set as priority projects of the power sector and the following explains the detail:
(1) Amendment for Technical Criteria of the Overhead Line
As first priority project, the Amendment for Technical Criteria of the Overhead Line” needs to be executed. This project will review the current wayleaves regulation and current minimum clearance for overhead line. The background for the project is mainly for the following four accounts:
(i) First account is that a range of wayleaves in Kenya seems excessive. Comparing the range of wayleaves in Kenya with that of Japan, the wayleaves in Kenya are larger than the Japanese range of wayleaves. Moreover, the range of wayleaves, where it is assumed that steel towers and power poles have collapsed, have not been previously reviewed;
(ii) Next point is the minimum clearance. Minimum clearance over 132 kV from electrical wires to buildings is much larger than other countries. Thus, there is still a necessity to review the regulation;
(iii) NCC is expected to develop or utilise their land more effectively in the future. As the economy of NCC grows steadily, the land within NCC is much needed for housing units, offices, and commercial facilities; and
(iv) If the land for overhead line is reduced, the cost to an electric power company might be reduced and might possibly decrease electricity tariff for consumers.
The project has two objectives. One is to reduce the cost of wayleaves for an electrical power company and the other is to reduce the land of overhead line, so that the land could be used more effectively for NCC. The project is assumed to be carried out in consideration of the following viewpoints:
(i) The technical criteria may be revised in consideration of construction techniques, quality of electrical power equipment, and safety; and
(ii) The project will review the criteria of Kenya in comparison with other country’s technical criteria. From the comparison and investigation, the criteria of Kenya may be revised.

The Project on Integrated Urban Development Master Plan for the City of Nairobi in the Republic of Kenya
Nippon Koei Co., Ltd. 8-36 Final Report IDCJ Inc. EJEC Inc.
Source: JICA Study Team (JST)
Figure 8.3.10 Current Wayleaves of Transmission Lines
(2) Reviewing the LCPDP
Review of LCPDP is proposed for the future project.
In Section 4.6.1, the LCPDP was referred to in relation to electrical demand. The chapter concluded that review of the GDP growth rate and future population forecast are recommended. Hence, if the power sector of Kenya has the ability to review LCPDP without an external consultant to help, this project is not needed. If they need external consulting services, the proposed project should be required. Actually, LCPDP was made by the power sector of Kenya together with the AFD assistance. Therefore, it is possible to require the consulting services for revising LCPDP.
(3) Development of the System for Map Information Sharing
As the third priority project, it may be needed to develop the system for map information sharing with NCC, Kenya Power, and other infrastructure sectors. Information sharing of map was discussed by using GIS in Section 4.6.1. As a result of the discussion, it was clear that much data of actual situation has been reflected in the GIS by Kenya Power.
However, there are some problems in sharing map data. The main point of the problem is what kind of data is needed for other sectors such as NCC and the infrastructure sectors. Although the information of underground cable is needed for those sectors at least, they do not grasp each other’s’ requirements for mapping. Therefore, first of all, it may be important to understand the requirement of other concerned parties. Second, construct a system of information sharing. There is no circumstance to share GIS at the current condition, and if this project starts, building the system of map sharing may be needed from scratch.
(4) Development of Underground Cable in Dandora Area
The next priority project is the development of underground cables in Dandora area, which is one of the proposed sub-centres. As mentioned earlier, the Dandora area has more than 30 ha of land used for power line wayleaves and the development concept of sub-centres demands the utilisation of the wayleaves. From this view point, installation of underground cables can be considered as a practical option. Specifically, the area along Kangundo Road with a length of 2 km, which is shown in Figure 8.3.12, can be proposed for underground cables.
Source: Energy Regulatory Commission
Figure 8.3.11 The Latest LCPDP

The Project on Integrated Urban Development Master Plan for the City of Nairobi in the Republic of Kenya
Nippon Koei Co., Ltd. 8-37 Final Report IDCJ Inc. EJEC Inc.
Source : JICA Study Team (JST)
Figure 8.3.12 Proposed Industry Area along Kangundo Road in Dandora
In order to implement the project, the following three points need to be considered:
(i) Firstly, there will be a need to decide who should bear the costs for the construction of the underground cables. The existing overhead lines are Kenya Power’s property, but Kenya Power does not need to replace the overhead lines with underground cables. On the other hand, NCC hopes that Kenya Power will replace them. Therefore, there is a need to establish which part should be shouldered by NCC or Kenya Power. Furthermore, a scheme with a third party is also conceivable;
(ii) The second point is to define the concrete construction area in Dandora. The purpose of the construction of underground cables is to utilise the vacant land after the overhead line. Thus, before discussing underground cables, first, there is a need to define which area is industrialised; and
(iii) The third point is to study the type of underground cable. Although Subsection 4.6.1 introduced three types of underground cables, each type should be studied considering technical aspects, costs, and operation, etc.
(5) Power Supply for Dandora Industrial Area
As the previous fourth project is described, the Dandora area is the proposed sub-centre. Moreover, the area along Kangundo Road was considered to become an industrial area, and the total site for the industrial park is 45 ha. Because of this concept, power supply for the area is required when industrialisation is realised.
In this project, there is a need to construct transmission lines from a substation to the Dandora industrial area. There are two substations near the proposed industrial area and both substations, Juja Substation and Dandora Substation, are about 1 km from the industrial area. Moreover a substation inside the industrial area and distribution lines are needed.
①
①

The Project on Integrated Urban Development Master Plan for the City of Nairobi in the Republic of Kenya
Nippon Koei Co., Ltd. 8-38 Final Report IDCJ Inc. EJEC Inc.
8.4 Solid Waste Management
8.4.1 Demand and Gap Analysis
(1) Basic Condition of Demand Analysis
Future amount of solid waste generation is projected based on the socioeconomic framework of this study as shown in Figure 8.4.1.
0
1,000
2,000
3,000
4,000
5,000
6,000
7,000
8,000
9,000
10,000
0
1,000,000
2,000,000
3,000,000
4,000,000
5,000,000
6,000,000
20092011201320152017201920212023202520272029
Waste Amoun [ton/day]
Population
Poppulation
Total waste
Source: JICA Survey Team (JST)
Figure 8.4.1 Waste Generation Project based on Population
According to the JICA Solid Waste Management (SWM) Survey (2010), the collection is separated for every collection zones in consideration of income levels.
Based on the total population projection in this study, the population projection for collection zones (refer to Figure 8.4.2) is summarised as Table 8.4.1.
Table 8.4.1 Projected Population in Each Collection Zone Name of Collection Zone 2013 2018 2023 2030 Collection Zone 1 197,724 235,405 268,699 304,618 Collection Zone 2 343,333 406,378 461,147 518,525 Collection Zone 3 401,897 475,141 538,545 604,549 Collection Zone 4 482,778 574,086 654,493 740,737 Collection Zone 5 214,232 257,613 296,949 341,215 Collection Zone 6 234,453 275,657 310,699 346,013 Collection Zone 7 182,367 223,132 261,512 307,223 Collection Zone 8 119,909 127,887 133,917 138,561 Collection Zone 9 156,270 163,750 169,403 173,757 Collection Zone NCC/SWMPC 1,268,388 1,435,904 1,582,306 1,737,302 Total (Residential) 3,601,351 4,174,952 4,677,671 5,212,500
Source: JICA Survey Team (JST)

The Project on Integrated Urban Development Master Plan for the City of Nairobi in the Republic of Kenya
Nippon Koei Co., Ltd. 8-39 Final Report IDCJ Inc. EJEC Inc.
Source: JICA Survey Team (JST)
Figure 8.4.2 Map of Each Collection Zone
According to the JICA SWM Survey (2010), future solid waste amount by year 2030 is projected based on the field survey conducted in 2010. As there are no other field survey data from 2010 to 2013, it is assumed that there is no significant change in solid waste generation during the period. Therefore, the unit generation ratio of solid waste used in 2010 and the projected socioeconomic data in this study will be used in this demand analysis. Based on the assumption, the estimated solid waste is shown in Figure 8.4.3.
0
500
1,000
1,500
2,000
2,500
3,000
3,500
2013 2018 2023 2030
Am
ount
of W
aste
[ton
/day
]
Year
Residential waste
Commercial waste
Market waste
Total waste
Source: JICA Survey Team (JST)
Figure 8.4.3 Estimated Solid Waste Projection

The Project on Integrated Urban Development Master Plan for the City of Nairobi in the Republic of Kenya
Nippon Koei Co., Ltd. 8-40 Final Report IDCJ Inc. EJEC Inc.
According to the above Figure 8.4.3, the amount of generated waste in 2030 will be approximately 1.5 times as that of 2013. In addition, there are many issues related to solid waste management. While the solid waste collection, transportation, treatment, and disposal system are not sufficient, which cause environmental issues like illegal dumping or pollution of the surrounding environment as discussed in Subsection 4.2.7. Main gaps from the current desirable situation are shown in Table 8.4.2.
Based on the demand of solid waste generation and disposal, it is necessary to prepare the development of the collection and transportation system and waste disposal and treatment system.
Table 8.4.2 Current Situation of Solid Waste Management and its Gaps between Desirable Situations Item Current Situation Demand/Desirable Situation Gap
Waste Generation Generated waste is not properly treated and there is no suitable action for waste reduction.
All the generated waste is treated properly.
Suitable system of solid waste based on the projection should be developed.
Collection and Transportation
The ratio of collection and transportation is less than 50%.
The collection ratio should be almost 100% to prevent illegal dumping.
Necessity of collection and transportation system.
Reuse and Recovery System
Reuse and recovery is carried out by waste pickers for only a part of recyclable waste in illegal dumping site, waste collection points, and the Dandora Dumping Site.
Recycling system of suitable scale is necessary.
Recycling system at community level should be developed.
Waste Disposal Waste is disposed in the open dumping site in Dandora, which causes pollution problem to the surrounding environment.
Waste should be disposed of in a sanitary manner through a suitable waste disposal method.
A sanitary landfill site is necessary.
Institutional Framework
There is no comprehensive institutional framework for solid waste management.
Comprehensive institutional framework for solid waste management and future establishment of recycling-based society.
Establishment of the revision of the law and new regulation is necessary.
Financial Situation
There is little capacity to cover the solid waste management by the current waste collection tariff.
It is necessary to increase the revenue from waste collection tariff, benefit from 3R activities, and subsidy as well as reduction of expenditure.
Improvement of the current financial system of solid waste management is necessary.
Source: JICA Survey Team (JST)
(2) Future Waste Stream and Future Demand of Each System
Currently, some of the wastes are illegally dumped which causes environmental pollution in NCC. In addition, it is necessary to implement the 3R (Reduce, Reuse, Recycle) activities to divert wastes into the landfill site to prolong its life as well as reduction of collection and transportation costs as considered in the JICA SWM Survey (2010). The target collection, diversion, and disposal rates set as target indicators are follows:
WCRi = WCAi / WGAi
WDIVRi= WDIVAi / WGAi
WDISR i = WDISA i / WGA i
Where, WGAi is the amount of waste generated in a year i
WCAi is the amount of waste collection in a year i
WDIVAi is the amount of waste disposal in a year i
WCRi is collection ratio in a year i
WDIVRi is diversion ratio in a year i
WDISRi is disposal ratio in a year i

The Project on Integrated Urban Development Master Plan for the City of Nairobi in the Republic of Kenya
Nippon Koei Co., Ltd. 8-41 Final Report IDCJ Inc. EJEC Inc.
The target indicators in each year are shown in Table 8.4.3.
Table 8.4.3 Target Indicators for Future Waste Stream Item 2013 2018 2023 2030
Collection Ratio 38% 47% 60% 78% Diversion Ratio 15% 20% 23% 24% Disposal Ratio 37% 46% 59% 76%
Source: JICA Survey Team (JST)
Future projection on the amount of generated, collected, recycled, and other wastes and disposed waste are calculated based on the target indicators shown in Table 8.4.3 above.
In addition, the waste stream in 2023 and 2030 is shown in Figure 8.4.5 and Figure 8.4.6.
0
500
1,000
1,500
2,000
2,500
3,000
3,500
2013 2018 2023 2030
Am
ount
of W
aste
[ton
/day
]
Year
Generated waste
Collected waste
Recycled/Other Waste
Disposed waste
Source: JICA Survey Team (JST)
Figure 8.4.4 Estimated Solid Waste Projection

The Project on Integrated Urban Development Master Plan for the City of Nairobi in the Republic of Kenya
Nippon Koei Co., Ltd. 8-42 Final Report IDCJ Inc. EJEC Inc.
Household waste2217 t/day
Commercial waste654 t/day
Market waste134 t/day
Self disposal301 t/day
Collected1796 t/day
Final disposal 1760 t/day
Illegal dumping666 t/day
Diverted579 t/day242 t/day
666 t/day
Source: JICA Survey Team (JST) Figure 8.4.5 Estimated Solid Waste Projection in 2023
Household waste2565 t/day
Commercial waste729 t/day
Market waste149 t/day
Self disposal344 t/day
Collected2672 t/day
Final disposal 2619 t/day
Diverted824 t/day427 t/day
Source: JICA Survey Team (JST)
Figure 8.4.6 Estimated Solid Waste Projection in 2030
8.4.2 Development Policy
(1) General Development Policy of Solid Waste Management
Based on the proposal of JST and the discussion in the TWG, “clean” and “safe” are two of the keywords for the development of NCC. The purpose of solid waste management is mainly to ensure safe and clean environment for the people by reducing and removing the hazardous, toxic, and infectious materials with suitable treatment and disposal. This process has to be carried out in consideration of the technical, financial, and organisational aspects toward environmental friendly society as well as in line with the change of life style towards less environmental impacts. In this context, the development policy of the solid waste management sector is set as follows:

The Project on Integrated Urban Development Master Plan for the City of Nairobi in the Republic of Kenya
Nippon Koei Co., Ltd. 8-43 Final Report IDCJ Inc. EJEC Inc.
1) Application of feasible methods of waste management in terms of environmental, social, economic, and technical aspects to keep a clean and safe environment for the people;
2) Development of a system to manage various stakeholders including private contractors, licensed private companies, waste dischargers, and waste pickers; and
3) Implementation of capacity development for target organisations and staff in a suitable manner.
(2) Responsibility of Relevant Organisations and Stakeholders
There are various relevant organisations and stakeholders related to solid waste management in NCC. Amongst the organisations, NCC has the main responsibility for the implementation of solid waste management. The responsibilities of relevant organisations are clarified as shown in Table 8.4.4.
Table 8.4.4 Responsibility of Relevant Organisations and Stakeholders Organisation/Stakeholder Responsibilities
Central Government (National Environmental Management Agency)
- To formulate national law and regulations related to solid waste management. - To prepare solid waste management plan in the national level. - To prepare the guidelines and technical standards. - To provide guidance to local governments.
Nairobi City County - To formulate the local policy of Nairobi City County - To implement and finance solid waste management in Nairobi City County
Private Contractors - To provide waste collection, transportation, and street sweeping services based on the contract.
Business Waste Generators (Industrial and Commercial)
- To manage their waste except the municipal waste handled by the local government.
Residents - To comply with the law and regulations related to solid waste management. - To reduce waste generation and recycle the recyclable waste. - To discharge the waste to determined places and time. - To burden the waste collection service fee based on polluters pay principle.
Source: JICA Survey Team (JST)based on the hearing with NCC
(3) Planning Strategy of Solid Waste Management
Based on the general development policy, the planning strategy is formulated as follows:
1) Collection and Transportation Plan
It is necessary to consider an effective collection and transportation system for maximum service provision with utilisation of current resources such as equipment and human capacity. In this moment, there are so many private companies which implement solid waste collection services but it is focused only on high income areas, which have the capacity to pay the tariff waste collection service. NCC cannot supervise such activity with so many private companies. Therefore, participation of a few private companies which has the capability of collecting and transporting solid wastes is necessary. It may also be necessary to introduce a franchise system for collection and transportation services for the comparatively higher and middle-income areas in consideration of the balance of income level, and introduction of collection by the public for low-income or slum areas.
2) 3R and Intermediate Treatment Plan
It is necessary to introduce the 3R system and intermediate treatment system to divert wastes to be disposed in the landfill site. In this context, the waste characterisation in NCC should be considered as well as with the financial and technical capability of the existing organisations. The calorific value of the waste generated in NCC is too low to consider incineration or gasification, and organic waste occupies the higher portion of waste composition. However, it

The Project on Integrated Urban Development Master Plan for the City of Nairobi in the Republic of Kenya
Nippon Koei Co., Ltd. 8-44 Final Report IDCJ Inc. EJEC Inc.
will be difficult to introduce large-scale compost or methanisation technology because the technology needs slightly higher technical capability. Therefore, small- or middle-scale compositing will be considered as 3R and intermediate for NCC.
3) Final Disposal
The final disposal is necessary for waste disposal and treatment as one of the cheapest and technical feasible options. However, the current final disposal method of NCC is open dumping which causes environmental deterioration in the surrounding environment. To improve this situation, the development of a sanitary landfill site and its operation procedure should be considered taking into account its financial and technical capability. The safe closure of the existing dumping site should be considered in parallel with the development.
4) Organisational Restructuring Plan
The development of the organisational capacity is critical to manage the private contractors and franchised company as well as improvement of the operational capacity of direct collection and transportation.
5) Legal and Institutional Improvement Plan
The related acts, regulations, and by-laws should be improved for better enforcement of solid waste management in consideration of a PPP structure, tariff setting, proper zoning, and cross-subsiding system as well as future 3R society.
6) Financial Management Plan
It is necessary to establish a special account for solid waste management in consideration of possible increase of revenue and budgetary allocation as well as waste collection charge.
7) Private Sector Participation Plan
Private sector participation is crucial for effective solid waste management. It is important to establish a management system for the private sector in consideration of suitable schemes such as introduction of a franchise system.
8) Community Participation Promotion Plan
Public education is important for effective solid waste management, especially in the low income or slum areas in case of NCC as there may not be sufficient roads for solid waste collection and transportation services. Source segregation system in community base or waste bank system should be considered in community participation plan as well as environmental education in schools.
(4) Consideration of Technical Options
In the JICA SWM Survey (2010), technical options have been considered for collection, transportation, treatment, and final disposal. These options are considered to be valid in the present study, as summarised below.
1) Treatment and Disposal
Considering the current financial situation and technical and organisational capacity of NCC, the easiest feasible technical option considering financial and technical aspects, especially for short term should be selected. According to the waste characterisation survey in the JICA SWM Survey (2010), the low calorific value of waste is approximately 3,300 kJ/kg, which is

The Project on Integrated Urban Development Master Plan for the City of Nairobi in the Republic of Kenya
Nippon Koei Co., Ltd. 8-45 Final Report IDCJ Inc. EJEC Inc.
considerably lower than the required average value for incinerators without power generation, which is approximately 7,500 kJ/kg in Japan. The low calorific value is considered to be too low to adopt the incineration technology. If NCC will not succeed in segregating biodegradable wastes that have high moisture contents, incineration is not a suitable technology.
For organic wastes, the methanisation also needs high technical skill for operation and requires appropriate segregation before the treatment. In this context, the combination of the segregation of plastic, paper, and metal for 3R and small-scale composting will be an adoptable technology. The residual waste should be disposed of in a sanitary landfill site.
Table 8.4.5 Merit and Demerit of Each Technical Option for Treatment and Disposal Options Merit Demerit
Landfill - Comparatively cheaper option - Technically feasible
- No waste reduction
3R+Landfill - Comparatively cheaper option - Technically feasible
- If no cooperation with waste generator, there is not enough waste reduction
3R+Incineration+Landfill - Effective volume reduction of wastes - Expensive for initial cost and O&M cost 3R+Composting+Landfill - Effective volume reduction of organic
wastes - Not an expensive option
- Waste separation is necessary and there is a need to market the compost
Source: JICA Survey Team (JST)
Considering the merits and demerits of the options for treatment and disposal, it will be better to select the option of “3R+Composting (including home composting and community composting)+Landfill” will be the most suitable option for waste treatment in NCC.
2) Collection and Transportation
According to the JICA SWM Survey (2010), various technical options of the transport system including secondary transportation system for various site selection options have been studied in the economic aspects. Finally, the site for final disposal is selected in Ruai and direct hauling is recommended due to economic aspects. However, the directly hauled wastes will include recyclable materials for market or commercial wastes, which can be removed in the material recovery facility (MRF). In addition, the waste pickers may lose their jobs after the closure of the Dandora Open Dumping Site, if there is no other facility in Dandora. In this context, JST recommends the preparation of MRF for the segregation of wastes for recyclable and biodegradable in the Dandora Open Dumping Site.
8.4.3 Priority Projects
Based on the development policy, it is necessary to develop a new sanitary landfill site, carry out the safe closure of the existing dumping site and develop an MRF in Dandora. In addition, it is necessary to improve the collection and transportation system in consideration of financial and organisational requirements. Furthermore, promotion of 3R and the establishment and improvement of laws, regulations, and guidelines for effective solid waste management is necessary.
In this regard, the following projects are proposed as priority projects:
(1) Development of a New Landfill Site
As proposed in the JICA Preparatory Survey (2012), a new sanitary landfill is necessary for final disposal of residual wastes. In the JICA Preparatory Survey (2012), the project site is surveyed based on findings of the previous JICA SWM Survey (2010). The site was proposed in Ruai which is approximately 28 km from the central business district of Nairobi City. The whole area of 80 ha is owned by NCC, although the procedure of obtaining title deeds is still ongoing.

The Project on Integrated Urban Development Master Plan for the City of Nairobi in the Republic of Kenya
Nippon Koei Co., Ltd. 8-46 Final Report IDCJ Inc. EJEC Inc.
It is proposed that the new landfill will be for a total usage period of about 15 years and approximately 9.8 million tons of wastes will be disposed of in the landfill. In consideration of the soil for soil cover, in total, 13.1 million tons of waste and soil will be accumulated at the site for the entire design life of the project.
The following table shows the outline of the new sanitary landfill structure:
Table 8.4.6 Outline of the New Sanitary Landfill Structure Category Facility Description
Principal Facilities
Landfill
Waste disposal facility Soil embankment for retaining solid waste
Lining system Waterproof liner using black cotton soil available at the site
Leachate collection facility
Leachate collection piping network at the bottom of the disposal area
Landfill gas exhaust facility Distribution of landfill gas exhaust pipes
Leachate treatment facility Anaerobic pond, facultative pond, coagulating sedimentation pond, etc.
Stormwater drainage Prevention of rainwater flowing into the disposal area
Monitoring facility Monitoring well Administration Administration building Office building and transport control station
Others Weigh bridge, parking lots Others Road network Hauling road, access road, on-site road
Enclosure facilities Fence, gate, etc. Source: JICA Survey Team (JST)
The sanitary landfill system will include the waste disposal area, a leachate treatment area, and a small area for administration. The semi-aerobic method will be applied for this sanitary landfill for quicker decomposition of organic matter in the accumulated waste and for reduction of the methane gas which is greenhouse gas. The system will prevent environmental pollution of the surrounding area.
However, the Kenya Airport Authority (KAA) and the Kenya Civil Aviation Authority (KCAA) opposed to the proposed Ruai site, as it is on the flight path of the Jomo Kenyatta International Airport (JKIA). Although there are no international and local regulations that specifically prohibit the development of a landfill site in this location. In addition, they also opposed to the utilisation of the circuit area for take-off and landing in JKIA,Wilson Airport, and the army base. The restricted areas based on the suggestions of KAA and KCAA are shown in Figure 8.4.7. The restricted areas cover most area of NCC and all the possible candidate sites proposed in the JICA SWM Survey (2010) are in the restricted areas.

The Project on Integrated Urban Development Master Plan for the City of Nairobi in the Republic of Kenya
Nippon Koei Co., Ltd. 8-47 Final Report IDCJ Inc. EJEC Inc.
Source: JICA Study Team (JST)
Figure 8.4.7 Candidate Sites of New Landfill Site and Restriction Areas
Therefore, JST suggested the importance of the methods of soil cover during landfill operation for sanitary landfill site to protect disposed waste from birds, as well as the introduction of semi-aerobic landfill method such as leachate collection and treatment system, lining system at the bottom of the site by using black cotton soil, and gas collection system. The landfill area is divided into six sections of landfill areas which are designed by the JICA SWM Survey (2010).
Regarding the operation of this sanitary landfill, a cell method, in which the waste cell is covered with soil every day, will be recommended following the JICA Preparatory Survey (2012), In order to secure the reliability of this sanitary landfill activity, it is also strongly recommended to train the landfill operators with required skills. There are various methods to prevent birds in the landfill sites. JST suggested that a pilot project for sanitary landfill operation should be implemented by NCC with relevant stakeholders including NEMA, KAA, and KCAA as shown in Figure 8.4.9, as well as the preparation of site visits of the best practices in other areas and holding workshops with relevant stakeholders related to sanitary landfill and airport operations.
Figure 8.4.9 Image of Landfill Operation Options
Source: JICA Study Team
Figure 8.4.8 Image of a Cell Method Operation
Bird protection net
Plastic sheet or soil Plastic sheet or soil

The Project on Integrated Urban Development Master Plan for the City of Nairobi in the Republic of Kenya
Nippon Koei Co., Ltd. 8-48 Final Report IDCJ Inc. EJEC Inc.
(2) Safe Closure of the Existing Landfill Site
The site at Dandora has been utilised as the area for dumping wastes since 1981, and has gradually expanded to 46 ha. According to the current site boundary map provided by the City Planning Department of NCC to JST on 27 September 2011, about 1.5 ha of the area within the dumping site is currently privately owned. In addition, some structures such as houses and schools built by some private individuals and religious and community organisations have been observed and immediately around the dumping site.
Existing landfill of Dandora Dumping Site is poorly managed and the area is not designed for a sanitary landfill. In addition waste disposal in Dandora has exceeded the design capacity for landfill operation.
Considering the current conditions at the site, it is better to decommission the Dandora Dumping Site. The following design concepts should be applied for the decommissioning of the Dandora Dumping site as described in the JICA Preparatory Survey (2012):
(i) Existing dumped waste shall not be transported outside of Dandora Dumping Site;
(ii) Part of the NCC area where no waste has been dumped will remain in that state;
(iii) A buffer zone should be secured for the surrounding environment;
(iv) Waste located on the private land and the area adjacent to the project site shall be cleansed and removed from the project site; and
(v) Environmental impact of leachate and bird strikes shall be paid to mitigate for environmental protection.
The following table shows the necessary facility and the role of the decommissioning of the Dandora Dumping Site:
Table 8.4.7 Outline of the Decommissioning of the Dandora Dumping Site Category Facility Description
Principal Facilities Landfilling area
Disposal area shall be limited and controlled in accordance with the decommissioning plan and waste quantity to be continuously disposed of at the site until the Ruai site will become operational.
Leachate collection facility Concrete ditch with collection pipes along the boundary facing the Nairobi River
Stormwater drainage Prevention of rainwater from flowing into the closed dumping site Landfill gas exhaust facility Distribution of landfill gas ventilation network Leachate treatment facility Leachate storage pond and artificial stream
Administration Monitoring facility Distribution of monitoring wells Others Perimeter facility Surrounding wall, gate etc. Source: JICA Study Team based on the JICA Preparatory Survey in 2012
Some of the accumulated waste shall be moved to another part of the site with a stable slope and flat the surface of waste layer. Then, the surface cover soil will be put on the whole surface of the waste. The thickness of this final cover soil will be 1 m or more to protect the surrounding environment from waste layer.
Landfill gas will be captured by a gas collection pipe installed in the surface layer of the site and released to the atmosphere through gas ventilation pipes.
Source: JICA Preparatory Survey in 2012 Figure 8.4.10 Layout Plan of Decommissioning of the
Dandora Dump Site
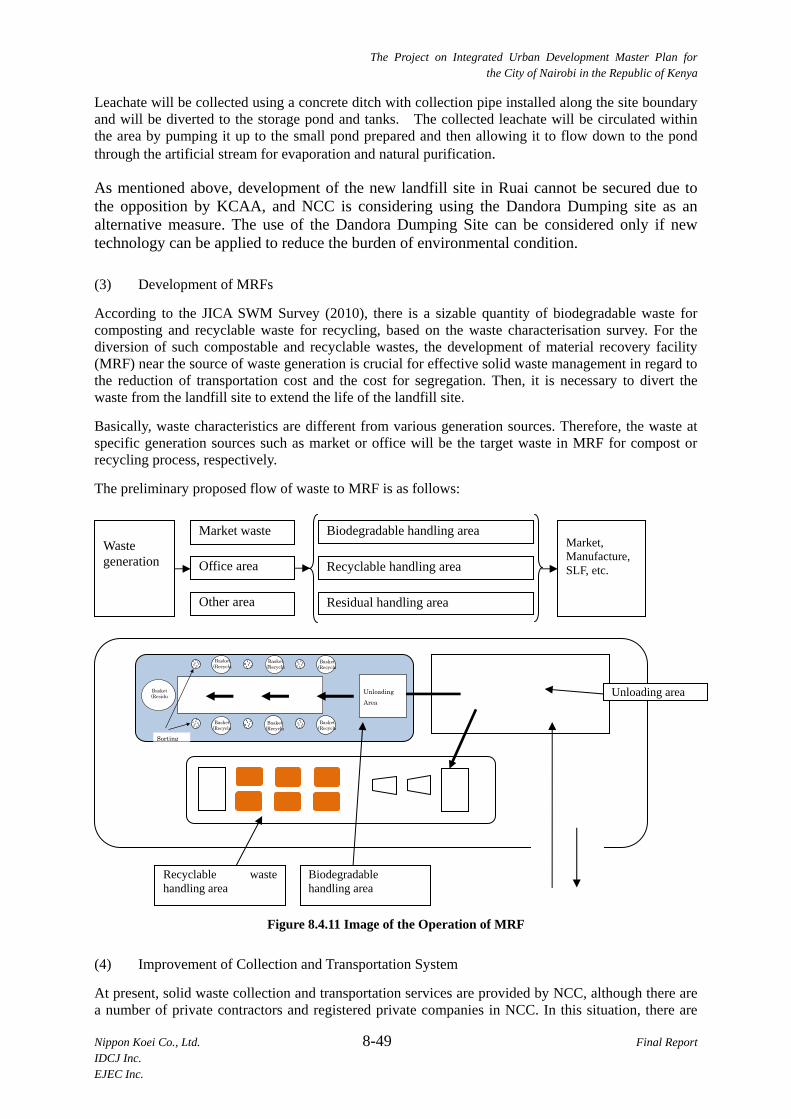
The Project on Integrated Urban Development Master Plan for the City of Nairobi in the Republic of Kenya
Nippon Koei Co., Ltd. 8-49 Final Report IDCJ Inc. EJEC Inc.
Leachate will be collected using a concrete ditch with collection pipe installed along the site boundary and will be diverted to the storage pond and tanks. The collected leachate will be circulated within the area by pumping it up to the small pond prepared and then allowing it to flow down to the pond through the artificial stream for evaporation and natural purification.
As mentioned above, development of the new landfill site in Ruai cannot be secured due to the opposition by KCAA, and NCC is considering using the Dandora Dumping site as an alternative measure. The use of the Dandora Dumping Site can be considered only if new technology can be applied to reduce the burden of environmental condition.
(3) Development of MRFs
According to the JICA SWM Survey (2010), there is a sizable quantity of biodegradable waste for composting and recyclable waste for recycling, based on the waste characterisation survey. For the diversion of such compostable and recyclable wastes, the development of material recovery facility (MRF) near the source of waste generation is crucial for effective solid waste management in regard to the reduction of transportation cost and the cost for segregation. Then, it is necessary to divert the waste from the landfill site to extend the life of the landfill site.
Basically, waste characteristics are different from various generation sources. Therefore, the waste at specific generation sources such as market or office will be the target waste in MRF for compost or recycling process, respectively.
The preliminary proposed flow of waste to MRF is as follows:
Figure 8.4.11 Image of the Operation of MRF
(4) Improvement of Collection and Transportation System
At present, solid waste collection and transportation services are provided by NCC, although there are a number of private contractors and registered private companies in NCC. In this situation, there are
Market waste Biodegradable handling area
Recyclable handling area
Residual handling area
Waste generation
Market, Manufacture, SLF, etc. Office area
Other area
Recyclable waste handling area
Biodegradable handling area
Unloading
Area
Sorting
Basket (Residu
l
Basket (Recycla
)
Basket (Recycla
)
Basket (Recycla
)
Basket (Recycla
)
Basket (Recycla
)
Basket (Recycla
)
Unloading area

The Project on Integrated Urban Development Master Plan for the City of Nairobi in the Republic of Kenya
Nippon Koei Co., Ltd. 8-50 Final Report IDCJ Inc. EJEC Inc.
various issues regarding the supervision of activities including the following: 1) Insufficient supervision of the private contractors and registered private companies, and 2) Unequal waste collection service charges for waste generators in each income level. To improve the condition, it is necessary to set up the collection zone by considering the socioeconomic level (especially, income level) in order to consider the waste collection service charges in each zone. Also the location of the collection zone and franchised system need to be examined to utilise the technology and know-how of each private company related to the collection and transportation services. In addition, waste diversion of market waste and other domestic waste after collection is recommended as described in Subsection 4.2.7, for which an MRF needs to be considered for waste separation. In this context, the collection and transportation area for each MRF are specifically proposed, as shown in Figure 8.4.12 with the number of zones and colour. Currently, the pilot project for zone 7 is being implemented in the JICA technical cooperation project.
Source: JICA Study Team
Figure 8.4.12 Collection Zone and Proposed Four Areas for the Transportation System
If the private sector participates in the collection and transportation service, NCC should supervise the activities of the private sector suitably. After the introduction of a franchise system, the franchise company will provide the collection and transportation service in one zone and manage the system under their own responsibility with the supervision of NCC. In this context, it is important to introduce a robust system as follows, as described in the JICA SWM Survey (2010):
1) Step-wise establishment of an operational zone based on cross-subsidy within the zone
In Nairobi City, income levels have been identified based on the poverty map prepared by WB. Based on the concept of affordability to pay (ATP), it is better to adjust the collection fee with the income level. Each zone in a franchise system should be in similar income level on average for each franchise company. In this context, the area of the zone and its location should be considered with the income level of waste generators as well as the location of zone. Therefore, the collection area is proposed in Figure 8.4.12 as described in the JICA SWM Survey (2010).
2) Suitable Collection System
Appropriate waste collection and transportation systems need to be considered to cope with the current waste generation source and type. As for collection, there are a number of options such as house to house collection and station collection. Station collection is suitable for

The Project on Integrated Urban Development Master Plan for the City of Nairobi in the Republic of Kenya
Nippon Koei Co., Ltd. 8-51 Final Report IDCJ Inc. EJEC Inc.
apartment or housing complex and possibly, in densely populated areas. Individual collection is suitable for detached housing areas and suburbs. As for the collection equipment, the merits and demerits of equipment shall be considered, and the selection of collection equipment should be in accordance with the area characteristics. The proposed collection method and collection equipment for each area is described as follows:
Options Merit DemeritHandcart -Easy to collect along
small road-Cheap cost
- Not effective for collection
Compactor vehicle
-Easy to collect and transport effectively
-Slightly expensive
Containervehicle
-Easy to collect-Effective collection
-Necessary for maintenance
Dump truck - Not so expensive - Slightly taking time for collection
Options Merit DemeritHouse to house collection
-Easy to collect-No incentive for waste reduction
-Taking the time for collection
Station collection
-Effective collection Necessary to monitor the collection point
Area of narrow road
Area of high income
Area of station collection
Other area
Apartment, secondary collection area
Individual house
Figure 8.4.13 Proposed Collection Methods and Equipment
(5) Establishment and Improvement of Laws, Regulations, and Guidelines for Effective Solid Waste Management
While the Environmental Management and Coordination Regulation (2006) is the basic law in Kenya and the NCC bylaws of 2007 have been established, there are no specific regulations or guidelines for the planning and operation of solid waste management in the national and county levels. It is necessary to establish the institutional system in the national level. NEMA has the responsibility of solid waste management in the national level to set up the law, regulations, and guidelines. NEMA should take an initiative to establish the institutional system for solid waste management. The proposed system is shown in Figure 8.4.14, which includes the institutional system about basic laws on waste management and sound material-recycle society for future establishment of the regulation for promotion of utilisation of resources, regulation on the promotion of green purchasing, and regulations related to E-waste, etc..

The Project on Integrated Urban Development Master Plan for the City of Nairobi in the Republic of Kenya
Nippon Koei Co., Ltd. 8-52 Final Report IDCJ Inc. EJEC Inc.
Figure 8.4.14 Image of Future Institutional System for Solid Waste Management
8.5 Telecommunications
8.5.1 Demand and Gap Analysis
Future demand for telecommunications is calculated in consideration of the future population studied in this report and the world trends of the telecommunications sector.
(1) Mobile Telephone
Figure 8.5.1 shows the mobile penetration ratio of countries in Africa. The mobile penetration ratio of Kenya was 67.5% in 2011 according to the International Telecommunications Union (ITU) statistics and it is expected to reach 69% based on the Communications Commission of Kenya (CCK) sector statistics report (3rd quarter 2012/13). The mobile penetration ratio of South Africa, Algeria, and Tunisia started to rise after around 2005 while that of Kenya’s neighbouring counties - Uganda, Ethiopia, and Tanzania - rose one year later. The growth rate of mobile penetration ratio in each country was nearly constant after the mobile penetration started to rise. On the other hand, as shown in Table 8.5.1, mobile penetration of G7 countries moved up at 50% points per decade on average. Applying this growth rate to calculate the future mobile penetration ratio in Kenya, mobile demand is expected to grow as shown in Table 8.5.2.
From Table 8.5.2, it is observed that mobile subscriptions will exceed the current capacity of mobile phones before 2018.
Guidelines - Guidelines for preparation of M/P - Guidelines for preparation of collection
and transportation - Guidelines for preparation of waste
treatment and disposal facility, etc.
Specific law and regulation - Regulation on the promotion of
utilisation of resources - Regulation on the promotion of green
purchasing etc.
Basic law and regulation for waste management Environmental Management and Coordination Regulation (2006) (Solid Waste Management Law)
Basic law for 3R (Reduce, Reuse, Recycle) Basic law for establishing a sound material-recycle society
National Solid Waste Management Plan- Solid Waste Management Plan in the
national level based on vision 2030

The Project on Integrated Urban Development Master Plan for the City of Nairobi in the Republic of Kenya
Nippon Koei Co., Ltd. 8-53 Final Report IDCJ Inc. EJEC Inc.
0
20
40
60
80
100
120
140
2000
2001
2002
2003
2004
2005
2006
2007
2008
2009
2010
2011
%
Year
Kenya
S.Africa
Tunisia
Algeria
Uganda
Ethiopia
Tanzania
Source: JICA Study Team (JST) based on ITU statistics
Figure 8.5.1 Mobile Phone Penetration Ratio of African Countries
Table 8.5.1 Penetration Ratio of Developed Countries
Year 2000 2001 2002 2003 2004 2005 2006 2007 2008 2009 2010 2011 Growth Rate(2011)-(2001)
France 49.20 62.29 64.55 69.29 73.51 78.84 84.17 89.66 93.36 92.75 92.03 94.79 32.50
Japan 53.12 59.43 64.35 68.67 72.43 76.34 78.94 84.84 87.24 91.90 97.43 104.95 45.52
United Kingdom
73.80 78.32 82.96 91.03 99.66 108.75 115.76 121.25 125.24 130.17 130.76 130.75 52.44
United States
38.75 45.00 49.16 55.15 62.85 68.63 76.64 82.47 85.68 89.14 91.86 92.72 47.72
Germany 58.53 68.13 71.73 78.56 86.43 96.04 103.78 116.62 127.95 127.42 127.04 132.30 64.17
Canada 28.46 34.39 37.95 42.05 47.02 52.71 57.46 61.49 66.29 70.71 75.92 79.73 45.34
Italy 74.13 89.59 94.26 98.11 107.70 121.87 136.11 150.94 150.84 149.44 154.64 157.93 68.34
Average Growth Rate of the Decade 50.86 Source: JICA Study Team (JST) based on ITU statistics
Table 8.5.2 Mobile Telephone Demand Year 2013 2018 2023 2030 Population 43,300,000 49,500,000 56,000,000 65,600,000 Mobile Penetration (%) 69 102 127 162 Estimated Mobile Subscriptions
29,849,336*1 50,490,000 71,120,000 106,272,000
Capacity 49,977,000*2
Note *1: Sector Statistics Report Q3 2012/13 issued by CCK on July 2013 *2: Figure of capacity is as of 2012 based on CCK Annual Report 2011/12
Source: JICA Study Team (JST) based on CCK Report
(2) Internet Use
Internet use penetration ratio in Kenya has been rising sharply and came up to approximately 28% in 2011 based on ITU statistics. This is due partly to the introduction of affordable internet access devices, including smart phones and social networking applications as well as aggressive promotion, special offerings, and reduced tariffs launched by operators. Furthermore, the internet use ratio is estimated to stand at around 37% in 2013, calculated based on the CCK sector statistics report in the 3rd quarter of 2012/13. From 30%, it took 11 years for the internet use penetration ratio of G7 countries to reach up to 80% (Figure 8.5.2). Furthermore, in Nordic Countries, where a much higher penetration ratio is seen, such as Norway, Sweden, and Iceland, it took approximately eight years for the ratio to rise from 80% to 90%. Applying this growth rate to calculate the internet use penetration in Kenya, the demand is assumed as shown in Table 8.5.3. Following the trend of developed countries
67.5%
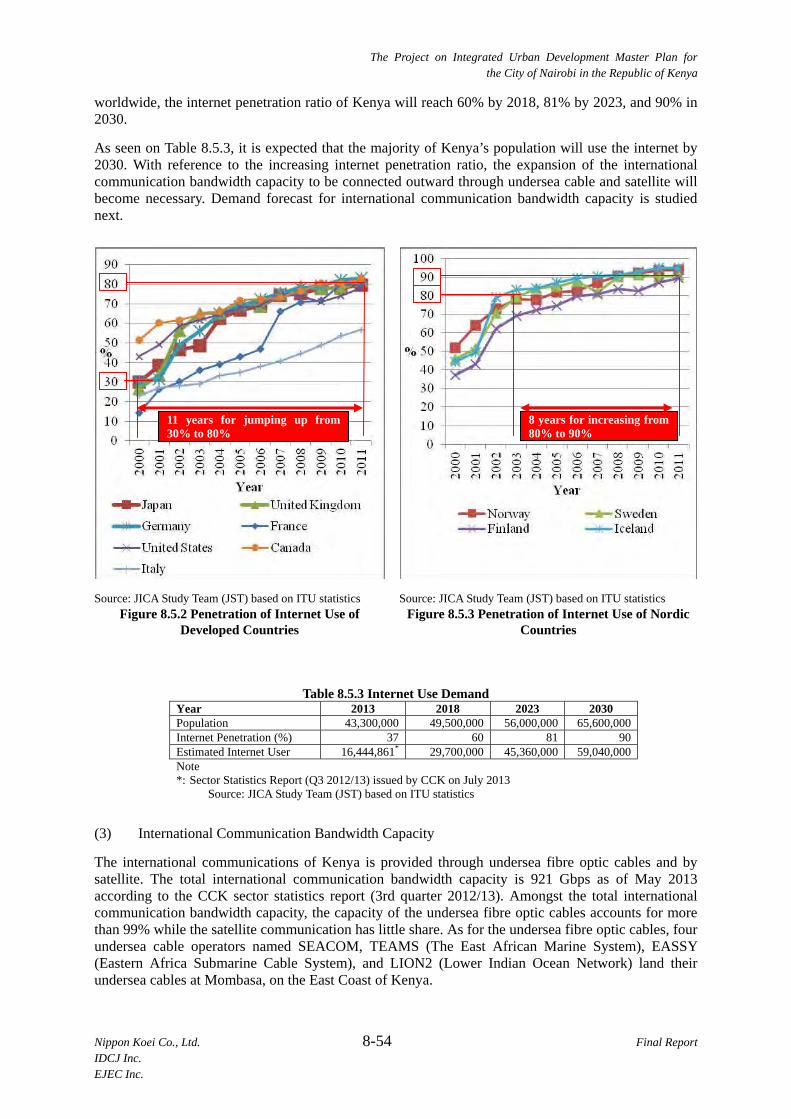
The Project on Integrated Urban Development Master Plan for the City of Nairobi in the Republic of Kenya
Nippon Koei Co., Ltd. 8-54 Final Report IDCJ Inc. EJEC Inc.
worldwide, the internet penetration ratio of Kenya will reach 60% by 2018, 81% by 2023, and 90% in 2030.
As seen on Table 8.5.3, it is expected that the majority of Kenya’s population will use the internet by 2030. With reference to the increasing internet penetration ratio, the expansion of the international communication bandwidth capacity to be connected outward through undersea cable and satellite will become necessary. Demand forecast for international communication bandwidth capacity is studied next.
Source: JICA Study Team (JST) based on ITU statistics Figure 8.5.2 Penetration of Internet Use of
Developed Countries
Source: JICA Study Team (JST) based on ITU statistics Figure 8.5.3 Penetration of Internet Use of Nordic
Countries
Table 8.5.3 Internet Use Demand Year 2013 2018 2023 2030 Population 43,300,000 49,500,000 56,000,000 65,600,000 Internet Penetration (%) 37 60 81 90 Estimated Internet User 16,444,861* 29,700,000 45,360,000 59,040,000 Note *: Sector Statistics Report (Q3 2012/13) issued by CCK on July 2013
Source: JICA Study Team (JST) based on ITU statistics
(3) International Communication Bandwidth Capacity
The international communications of Kenya is provided through undersea fibre optic cables and by satellite. The total international communication bandwidth capacity is 921 Gbps as of May 2013 according to the CCK sector statistics report (3rd quarter 2012/13). Amongst the total international communication bandwidth capacity, the capacity of the undersea fibre optic cables accounts for more than 99% while the satellite communication has little share. As for the undersea fibre optic cables, four undersea cable operators named SEACOM, TEAMS (The East African Marine System), EASSY (Eastern Africa Submarine Cable System), and LION2 (Lower Indian Ocean Network) land their undersea cables at Mombasa, on the East Coast of Kenya.
11 years for jumping up from 30% to 80%
8 years for increasing from 80% to 90%

The Project on Integrated Urban Development Master Plan for the City of Nairobi in the Republic of Kenya
Nippon Koei Co., Ltd. 8-55 Final Report IDCJ Inc. EJEC Inc.
With the increase in the number of internet users, there is a need for the international communication bandwidth capacity to expand in order to provide smooth internet connection for users. Demand for international communication bandwidth capacity is studied based on the following assumptions listed below. Table 8.5.4 shows the result of demand forecast for international communication bandwidth capacity.
As shown in Table 8.5.4, although the current available international communication bandwidth capacity is 921 Gbps, the estimated international capacity will be 1,270 Gbps in 2018 as highlighted in green. This forecast shows that the international communication bandwidth capacity will exceed the current capacity before 2018 (Figure 8.5.4).
Table 8.5.4 International Communication Bandwidth Capacity Demand No. Items Unit 2013 2018 2023 2030 Calculation
1 Population 43,300,000 49,500,000 56,000,000 65,600,0002 Internet User 16,444,861 29,700,000 45,360,000 59,040,0003 Internet User Ratio % 38 60 81 904 Broadband User Ratio % 2.7 8 13 205 Broadband user 1,178,077* 3,960,000 7,280,000 13,120,000 No.1 x No.4 /1006 Individual Data Use per day Mbyte 3,000 3,000 3,000 3,0007 Individual Data Use per day Mbit 24,000 24,000 24,000 24,0008 Total Data Per day Mbit 28,273,848,000 95,040,000,000 174,720,000,000 314,880,000,000 No.5 x No.79 Necessary Bandwidth (Broadband User) Mbps 327,244 1,100,000 2,022,222 3,644,444 No.8/24/60/60
10 Narrowband user 15,266,784 25,740,000 38,080,000 45,920,000 No.2-No.511 Individual Data Use per day Mbyte 300 300 300 30012 Individual Data Use per day Mbit 2,400 2,400 2,400 2,40013 Total Traffic Per day Mbit 36,640,281,600 61,776,000,000 91,392,000,000 110,208,000,000 No.10 x No.1214 Necessary Bandwidth (Narrowband User) Mbps 424,077 715,000 1,057,778 1,275,556 No.13/24/60/6015 Necessary Bandwidth (Internal) Mbps 751,321 1,815,000 3,080,000 4,920,000 No.9+No.1416 Internal Connection Ratio 0.7 0.7 0.7 0.717 International Necessary Bandwidth Mbps 525,925 1,270,500 2,156,000 3,444,000 No.15 x No.1618 International Available Bandwidth Mbps 921,319*
Note:Figures with * comes from CCK Quarterly Sector Statistics Report Q3 2012/13 issued on July 2013 Figures colored in red comes from the assumption.
Source: JICA Study Team (JST) based on ITU statistics
0
500,000
1,000,000
1,500,000
2,000,000
2,500,000
3,000,000
3,500,000
4,000,000
2013 2018 2023 2030
Mbps
Year
International Necessary Bandwidth
Current bandwidth:921,319Mbps
Source: JICA Study Team (JST) Figure 8.5.4 International Communication Bandwidth
Capacity Demand
Assumption Broadband subscription :Linear increase Individual data usage per day :3 GByte (broadband user)
:300 MByte (narrowband user) International connection ratio :0.7
(Not all data go outward through the undersea fibre optic cables and satellite communications)

The Project on Integrated Urban Development Master Plan for the City of Nairobi in the Republic of Kenya
Nippon Koei Co., Ltd. 8-56 Final Report IDCJ Inc. EJEC Inc.
8.5.2 Development Policy
(1) Development Policy
Based on the study of the current conditions previously stated in Chapter 2, JST set up the following policies for the development of telecommunications in NCC to achieve Kenya Vision 2030 and the National Broadband Strategy.
1) High Speed and Reliable Communications Network and its Connectivity
Building reliable information and communications infrastructure is essential to develop the country and to improve the quality of life. Furthermore, it contributes to operating and maintaining other sector infrastructures effectively and reasonably. To realise this, all communication infrastructure layers including the national backbone communication network, the metro trunk communication network, and the access network - which is an interface with users, need to be improved. Similarly, the bottleneck of data stream should be solved by introduction of proper network equipment that can process the increasing data bandwidth that goes together with the expansion of internet users.
2) Collaboration amongst Governmental Players and Operators
Telecommunications network is a public infrastructure. Therefore NCC shall administer the construction, installation, and maintenance works conducted by the telecommunications contractors/operators, because telecommunications infrastructure partially occupying municipal roads or lands and antenna towers built operator-by-operator impair the urban landscape. Thus, the public-private sector partnership should be improved to optimise telecommunications infrastructure development in Nairobi City.
3) Policy, Regulation, and Institution Development
According to the enforcement of a new law after the elections in 2013, NCC is supposed to have the authority to consider and approve all development applications and grant all development permissions. Moreover, it is expected to control the use and development of land and buildings in the city area, and to have jurisdiction over the control of the use and development of land and infrastructure in the interests of proper and orderly development. For this reason, NCC is required to formulate and enforce the policy, regulations, and institutions when developing the telecommunications infrastructure.
4) Promotion of E-government
E-government delivers a next generation of administrative services that enable the share and utilisation of information and data amongst the national and local governments through computer network instead of the current administrative services conducted face-to-face through documents. To promote E-government, raising the level of information and communications technology (ICT) literacy education and developing an exclusive government network that is not affected by data stream of the private sector, are recommended to be introduced.
Development Policy 1. High Speed and Reliable Communications Network and its Connectivity, 2. Collaboration amongst Governmental Players and Operators, 3. Policy, Regulation, and Institution Development, 4. Promotion of E-government, and 5. Protecting Citizens from Disasters and Emergencies.

The Project on Integrated Urban Development Master Plan for the City of Nairobi in the Republic of Kenya
Nippon Koei Co., Ltd. 8-57 Final Report IDCJ Inc. EJEC Inc.
5) Protecting Citizens from Disasters and Emergencies
Disasters and emergencies occur without previous notice and they usually cause damage to the people as well as damage to the infrastructure. In Kenya, most people receive disaster information through the media such as television and radio broadcasting. Most people in the disaster zone may panic for lack of information brought on by the unavailability or disability of the media due to the disaster. Thus, correct disaster information and its prompt dissemination are essential to minimise the damage of the disaster and to prevent a secondary disaster which may occur sequentially.
(2) Development Goals
According to the development policy, JST’s development goals for the telecommunications sector are as follows:
8.5.3 Priority Projects
(1) Projects Necessary to Achieve the Developmental Goals
The JST proposes nine projects to be carried out by 2030 to achieve the goals set for the telecommunications sector; they are as follows: These projects are divided into two categories. The six projects from No. 1 to No. 6 are to be carried out for telecommunications infrastructure development. Meanwhile, the three projects from No. 6 to No. 9 are for institutional development. Since Project 1 is on communication network development, the operators shall be fully involved. Projects 2 to 9, on the other hand, shall be implemented with government initiative because these projects promote e- government and improve government services to Nairobi City residents. Outline, objectives, and effects of each project are explained in this section.
1) Fibre Optic Trunk Communication Network in Nairobi City
Upgrading the optic fibre trunk network for the metro trunk communications and local access network is essential to solve the telecommunications infrastructure issues. Similarly, the undersea cables landing at Mombasa should be enhanced to remove the fundamental bottleneck that decreases internet speed. Enhancement of communications network contributes not only to the improvement of internet user convenience but also to the introduction of the
Projects to Achieve the Development Goals 1. Optic Trunk Communication Network in Nairobi City 2. Common Infrastructure for Operators 3. Introduction of a Dedicated Government Network amongst Government Offices 4. Disaster Information Gathering and Dissemination System 5. Local Government Data Centre and Cyber Security 6. Upgrading the National Addressing System 7. ICT Literacy Education for Citizens 8. Establishment of Framework on Construction Supervision and Maintenance Works 9. Infrastructure Sharing Policy
Development Goals 1. Expansion of Broadband Services to the Whole Area under Nairobi City County, 2. Provision of Prompt and Reliable Governmental Administrative Services to Nairobi City
Citizens, 3. Establishment of the National Infrastructure Sharing Policy, 4. Improvement of the Digital Literacy of Nairobi City Citizens, and 5. Disaster Prevention Information Dissemination to the Citizens.

The Project on Integrated Urban Development Master Plan for the City of Nairobi in the Republic of Kenya
Nippon Koei Co., Ltd. 8-58 Final Report IDCJ Inc. EJEC Inc.
Intelligent Transport Systems (ITS) which provide innovative services to different modes of transport and traffic management and enable various users to be better informed and make safer, more coordinated, and 'smarter' use of transport networks.
This development, the conceptual diagram of which is shown in Figure 8.5.5, is in line with the global trends of ICT as well as with the development policy. The initiative to develop the fibre optic trunk communications network should be taken on by the operators.
Source: JICA Study Team (JST)
Figure 8.5.5 Conceptual Diagram of the Telecommunications Network
i) Objectives
To establish high speed networks, To improve connectivity for users, and To upgrade submarine cable capacity.
ii) Effects
Increase in the number of internet users, Enhanced convenience in the use of the internet, Promotion of the citizens' participation in e-government (access to on-line government
services), and Promotion of ITS.
iii) Development Items
Upgrade the trunk communications network and accessibility Network construction
amongst the urban cores and sub-centres by connecting fibre optic cables laid along the roads and railways as shown in Figure 8.5.6.
Upgrade the networking equipment including optical transmission device, router, switch, and network control unit to expand the network bandwidth capacity.
Introduce the Long-Term Evolution (LTE) for accessibility improvement.
Upgrade undersea cable bandwidth capacity The government should assist operators to expand the undersea cable bandwidth
capacity.
Source: JICA Study Team (JST) Figure 8.5.6 Network Construction Plan

The Project on Integrated Urban Development Master Plan for the City of Nairobi in the Republic of Kenya
Nippon Koei Co., Ltd. 8-59 Final Report IDCJ Inc. EJEC Inc.
iv) Responsible Organisations
Operators in partnership with the Ministry of Information Communications and Technology (MOICT)
2) Common Infrastructure for Operators
Currently, operators deploy their telecommunications infrastructure based on their own marketing strategy. Thus, cable laying works under the road conducted by every operator affect road traffic and increase the workload of officers in the road sections of NCC. On the other hand, a few antenna towers are shared based on the rent paid by a borrower to the owner of a tower. However, the majority of the antenna towers are installed by individual operators. These antenna towers have an adverse effect on urban landscape.
The JST recommends the development of a common infrastructure for operators to facilitate the expansion of telecommunications services. JST proposes a common underground duct for cables and shared antenna towers for mobile base transceiver stations and fixed wireless access to be shared amongst operators. Comprehensively, common infrastructure will not only expand the telecommunications services but also reduce operators' burden for its expansion.
The common underground duct buried under the ground accommodates indispensable primary infrastructure that includes communication and power cables. NCC should charge common underground duct users a fee to operate and maintain the common underground duct instead of applying for the wayleaves fee for laying the cable under the road. The common underground duct is environmentally friendly and leads to a reduction in road construction and provides for an urban infrastructure that is resistant against disasters.
Shared antenna towers are proposed to be operated and maintained by local governments such as NCC or a third party partially funded by public sources. It would be particularly beneficial because operators would provide their telecommunications services nationwide, not limited to the Nairobi City area. Shared antenna towers will improve urban landscape by reducing the number of antenna towers of individual operators and will promote effective land use. It is essential to expand the services with shared antenna towers to rural areas, because operators have a negative stance on offering their services there.
i) Objectives
To avoid uncoordinated infrastructure deployment by operators.
ii) Effects
Enhancement of the expansion of the telecommunications services, Coordinated land use, Improvement of urban landscape, Reduction of road construction and increase in road users’ satisfaction, Reduction of operators' burden for construction and maintenance works, Enhancement of the expansion of telecommunications infrastructure (operator's
investment), and Protection against vandalism.
iii) Development Items
Common underground ducts along trunk roads connecting the urban cores with the sub-centres Infrastructure to be accommodated: communications, power, water, and drainage
water; and Accommodation capacity of the telecommunications operators: over 16 operators.

The Project on Integrated Urban Development Master Plan for the City of Nairobi in the Republic of Kenya
Nippon Koei Co., Ltd. 8-60 Final Report IDCJ Inc. EJEC Inc.
Shared antenna towers in rural areas to promote operators' expansion of mobile service areas
iv) Responsible Organisation
NCC
Table 8.5.5 Current Operators Who have their Own Infrastructure
1 Airtel Networks Kenya Limited 2 Accesskenya Group Limited 3 Alldean Satellite Networks (Kenya) Limited 4 Bell Western Limited 5 Essar Telecommunications Kenya Ltd 6 Frontier Optical Networks Limited 7 Gateway Telecommunications (kenya) Limited 8 Iway Africa Kenya Limited 9 Jamii Telecommunications Limited 10 Kenya Data Networks Limited 11 Mobile Telephone Networks Business Kenya Limited12 Safaricom Limited 13 Sea Submarine Communications Ltd 14 Simbanet Com Limited 15 Telkom Kenya Limited 16 Wananchi Group (Kenya) Limited
Source: JICA Study Team (JST) based on hearing survey to CCK
Source: JICA Study Team (JST) Figure 8.5.7 Network Construction Plan
3) Introduction of a Dedicated Government Network amongst Government Offices
This fibre optic network is developed exclusively for the use of government offices in order to share information and data, to promote effective administrative management as well as to provide prompt administrative services to citizens. Currently, the network for 38 national government buildings is connected through a telecommunications operator's leased network. However, it has a high risk for communication failure in case of disasters and emergencies due to the concentration of communication traffic on the telecommunications operator's network.
Efficient administrative management needs a reliable and sound exclusive network built on fibre optic cables connecting government offices, its site offices, ministries, and agencies. This also promotes prompt and effective implementation of administrative management and provides the groundwork to introduce e-government. It is considered reasonable and proper that the NCC Headquarters is connected to the Ministry of Devolution and Planning as these two organisations have a close relationship with each other in terms of local administration affairs. The fibre optic cables have the advantage, which is ordinarily consisting of multiple cores. Some cores are used for the government network, while the other cores can be leased to operators or private companies for their network expansion.
Figure 8.5.8 shows a conceptual diagram on the introduction of the dedicated government network.
i) Objectives
To establish a dedicated government network unaffected by the private sector data streaming; and
To share information amongst government offices, its site offices, ministries, and agencies.
ii) Effects
Prompt and effective implementation of administrative management, Provision of prompt administrative services to citizens,

The Project on Integrated Urban Development Master Plan for the City of Nairobi in the Republic of Kenya
Nippon Koei Co., Ltd. 8-61 Final Report IDCJ Inc. EJEC Inc.
Implementation of an efficient business continuity planning (BCP) during disasters/emergencies ,
Basis for the introduction of e-government, Promotion of ITS by information sharing, and Fibre optic core lease.
iii) Development Items
Introduction of intranet in NCC, Introduction of the NCC internal dedicated fibre optic network including site offices, Connection between the NCC headquarters and the national government (Ministry of
Devolution and Planning), and Upgrading the existing national government network connecting the national
government offices to a dedicated fibre optic network.
iv) Responsible Organisations
NCC for NCC internal dedicated fibre optic network and intranet, and MOICT for a dedicated national government fibre optic network.
Source: JICA Study Team (JST) Figure 8.5.8 Conceptual Diagram of a Dedicated Government Network for Government Offices
4) Disaster Information Gathering and Dissemination System
Widespread and coinstantaneous information dissemination helps citizens evacuate to safety in case of disasters or emergencies; hence, the disaster information gathering and dissemination system is proposed to be introduced in NCC.
Currently, the Kenya Meteorological Department and the Kenya National Disaster Operation Centre are in charge of meteorological information and river water level information concerning disaster prevention. To improve information dissemination, it is recommended that

The Project on Integrated Urban Development Master Plan for the City of Nairobi in the Republic of Kenya
Nippon Koei Co., Ltd. 8-62 Final Report IDCJ Inc. EJEC Inc.
NCC disseminates information to citizens through various ICT equipment including internet, message boards, and public megaphones. NCC needs to share the collected information with the relevant organisations through the dedicated government network previously mentioned. Furthermore, it is recommended that NCC should have its own observation station to stay informed about the current rainfall and water level conditions in the city area. The rainfall and water level information observed at the site will be sent to NCC Headquarters at regular intervals through dedicated wireless radio communications. When the rainfall and river water levels rise and there is a potential for flooding, the NCC Headquarters will announce the information on rising water levels to give notice in order to evacuate the residents living near the river.
i) Objectives
Widespread and coinstantaneous information dissemination to citizens
ii) Effects
Protection of lives and property, and Provision of regular public announcements.
iii) Development Items
Rainfall and river water level information observation and telemetric information transmission system with security fence, and
Wireless information dissemination including outside message boards and public megaphones with security fence.
iv) Responsible Organisation
NCC
Source: JICA Study Team (JST)
Figure 8.5.9 Conceptual Diagram of the Disaster Information Gathering and Dissemination System

The Project on Integrated Urban Development Master Plan for the City of Nairobi in the Republic of Kenya
Nippon Koei Co., Ltd. 8-63 Final Report IDCJ Inc. EJEC Inc.
5) Local Government Data Centre with Cyber Security
The data centre is a centralised repository, either physical or virtual, for the storage, management, and dissemination of data and information. On the national government level, the Government of Kenya has built a government data centre for processing and storage of government applications and data through the Directorate of e-Government. The national governmental data centre implementation started in 2008 and is now ready to host government systems and services. Pursuant to the national government level, it is recommended that NCC set up their local government data centre. For efficient data exchange between the local government data centre and NCC, the dedicated government network can be utilised effectively to centralise the governmental information in the data centre. The conceptual drawing of the local government data centre is incorporated in Figure 8.5.8.
In addition, cyber attacks of fraudulent access and distributed denial of service (DDoS) have hit and damaged the intranet system of companies and government offices and concurrently might have caused a leak of confidential information or an organisation’s defamation. Cyber attack protection does not only serve to block an attack from outside of the intranet, but also includes countermeasures which are premised on intrusion into the intranet (Figure 8.5.10).
i) Objectives
To centralise data and information, and To protect data and information against cyber attacks.
ii) Effects
Ensuring the security of government information and data, Efficient implementation of administrative management, Optimal use of the human resources, and Building a society with a sense of security.
iii) Development Items
NCC data centre
iv) Responsible Organisation
NCC
Source: JICA Study Team (JST)
Figure 8.5.10 Cyber Security
Countermeasures against cyber attacks are categorised into three types, namely, technical, human, and physical countermeasures. The methodologies of each countermeasure are proposed as shown in Table 8.5.6.

The Project on Integrated Urban Development Master Plan for the City of Nairobi in the Republic of Kenya
Nippon Koei Co., Ltd. 8-64 Final Report IDCJ Inc. EJEC Inc.
Table 8.5.6 Countermeasures against Cyber Security Item Methodology
Tech
nica
l Cou
nter
mea
sure
System Update the operating system and install security patch on personal computers
Introduce user authentication system Apply strict access control to network resources
Network Monitor the network and detect malfunctions Install firewall to avoid intrusion from outside Install the Intrusion Detection System (IDS) and Intrusion Prevention
System (IPS) for prompt detection and intrusion prevention Data Security Encipher data and hard disk Virus Install antivirus software
Update virus definitions
Hum
an
Cou
nter
mea
sure
Information Security Policy
Establish an information security policy Compliance with the information security policy
Internal Rule Stipulate ethical codes and punitive clauses to prevent improper use Information Security Education
Raise awareness about the importance of information security
Password Control Periodic renewal of passwords Select a difficult password
Phy
sica
l C
ount
erm
easu
re Disaster
Earthquake resistance for buildings Fire prevention system and fire alarm box Waterproofing floor, wall, and ceiling
Crime Locking premises, building, and room Entering/leaving record system and monitoring camera
Equipment Trouble System redundancy Data backup
Source: JICA Study Team (JST)
6) Upgrading the National Addressing System
The National Addressing System is a database and provision system to facilitate identification of citizens, revenue collection, improved city management, and provision of efficient rescue services. The system would also assist the provision of security and utility services, and a host of other services including efficient delivery of postal/courier items. There is a system for identifying streets, buildings, and plots. However, the existing system is unable to keep up with the pace of urbanisation. As a result, most of the streets in urban areas have no names or address.
The outline of the National Addressing System is described below. Basic data for the system consisting of property number, name of landlord and property owner, street name, and its geographical coordinates, etc. are given by each county and stakeholder including power and water utility companies and telecommunications operators. Each county sends the data to a processing server that will be installed in MOICT. MOICT will manage the data for information provision to relevant organisations such as postal/courier operators, emergency/security service organisations, and tax office. Similarly, information on residents shared by the stakeholders will be used to improve the accuracy of the information sent by each county. Each county should collect and provide the data necessary for the system early on to make the system useful.
i) Objectives
To make a property and road database by linking geographical coordinates, and To provide information to relevant organisations.
ii) Effects
Efficient city management, Speedup of administrative services, and Facilitate identification of citizens, revenue collection, and provision of efficient rescue
services.

The Project on Integrated Urban Development Master Plan for the City of Nairobi in the Republic of Kenya
Nippon Koei Co., Ltd. 8-65 Final Report IDCJ Inc. EJEC Inc.
iii) Development Items
National Addressing System including data gathering and provision
iv) Responsible Organisations
MOICT
Source: JICA Study Team (JST)
Figure 8.5.11 Upgraded National Addressing System
7) ICT Literacy Education for Citizens
With reference to the introduction of the dedicated government network connecting government offices and the current ICT education programme in which MOICT plans to distribute computers to all pupils attending primary school in 2014, it is essential to improve the officers' ICT literacy. Consequently, it will promote efficient administrative management through the dedicated government network as well as raise citizens' ICT literacy to achieve social and economic benefits based on improved productivity and further promote e-commerce.
People who have low ICT literacy are not familiar with computers. Therefore, it is necessary to provide basic ICT education such as what computers are and how they work (Table 8.5.7). Operating word processing, spreadsheet, and presentation software are the minimum ICT literacy requirement for productivity improvement and effective city management.
i) Objectives
To improve the citizens' ICT literacy.
ii) Effects
Prompt and effective implementation of administrative management, Job creation, Growth of investment opportunities, and Access to online government services.
MOICTNational Addressing System
Nairobi County
•Property number•Landlord, property owner•Street name•Land reference number•Name of the building•Geographical coordinates of the property
47 counties in Kenya
Database server
GIS server
WEB server
Postal/Courier Operators•Door to door delivery service•Improving of delivery speed and accuracy•Facilitating e-commerce
Emergency / security Services•Increase of dispatching speed and accuracy
Tax Office•Efficient tax collection
Centralization
InformationProvision
Power CompanyWater companyTelecommunication Company
•Address•Resident
Stakeholder
Processing server

The Project on Integrated Urban Development Master Plan for the City of Nairobi in the Republic of Kenya
Nippon Koei Co., Ltd. 8-66 Final Report IDCJ Inc. EJEC Inc.
iii) Development Items
The ICT Department is in charge of ICT literacy education for government officers and citizens.
ICT literacy education for students in primary and secondary schools is under the authority of the Ministry of Education.
iv) Responsible Organisations
NCC in collaboration with MOICT and MOE
Table 8.5.7 Basic ICT Literacy Education Step Content
1.Computer Fundamentals Why do we need computers Major computer components Computer terminologies Performance and functions Operating system
2. Internet and World Wide Web
About the internet How to operate browser softwares E-commerce How to send and receive e-mail messages
3.Raise Productivity through the Use of Computers
Word processing Spreadsheet Presentation Database
4.Security and Privacy Outlines of computer security and privacy Privacy protection Securing computer with latest security conditions Computer ethics
Source: JICA Study Team (JST)
8) Establishment of a Framework on Construction Supervision and Maintenance Works
The quality of construction or maintenance works for telecommunications infrastructure are various and nonconstant. This comes from insufficiency of regulations or codes to define the procedure of the works. Meanwhile due to the expansion of the jurisdiction of NCC based on the enforcement of the new law after the election in 2013, NCC was supposed to have the power to consider and approve all development applications and grant all development permissions, and control the use and development of land and buildings in the city area. In this situation, in order to upgrade the quality of the telecommunications infrastructure works, the regulations and codes for developing supervision and maintenance works on telecommunications infrastructure should be strengthened and strictly complied with. In view of this, NCC has the responsibility for managing and controlling the works without depending on operators and contractors.
i) Objectives
Improvement of construction and maintenance works’ quality.
ii) Effects
Prolonging the life of infrastructure, Improved reliability of telecommunications infrastructure, Reduction of maintenance costs, and Promotion of cooperation amongst operators, contractors, and NCC.
iii) Development Items
Framework on Construction Supervision and Maintenance Works.

The Project on Integrated Urban Development Master Plan for the City of Nairobi in the Republic of Kenya
Nippon Koei Co., Ltd. 8-67 Final Report IDCJ Inc. EJEC Inc.
Source: JICA Study Team (JST)
Figure 8.5.12 Framework on Construction Supervision and Maintenance Works
iv) Responsible Organisation
NCC
9) Infrastructure Sharing Policy
The introduction of common infrastructure provides benefits to both NCC and the operators in terms of cost, infrastructure management, urban landscape, and future planning of urban development. With reference to the introduction of common infrastructure, JST proposes to set up an operation and maintenance policy for each operator to use the common infrastructure fairly and efficiently as well as for NCC to administer it securely and effectively. Since the properties of various operators will be committed to the common infrastructure, NCC should operate the common infrastructure responsibly according to the O&M policy.
i) Objectives
To consolidate management of common infrastructure, and To set the methodology and procedures for the common infrastructure.
ii) Effect
Effective infrastructure management
iii) Development Items
Infrastructure sharing policy Administration and management of common infrastructure, Formulate application and operation procedures for common infrastructure users, Equipment, cables, and related apparatus allowed to be installed on common
infrastructure, Loss and damages and dispute treatment, and Cost sharing for construction and maintenance of common infrastructure.
iv) Responsible Organisation
NCC
Application procedure for construction contractors and its evaluation criteria
Necessary documents (location map, working drawing) Construction coordination to avoid excavation in the
same zone
Design change request procedure Quality control methodology (stepwise inspection)
Completion report (as-built drawing, inspection report) Management of the latest deployment information on the
infrastructure including not only telecommunications but also power, water, and sewage
Pre-construction Stage
Construction Stage
Construction Completion Stage
Feedback

The Project on Integrated Urban Development Master Plan for the City of Nairobi in the Republic of Kenya
Nippon Koei Co., Ltd. 8-68 Final Report IDCJ Inc. EJEC Inc.
(2) Priority Projects
1) Selection of Priority Projects
From amongst the nine projects, five were selected for priority implementation based on their urgency, the rate of involvement of NCC, and the range of beneficiaries that can be reached. Projects that receive high evaluation scores are selected as priority projects.
As a result of the evaluation, JST proposes the prompt implementation of the following five projects. The evaluation results are shown in Table 8.5.8.
Table 8.5.8 Evaluation of the Project
Project UrgencyScore
NCC'sinvolvement
Score
Range of Beneficiaries ofthe project(Direct benefit)
Score
EvaluationScore
Note
1. Optic Trunk Communication Network in NairobiCity
High 2 Middle 1NCC/Operator/Government/User
2 5 Selected
2. Common Infrastructure for Operators High 2 High 2 NCC/Operator 1 5 Selected
3. Introduction of Dedicated Government Networkamong Government Offices
High 2 High 2 NCC/Government 1 5 Selected
4. Disaster Information Gathering andDisseminating System
High 2 High 2 NCC/User 1 5 Selected
5. Government Data Center with Cyber Security Middle 1 High 2 NCC 0.5 3.5
6. Upgrading National Addressing System Middle 1 Middle 1 NCC/Government 1 3
7. ICT Literacy Education for Citizens Middle 1 High 2 User 0.5 3.5
8. Establishment of Framework on ConstructionSupervision and Maintenance Works
Middle 1 High 2 NCC/Operator 1 4
9. Infrastructure Sharing Policy High 2 High 2 NCC/Operator 0.5 4.5 Selected
Note: Evaluation scores High:2 pt.Middle:1 pt.
High:2 pt.Middle:1 pt.
4 players: 2 pt.3 players: 1.5 pt.2 players: 1 pt.1 player: 0.5 pt.
Source: JICA Study Team (JST)
2) Evaluation
Each project is evaluated based on the following: a) urgency, b) role of NCC to the initiative, and c) beneficiary of the project. Contents of the evaluation conditions are explained below.
i) Urgency
Either "High" or "Middle" is put for each project based on its urgency. "High" is applied to a project that needs to commence as soon as possible in consideration of the current condition of the telecommunications sector. The evaluation chart is presented in Table 8.5.8.
ii) NCC’s Involvement in the Implementation of the Project
To evaluate NCC’s involvement in the development of the project, similarly either "High" or "Middle" mark is put for each project. "High" is marked to a project where NCC should be involved in its implementation. JST proposes that NCC should be involved in the implementation of the following projects:
Priority Projects 1. Optic Trunk Communication Network in Nairobi City 2. Common Infrastructure for Operators 3. Introduction of Dedicated Government Network amongst Government Offices 4. Disaster Information Gathering and Dissemination System 5. Infrastructure Sharing Policy

The Project on Integrated Urban Development Master Plan for the City of Nairobi in the Republic of Kenya
Nippon Koei Co., Ltd. 8-69 Final Report IDCJ Inc. EJEC Inc.
Project No.2: Common Infrastructure for Operators
Project No.3: Introduction of Dedicated Government Network amongst Government Offices
Project No.4: Disaster Information Gathering and Dissemination System
Project No.5: Local Government Data Centre and Cyber Security
Project No.7: ICT Literacy Education for Citizens
Project No.8: Establishment of Framework on Construction Supervision and Maintenance Works
Project No.9: Infrastructure Sharing Policy
iii) Range of Beneficiaries of the Project
The projects are also evaluated according to the number of people they benefit. A high rating is given to projects that will benefit a large number of people.

The Project on Integrated Urban Development Master Plan for the City of Nairobi in the Republic of Kenya
Nippon Koei Co., Ltd. 8-70 Final Report IDCJ Inc. EJEC Inc.
Doris Severino, Kileleshwa Primary School (Rank 2 of Class 6)

The Project on Integrated Urban Development Master Plan for the City of Nairobi in the Republic of Kenya
Nippon Koei Co., Ltd. 9-1 Final Report IDCJ Inc. EJEC Inc.
CHAPTER9 CROSS-CUTTING ISSUES
9.1 Governance and Institution
9.1.1 Policy and Strategy for Institutions
Based on the issues raised in the previous sections, the policy and strategy on governance and institution are proposed. Details are shown below.
(1) Basic Policy for Institutional Strengthening
The basic policy for institutional strengthening includes strengthening “development control”, implementing “urban (spatial) development projects”, and enhancing “infrastructure development management”. Figure 9.1.1 illustrates an urban development mechanism to be developed for the implementation of the NIUPLAN.
Source: JICA Study Team (JST)
Figure 9.1.1 Institutional Framework to be Developed
(2) Strategy for Institutional Strengthening
1) Strengthening of development control: Comprehensive development control mechanism development
Development control mechanism including building control, land development control, and introduction of technical standard will be developed and their relationship will be clearly defined. The mechanism will also show procedure and responsible agencies.
Building control: building control is based on the building code to secure building safety which is also linked with the zoning regulations to contribute to the creation of urban
Integrated Urban Development Master Plan for the City of Nairobi
Development Control Urban (spatial) Development Projects
Infrastructure Management
Private Sector Promotion
Community Awareness
Urban Management Mechanism
Management Support Mechanism

The Project on Integrated Urban Development Master Plan for the City of Nairobi in the Republic of Kenya
Nippon Koei Co., Ltd. 9-2 Final Report IDCJ Inc. EJEC Inc.
environment. Strengthening of the building control management is important to provide housing with proper conditions such as safety and utility.
Land development control: land development control is for area development and based on land use zoning and technical standard.
Technical standard: technical standard shows infrastructure and facility and their standard for land development which can be developed for the entire Nairobi City or for each sub-centre. The technical standard will be used for land development permission process.
Source: JICA Study Team (JST)
Figure 9.1.2 Overview of the Development Control Mechanism
2) Facilitation of urban development schemes
Sub-centre development is proposed to realise the proposed structure plan (multicore development). In order to promote sub-centre development, the urban development scheme comprising spatial development together with infrastructure development has to be facilitated. In regard to an implementation body of urban development projects, the public sector (central government only/combination of central government and local government) is one option, and another option is the combination of public sector and private sector. In the latter situation, it is general that the public sector supports regulatory function such as public meeting and study on relaxation of the regulations. Typical types of urban development schemes include the “land readjustment project” and “land redevelopment project”.
Key features of the land readjustment project are summarised below.
Change and improvement of land condition,
Securing necessary public space,
Designation of the land readjustment project in urban planning,
Fair and transparent legal procedures,
Preservation of private land rights,
Consensus building amongst land right holders, and
Fair sharing of profit and cost.
One of the characteristics of the project scheme is that land owners can participate in the project and there is no land acquisition or relocation. Also, land owners can stay after the project is completed.
Land Development Control Land use zoning regulation Building facility, floor area
ratio, building coverage ratio Relation between site and
roads Restriction in fire protection
zone
Building Control Safety: structure, fire prevention,
building equipment Rules related to zoning
regulation
Technical Standard Facility requirement Development condition
Development Control Mechanism

The Project on Integrated Urban Development Master Plan for the City of Nairobi in the Republic of Kenya
Nippon Koei Co., Ltd. 9-3 Final Report IDCJ Inc. EJEC Inc.
Source: JICA Study Team (JST)
Figure 9.1.3 Image of the Land Readjustment Project
Urban redevelopment is another scheme used for urban development to moderate high-density urban area by verticalization. This scheme involves the relocation of businesses, demolition of structures, and relocation of people. This scheme is suitable for areas which are made up of a lot of small plots, because this scheme supports the right conversion between land ownership and floor ownership.
For the implementation of these schemes, land ownership, property value system, and floor value on multifloor building systems has to be developed.
3) Infrastructure development management mechanism
Infrastructure development management for urban development schemes requires coordination management and information sharing as shown below.
Coordination management
Quality control, coordination, and enforcement are key components of infrastructure management. An organisation or department must be nominated or established in the county government to oversee the allocation and sharing of infrastructure. This organisation will act to accomplish the following:
Streamline approvals for utilities according to a common system, Enforce the current two-year infrastructure audit requirement, Manage the costs of maintaining infrastructure by cost sharing amongst users, Agree on affordable charges for infrastructure provision, and Ensure quality control and reinstatements.
Information Sharing
Information sharing will ensure that updates in policy and infrastructure are consolidated with up to date spatial information and the management is well informed of it. Information sharing must begin with the formulation of a common geospatial database of existing and proposed infrastructure from all major service providers. There must also be civic engagement on environmental consciousness and public awareness on infrastructure including wayleaves. For quality control of information, mapping and development of common ducts and other survey projects must be consolidated and all mapping projects and professionals must uphold standards. However, the Survey of Kenya does not fill this role. Thus, as a guiding framework, the policies for data management must be created on unified data coordination and sharing of projects and designs. On this basis, the Survey of Kenya should preside and control the data management system.

The Project on Integrated Urban Development Master Plan for the City of Nairobi in the Republic of Kenya
Nippon Koei Co., Ltd. 9-4 Final Report IDCJ Inc. EJEC Inc.
4) Private sector promotion scheme
Private sector involvement is important for both development control and urban development. In order for effective urban management to come about, a mechanism in which the private sector can be widely involved has to be developed.
Development control: For effective execution of development control, the private sector including developers has to understand the rules. The control mechanism proposed in (i) above has to be disseminated to developers to ensure understanding of the rules.
Urban development: A public-private partnership (PPP) framework is often used for urban development. To regulate promotion of private sector development including an incentive for development, a clear definition of the government’s role in supporting private sector development has to be developed.
5) Develop information dissemination mechanism
All information for urban development management including the Nairobi Integrated Urban Development Master Plan (NIUPLAN), control measures, and development mechanism has to be openned to the public in view of improving public awareness and transparency for control and development. The website, which is developed for the strategic environmental assessment (SEA) procedure of this project, can be used as one of the tools for information dissemination. In addition, to disseminate the information, the Nairobi City County (NCC) has to provide civic education to promote awareness on urban development management rules.
6) Strengthen organisations for urban management
For securing the NIUPLAN implementation, urban management mechanism including NCC strengthening, coordination mechanism strengthening, and stakeholder strengthening have to be developed. The points in urban management strengthening are described below.
NCC strengthening: NCC plays an important role in the NIUPLAN implementation. The capacity of NCC in terms of skills and number has to be strengthened. Skills include development control, building control, and infrastructure development management. It is also necessary to increase the number of staff, particularly for development control in which more development permit applications are expected once the E-Permit System has been in full operation.
Coordination mechanism strengthening: Coordination amongst concerned agencies is crucial for infrastructure implementation. Coordination includes coordination within NCC, coordination between NCC and the national government, and coordination amongst county governments. NCC should take the initiative in establishing the coordination mechanism.
Stakeholder strengthening: Since stakeholder participation is guaranteed in the Constitution of Kenya and the NIUPLAN has been prepared through stakeholder participation, the stakeholder participation mechanism has to be developed for implementation. One of the methods is the development of community forum, through which communication between the community and NCC can be enhanced.
9.1.2 Capacity Development Plan
To realise integrated urban development based on the NIUPLAN, the capacity of human resources to execute the strategy for institution as mentioned in Subsection 9.1.1 should be developed.

The Project on Integrated Urban Development Master Plan for the City of Nairobi in the Republic of Kenya
Nippon Koei Co., Ltd. 9-5 Final Report IDCJ Inc. EJEC Inc.
The working group members have formulated the capacity development plan composed of the following six items: (1) target group, (2) target year, (3) goal, (4) approach, (5) activity, and (6) plan of operation.
Figure 9.1.4 illustrates a framework of capacity development plan composed of the abovementioned items (1) to (4).
Framework of Capacity Development Plan
(1) Target Group: - Core Target: Officials of the City Planning Department of NCC (Salary Scale Level:
1-12) - Subtarget: Officials of other concerned departments of NCC (including Public Works
and Infrastructure) (2) Target Year: i) Short Term: 2018, ii) Mid Term: 2023, iii) Long Term: 2030 (3) Goal: Long Term: To be able to implement urban development and management
consistent with the NIUPLAN (Goals for short term and mid term will be set after the long-term goal is set.) (4) Approach: 1. To fully understand the NIUPLAN 2. To acquire fundamental skills of urban development and urban management 3. To encourage internal trainings including on-the-job training (OJT) 4. To apply participatory methods to trainings 5. To strengthen monitoring and evaluation for capacity development
Source: JICA Study Team (JST) Figure 9.1.4 Framework of Capacity Development Plan
(1) Target Group
Through discussion in working groups, two different target groups have been identified. One is a core target group, to which the highest priority is given in capacity development. The officials of the City Planning Department of NCC are the core target group of capacity development. The other is a subtarget group, which is the second most important target group following the core target group.
While there are 18 salary scale levels in NCC, the working group members will focus on the officials of salary scale level (SSL) 1 to 12 to seek for efficient and effective capacity development. In the future, the outputs of capacity development of the officials of SSL 1 to 12 will trickle down to the officials of SSL 13 to 18.
Core Target Group: Officials (Salary Scale Level: 1-12) of the City Planning Department of NCC
Subtarget Group: Concerned officials of the following seven other departments of NCC:
(i) Public Works and Infrastructure Department,
(ii) Education, Youth Affairs, Sports, Culture, and Social Services Department,
(iii) Environment and Forestry Department,
(iv) Trade and Development Department,
(v) Finance and Economic Planning Department,
(vi) Governance and Administration Department, and
(vii) Justice and Inspectorate Department.

The Project on Integrated Urban Development Master Plan for the City of Nairobi in the Republic of Kenya
Nippon Koei Co., Ltd. 9-6 Final Report IDCJ Inc. EJEC Inc.
(2) Target Year
The target year of the capacity development plan should be set. The year of achieving the goals in Item (3) is the target year. It will be consistent with the target year of the NIUPLAN, since the capacity development plan is part of it. As such, the target year of capacity development is year 2030, which is the target year of the NIUPLAN. As benchmarks up to 2030, intermediate target years are also set such as the short-term goal and mid-term goal. The following are tentatively set as the target years of capacity development:
Short-term Target Year: 2018
Mid-term Target Year: 2023
Long-term Target Year: 2030
(3) Goal
Goal is the desirable and achievable state of capacity development by the target years. The thematic working group members will discuss how to set the goals for each target year in the succeeding thematic working group meetings.
According to the policy and strategy for institution as mentioned in Subsection 9.1.1, implementation of the NIUPLAN is the ultimate purpose of governance and institution. Capacity development is also required to contribute to the implementation of the NIUPLAN. To make more concrete statement of the goal, the JST proposes to divide the implementation of the NIUPLAN into urban development and urban management. Both notions of urban development and urban management include three pillars of the institutional strategy such as “development control”, “urban (spatial) development projects”, and “infrastructure development management”.
As such, JST proposes that the goal of capacity development plan in 2030, long-term target year, is “To be able to implement urban development and management consistent with NIUPLAN” in order to kick off further discussion with the thematic working group members for governance and institution. To be more precise, the indicator corresponding to the goal will also be discussed in the forthcoming study. The goals as benchmarks of the short-term and mid-term target years will be set based on the goal of the long-term target year to be discussed in the thematic working group.
(4) Approach
An approach is a method of achieving the goal. The approaches of the capacity development plan are methods to implement urban development and management through development control mechanism as shown in Figure 9.1.2. The approaches are closely connected with the issues of capacity development, which include both strengths and weaknesses of the current state of capacity development in NCC. The approaches are classified into three types, namely, i) contents refinement, ii) elaboration in method, and iii) improvement mechanism. The three approaches are described as follows:
i) Contents refinement is an approach to elaborate the contents of capacity development on what knowledge and skills should be acquired; ii) Elaboration in method is an approach to introduce new methods for capacity development on how to acquire knowledge and skills; and iii) Improvement mechanism is an approach to improve both contents and methods of capacity development. The relation between goal and approaches is shown in Figure 9.1.5.

The Project on Integrated Urban Development Master Plan for the City of Nairobi in the Republic of Kenya
Nippon Koei Co., Ltd. 9-7 Final Report IDCJ Inc. EJEC Inc.
Source: JICA Study Team (JST)
Figure 9.1.5 Relation between Goal and Approaches of Capacity Development Plan
1) Contents Refinement
Approach 1: To fully understand the NIUPLAN.
To achieve the goal, the target officials need to understand the NIUPLAN in full. Otherwise, urban development and management in Nairobi City might progress without consistency with the NIUPLAN. Since the NIUPLAN is a road map toward the vision, full understanding of it and frequently referring to it are crucial in keeping the related programmes and projects aligned with it.
The officials of both core target group and subtarget groups are required to understand the NIUPLAN.
Approach 2: To acquire fundamental skills of urban development and management.
It is necessary to acquire fundamental skills of urban development and management to achieve the goal. A system of urban development and urban management, linkage and position amongst the skills, basic concepts of development and management, are the fundamental skills. It will help the target officials to develop their capacities more by realising how each skill will work in urban development and urban management. The items mentioned in are the key items of urban development and management.
Now NCC has introduced various E-permits such as development permit, construction permit, and inspection of construction for land and building control under IFC support. Ensuring the operation and maintenance of the E-permit system should be attained through capacity
Goal: To be able to implement urban development and management that is consistent with the Integrated Urban Development Master Plan
i) Contents Refinement
Approach 1 To fully understand the NIUPLAN
Approach 2 To acquire fundamental skills of urban development and management
ii) Elaboration in Method
iii) Improvement Mechanism
Approach 4 To encourage internal training including OJT
Approach 5 To apply participatory methods to training
Approach 6 To strengthen monitoring and evaluation for capacity development
Approach 3 To adapt ICT skills to urban development and management

The Project on Integrated Urban Development Master Plan for the City of Nairobi in the Republic of Kenya
Nippon Koei Co., Ltd. 9-8 Final Report IDCJ Inc. EJEC Inc.
development of the officials of the Development Control Section, Enforcement Section, and Policy Implementation Section.
Approach 3: To adapt information and communications technology (ICT) skills to urban development and management.
To efficiently manage necessary information for planning and urban development, acquiring ICT skills is necessary. Now NCC is formulating a road map of ICT, so the ICT system to be developed in urban development and management should be consistent with the road map. The target officials should acquire skills of necessary software such as GIS, documentation, spreadsheet, and CAD. The officials of the Land Survey Section should be mainly targeted although the officials of other sections are also related.
2) Elaboration of Method
Approach 4: To encourage internal trainings including on-the-job training (OJT)
To acquire more practical skills rather than academic knowledge, applying on-the-job training (OJT) in capacity development should be encouraged. OJT provides learning opportunities through practice in the real world of urban development and management. In addition, internal trainings should be more encouraged. It is because the menu of internal trainings can flexibly meet the needs of the target officials. It is also expected that internal trainings can cover more practical contents than external trainings. The executive level staffs in the City Planning Department such as director, deputy director, and section manager, needs to lead the other target officials to carry out OJT.
Approach 5: To apply participatory methods to trainings
To entail successful capacity development and achieve the goal, active involvement by the target officials should be encouraged. A lecture, in which a trainer delivers ideas to trainees in one way, is a conventional method of trainings. However, the lectures have limitations to encourage active participation by the trainees. To overcome difficulty, participatory methods including workshops and group discussions are worth considering for active involvement. The Central Administration Section, in cooperation with the executive level of the City Planning Department, should organise training programmes with participatory methods.
3) Improvement Mechanism
Approach 6: To strengthen monitoring and evaluation for capacity development
Capacity development should be monitored and evaluated periodically to effectively and efficiently ensure that it is on the right track and to find ways to improve and enhance it. Without monitoring and evaluation, it is impossible to measure how far the goal has been achieved and judge if the programmes and activities are on the right track.
The Central Administration Section, in cooperation with the executive level staff of the City Planning Department, should monitor and evaluate the capacity development activities periodically, to improve the programmes.
The results of monitoring and evaluation should also be reflected in consideration of the reforms in the organisation and institutional system. For example, the performances of the concerned sections of development control, namely, i) Development Control Section for building permit, ii) Enforcement Section for building inspection, and iii) Policy Implementation System for development permit are to be monitored and evaluated. Then, how capacity development contributes to the performance of their tasks such as operating the E-permit system should be scrutinised. The monitoring and evaluation results might imply

The Project on Integrated Urban Development Master Plan for the City of Nairobi in the Republic of Kenya
Nippon Koei Co., Ltd. 9-9 Final Report IDCJ Inc. EJEC Inc.
some constraints such as systems, organisations, and institution, in which repeating capacity development is difficult to overcome.
Through this approach, capacity development starting from individual level aims to stretch out to the organisational and institutional levels.
(5) Activity
To execute the policy and strategy for institution and the capacity development approaches mentioned above, the activities shown in Table 9.1.1 will be taken in capacity development. Categories 2 to 6 are related with the policy and strategy for institutions, and Categories 1 and 7 as well as possible training methods for each category are added to support the capacity development approaches. The activities will also be discussed and elaborated in the forthcoming thematic working group meetings.
Table 9.1.1 Activities and Methods on Capacity Development Category of Capacity
Development Training Items (Activities) Possible Training Method
1. Introduction 1-1 NIUPLAN 1-2 Overview of Urban Development and Urban Management
Lecture
2. Development Control
2-1 Building Control 2-2 Land Development Control 2-3 Technical Standard
Lecture, OJT
3. Urban (Spatial) Development Projects
3-1 Land Readjustment 3-2 Land Redevelopment 3-3 Funding Schemes
Lecture, OJT
4. Infrastructure Management
4-1 Coordination Management 4-2 Information Sharing
Lecture, OJT
5. Community Awareness 5-1 Cooperation with Civil Society 5-2 Communication with Civil Society
Lecture, OJT, Group Discussion, Workshop
6. Private Sector Promotion
6-1 Public-Private Partnership (PPP) 6-2 Communication with the Private Sectors
Lecture, OJT, Group Discussion, Workshop
7. Supporting Skills 7-1 Data Management/GIS 7-2 Monitoring and Evaluation
Lecture, Group Discussion, OJT
Source: JICA Study Team (JST)
(6) Plan of Operations
Table 9.1.2 shows an image of the plan of operations for the activities (sample). The plan of operations shows project specifics such as the expected results, schedule, person-in-charge, parties responsible for implementation, necessary resources and equipment, and costs for each activity. The plan of operations is an effective tool for implementation and management for capacity development, and it provides important data for monitoring and evaluation. The plan of operation will also be discussed in the forthcoming thematic working group meetings for governance and institution.

The Project on Integrated Urban Development Master Plan for the City of Nairobi in the Republic of Kenya
Nippon Koei Co., Ltd. 9-10 Final Report IDCJ Inc. EJEC Inc.
Table 9.1.2 Image of Plan of Operations for Capacity Development Activities (Sample) Activities Expected Result Schedule Person in
Charge Target Group
Materials and Equipment
Estimated Cost
1. Introduction 1-1 NIUPLAN Consistent urban
development and urban management with the NIUPLAN
Once a year at the beginning of each fiscal year
Director of the City Planning Department
City Planning Department of NCC Concerned Department of NCC
Hardcopy of the NIUPLAN Presentation of summary
(To be estimated)
1-2 Overview of Urban Development and Urban Management
Acquire broad viewpoints for executions of urban development and urban management
Once a year at the beginning of each fiscal year
Deputy Director of the City Planning Department
City Planning Department of NCC
Text introducing overview of urban development and urban management Presentation of summary
(To be estimated)
Source: JICA Study Team (JST)
9.1.3 Priority Projects
Priority projects are proposed for institutional and organisational aspects as well as human resources development to enhance urban development management.
(1) Urban Development Mechanism Development
Priority of institutional strengthen is development of urban development mechanism. As described in Sections 6.4.5 and 6.4.6, Central Business District (CBD) development and sub-centre are identified as urban development, which is expected to form urban structure and to improve urban conditions through spatial and infrastructure development.
Urban development mechanism includes land re-adjustment project and land re-development project, covering spatial development, infrastructure development, and financial arrangement, have to be developed. In addition, incentive measure to promote CBD and sub-centres, including conversion of the development right, relaxation of plot ratio, and other measures will be developed.
(2) Organisational strengthening
The priorities of organisational strengthening is NCC strengthening, stakeholder strengthening, and intercounty strengthening.
1) NCC strengthening
The objective is to strengthen NCC capability on urban management including development control, coordination, and infrastructure development.
Components of the NCC strengthening are shown below.
Increase in the number of staff for development permit and building permit to accommodate increase in the number of permit applications once the e-permit system has been in full operation. Also, increase in the number of inspectors to monitor construction for completion certificate;
Strengthen participatory mechanism including formulation and management of community forum; and
Conduct training on urban management including planning, development control, and infrastructure management.

The Project on Integrated Urban Development Master Plan for the City of Nairobi in the Republic of Kenya
Nippon Koei Co., Ltd. 9-11 Final Report IDCJ Inc. EJEC Inc.
2) Stakeholder strengthening
Community participation from planning stage to implementation stage is required to understand the importance of urban management. The objective of stakeholder strengthening is to establish and manage community groups (forum) as a participatory mechanism which will be utilised for urban management.
Components of the stakeholder strengthening are shown below.
Community groups (forum) will be established in each district in Nairobi City to participate in urban development including participation in the detailed plan formulation, sub-centre development, and infrastructure development.
Training will be conducted to enhance understanding of urban management including necessity of building permit, development permit, and infrastructure development.
3) Intercounty coordination mechanism
Intercounty coordination was raised as one of the key elements for the NIUPLAN implementation. The objective is to develop intercounty coordination mechanism for promotion of efficient infrastructure development. Intercoordination mechanism should function as coordinating body for infrastructure development such as roads, water supply, drainage, and solid waste management, which are physically linked with neighboring counties.
(3) Human Resources Development
To support the institution and organisation mentioned above, human resources development through providing learning opportunities is necessary. The NCC officials should acquire knowledge and skills of urban development and management with supporting ICT skills such as GIS and CAD through lecture, OJT, and group discussions. The NCC officials are expected to utilise what they learn through human resources development for strengthening institution and organisation.
9.2 Industrial Development
9.2.1 Industrial Development Vision of Kenya for 2030
(1) Foundations of Socioeconomic Development
Kenya Vision 2030 stipulates that the three pillars, economic, social, and political, are anchored on the foundations of the following: (i) macroeconomic stability; (ii) infrastructural development; (iii) science, technology, and innovation (STI); (iv) land reforms; (v) human resources development; and (vi) security and public sector reforms.
(2) Priority Sectors
Kenya Vision 2030 sets the following six priority sectors:
Tourism, Agriculture and Agro-industries, Wholesale and Retail Trade, Manufacturing, IT enabled services (previously known as business process off-shoring), and Financial Services.

The Project on Integrated Urban Development Master Plan for the City of Nairobi in the Republic of Kenya
Nippon Koei Co., Ltd. 9-12 Final Report IDCJ Inc. EJEC Inc.
(3) Major Project Proposals
In order to strengthen the foundations of socioeconomic development and the priority sectors, the following projects are proposed (Table 9.2.1 and Table 9.2.2).
Table 9.2.1 Major Investment Projects of Kenya Vision 2030 Sector Major Investment Projects
(1) Energy Sector
(1.1) Olkaria V Geothermal Power Generation Plant (2X70 MW) (1.2) Isiolo 50 MW Wind Power (1.3) Liquefied Natural Gas (LNG) Storage and Regasification Facility with
Associated Power Generation (1.4) Transformer Manufacturing (1.5) Solar PV Panels Manufacturing (1.6) Mombasa Petroleum Trading Hub - Single Buoy Mooring (SBM)
(2) Transportation Sector (2.1) Nairobi City Commuter Rail (2.2) Railway Cities (2.3) Lamu Port (LAPSSET- Lamu Port Southern Sudan Ethiopia Transport Corridor Project) (2.4) Thika Toll Road (completed as a non-toll road)
(3) ICT Sector (3.1) Konza Technology City (4) Tourism Sector (4.1) Eco Lodges and Tourism Adventure Facilities
(4.2) Revolving Restaurant (at Kenyatta International Convention Centre (KICC)) (4.3) Amusement Park and 5-Star Hotel at Bomas of Kenya
(5) Real Estate - Recreation, Sports, Tourism, and Heritage Social Infrastructure
(5.1) Nairobi Galleries at the Nairobi National Museum (5.2) International Sports Academy in Kasarani
(6) Agriculture (6.1) Establishment of a Fertilizer Plant (6.2) Privatisation of Sugar Factories (6.3) LAPSSET Corridor Projects (6.3.1) Establishment of a Sugar Factory (6.3.2) Establishment of Mango Production and Processing (6.3.3) Establishment of the Beef Industry (6.4) Rice Irrigation Scheme
Note: The above major investment projects of Kenya Vision 2030 were presented during the Investment Summit on 31 July 2012 in London. Source: Kenya Vision 2030 website (2013)
Table 9.2.2 Other Project Proposals related to Kenya Vision 2030 presented by the Kenya Investment Authority Project Category Remarks
(1) Mining and geology roadmaps - Oil and gas exploration and investment opportunities (2) Telecommunications and ICT - Telecommunications licenses, procedures, and costs (3) Tourism development - Conference tourism
- Betting control and licensing board roadmaps - Heritage tourism - Tourism in protected areas - Kenya Wildlife Service (KWS) roadmap
(4) Development of niche tourism product
- This initiative introduces new high-value niche products such as cultural, eco-sports and water-based tourism. There have been notable achievements in the period under review. About 200 high-quality home stays have been licensed. The repairing and upgrading of the Kasarani Sports Complex is complete with a view to enhance sports tourism.
(5) New Towns - Tatu City - New towns proposed in the Spatial Planning Concept for Nairobi Metropolitan Region
(6) Agricultural development - Horticulture development - Coffee industry development - Diary - Tea
The Project on Integrated Urban Development Master Plan for the City of Nairobi in the Republic of Kenya
Nippon Koei Co., Ltd. 9-13 Final Report IDCJ Inc. EJEC Inc.
Project Category Remarks (7) Financial business development - Insurance license industry roadmap
- Opportunities for investors at the Nairobi Securities Exchange - Roadmap to conducting banking, financial institution, and mortgage finance
(8) Deepening of capital markets (Capital Markets Roadmaps)
- To promote long-term investments and create a conducive environment to fund Kenya Vision 2030 through the capital markets.
(9) Industrial property institute road maps
- Upgrading the Industrial Property Institute
(10) Development of five small and medium enterprises (SME) parks
- A pilot metal SME park will be located in Nairobi City due to its proximity to most important markets.
- Nairobi Industrial and Technology Park: A joint venture with Jomo Kenyatta University of Agriculture and Technology (JKUAT) who has provided the 32 acres of land. A project proposal, work plan, and zoning concept have been developed.
(11) Development of mini and integrated iron and steel mills
- The project is in Machakos County.
Source: Kenya Investment Authority website (2013)
9.2.2 Industrial Development of Nairobi City towards 2030
(1) Development Direction
The industrial development of Nairobi City is expected to realise both advancement of the industry and generation of employment by linking the two aspects and upgrading informal businesses.
1) Main engine for economic development
Nairobi City should continue to be a main engine for national development while decelerating its population growth. This requires Nairobi City to accommodate advanced-skills-intensive businesses including headquarters and management functions and to increase high-end employment opportunities so that the industrial structure will be advanced towards higher-value addition. In migration of simple labour or expansion of large-scale heavy industries should not be sought for.
2) Generating sustainable employment
On the other hand, one of the most serious socioeconomic requirements in industrial development is to solve unemployment, underemployment, and working poor problems. Generating employment opportunities is, therefore, a mission with a view to establishing supporting industries and innovative or creative individual businesses, upgrading micro, small and medium enterprises, and also absorbing young graduates and even dropouts.
(2) Priority Sectors
The priority industrial sectors of Nairobi City are identified by the following criteria:
Include the sectors of high importance for national development as manifested in Kenya Vision 2030,
Exclude sectors to be promoted in rural areas, local towns, and suburban areas, and
Include other sectors of special importance in view of Nairobi City’s specific issues.
Amongst the foundations of socioeconomic development and the priority sectors identified by Kenya Vision 2030, the agriculture and agro-processing sector is more desired in rural, local, and fully

The Project on Integrated Urban Development Master Plan for the City of Nairobi in the Republic of Kenya
Nippon Koei Co., Ltd. 9-14 Final Report IDCJ Inc. EJEC Inc.
suburban areas, and mass production or heavy industry requiring large area is also expected outside of urbanised areas. Innovative light manufacturing based on research and development of scientific and technological advancement should be promoted in Nairobi City, as it has accumulated resources of science and technology. Considering the traffic congestion and the measures to address it in the coming years, the transportation and logistics business is identified as an additional priority sector of Nairobi City. (Figure 9.2.1)
Consequently, the following priority sectors are selected for Nairobi City:
(i) Construction-related development businesses (construction, consulting, planning, design, infrastructure provision and operation, low cost housing, etc.),
(ii) Social development businesses (education, health, etc.),
(iii) Professional, scientific, and technical businesses,
(iv) Tourism businesses,
(v) Wholesale and retail trade,
(vi) ICT businesses,
(vii) Financial businesses, and
(viii) Transportation and logistics businesses.

The Project on Integrated Urban Development Master Plan for the City of Nairobi in the Republic of Kenya
Nippon Koei Co., Ltd. 9-15 Final Report IDCJ Inc. EJEC Inc.
Kenya Nairobi
Foundations of Soc io-economic development Priority sectors
Macroeconomic stability
Infrastructuraldevelopment
Construction-relateddevelopment businesses
Science, technology andinnovation
Land reforms
Human resourcesdevelopment
Social developmentbusinesses (education,
health, etc)
Security and publicsector reforms
Professional, scientificand technical businesses
Priority sectors
Tourism Tourism businesses
Agriculture and agro-industries
Wholesale and retailtrade
Wholesale and retailtrade
Manufacturing
IT enabled services ICT businesses
Financial services Financial businesses
Nairobi's priority
Traffic congestionTransportation andlogistics businesses
Source: Kenya Vision 2030 and JICA Study Team (JST) Figure 9.2.1 Correspondence between Priorities of Kenya and Nairobi City

The Project on Integrated Urban Development Master Plan for the City of Nairobi in the Republic of Kenya
Nippon Koei Co., Ltd. 9-16 Final Report IDCJ Inc. EJEC Inc.
(3) Generation of Sustainable Employment
Generation of sustainable employment can be promoted by activating the labour market. Mobilising the workforce, disseminating job information, and match-making functions should be strengthened by both private and public organisations.
The labour market can be activated by job placement offices and temporary staff dispatching offices. Such offices may operate on a contract basis public facilities like social centres, digital centres, and libraries, and also business processes of private and public organisations.
Capacity and skills development can be conducted not only by education or vocation institutions but also through on-the-job training. Organisational capacity and skills will be upgraded by entering into subcontracts under larger enterprises, which control the quality, quantity, and delivery time of the products. Even buyers can help improve suppliers’ products by demanding rational conditions. Such market-led skills development mechanism as part of industrial linkages can function better than off-the-job training, if the latter lacks enough motivation. (Figure 9.2.2)
Enterprise Sizes General supporting organizations
International and national large enterprises Kenia Investment Authority (KenInvest)
Medium size enterprises
Kenya Industrial Estates Ltd. (KIE)
Small size enterprises
Micro and Small Enterprise Authority (MSEA)
Micro and individual businesses
Vertical linkageNairobi City County
Line agencies
Horizontal linkage
<-In
form
al sec
tor
1 m
illio
n job
s->
<-F
orm
al sect
or
1.8 m
illio
n jobs->
Source: JICA Study Team (JST)
Figure 9.2.2 Expected Structure of the Industries of Nairobi in 2030
(4) Expected Employment
Based on the results of the person trip survey and considering the rapid growth of the priority sectors and the trend of formalisation of the industries in Nairobi City, a scenario of future employment distribution can be assumed (Figure 9.2.3, Tables 9.2.3 and 9.2.4). It is noted that the categories in the person trip survey are different from the standard industrial classification. The person-trip-based category of “other service industry” is interpreted to include professional, scientific, and technical business, which is expected to increase its share although the increase is not apparent due to the decrease of the rest in the “other service industry” category. The total increments of employment during the plan period is approximately 1 million, consisting of 0.8 million formal jobs and 0.2 million of informal jobs.

The Project on Integrated Urban Development Master Plan for the City of Nairobi in the Republic of Kenya
Nippon Koei Co., Ltd. 9-17 Final Report IDCJ Inc. EJEC Inc.
The scenario manifests necessity to accommodate a large amount of rapidly growing businesses such as information and communication businesses, financial businesses, and professional, scientific, and technical businesses.
0.0
0.5
1.0
1.5
2.0
2.5
3.0
2013 2030
Number of jobs
million
Private households
Other service industry
Health and social work
Education
Public administration
Real estate and renting
Financial intermediation
Hotels and restaurants
Transportation, storage andcommunication
Repair of vehicles, personal andhousehold goods
Wholesale and retail trade
Construction
Electricity, gas and water supply
Manufacturing
Mining and quarrying
Agriculture and forestry
Source: JICA Study Team (JST)
Figure 9.2.3 Expected Scenario of Employment Distribution by Type of Industry
Table 9.2.3 Expected Scenario of Employment Distribution by Type of Industry Type of industry 2013 2013 % % point change 2030 % 2030 2030-2013
1 Agriculture and forestry 43,831 2.4 -1.5 0.9 26,000 -18,0002 Mining and quarrying 11,571 0.6 -0.2 0.4 12,000 1,0003 Manufacturing 91,053 5.0 -1.0 4.0 113,000 22,0004 Electricity, gas and water supply 40,807 2.3 0.2 2.5 69,000 28,0005 Construction 66,807 3.7 1.5 5.2 146,000 79,0006 Wholesale and retail trade 307,061 16.9 0.0 16.9 476,000 169,0007 Repair of vehicles, personal and household goods 71,205 3.9 0.0 3.9 110,000 39,0008 Transportation, storage and communication 86,471 4.8 3.0 7.8 218,000 132,0009 Hotels and restaurants 160,013 8.8 1.0 9.8 276,000 116,000
10 Financial intermediation 102,413 5.6 0.8 6.4 181,000 79,00011 Real estate and renting 32,518 1.8 0.0 1.8 51,000 18,00012 Public administration 86,202 4.8 -1.0 3.8 106,000 19,00013 Education 140,332 7.7 1.6 9.3 263,000 122,00014 Health and social work 94,294 5.2 1.0 6.2 174,000 80,00015 Other service industry 347,825 19.2 0.0 19.2 539,000 192,00016 Private households 130,465 7.2 -5.4 1.8 51,000 -80,000
Total 1,812,869 100.0 0.0 100.0 2,811,000 998,000 Source: JICA Study Team (JST)

The Project on Integrated Urban Development Master Plan for the City of Nairobi in the Republic of Kenya
Nippon Koei Co., Ltd. 9-18 Final Report IDCJ Inc. EJEC Inc.
Table 9.2.4 Correspondence between Categories in the Person Trip Survey and Industrial Classification Categories in the Person Trip Survey Standard Industrial Classification 1 Agriculture and forestry 1 Agriculture, forestry, and fishing 2 Mining and quarrying 2 Mining and quarrying 3 Manufacturing 3 Manufacturing 4 Electricity, gas, and water supply 4 Public utility related industries (electricity, water, sewerage, waste
management, etc.) 5 Construction 5 Construction 6 Wholesale and retail trade 7 Repair of vehicles, personal and household goods
6 Wholesale and retail trade; repair of motor vehicles and motorcycles
8 Transportation, storage, and communication 7 Transportation and storage 9 Information and communication
9 Hotels and restaurants 8 Accommodation and food service activities 10 Financial intermediation 10 Financial and insurance activities 11 Real estate and renting 11 Real estate activities 12 Public administration 14 Public administration 13 Education 15 Education 14 Health and social work 16 Human health and social work activities 15 Other service industry 12 Professional, scientific, and technical activities
13 Administrative and support service activities 17 Arts, entertainment, and recreation 18 Part of other service activities
16 Private households 18 Part of other service activities 19 Tourism industry (integration of some of the above industries) Source: JICA Study Team (JST), United Nations website (2013)
(5) Development of Industrial Sectors
Development of industrial sectors is broadly outlined below, according to the United Nation’s International Standard Industrial Classification of All Economic Activities, Rev.4.
1) Agriculture
Farming in Nairobi City is mostly informal on a small scale. Horticulture and floriculture are amongst the popular activities. Strong urbanisation pressure causes unplanned urbanisation in agricultural lands such as scattered housing development without proper infrastructure. This issue is remarkable in the peripheral areas such as Dagoretti.
Farming in Nairobi City should be high value-added, taking advantage of the proximity of the urban market. The typical examples are perishable vegetables, fruits, and flowers. Agricultural land should also be regarded as part of the green and open space network. Thus, the zoning of the agricultural areas should be discussed from an urban environment view point as well as an agricultural production view point. Land use zoning and enforcement, tax incentives and disincentives, and infrastructure provision should be studied, paying due consideration to the land market mechanism.
Agriculture including agro-processing/industry is one of the six priority sectors of Kenya Vision 2030, and Nairobi City should function to sell, export by air, as well as coordinate, market, and finance the sector in close cooperation with the production fields.
2) Mining and quarrying
There are some large-scale quarry sites in Embakasi and Njiru divisions. One of the issues is the deterioration of the quarry sites where not only sustained land use would be difficult but also risks of accidents and water-borne diseases would be associated, unless the sites were properly reclaimed after quarrying activities. The operators should be enforced to reclaim the sites after quarrying.

The Project on Integrated Urban Development Master Plan for the City of Nairobi in the Republic of Kenya
Nippon Koei Co., Ltd. 9-19 Final Report IDCJ Inc. EJEC Inc.
For development of the mining and quarrying sector of Kenya including exploration of oil and gas deposits, Nairobi City should function as a hub for research, investment promotion, and exploration.
3) Manufacturing
According to the business registration data of NCC as of February 2013, there are 454 large manufacturing businesses. Amongst them 289 are located in Makadara, 83 in Embakasi, and 52 in Kasarani. They are mostly in industrial areas in Makadara and Ruaraka, and along Mombasa Road. Their products are diverse from food and beverages to transport equipment (e.g., East African Breweries, Nestle, Coca Cola, Pepsi Cola (new), GM, Honda (new)). It seems that a number of unskilled workers commute to such industrial areas on foot from informal settlements such as Mukuru and Kibera to Makadara and Korongocho to Ruaraka.
There are several clusters of informal light manufacturing (Jua Kali) like fabrication and repair of metal products. Kamukunji and Kariobangi are such examples. It is expected that such informal businesses generate job opportunities and some may grow to become formal enterprises. On the other hand, the elaboration level of their products is not yet very high in general. In addition, some of their waste materials are polluting the environment. There are also small furniture workshops at many places. They imply existence of a craftsman culture.
One important characteristic of the manufacturing sector is weak industrial/business linkages, which are a cause and also a result of weak competitiveness of each enterprise.
For development of internationally competitive manufacturing of Kenya, which is one of the six priority sectors of Kenya Vision 2030, Nairobi City should seek high value-added manufacturing such as knowledge intensive, research and development oriented, prototype development, ICT related, and market-led. Relatively large scale and labour intensive industries may find better operation environments in the environs of the city rather than inside the city. Therefore, the existing designated large-scale industrial zones may not need to be expanded, but they need renovation of infrastructure and facilities such as roads and street lights. In such a general direction, whether to promote or to control new factories needs careful location-specific study from both employment generation and population control viewpoints. Upgrading informal small businesses and creating a supporting industry system are expected. Whether to upgrade them on site or by relocation to more appropriate sites needs to be studied. If they are to be relocated, the new site needs to be provided with new common facilities for the enterprise groups to enjoy better operating environment. Open space in the industrial area can also be a candidate relocation site for informal manufacturers, who may be able to take advantage of proximity to the large-scale formal manufacturers. According to Kenya Vision 2030 Economic Pillar, a pilot metal small and medium enterprises (SME) park will be located in Nairobi City due to its proximity to most important markets. In any case, it is expected that the SMEs can train themselves by responding to the market demand, for example, through sales under supermarkets, who can pinpoint the demand, or by being subcontracted from large manufacturers. The subcontracting and partnership exchanges (SPXs) scheme of the United Nations Industrial Development Organisation (UNIDO) may be utilised. Another way to support SMEs is through government organisations’ procurement of their products, although they have to meet specified conditions in quality, quantity, delivery, and costs. NCC can coordinate with the stakeholders for micro, small, and medium enterprises (MSME) development. One of the actions is to secure sites for MSMEs.
4) Public utility related industries
Energy and water are two of the bottlenecks for national development. Various power generation and supply projects are presented for participation of the private companies on a

The Project on Integrated Urban Development Master Plan for the City of Nairobi in the Republic of Kenya
Nippon Koei Co., Ltd. 9-20 Final Report IDCJ Inc. EJEC Inc.
PPP basis. For such projects, Nairobi City can provide liaison offices for project management, procurement, logistical support, etc. of the power plants. On the other hand, Nairobi City needs more reliable power supply and wider distribution including informal settlements. To complement the national supply, relatively small-scale green energy plants such as wind energy, solar energy, and bioenergy can be promoted in the city or the environs. In addition, electrification of informal settlements can be supported by approaches called social businesses or base of the pyramid businesses, for example, through the introduction of solar lanterns.
Due to insufficient distribution of tap water, water venders are common in Nairobi City. The water-related sector is also one of the areas where the private sector can play more roles in a more coordinated way.
Operation and management of electricity and water networks can be optimised by using ICT, as this business is emerging.
5) Construction-related development businesses
There are 708 large construction businesses. Amongst them 298 are located in Makadara, 130 in Westlands, and 83 in Embakasi. Currently, many construction projects of residential and office buildings and infrastructure such as roads are ongoing. Toward 2030, a large amount of construction will be required in and around Nairobi City in order to expand and upgrade the current inadequate infrastructure systems that cause high costs to businesses.
At the national level, a huge amount of construction demand for socioeconomic development necessitates various construction- related businesses, including building material companies, contractors, and designers, of which a number of businesses such as architectural and consulting firms will be located in Nairobi City. Many company headquarters are also in Nairobi City.
Thus construction-related enterprises need to be developed through various means such as joint works with international enterprises and participation in PPP.
6) Wholesale and retail trade; repair of motor vehicles and motorcycles
There are a number of subcategories under this title. They include shopping zones in the commercial business district (CBD), various types of markets, supermarkets, shopping malls, individual shops, informal vendors, hawkers, and internet shops. There are 2,992 large businesses in this category. Amongst them 929 are located in the Central Division, 644 in Makadara, and 601 in Westlands.
The wholesale and retail trade sector is one of the six priority sectors of Kenya Vision 2030. The growth of retail trade for individuals will be accelerated by the expanding middle class. General trends of increasing car ownership and business women will increase the share of supermarkets and malls in the retail trade. On the other hand, the peripheries of the city where markets are sparsely located may need new markets (Figure 9.2.4).

The Project on Integrated Urban Development Master Plan for the City of Nairobi in the Republic of Kenya
Nippon Koei Co., Ltd. 9-21 Final Report IDCJ Inc. EJEC Inc.
Source: Department of Social Services and Housing, NCC (2013)
Figure 9.2.4 Market Locations
The existing and new shopping zones need to contribute to maximising urban functions and attractions in relation to urban structure, land use configuration, and transportation network. Especially locations of new large shopping malls should be guided to optimise overall urban functions and attractions. On the other hand, markets can be upgraded either on site or at relocation sites for safer and more comfortable shopping environment. They may have more functions such as ordinary shops, restaurants, and other community support functions. Some of them may become tourist attractions. Informal markets are commonly seen especially around informal settlement areas. A number of informal vendors open shops by occupying public spaces on streets. They should be guided to places better for the public and themselves.
Repairers of vehicles and motorcycles are required to be more environmentally-sensitive in two ways. First, they need to pay due attention to their neighbouring environment. If it is difficult, relocation as a group is one way to improve their operation environment as well as their neighbouring environment. The second environmental issue is that strict vehicle exhaust emissions inspection should be enforced and should be passed by their maintenance work.
7) Transportation, storage, and logistics businesses
There are 311 large businesses in this category. Amongst them 108 are located in Makadara, 71 in Embakasi, and 41 in Westlands. To cope with the current traffic congestion and meet the increasing transportation demand, transportation, storage, and logistics (advanced operation of material flows) businesses should have high development potential.
A number of road and transportation projects are being implemented or proposed including the Nairobi Commuter Rail services and bus rapid transit systems. Current and new passenger transportation businesses and logistics businesses can be upgraded in parallel with the introduction of improved infrastructure and ICT. The existing bus and matatu system can

The Project on Integrated Urban Development Master Plan for the City of Nairobi in the Republic of Kenya
Nippon Koei Co., Ltd. 9-22 Final Report IDCJ Inc. EJEC Inc.
redesign their division of roles to structure a more hierarchical network and improve their services. They also need to improve their passengers’ safety and to mitigate air pollution.
8) Accommodation and food service activities
Hotels in Nairobi City accommodated 1,681,900 bed-nights including 1,155,700 by high class hotels in 2011. They accounted for 24% of the national figure while the Coast Province accounted for 50%. In Nairobi City, there are 1,357 large businesses in this category. Amongst them 517 are located in the Central District and 332 in Westlands, together accounting for 63%. Thus, Nairobi City’s large hotels and restaurants are concentrated in the Central and Westlands divisions, forming a hub of tourism and business trips.
As tourism is one of the six priority sectors in Kenya Vision 2030 for which Nairobi City is a hub, accommodation and food services are expected to grow to cater for domestic and international demands. Moreover, the expected growth of the middle class will promote eating-out at restaurants.
9) Information and communication businesses
There are 251 large businesses in this category. Amongst them 118 are located in Westlands, 73 in the Central District, together accounting for 76%.
The ICT of Kenya has gained international reputation as M-pesa being a good example. However, according to the Kenya Vision 2030 Sector Plan for Information and Communication Technology 2008-2012, the following issues and challenges are emerging:
- Limited access and availability of infrastructure,
- High cost of access and lack of affordable solutions,
- Language and content limitations,
- Lack of regulatory and legislative framework,
- How to respond to impacts of the globalisation,
- Roles to be played by the government,
- Maintaining healthy competition,
- Human resource development,
- Enhancing research, innovation, and protection of intellectual property,
- Strengthening the industry structure and capacity, and
- Spectrum management.
As one of the six priority sectors of Kenya Vision 2030 is the IT enabled services (previously known as business process off-shoring), development of ICT infrastructure and business is recognised to be critically important.
The priority programmes to meet the above issues and challenges are as follows:
- Establishment of the Information and Communication Technology/Business Process Outsourcing (ICT/BPO) park,
- ICT infrastructure development,
- Development of local digital contents,

The Project on Integrated Urban Development Master Plan for the City of Nairobi in the Republic of Kenya
Nippon Koei Co., Ltd. 9-23 Final Report IDCJ Inc. EJEC Inc.
- E-government strategy, and
- Development of policy, legal, and institutional framework.
Konza City, some 50 km south of Nairobi City, was launched responding to the government’s strategy. However, there are much more to do, and the optimal locations for a number of them will be in Nairobi City. The District Development Plans of the three districts in Nairobi City also regard ICT as a base for development regardless of sectors, and emphasise the importance of ICT dissemination at the community level.
On the demand side, the introduction of ICT to diverse sectors and activities such as management of traffic, energy, and safety as well as businesses is worth studying. On the supply side, small-scale ICT entrepreneurs can be fostered by such measures like linking small and large enterprises, providing special spaces, or granting other incentives. It is also important to raise ICT literacy especially amongst the youth. Enhancing the Digital Villages (Pasha Centre) Project involving the youth is one way of achieving this direction.
10) Financial businesses
According to the Kenya Vision 2030 Sector Plan for Financial Services 2008-2012, the financial sector in Kenya comprises banking, insurance, capital markets, pension funds, and quasi-banking institutions, which comprise savings and credit cooperative societies (SACCOs), microfinance institutions (MFIs), building societies, development finance institutions (DFIs), and informal financial services such as rotating savings and credit associations (ROSCAs), merry go rounds, and accumulated savings and credit associations (ASCAS). In Nairobi City, there are 238 large businesses of financial and insurance activities. Amongst them, 101 are in the Central Division and 93 are in Westlands, together accounting for 82%.
The financial services sector is one of the six priority sectors of Kenya Vision 2030 and Nairobi City, in particular Nairobi City’s Hill/Upper Hill, is expected to be a globally competitive financial hub or a regional financial centre (RFC), serving a large part of the Eastern Africa Region. The aspiration requires the following: (1) skilled human resources, (2) efficient financial sector regulations, (3) a critical mass of financial institutions, and (4) a conducive business environment.
Roadmaps for financial business development including capital market and insurance business are prepared and present investment opportunities. Nairobi City needs to fulfill the above four requirements and also to create an environment that is not only business-friendly but also resident-friendly.
11) Real estate activities
As a large number of residential and business buildings and complexes are being constructed, the real estate businesses are active at least in some areas in Nairobi City.
Toward realisation, of well-planned land development, public support, or incentives may be granted to qualified urban development projects contributing not only to quality environment inside the sites but also to proper environment of the neighboring zones.
12) Professional, scientific, and technical businesses
There are 202 large businesses of professional, scientific, and technical activities. Amongst them 98 are in Westlands, accounting for nearly 50%.
According to the Kenya Vision 2030 Sector Plan for Science, Technology, and Innovation 2008-2012, development of strategic partnerships between higher education and industries is

The Project on Integrated Urban Development Master Plan for the City of Nairobi in the Republic of Kenya
Nippon Koei Co., Ltd. 9-24 Final Report IDCJ Inc. EJEC Inc.
one of the important approaches. The plan also proposes the following: (1) creating technopreneurship (seeking high technology venture business) and industry-led clusters, involving small and large firms, both indigenous and foreign owned, and (2) attracting targeted foreign direct investment and focusing activities of government agencies in creating knowledge-based economy. In order to improve science, technology and innovation infrastructure, and equipment, a project called the ”Establishment of Science and Technology Parks and Industrial Incubators Project” is proposed. It aims to establish technology parks and industrial incubators in Kenya to enhance the transfer of knowledge into products and services. It also aims to enhance PPP and to encourage growth of SMEs. One of the candidate locations may be Nairobi City or its environs.
On the other hand, according to Kenya Vision 2030 Economic Pillar, the Nairobi Industrial and Technology Park is being developed in JKUAT, who has provided 32 acres of land in their campus in Kiambu County. JKUAT and Nissin Food Holdings launched the instant noodles business in partnership. The park is a pioneer for research and development oriented collaboration between businesses and universities. Such initiatives are also expected in Nairobi City, involving universities or research institutes, companies, and government bodies.
13) Administrative and support service activities
Under this category are the following: (1) rental and leasing activities, (2) employment activities, (3) travel agencies, tour operators, reservation services and related activities, (4) security and investigation activities, (5) services to buildings and landscape activities, and (6) office administrative, office support, and other business support activities. Some of these businesses are already very active. In the coming years, demands for such service industries are expected to grow especially in highly urbanised areas like Nairobi City.
In order to activate labour market, qualified placement businesses such as recruiting, dispatching temporary staff, business process outsourcing in a wide sense, and dispatching workforce to overseas labour market can play important roles.
For security of not only individual houses and business establishments but also streets and districts against crimes and disasters, private security firms can play important roles in collaboration with public agencies and citizens by building a network, in particular, an ICT network.
Moreover, business to support urban management with innovative ICT systems is emerging.
14) Public administration
In Kenya, there are 53,253 wage employees in government services excluding law and order, defense, education services and other specialised services. Its national share is 2.5% of the total private and public wage employment of 2,127,700. In Nairobi City, however, the employment share of overall public administration is approximately 4.8% according to the person trip survey. Taking advantage of such concentration, public administrators of different line organisations in Nairobi City are expected to collaborate efficiently for the nation’s common socioeconomic agenda.
15) Education
There are approximately 900 primary schools including pre-primary schools and 250 secondary schools (Table 9.2.5 and Figure 9.2.5). There are also a number of tertiary education and vocational training institutions. Although they are not profit-making bodies, they provide employment and undertake economic activities.

The Project on Integrated Urban Development Master Plan for the City of Nairobi in the Republic of Kenya
Nippon Koei Co., Ltd. 9-25 Final Report IDCJ Inc. EJEC Inc.
Table 9.2.5 Number of Primary and Secondary Schools School Category Primary Schools
(including pre-primary) Secondary Schools
Public 216 80 Private 149 160 Non-formal 542 10 Total 907 250
Source: Education Department NCC (2013), former City Council of Nairobi (2013)
Source: Education Department, NCC (2013), , former City Council of Nairobi (2013)
Figure 9.2.5 School Locations
During the period from 2013 to 2030, as both population and enrolment rates increase, the total enrolment of schools and institutions is estimated to increase by 82% from 954,000 to 1,737,000. Moreover, quality education and training are increasingly demanded. Therefore, not only ordinary education but also various human development and skills development services need to be expanded and upgraded.
16) Human health and social work activities
There are 23 large institutions of human health and social work activities, of which ten are located in Westlands, six in Makadara, and five in Langata. Currently, there is a big gap between demand and supply of health and social services. Toward a more equitable society, expansion of the services is required. In this regard, social businesses should also be promoted.
Operation of community facilities such as social halls, community halls, and parks can be contracted out to non-governmental organisations or community organisations or youth groups in order to realise efficient operation and the communities’ sense of commitment.

The Project on Integrated Urban Development Master Plan for the City of Nairobi in the Republic of Kenya
Nippon Koei Co., Ltd. 9-26 Final Report IDCJ Inc. EJEC Inc.
17) Arts, entertainment, and recreation
There are 90 large businesses of arts, entertainment, and recreation, of which 40 are located in Westlands and 19 in the Central Division. This category of businesses can be developed in line with tourism promotion, as cultural tourism, traditional, and modern, has the potential to expand.
18) Other service activities
Many people are engaged in this category such as washing, hair dressing, housekeeping, and shoe shine. Some of these activities will grow as the population and economy grow, while others like housekeeping and shoe shine may decrease as the income gap decreases.
19) Tourism businesses
According to a tourist guide in Kenya, Nairobi City’s best natural attractions are the following: (1) Nairobi National Park, (2) David Sheldrick Wildlife Trust, (3) Giraffe Centre, and (4) Ngong Hills. Moreover, the best cultural attractions area the following: (1) Bomas of Kenya, (2) National Museum, (3) African Heritage House, (4) Karen Blixen Museum, and (5) Carnivore Restaurant.
In addition to the above, the CBD including Uhuru Park and Central Park is a popular destination for many holiday makers. The workshop road zone south of the railway yard is emerging as a creative spot.
On the other hand, Nairobi City is generally regarded as a dangerous place. Regarding the operation of some of the above best attractions, services such as the reception procedures and design of the websites can be evaluated to be less client-oriented than expected.
Kenya Vision 2030 includes tourism in the six priority sectors and encourages various types of tourism, such as ecotourism, wildlife tourism, heritage tourism, conference tourism, and sports tourism. It also proposes the following projects in Nairobi City:
- Amusement Park and 5-Star Hotel at Bomas of Kenya,
- Nairobi Galleries at the Nairobi National Museum,
- Revolving Restaurant (at Kenyatta International Convention Centre (KICC)), and
- International Sports Academy in Kasarani.
In addition to these, Nairobi City is a hub of tourists who visit other sites in and around Kenya. Based on the general understanding that tourism contributes substantially to Nairobi City’s employment and economy, it can be promoted through the following city-wide measures amongst others:
- Improvement of public safety,
- Improvement of product quality and diversity,
- Improvement of infrastructure and public services especially decongestion of traffic along tourist networks,
- Recovery of clean environment and creation of tourist streets,
- Enhancement of the shops, streets, crossings, and bus stops, and
- Opening of exclusive pedestrian streets or car free zones on weekends.

The Project on Integrated Urban Development Master Plan for the City of Nairobi in the Republic of Kenya
Nippon Koei Co., Ltd. 9-27 Final Report IDCJ Inc. EJEC Inc.
For example, the Nairobi River and its banks especially between Museum Roundabout and Race Course Roundabout should be cleaned and beautified as part of the stroll network in CBD together with the increase of urban amenities around the area.
Another idea is to create marathon tours, as a number of marathon, half-marathon, and 10-km marathon tours in various countries are attracting many amateur marathon fans from abroad.
For many foreigners, Africa’s image is Kenya’s image including wild animals. Some Japanese have mistakenly thought that Mt. Kilimanjaro is in Kenya. Such Kenya’s strong brand should be protected from decaying with reputation of insecurity. The Nairobi National Park may be promoted as the most convenient safari park in the world. Tourism promotion can be included in the missions of the Kenyan embassies.
Location-specific items discussed in this section are indicated in Figure 9.2.6.

Nippon K
oei Co., L
td 9-28
Final R
eport
IDC
J Inc. E
JEC
Inc
The P
roject on Integrated Urban D
evelopment M
aster Plan for
the City of N
airobi in the Republic of K
enya
Source: JICA Study Team (JST)
Figure 9.2.6 Location-specific Agenda for Industrial and Tourism Development
Agenda for Industrial and Tourism Development (1) Sole Central Business District (CBD) (2) Unplanned urbanisation of agricultural lands in Dagoretti (3) Deterioration of quarry sites in Embakasi and Njiru (4) Industrial area in Makadara (5) Industrial area in Ruaraka (6) Industrial area along Mombasa Road (7) Informal settlements of Mukuru (8) Informal settlements of Kibera (9) Informal settlements of Korongocho (10) Informal light manufacturing (Jua Kali) in Kamukunji (11) Informal light manufacturing (Jua Kali) in Kariobangi (12) Regional Financial Centre (RFC) at Nairobi Hill/Upper Hill (13) Nairobi Industrial and Technology Park in Jomo Kenyatta
University of Agriculture and Technology (JKUAT) (14) Nairobi National Park (15) David Sheldrick Wildlife Trust (16) Giraffe Centre (17) Ngong Hills (18) Bomas of Kenya (19) Nairobi National Museum (20) African Heritage House (21) Karen Blixen Museum (22) Carnivore Restaurant (23) Uhuru Park (24) Central Park (25) Workshop Road Zone (26) Nairobi River Zone (27) Kenyatta International Convention Centre (KICC) (28) International Sports Academy in Kasarani

The Project on Integrated Urban Development Master Plan for the City of Nairobi in the Republic of Kenya
Nippon Koei Co., Ltd. 9-29 Final Report IDCJ Inc. EJEC Inc.
9.2.3 Prospects of Industrial Development in the Environs
The Spatial Planning Concept for Nairobi Metropolitan Region prepared by the then Ministry of Nairobi Metropolitan Development in 2013 planned rapid development in the environs out of Nairobi City within Greater Nairobi. Urban centres are planned to contribute to economic development and new towns are to be self-contained. None of them will be dormitory towns. Major functions of urban centres are envisaged and those of new towns are as indicated by their names. In manufacturing, agro-based industries tend to be featured in the north-west environs with high agricultural potential, while other industries are planned at the urban centres of Thika, Ngong, and Mavoko. Those urban centres and new towns can complement the urban functions of Nairobi City, so that the city does not need to be equipped with a full set of industrial functions (Figure 9.2.7 and Table 9.2.6).
Note: The area of each district shown in the figure does not include the part outside the Greater Nairobi. Sources: District Development Plans (2008-2012) and JICA Study Team (JST)
Figure 9.2.7 District Demarcation in the Environs of Nairobi City within Greater Nairobi

The Project on Integrated Urban Development Master Plan for the City of Nairobi in the Republic of Kenya
Nippon Koei Co., Ltd. 9-30 Final Report IDCJ Inc. EJEC Inc.
Table 9.2.6 Estimation of Population and Employment of the Environs in Greater Nairobi Population Estimation
County District 2009 2013 2015 2018 2020 2023 2025 2030 Proposed new towns (planned populatio)Nairobi City 3,138,369 3,601,351 3,820,673 4,174,952 4,369,208 4,677,671 4,824,618 5,212,500
Kiambu Thika 497,140 624,536 688,234 851,199 959,842 1,180,572 1,327,725 1,829,662Aerotrotropolis (100,000),Tatu City (70,000) (construction started.)
Kiambu East 401,514 385,233 377,093 458,241 512,340 625,036 700,166 961,198Kiambu West 370,574 585,410 692,829 830,577 922,409 1,106,920 1,229,927 1,645,893 Knowledge-cum-Health City (100,000)
Kajiado Kajiado 249,819 311,360 342,130 417,027 466,958 570,063 638,801 875,427Machakos Machakos 139,502 207,107 240,910 309,251 354,811 445,115 505,318 707,503 Sports City (100,000)
Kangundo 219,103 310,087 355,579 452,249 516,696 646,995 733,861 1,030,149 Cyber City (100,000)Nairobi City's Environs in Greater Nairobi 1,877,652 2,423,734 2,696,775 3,318,544 3,733,056 4,574,701 5,135,798 7,049,832
Assumptions 2009 2013 2015 2018 2020 2023 2025 2030Share of workforce (%) 52.7 52.7 52.7 52.7 52.7 52.7 52.7 52.7Unemployment rate as defined in 2009 Census (%) 14.7 13.2 12.5 11.4 10.7 9.6 8.8 7.0Share of employees in population (%) 45.0 45.7 46.1 46.7 47.1 47.7 48.0 49.0
Employment EstimationCounty District 2009 2013 2015 2018 2020 2023 2025 2030 Proposed new towns
Kiambu Thika 223,480 285,575 317,362 397,443 451,881 562,641 637,903 896,736Aerotrotropolis,Tatu City (construction started.)
Kiambu East 180,493 176,152 173,887 213,963 241,203 297,882 336,394 471,093Kiambu West 166,585 267,685 319,481 387,815 434,258 527,540 590,917 806,669 Knowledge-cum-Health City
Kajiado Kajiado 112,301 142,373 157,765 194,719 219,837 271,683 306,911 429,055Machakos Machakos 62,710 94,702 111,090 144,396 167,040 212,135 242,779 346,754 Sports City
Kangundo 98,494 141,790 163,966 211,165 243,254 308,347 352,582 504,886 Cyber CityNairobi City's Environs in Greater Nairobi 844,063 1,108,277 1,243,550 1,549,501 1,757,473 2,180,228 2,467,486 3,455,193
Employment of Urban Centres and New Towns according to "Spatial Planning Concept for Nairobi Metropolitan Region" in Greater Nairobi
County District Urban centreEnvisagedfunctions
2009% in districtemployment
2030 % in district employment
Kiambu Thika 121,281 54.3 648,170 72.3Ruiru Trading 75,694 340,869Thika Industrial 43,187 199,581Juja Service 2,400 57,720Aerotrotropolis 0 50,000
Kiambu 66,518 36.9 326,329 69.3
KiambuAdministrativecum Agro-based industrial
28,980 126,823
KaruriAgro-basedindustrial
37,538 185,426
GithunguriAgro-basedindustrial cumAdministrative
0 14,080
Kiambu 107,513 64.5 532,831 66.1
LimuruAgro-basedindustrial
32,265 148,819
KikuyuAgro-basedindustrial
75,248 334,012
Knowledge-cum-Health City 0 50,000Kajiado Kajiado 36,320 32.3 301,316 70.2
Ngong Industrial 17,937 144,424Kitengera Service 5,031 78,374Ongata Rongai Service 9,474 54,136Kiserian Service 3,878 24,382
Machakos Machakos 44,546 71.0 264,032 76.1Mavoko Industrial 44,546 209,020Kathiani service 0 5,012Sports City 0 50,000
Kangundo 45,351 46.0 377,757 74.8Kangundo/Tala Trading 45,351 327,757Cyber City 0 50,000
Nairobi City's Environs in Greater Nairobi 421,529 49.9 2,450,435 70.9
Note: Spatial Planning Concept for Nairobi Metropolitan Region plans new towns as self-contained cities and as means for
promoting economic development, therefore, the number of jobs in each new town is assumed to be 50% of the population.
It is assumed that each district will have no net cross-border commuters, based on the self-contained concept. Sports City is assumed to be in Greater Nairobi, because it is either partly inside of or neighbouring on Greater Nairobi
although it cannot be pinpointed. Tatu City is not amongst the new towns planned by the Spatial Planning Concept for Nairobi Metropolitan Region. Sources: "Spatial Planning Concept for Nairobi Metropolitan Region" (2013) Ministry of Nairobi Metropolitan Development,
JICA Study Team (JST)
9.2.4 Required Policy Measures and Expected Functions of Nairobi City County
The socioeconomic framework set above requires policy measures to make it happen. The target population of Nairobi City in 2030 is 166% of its population in 2009. At the same time, the target population growth rate is substantially lower than the recent trend of population growth. Therefore, the framework requires a mixed policy for employment generation and deceleration of in-migration amongst others.
Regulating industrial location and advancing the industrial structure can be two of the important policy measures including regulations to restrict certain industries in some of the central zones and to promote relocation of industries to new and suburban sites with better operational environment.
It is worth studying for Nairobi City County to have a facilitation function for its industrial development through the following activities. It is not recommendable for a government organisation to be an implementer of businesses.

The Project on Integrated Urban Development Master Plan for the City of Nairobi in the Republic of Kenya
Nippon Koei Co., Ltd. 9-31 Final Report IDCJ Inc. EJEC Inc.
(i) Expedite and improve NCC’s procedures for doing business of private establishments so that Kenya’s rank in the “Ease of Doing Business” of the International Finance Corporation is significantly raised.
(ii) Identify potential sites for public or private investment as there are a lot of areas, in which the potential value is not yet partly realised due to the malfunctioning property taxation mechanism.
(iii) Facilitate investment and operation of businesses by making use of the land use zoning, business licensing, land rents, property taxation, and related incentives and disincentives.
(iv) Facilitate investment and operation of businesses in collaboration with other relevant organisations such as Kenya Investment Authority (KenInvest), Kenya Industrial Estate Ltd. (KIE), Micro and Small Enterprise Authority (MSEA), sector-wise agencies, and infrastructure agencies as well as private sector organisations.
(v) Take the initiative in the redevelopment or renewal of potential sites owned by NCC involving the private businesses both as developers in the project stage and as tenants in the business zones or floors in the operation stage. For example, in addition to residential use, commercial and office units, and industrial apartments for light manufacturers can be developed within a project site.
(vi) Contract out operation of the social facilities to non-governmental organisations, or community organisations, or youth groups on contracts for fixed periods of time with monitoring and evaluation mechanisms.
(vii) Make city markets better places for customers, tenant traders, and neighbourhoods.
(viii) Increase transparency of roadside parking management.
(ix) Build up industrial statistics, for example, by augmenting or independently of the business licensing data.
Besides the above activities for industrial development, the following measures to decelerate population growth are worth studying.
(i) Disincentive measures or prohibition to restrict building and expanding facilities larger than specified standards.
(ii) Incentive measures to promote relocation of large facilities from congested areas to under-urbanised areas.

The Project on Integrated Urban Development Master Plan for the City of Nairobi in the Republic of Kenya
Nippon Koei Co., Ltd. 9-32 Final Report IDCJ Inc. EJEC Inc.
9.3 Urban Facilities
9.3.1 Demand and Gap Analysis
(1) Health Facilities
According to the Nairobi City County Public Health Department, there are around 79 health centres. Nairobi City has a total population of 3,138,369 according to the 2009 Population Census,.
In previous studies, it has been proposed that a health centre should be provided for every 25,000 people. Based on this, Nairobi City has a shortage of 47 health centres. The table below summarises the number of health centres within the districts of Nairobi City and their consequent population.
Table 9.3.1 Number of NCC Health Centres and Dispensaries by District District No. of NCC Health Centres and
Dispensaries Population
Starehe 12 274,607 Kamukunji 9 261,855 Kasarani 12 525,624 Westlands 10 247,102 Dagoretti 4 329,577 Kibera 3 355,188 Embakasi 9 925,775 Makadara 20 218,641
Source: JICA Study Team (JST)
From Table 9.3.1 above, it is clear that more health centres are needed in Embakasi than in any other district. Providing health centres in Embakasi should therefore be a priority project since it lacks about 29 health centres to cater for its population.
Using the Nairobi Metropolitan Development Scenario, Nairobi City is predicted to have 5,212,500 inhabitants. Based on this, 101 more health centres will be required to serve Nairobi City’s populace.
Similarly, for every population of 25,000 people, a large market should be provided. Table 9.3.2 below shows the number of large markets within the districts of Nairobi City and their consequent populations respectively as provided by the Nairobi City County markets section.
Table 9.3.2 Types and Capacity of City Council Markets by Ward District No. of Markets Population
Starehe 3 274,607 Kamukunji 5 261,855 Kasarani 2 525,624 Westlands 2 247,102 Dagoretti 0 329,577 Kibera 3 355,188 Embakasi 6 925,775 Makadara 2 218,641
Source: JICA Study Team (JST)
There also exist 20 open air markets within Nairobi City. About 126 markets are needed for the whole of Nairobi City even though there are only 23 large markets. From the above Table 9.3.2, the priority area is Embakasi which has the biggest deficit of 32 markets.
By 2030, a total of 209 markets will be required to serve the population of Nairobi City.

The Project on Integrated Urban Development Master Plan for the City of Nairobi in the Republic of Kenya
Nippon Koei Co., Ltd. 9-33 Final Report IDCJ Inc. EJEC Inc.
(2) Primary Schools
According to the draft physical planning handbook, a school is required for a population of 5,000 people. Currently, there are 185 public primary schools in Nairobi City and, thus, Nairobi City has a deficit of 443 primary schools. Further, a primary school should be within a 500 m walking distance. See the map below which contains the 500 meter buffer.
Source: JICA Study Team (JST)
Figure 9.3.1 Map Showing Shortage of Primary Schools
From Figure 9.3.1 above, Mukuru Kwa Njenga and Kayole have a deficit of more than 15 schools. Therefore, key priority areas for establishment of new schools in the areas not covered by the buffer zones should be formed. By 2030, a total of 1,043 primary schools will be required to serve Nairobi City’s growing population.
(3) Secondary Schools
For every population of 25,000 people, a secondary school is required based on the draft physical planning handbook. Further, the school should serve a buffer region of 1 km. Currently, there are 49 public secondary schools in Nairobi City which can only serve 1,225,000 people. About 77 more schools are required to serve the remaining population and should be located away from the buffer zones.
From Figure 9.3.2 below, Umoja, Kayole, and Mukuru Kwa Njenga require five more schools. This is the highest compared to all the other sublocations. These are, therefore, the priority areas for any proposal to build a government school. Proposed schools should be outside the buffer zones.

The Project on Integrated Urban Development Master Plan for the City of Nairobi in the Republic of Kenya
Nippon Koei Co., Ltd. 9-34 Final Report IDCJ Inc. EJEC Inc.
Source: JICA Study Team (JST)
Figure 9.3.2 Map Showing Shortage of Secondary Schools in Nairobi
(4) Universities
The rise of both private and public universities within Nairobi City’s CBD has seen an increase in traffic towards the CBD especially in the evening, thereby, creating congestion on the roads that direct traffic into the CBD.
In the future, universities should be redirected to areas outside the CBD in the proposed sub-centres, which have a good transportation network. Figure 9.3.3 below shows the distribution of universities within Nairobi City.

The Project on Integrated Urban Development Master Plan for the City of Nairobi in the Republic of Kenya
Nippon Koei Co., Ltd. 9-35 Final Report IDCJ Inc. EJEC Inc.
Source: JICA Study Team (JST)
Figure 9.3.3 Map Showing Distribution of Universities in Nairobi City
(5) Fire Stations
According to the physical planning handbook, for every 50,000-100,000 people, a fire station should be provided. Therefore, Nairobi City requires 32 fire stations. Currently, there are only three fire stations in Nairobi City.
In order to provide suitable sites for the fire stations, it is important to consider the following:
Proximity to roads, Availability of land, Population of surrounding area, and Land use in the surrounding area.
Below, find Figure 9.3.4 showing the suggested sites for the new fire stations.

The Project on Integrated Urban Development Master Plan for the City of Nairobi in the Republic of Kenya
Nippon Koei Co., Ltd. 9-36 Final Report IDCJ Inc. EJEC Inc.
Source: JICA Study Team (JST)
Figure 9.3.4 Map Showing the Proposed Fire Stations
(6) Community Facilities
From the draft physical planning handbook, a community centre should be provided for every 5,000 people. Currently, there are only 25 community centres in Nairobi City. This leaves a deficit of 603 community centres based on the current population.

The Project on Integrated Urban Development Master Plan for the City of Nairobi in the Republic of Kenya
Nippon Koei Co., Ltd. 9-37 Final Report IDCJ Inc. EJEC Inc.
Source: JICA Study Team (JST)
Figure 9.3.5 Map Showing Shortage of Community Facilities
From the above Figure 9.3.5, Mukuru Kwa Njenga has the highest deficit of seven community centres followed by Kayole and Umoja which require six community centres each. Therefore, these sublocations form the basis of candidate sites for the priority projects. By 2030, a total of 1,043 community centres will be required to serve the population.
9.3.2 Development Policy Develop the areas where facilities are not enough: number of facility per population (future) and the number facility based on the guidelines. Development to support sub-centre development should be encouraged.
The Project on Integrated Urban Development Master Plan for the City of Nairobi in the Republic of Kenya
Nippon Koei Co., Ltd. 9-38 Final Report IDCJ Inc. EJEC Inc.
9.4 Geographic Information System (GIS)
9.4.1 Background of the Issues
A geographical information system (GIS) is a computer-based tool used to consolidate various locational, topographical, social, administrative, and infrastructure information. It also facilitates the creation of informed decisions. The usefulness of GIS, however, highly depends on the availability and quality of data to be used.
Acquisition of data from different sources comes with a problem of their own. This is partly because different data sources differ in accuracies. Other reasons why the accuracies of data differ include but are not limited to the following:
Age of data,
Projection, coordinate system, and datum used,
Format in which the data is kept,
Human error, and
GIS system users.
Inaccuracy leads to positional errors and attribute errors. Positional errors are errors arising when spatial entities are fixed in space by incorrect coordinates, whereas attribute errors are errors arising from incorrect labelling of spatial entities in the GIS database.
9.4.2 Situation of Nairobi City’s GIS
There were several existing problems in the non-harmonious geographic data of Nairobi City which include the following:
Incorrect spatial referencing of acquired shape files; although it was indicated on some shape files that the mapping datum used was WGS 84 reference ellipsoid, a study on their spatial location revealed that they were mapped using Arc datum 1960. There was a similar mistake on the datum information on the orthophotos of Nairobi City. This misrepresentation generated a position shift of about 300 m between the orthophotos and other sets of GIS data mapped using the WGS 84 reference ellipsoid. The most likely reason for the incorrect datum information on the orthophotos is that they might have been outputted through a reprojection from Arc Datum 1960 to WGS84 reference ellipsoid that did not register, thus, giving the spatial shift.

The Project on Integrated Urban Development Master Plan for the City of Nairobi in the Republic of Kenya
Nippon Koei Co., Ltd. 9-39 Final Report IDCJ Inc. EJEC Inc.
Source: JICA Study Team (JST)
Figure 9.4.1 Difference in the Satellite Image
The topographic data available in the National Mapping Agency was only in CAD format.
The present GIS data has been based on the orthophoto of 2003 procured by JST (The Study for the Establishment of the Spatial Data Framework for the City of Nairobi in the Republic of Kenya) in March 2005 along the terrain map GIS data specifications. Therefore, updating of the GIS database is required to fill up and include developments after 2003 to date.
(1) Map Data
1) Data Model
All GIS database shall be developed by ArcGIS Personal Geodatabase Format.
2) Coordinate System
The following items shall be used: Projection system is Universal Transverse Mercator (UTM) in Zone 37/ Origin of Meridian is 39° East of Greenwich/ Origin of Latitude is Equator/ Scale factor at origin is 0.9996/ False easting is 500,000 m/ False northing is 10,000,000 m/ Unit of measurement is meter/ Spheroid is Clarke 1880 Arc/ Semi-major axis is 6,378,249.145 m/ Inverse flattening is 293.465.
(2) Dataset
The geodatabase shall be organised around 13 dataset, namely: adm_bnd, annotation, buildings, centreline, control_pnt, map_index, small_obj, surround, symbol, topographic, transportation, vegetation, and water_area. In addition, each dataset shall include some feature classes (Table 9.4.1).

The Project on Integrated Urban Development Master Plan for the City of Nairobi in the Republic of Kenya
Nippon Koei Co., Ltd. 9-40 Final Report IDCJ Inc. EJEC Inc.
Table 9.4.1 Contents of the Geodatabase Name of Personal
Geodatabase
Name of Feature Dataset
Name of Feature Class Data Description
Nairobi_GISDB
Adm_bnd Constituency_poly Polygon data of constituency boundary
Location_poly Polygon data of location boundary Sublocation_poly Polygon data of sublocation boundary
Annotation Annotation_pnt Point data of annotation
Buildings Buildings_pnt Point data of building symbol Buildings_line Line data of gate, etc Buildings_poly Polygon data of building
Centreline Centreline_line Line data of centre road Control_pnt Control_pnt Point data of control point Map_index Each feature class includes a polygon showing the coverage of one map sheet.
Small_obj Small_obj_pnt Point data of small object Small_obj_line Line data of small object
Surround Surround_line Line data of surround
Symbol Symbol_pnt Point data of symbol for open space Symbol_line Line data of symbol for open space
Topographic Topographic_line Line data of contour and geographical feature Transportation Transportation_line Line data of road, railway, and those facility
Vegetation Vegetation_pnt Point data of vegetation Vegetation_line Line data of vegetation Vegetation_poly Polygon data of Vegetation
Water_area Water_area_pnt Point data of water area’s object Water_area_line Line data of water area Water_area_poly Polygon data of lake, pond, and big river
Source: JICA Study Team (JST)
Source: JICA Study Team (JST)
Figure 9.4.2 Topographic GIS Map (1:5000)

The Project on Integrated Urban Development Master Plan for the City of Nairobi in the Republic of Kenya
Nippon Koei Co., Ltd. 9-41 Final Report IDCJ Inc. EJEC Inc.
Other issues include:
The 1999 Census GIS data provided had no coordinate system. It was also particularly difficult for JST to acquire GIS data on the 2009 population census even though the data was an important input for the formulation of the NIUPLAN. Geo-referenced population census data for 2009 had to be procured by JST.
Source: JICA Study Team (JST)
Figure 9.4.3 Census Map 2009
Land use data with all the important attributes is required for effective planning. While comprehensive land use data in Kenya is not available, some limited land use data is made available by the Columbia University of United States. The land use map legend was not well categorised, for example, a land use is categorised as “Unknown” or “No structures”, which needs some additional interpretation or analysis. Therefore, modification of the attributes is required.
Source: JICA Study Team (JST) based on a map produced by the Columbia University
Figure 9.4.4 Land Use Map from the Columbia University

The Project on Integrated Urban Development Master Plan for the City of Nairobi in the Republic of Kenya
Nippon Koei Co., Ltd. 9-42 Final Report IDCJ Inc. EJEC Inc.
Cadastral Data Unavailability: Figure 9.4.5 shows the cadastral data held by NCC. It does not cover the whole of Nairobi City. The updated status of the data is also not clear.
Source: JICA Study Team (JST)
Figure 9.4.5 Cadastral Map (held by NCC)
9.4.3 Current Status of the GIS Data under the NIUPLAN
Satellite imagery for the City of Nairobi has been acquired (2012 Imagery) which will be used for this project.
Table 9.4.2 Specifications of the Satellite Imagery (WorldView-2) Item Specifications 1 Image Processing Ortho/Pansharpen 2 Map Projection UTM Zone 37 South WGS84 3 File Format GeoTiff 4 Ground Resolution 50 cm 5 Image Quality (Geotiff) 16 bit 6 Resampling System CC (Cubic Convolution) 7 Band 4 band(B,G,R,IR)
Source: JICA Study Team (JST)

The Project on Integrated Urban Development Master Plan for the City of Nairobi in the Republic of Kenya
Nippon Koei Co., Ltd. 9-43 Final Report IDCJ Inc. EJEC Inc.
Source: JICA Study Team (JST)
Figure 9.4.6 Aerial Photos of Nairobi City
Shape files to be used for the NIUPLAN have been projected to WGS 84 UTM Zone 37’s projection which is the coordinate system to be adopted for the project. The topographic data, land use data, building data, and road data are consistent with the newly acquired satellite imagery as shown in Figure 9.4.7.

The Project on Integrated Urban Development Master Plan for the City of Nairobi in the Republic of Kenya
Nippon Koei Co., Ltd. 9-44 Final Report IDCJ Inc. EJEC Inc.
Satellite Image
Land Use Data
Buildings Data
Roads Data
Source: JICA Study Team (JST) Figure 9.4.7 Fair Consistency between the Imagery and Land Use, Buildings, Roads Shape File
The land use data have been updated to match the satellite imagery of 2012. A more detailed layer management than the Columbia University data set has been devised in the GIS database.

The Project on Integrated Urban Development Master Plan for the City of Nairobi in the Republic of Kenya
Nippon Koei Co., Ltd. 9-45 Final Report IDCJ Inc. EJEC Inc.
Source: JICA Study Team (JST)
Figure 9.4.8 Land Use Map
9.4.4 Current Status of Database under the NIUPLAN
The JST and NCC have collected data for the planning of the NIUPLAN. Table 9.4.3 shows the current status of database development. After that, NCC will continue to collect the necessary data shown in Table 9.4.3.
Table 9.4.3 Current Status of Database Development
Group Data Source Status Required
Additional Data
Type of Data 1
Type of Data 2
Location Data Attribute Data
Population, Urban Economy and Social Cultural Issues
1. Census
KNBS (Kenya National Bureau of Statistics)
1979 census with 1 sublocation
GIS/Shp (not coordinate)
located :Population:Population Density
1989 census with 62 Sublocations
GIS/Shp (not coordinate)
located :Population:Population Density
1999 census with 111 Sublocations
GIS/Shp (not coordinate)
located :Population:Population Density
2009 census with 112 Sublocations
GIS/Shp located :Population
:Population Density
Children's Homes GIS/Shp 4 located :Positional Information
Community Centres GIS/Shp
25 located :Approximate capacity for the centres is available. :Additional information on floor area is required
Fire Stations GIS/Shp 3 located :Number of employees
and area of land Libraries GIS/Shp 5 located :Seating capacity
2. Social Facilities
NCC(Nairobi City County)
Markets GIS/Shp
37 out of 46 located
:The following information is required. :Number of stalls within
☑

The Project on Integrated Urban Development Master Plan for the City of Nairobi in the Republic of Kenya
Nippon Koei Co., Ltd. 9-46 Final Report IDCJ Inc. EJEC Inc.
Group Data Source Status Required
Additional Data
Type of Data 1
Type of Data 2
Location Data Attribute Data
24 markets:The remaining markets are open air markets. :6 more markets require mapping :Information on storage facilities
Recreational Parks
GIS/Shp 9 located :Positional Information
Public Playgrounds GIS/Shp 10 located :Positional Information
Public Primary Schools
GIS/Shp
185 located :The following information is required. :Number of classes. :Name of schools. :Information on classroom capacity and student capacity
Public Secondary Schools
GIS/Shp
49 located :The following information is required. :Name of school :Number of classes :Information on classroom capacity and student capacity
Universities and Colleges
GIS/Shp
34 located :The following information is required. :Name of institution. :Information on classroom capacity and student capacity
Stadia GIS/Shp 3 located :Positional Information
Vocational Institutes GIS/Shp 9 out of 11
located:Positional Information
☑
NCC's Health Centres GIS/Shp 50 out of 74
located:Type of Facility :Services Provided ☑
Museums GIS/Shp 2 located :Positional Information
Nairobi Arboretum GIS/Shp located :Positional Information
3. Crime Kenya Police
Type of crimes, location and time crime was committed
─ ─ ─ ☑
Land Use and
Human Settlemant
s
1. Topographic
SOK (Survey Of Kenya)
2005 Topographic Data
GIS/Shp located
:Digitised Buildings :Constituency Boundary :Location Boundary :Roads as Line Data :Sublocation Boundary :Vegetation as Polygon and PolyLine Data :Water Area as Polygon and Polyline Data
2. Cadastral Cadastral Data ─ ─ ─ ☑3 Land Use
Columbia University
2010 Land use GIS Data GIS/Shp located :Some names of features
are available
4. Historical building
National Museums of kenya
Heritage sites and historical buildings
─ ─ ─ ☑
Urban Transport
1. Road
Kenya Roads Board
2010 Road Data for Kenya
GIS/Shp located
:Road ID :Surface Condition :Number of Lanes :Availability of Road Shoulder and its Condition :Direction(whether one way or two way) :Description of Drainage, its Location and Condition
2. Ministry of Proposed GIS/Shp located :LRT Corridor

The Project on Integrated Urban Development Master Plan for the City of Nairobi in the Republic of Kenya
Nippon Koei Co., Ltd. 9-47 Final Report IDCJ Inc. EJEC Inc.
Group Data Source Status Required
Additional Data
Type of Data 1
Type of Data 2
Location Data Attribute Data
MRTS Corridor
Transport Alignment of MRTS
Underground :LRT Corridor Elevated :Elevated BRT Corridor :At grade BRT Corridor
3. Airport
Kenya Airports Authority
Proposed Airport Plan CAD/DXF located ─
1. Water
NCWSC (Nairobi City Water and Sewerage Company)
Water Distribution Lines and Valves
GIS/Shp located :Size of Pipe :Material of Pipe
Infrastructure 2. Sewerage Sewer Lines
Manholes GIS/Shp located :Size of Pipe :Material Manhole Description
3. Drainage NCC (Nairobi City County)
Drainage ─ ─ ─ ☑
4. Electricity Transmission Kenya Power
:Power lines :Circuit breakers :Switches :Capacitors :Towers :Fuses :Substations
GIS/Shp located
:Voltage transmitted through the power lines :Name of circuit breakers, origin, Structure :Type of switches, feeder, function, design, voltage, mode of operation :Name of capacitor, origin, feeder, type, manufacturer :Tower ID :Fuse ID, origin, feeder :Substations mane, region, street
5. Telecommunications
CCN (Communications Commission of Kenya)
Distribution of infrastructure ─ ─ ─ ☑
Environment
1. Land Cover
KFS (Kenya Forest Services)
Greenery ─ ─ ─ ☑
2. Air Quality UON
(University Of Nairobi)
Pollution Levels ─ ─ ─ ☑
3. Geology Distribution of Rock Structure
─ ─ ─ ☑
Note: ─ Means that the data is not in our database, ☑Means that additional data is required Attribute data is the information contained within the datasets for example, the attribute data for the primary schools dataset includes name of school and number of classes within the schools. For hospitals, you may find location of hospital with the attribute data being the bed capacity within the hospital.
Source: JICA Study Team (JST)
9.4.5 The Management Proposal of GIS Data
The GIS data should have metadata which provides certain information about an item’s content. For example, an image may include metadata that describes how large the picture is, the colour depth, when it was created, and the image resolution. Metadata allows the user to manage GIS data in a better way since he/she has a history of certain data.
Public organisations and private companies undertaking GIS activities within the country should involve the Survey of Kenya especially in checking the integrity and accuracy of the data. The Survey of Kenya should in turn be the repository of GIS data where all agencies involved in GIS activities store and accumulate their data. This stored data can also be used by other institutions carrying out GIS activities in the country. In addition, JST suggests that there should be a standard schema/data model for the county so as to improve the consistency and integrity of data being currently used and those that will be used in the future. The county should also adopt some standards for data collection, validation, management, and use. Also, cartographic standards should be established to ensure that data is updated

The Project on Integrated Urban Development Master Plan for the City of Nairobi in the Republic of Kenya
Nippon Koei Co., Ltd. 9-48 Final Report IDCJ Inc. EJEC Inc.
frequently and efficiently with less effort to ensure that the process becomes less of a task.
Integrated GIS will improve the integrity and reliability of data since all the data will be handled as a package. This will help in identifying errors within the data. Therefore, JST recommends and urges the Survey of Kenya to adopt package management of GIS data as a way of ensuring that GIS data meets the required standards. Regular updates should also be done by the Survery of Kenya.
9.4.6 Management Proposal of an Integrated GIS
The JST proposes an Integrated GIS for management of GIS data. An Integrated GIS is a system that enables electronic sharing of data integrated on a map and may include information such as roads, urban areas (land use), buildings, rivers, development approvals, zoning policy, urban facility improvement plans, and any other information that is available within the departments being served by the integrated system.
Currently, in the NCC structure, each sector creates and maintains its own information. It is not possible to share data within the sectors and therefore, there is a duplication of data and effort that leads to loss of resources, time, and productivity.
By constructing a system (security of accuracy and quality of data, operating rules, and cooperation with the development organisations) there will be a high degree of operations, rapid exchange of information, and a reduction on the maintenance costs of the data. In addition, overlay analysis of data will be made possible by working with external organisations where high-level information can be shared.
Other advantages of having an Integrated GIS in public office operations are the following:
・Operational efficiency and effective use of existing assets, ・Availability of a comprehensive range of administrative services to respond to diverse needs, and ・Improvement of policy management.
Use SpaseDB
Water Supply and
Sewerage SystemsDB
Water and Sewerage management
Road Trafficmanagement
Wastemanagement
•Pipe and Drain•Start-Service Area•Construction Information
•Disposal Plant•Waste Generation Status•Collection Point Information
*Data provided deportment search and viewable
Base Map ・ Satellite Image
Connection Pole Data
Power Pole Data
Road・Railway DB
WasteDB
Integrated GIS
•Use District•Land Use Condition•Land Ownership
•Road Boundary•Railway Boundary•Construction Information
Use Inquiry・Land Usemanagement
Searching
Source: JICA Study Team (JST)
Figure 9.4.9 Image of an Integrated GIS

The Project on Integrated Urban Development Master Plan for the City of Nairobi in the Republic of Kenya
Nippon Koei Co., Ltd. 9-49 Final Report IDCJ Inc. EJEC Inc.
Integrated GIS
Institutions of the County and Nairobi County
Public and Public Interest Organization
Private Corporation
Source: JICA Study Team (JST)
Figure 9.4.10 Cooperation with External Organisations(Data Sharing)
9.4.7 Management Proposal for an Open Policy on GIS Data
The JST also proposes an open policy on GIS data in order to promote the sharing of data developed by an integrated GIS.
An open policy is meant to assist residents and businesses to view maps through the internet or an intranet based on publicly available data shared from an Integrated GIS. It promotes information sharing which leads to improved communication, improved service delivery, and efficiency in administrative functions.
Introduction of an open policy makes it possible for a resident to browse from a tablet device or a computer any information held by the government for the general public. Residents may also opt to share information with the government.
In summary, the advantages of having an open policy in front office public operations include the following:
・Dissemination of information to residents, ・Bi-directional information transmission between the local community and residents, ・Creation of opportunities through the use of locally available information, ・Provision of an online and one-stop service point for administrative functions, and ・Improvement of government accountability through the sensitisation of local residents on matters
to do with administrative evaluation.

The Project on Integrated Urban Development Master Plan for the City of Nairobi in the Republic of Kenya
Nippon Koei Co., Ltd. 9-50 Final Report IDCJ Inc. EJEC Inc.
BusinessThe Population
Integrated GIS
Publish GIS Information on the
Internet
Public Office
Source: JICA Study Team (JST)
Figure 9.4.11 Image of an Open-type GIS

The Project on Integrated Urban Development Master Plan for the City of Nairobi in the Republic of Kenya
Nippon Koei Co., Ltd. 10-1 Final Report IDCJ Inc. EJEC Inc.
CHAPTER10 SOCIAL AND ENVIRONMENTAL CONSIDERATIONS
10.1 Social and Environmental Considerations for Master Plan Formulation
10.1.1 Basic Policy for Social and Environmental Considerations for Nairobi Integrated Urban Development Master Plan (NIUPLAN)
It is essential to establish relevant environmental and social management programs or plans within the development of long-term urban development master plan (MP). Within this NIUPLAN, the environmental and social considerations related with the implementation of NIUPLAN is achieved through a series of intensive participatory and information disclosure process, based on the Constitution of Kenya (2010), County Government Act (hereinafter referred to as County Government Act (CGA)) No. 12 of 2012, Urban Areas and Cities Act No. 13 of 2011, the National Environment Management Authority’s (NEMA) SEA Guideline (2012), the JICA Guidelines for Environmental and Social Considerations (2010), and other enabling legislation on civic education. In particular, Kenya’s Constitution (2010), CGA, and the Urban Areas and Cities Act 2011, mentioned above, stress out the importance of public participation, and regard it as one of its key principles and value for sustainable development. Subsquently, the right of timely access to information, data and/or documents, public participation, and relevant education for any policy formulation processes are legally protected under this legal framework in Kenya.
Within this NIUPLAN, most of public participatory processes are achieved throughout a series of stakeholder meeting program, developed and implemented within the strategic environmental assessment (SEA) of NIUPLAN. More detailed descriptions of this SEA study and stakeholder meeting and its relevant activities are described in following sections.
10.1.2 Requirement of the Strategic Environmental Assessment (SEA)
The Environmental (Impact Assessment and Audit) Regulations, 2003, mentioned that lead agencies should subject all public policies, plans, and programs (PPP) to SEA. During the SEA process, the likely significant effects of a PPP on the environment shall be identified, described, evaluated, and reported. The full range of potential effects and impacts are covered, including secondary, cumulative, synergistic, short-, medium- and long-term, permanent, and/or temporary impacts. It is noted that Nairobi City County (NCC) is the lead agency within the NIUPLAN study.
Basically, with close consultation with NEMA, the lead agencies, public and private institutions as well as individuals can initiate the SEA process. Section 42 (3) of the Environmental (Impact Assessment and Audit) Regulations, 2003, commits the government and all lead agencies to incorporate principles of the SEA in the development of public sectoral, national, and regional policies. Based on this rational, the SEA study is conducted within NIUPLAN. More detailed descriptions of the SEA procedures will be described in the following sections.

The Project on Integrated Urban Development Master Plan for the City of Nairobi in the Republic of Kenya
Nippon Koei Co., Ltd. 10-2 Final Report IDCJ Inc. EJEC Inc.
10.1.3 Framework of SEA Study for NIUPLAN
(1) Outline
As mentioned above, the SEA study for this NIUPLAN is conducted based on both the NEMA’s SEA Guideline (2012) and the JICA Guidelines for Environmental and Social Considerations (2010). Terms of Reference (ToR) development of the SEA study consists of two steps. The first one was started in January and February 2013 throughout a series of discussions with NEMA and the City Council of Nairobi, CCN (currently NCC), and then, the first ToR (fundamental version) was developed in February 2013 while initiating relevant NIUPLAN-SEA study. More detailed descriptions of this fundamental version of ToR are summarised in Section 10.2 of this report.
After the administrative reform, conducted in April 2013, CCN was transformed into Nairobi City County (NCC), and then, the on-going NIUPLAN had to unconditionally incorporate several important concepts of CGA into its SEA study implementation. Eventually, the amendment of the fundamental version of ToR, mentioned above, was initiated and finalised around August 2013. More detailed descriptions of this amended version of ToR is summarised in Section 10.3 of this report.
(2) County Government Act (CGA)
The CGA was enacted in 2012, and stipulates the strong and comprehensive public participation process within the SEA study of NIUPLAN. Within the CGA, public participation (Part VIII), communication and access to information (Part IX), and civic education regarding the PPP development work by NCC (Part X) are specifically emphasised for implementation (more detailed descriptions of CGA are summarised in Section 2.2.1 of the Progress Report). In this regard, the ToR for the SEA procedure undertaken by a subcontract, contract of which had been concluded in February 2013, was duly amended to incorporate several key concepts of CGA mentioned above.
Throughout this ToR amendment, an entire SEA process of NIUPLAN becomes a strong “stakeholder meeting”- centered (or community participatory) SEA. To achieve a smooth implementation of this SEA, a new ad-hoc group, named as the “Master Plan Secretariat”, is established under the supervision of the Director of the City Planning Department, NCC (see Figure 10.1.1). The main role of this newly created secretariat is to supervise all SEA process with relevant technical assistances of the JICA Study Team (JST). Also, this secretariat will establish liaisons with NEMA, relevant governmental organisations, universities, schools, and international development partners including JICA, NGOs, and key stakeholder. Public relation program, which is one of the key components of this SEA process, is developed and implemented by this secretariat with technical support from JST. Information disclosure through the website of this master plan and SEA will be organised by this secretariat.
Source: JICA Study Team (JST), 2014
Figure 10.1.1 SEA Implementation Framework
Nairobi City County Master Plan Secretariat254 714 994 822 254 733 953 729 (8.00 a.m-5.00 p.m)
JICA Study Team
・Website Management Task Group・Stakeholder Meeting Task Group ・Intra-department Coordination Group ・Civic Education Preparation Group ・Inter-county/or District Coordination Group ・Inter-ministerial Coordination Group ・Liaison with NEMA ・Others

The Project on Integrated Urban Development Master Plan for the City of Nairobi in the Republic of Kenya
Nippon Koei Co., Ltd. 10-3 Final Report IDCJ Inc. EJEC Inc.
10.2 SEA (Fundamental Version)
10.2.1 Development of the Terms of Reference reflecting the SEA Guideline
Based on the SEA Guideline of Kenya, mentioned above, the ToR for successful SEA study for NIUPLAN (fundamental version) was developed in February 2013. Key SEA study steps, to be required for this NIUPLAN study and incorporated into ToR development, are summarised in Table 10.2.1.
Table 10.2.1 Main Tasks of SEA specified by the SEA Guideline of Kenya 1 Preparatory Work (Preparation and Submission of PPP Brief)2. Scoping 2-1 Determine the Scope of SEA 2-2 Carry out Scoping 2-3 Process Criteria 2-4 Stakeholder Identification and Schedule of Stakeholder Meeting 2-5 Alternative Plan Identification 2-6 Preparation and Submission of the Scoping Report
3 Detailed SEA Study 3-1 Collection of Baseline Information 3-2 Situation Analysis 3-3 Identification, Prediction, and Evaluation of Potential Impacts 3-4 Alternative Comparison 3-5 Impact Mitigation and Opportunities Enhancement
3-6 Preparation and Submission of the Draft SEA Report 4. Public Review 5 Stakeholder Meeting 4-1 Conduct Stakeholder Meeting 4-2 Collect all comments and/or opinions from those meetings 6 Revision of the Draft SEA Report, Preparation and Submission of the SEA Final Report All revision works shall be conducted based on collected comments and/or opinions mentioned above. 7 Stakeholder Validation Meeting 8 Approval of the SEA Final Report 9 Monitoring and Evaluation Source: NEMA, 2012
More detailed descriptions for each SEA step, mentioned above, are summarised as follows:
(1) Submission of PPP (Policy, Plan, and Program) Brief
The SEA Review Applicant shall prepare the Policy, Plan and Program (PPP) brief and submit it to NEMA for guidance. Then, NEMA will undertake the screening in order to determine whether SEA is required or not for the PPP concerned. The result shall be noticed within seven working days. If it is concluded that SEA is required, NEMA will advise the SEA applicant on the recruitment of the registered SEA consulting firm and/or expert. A selected consulting firm and/or expert are required to perform a successful SEA-related study. Throughout the SEA study in Kenya, the first deliverable to be submitted to NEMA is the scoping report, to be described in the next section.
(2) Preparation of the Scoping Report
A registered consultant shall conduct scoping work for this SEA-related work. During this scoping process, the consultant shall develop an appropriate ToR for SEA (i.e., a detailed SEA study, to be described in the subsequent section) for NIUPLAN, prepare the scoping report, and then, submit both documents to NEMA for those approvals. NEMA will review the adequacy of both the scoping report and ToR (draft) of a detailed SEA study, and then, a decision is reached on whether more information is required or approval should be granted. This decision will be notified to the proponent within twenty one working days.

The Project on Integrated Urban Development Master Plan for the City of Nairobi in the Republic of Kenya
Nippon Koei Co., Ltd. 10-4 Final Report IDCJ Inc. EJEC Inc.
(3) Detailed SEA Study
After obtaining both approvals of the scoping report and ToR for SEA, a detailed SEA study shall be initiated. Following are key tasks to be conducted within the detailed SEA Study:
(i) Collection of baseline information,
(ii) Situation analysis,
(iii) Identification, prediction, and evaluation of potential impacts,
(iv) Alternative comparison,
(v) Impact mitigation and opportunities enhancement, and
(vi) Preparation and submission of the draft final SEA report.
Then, the SEA final report shall be summarised, reflecting all comments obtained from the following review processes, to be required within SEA in Kenya:
1. Administrative reviews, and
2. Stakeholder reviews.
In Kenya, the stakeholder reviews, mentioned above, consist of following three parts, i.e., (i) public review, (ii) review by lead agencies, and (iii) review by an expert committee.
(4) Public Review
In Kenya, the PPP owner shall ensure that two notices regarding the draft final SEA report are published, a week apart from each other in both the Kenya Gazette and a credible newspaper with the nationwide circulation. Generally, the public has thirty working days (from the first advertisement) to submit comment on a plan- or program-level SEA process.
(5) Stakeholder Meeting
As discussed earlier, the stakeholder meeting is one of the important parts of this SEA-related technical assistance study for NIUPLAN. According to the discussion between NEMA and JST, held on 22 January 2013, NEMA suggested to have multiple stakeholder meetings for different social tiers such as: (i) groups consisting of district government officials and school, NGOs, and (ii) general stakeholder meetings at each district. Based on these discussions, a comprehensive stakeholder meeting program was developed for the SEA study of NIUPLAN. Basically, all stakeholder meetings are categorised into the following two groups, depending on the SEA study phases, i.e., (i) preliminary stakeholder meetings, conducted during the scoping study phase, and (ii) full-scale stakeholder meetings, conducted during a detailed SEA study. Within the SEA process of this NIUPLAN study, eighteen (18 meetings=2 meetings/district x 9 districts) preliminary stakeholder meetings and fifty four (54 meetings=2 meetings/district x 9 districts x 2 + 18 selected sector groups) meetings are scheduled to be conducted. Besides, 23 public consultations are organised and held by NCC in order to discuss the key sectoral issues of NIUPLAN with stakeholders at the final stage of a detailed SEA study period. More detailed descriptions of this stakeholder meeting and the public consultation are summarised in Sections 10.3 and 10.4.
(6) Stakeholder Validation Workshop
Beside those stakeholder meetings, mentioned above, the stakeholder validation workshop is required to be held for the presentation of the SEA final report. The validation meeting of this NIUPLAN- SEA was conducted on 24th September, 2014. Before this meeting, 10 comments, obtained from the report examinations of SEA (D/F), submitted on 17th May, 2014, were collected, and then, passed forward to NCC from NEMA. Based on these comments, report revising was conducted, and then, summary of all comment-response, made by NCC, were explained within that validation meeting.

The Project on Integrated Urban Development Master Plan for the City of Nairobi in the Republic of Kenya
Nippon Koei Co., Ltd. 10-5 Final Report IDCJ Inc. EJEC Inc.
(7) Entire Schedule of the NIUPLAN SEA Study
As mentioned earlier, the SEA study is conducted in order to obtain approval from NEMA and make the proposed NIUPLAN official urban development master plan in Kenya. Following are the key milestones of the NIUPLAN SEA study:
10.2.2 NCC Internal Preparatory Meeting
Prior to the preliminary stakeholder meeting, to be described in the following section, three preparatory meetings, i.e., (i) NCC internal meeting, (ii) NCC assembly meeting, and (iii) Sensitisation meeting (see Table 10.2.2) were held in order to achieve and consolidate the internal study consensus within NCC as well as to prepare for a well-organised start in a series of stakeholder meetings. After these three preparatory meetings, 18 preliminary meetings were conducted during the scoping study period in order to grasp the current urban issues and baseline concern for NIUPLAN from the general public.
Table 10.2.2 Three Preparatory Meetings Objectives1 NCC Internal Meeting To explain the MP and SEA outlines to the directors of each department of NCC while
achieving study consensus internally.2 NCC Assembly Meeting To explain the MP and SEA outlines to the NCC Assembly and district commissioners
while achieving study consensus.3 Sensitisation Meeting First general stakeholder meeting. To explain the MP and SEA outline and a series of
public participation process to be followed during both scoping and detailed SEA studies periods to stakeholders.
Source: JICA Study Team (JST)
10.2.3 Preliminary Stakeholder Meeting
The NCC consists of the following nine districts, i.e., Kasarani, Westlands, Starehe, Kamukunji, Dagoretti, Langata, Makadara, Embakasi, and Njiru. Each district is further divided into wards, and the entire Nairobi City is divided into 85 wards in total. As mentioned earlier, two preliminary stakeholder meetings were held at each district in order to grasp current baseline urban issues such as environmental and social concerns that residents including government officials of each county have. The advertisement of those meetings was conducted by posters, radio, newspaper, and TV. Table 10.2.3 summarises the schedule of preliminary stakeholder meetings conducted at each district.
A. Correspondence with NEMA 1. Submission of PPP Brief to NEMA 6 April 2013 2. Reply from NEMA (PPP) 16 April 2013 3. Submission of the Scoping Report and SEA-ToR to NEMA 28 October 2013 4. Reply from NEMA (Scoping Report) 10 December 2013 5. SEA DF preparation and submission to NEMA 17 May 2014 6. SEA Final Report submission to NEMA 08 October 2014 7. Preliminary Approval of NIUPLAN-SEA 27 October 2014 B. Major Activities 1. Preliminary Stakeholder Meeting August and September 2013 2. 1st Stakeholder Meeting Campaign November and December 20133.2nd Stakeholder Meeting Campaign December 2013–March 2014 4. 3rd Stakeholder Meeting Campaign January 2014 5. NCC’s Public Consultation January 2014–February 2014 6. Civic Education 10 March–28 March 2014 7. SEA Validation Meeting 24 September, 2014

The Project on Integrated Urban Development Master Plan for the City of Nairobi in the Republic of Kenya
Nippon Koei Co., Ltd. 10-6 Final Report IDCJ Inc. EJEC Inc.
Table 10.2.3 Schedule of 18 Preliminary Stakeholder Meetings District Number of Wards 1st Meeting 2nd Meeting
1 Kasarani 14 29 August 2013 5 September 2013 2 Westlands 7 30 August 2013 6 September 2013 3 Starehe 12 28 August 2013 4 September 2013 4 Kamukunji 5 27 August 2013 10 September 2013 5 Dagoretti 8 26 August 2013 10 September 2013 6 Langata 10 28 August 2013 4 September 2013 7 Makadara 4 28 August 2013 4 September 2013 8 Embakasi 23 27 August 2013 5 September 2013 9 Njiru 2 29 August 2013 30 August 2013
Source: JICA Study Team (JST), 2014
Table 10.2.4 shows an example of the meeting program of this preliminary stakeholder meeting held at Dagoretti on 26 August 2013. Basically, the other 17 preliminary meetings were held using a similar program as this, reflecting specific features of each district.
Table 10.2.4 Meeting Program of Preliminary Stakeholder Meeting held at Dagoretti District TIME ACTIVITY
1 09:00-10:00 Arrival and Registration of Participants2 10:00-10:15 Introduction of Participants3 10:15-10:30 Opening Remarks by the Dagoretti Deputy County Commissioner4 10:30-10:45 Speeches by the Dagoretti Sub-county Members of the Parliament and County Assembly5 10:45-11:05 Presentation of the Master Plan-NCC6 11:05-11:20 Presentation of the SEA-GIBB7 11:20-12:15 Question and Answer Session8 12:15-12:30 Questionnaire Survey9 12:30-12:45 Closing Remarks
10 12:45-13:00 Tea/Guests Leave at their own pleasureSource: JICA Study Team (JST), 2014
10.3 County Government Act and Public Participation
10.3.1 Development of Terms of Reference Reflecting the County Government Act
Upon reviewing the CGA, two new tasks, i.e., (i) website creation of NIUPLAN - SEA and its operation (see Section 10.3.2 for more detailed descriptions), and (ii) civic education (see Section 10.3.4 for more detailed descriptions), are added into the original ToR (fundamental version), developed in February 2013, in order to encourage comprehensive information disclosure and make the entire MP development process more participatory through this SEA process (see Table 10.3.1). Besides, a more comprehensive public advertisement scheme, using poster, TV, radio, newspaper, and website are also employed. More detailed descriptions of this public advertisement scheme, developed within this SEA study, are summarised in Section 10.3.2.
Table 10.3.1 Newly Added Task to Previous SEA Newly Added Task Task Descriptions
1 Civic Education Convene in three weeks, open house seminar at the city hall and display all MP study results by sector. Any citizen who is interested can visit and have MP explanation.
2 Website Creation of SEA and its Operation
To encourage strong public participation into this MP development, a website of SEA and MP will be developed. The main purpose of this website creations are as follows: (i) Establish good communication between NCC, Nairobi City’s citizens, and other key stakeholders. (ii) Enhance prompt information disclosure.
Source: JICA Study Team (JST), 2014
Table 10.3.2 summarises the main tasks of amended SEA-ToR, combining both SEA Guidelines and CGA.

The Project on Integrated Urban Development Master Plan for the City of Nairobi in the Republic of Kenya
Nippon Koei Co., Ltd. 10-7 Final Report IDCJ Inc. EJEC Inc.
Table 10.3.2 Main Tasks of SEA, specified by both SEA Guideline of Kenya and CGA 1. Preparatory Work (Preparation and submission of PPP Brief) This task will be conducted by both NCC and JST. 2. Scoping 2-1 Determine the Scope of SEA 2-2 Carry out Scoping 2-3 Process Criteria 2-4 Stakeholder Identification and Schedule of Stakeholder Meeting 2-5 Alternative Plan Identification 2-6 Preparation and Submission of the Scoping Report
3. Detailed SEA Study 3-1 Collection of Baseline Information 3-2 Situation Analysis 3-3 Identification, Prediction, and Evaluation of Potential Impacts 3-4 Alternative Comparison 3-5 Impact Mitigation and Opportunities Enhancement
3-6 Preparation and Submission of the Draft SEA Report 4. Public Review 5 Stakeholder Meeting 4-1 Conduct Stakeholder Meeting 4-2 Collect all comments and/or opinions from those meetings 6. Civic Education (newly added) 7. Website Creation of SEA and its Operation (newly added) 8. Revision of the Draft SEA Report, Preparation and Submission of the SEA Final Report All revision works shall be conducted based on collected comments and/or opinions, mentioned above. 9. Stakeholder Validation Meeting 10. Approval of the SEA Final Report 11. Monitoring and Evaluation
Note: Tasks 6 and 7 (Civic Education and Website Creation, respectively) are added to the original ToR. Source: NEMA, 2012 and County Government Act of 2012
10.3.2 Public Advertisement
In order to encourage interaction between the MP owner (i.e., NCC) and Nairobi City’s citizens, and to raise wide MP concerns therein while responding to both CGA and Urban Areas and Cities Act No. 13 of 2011, a comprehensive public advertisement scheme is developed, by poster, TV, radio, newspaper and the NIUPLAN website (see Table 10.3.3).
Table 10.3.3 Summary of Public Advertisement Descriptions1 Poster 500 copies of advetisement posters are put on notice boards of the city hall, district
commissioner’s office, and other public places (e.g., bus stops, railway stations, churches, mosques, venues of meetings) across the city in the following four different times: First: 24 August 2013 (for Preliminary SHMs) Second: 22 November 2013 (First Campaign of SHMs) Third: 3 January 2014 (Second Campaign of SHMs) Fourth: 13 January 2014 (Third Campaign of SHMs)
2 TV Advertisements in English and Ki-Swahili were conducted four times. As of March 2014, the following two TV advertisements were done: First: 27 August 2013 (First Campaign of SHMs) Second: 19 and 20 March 2014 (Civic Education)
3 Radio Advertisements in English and Kiswahili were conducted eight times First: Late of August of 2013 Second: 9 January 2014 (Third Campaign of SHMs) Third: 13 January 2014 (Third Campaign of SHMs) Fourth: (9 days x 4 times/day = 36 times): 18, 19, 20, 21 March and 24, 25, 26, 27 and
28 March (Civic Education)

The Project on Integrated Urban Development Master Plan for the City of Nairobi in the Republic of Kenya
Nippon Koei Co., Ltd. 10-8 Final Report IDCJ Inc. EJEC Inc.
Descriptions4 Newspaper Advertisements in English were conducted eleven times (as of March 2014)
First: 22 July 2013 (for First Workshop) Second: 31 July 2013 (for First Workshop) Third: 24 August 2013 (for preliminary SHMs) Fourth: 29 August 2013 (for preliminary SHMs) Fifth: 22 November 2013 (for Fist Campaign of SHMs) Sixth: 3 January 2014 (for Second Campaign of SHMs) Seventh: 13 January 2013 (for Third Campaign of SHMs) Eighth: 7 March 2014 (Civic Education) Ninth: 14 March 2014 (Civic Education) Tenth: 21 March 2014 (Civic Education) Eleventh: 27 March 2014 (Civic Education)
5 Website Specific website for the NIUPLAN study and its SEA is established as follows: http://citymasterplan.nairobi.go.ke/ Specific Email Address for the Proposed Master Plan, [email protected]
Its full-scale operation started on 10 September 2013Source: JICA Study Team (JST), 2014
10.3.3 Public Meeting
During the detailed SEA study period, a series of stakeholder meetings were conducted. Basically, the entire stakeholder meeting consists of the following three parts, i.e., (i) fist stakeholder campaign, (ii) second stakeholder campaign, and (iii) third stakeholder campaign (see Tables 10.3.4–10.3.6). Within the first and third stakeholder campaigns, a focused group meeting (e.g., participants from county government officials, local NGOs representative, community leaders, and other key persons) and a general public meeting were held at each county. Within the second stakeholder meeting campaign, consultations were conducted for several selected sector groups. The selection of each sector group was conducted throughout a series of discussion with NCC.
Table 10.3.4 Summary of the First Stakeholder Meeting (Detailed SEA Study) Subcounty/
District Meeting 1: Focused Group Meeting 2: Public Meeting Date and Time Attendance Date and Time Attendance
1 Kamukunji 26 Nov 2013, 10 am 15 26 Nov 2013, 2 pm 160 2 Kasarani 27 Nov 2013, 2 pm 16 27 Nov 2013, 10 am 114 3 Dagoretti 29 Nov 2013, 10 am 15 29 Nov 2013, 2 pm 32 4 Lang’ata 2 Dec 2013, 2 pm 18 2 Dec 2013, 10 am 95 5 Njiru 2 Dec 2013, 10 am 34 3 Dec 2013, 2 pm 66 6 Makadara 4 Dec 2013, 10 am 42 4 Dec 2013, 2 pm 70 7 Embakasi 5 Dec 2013, 10 am 20 5 Dec 2013, 2 pm 92 8 Westlands 11 Dec 2013, 10 am 18 11 Dec 2013, 2 pm 82 9 Starehe 9 Dec 2013, 10 am 18 17 Dec 2013, 10 am 108 Total 196 Total 819
Source; JICA Study Team (JST), 2014
Table 10.3.5 Summary of the Second Stakeholder Meeting (Selected sectoral group, Detailed SEA Study) Target Groups Date Attendance
1 Women 9 January 2014 3 2 Elderly* Cancelled - 3 Youth 9 January 2014 8 4 Disabled 10 January 2014 3 5 Children 12 December 2013 7 6 Residents Association 13 January 2013 22 7 Professional Associations 14 January 2014 8 8 Business Associations 14 January 2013 4 9 Implementing Agencies 23 January 2013 7 10 Regulatory Agencies 23 January 2014 13 11 Learning Institutions (universities) 16 January 2014 11 12 County Executives* Cancelled - 13 Kiambu 4 March 2014 30 14 Machakos 25 February 2014 17 15 Kajiado 27 February 2014 31

The Project on Integrated Urban Development Master Plan for the City of Nairobi in the Republic of Kenya
Nippon Koei Co., Ltd. 10-9 Final Report IDCJ Inc. EJEC Inc.
Target Groups Date Attendance 16 Nyandarua 5 March 2014 27 17 Murang’a* Cancelled - 18 National Level * Cancelled - 19 Solid Waste Management* Cancelled - Total 191
Source; JICA Study Team (JST), 2014
Table 10.3.6 Summary of the Third Stakeholder Meeting (Detailed SEA Study)
Subcounty/ District
Meeting 1: Focused Group Meeting 2: Public Meeting Date and Time Attendance Date and Time Attendance
1 Kamukunji 14 Jan 2014, 10 am 22 14 Jan 2014, 2 pm 84 2 Kasarani 8 Jan 2014, 2 pm 19 8 Jan 2014, 10 am 74 3 Dagoretti 9 Jan 2014, 10 am 13 9 Jan 2014, 2 pm 79 4 Lang’ata 13 Jan 2014, 10 am 13 22 Jan 2014, 10 am 98 5 Njiru 15 Jan 2014, 10 am 29 15 Jan 2014, 2 pm 93 6 Makadara 16 Jan 2014, 10 am 13 16 Jan 2014, 2 pm 141 7 Embakasi 17 Jan 2013, 10 am 29 17 Jan 2014, 2 pm 107 8 Westlands 10 Jan 2014, 10 am 21 10 Jan 2014, 2 pm 26 9 Starehe 21 Jan 2014, 10 am 10 21 Jan 2014, 2 pm 99 Total 169 Total 801
Source; JICA Study Team (JST), 2014
10.3.4 Stakeholder Validation Workshop
As mentioned before, the validation meeting of this NIUPLAN- SEA was conducted at Kenya School of Monetary Studies on 24th September, 2014. The main objective of this meeting is to explain NCC’s approaches to comments for SEA (D/F), submitted on 17th May, 2014, to the public, and then, establish consensus to move forward to the next step, i.e., the preparation of the SEA Final Report. During the report examination period of SEA DF Report, 10 comments were collected. Most of comments show concerns about the integrity of NIUPLAN with other urban policies and plans. Based on these comments, the report revising was conducted, and then, summary of all comment-response, made by NCC, were explained within that validation meeting (see Figure 10.3.1).
SEA Validation (part 1)
SEA Validation (part 2) Source: JICA Study Team, 2014
Figure 10.3.1 Photo Records of SEA Stakeholder Validation Workshop
Additional issues were also raised during that meeting. Incorporating those comments, then, the SEA final report was prepared, and then, submitted to NEMA on 8th October, 2014. Final report examination was conducted by NEMA and the preliminary approval of NIUPLAN-SEA study was issued on 27th October, 2014.

The Project on Integrated Urban Development Master Plan for the City of Nairobi in the Republic of Kenya
Nippon Koei Co., Ltd. 10-10 Final Report IDCJ Inc. EJEC Inc.
10.3.5 Website Management
(1) Introduction
The website for NIUPLAN is developed (its domain name is http://citymasterplan.nairobi.go.ke/). The main objectives of this website development are the following: (i) to promote public participation, (ii) to provide opportunities for the general public and key stakeholders to learn the master plan formulation, (iii) to educate the general public about the master plan development process (i.e., support for the empowerment) and provide opportunities for citizenry participation during the formulation process, (iv) to obtain feedback from the general public and key stakeholders, and (v) to respond to both CGA and Urban Areas and Cities Act No. 13 of 2011. Those feedbacks will be integrated within the master plan formulation process.
The website development is part of the strategies for strengthening public participation in the formulation of NIUPLAN. This is alongside public advertisement in the newspapers, television, radio, and targeted posters.
(2) Content
This website contains the following features:
(i) Outline of the entire MP Study,
(ii) Relevant information regarding the proposed MP Study (e.g., material of JCC, Thematic meeting),
(iii) Interim, Progress, Draft Final, and Final Report,
(iv) Stakeholder program (e.g., notice of date, venue, and others),
(v) Question and answers session,
(vi) List of past question and answer session with attendance list,
(vii) Civic education program (notice of date, venue, and others), and
(viii) All education material used for civic education.
Figure 10.3.2 shows the website outline and architecture, developed for this master plan study. Throughout this website, the following three goals were established, including: (i) comprehensive information disclosure, (ii) learning opportunity, and (iii) constructive interaction between NCC and the general public. Figure 10.3.3 shows the front page image of the developed website for this integrated urban development MP Study. It is noted that all questions and/or comments, obtained through this website are received by the NIUPLAN website management task group, and then, some of them are passed forward to relevant sections and/or specialists for more detailed examination as well as appropriate response preparations.

The Project on Integrated Urban Development Master Plan for the City of Nairobi in the Republic of Kenya
Nippon Koei Co., Ltd. 10-11 Final Report IDCJ Inc. EJEC Inc.
Source: JICA Study Team (JST), 2014
Figure 10.3.2 Website Architecture
Source: JICA Study Team (JST), 2014
Figure 10.3.3 Front Page of the Website of NIUPLAN
(3) Website Operation Framework and Policy
The website will be operated by the NIUPLAN Secretariat with support from the selected subcontractor for the work (see Table 10.3.7).
Table 10.3.7 Website Operation Policy Task/Activity Frequency of Task/Activity1 Contents Collection Daily2 Content Approval Weekly (Friday)3 Website/Content Updating Weekly (Friday)4 Question and Answer (Website) Daily5 Munites of Meeting of Public Meetings Promptly after the meeting
Source: JICA Study Team (JST), 2014

The Project on Integrated Urban Development Master Plan for the City of Nairobi in the Republic of Kenya
Nippon Koei Co., Ltd. 10-12 Final Report IDCJ Inc. EJEC Inc.
Table 10.3.8 summarises examples of minutes of meeting of the weekly website/content updating meeting held on 20 September 2013 (Friday). Table 10.3.9 shows a summary of this periodical website management meeting held during the period between September 2013 and March 2014.
Table 10.3.8 Summary of Approved Contents for Website Updating A Thematic Working Group Materials
• Transport: 17 September 2013 • Land Use and Human Settlement: 17 September 2013
B Sensitisation Meeting of 5 August 2013 • Minutes of Meeting • Attendance List • Related Articles • Photos
C Update of Members of the Technical Working Groups (six Thematic Groups)Note that the content approval listed above was made on 20 September 2013 (Friday). Source: JICA Study Team (JST), 2014
Table 10.3.9 Summary of Website Management Meeting Date Key Agendas
1 20 September 2013 Inauguration. Update of the NIUPLAN website
2 27 September 2013 Issues carried over from previous meeting. Upload contents and sharing of Website User Rights. Contents for approval in the next meeting.
3 4 October 2013 Issues carried over from previous meeting. Upload contents. Statistics on the activity on the website,.Contents for approval in the next meeting.
4 11 October 2013 Issues carried over from previous meeting. Upload contents, Correspondence Report, Contents for approval in the next meeting.
5 18 October 2013 Same as above. 6 25 October 2013 Issues carried over from previous meeting. Integration of another contact e-mail address
within the website feedback form. Contents for approval in the next meeting. 7 1 November 2013 Issues carried over from previous meeting. Correspondence and website user statistics.8 22 November 2013 Issues carried over from previous meeting. Contents for approval.9 20 December 2013 Issues carried over from previous meeting. Contents for approval (meeting material of the
first campaign SHM and environment technical working group). Website user statistics.10 7 February 2014 Issues carried over from previous meeting. Contents for approval. The NIUPLAN e-mail
correspondence and reporting. Website user statistics.Note: This table was prepared based on the records summarised as of March 2014. Source: JICA Study Team (JST), 2014
Figure 10.3.4 shows the number of monthly website visits after its full operation started in September 2013. As of February 2014, a total number of recorded visits is 5,634. As shown in this Figure 10.3.3, a sudden increase in the number of website visitors is recognised after January 2014. This increase may correspond to the intensity and activeness of the public participation program, implemented within the SEA study of NIUPLAN. During last January and February, a series of second and third stakeholder meetings were held (see Tables 10.3.5 and 10.3.6). Besides, NCC conducted their NIUPLAN public consultation separately (see Table 10.4.1).

The Project on Integrated Urban Development Master Plan for the City of Nairobi in the Republic of Kenya
Nippon Koei Co., Ltd. 10-13 Final Report IDCJ Inc. EJEC Inc.
0
500
1000
1500
2000
2500
3000
3500
09/2013 10/2013 11/2013 12/2013 01/2014 02/2014 03/2014
Visits/Month
Monthly NIUPLAN Website Visits
Note that the total number of visits as of March 2014 is a recorded value on 24 March 2014. Source: JICA Study Team (JST), 2014
Figure 10.3.4 Monthly Website Number of Visits
10.3.6 Civic Education
As required by CGA, a civic education was held for three weeks, which started from 10 March 2014 (Monday) and finished on 28 March 2014 (Friday). The main objective of this civic education is to set up an open-house discussion place for Nairobi City’s Citizens who are interested in NIUPLAN and make possible a direct talk between Nairobi City’s citizens and NCC, and then, to disseminate relevant information of the proposed NIUPLAN to the general public. It is noted that no specific guideline for the duration of the civic education is specified in CGA, and the three weeks civic education was tentatively determined based on the internal discussion of NCC. In order to establish easy access to the venue of this civic education for the general public, the open space at the main gate is selected, and two permanent guides were assigned during this civic education program (see Figure 10.3.5). There were several times that the NCC personnel of the Department of Urban Planning attended this civic education to provide more professional explanation to visitors as per requests.
It is noted that the civic education program is not a one-time event but to be continued periodically in order to disseminate NIUPLAN information across the county as well as neighbouring regions. So, it is likely that more civic educations will be held in the near future. Figure 10.3.6 shows the time variation of the number of daily visitors for this civic education.
Advertisement Banner
Explanation of MP by Guides to Visitors
Panel Display of NIUPLAN
On-site explanation by the NCC Officials to the
visitors as per request.Source: JICA Study Team (JST), 2014
Figure 10.3.5 Photo Records of the Civic Education Program

The Project on Integrated Urban Development Master Plan for the City of Nairobi in the Republic of Kenya
Nippon Koei Co., Ltd. 10-14 Final Report IDCJ Inc. EJEC Inc.
0
10
20
30
40
50
60
70
80
Mar 10
Mar 11
Mar 12
Mar 13
Mar 14
Mar 17
Mar 18
Mar 19
Mar 20
Mar 21
Mar 24
Mar 25
Mar 26
Mar 27
Mar 28
Visitors/day
Source: JICA Study Team (JST), 2014
Figure 10.3.6 Number of Daily Visitors during the Civic Education
10.4 Analysis on Planning Alternatives (Structure Plan)
(1) Outline
Table 10.4.1 summarises five development structure alternative strategies proposed within this NIUPLAN study. In order to conduct an evaluation of the five proposed development structure alternative strategies, the following two matrices, namely: (i) Compound Matrix, and (ii) Risk and Opportunity Matrix, are developed.
Table 10.4.1 Summary of Proposed Development Structure Alternative Plans Structure Plan Image of Structure Characteristics
STR-1 CBD One Core System (mono core) (present trend)
Regarded as the “No Action” plan. Only one strong nuclei which will develop and there is no existence or important function in other centres.
STR-2 Sub-centre System (poly nucleated development)
There is no dominating single settlement; all nodes of the polycentric network have the same relevance as “spatial participation”.
STR-3 Sub-centre System (bi-polar corridor development)
Development of minor settlements along the transport corridor connecting two strong nodes.
STR-4 Sub-centre System (corridor cum ring development)
Development of settlements along the corridor and ring.
CBD
CBD
CBD
CBD

The Project on Integrated Urban Development Master Plan for the City of Nairobi in the Republic of Kenya
Nippon Koei Co., Ltd. 10-15 Final Report IDCJ Inc. EJEC Inc.
Structure Plan Image of Structure Characteristics STR-5 Diffused Development System
Development of two levels of corridor (within NCC and Greater Nairobi)
Source : JICA Study Team (JST), 2014
The compound matrix, mentioned above, is principally used to evaluate individual PPPs (Policy, Plan and Program) against a range of environmental criteria, which serve as indicators of the existing environmental and social conditions. This approach was used for the SEA study of Kumashi Urban Development Master Plan Study conducted in Ghana (JICA, 2013). Basically, this evaluation is conducted regarding four subcategories such as: (i) natural resources, (ii) socio-cultural, (iii) economic, and (iv) institutional. Table 10.4.2 shows a summary of the evaluation factors.
The environmental risk and opportunities matrix also mentioned earlier, helps to assess the potential risks and opportunities associated with each individual PPP, so that remedial and/or mitigation measures for the risk can be proposed and factored in the design of the PPP. Within this SEA study, a similar methodology used in Ghana is applied, reflecting the site-specific features across the study area.
Table 10.4.2 Evaluation Factors for SEA (draft) Natural Resources Socio-Cultural Economic Institutional Water Pollution Erosion Deforestation Ecosystem Conservation Flood
Waste ManagementTraffic Congestions Noise/Vibration Air Quality Illegal settlement Improvement of Safety and Amenity Land Litigation
UnemploymentPoor Accessibility to Market or Business Districts Poor Road Network Low Income
Urban Development ControlUrban Development Promotion System (Private Sector) Public Participation/Public Awareness Information Disclosure System
Source: JICA Study Team (JST), 2014
(2) Compound Matrix
Table 10.4.3 shows a summary of the compound matrix of each development structure alternative, as summarised in Table 10.4.1. Specific negative risks, associated with the implementation of each development structure alternative is summarised in the following section.
As summarised in Table 10.4.3, no positive impact can be recognised for STR-1 scenario (i.e., “No Action Plan”, and current city traffic congestion and its resultant roadside environmental conditions such as the air quality and noise are getting worse. By implementing any strategy from STR-2 to STR-5, certain amounts of alleviation of traffic congestions and the improvement of related roadside environment are expected to occur although several infrastructure developments shall be conducted around the current suburb areas of Nairobi City. More detailed pros and cons of each development structure alternative are summarised, using the risk and opportunity matrix in the next section.
CBD
: Nairobi City Boundary
: Greater Nairobi

The Project on Integrated Urban Development Master Plan for the City of Nairobi in the Republic of Kenya
Nippon Koei Co., Ltd. 10-16 Final Report IDCJ Inc. EJEC Inc.
Table 10.4.3 Compound Matrix for Selected Development Structure Alternatives Institutional
Eva
luat
ion F
acto
rs
Wat
er
body
pollu
tion
Ero
sion
Defo
rest
atio
n
Ecosy
stem
Conse
rvat
ion
Flo
odi
ng
Was
te M
anag
em
ent
Tra
ffic
Conge
stio
n
Nois
e/V
ibra
tion
Air
Qual
ity
Illega
l se
ttle
ment
Impr
ove
ment
of
Urb
an S
afety
and
Am
enit
y
Lan
d Lencro
achm
ent
Hig
h u
nem
ploym
ent
Poor
access
ibili
ty t
o m
arke
ts/or
busi
ness
dis
tric
t du
e t
o t
raff
ic jam
s
Poor
road
netw
ork
Low
Incom
e
Urb
anD
eve
lopm
ent
Contr
ol
Urb
an D
eve
lopm
ent
Pro
moti
on S
yste
m(P
riva
te S
ecto
r)
Publ
ic P
arti
cip
atio
n/pu
blic
aw
areness
Info
rmat
ion D
isclo
sure
Sys
tem
STR-1 ー ー - - - - - ー ー - - - 0 - - 0 - - ? ?
STR-2 ー ー - - - - ? ? ? ? ? ? + + + 0 + + + +
STR-3 ー ー - - - - ? ? ? ? ? ? + + + 0 + + + +
STR-4 ー ー - - - - ? ? ? ? ? ? + + + 0 + + + +
STR-5 ー ー - - - - ? ? ? ? ? ? + + + 0 + + + +
Note+ : Likely to be Positive
- : Likely to be Negative0 : Likely to be Neutral ? : Uncertain
Natural Resources Economic IssuesSocio-Cultural Issues
Source: JICA Study Team (JST), 2014
(3) Risk and Opportunity Matrix
Table 10.4.4 shows a summary of the environmental risk and opportunity matrix for selected development structure alternatives as summarised in Table 10.4.1. As shown in Table 10.4.4, each development structure alternative has its own advantage and disadvantage of its implementation, and preparation of relevant environmental and social management plan or program would be essential to make environmentally and socially sound implementations of those options. In the “Do-nothing scenario (i.e., STR-1, listed in Table 10.4.4)”, it would be obvious that the current county-wide issues such as disorganised land use conditions, traffic congestion, illegal settlement, improper waste treatment system, deforestation, and others will not be changed (most likely will be worsened).
From the urban development and management points of views, potential advantages to lessen the difficulties for implementation of urban development and/or improvement programs in the future would be significant. Besides, it can be expected that chronic shortage of basic infrastructure facilities such as waste disposal sites, one of the important current urban issues, would be solved by the implementation of NIUPLAN. It is noted that temporal environmental degradations would be inevitable within construction activities due to its implementation. It would be beneficial to prepare mid-term or long-term comprehensive regional management plans or strategies for the implementation of future urban development program based on any development structure alternatives (i.e., from STR-2 to STR-5, listed in Table 10.4.4). More specific environmental and social programs shall be developed after specific development projects including relevant construction plans are delineated.
Table10.4.4 Environmental Risk and Opportunity Matrix for Selected Development Structure Alternative Development
Structure Alternative
Anticipated Risk Proposed Mitigation/Implementation Guideline
STR-1 ・More worsened and disorganised land use across the entire county and resultant traffic congestion, illegal settlement, waste dumping, deforestation, and others. ・More traffic congestion inside the CBD, and resultant loss of business opportunities, more disorganised traffic safety, worsened roadside environment such as noise, vibration and air quality, and deterioration of urban amenity and environmental quality.
・ Need to establish organisedcomprehensive urban development program covering from land use, transport, social safety and services, and environment as well as relevant capacity development.

The Project on Integrated Urban Development Master Plan for the City of Nairobi in the Republic of Kenya
Nippon Koei Co., Ltd. 10-17 Final Report IDCJ Inc. EJEC Inc.
Development Structure
Alternative Anticipated Risk Proposed Mitigation/Implementation
Guideline
・Difficulties for implementation of urban development and/or improvement programs in the future remain. ・Worsened chronic shortage of basic infrastructure facilities (e.g., construction of new waste disposal sites). ・ Difficulties in the implementation of city-wide environmental and social management programs in the future remain.
STR-2 ・Compared with STR-1, congestion and crowdedness observed in CBD would be alleviated. ・Increased risk of temporal traffic jams during construction period of the new sub-centre. ・Possibilities that the newly developed sub-centre would become a new source of pollution exist. ・Possible future urban amenity degradation of the CBD area due to mass exodus of population to sub-centres (e.g., Detroit, USA). ・Risk of reduction of open spaces such as green, wetland, and forest areas would be increased due to the construction of new sub-centres.
・ Need to establish organised comprehensive regional development plan covering from basic infrastructure (e.g., transport network, adequate water supply, sewerage, waste management, and power supply) to other basic social services (e.g., school, medical centre, market, and others).・ Need to establish a region-wide comprehensive environmental and social management program covering social safety and services and environment for each sub-centre as well as relevant capacity development before its setup while establishing integrity with the regional development plan mentioned above.
STR-3 ・ Compared with STR-1 and STR-2, congestion and crowdedness observed in CBD would be further alleviated.・Increased risk of temporal traffic jams during construction period of the new sub-centre. ・Increased risk of temporal traffic jams during construction period of the new sub-centre and residential areas. ・The possibilities that the newly developed sub-centre and residential areas would become new pollution source would be larger than STR-2, but possible intensity and/or the order of the magnitude of future negative impacts of each sub-centre and residential area would be lessened due to the wider distribution of future population. ・Possible future urban amenity degradation of the CBD area due to mass exodus of population to new sub-centres and residential areas (e.g., Detroit, USA). ・Risk of reduction of open spaces such as green, wetland, and forest areas would be increased due to the construction of new sub-centres and residential areas.
・Same as above. ・Need more organised operation of regional transport network, water supply, and waste management system due to the increase of collective residential areas and sub-centres.
STR-4 ・Similar to STR-3, congestion and crowdedness observed in CBD would be further alleviated. ・Increased risk of temporal traffic jams during construction period of the new sub-centre. ・The possibilities that the newly developed sub-centre and residential areas would become new pollution source exist and possible intensity and/or the order of magnitude of future negative impacts of the sub-centre combined with residential areas would be larger than STR-3. ・Possible future urban amenity degradation of the CBD area due to mass exodus of population to new sub-centres and residential areas (e.g., Detroit, USA). ・Risk of reduction of open spaces such as green, wetland, and forest areas would be increased due to the construction of new sub-centres and residential areas.
・ Need to establish organised comprehensive regional development plan covering from basic infrastructure (e.g., transport network, adequate water supply, sewerage, waste management, and power supply) to other basic social services (e.g., school, medical center, market, and others).・ Need to establish region-wide comprehensive environmental and social management program covering social safety and services, and environment for each sub-centre as well as relevant capacity development before its setup while establishing integrity with the regional development plan mentioned above.
STR-5 ・Compared with STR-1, congestion and crowdedness observed at CBD would be alleviated. ・Increased risk of temporal traffic jams during construction period of the new sub-centre. ・Relevant development activities such as construction of the new sub-centres and its transport system and basic infrastructure will be wide-spread, and the risk to jeopardise the local flora/fauna would be increased (e.g., destruction of ecological corridors). ・The possibilities that the newly developed sub-centre and residential areas would become new pollution source would
・Same as above. ・ Need to establish inter-county coordination system to control transboundary pollutions and/or conflicts.

The Project on Integrated Urban Development Master Plan for the City of Nairobi in the Republic of Kenya
Nippon Koei Co., Ltd. 10-18 Final Report IDCJ Inc. EJEC Inc.
Development Structure
Alternative Anticipated Risk Proposed Mitigation/Implementation
Guideline
be wider than the previous four options, but possible intensity and/or the order of magnitude of the future negative impacts of each sub-centre and residential area would be lessened due to the wider distribution of future population. ・Risk of reduction of open spaces such as green, wetland, and forest areas, possibly wider than other structure plans would be increased due to the construction of new sub-centres and residential areas. ・Possible future urban amenity degradation of the CBD area due to mass exodus of population to new sub-centres and residential areas (e.g., Detroit, USA).
Source: JICA Study Team (JST), 2014
10.5 Integration of Public Comments in the Master Plan Based on the stakeholder meetings, held during the SEA study of NIUPLAN, NCC organised 23 public consultations across the city county (equivalent to one consultation/one constituency) to encourage the citizens to contribute and share their desired aspirations in the development of the city (see Table 10.5.1).
Table 10.5.1 Schedule of NCC’s 23 Public Consultation Meetings Constituency/or
Venue Date Constituency Date
1 Westland (1) 20 January 2014 13 Mathare North 29 January 2014 2 Kangemi 21 January 2014 14 Mathare 1 February 2014 3 Kileleshwa/Lavington 21 January 2014 15 Embakasi South 3 February 2014 4 Dagoretti North 22 January 2014 16 Starehe 12 February 2014 5 Dagoreti South 22 January 2014 17 Kamukunji 11 February 2014 6 Gigiri/Runda 23 January 2014 18 Embakasi West 5 February 2014 7 Kenya police CID
Pavilion, South C 23 January 2014 19 Makadara 6 February 2014
8 Kibra 27 January 2014 20 Embakasi East 8 February 2014 9 Karen/Langata 27 January 2014 21 Embakasi North 3 February 2014 10 Roysambu
constituency 28 January 2014 22 Embakasi central 4 February 2014
11 Garden Estate 28 January 2014 23 Embakasi East/Kasarani
13 February 2014
12 Roysambu/Kasarani 29 January 2014Source: NCC, 2014
The purpose of the consultations is to share information of the current city situation, challenges, and opportunities as well as contents of NIUPLAN, to have sectoral discussions with various stakeholders, and then, to further consolidate the study consensus. Within the forum, validity of development options were discussed in order to build consensus and agreements for selected priority programs and projects. In order to encourage more interactive deliberations and to gain more insights into the sectoral issues, thematic working group discussions were organised and more sector-specific discussions were conducted in each district. Tables 10.5.2–10.5.6 summarise major findings and remarks, commonly found within each sectoral discussion. More detailed minutes of meeting summaries of public consultation held at each constituency are attached in Appendix A. It is noted that those findings and remarks mentioned above are incorporated into NIUPLAN.
The entire consultation programs were divided into three sessions. The first session focused on the participant’s urban development-related expectations, general issues, and the current development situation including various sectors and emerging proposals. Within the second session, four thematic working group discussions were conducted, and all the participants further analysed the presentations, identified missing gaps, suggested proposals, and build consensus on priority programs and projects.

The Project on Integrated Urban Development Master Plan for the City of Nairobi in the Republic of Kenya
Nippon Koei Co., Ltd. 10-19 Final Report IDCJ Inc. EJEC Inc.
Then, within the third sessions, participants were encouraged to provide feedback and to share their comments and/or proposals while agreeing to make the MP move forward to the next steps.
Table 10.5.2 Major NIUPLAN Remarks obtained from Public Consultation (Urban Transport) Issues Findings and Proposals to NIUPLANA radial pattern focusing on the CBD as its centre
Construct strategic bypasses and ring roads
Inefficient public transport Introduce reliable and efficient mass rapid transport systems either through rail or bus services
Inefficient traffic management Functioning and synchronised traffic lights Poor non-motorised transport (NMT) provision
Make provisions for non-motorised transport
Source: NCC, 2014
Table 10.5.3 Major NIUPLAN Remarks obtained from Public Consultation (Urban Infrastructure) Issues Findings and Proposals to NIUPLANWater loss and development of water supply facilities
Explore the possibility of existing soft water boreholes
Storm water drainage not integrated
Integrated storm water and rain water management
Sewerage water not meeting the effluent standards
Development of new drainages systems and sewer lines Provision of better water and sewer policies
Energy supply - insufficient supply and high tariffs
Consider renewable energy Shift street lighting to solar energy Provide incentives for the installation and use of solar energy
Solid waste management insufficient collection, disposal
Collaboration with NCC and public for waste management Waste recycling; recycling plants
Source: NCC, 2014
Table 10.5.4 Major NIUPLAN Remarks obtained from Public Consultation (Land Use, Resettlement, and Social Service)
Issues Findings and Proposals to NIUPLANLand grabbing Mapping out and repossession of public land that has been previously
grabbed Embracing the construction of good quality high-rise development
Land tenure Consult with communities when preparing zone plans Land use change Enforce land tenure systems that encourage modern development Uncontrolled development Awareness creation on proper planning and planning regulations
NCC should be fully responsible for the approval of all development plans Housing Proper zoning as well as slum upgradingSocial amenities including health facilities and education facilities
Decentralisation of social facilities
Uncontrolled livestock farming NCC should consider advocating and funding urban agriculture Increasing crime Empowerment of the youth
Development of rehabilitation centres Provide street and estate lighting
Source: NCC, 2014
Table 10.5.5 Major NIUPLAN Remarks obtained from Public Consultation (Governance, Legislation, and Institutional Aspects)
Issues Findings and Proposals to NIUPLANPublic participation Engage the youth in the decision
Hold periodic public forums between national and county governments Set up a committee comprising of members of the public on matters of development Member of the County Assembly (MCAs) to sign a memorandum for public engagement.
Planning and policy formulation
Coordination in the county offices should be enhanced and officers informed on processes Employ more architects and planners
Communication Use of community radio program for dissemination of information Develop proper information dissemination and feedback mechanisms
Institutional management
Involve stakeholders in the policy making process Harmonise city by laws with the 2010 Constitution Decentralise county offices and services to bring services
Source: NCC, 2014

The Project on Integrated Urban Development Master Plan for the City of Nairobi in the Republic of Kenya
Nippon Koei Co., Ltd. 10-20 Final Report IDCJ Inc. EJEC Inc.
Table 10.5.6 Major NIUPLAN Remarks obtained from Public Consultation (Cross-cutting Issues) Issues Findings and Proposals to NIUPLANSafety and security There is a need to take security as a civic responsibility
Protecting the whistle blowers/witnesses Economic and social empowerment
Sensitisation and capacity enhancement
Sensitisation on specific roles in the planning process Capacity enhancement in areas where the skills are lacking or inadequate and where
necessary outsourcedTransparency and accountability
Establish proper transparency and accountability mechanisms subject to monitoring and evaluation
Set standards for service delivery with performance indicators and performance contractsLaw and enforcement Introduce mandatory site visits for evaluation of approved and upcoming developments
Repeal old, punitive, and contradictory legislation and by-laws and formulate policies that are more enabling
Source: NCC, 2014
In addition to stakeholder meetings, Validation Workshop was held on September 24, 2014 to validate SEA Report, confirming SEA recommendation to NIUPAN, as well as confirming contribution of SEA process to NIUPALN. Contribution of SEA process to NIUPLAN is summarized below.
Discussions and consensus building with thematic / stakeholder groups for incorporation of certain environmental and social considerations into the NIUPLAN development process. Specific contributions were on:
Environmental Guidelines for future planning for the proposed urban structure plans;
Detailed environmental analysis and ranking of structure plan alternatives;
Identification of sub-centres and stations that would require special guidelines and approvals to protect Nairobi National Park and gazetted forests within the City. These are Lang’ata, Karen, Woodley and Syokimau;
Participation in task-force to develop recommendations for consensus building on solid waste management in the City, specifically the issue of decommissioning of Dandora Dumpsite and the proposed Ruai Sanitary Landfill Site;
As a result of the discussions on solid waste management, the task-force recommended a change in NIUPLAN proposals to convert Dandora into a materials recovery facility. This is expected to ensure that any wastes disposed at the sanitary landfill site are inert, thus reducing the risk of bird strikes by aircraft;
Validation of the situational analysis sections of NIUPLAN through confirmation by stakeholders through-out the 68 meetings and 3 workshops held under the SEA for NIUPLAN;
The public meetings and discussions with residence associations were important for information dissemination on NIUPLAN and they also provided a platform for the citizens at sub-county level to question and contribute to the master plan and SEA processes;
The Focus Group Discussions and Key Informant Interviews with both civil society and public services allowed for validation of key issues by professionals in the City;
Contributions through submission of summary papers to NIUPLAN Secretariat for consideration in development of the City County Government policies and laws for both environmental and planning purposes. These contributions were based on the findings of the SEA for NIUPLAN;
Inter-county consultations organised under the SEA study that resulted in the following:
Proposal of joint committees and collaborative mechanisms towards sustainable development between Nairobi, Kajiado, Machakos and Kiambu;

The Project on Integrated Urban Development Master Plan for the City of Nairobi in the Republic of Kenya
Nippon Koei Co., Ltd. 10-21 Final Report IDCJ Inc. EJEC Inc.
Proposals for contributions by Nairobi County Government to conservation of the Aberdare Water Tower as a result of discussions between Nyandarua and Nairobi County;
Provision of a platform for implementation of a Civil Education Program as required by the County Government Act and as informed by the Nairobi City County Planning Department;
Provision of a platform for stakeholder engagement and feed back to the NIUPLAN secretariat through-out the NIUPLAN preparation process.
10.6 Priority Project for Urban Environmental Sector
(1) Citywide Air Quality Management
As discussed in the previous section, several environmental issues such as waste management, water quality improvement of urban tributaries, urban air quality, vehicular emissions, and others were raised and most of stakeholders pay great concerns. As one of the priority projects in the environmental sector, a “citywide air quality management program” is identified for the urban environmental management sector.
The proposed technical cooperation program can play an essential role to support the setup of the urban air quality monitoring system and make great contributions to improve the capacity of the regional environmental management across Nairobi City, that would eventually provide a sustainable and harmonious growth through the implementation of the NIUPLAN.
Recently, the urban air pollution is recognised as one of major public health and environmental issues in Nairobi City. The main sources of air pollution are vehicles, industries, emissions from the use of charcoal and firewood, and other municipal sources such as the open burning of wastes. Amongst them, the increasing number of cars circulating inside the city intensifies worsened traffic conditions and relevant vehicular pollution problems. Vehicles emit significant levels of air pollutants including greenhouse gases and the precursors of smog. Charcoal burning, a very prevalent energy source in the city, emits methane (CH4) and carbon monoxide (CO) and sends tiny particulates into the surrounding air.
Besides, the current vehicle inspection and maintenance system in Kenya is not sufficient to enforce the periodical vehicle maintenance activities, one of essential components to achieve significant vehicular emission reduction. So, most of public transport, matatu (mini-buses used for the citywide transport), are in poor conditions and are circulating while emitting black smoke along major roads of Nairobi City.
No specific environmental section responsible for urban air quality management exists within the Department of Environment of NCC. NCC has no authorised power to enforce the proper vehicle integrated management (I/M) system, either.
Also, NCC does not have its own urban air quality monitoring system to scientifically analyse the air qualities. So, it is quite difficult to grasp the latest air quality information by NCC promptly. Under this situation, it is difficult to develop comprehensive and effective air quality management program including the air quality monitoring and/or inspection. Without any actions to improve, it would be quite difficult for NCC to implement effective citywide environmental management program. Thus, NCC will not be able to cope up with the rapid growth of the vehicle circulation and resultant worsened urban air quality condition. The citywide environmental governance, compliance, and enforcement in Nairobi City would be weakened further.

The Project on Integrated Urban Development Master Plan for the City of Nairobi in the Republic of Kenya
Nippon Koei Co., Ltd. 10-22 Final Report IDCJ Inc. EJEC Inc.
(2) Objectives
The proposed technical cooperation program aims to provide relevant technical supports for setting up NCC’s own urban air quality monitoring system in order to achieve a comprehensive citywide air quality management while strengthening the capacity of the environmental audit, enforcement, and governance, to be conducted by NCC. By setting up urban air quality monitoring stations at strategically important sites such as the downtown of Nairobi City, it would be possible to smoothly obtain first-hand scientific air quality data. Using these air quality information, NCC can develop relevant environmental mitigation measures or provide directions while accumulating reliable fundamental urban air quality information that would lead to a creation of nationwide environmental database in the long-term period. As a result, it would make the establishment of a regionwide air quality monitoring network system possible while making the development of a citywide air quality management program more meaningful.
The second objective of this proposed program is to provide the capacity development for NCC in order to improve the entire performance quality of the environmental audits including environmental monitoring activities. This capacity building program would cover the upgrading of air quality monitoring skills as well as the development of the monitoring program, periodical inspection, and maintenance of the monitoring equipment for its quality control. In general, the equipment that will be used within the proposed monitoring system are expensive and sophisticated ones. Once a full-scale operation of monitoring system starts, those equipment will be under heavy-duty usage conditions, and most of them are prone to malfunction. Therefore, it is important to develop a suitable periodical maintenance framework prior to the long-term citywide monitoring operation. In that aspect, it is also imperative to acquire relevant discipline for NCC in order to maintain all monitoring equipment in its best condition at all times.
The third objective is to strengthen the environmental governance in conjunction with this environmental laboratory setup. No matter how meaningful NCC can obtain relevant urban air quality information, its usefulness would be hampered without a proper environmental governance and enforcement. In that aspect, a capacity to develop a meaningful environmental audit program including periodical monitoring activities shall be strengthened. Also, it would be required to conduct several improvements within the current environmental legal framework. For instance, it would be better to enact relevant legal codes in the periodical reporting of environmental compliances, in particular, pollutant emission into the surrounding atmosphere. It shall be a mandatory task for all project and/or factory owners, and relevant reliable environmental laboratory tests shall be conducted with their expenses. Also, it is imperative to strengthen the current vehicle I/M system to reduce the total amount of vehicular emission.
Throughout this proposed, technical supports for the proposed citywide air quality monitoring framework including the setting up of monitoring systems would be possible to make a great contribution to improve the environmental monitoring performance of NCC as well as the entire country. To achieve this goal, it is imperative to establish their own monitoring system and have equipment with proper comprehensive technical assistance program, to be conducted both in Japan and Kenya. A summary of this proposed priority project is described in Chapter 11 of this main report.

The Project on Integrated Urban Development Master Plan for the City of Nairobi in the Republic of Kenya
Nippon Koei Co., Ltd. 11-1 Final Report IDCJ Inc. EJEC Inc.
CHAPTER11 PRIORITY PROGRAMS OF NIUPLAN
11.1 Justification of Priority Programs Priority programs are proposed as a first step for the implementation of Nairobi Integrated Urban Development Master Plan (NIUPLAN) which is expected to be implemented (start) in the short term (~2018). Instead of implementing individual projects, the projects are compiled as a “program” to clarify objectives and promote efficient implementation. Five programs are proposed to be implemented in the short run, namely: (i) urban development program, (ii) urban transport development program, (iii) urban infrastructure development program, (iv) environment improvement program, and (v) urban development management strengthening program.
Priority Programs for the Nairobi Integrate Urban Development Master Plan
(i) Urban development program: to promote and accelerate integrated and efficient urban development;
(ii) Urban transport development program: to support forming urban structure including CBD and sub-centres;
(iii) Infrastructure development program: to promote urban development through urban facility development;
(iv) Environment improvement program: to improve urban environment for water, solid waste, and air quality; and
(v) Urban development management strengthening program: to strengthen institutions and human resources.
The following programs aim to form the urban structure: (i) urban development program, (ii) urban transport development program, (iii) urban infrastructure development program, whereas the following programs aim to support urban development: (iv) environment improvement program, and (v) urban development management strengthening program. Components of each program are selected from the point of view of accelerating urban development and urgency of the sector requirements.
Figure 11.1.1 shows the structure of the priority programs.

The Project on Integrated Urban Development Master Plan for the City of Nairobi in the Republic of Kenya
Nippon Koei Co., Ltd. 11-2 Final Report IDCJ Inc. EJEC Inc.
Source: JICA Study Team (JST)
Figure 11.1.1 Priority Program Structure
Outline of the priority programs are summarised in Table 11.1.1 below.
As mentioned in Chapters 6 to 9, the JICA Study Team (JST) proposed priority projects to be carried out by 2030 to solve the gaps between the current supply and demand forecast. From these projects which are shown in Table 11.1.1, 16 high priority programs are selected considering “Readiness of the program”, “NCC’s involvement”, and “Range of beneficiaries of the projects”. The evaluation criteria are shown at the bottom of the table.
Table 11.1.1 List of All Priority Programs
Sector Project Timing of mplementation Score
NCC’s Involvement
(Organisation)Score
Range of Beneficiaries of
the Project Score Total
Score
CostUS$ Mil
Urban Development
Railway City Development* Short 1 High 2 NCC, KRC 1 4 100
East of Tom Mboya St. Development Medium 0 High 2 NCC,
developer 0.5 2.5
Dandora Sub-Centre Development Short 1 High 2 NCC,
developer 0.5 3.5 5
Eastlands Urban Renewal Project Short 1 High 2 NCC, NHC 1 4 5
Urban Transport
Flyover in CBD for Railway City* Short 1 High 2 NCC, KURA 1 4 40-50Widening of Enterprize Road Short 1 High 2 NCC, KURA 1 4 15 Construction of Northern Part ofCircumferential Road C-2*
Short 1 High 2 NCC, KURA 1 4 12
Development of New Bus & MatatuTerminal in Railway City
Short 1 High 2 KURA, NCC 1 4 8
Formulation of Public TransportSystem Policy and Guideline
Short 1 Middle 1 MoTI, MoDP,
NCC 1.5 3.5 8
Vitalization of Commuter TrainOperation*
Immediately 2 Middle 1 KRC 0.5 3.5 2
Feasibility Study for the East-West Corridor MRT Line
Short 1 Middle 1 KRC 0.5 2.5
Feasibility Study on Nairobi Loop Line Short 1 High 2 NCC,KRC 1 4 1.6 Formulation of ITS City Master Plan Immediately 2 Middle 1 NCC, Police 0.5 3.5 5
Urban development program (To promote and accelerate integrated and efficient
urban development) CBD development Sub-centre development Urban renewal
Urban transport development program (To support forming urban structure including
CBD and sub-centres) Road network development Public transport development
Infrastructure development program (To promote urban development through urban facility development) Water supply Power Telecommunication
Environment improvement program (To improve urban environment for water, air
solid waste) Storm water drainage and sewerage Solid waste management Air pollution control
Urban development management strengthening program
(To strengthen institutions and human resources)
Regulation Human resources development GIS
Support Urban Development

The Project on Integrated Urban Development Master Plan for the City of Nairobi in the Republic of Kenya
Nippon Koei Co., Ltd. 11-3 Final Report IDCJ Inc. EJEC Inc.
Sector Project Timing of mplementation Score
NCC’s Involvement
(Organisation)Score
Range of Beneficiaries of
the Project Score Total
Score
CostUS$ Mil
Infrastructure
Development
Master Plan of Distribution Network inNairobi
Short 1 High 2 NCC 0.5 3.5 5
Equipment of collecting rainwater forBuilding
Short 1 Middle 1 NCC 0.5 2.5
Priority Project operated by AWSB Short 1 Middle 1 NCC, AWSB 1 3 Amendment for Technical Criteria of Overhead Line
Immediately 2 Middle 1 Kenya Power 0.5 3.5 0.5
Reviewing the LCPDP Short 1 Low 0 Energy
Regulatory
Commission
0.5 1.5
Development of Underground Cable in Dandra Area
Medium 0 High 2 NCC 0.5 2.5
Power Supply for Dandra Industry Area
Medium 0 High 2 NCC 0.5 2.5
Fiber Optic Trunk CommunicationNetwork in Nairobi City
Immediate 2 Middle 1 NCC,
Government, Operator
1.5 4.5 300-400
Common Infrastructure for Operators Medium 0 High 2 NCC, Operator 1 3 Introduction of Dedicated GovernmentNetwork among Government Offices
Medium 0 High 2 NCC,
Government 1 3
Disaster Information Gathering andDissemination System
Medium 0 High 2 NCC 0.5 2.5
Infrastructure Sharing Policy Medium 0 High 2 NCC, Operator 1 3
Environment
River Improvement Project Short 1 Middle 1 WRMA, NCC 1 3 Sewerage Improvement Project Short 1 Middle 1 AWSB,NCC 1 3
Capacity development for storm waterdrainage system in Nairobi city
Short 1 High 2 NCC 0.5 3.5 5
Capacity development for seweragesystem in Nairobi city
Short 1 High 2 NCC 0.5 3.5 5
Development of new landfill site Short 1 High 2 NCC 0.5 3.5 50 Safe closure of existing landfill site Medium 0 High 2 NCC 0.5 2.5 30
Nairobi solid waste management Short* 1 High 2 NCC 0.5 3.54,
10,000Development of MRFs Medium 0 High 2 NCC 0.5 2.5 Improvement of Collection andTransportation System
Medium 0 High 2 NCC 0.5 2.5
Establishment and improvement oflaws, regulations and guidelines foreffective solid waste management
Medium 0 Low 1 NCC 0.5 1.5
City-wide Air Quality ManagementProgram
Short 1 High 2 NCC, MoTI, MoLHUD
1.5 4.5 10-20
Urban Development Management
Installation of Integrated GIS for NCCData Management System
Medium 0 High 2 NCC 0.5 2.5
Urban development managementstrengthening (institution, capacitydevelopment)*
Immediately 2 High 2 NCC 0.5 4.5 5
Note : Evaluation
Score
Immediate(2-3yrs) : 2, Short(4-5yrs) : 1 Medium(more than 5 yrs) : 0
High : 2 Middle : 1 Low : 0
3 players : 1.5 2 players : 1 1 players : 0.5
Note : Hatched programs are selected as high priority programs. The projects with “ * “ mark represent high priority projects among priority programs Source : JICA Study Team (JST)
11.2 Urban Development Program Several urban development programs are proposed as priority programs. Following figure shows the location of sub-centres for urban development or urban renewal. Some of the sub-centres are

The Project on Integrated Urban Development Master Plan for the City of Nairobi in the Republic of Kenya
Nippon Koei Co., Ltd. 11-4 Final Report IDCJ Inc. EJEC Inc.
identified as priority projects including “Railway city development”, “Dandora sub-centre development”, and “Eastlands urban renewal project”.
Source: JICA Study Team (JST)
Figure 11.2.1 Location of Urban Development Sites
11.2.1 CBD development program
“Railway city development” is identified as a priority project for land use, railway and urban transport sector. Project outline is summarized in the table below.
1 Project title Railway city development 2 Background Nairobi central station area is one of obstacles for CBD expansion toward south.
KRC is planning to develop this area as “Railway City”. However, their first master plan is not adequately considered current CBD situation.
3 Objective To revise master plan for the area to strengthen traffic and pedestrian network, and utilize development potential of the expanded CBD area.
4 Components (1) Survey of current situation Land ownership, land use, existing infrastructure condition
(2) Revision of KRC’s master plan Detailed land use plan Basic design of infrastructure Development control guideline
(3) Priority project design New railway station, station square and transfer terminals design Flyovers and new connection road KRC worker housing re-development Urban renewal project in front of Nairobi station
(4) Urban management scheme Urban re-development scheme Area management scheme
(5) Projects implementation
CBD/Railway city development
Woodrey station sub-centre
Dandora station sub-centre
Imara-Daima station sub-centre
Eastlands urban renew al

The Project on Integrated Urban Development Master Plan for the City of Nairobi in the Republic of Kenya
Nippon Koei Co., Ltd. 11-5 Final Report IDCJ Inc. EJEC Inc.
5 Responsible organization PPP (KRC, KURA, NCC) 6 Cost US $ 100 million 7 Possible fund source ODA (Loan, Technical Cooperation)
Flyover
Railway City (100ha)
Nairobi Sta.

The Project on Integrated Urban Development Master Plan for the City of Nairobi in the Republic of Kenya
Nippon Koei Co., Ltd. 11-6 Final Report IDCJ Inc. EJEC Inc.
11.2.2 Sub-centre Development Program (priority area)
“Dandora Sub-Centre Development” is identified as a priority project for land use sector. Project outline is summarized in the table below.
1 Project title Dandora Sub-Centre Development 2 Background This Master Plan study recommends multi-core sub-centre system for Nairobi city.
NRC is also planning to develop commuter train service including Dandora station to utilize existing railway lines.
Dandora estate and surrounding area are one of heavily populated area without appropriate road network. It is necessary to re-develop urban function to improve current conditions.
Dandora dumping site need to plan to transfer its function.
3 Objective To draw up sub-centre development detailed plan of Dandora station area to improve transportation network and to utilize development potential in this area.
4 Components (1) Survey of current situation Land ownership, land use, existing infrastructure condition
(2) Detailed land use plan Basic design of infrastructure Detailed land use plan
(3) Dandora station development plan Railway station urban re-development Dandora Dumping site renewal plan
5 Responsible organization NCC, KRC 6 Cost US $ 5 million 7 Possible fund source ODA (Technical Cooperation)
11.2.3 Eastlands Urban Renewal Project
“Eastlands Urban Re-development” is identified as a priority project for land use sector. Project outline is summarized in the table below.
1 Project title Eastlands Urban Renewal Project 2 Background Eastlands estate was developed for local residents before the Independence. NCC has a
plan to re-develop this area to upgrade existing infrastructure. The buildings in these estates are antiquated and the population density is still low
compare to other residential areas in Nairobi City.
3 Objective To draw up urban renewal master plan for Eastlands
4 Components (1) Preparation of development plan Land use plan Road network plan Public transport plan
(2) Development scheme Funding or financial framework Legal framework Implementation framework
(3) Schedule and implementation of development plan Project time framework Project management framework
5 Responsible organization NCC, NHC(National Housing Corporation) 6 Cost US $ 5 million (Technical Cooperation) 7 Possible fund source ODA (Technical Cooperation)

The Project on Integrated Urban Development Master Plan for the City of Nairobi in the Republic of Kenya
Nippon Koei Co., Ltd. 11-7 Final Report IDCJ Inc. EJEC Inc.
11.3 Urban Transport Development Program In order to ensure the smooth transition or implementation of the Master Plan, recommendations are prepared as follows:
11.3.1 Road network development program
1 Project title Flyover in CBD for Railway City 2 Background This project aims at development of Railway City by harmonious planning of land use and
urban transport 3 Objective To encourage development potential in southern part of the Nairobi Station by
improvement of accessibility to the area, consequently remove the functions unnecessary in the CBD, and promote the creation of the Railway City.
To alleviate traffic congestion in northern part of the station by means of removal of the bus and matatu terminus to new terminal in the Railway City.
To guide traffic flows from southern part of the Nairobi city promptly and decongest the traffic in peripheral area.
4 Components Viaduct-1 (Length: 1,000m, 4-lanes, Project cost: 30-40 million USD) The viaduct connects Moi Avenue, trunk road of CBD, and Enterprise Road, trunk road of southern area of the station. Moreover, the viaduct together with widening of Enterprise Road to 4-lanes will disperse the traffic on Mombasa Road.
Viaduct-2 (Length: 400m, 2-lanes, project cost: 10 million USD) The viaduct guides bus and matatu traffic to new terminal in the Railway City, remove the traffic on Landhies Road and thus alleviates the congestion around terminus in northern part of the station.
5 Responsible organization KURA, NCC Engineering Department 6 Cost Total 40-50 million USD 7 Possible fund source ODA (Grant Aid / Loan)
Viaduct-1Viaduct-2
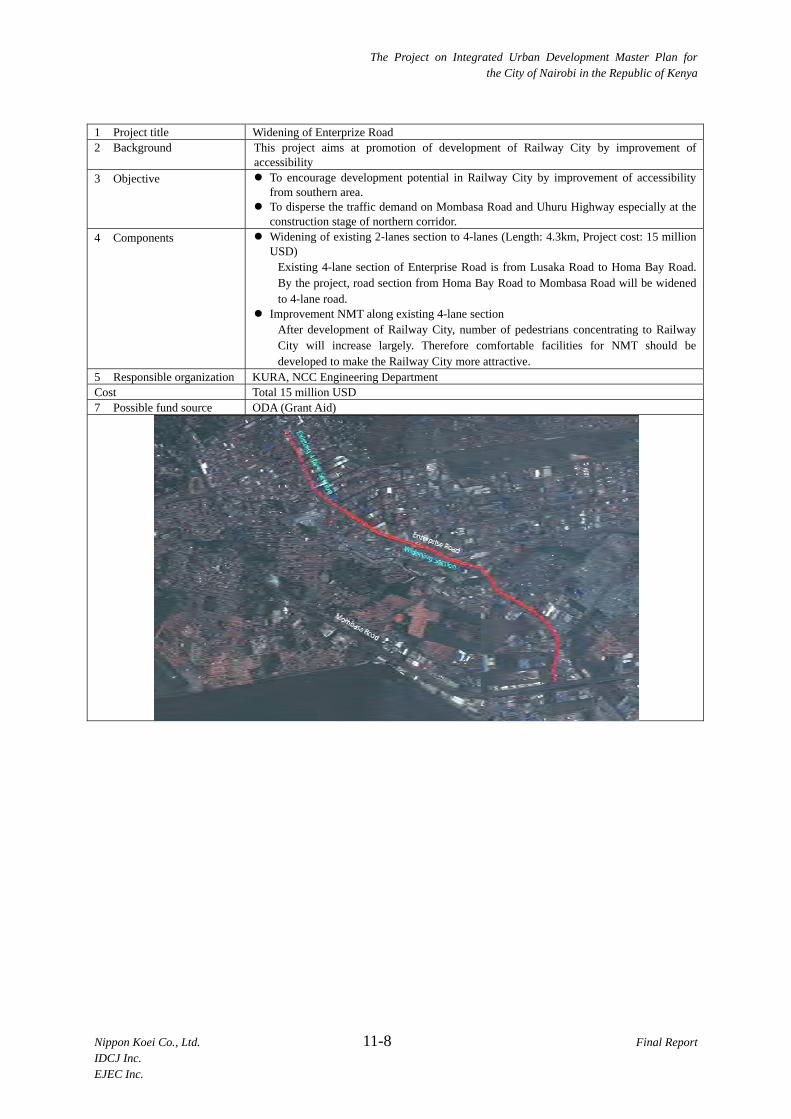
The Project on Integrated Urban Development Master Plan for the City of Nairobi in the Republic of Kenya
Nippon Koei Co., Ltd. 11-8 Final Report IDCJ Inc. EJEC Inc.
1 Project title Widening of Enterprize Road 2 Background This project aims at promotion of development of Railway City by improvement of
accessibility 3 Objective To encourage development potential in Railway City by improvement of accessibility
from southern area. To disperse the traffic demand on Mombasa Road and Uhuru Highway especially at the
construction stage of northern corridor. 4 Components Widening of existing 2-lanes section to 4-lanes (Length: 4.3km, Project cost: 15 million
USD) Existing 4-lane section of Enterprise Road is from Lusaka Road to Homa Bay Road. By the project, road section from Homa Bay Road to Mombasa Road will be widened to 4-lane road.
Improvement NMT along existing 4-lane section After development of Railway City, number of pedestrians concentrating to Railway City will increase largely. Therefore comfortable facilities for NMT should be developed to make the Railway City more attractive.
5 Responsible organization KURA, NCC Engineering Department Cost Total 15 million USD 7 Possible fund source ODA (Grant Aid)

The Project on Integrated Urban Development Master Plan for the City of Nairobi in the Republic of Kenya
Nippon Koei Co., Ltd. 11-9 Final Report IDCJ Inc. EJEC Inc.
1 Project title Construction of Northern Part of Circumferential Road C-2 2 Background Road network system in Nairobi City at present is composed of radial roads. And
development of western ring roads contributed to form C/R (Circumferential/Radial) road network system partially.
3 Objective Development of the circumferential road C-2 will change the traffic movement around CBD fundamentally.
Additionally, the circumferential road C-2 will encircle the CBD area, and will lubricate the traffic movement around the CBD.
4 Components Construction of Northern Part of Circumferential Road C-2 (From Thika Highway- Uhuru Highway Intersection to Mbagathi Way, Length: 3.7 km (widening 2.2 km; new construction 1.5 km), Project cost: 12 million USD, 4-lanes)
This Circumferential road is 2nd circumferential road encircles the city centre area proposed by NUTRANS. Proposed route by NUTRANS had many constraints, so alternate route has been proposed in this study.
5 Responsible organization KURA, NCC Engineering Department Cost 12 million USD 7 Possible fund source ODA (Grant Aid)

The Project on Integrated Urban Development Master Plan for the City of Nairobi in the Republic of Kenya
Nippon Koei Co., Ltd. 11-10 Final Report IDCJ Inc. EJEC Inc.
11.3.2 Public transport development program
In order to improve the efficiency of current bus terminal which is located in northern part of Nairobi station, the new bus and matatu terminal development plan is proposed as follow:
1 Project title Development of New Bus & Matatu Terminal in Railway City 2 Background Bus terminals and Matatu terminals are located in the northern part of Nairobi Station. Too
much concentration of bus and Matatu into narrow area is causing heavy traffic congestion in the area. Moreover, introduction of new public transport system which will accelerate congestion more and more is expected in near future.
3 Objective Development of new Bus and Matatu will ease the current conjestion in the northern part of Nairobi Station
Development of new terminal will attract many passengers who will be the source of prosperity in the Railway City. Therefore development of new terminal will contribute to the attractive town.
4 Components Construction of Bus and Matatu Terminal (Expected Area: 50,000m2) Opening of south gate of the station Facilities for Passengers (Waiting room, Time Table, Ticket office, Restaurant, KIOSK,
etc.) 5 Responsible organization KURA, NCC Engineering Department Cost 8 million USD 7 Possible fund source ODA (Grant Aid)
In order to support KRC’s commuter train operation plan, the following feasibility study is recommended to introduce diesel cars and modern signal and telecommunication system together with rehabilitation of station and track structure.
1 Project title Vitalization of Commuter Train Operation 2 Background Due to insufficient number of locomotives, commuter train operation is limited.
Existing commuter train operation is inefficient due to lack of proper signalling and telecommunication systems.
Running speed of commuter trains are very low due to poor track condition.
3 Objective To improve existing commuter train operation (train pulled by diesel locomotive) by replacing with DMU (Diesel Multiple Unit), including detailed plan of DMU maintenance equipment and facilities.
To modernize existing signalling and telecommunication systems to suit with the vitalized commuter train operation.
To rehabilitate existing track and station structures in the sections where DMU commuter train to be operated.
4 Components (1) Detailed planning of DMU (Diesel Multiple Unit: Diesel car) operation replacing existing commuter trains pulled by diesel locomotives, including detailed plan of DMU maintenance equipment and facilities.
(2) Detailed planning of modernized signalling and telecommunication systems to suit with the vitalized DMU commuter train operation.
(3) Detailed planning and basic design of track and station rehabilitation where DMU commuter train to be operated.
5 Responsible organization Kenya Railways Corporation (KRC) 6 Cost US $ 2 million 7 Possible fund source ODA (Technical Cooperation)

The Project on Integrated Urban Development Master Plan for the City of Nairobi in the Republic of Kenya
Nippon Koei Co., Ltd. 11-11 Final Report IDCJ Inc. EJEC Inc.

The Project on Integrated Urban Development Master Plan for the City of Nairobi in the Republic of Kenya
Nippon Koei Co., Ltd. 11-12 Final Report IDCJ Inc. EJEC Inc.
In order to avoid traffic congestion at CBD due to radiating structure of MRT/LRT lines, it is recommended to construct a loop line circulating around CBD. For that purpose, the following feasibility study is recommended.
1 Project title Feasibility Study on Nairobi Loop Line 2 Background The existing MRTS plan indicates that all the MRT/LRT corridors are radiating from
Nairobi Railway Station. Therefore, severe congestion at CBD around Nairobi Station will be unavoidable.
3 Objective To avoid congestion at CBD, diverting MRT/LRT passengers by the loop line. To provide sub-centres plan around interchange stations To provide train operation plan based on the demand forecast.
4 Components (1) Detailed planning of a loop line circulating the CBD including demand forecast. (2) Detailed planning of interchange stations including land use plan to form sub-centres. (3) Basic design of the system selected for the loop line.
5 Responsible organization Ministry of Transport and Infrastructure (MOTI) 6 Cost US $ 1.6 million 7 Possible fund source ODA (Technical Cooperation)
Pictures above shows the idea of loop line with total length of 13.2 and 13 stations
11.3.3 Intelligent Transport System Development Program
Formulation of ITS(Intelligent Transport System) City Master Plan is recommended to establish comprehensive plan to install ITS for Nairobi city.
1 Project title Formulation of ITS City Master Plan 2 Background Traffic demand in Nairobi City is increasing in the entire area, and congestion of road is also
spreading in the whole area. Through traffic in CBD is deteriorating the traffic congestion in CBD area. By introduction of ITS technology to Nairobi City area, traffic flow will be improved and traffic concentration to CBD will be rectified. In the current circumstances, ITS is introduced individually such as installation of CCTV concentrates in CBD, and comprehensive policy for development of ITS in Nairobi City does not exist. The transportation control using intelligent information will be necessary also not only the inside of CBD but before flowing into CBD, in order to mitigate congestion of CBD. Hence, the project aims at the establishment of comprehensive plan for development of ITS in Nairobi City including the installation and management of ITS facilities.
3 Objective In the current circumstances, ITS is introduced individually such as installation of CCTV, and comprehensive policy for development of ITS in Nairobi City does not exist. Hence, the project aims at the establishment of comprehensive plan for development of ITS in Nairobi City including the installation and management of ITS facilities.
4 Components Review of current condition of introduction of ITS to Nairobi City - Equipment, software, personnel and capacity, network, budget, etc.
Analysis on requirement for information technology in Nairobi City - Traffic control, accumulation of traffic data, supporting public transport operation,
parking control, crime prevention, etc.

The Project on Integrated Urban Development Master Plan for the City of Nairobi in the Republic of Kenya
Nippon Koei Co., Ltd. 11-13 Final Report IDCJ Inc. EJEC Inc.
Establishment of basic policy for ITS - Clarification of objective of ITS in Nairobi City - Prioritization of required system and target area/road - Institutional framework for implementation of ITS system
Basic design of ITS system in Nairobi City - Formation of basic function of ITS system
Phasing plan - Prioritization of major function and establishment of phasing plan into short and
medium term. Capacity development plan
- Technical training of personnel in charge Institutional plan
- Establishment of institutional plan including sustainable budget acquirement Implementation of Pilot Project
5 Responsible organization NCC Engineering Department, Police, MoDP 6 Cost 5 million USD (Including Pilot Project) 7 Possible fund source ODA (Technical Cooperation)
11.4 Infrastructure Development Program Infrastructure development program includes water supply, power and telecommunication sectors.
11.4.1 Water Supply
“Master plan for distribution network” is identified as a priority project for water supply sector. Project outline is summarized in the table below.
1 Project title Master Plan of Distribution Network in Nairobi City 2 Background Pipelines and the reservoirs of the distribution network need to be rehabilitated due to
the overage material, the unsuitable material for potable water and the construction of buildings on the alignment of pipeline.
The necessity of expanding the distribution network had become higher year by year corresponding with the drastic urbanization of Nairobi City
To cover the strengthened capacity based on the development, the comprehensive plan of the distribution network in is required.
3 Objective Since the construction works of pipelines in the distribution network need to be stepwise carried out due to the requirement of budget and other activities in the city such as transportation, master plan shows the necessary components for implementation.
4 Components (1) Survey of current situation Location of pipeline, diameter and material Water pressure in distribution network Topographic information including road, administrative and distribution network
boundaries existing facilities and equipment such as reservoirs and pumps (2) Study of pipeline arrangement in distribution network Clustering looped pipelines to main distribution pipeline for identification of the
problems such as physical leakage, illegal connection and malfunction of water meter, Arrangement of reservoirs to keep regular pressure with releasing pressure between
main pipeline and pipeline connecting to each customer, Utilization of existing pipelines, and Stepwise development based on the development of water resources. (3) Preparation of direction on rehabilitation and replacement of pipeline (4) Preliminary cost estimate to complete the development of the distribution network
5 Responsible organization NCC 6 Cost US $ 5 million 7 Possible fund source ODA (Technical Cooperation)
The Project on Integrated Urban Development Master Plan for the City of Nairobi in the Republic of Kenya
Nippon Koei Co., Ltd. 11-14 Final Report IDCJ Inc. EJEC Inc.
11.4.2 Power
“Amendment for technical criteria of overhead line” is identified as a priority project for power sector. Project outline is summarized in the table below.
1 Project title Amendment for technical criteria of overhead line 2 Background A range of wayleaves in Kenya is excessive and has not been updated.
Minimum clearance over 132 KV from electrical wires to buildings is much larger than that for other countries and need to be reviewed.
More land is needed for development.
3 Objective To reduce the cost of wayleaves for a electrical power company and to reduce the land of overhead line for NCC
To reduce the land for overhead line and create more land for development.
4 Components (1) The technical criteria may be revised with considering construction techniques, the quality of electrical power equipment and safeness.
(2) The project reviews other country’s technical criteria in addition to the criteria of Kenya and compares them. From the consideration of comparing investigation, the criteria of Kenya may be revised.
5 Responsible organization Kenya Power 6 Cost US $ 0.5 million 7 Possible fund source ODA (Technical Cooperation)
11.4.3 Telecommunications
“Fiber optic trunk communication network in Nairobi city” and “Introduction of leased network among government offices” are identified as priority projects for telecommunications sector. Project outline is summarized in the table below.
1 Project title Fibre optic trunk communication network in Nairobi city 2 Background Upgrading the optic fiber trunk network for the metro trunk communications and local
access network is essential to solve telecommunications infrastructure issues. Undersea cables landing at Mombasa should be enhanced to remove the fundamental
bottleneck that decreases internet speed. Enhancement of communications network contributes not only to the improvement in
internet user convenience but also to the introduction of Intelligent Transport Systems(ITS) which provide innovative services to different modes of transport and traffic management and enable various users to be better informed and make safer, more coordinated, and 'smarter' use of transport networks.
3 Objective To Increase in the number of internet users, enhance the convenience of the internet, promote citizens' participation in e-government (access to on-line government services), promotion of ITS
4 Components (1) Upgrade the trunk communication network and accessibility Network construction among the urban cores and sub-centres by connecting fiber optic
cables laid along the roads and railways. Upgrade the networking equipment including optical transmission device, router, switch
and network control unit to expand network bandwidth capacity Introduce LTE for accessibility improvement (2) Upgrade undersea cable bandwidth capacity Government should assist operators to expand the undersea cable bandwidth capacity.
5 Responsible organization Telecommunication operators, MOICT 6 Cost US $ 300 million ~ 400 million 7 Possible fund source ODA (Loan)

The Project on Integrated Urban Development Master Plan for the City of Nairobi in the Republic of Kenya
Nippon Koei Co., Ltd. 11-15 Final Report IDCJ Inc. EJEC Inc.
11.5 Environment Improvement Program Environment improvement program includes storm water drainage and sewerage, solid waste management, and air pollution management.
11.5.1 Storm water drainage and sewerage
“Capacity development for storm water drainage system in Nairobi city” is identified as a priority project for storm water drainage sector. Project outline is summarized in the table below.
1 Project title Capacity development for storm water drainage system in Nairobi city 2 Background Nairobi city faces flood and roads are inundated which cause traffic congestion and
worsening living environment. The project aims at supporting the capacity development for the City Engineering
Department of the Nairobi City County; (i) to restore its administrative functions to maintain the storm water drainage systems; (ii) to establish its administrative capability to manage the plan, design and construction of storm water drainage works within the catchment areas of the Nairobi River and its major tributaries.
3 Objective to restore its administrative functions to maintain the storm water drainage systems, to establish its administrative capability to manage the plan, design and construction of storm water drainage works within the catchment areas of the Nairobi River and its major tributaries.
4 Components Collection, review and update of technical data (master plan, project documents, as-built drawings, etc.) for the maintenance of the existing storm water drainage systems,
Practices for the maintenance of the existing storm water drainage systems in the systematic approaches,
Review, update and application of design standards and specifications for the storm water drainage works,
City Engineering Department to be involved with the proposed River Improvement Project to prepare the river improvement master plan as the definitive framework for the management of storm water drainage entirely in Nairobi City,
City Engineering Department to be involved with the plan, design and implementation of the storm water drainage developments in the individual sub-catchment areas in conformity with the river improvement master plan, and
Organizational reform for the City Engineering Department to take the responsibility for the administrative management of the storm water drainage including plan, design, construction and maintenance for the Nairobi River and its major tributaries and associated storm water drainage systems in the individual sub-catchment areas.
5 Responsible organization NCC, NCWSC 6 Cost US $ 5 million 7 Possible fund source ODA (Technical Cooperation)

The Project on Integrated Urban Development Master Plan for the City of Nairobi in the Republic of Kenya
Nippon Koei Co., Ltd. 11-16 Final Report IDCJ Inc. EJEC Inc.
“Capacity development for sewerage system in Nairobi city” is identified as a priority project for storm sewerage sector. Project outline is summarized in the table below.
1 Project title Capacity development for sewerage system in Nairobi city 2 Background Sewerage development is implemented based on 1998 master plan. Since Nairobi
City has become city county, NCC is expected to manage sewerage and capacity development is needed for sewerage management, water quality improvement and sewer treatment.
The project aims at supporting the capacity development; (i) for the City Engineering Department of the Nairobi City County to establish its administrative capability to manage the plan, design, construction and O&M for the sewerage system in Nairobi City; and (ii) for the Nairobi City Water Supply and Sewerage Company (NCWSC) to carry out O&M for the sewerage system in order to ensure the improvements by the proposed Sewerage Improvement Project.
3 Objective For the City Engineering Department of the Nairobi City County to establish its administrative capability to manage the plan, design, construction and O&M for the sewerage system in Nairobi City; and for the Nairobi City Water Supply and Sewerage Company (NCWSC) to carry out O&M for the sewerage system in order to ensure the improvements by the proposed Sewerage Improvement Project.
4 Components City Engineering Department to be involved with the proposed Sewerage Improvement Project to improve the performance of the sewerage system,
City Engineering Department to be involved with the plan, design and implementation of the sewerage development in conformity with the sewerage master plan,
NCWSC to practice O&M manners to be applied resulting from the Sewerage Improvement Project and feedbacks,
Review, update and application of design standards and specifications for the sewerage works through the O&M practices and feedbacks,
Organizational reform for the City Engineering Department to take the responsibility for the administrative management of plan, design, construction and O&M for the sewerage system in Nairobi City.
5 Responsible organization NCC, NCWSC 6 Cost US $ 5 million 7 Possible fund source ODA (Technical Cooperation)
11.5.2 Solid waste management
“Development of new landfill site” is identified as a priority project for solid waste management sector. Project outline is summarized in the table below.
1 Project title Development of New Landfill Site 2 Background A new sanitary landfill is necessary for final disposal of residual waste with consideration of
environmental protection for surrounding environment. In the JICA preparatory survey in 2012, the project site is surveyed based on the JICA M/P study in 2010. The site was proposed in Ruai which is approximately 28 km from the central business district of Nairobi City. The whole area of 80 ha is owned by the NCC though the procedure of obtaining title deeds is still ongoing.
3 Objective To improve solid waste condition through proper land fill site construction
4 Components (1) Principal facilities Landfill: waste disposal facility, lining system, leachate collection facility Landfill gas exhaust facility Leachate treatment facility Storm water drainage Monitoring facility (2) Administration Administration building (3) Others Road network, enclosure facilities
5 Responsible organization NCC 6 Cost US $ 50 million 7 Possible fund source ODA (Loan)

The Project on Integrated Urban Development Master Plan for the City of Nairobi in the Republic of Kenya
Nippon Koei Co., Ltd. 11-17 Final Report IDCJ Inc. EJEC Inc.
“Closure of existing dumping site” is identified as a priority project for solid waste management sector after the development of new landfill site. Project outline is summarized in the table below.
1 Project title Decommissioning of Closure of Existing Open Dump Site 2 Background Safe closure of existing open dump site is necessary for environmental protection for
surrounding environment. In the JICA preparatory survey in 2012, the project site for the decommissioning has been surveyed based on the JICA M/P study in 2010. The existing open dump site was located near the city central business district as well as the international airport in Nairobi City which will affect the surrounding environment.
3 Objective To improve solid waste condition through proper decommissioning of existing open dump site
4 Components (1) Principal facilities Final cover soil Landfill gas exhaust facility Leachate collection and treatment facility Storm water drainage Maintenance road Environmental monitoring facility (2) Others Retaining wall
5 Responsible organization NCC 6 Cost US $ 30 million 7 Possible fund source ODA (Loan)
“Nairobi solid waste management” is identified as a priority project for solid waste management sector. Project outline is summarized in the table below.
1 Project title Nairobi Solid Waste Management Project in the Republic of Kenya 2 Background Solid waste generated in Nairobi County is landfilled in Dandora dump site in Nairobi
County. Dandora dump site is open-dump type disposal site and there is no embankment for retaining solid waste, lining system, landfill gas exhaust facility, storm water drainage and leachate collection and treatment facilities which are necessary for sanitary landfill site, as identified issues. Development of new sanitary landfill site is urgently needed as well as the segregation of recyclable material by 3R promotion. In this context, JICA supported the preparatory survey of Nairobi Solid Waste Management Project in Republic of Kenya in the landfill site in Ruai proposed in the JICA M/P study in 2010. However, the site is around 13 km from the airport and on the way of landing pass, which may cause bird strike, which is suggested by KAA. Due to their concern, the EIA has not been approved yet. Based on various stakeholders concern, the Pilot Project (P/P) of sanitary landfill development is recommended as JICA technical cooperation project in the process of the development of sanitary landfill site, including capacity development and involvement of and consensus building among various stakeholders, to implement sanitary landfill development project development.
3 Objective To improve solid waste condition through proper solid waste management
4 Components P/P of sanitary landfill site (approximately 1ha) Review and revision of development plan of new sanitary landfill site (80ha) based on
the P/P of sanitary landfill site (project contents, basic design, construction plan, operation and maintenance plan, cost estimation, etc).
Review and revision of closure plan of Dandora dump site (46ha) (project contents, basic design, construction plan, operation and maintenance plan, cost estimation, etc).
5 Responsible organization NCC, NEMA, KCAA, KAA 6 Cost Technical Cooperation US $ 4 million, Loan: US $ 10 billion 7 Possible fund source ODA (Technical Cooperation Project, Loan)

The Project on Integrated Urban Development Master Plan for the City of Nairobi in the Republic of Kenya
Nippon Koei Co., Ltd. 11-18 Final Report IDCJ Inc. EJEC Inc.
11.5.3 City-wide Air Quality Management Program
“City-wide Air Quality Management Program” is identified as priority projects for the urban environmental management sector. Project outline of each are summarized in the table below, separately.
1. Project Title City-wide Air Quality Management Program
2. Background Set up reliable, city-wide air quality monitoring system is essential task to implement effective urban air quality management program. Currently, it is reported that the main sources of atmospheric pollution are vehicles, industries, emissions from the use of charcoal and firewood, and other municipal sources such as the open burning of waste.
So, following two type of city-wide air quality monitoring systems, i.e., i) monitoring system for roadside air quality, and ii) monitoring system for industry complex and waste disposal sites, are required.
3. Components Set up A/Q Unit responsible for city-wide air quality management. Set up following facilities and/or equipment for a long-term city-wide air
quality monitoring system, (1) Construction of fixed monitoring stations across the city while preparing development of environmental information database. (2) Set of portable air quality measurement equipment for the measurement of specific pollutant emission sources (e.g., factory). (3) Air quality monitoring vehicle .
Capacity building for A/Q Unit Staff. Capacity building for upgrading of vehicle inspection and maintenance. Set up environmental police unit (or convert traffic police to environmental
police). Upgrade Vehicle I/M – related legal framework Upgrade environmental enforcement and governance regarding vehicle I/M. Capacity Building for Motor Vehicle Inspection Unit. Raise Public Awareness of Vehicle I/M
4. Responsible Organization Department of Environment, Nairobi City County Motor Vehicle Inspection Unit, National Transport Safety Authority, Ministry
of Transport and Infrastructure Ministry of Land, Housing and Urban Development
5. Cost US$ 10 million – 20 million 6. Possible Fund Source ODA (Technical Co-Operation)
11.6 Urban Development Management Strengthening Program “Urban development management” is identified as priority projects for urban management sector. Project outline is summarized in the table below.
1 Project title Urban development management strengthening 2 Background One of the reasons for poor implementation of 1973 Strategic Plan is capacity of staff
of NCC and related agencies were poor. In order to secure proper implementation of the MP requires capacity development, particularly NCC staff.
Kenya, on the other hand, after the new constitution has been enacted, new legislation has been issues but the legislation for urban development and management has not been prepared. Thus, institutional strengthening is also important to secure implementation.
In order to secure realization of the MP, capacity development is conducted to strengthen institution and human resources.
3 Components Institutional strengthening for urban development (spatial development) CBD development and sub-centre development is proposed to form strong urban
structure. Legislation for urban development project (e.g. land re-adjustment project, urban renewal project) still does not exist in Kenya, which becomes constraints for urban development. Also related legislation, such as land management, land value assessment) has to be strengthened.
Urban development requires private sector participation. PPP mechanism will be developed.
Urban facility (infrastructure) management strengthening

The Project on Integrated Urban Development Master Plan for the City of Nairobi in the Republic of Kenya
Nippon Koei Co., Ltd. 11-19 Final Report IDCJ Inc. EJEC Inc.
Since infrastructure development is managed by concerned agencies independently so infrastructure management is considered weak and not efficient (construction at same location, no common database, land management). Infrastructure management mechanism is established (NCC as facilitator, GIS database management).
Land development permission Building permit system is already established and operated but land development
permit is still under development. Land development system is developed. Urban development management by GIS
Data necessary for urban development management is compiled as one GIS database system and utilized for development permit, urban development project management and infrastructure development management.
Urban transport planning by using the JICA System for Traffic Demand Analysis (STRADA)
This project is efficient if it can be implemented together with “CBD development” and “Sub-Centre development” proposed in Urban development program.
4 Responsible organization NCC 5 Cost US $ 5 million 6 Possible fund source ODA (Technical Cooperation)

The Project on Integrated Urban Development Master Plan for the City of Nairobi in the Republic of Kenya
Nippon Koei Co., Ltd. 11-20 Final Report IDCJ Inc. EJEC Inc.
Charles, Buruburu Primary School (Rank 3 of Class 6)

The Project on Integrated Urban Development Master Plan for the City of Nairobi in the Republic of Kenya
Nippon Koei Co., Ltd. 12-1 Final Report IDCJ Inc. EJEC Inc.
CHAPTER12 CONCLUSION AND RECOMMENDATION FOR IMPLEMENTATION OF THE MASTER PLAN
12.1 Conclusion The Integrated Urban Master Plan covers the development vision, structure plan, sub-centre development, urban transport development, infrastructure development, and capacity development. Through the process of the master plan formulation, a series of technical working group and stakeholder meetings was conducted. In addition, the geographic information system (GIS) database was developed and priority programs are proposed. The following points of the master plan are:
Development vision is proposed for Nairobi City County (NCC) to become not only the centre of Kenya but also to become the centre of the East African Region;
Sub-centre system (multi-core development) is proposed which includes strengthening of the Central Business District (CBD) and development of seven sub-centres;
Urban transport development proposes multi-modal development including road network public transport network, and traffic management;
Infrastructure covers water supply, storm water drainage and sewerage, power supply, solid waste management, and telecommunication in which the development policy is proposed;
Capacity development proposed to strengthen urban development management from planning, controlling, and development;
GIS database covers land use, infrastructure, and urban facilities, and
Priority programs are proposed to be implemented in the short term.
12.2 Recommendation In order to ensure the smooth transition or implementation of the master plan, recommendations are prepared for institutional aspect and technical aspect as actions to be taken:
Institutional aspect
(1) Dissemination of the Nairobi Integrated Urban Development Master Plan (NIUPLAN) to NCC
The NIUPLAN, which shows the policy and direction of urban development of Nairobi City, is considered as an umbrella plan and has to be a base for sector development plans, detail plans, as well as feasibility studies to be prepared by concerned sectors. In order to secure consistency of the NIUPLAN and related plans, the NCC staff and NCC assembly have to understand the contents of the NIUPLAN. The City Planning Department of NCC should take initiative in disseminating the NIUPLAN to the NCC staff and NCC assembly.

The Project on Integrated Urban Development Master Plan for the City of Nairobi in the Republic of Kenya
Nippon Koei Co., Ltd. 12-2 Final Report IDCJ Inc. EJEC Inc.
(2) Organization strengthening for the master plan implementation
Organization strengthening, which includes technical aspect and coordinating aspect is one of the key elements for the master plan implementation. Technical aspect covers land use control and urban development and infrastructure development. Coordinating aspect covers coordination within NCC, coordination between NCC and the national government, and coordination amongst county governments. Coordination amongst county government has become important after county government system has been in place as a part of decentralization policy, thus coordinating mechanism amongst county government has to start immediately.
(3) Capacity development
Capacity development is considered as one of important non-structural measures. Failure of capacity development is identified as one of the reasons for the weak implementation of 1973 Strategic Plan. In order to secure the implementation of the master plan, capacity development should start as soon as possible. Capacity development covers the following aspects:
To fully understand the master plan,
To acquire fundamental skills of urban development and management,
To adapt the information and communication technology (ICT) skills to urban development and management, and
To place capacity development method including on-the-job training (OJT), participatory method, monitoring, and evaluation.
(4) Sustainable stakeholder involvement for the master plan implementation
Sustainable urban development requires active stakeholder involvement in many ways, amongst them are: following the rules such as building permit and development permit and changing socioeconomic pattern of general public.
Changing socioeconomic pattern also has significant impact on urban development. Traffic congestion can be eased by shifting working hours to avoid the rush hours and promoting school bus in commuting to/from the school instead of using private cars.
Thus, in addition to the implementation of structural and non-structural measures, NCC has to encourage changing the public pattern and also develop mechanism which connects NCC and the general public.
Technical aspect
(1) Development of CBD and Sub-Centres
The CBD development is an “icon” for NCC to become a centre of Kenya, as well as, a centre of East Africa as shown in the development vision. The ideas behind CBD/Railway city and sub-centre development are to ensure that urban development should cover infrastructure development, spatial development, and implementation mechanisms. Thus, CBD/Railway city and sub-centre should be developed as a program not as individual infrastructure development. The following actions are needed for CBD/Railway city and sub-centre development:
Establish an urban development mechanism including role and responsibility amongst public and private sectors.

The Project on Integrated Urban Development Master Plan for the City of Nairobi in the Republic of Kenya
Nippon Koei Co., Ltd. 12-3 Final Report IDCJ Inc. EJEC Inc.
Conduct a detailed survey for implementation, including traffic volume and land ownership in the target area.
Prepare detail plan for CBD and for selected sub-centres as a part of urban development implementation.
Develop an urban development implementation scheme such as land re-adjustment and urban redevelopment that matches the condition of Nairobi City.
(2) Implement the urban transport in accordance with the development plan proposed as short-term measures
The results of the traffic demand forecast showed the traffic congestion worsens in the short term and medium term. To cope with these issues, various measures should be taken as shown below.
Provision of a signal control system on the radial trunk road in the city and signal control system in the whole city,
Introduction of a bus-exclusive lane which is effective even before the introduction of the bus rapid transit (BRT),
Staggered working hours to ease morning peak hours,
Streamline the fleet carrier to decrease vehicle trips in the business area, and
Relocation of bus terminal in the sub-centres.
(3) Infrastructure development to form Nairobi urban structure and support urban development
Infrastructure is a key element of forming Nairobi urban structure and support urban development. Priority programs are proposed for a key infrastructure and it is important to start preparing for the implementation. The following actions should be taken for infrastructure development:
Establish a coordination mechanism amongst concerned agencies. Infrastructure development is the responsibility of the national government. NCC should be able to coordinate concerned agencies for an efficient infrastructure development.
Conduct survey or study (feasibility study, detailed design) for implementation.

The Project on Integrated Urban Development Master Plan for the City of Nairobi in the Republic of Kenya
Nippon Koei Co., Ltd. 12-4 Final Report IDCJ Inc. EJEC Inc.
Simon Wamira, Muthangari Primary School (Rank 2 of Class 5)