Embed Size (px)
Citation preview
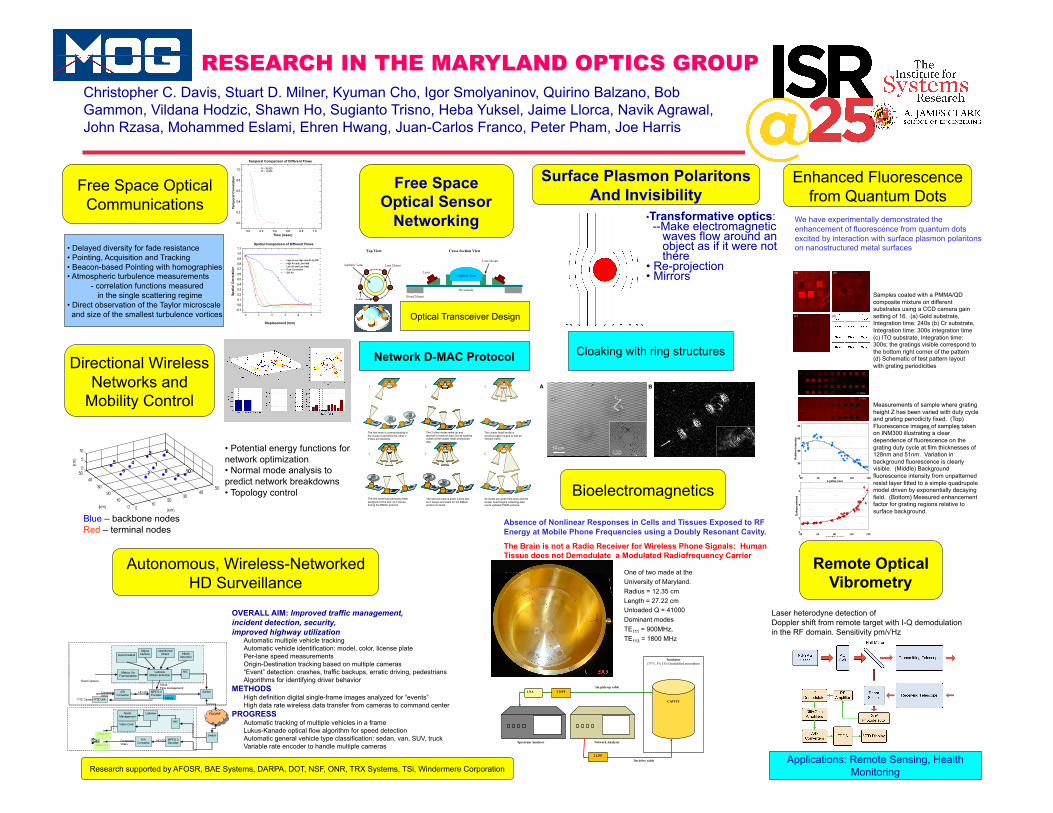
RESEARCH IN THE MARYLAND OPTICS GROUP Christopher C. Davis, Stuart D. Milner, Kyuman Cho, Igor Smolyaninov, Quirino Balzano, Bob Gammon, Vildana Hodzic, Shawn Ho, Sugianto Trisno, Heba Yuksel, Jaime Llorca, Navik Agrawal, John Rzasa, Mohammed Eslami, Ehren Hwang, Juan-Carlos Franco, Peter Pham, Joe Harris
Free Space Optical Communications
Directional Wireless Networks and
Mobility Control
Remote Optical Vibrometry
Surface Plasmon Polaritons And Invisibility
Bioelectromagnetics
Enhanced Fluorescence from Quantum Dots
Applications: Remote Sensing, Health Monitoring
Laser heterodyne detection of Doppler shift from remote target with I-Q demodulation in the RF domain. Sensitivity pm/√Hz
•Transformative optics: --Make electromagnetic waves flow around an object as if it were not there • Re-projection • Mirrors
We have experimentally demonstrated the enhancement of fluorescence from quantum dots excited by interaction with surface plasmon polaritons on nanostructured metal surfaces
Autonomous, Wireless-Networked HD Surveillance
OVERALL AIM: Improved traffic management, incident detection, security, improved highway utilization
Automatic multiple vehicle tracking Automatic vehicle identification: model, color, license plate Per-lane speed measurements Origin-Destination tracking based on multiple cameras “Event” detection: crashes, traffic backups, erratic driving, pedestrians Algorithms for identifying driver behavior
METHODS High definition digital single-frame images analyzed for “events” High data rate wireless data transfer from cameras to command center
PROGRESS Automatic tracking of multiple vehicles in a frame Lukus-Kanade optical flow algorithm for speed detection Automatic general vehicle type classification: sedan, van, SUV, truck Variable rate encoder to handle multiple cameras
Samples coated with a PMMA/QD composite mixture on different substrates using a CCD camera gain setting of 16. (a) Gold substrate, Integration time: 240s (b) Cr substrate, Integration time: 300s integration time (c) ITO substrate, Integration time: 300s; the gratings visible correspond to the bottom right corner of the pattern (d) Schematic of test pattern layout with grating periodicities
Measurements of sample where grating height Z has been varied with duty cycle and grating periodicity fixed. (Top) Fluorescence images of samples taken on INM300 illustrating a clear dependence of fluorescence on the grating duty cycle at film thicknesses of 128nm and 51nm. Variation in background fluorescence is clearly visible. (Middle) Background fluorescence intensity from unpatterned resist layer fitted to a simple quadrupole model driven by exponentially decaying field. (Bottom) Measured enhancement factor for grating regions relative to surface background.
Absence of Nonlinear Responses in Cells and Tissues Exposed to RF Energy at Mobile Phone Frequencies using a Doubly Resonant Cavity.
The Brain is not a Radio Receiver for Wireless Phone Signals: Human Tissue does not Demodulate a Modulated Radiofrequency Carrier
One of two made at the University of Maryland. Radius = 12.35 cm Length = 27.22 cm Unloaded Q = 41000 Dominant modes TE111 = 900MHz, TE113 = 1800 MHz
Incubator (37°C, 5% CO2) humidified atmosphere
CAVITY
3m pick-up cable
3m drive cable
Network Analyser Spectrum Analyser
LNA 2 HPF
2 LPF
Free Space Optical Sensor
Networking
Optical Transceiver Design
Network D-MAC Protocol
Blue – backbone nodes, Red – terminal nodes
Blue – backbone nodes Red – terminal nodes
• Delayed diversity for fade resistance • Pointing, Acquisition and Tracking • Beacon-based Pointing with homographies • Atmospheric turbulence measurements
- correlation functions measured in the single scattering regime
• Direct observation of the Taylor microscale and size of the smallest turbulence vortices
• Potential energy functions for network optimization • Normal mode analysis to predict network breakdowns • Topology control
Research supported by AFOSR, BAE Systems, DARPA, DOT, NSF, ONR, TRX Systems, TSi, Windermere Corporation
The first mote is communicating to the cluster head while the other 2 motes are sleeping.
The 2 other motes wake up and attempt to transmit data, but all packets collide at the cluster head photodiode (Rx).
The cluster head sends a synchronization signal to halt all network traffic.
The first mote has previously been assigned a time slot, so it sleeps during the DMAC protocol.
The second mote is given a time slot, so it sleeps and waits for the DMAC protocol to finish.
All motes are given time slots and the cluster head begins collecting data via its updated TDMA scheme.
1 2 3
4 5 6
Temporal Comparison of Different Flows
Time (msec) Te
mpo
ral C
orre
latio
n
Spatial Comparison of Different Flows
Displacement (mm)
Spat
ial C
orre
latio
n
Cloaking with ring structures