Embed Size (px)
Citation preview
Chinese Journal of Oceanology and Limnology Vol. 28 No. 5, P. 1002-1011, 2010 DOI: 10.1007/s00343-010-0025-z
Response of upper ocean currents to typhoons at two ADCP moorings west of the Luzon Strait*
CHEN Fei (陈飞)1, 2, DU Yan (杜岩)1,**, YAN Li (严厉)1, WANG Dongxiao (王东晓)1, SHI Ping (施平)1, 3 1 LED, South China Sea Institute of Oceanology, Chinese Academy of Sciences, Guangzhou 510301, China 2 GKSS Coastal Research Center, Max-Plank-Str 1, Geesthacht D-21502, Germany 3 Yantai Institute of Coastal Zone Research, Chinese Academy of Sciences, Yantai 264003, China
Received Jan. 19, 2010; revision accepted Jun. 8, 2010
© Chinese Society for Oceanology and Limnology, Science Press, and Springer-Verlag Berlin Heidelberg 2010
Abstract We deployed two ADCP mooring systems west of the Luzon Strait in August 2008, and measured the upper ocean currents at high frequency. Two typhoons passed over the moorings during approximately one-month observation period. Using ADCP observations, satellite wind and heat flux measurements, and high-resolution model assimilation products, we studied the response of the upper ocean to typhoons. The first typhoon, Nuri, passed over one of the moorings, resulting in strong Ekman divergence and significant surface cooling. The cooling of surface water lagged the typhoon wind forcing about one day and lasted about five days. The second typhoon, Sinlaku, moved northward east of the Luzon Strait, and did not directly impact currents near the observation regions. Sinlaku increased anomalous surface water transport exchange across the Luzon Strait, which modulated the surface layer current of the Kuroshio.
Keyword: ADCP observation; Luzon Strait; typhoon; surface current
1 INTRODUCTION As strong cyclones generated in the tropical ocean,
typhoons (or hurricanes) exert great influence on local air-sea interactions at synoptic scales. Typhoons cause strong local perturbations, convey momentum and vorticities to the ocean, and take heat away, which would lead to significant thermodynamical anomalies over a short period. The response of the upper ocean to typhoon can be sorted to two stages: “forcing” and “relaxation”. The former is a local stage that occurs during a typhoon, and the latter occurs after a typhoon with remarkable spatial-temporal variation (Price et al., 1994). The responses of the ocean during the forcing stage includes mainly abnormal flows in the surface layer and upper mixed layer near the typhoon eye, enhancement of both vertical mixing and entrainment of the mixed layer, sudden cooling of sea surface temperature (SST) and uplift of thermocline by Ekman pumping (Black, 1983; Cornillon et al., 1987; Gill, 1984; Stanford et al., 1987). The observed hydrological data indicated that strong wind-driven currents were induced by the
passing of typhoons, and SST presented an anomaly cooling. There was an energy dispersion in the upper mixed layer during the relaxaion stage which formed the expanding typhoon trail.
Lack of previous data has resulted in a limited number of analyses of ocean response, mostly focused on SST. On the one hand, the sharp cooling of SST is the most clear response to typhoons. On the other hand, SST cooling induced by typhoons is an important part of the ability to predict typhoons. In the Atlantic Ocean, Leipper (1967) found that the pumping depth could reach nearly 60 m beneath the hurricane center. In additon, surface warm water travelled outward and then had a downdraft at the the edge of hurricane. This process caused a drop of SST larger than 5°C. Black (1983), Dickey et al. (1998), and Walker et al. (2005) measured the range of SST
* Supported by the Knowledge Innovation Program of the Chinese Academy of Sciences (Nos. KZCX1-YW-12-01; KZCX2-YW-BR-04), the National Natural Science Foundation of China (Nos. 40876007, 40806006), and the National High Technology Research and Development Program of China (863 Program) (No. 2008AA09A402) ** Corresponding author: [email protected]
No.5 CHEN et al.: Ocean response to typhoon
1003
drop induced by hurricanes over the Atlantic, and found that such cooling can reach nearly 4°C within 400 m. Bender (1993) studied the hurricane-ocean interaction using a coupled model and showed that the extent of the SST decrease has a close relationship with the moving speed of the hurricane. In the Pacific Ocean, Su et al. (2001) simulated the response of the SST to typhoons in the Bohai Sea and Yellow Sea, and reported that their influence on SST was asymmetric, and that the surface cooling was due to upwelled cold water/entrainment. Liu et al. (2006) studied the response of the upper ocean to tropical cyclones in the Northwest Pacific during 2001–2004, and they found that the maximum drop of mixed layer temperature was up to 5°C.
Recently, more studies have focused on the processes of adjustment of ocean currents during the passing of typhoons. For instance, Walker et al. (2005) studied the response of the upper ocean upper to Hurricane Ivan in the Gulf of Mexico using observations from 14 moorings during September 2004. They stated that the response of the current was strongly related to the intensity of the hurricane and distance to the eye. Zhu et al. (2007) discussed the relationship between surface current and wind speeds under typhoon conditions with mooring observation data, and presented a description of a decaying process of inertial currents near the trail. Through simulations, previous studies have shown that the response of the upper ocean to typhoons mainly includes the current anomalies and Ekman pumping over large areas (Bender et al., 1993).
The difficulty of ship observations under extreme weather condition has limited the research to date of the dynamic processes of the upper ocean response to typhoons. In this study, we used a one-month subsurface mooring ADCP dataset to investigate the upper ocean adjustment west of Luzon Strait during August-September, 2008. During this time, typhoons Nuri and Sinlaku passed over two ADCP deployment sites. Satellite SST, wind records, and high resolution model assimilation products were included in the analysis to achieve a comprehensive study of the upper ocean’s response to typhoons in the South China Sea (SCS).
2 DATA INFORMATION 2.1 Mooring data and typhoon information
The South China Sea Institute of Oceanology, Chinese Academy of Sciences deployed two ADCP mooring systems southwest of Luzon Strait in August 2008. These systems were used to record
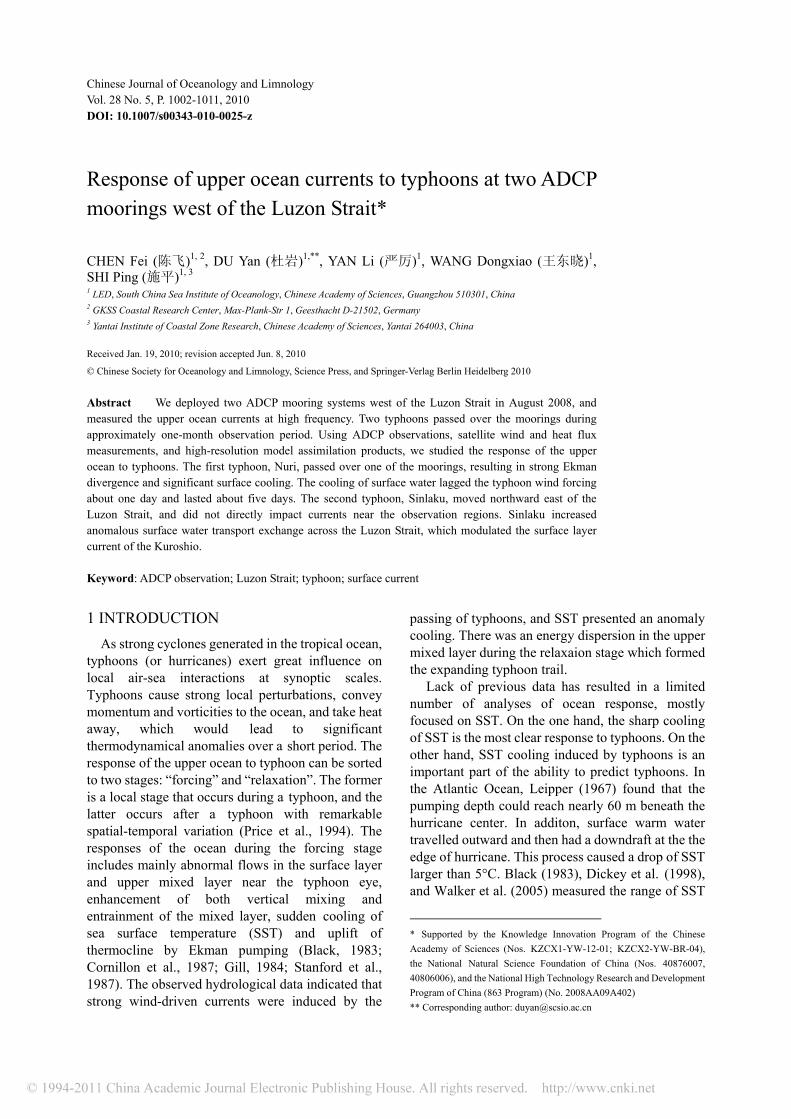
observations over a one-month period, during which time two typhoons passed over the moorings. Fig.1 shows the position of the two moorings and the tracks of the typhoons. Mooring No.1 was deployed at (120°E, 19.5°N), which is located outside of the Kuroshio axis. The observations from this mooring span from 20 August to 20 September. Mooring No.2 was deployed at (120°E, 21°N), which is located where the Kuroshio branch passes Luzon Strait. Observations from this mooring extended from August 19 to September 16. The sampling frequency at both moorings was 10 minutes and the vertical sampling interval was 16 m.
Fig.1 Positions of observations and the paths of Nuri and Sinlaku
Signal ‘*’ represents mooring No.1, while signal ‘·’ represents mooring No.2. The contour lines denote the Mean Dynamic Ocean Topography (MDOT) plus the World Ocean Circulation Experiment (WOCE) sea surface height anomaly (SSHA) during August and September 2008.
The first typhoon, Nuri (No. 200812), was generated in the western Pacific on August 17, 2008. This typhoon moved to the east of the Philippines on 19 August. At that point, the typhoon had a maximum wind speed of 75 knots (38.58 m/s). Nuri passed over mooring No.1 at 12: 00 on August 20 with Category 5 typhoon intensity. It then moved to the Pearl River estuary at 18: 00 on August 21, where it attenuated and vanished. Nuri had a direct impact on mooring No.1. The second typhoon, Sinlaku (No. 200813), formed in the western Pacific on 8 September, and moved east of the Philippines on 9 September in maximum wind speed of 100 knots (51.44 m/s). Then, it moved northward slowly over the Kuroshio, east of the Luzon Strait from September 10–14 as a Category 5 tropical cyclone. Sinlaku landed on the northeastern portion of Taiwan Island at 6:00 on September 14, and then moved northward. Sinlaku did not have a direct impact on the moorings deployed in the study region.
Due to buoy fluctuations, observations were not made at fixed depths during the study period. For

CHIN. J. OCEANOL. LIMNOL., 28(5), 2010 Vol.28
1004
quality control, isolated data were excluded for the first step of the analysis. The data were interpolated to a standard depth (e.g., 17, 33, or 49 m). The vertical interval was 16 m, which was the same depth at which the ADCP sampled. The effective sampling depth for the ADCP was 500 m, which meant that over 18% of the data were missing for mooring No.1 in the upper 50 m. This missing was caused by fluctuations of the buoy (Fig.2a). The surface water reflection also caused the ADCP data in the upper layer to be less precise by an order of magnitude.
This is why the observations were larger compared with the assimilation data (Figs.4, 7). The ADCP observations provided an opportunity to measure the processes of the upper ocean adjustment under typhoon conditions. This indicated that the intensified response at depth of the upper ocean current to the typhoon was about 60 m. Fig.2 shows the detail of the upper ocean current adjustment. The ocean adjusted dramatically in the upper layer (50–60 m), while deeper layers showed little variance. More details can be found in Chen et al. (2009).
Fig.2 Time series of ADCP current vectors and temporal averaged currents; a, c: for mooring No.1, and b, d: for mooring No.2 2.2 Remote sensing data and HYCOM product
To study the processes of upper ocean adjustment, such as wind forcing, heat budgets, SST and velocity fields, we used other observation data over the same period. These data include HYbrid Coordinate Ocean Model (HYCOM) SST, sea surface height (hereafter SSH), surface currents (Kelly et al., 2007), latent heat fluxes that are calculated from Advanced Microwave Scanning Radiometer (AMER), and QuikSCAT daily wind data (Zeng et al., 2009). HYCOM products came from assimilative runs (i.e., HYCOM+ NCODA [Navy Coupled Ocean Data Assimilation] global 1/12°analysis). More details are presented at http://www.hycom.org/dataserver, (accessed on 2010-1-25). Daily latent heat fluxes were calculated using the Coupled Ocean-Atmosphere Response Experiment algorithm (COARE 3.0) (Fairall et al., 2003). QuikSCAT wind speeds and directions at a
height of 10 m over the ocean surface were retrieved from measurements of the scatterometer’s backscattered power with a spatial resolution of 1/4° (see http://www.remss.com/qscat/qscat_description. html)(accessed on 2010-1-25).
3 CURRENT OBSERVATIONS AND RELATED PHYSICAL PROCESSES
The change of upper layer ocean has a close relationship with the passing of typhoons (Fig.2a). A strong north-eastward current appeared after August 20, and then attenuated with oceanic adjustment. The current was southwestward in the next 10 days. Sinlaku moved to the east of the Luzon Strait after September 10, and the upper ocean currents responsed as a north-eastward flow and then weakened after September 17.
The observation depth of mooring No.2 was less

No.5 CHEN et al.: Ocean response to typhoon
1005
than 180 m. the surface current in mooring No.2 had no stable direction as indicated in Fig.2b. The response of the ocean took place mostly in the upper 60 m in which velocity of the current significantly changed when the two typhoons passed over the moorings, and instrument errors were mixed with real signals.
To study the conditions of current in different observation periods, we averaged the speed in the periods (Fig.2c–d). In mooring No.1, the stable northeastward current was characterized by water flowing from the SCS to the Pacific in depths of 350–500 m (Liu et al., 2000; Qu, 2000; Qu et al., 2004). Currents flowed eastward in 80–350 m.
Fig.3 shows detailed information for physical parameters derived from HYCOM SST, SSH, AMER diagnostic flux, and QuikSCAT winds. Nuri, the first typhoon moved rapidly who passed over the mooring directly. Hence, in both mooring locations, SST declined sharply. Conversely, Sinlaku, the second typhoon passed slowly east of the Luzon Strait, and did not have a direct impact on the mooring depoyed there. In addition, SST decreased slowly. Compared with all the physical parameters
above, we found that the SST, the SSH from HYCOM, and calculated latent heat fluxes showed the same features. For example, mooring No.1 showed a rapid SSH drop when Nuri came. This drop was from 95 to 78 in two days. However, the drop was only 10 cm in nearly five days for Sinlaku. Latent heat fluxes were more obvious from mooring No.2, which had a double rise than No.1. We obtained evidence of a close relationship between ocean response and typhoon speed in this study. For mooring No.1, during the first typhoon period (August 19–20), latent heat fluxes lost was less, and the wind speed was larger than those in the second typhoon (September 9–13), implying that the ocean upwelling played a role in SST decrease during the first typhoon, and indicating that when a typhoon passed, the cyclonic wind field would pump up deep cold water to the surface. Therefore, surface divergence advected cold water away from the upwelling region. SST decreased rapidly, and the SSH was depressed. SST in mooring No.2 decreased more slowly than that in mooring No.1, which may be related with the local conditions.
Fig.3 Physical parameters (from top to bottom: HYCOM SST, HYCOM SSH, AMER diagnostic latent heat flux, QuikSCAT winds, and wind stress curl)
a. for mooring No.1 location; b. for mooring No.2 location; two typhoon influencing periods are highlighted by a gray background.

CHIN. J. OCEANOL. LIMNOL., 28(5), 2010 Vol.28
1006
Fig.4 Daily average current speeds (units: m/s) of two moorings when Nuri passed through (a, b: in-situ mooring data; c, d: HYCOM assimilation product)
4 RESPONSE OF UPPER OCEAN TO TYPHOON NURI 4.1 ADCP current in the vertical orientation
Fig.4a–b shows the daily averaged current in the upper 100 m at mooring No.1 and No.2 from August 20 to 26 when Nuri passed the region. Limited by observation methods, some data were missing in the ADCP observations at the surface layer. Besides, 2m/s current speed appears in some days. This speed in upper 50 m ocean is much larger than realistic speed in South China Sea region. Generally, the upper 50 m data are considered unreliable due to the nature of the ADCP measurements and deployment depth. HYCOM re-analysis was used for cross-validation (Fig.4c–d). From the HYCOM data, the current direction was consistent with the ADCP observations for both moorings, which confirmed the previous conclusion that “the ADCP data in the upper layer were not precise within the order of sampled ADCP data’s magnitude”. Therefore, we may have overestimated the magnitude of ADCP current, but the responded ocean currents’ direction in the upper layer was still reasonable. The quality of the HYCOM data can be validated by the SSH and current structure shown later (Figs.6, 9).
As shown in Fig.4a and 4c, in terms of the magnitude of current vectors, the flow velocity during August 20 was still small when Nuri passed.
The typhoon strenthened on August 21 after Nuri left from the region of mooring No.1 and eventually landed in Pearl River estuary at 18:00 on 21 August, indicating that the flow field of the surface layer required a certain period of time to respond. This is why its response (flow velocity increasing) lagged the passing of the typhoon for about 1 day. In vertical direction, when the ocean currents responded to the typhoon on August 21, the response depth extended to nearly 80 m. This response depth was illustrated by both in-situ datasets (Fig.4a) and assimilated products (Fig.4b). We think that 80 m is reasonable. Great velocity changes in the upper 50 m were derived from overestimated speeds measured by ADCP from 23 to 25. The observations and HYCOM outputs show that the currents had different histories of variation in flow direction. From the HYCOM results, medium northward currents lasted about five days after a typoon passing. This low-frequency adjustment represented the attenuation process of ocean current driven by wind at the tr of track of the typhoon.
The main energy source of the typhoon is from the vast warm water ocean. When a typhoon originally forms, it acquires the latent heat released by evaporation at the ocean surface, and then gradually grows and swells during which one can imagine, the strong wind field of the typhoon accelerates evaporation, which provides the necessary heat

No.5 CHEN et al.: Ocean response to typhoon
1007
source. On the other hand, strong turbulent mixing appears in the ocean surface and deepens the mixed layer when typhoon strengthens. Meanwhile, the cyclone arises from a strong sea surface-layer with a horizontal divergence and cold water upwelling in the thermocline, all of which lead to a reduction of sea-surface temperature.
When Nuri passed on August 21, SST dropped for about 2°C as shown in Fig.3a and 3b. In addition, the SSH depressed by 10 cm. Large-scale advections created a low SSH area due to the divergence of the surface-layer, and subsequently, the latent heat fluxes were greatly increased, indicating that the typhoon caused the enhancement of evaporation in the ocean surface and rapid heat loss at the ocean surface. Wind speed over the ocean surface reached more than 20 m/s during the typhoon and then dropped down rapidly afterward as demonstrated by QuikSCAT winds. The adjustment process of the ocean was comparatively slow and the response of its surface-layer flow field lagged the atmospheric forcing.
The daily averaged current speed at mooring No.2 (Fig.4b & 4d) showed smaller velocities then that in mooring No.1 (Fig.4a & 4c). No sudden increase in velocity was observed, but the flow direction changed from nearly westward to northward. A milder response occurred in mooring No.2 than mooring No.1. This may be explained that mooring No.1 was right below the path of typhoon. In addition, mooring No.2 was located north of mooring No.1, where the response of ocean current was weaker. The ocean response at mooring No.2 still lagged by 1 day to the typhoon. On August 20, the surface current was westward, while on August 21 it changed in northward direction (Fig.4b & 4d). In vertical direction, when the ocean currents responded to the typhoon cyclone on August 21, the response depth deepened to about 80 m. The directions changed consistently northward from the surface down to 75 m. Such northward flow was maintained from August 21 to 24, and is shown especially from the HYCOM data. The northward flow decreased gradually, which indicated a gradual reduced influence of the typhoon. The recovery and adjustment lasted from August 22 to 24. In the period after the 25th, the surface-layer flow field was determined by geostophic currents.
Similarly, at mooring No.2, the SST cooled down, the latent heat fluxes climbed and the wind speed above the ocean surface slowed down gradually after the typhoon. The difference is that the SSH of
mooring No.2 had a smaller increase as it located off the typhoon path. Surface water was transported to this area by advection in the wake of the typhoon, which led to a slight convergence movement only.
4.2 Wind field and SST
On August 20, Typhoon Nuri passed over the Luzon at a maximum speed of about 28 m/s near 121°E/19.5°N. However, the minimum SST was located northeast of the Luzon Islands. SST in this area decreased to below 27°C and the lowest value was 25°C.
On August 21, Nuri moved to the open sea near Guangdong Province, with a maxium speed of 50 m/s. Meanwhile, minimum SST (lower than 27°C) was recorded east of the Luzon Strait. Therefore, minimum SST always lagged the maximum wind speeds. The center of the cold eddy was southeast of the typhoon center.
Furthermore, SST declined in the observation sites, from 29°C to 28°C at 120°E/19.5°N, and from 29.5°C to 28°C at 120°E/21°N. This SST pattern can explain the sharp SST decrease during the passing of Nuri (Fig.3).
4.3 Surface circulation and SSH
The SSH and surface currents from HYCOM (Fig.6) were reasonable compared with the satellite wind observations. The ocean response lagged the atmospheric forcing when Nuri moved to the open sea near the Pearl River estuary on August 21
(Fig.5b). On August 21, the pressure gradient shown on the SSH pointed to the SCS. Conversely, the surface sea current crossed the contour line northeastwards, indicating that the surface current was the Ekman divergence current caused by the force of the typhoon but the geostrophic current. A low SSH area is clear in the wake of Typhoon Nuri, which is consistent with the low SST. On August 25, the low SSH area moved northwestwards and the current was southwestward. These currents are due to the adjustment of the upper-ocean flow after the typhoon. It is clear that after the ocean adjustment, the upper ocean recovered to its normal condition. Surface currents turned to geostrophic currents, following the SSH contours.
Moreover, on August 21, surface flow carried seawater from the northern SCS to the western Pacific across the Luzon Strait. Meanwhile, on August 25, there was no water discharge from the SCS. Thus, Nuri led to a surface water exchange between the SCS and the Western Pacific Ocean.

CHIN. J. OCEANOL. LIMNOL., 28(5), 2010 Vol.28
1008
Fig.5 QuikSCAT Wind Field (a, b: vectors denote wind directions; the shadings denote wind speeds; units: m/s) and HYCOM SST (c, d: units: °C) during the Nuri passing period (August 20 and 21)
Fig.6 HYCOM SSH (units: m) and surface-layer flow field (units: m/s) on August 21 and 25
5 RESPONSE OF UPPER-OCEAN TO TYPHOON SINLAKU
5.1 ADCP current in the vertical orientation
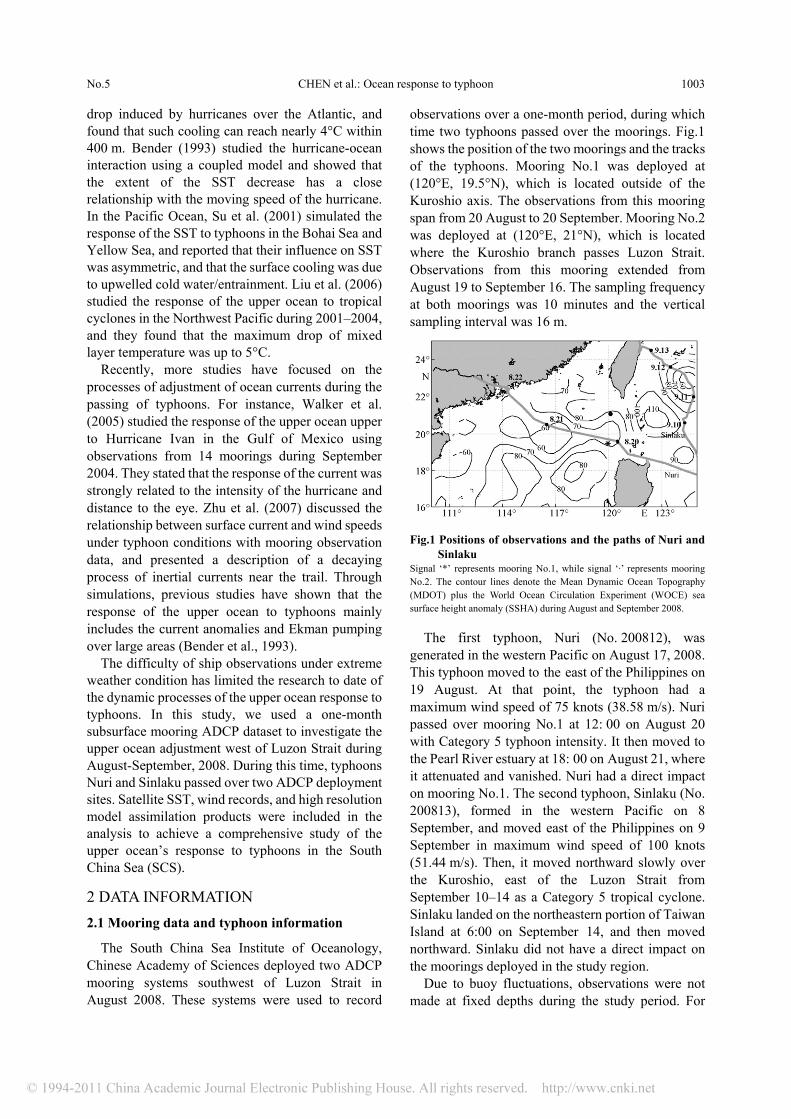
Fig.7 shows the ADCP and HYCOM daily averaged current at moorings No.1 and No.2 from September 8 to 14 during the passing of Sinlaku east of the Luzon Strait. Sinlaku moved slowly between September 9 and 13, lingered in the region east of the strait, and had no directly impact on the region of the
moorings. Therefore, ocean currents near the two moorings responded slowly and weakly to Sinlaku without rapid velocity increase and sudden direction changes.
For mooring No.1, southward currents dominated the surface to nearly 100 m during September 9–12, and then turned southeastward. For mooring No.2, vertical currents were southwestward from the surface to nearly 100 m during September 9–12, and then in September 13 the direction changed slightly to southward.
No.5 CHEN et al.: Ocean response to typhoon
1009
Fig.7 Daily average current speed (units: m/s) of two moorings when Sinlaku passed through (a, b: in-situ mooring observation;
c, d: HYCOM assimilation)
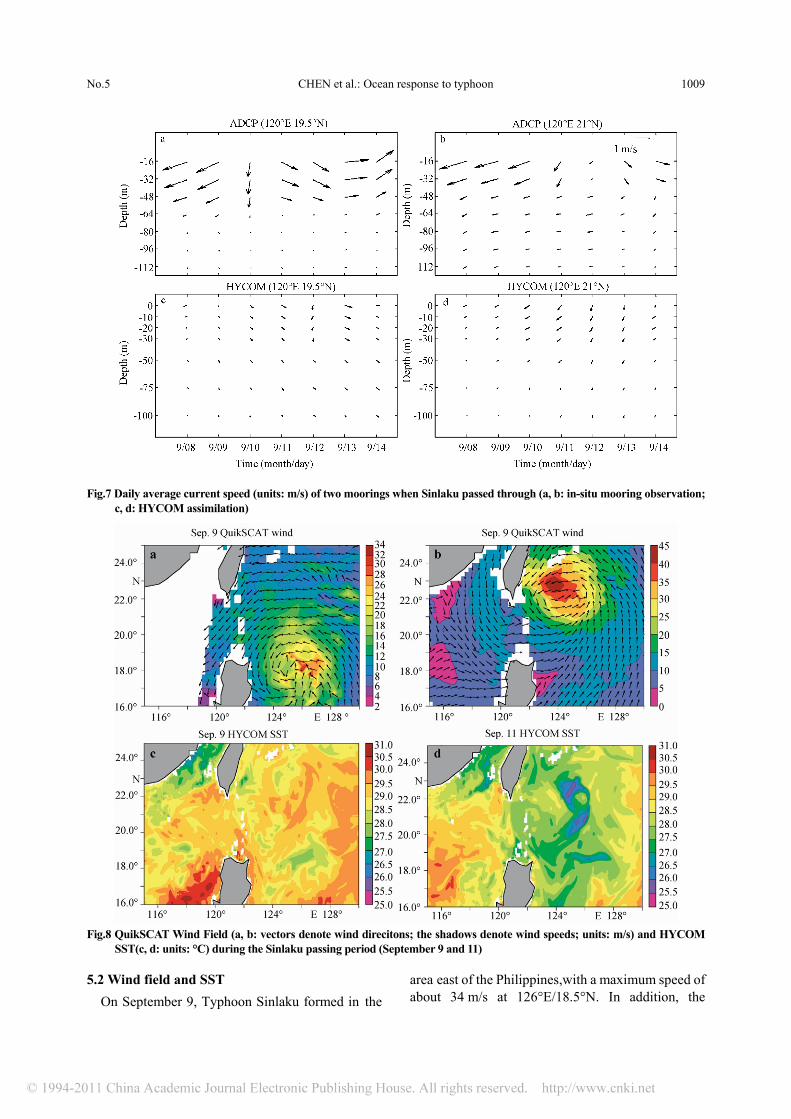
Fig.8 QuikSCAT Wind Field (a, b: vectors denote wind direcitons; the shadows denote wind speeds; units: m/s) and HYCOM SST(c, d: units: °C) during the Sinlaku passing period (September 9 and 11)
5.2 Wind field and SST
On September 9, Typhoon Sinlaku formed in the area east of the Philippines,with a maximum speed of about 34 m/s at 126°E/18.5°N. In addition, the

CHIN. J. OCEANOL. LIMNOL., 28(5), 2010 Vol.28
1010
minimum SST located near the typhoon center. SST in this area decreased to below 28.5°C, minimum at 27°C.
On September 11, Sinlaku moved east of Taiwan Island at the maximum speed 45 m/s. Meanwhile, the minimum SST (<27°C) distributed a slightly east of the maximum speed region. Therefore, the minimum SST always matched the maximum wind speed. The center of the cold eddy was close to the typhoon center simultaneously. Over the region, the typhoon caused a large-scale change of wind field and a strong Ekman pumping east of the Luzon Strait, causing latent heat loss and vertical mixing of the upper ocean, which is important to the SST. In addition, the SST west of the Luzon Island dropped from 30.5°C to 28.5°C. The SST at the two moorings dropped slowly because the
entire northern SCS was slightly influnced by Sinlaku.
5.3 Surface circulation and SSH
In September, before and after Sinlaku, the SSH and current distribution between September 6 and 16 followed the same pattern to the west of the Luzon Strait, regardless of the passing of the typhoon east of the strait. On September 6, the sea current southwest of the strait turned to show typical eddies in the SCS, which is explained by classical geostrophic current theory. After the typhoons, the geostrophic current induced water in the entire upper ocean from the SCS to the Kuroshio. No such a geostrophic current was observed before the typhoon.
Fig.9 HYCOM SSH (units: m) and surface-layer flow field (units: m/s) on September 6 and 16 6 CONCLUSIONS
Two ADCP moorings were mounted west of the Luzon Strait during August and September 2008 for studying the upper ocean current adjustment to typhoon forcings. Satellite wind and high-resolution numerical assimulation products were used to give the spatial response of the ocean.
When Typhoon Nuri passed right through the mooring sites, the local upper ocean current responded rapidly to large-scale wind forcing. For mooring No.1, the current velocity increased suddenly. For mooring No.2, the current direction changed at once. Associated SST cooling was induced by upwelling, as well as by latent heat flux loss. A 1-day lag to the typhoon forcing indicated that Ekman currents dominated the ocean surface layer. Surface water flowed across the isoline of the SSH, which generated the geostrophic current in the thermocline. After five days of typhoon, the surface layer resumed to mainly geostrophic currents.
Conversely, Typhoon Sinlaku passed nearby the
mooring sites, and had a less impact on the local current northwest of the Luzon Strait. Sinlaku moved slowly northward east of the strait. The change in the upper ocean currents was weaker compared with that by Typhoon Nuri. Mostly, the current adjusted as a geostrophic current. After the passing of the typhoons, the surface outflow at the Luzon Strait was enhanced toward the Pacific Ocean due to the pressure head toward the northeast of Taiwan Islands.
7 ACKNOWLEDGMENTS We wish to thank the HYCOM group for
providing the ocean hindcast data, and APDRC/University of Hawaii for maintaining the satellite database.
References
Bender M A, Ginis I, Kurihara Y. 1993. Numerical simulations of tropical cyclone-ocean interaction with a high-resolution coupled model. J. Geophys., Res., 98: 23 245-23 263.
Black P G. 1983. Ocean Temperature Changes Induced by

No.5 CHEN et al.: Ocean response to typhoon
1011
Tropical Cyclones. The Pennsylvania State University. 278p.
Chen F, Du Y, Wang D X, Shi P, Mao H B, Chen R Y, Chen J. 2009. Baroclinic currents observed by mooring ADCP in southwest Luzon Strait during August-September 2008. Journal of Tropical Oceanography, 28(4): 66-71. (in Chinese with English abstract)
Cornillon P, Stramma L, Price J F. 1987. Satellite measurements of sea surface cooling during hurricane Goria. Nature, 326: 373-375.
Dickey T, Frye D, McNeil J. 1998. Upper-ocean temperature response to Hurricane Felix as measured by the Bermuda test bed mooring. Mon. Wea. Rev., 126: 1 195-1 201.
Fairall C W, Bradley E F, Hare J E, Grachev A A, Edson J B. 2003. Bulk parameterization of air–sea fluxes: updates and verification for the COARE algorithm. J. Climate, 16: 571-591.
Gill A E. 1984. On the behavior of internal waves in the wakes of storms. J. Phys. Oceanogr., 14: 1 129-1 151.
Kelly K A, Thompson L, Wei C, Metzger E J. 2007. Evaluation of HYCOM in the Kuroshio Extension region using new metrics. J. Geophys. Res., 112(C01004), doi:10.1029/2006JC003614.
Leipper D F. 1967. Observed ocean conditions and Hurricane Hilda, 1964. J. Atmos. Sci., 24: 182-196.
Liu Q Y, Yang H J, Li Wei, Liu Z T. 2000. Velocity and transport of the zonal current in the Luzon Strait. Acta Oceanology Sinica, 22(2): 1-8. (in Chinese with English abstract)
Liu Z H, Xu J P, Zhu B K. 2006. Upper ocean response to
tropical cyclones in northwestern Pacific during 2001-2004 by Argo data. Journal of Tropical Oceanography, 25: 1-8. (in Chinese with English abstract)
Price J F, Sandord T B, Forristall G Z. 1994. Forced stage response to a moving hurricane. J. Phys. Oceanogr., 24: 233-259.
Qu T D. 2000. Upper-Layer circulation in the South China Sea. J. Phys. Oceanogr., 30: 1 450-1 460.
Qu T D, Kim Y Y, Yaremchuk M, Tozuka T, Ishida A, Yamagata T. 2004. Can Luzon Strait transport play a role in conveying the impact of ENSO to the South China Sea? J. Climate, 17: 3 644-3 657.
Stanford T B, Black P G, Haustein J R, Feeney J W, Forristall G Z, Price J F. 1987. Ocean response to a hurricane, Part I: Observations. J. Phys. Oceanogr., 17: 2 065-2 083.
Su J, Li L, Bao X W. 2001. Numerical experiment of SST response to typhoon process in Yellow Sea and Bohai Sea. Journal of Ocean University of Qingdao, 31(2): 165-172. (in Chinese with English abstract)
Walker N D, Leben R R. 2005. Hurricane-forced upwelling and chlorophy enhancement within cold-core cyclones in the Gulf of Mexico. Geophys. Res. Lett., 32: L18610.
Zeng L L, Shi P, Liu W T, Wang D X. 2009. Evaluation of a satellite-derived latent heat flux product in the South China Sea: A comparison with moored buoy data and various products, Atmospheric Research, 94: 91-105.
Zhu D Y, LI L. 2007. Near inertial oscillations in shelf-break of northern South China Sea after passage of typhoon Wayne. Journal of Tropical Oceanography, 26(4): 1-4. (in Chinese with English abstract)