Embed Size (px)
Citation preview
ROI & Impact: Quantitative & Qualitative Measures for Taxonomies
Wednesday, 11 February 2009
12:00 – 12:30 PM MST
Presented by Jay Ven Eman, Ph.D., CEO
Access Innovations, Inc. / Data Harmony
505.998.0800 / www.accessinn.com / www.dataharmony.com
DHUG 2009
First, some questions Do you know what a taxonomy is? Does your boss’s boss know? Care? What are YOU trying to accomplish? What are your objectives? What isn’t working? What is?
How badly? How much? Who? Where?
Copyright 2007 Access Innovations, Inc.
First, some questions - 2 Who are your searchers?
Internal? Intranet? External? Web? Fee based (commercial)? How many? What do they do? How do they do it?
What are they seeking? Why?
Copyright 2007 Access Innovations, Inc.

First, some questions - 3 Where are they looking? How many searching environments?
Physical? Internal resources? External resources? Search interfaces?
And so on…
Copyright 2007 Access Innovations, Inc.
Copyright 2007 Access Innovations, Inc.
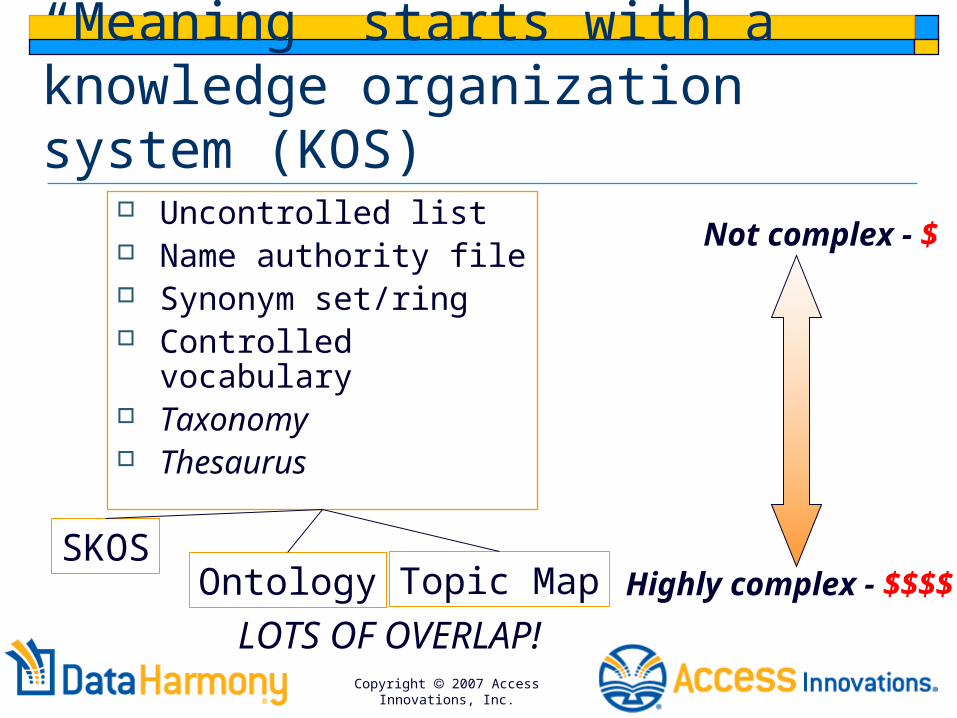
“Meaning” starts with a knowledge organization system (KOS)
Uncontrolled list Name authority file Synonym set/ring Controlled vocabulary Taxonomy Thesaurus
Not complex - $
Highly complex - $$$$
LOTS OF OVERLAP!
Topic MapOntologySKOS
The Pain of Search
Copyright 2007 Access Innovations, Inc.
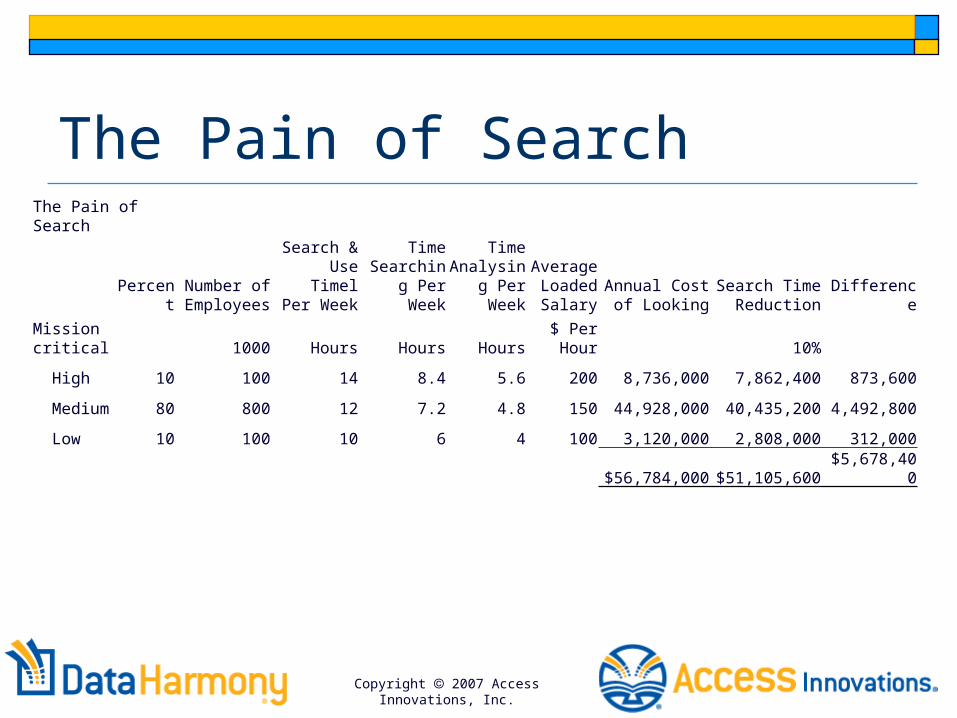
The Pain of Search
PercentNumber of Employees
Search & Use Timel Per Week
Time Searching Per Week
Time Analysing Per Week
Average Loaded Salary
Annual Cost of Looking
Search Time Reduction Difference
Mission critical 1000 Hours Hours Hours
$ Per Hour 10%
High 10 100 14 8.4 5.6 200 8,736,000 7,862,400 873,600
Medium 80 800 12 7.2 4.8 150 44,928,000 40,435,200 4,492,800
Low 10 100 10 6 4 100 3,120,000 2,808,000 312,000
$56,784,000 $51,105,600 $5,678,400
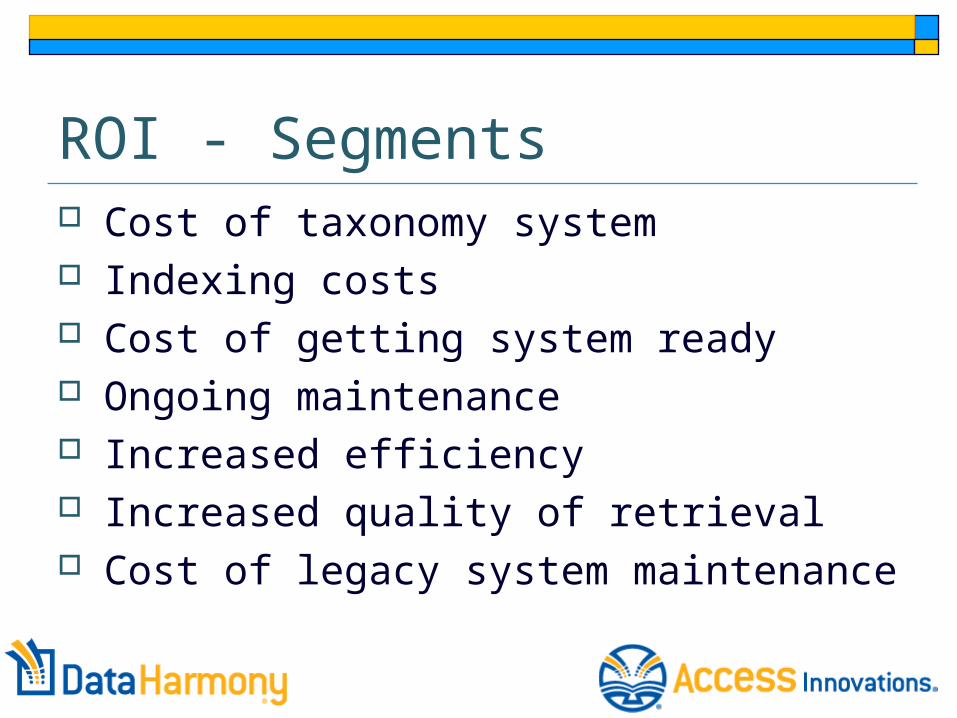
ROI - Segments Cost of taxonomy system Indexing costs Cost of getting system ready Ongoing maintenance Increased efficiency Increased quality of retrieval Cost of legacy system maintenance
Copyright © 2005 Access Innovations, Inc.
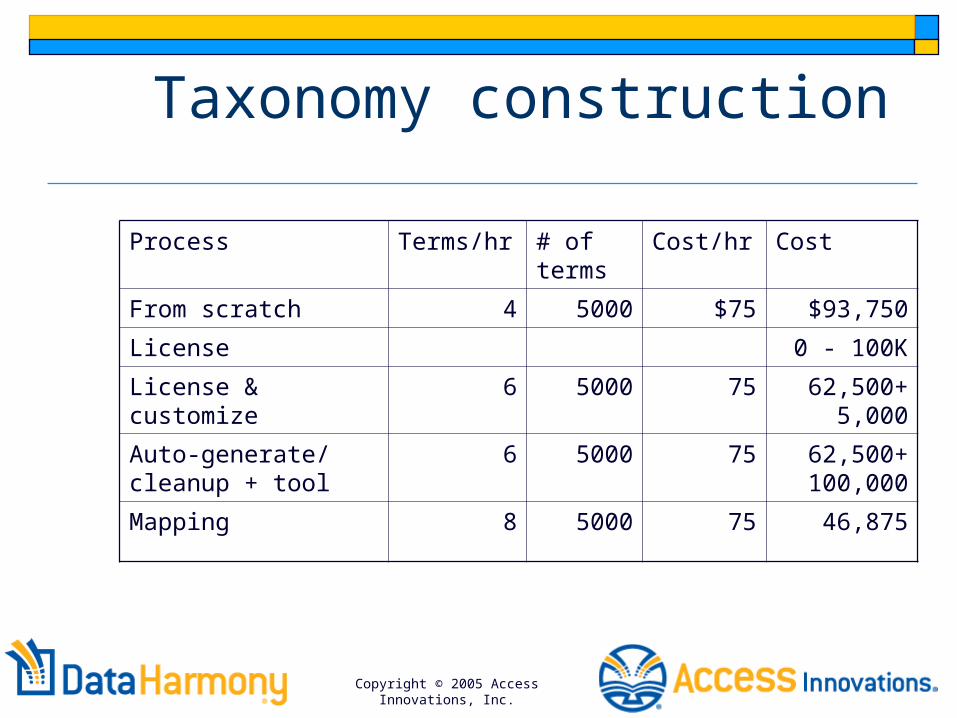
Taxonomy construction
Process Terms/hr # of terms
Cost/hr Cost
From scratch 4 5000 $75 $93,750
License 0 - 100K
License & customize 6 5000 75 62,500+ 5,000
Auto-generate/cleanup + tool
6 5000 75 62,500+ 100,000
Mapping 8 5000 75 46,875

Indexing & Search Metrics Hit, Miss, Noise Subjective
Relevance Aboutness
Statistical Precision Recall Level of effort

Hit, Miss, Noise Hit – exactly what a human indexer would use Miss – human indexer would use but system
did not assign Noise – system assigned but human did not
Relevant noise – could have been assigned Irrelevant noise – just plain wrong

Subjective Relevance
Reflects how akin it is to the users request Aboutness
Reflects the topical match between the document content and the term
How well the topic describes what the document is about
Varies with level of conceptual terms vs. factual terms in the thesaurus

Subjective “There is now a 92% accuracy rating accuracy on accounting and
regulatory document search based on hit, miss and noise or relevance, precision and recall statistics…Access Innovations.” USGAO
“IEEE had their system up and running in three days, in full production in less than two weeks.” Institute of Electrical and Electronics Engineers (IEEE)
“The American Economic Association said its editors think using it is fun and makes time fly!” American Economic Association (AEA)
“ ProQuest CSA have achieved a 7 fold increase in productivity – thus they have four licenses.” ProQuest CSA
“Weather Channel finds things 50% faster using Data Harmony. A significant saving in time.” The Weather Channel
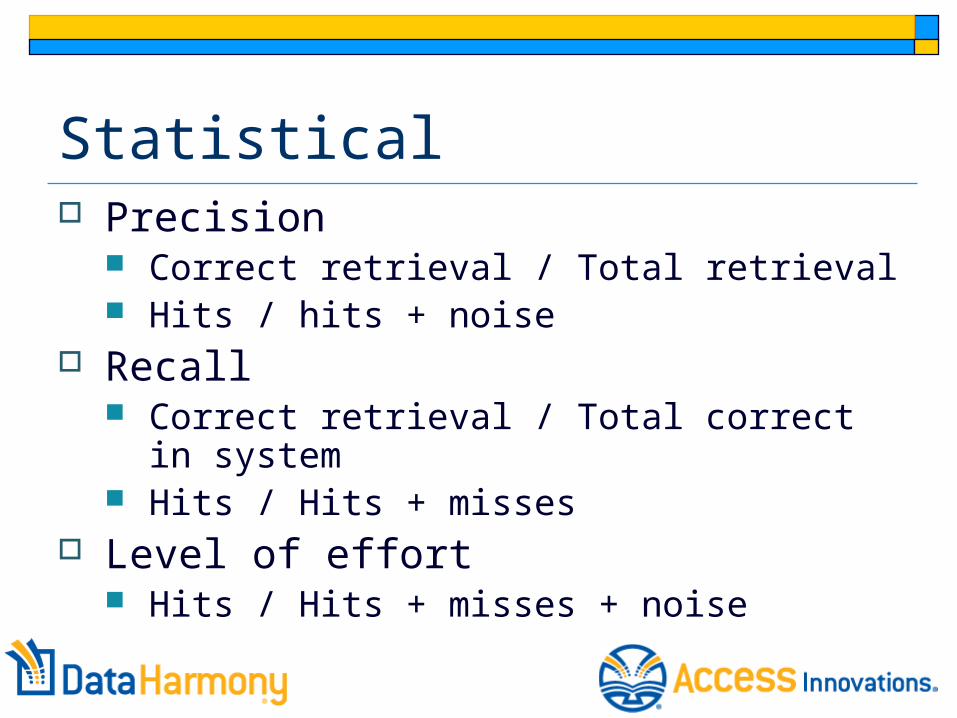
Statistical Precision
Correct retrieval / Total retrieval Hits / hits + noise
Recall Correct retrieval / Total correct in system Hits / Hits + misses
Level of effort Hits / Hits + misses + noise
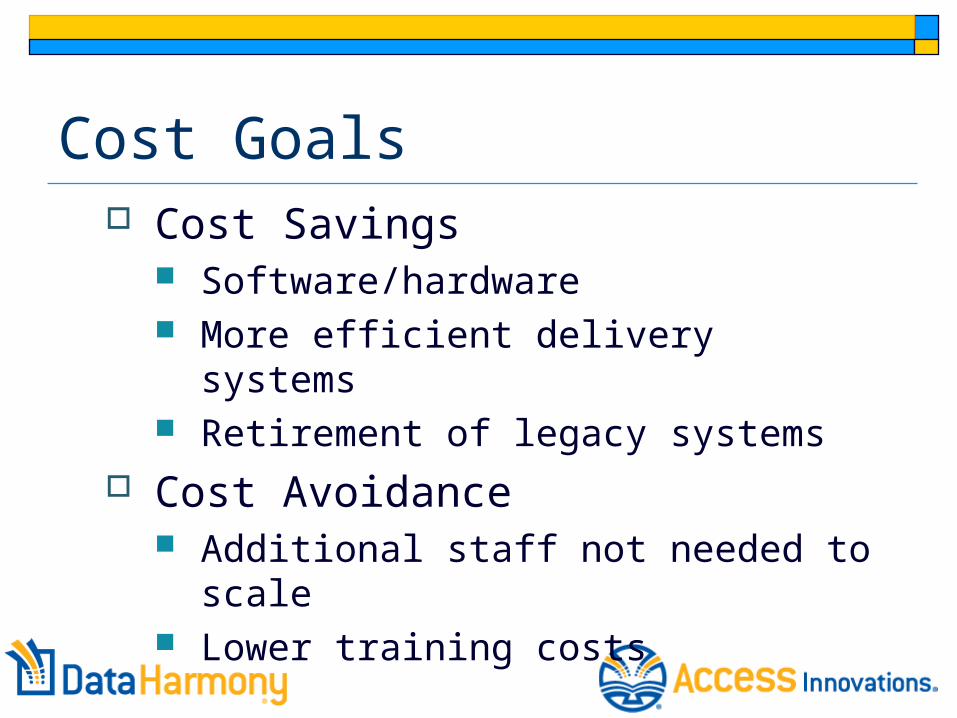
Cost Goals Cost Savings
Software/hardware More efficient delivery systems Retirement of legacy systems
Cost Avoidance Additional staff not needed to scale Lower training costs
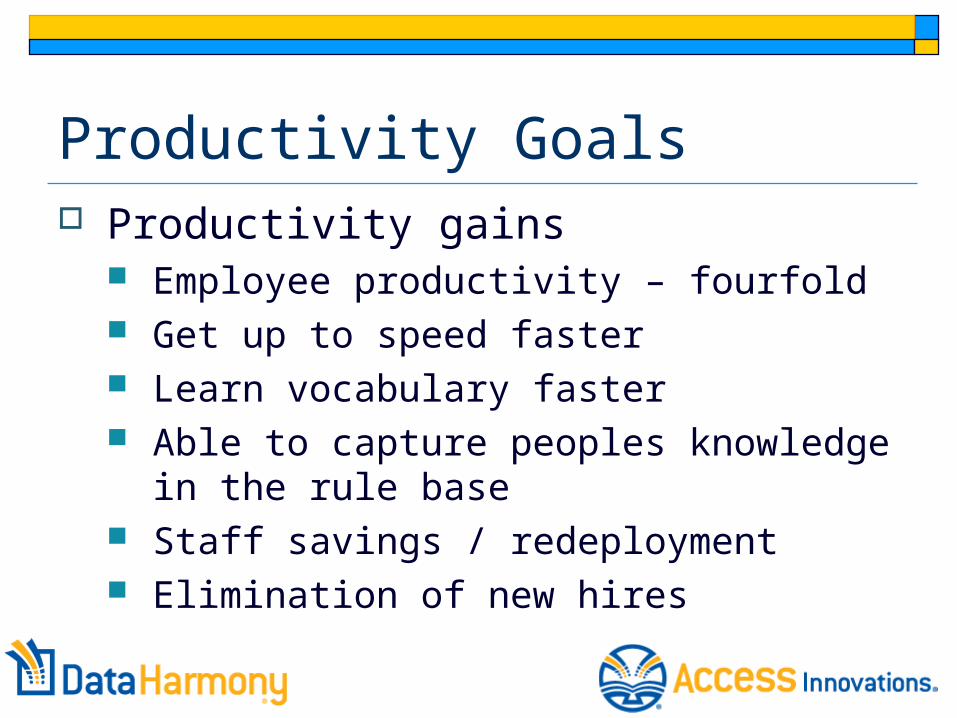
Productivity Goals Productivity gains
Employee productivity – fourfold Get up to speed faster Learn vocabulary faster Able to capture peoples knowledge in the
rule base Staff savings / redeployment Elimination of new hires

Additional Benefits Revenue Generation
Higher hit rates More purchases off the site
Competitive advantage Shorter product / sales cycles Faster implementation Better search experience
Ability to meet regulatory requirements

Go – No Go Reach 85% precision to launch for
productivity - assisted Reach 85% for filtering or categorization
Sorting for production Level of effort to get to 85% Integration into the workflow is efficient
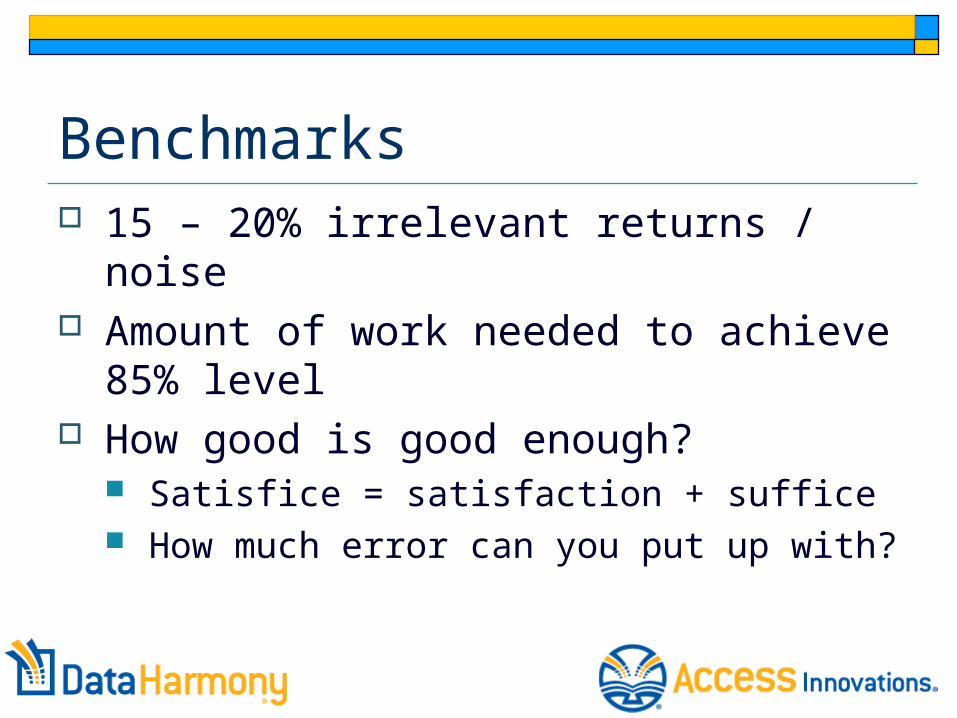
Benchmarks 15 – 20% irrelevant returns / noise Amount of work needed to achieve 85%
level How good is good enough?
Satisfice = satisfaction + suffice How much error can you put up with?

Example ROI Calculation Assume – 5,000 term thesaurus
1.5 synonyms per terms 7,500 terms total
Assume 85% accuracy Use assisted for indexing Use automatically for filtering
Assume $75 per hour for staff Assume 10,000 records for test batch

Indexing costs with Data Harmony 80% of rules built automatically 7,500 x .8 = 6,000 20% require complex rules
Average rule takes 5 minutes (Actually MUCH faster using M.A.I. GUI) 5 x 1,500 = 7,500 minutes 125 hours x $75 = $9,375

Indexing Costs Base cost of MAIstro EE - $60,000 Cost of getting system ready
Programming support and integration Estimated at 2 weeks programming $125 / hour = $10,000
Rule building Estimated at 125 hours $75 / hour = $9,375 Possible need to re-run training set several times
Ongoing maintenance Estimated at 15% of purchase price for license = $9,000 Rule building for new terms 50 terms per quarter
200 terms x .8 = 160 automatic 40 at 5 minutes per term = 200 minutes /60 = 3.33 hours x $75 =
$250 Targeted initial accuracy at 85%
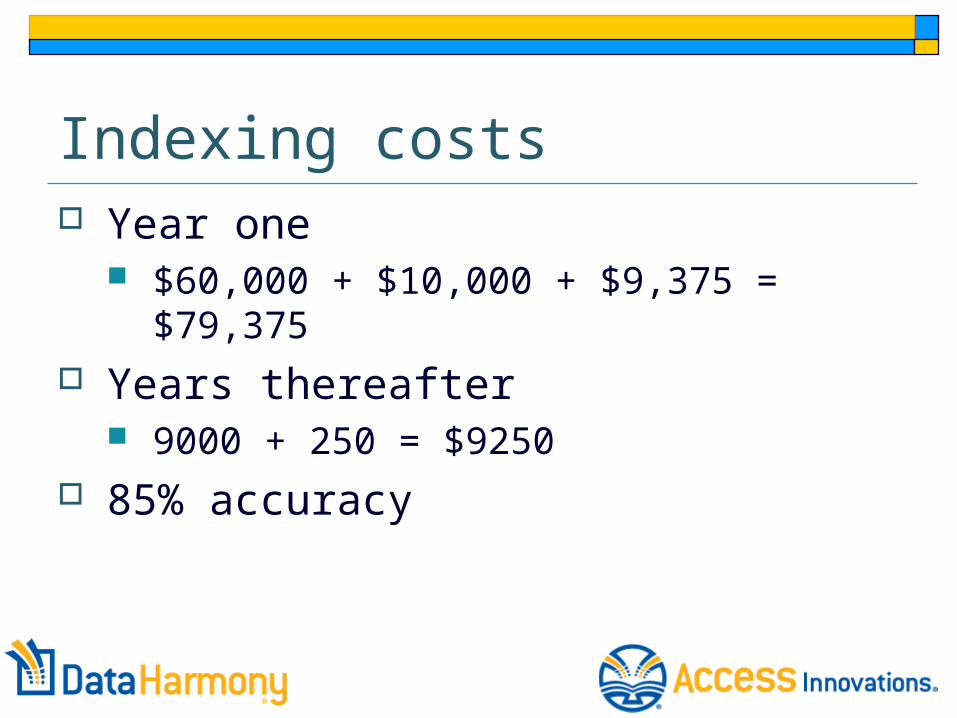
Indexing costs Year one
$60,000 + $10,000 + $9,375 = $79,375 Years thereafter
9000 + 250 = $9250 85% accuracy

ROI Taxonomy costs = $67,500 Indexing costs = $79,375 Pain of search – difference = $5,678,400 If off by factor of 4, then a positive ROI of
241%
Copyright 2007 Access Innovations, Inc.

ROI & Impact: Quantitative & Qualitative Measures for Taxonomies
Wednesday, 11 February 2009
12:00 – 12:30 PM MST
Presented by Jay Ven Eman, Ph.D., CEO
Access Innovations, Inc. / Data Harmony
505.998.0800 / www.accessinn.com / www.dataharmony.com
Thank you!