Embed Size (px)
Citation preview

業務のためのPython勉強会 #2
Jul. 2, 2015 阿久津 剛史
TW @akucchan_world
1
私のPython学習奮闘記#2 〜データ分析編〜

自己紹介
• 阿久津 剛史 Twi=er @akucchan_world
• 某メーカー勤務 – 元光通信エンジニア(自称は現役) – 現マーケティング担当
• Python経験1年弱 – MIT OCW 2 courses finished. – 実務で使うために勉強中
2

ご注意
In[1]: MyTalk == type(lecture) Out[1]: False In[2]: MyTalk == type(report) Out[2]: True
3
私の発表は 授業ではありません
私の発表は 報告の一種です
初心者(Starter)の 初心者(Starter)による 初心者(Starter)のための
Python勉強法
Contents
• Pythonでデータ分析しよう! • Ex. 1: アンケート集計 • Ex. 2: ウェブ上のデータ処理
4

Contents
• Pythonでデータ分析しよう! • Ex. 1: アンケート集計 • Ex. 2: ウェブ上のデータ処理
5
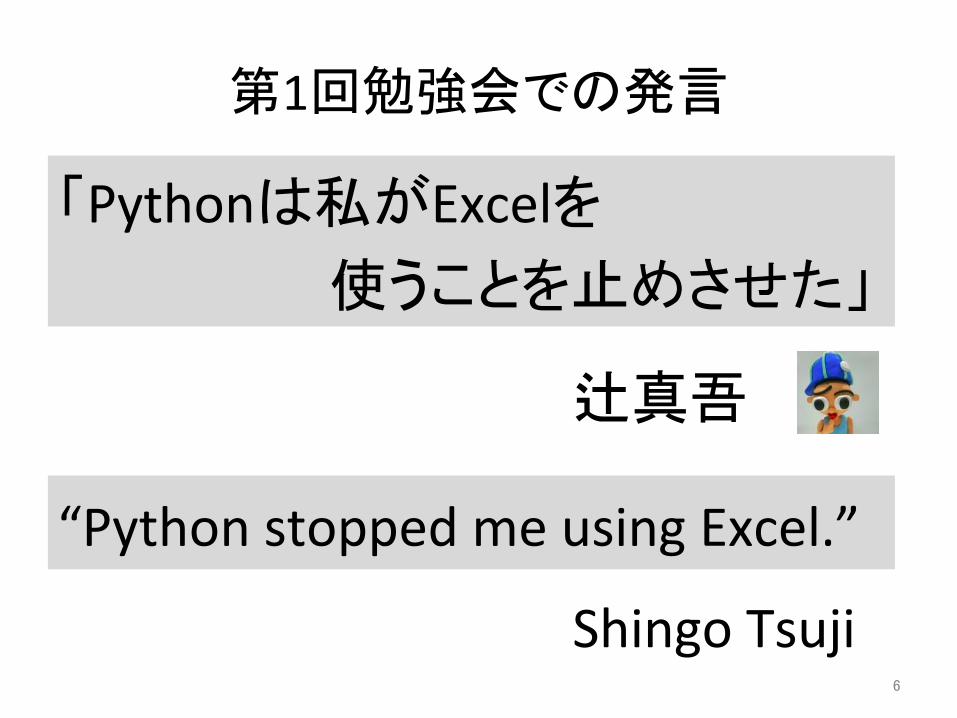
第1回勉強会での発言
“Python stopped me using Excel.”
6
「Pythonは私がExcelを 使うことを止めさせた」
辻真吾
Shingo Tsuji

データ分析ツール
7
表計算ソフト (Excel)
標準関数、分析ツール
簡易プログラミング言語 (Excel VBA)
ファイル処理、自動化
プログラミング言語(Python, R)
機械学習、クラスタリング
機能性
Easy
Hard
難易度
Basic Advanced

Wes McKinney(著)、 小林儀匡ほか(訳)、 『Pythonによるデータ分析入門』 • pandas開発者の著書
Pros: • 実例が豊富 • データサイエンスを目指すのに最適
Cons: • 多くの知識(Python、統計学)を前提としている
• ムズい! 8

Split-‐Apply-‐Combine Strategy[1]
9 [1] Hadley Wickham, h=p://vita.had.co.nz/papers/plyr.pdf
A B C A B C A B C
1,000 2,000 3,000 2,000 2,500 4,000 3,000 3,000 5,000
A 1,000 A 2,000 A 3,000
B 2,000 B 2,500 B 3,000
C 3,000 C 4,000 C 5,000
A 2,000 B 2,500 C 4,000
School Amount
Split (分離)
Apply (適用)
Combine (結合)
Ex. 小学生のおこづかいデータ
mean
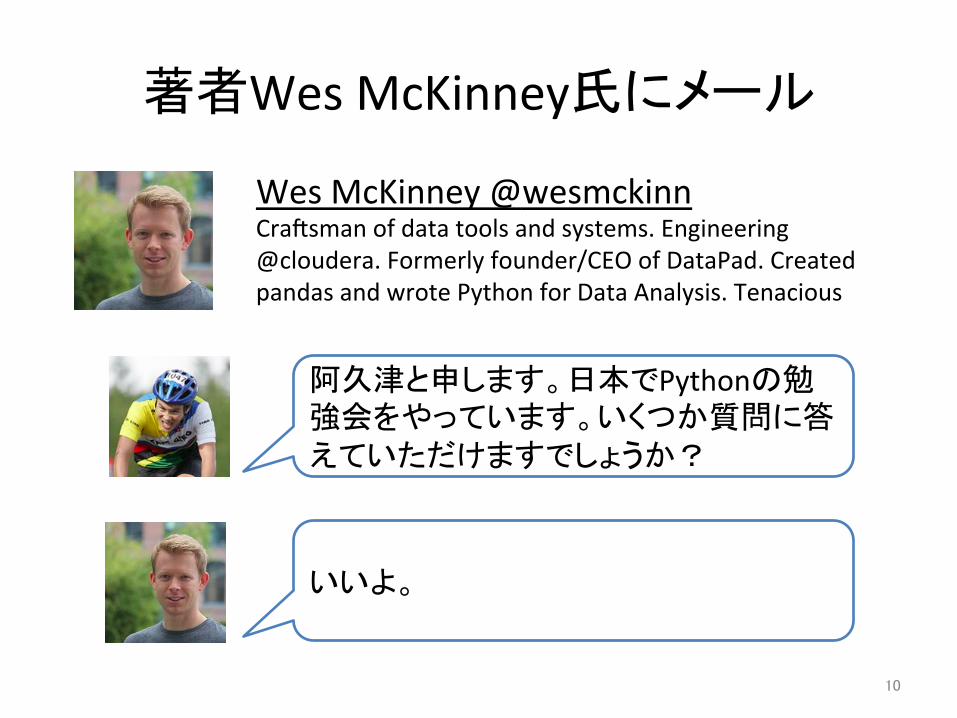
著者Wes McKinney氏にメール
10
Wes McKinney @wesmckinn Cracsman of data tools and systems. Engineering @cloudera. Formerly founder/CEO of DataPad. Created pandas and wrote Python for Data Analysis. Tenacious
阿久津と申します。日本でPythonの勉強会をやっています。いくつか質問に答えていただけますでしょうか?
いいよ。
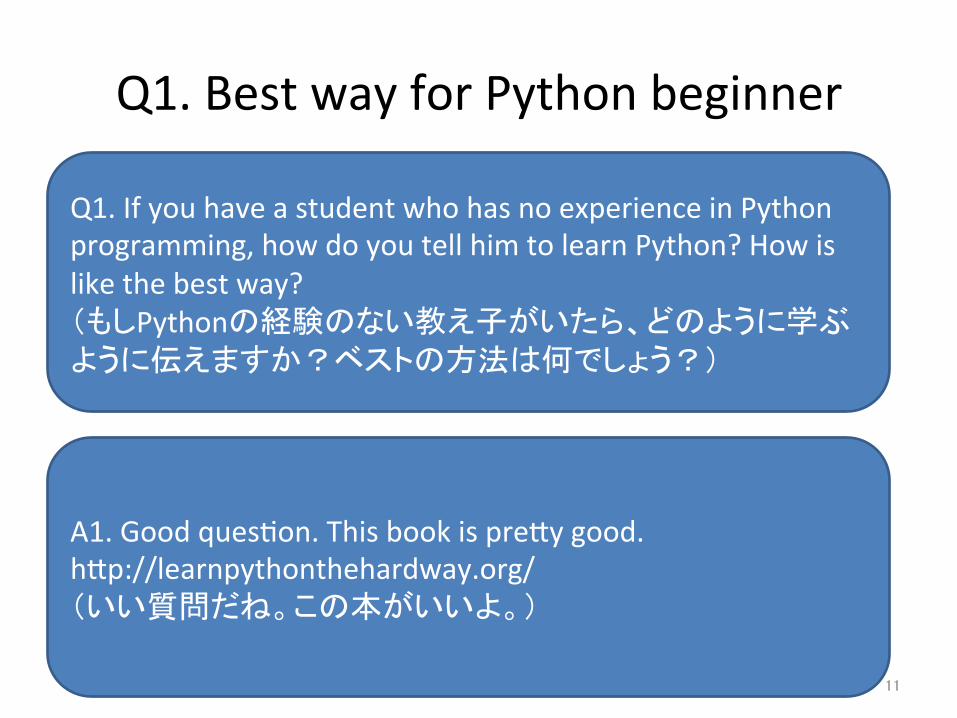
Q1. Best way for Python beginner
11
Q1. If you have a student who has no experience in Python programming, how do you tell him to learn Python? How is like the best way? (もしPythonの経験のない教え子がいたら、どのように学ぶように伝えますか?ベストの方法は何でしょう?)
A1. Good quesion. This book is pre=y good. h=p://learnpythonthehardway.org/ (いい質問だね。この本がいいよ。)

Learn Python The Hard Way
12 h=p://learnpythonthehardway.org/

Q2. Your book was published three years ago. Is there any big change in Python for Data Analysis? Do you have a plan to revise your book? (あなたの本は3年前に書かれましたが、Pythonによるデータ分析において大きな変化はありますか?改訂の予定はありますか?)
A2. I haven't begun any revisions; I would like to do a revised version in 2017 or so. (まだ改訂は始めていないよ。 2017年くらいに改訂したいね。)
Q2. Plan for Revision
13

Q3. While Python ver.2 was recommended in your book, is ver.2 sill be=er than ver.3 for beginners who have just started Python programming? (あなたの著書ではPython 2.xが薦められていましたが、これからPythonを始めるビギナーにとっても3.xより2.xが良いでしょうか?)
A3. If you can, I would use Python 3.4. The Anaconda distribuion makes seong up a complete Python 3.4 environment fairly easy; you can google for instrucions (僕だったらPython 3.4を使うね。Anacondaディストリビューションなら超簡単に3.4環境を導入できるよ。ググればインストール方法もわかるよ。)
Q3. Python 2.x or 3.x?
14

Q4. Message for Our Club
15
Q4. Could you give us a message for our Python learner colleagues? We will be happy if we could have your idea. (Pythonを学ぶ仲間たちにメッセージをいただければ、幸いです。)
A4. Good luck on your Python journey; I believe it will be worth your ime. (君たちのPythonの旅の幸運を祈っているよ。それはきっと価値のある時間となるはずだよ。)
Contents
• Pythonでデータ分析しよう! • Ex. 1: アンケート集計 • Ex. 2: ウェブ上のデータ処理
16

第1回勉強会アンケート
Ques%on Answer
Q1. 発表は参考になりましたか? 「Pythonでプログラムを書こう!」 (辻) Yes/No
Q2. 発表は参考になりましたか? 「私はPython独学奮闘記」 (阿久津) Yes/No
Q3. 発表は参考になりましたか? 「データサイエンスとデータエンジニア」 (草薙) Yes/No
Q4. 次回の勉強会に参加しますか? Yes/No
17
アンケート結果を集計しよう!

アンケート結果:spc_01.csv
18
Guest_ID Q1 Q2 Q3 Q4 1 Yes Yes Yes Yes 2 Yes Yes Yes Yes 3 Yes Yes Yes Yes 4 Yes Yes Yes Yes 5 Yes Yes Yes 6 Yes Yes Yes Yes 7 Yes Yes Yes Yes 8 Yes Yes Yes Yes 9 No Yes Yes Yes
10 Yes Yes Yes Yes 11 Yes Yes Yes Yes 12 Yes Yes Yes Yes 13 Yes Yes Yes Yes 14 Yes Yes Yes Yes 15 Yes Yes Yes Yes

アンケート結果:spc_01.csv
19
Guest_ID Q1 Q2 Q3 Q4 1 Yes Yes Yes Yes 2 Yes Yes Yes Yes 3 Yes Yes Yes Yes 4 Yes Yes Yes Yes 5 Yes Yes Yes 6 Yes Yes Yes Yes 7 Yes Yes Yes Yes 8 Yes Yes Yes Yes 9 No Yes Yes Yes
10 Yes Yes Yes Yes 11 Yes Yes Yes Yes 12 Yes Yes Yes Yes 13 Yes Yes Yes Yes 14 Yes Yes Yes Yes 15 Yes Yes Yes Yes

(1) Excelで集計
1. Excel関数を使ってデータ処理 2. グラフ機能を使って結果表示
20

データ処理
21
A B C D E F
1 Guest_ID Connpass_ID Q1 Q2 Q3 Q4
2 1 *** Yes Yes Yes Yes
3 2 *** Yes Yes Yes Yes
4 3 *** Yes Yes Yes Yes
… … … … … ...
14 13 *** Yes Yes Yes Yes
15 14 Yes Yes Yes Yes
16 15 *** Yes Yes Yes Yes 17
Count Yes 14 15 15 14
18 No 1 0 0 0 19 Total 15 15 15 14 20
Percent Yes 93% 100% 100% 100%
21 No 7% 0% 0% 0%

データ処理
22
A B C D E F
1 Guest_ID Connpass_ID Q1 Q2 Q3 Q4
2 1 *** Yes Yes Yes Yes
3 2 *** Yes Yes Yes Yes
4 3 *** Yes Yes Yes Yes
… … … … … ...
14 13 *** Yes Yes Yes Yes
15 14 Yes Yes Yes Yes
16 15 *** Yes Yes Yes Yes 17
Count Yes 14 15 15 14
18 No 1 0 0 0 19 Total 15 15 15 14 20
Percent Yes 93% 100% 100% 100%
21 No 7% 0% 0% 0%
#Yesのカウント =counif(C$2:C$16,
“Yes”)
#割合の計算 =C17/C19

グラフ
23
Q1�
Yes$
No$
Q2�
Yes$
No$
Q3�
Yes$
No$
Q4�
Yes$
No$

(2) Pythonで集計
24
1. データ読み込み
2. Yes/Noカウント
3. パーセント計算
4. グラフ表示
#1. read the csv file
#2. count the numbers of Yes/No
#3. calculate the rate
#4. draw the graph
フローチャート 擬似コード

まずはQ1のみ処理
25

グラフ: Q1
26

Q1〜Q4の一括処理
27

グラフQ1〜Q4
28

Example 1. for文構造
29

Example 2. apply
30
データ処理を 関数にまとめる
Apply

Example 3. map
31
データ処理を 関数にまとめる
Map

Contents
• Pythonでデータ分析しよう! • Ex. 1: アンケート集計 • Ex. 2: ウェブ上のデータ処理
32
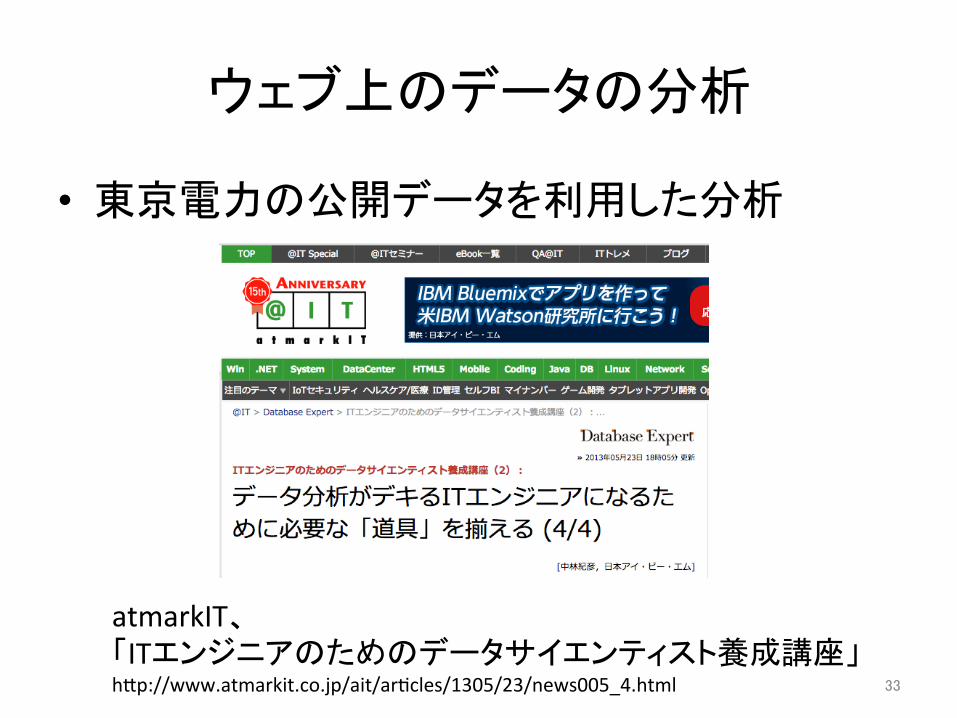
ウェブ上のデータの分析
• 東京電力の公開データを利用した分析
33
atmarkIT、 「ITエンジニアのためのデータサイエンティスト養成講座」 h=p://www.atmarkit.co.jp/ait/aricles/1305/23/news005_4.html

東京電力のオープンデータ
34
でんき予報 h=p://www.tepco.co.jp/forecast/index-‐j.html
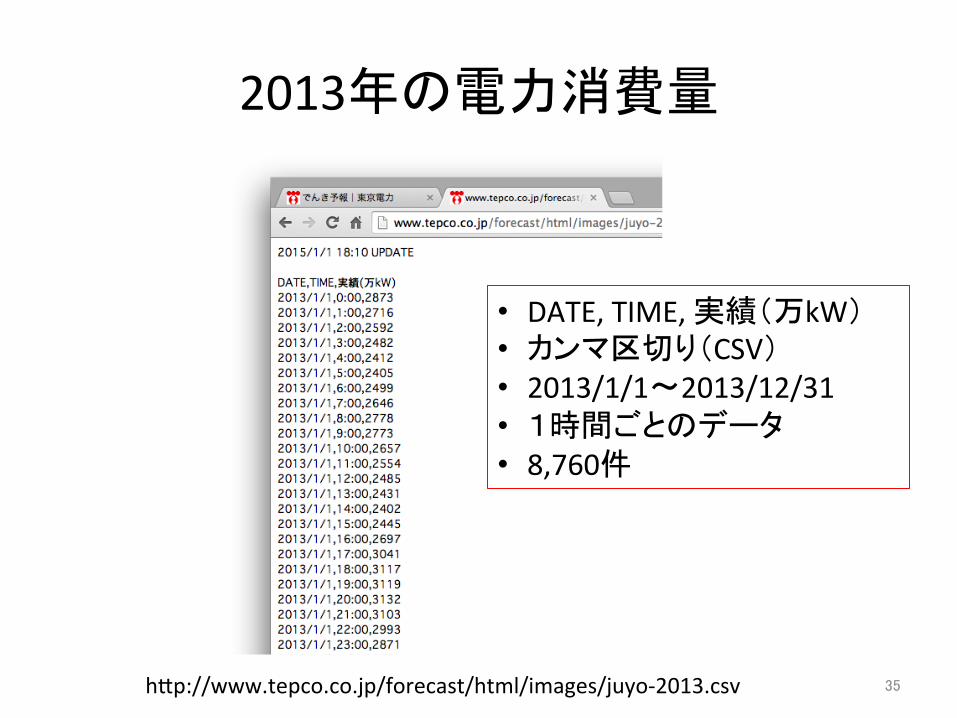
2013年の電力消費量
35 h=p://www.tepco.co.jp/forecast/html/images/juyo-‐2013.csv
• DATE, TIME, 実績(万kW) • カンマ区切り(CSV) • 2013/1/1〜2013/12/31 • 1時間ごとのデータ • 8,760件

tepco.py
36
コード

tepco.py
37
グラフ

Excel vs Python
Excel Python
Pros • 簡単なデータ集計には強い武器。
• データ量が多くなるほど、有利。
• 豊富な機能
Cons • データ数、ファイル数が多くなると不利。
• 自動化が困難。
• コードがわからないとNG
• コード習得が課題
38

まとめ
• Pythonによるデータ分析 – 自動化 – 高度な分析(機械学習、クラスタリングなど) – ウェブ上のデータ分析
• ExcelとPythonの簡単な比較 – ExcelはGUI操作が簡単、VBAで自動化は面倒 – Pythonは自動化に適、プログラム学習が課題
39
![Ответы для варианта ЕГЭ 2021 №200921 по химии 11 класс › wp-content › uploads › 2020 › ...n(S02 = 9,6 / 64 = 0, 15 MOJIb n(S02 [2] = n(S02](https://img.pdfslide.tips/doc/110x75/60d337b6dda29e4a9b580385/-2021-a200921-11-.jpg)