Embed Size (px)
Citation preview
Sampo Group Debt Investor PresentationPrepared February 10, 2016Figures December 31, 2015
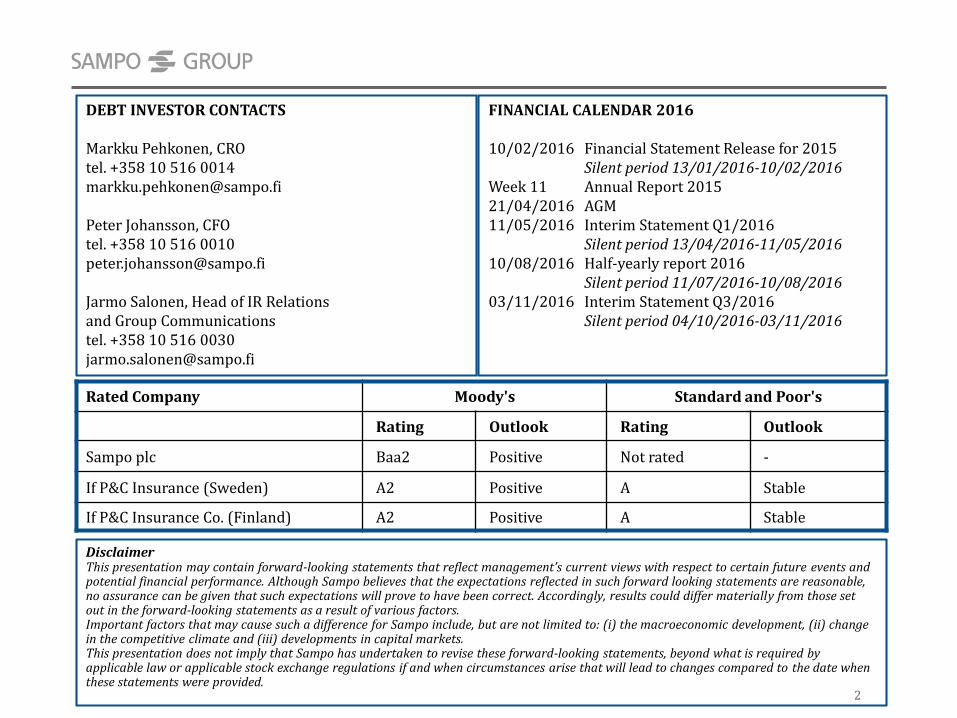
DEBT INVESTOR CONTACTS
Markku Pehkonen, CROtel. +358 10 516 [email protected]
Peter Johansson, CFOtel. +358 10 516 [email protected]
Jarmo Salonen, Head of IR Relations and Group Communicationstel. +358 10 516 [email protected]
FINANCIAL CALENDAR 2016
10/02/2016 Financial Statement Release for 2015Silent period 13/01/2016-10/02/2016
Week 11 Annual Report 201521/04/2016 AGM11/05/2016 Interim Statement Q1/2016
Silent period 13/04/2016-11/05/201610/08/2016 Half-yearly report 2016
Silent period 11/07/2016-10/08/201603/11/2016 Interim Statement Q3/2016
Silent period 04/10/2016-03/11/2016
Rated Company Moody's Standard and Poor's
Rating Outlook Rating Outlook
Sampo plc Baa2 Positive Not rated -
If P&C Insurance (Sweden) A2 Positive A Stable
If P&C Insurance Co. (Finland) A2 Positive A Stable
DisclaimerThis presentation may contain forward-looking statements that reflect management’s current views with respect to certain future events and potential financial performance. Although Sampo believes that the expectations reflected in such forward looking statements are reasonable, no assurance can be given that such expectations will prove to have been correct. Accordingly, results could differ materially from those set out in the forward-looking statements as a result of various factors.Important factors that may cause such a difference for Sampo include, but are not limited to: (i) the macroeconomic development, (ii) change in the competitive climate and (iii) developments in capital markets.This presentation does not imply that Sampo has undertaken to revise these forward-looking statements, beyond what is required by applicable law or applicable stock exchange regulations if and when circumstances arise that will lead to changes compared to the date when these statements were provided.
2
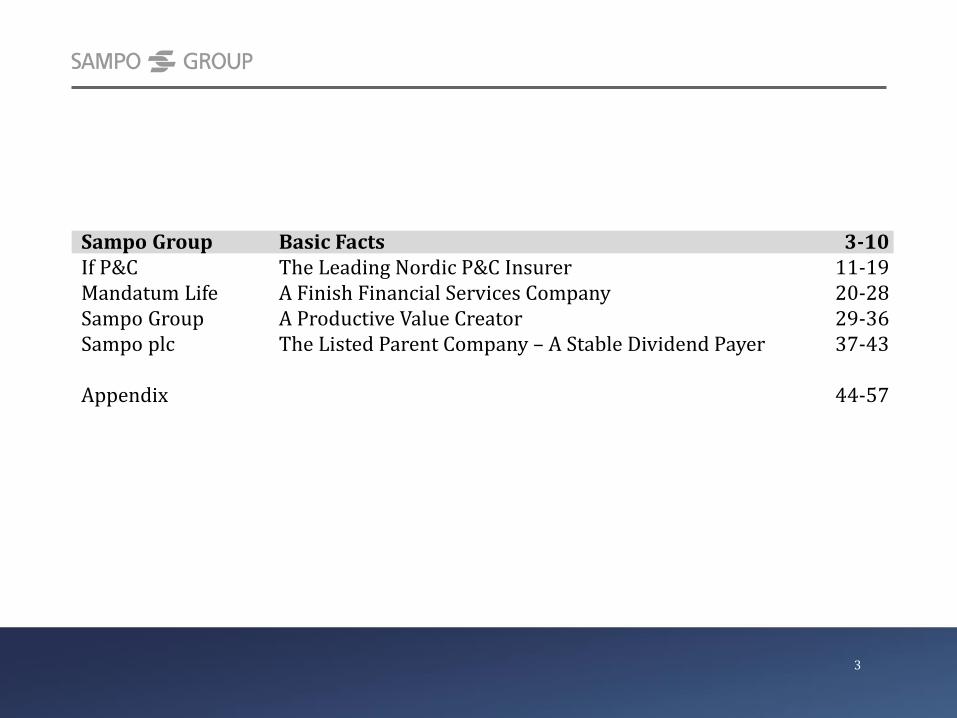
Sampo Group Basic Facts 3-10If P&C The Leading Nordic P&C Insurer 11-19Mandatum Life A Finish Financial Services Company 20-28Sampo Group A Productive Value Creator 29-36Sampo plc The Listed Parent Company – A Stable Dividend Payer 37-43
Appendix 44-57
3
37.5
25.0
24.8
21.9
21.6
18.0
14.0
7.3
5.1
4.3
2.5
1.7
1.1
0.7
0.5
0 10 20 30 40
Nordea
Danske
Sampo
Swedbank
SHB
DnB
Investor
Gjensidige
Tryg
Industrivärden
Topdanmark
Storebrand
Alm.Brand
Protector
Aktia
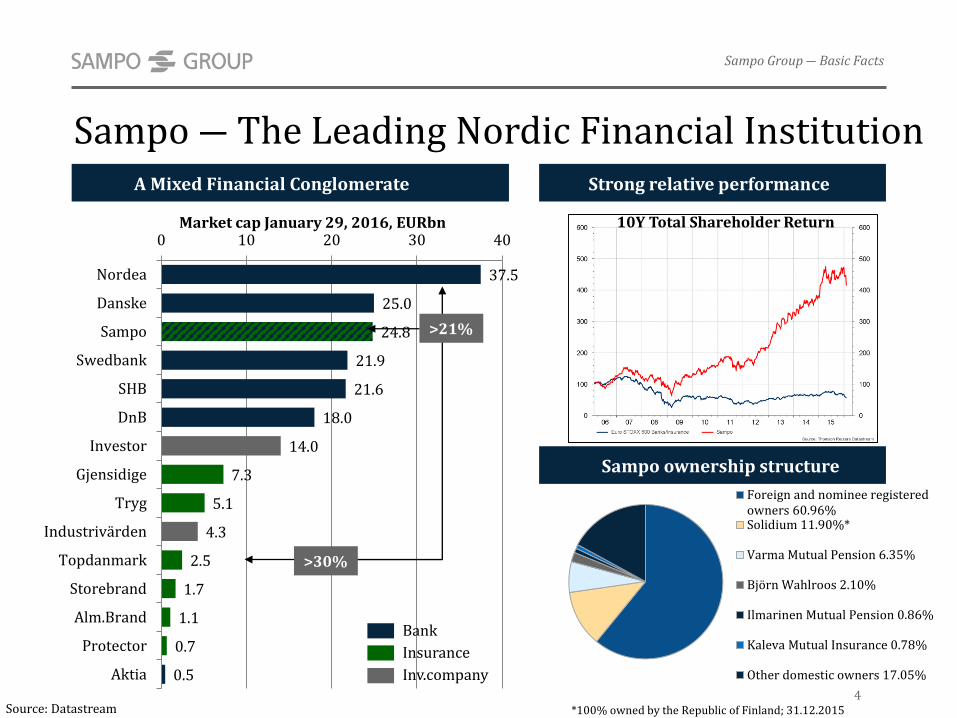
Sampo ― The Leading Nordic Financial Institution
Source: Datastream
>30%
>21%
Sampo ownership structure
*100% owned by the Republic of Finland; 31.12.2015
Market cap January 29, 2016, EURbn
Strong relative performance
4
Sampo Group ― Basic Facts
10Y Total Shareholder Return
A Mixed Financial Conglomerate
Bank
Insurance
Inv.company
Foreign and nominee registeredowners 60.96%Solidium 11.90%*
Varma Mutual Pension 6.35%
Björn Wahlroos 2.10%
Ilmarinen Mutual Pension 0.86%
Kaleva Mutual Insurance 0.78%
Other domestic owners 17.05%
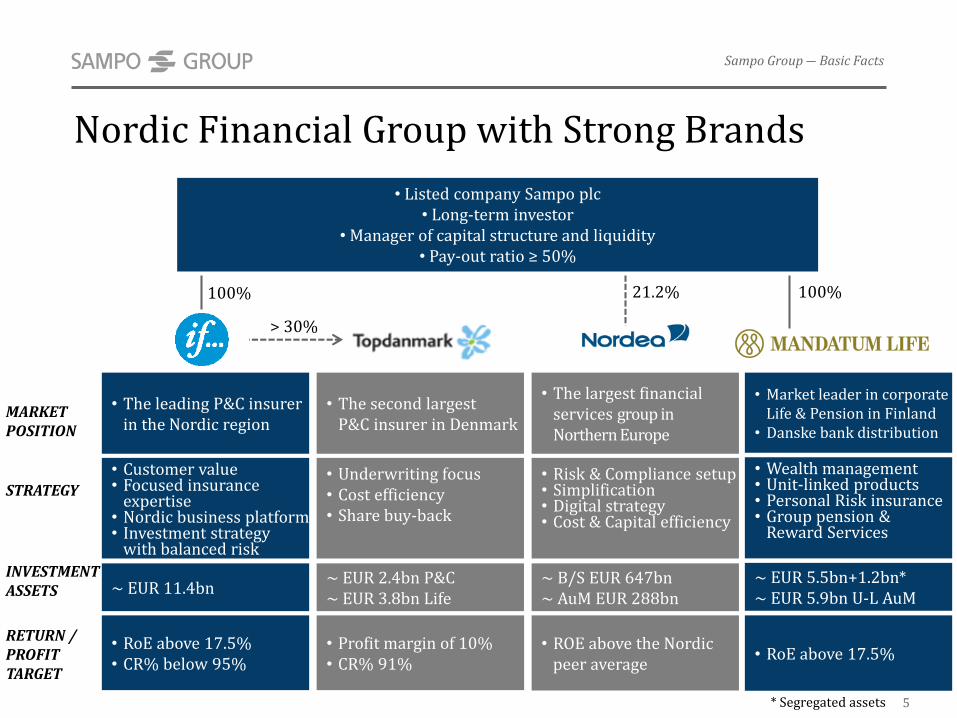
• Listed company Sampo plc• Long-term investor
• Manager of capital structure and liquidity• Pay-out ratio ≥ 50%
Nordic Financial Group with Strong Brands
Sampo Group ― Basic Facts
5
MARKET POSITION
STRATEGY
INVESTMENT ASSETS
RETURN /PROFITTARGET
21.2%
• The leading P&C insurerin the Nordic region
• Customer value• Focused insurance
expertise• Nordic business platform• Investment strategy
with balanced risk
~ EUR 11.4bn
• RoE above 17.5%• CR% below 95%
> 30%
100%
• The largest financialservices group inNorthern Europe
• Risk & Compliance setup• Simplification • Digital strategy• Cost & Capital efficiency
~ B/S EUR 647bn~ AuM EUR 288bn
• ROE above the Nordicpeer average
• The second largest P&C insurer in Denmark
• Underwriting focus• Cost efficiency• Share buy-back
~ EUR 2.4bn P&C~ EUR 3.8bn Life
• Profit margin of 10%• CR% 91%
• Wealth management• Unit-linked products• Personal Risk insurance • Group pension &
Reward Services
• Market leader in corporateLife & Pension in Finland
• Danske bank distribution
~ EUR 5.5bn+1.2bn*~ EUR 5.9bn U-L AuM
• RoE above 17.5%
* Segregated assets
100%
Sampo Group Steering Model and Principles• Non-complex structures and only minor contagion risks
– three separate and independent business areas
– straightforward and transparent legal structure combined with limited intragroup exposures
• General Principles of Business activities
– clear responsibilities
– simple and flat operational structures
• Parent company gives guidance to the subsidiaries by setting
– targets for capitalization and ROE
– group principles for Risk Management, Remuneration, Compliance, Code of Conduct
• Subsidiaries organize underwriting activities independently taking into account
– the specific characteristics of their operations
– the above guidance from parent company
– the stakeholders’ expectations and external regulation6
Sampo Group ― Basic Facts
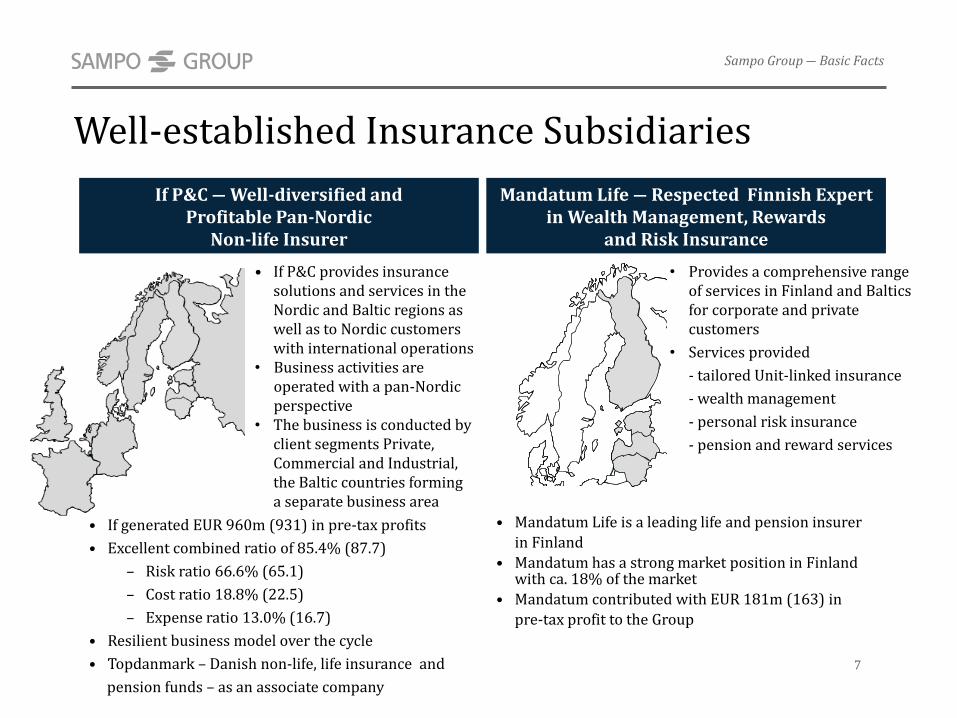
• If generated EUR 960m (931) in pre-tax profits
• Excellent combined ratio of 85.4% (87.7)
– Risk ratio 66.6% (65.1)
– Cost ratio 18.8% (22.5)
– Expense ratio 13.0% (16.7)
• Resilient business model over the cycle
• Topdanmark – Danish non-life, life insurance and
pension funds – as an associate company
If P&C ― Well-diversified and Profitable Pan-Nordic
Non-life Insurer
• If P&C provides insurance solutions and services in the Nordic and Baltic regions as well as to Nordic customers with international operations
• Business activities are operated with a pan-Nordic perspective
• The business is conducted by client segments Private, Commercial and Industrial, the Baltic countries forming a separate business area
Well-established Insurance Subsidiaries
• Mandatum Life is a leading life and pension insurer
in Finland
• Mandatum has a strong market position in Finland with ca. 18% of the market
• Mandatum contributed with EUR 181m (163) in
pre-tax profit to the Group
Mandatum Life ― Respected Finnish Expert in Wealth Management, Rewards
and Risk Insurance
• Provides a comprehensive rangeof services in Finland and Balticsfor corporate and privatecustomers
• Services provided
- tailored Unit-linked insurance
- wealth management
- personal risk insurance
- pension and reward services
Sampo Group ― Basic Facts
7
Sampo Group ― Basic Facts
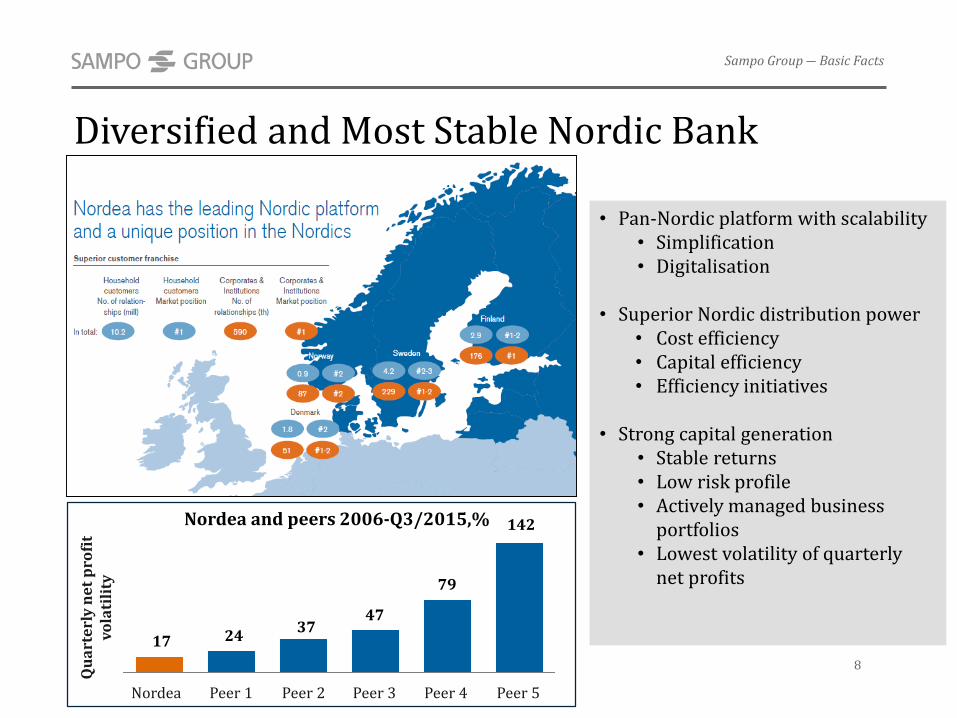
Diversified and Most Stable Nordic Bank
• Pan-Nordic platform with scalability• Simplification• Digitalisation
• Superior Nordic distribution power• Cost efficiency• Capital efficiency• Efficiency initiatives
• Strong capital generation• Stable returns• Low risk profile• Actively managed business
portfolios• Lowest volatility of quarterly
net profits
17 24 37
47
79
142
Nordea Peer 4Peer 3Peer 1 Peer 5Peer 2
Qu
art
erl
y n
et
pro
fit
vola
tili
ty
Nordea and peers 2006-Q3/2015,%
8
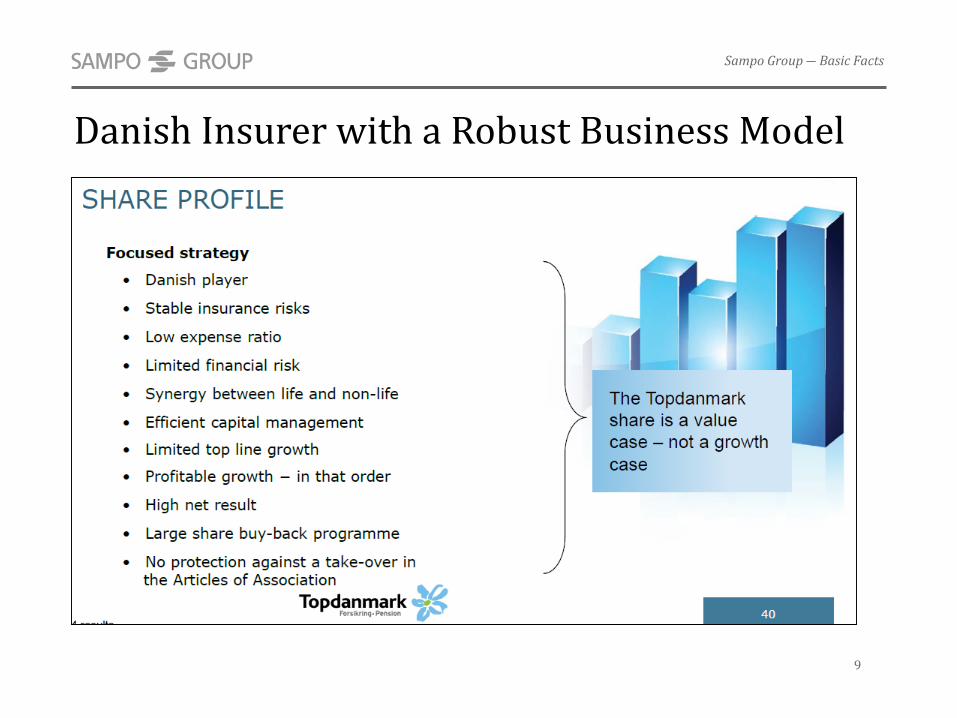
Danish Insurer with a Robust Business Model
9
Sampo Group ― Basic Facts
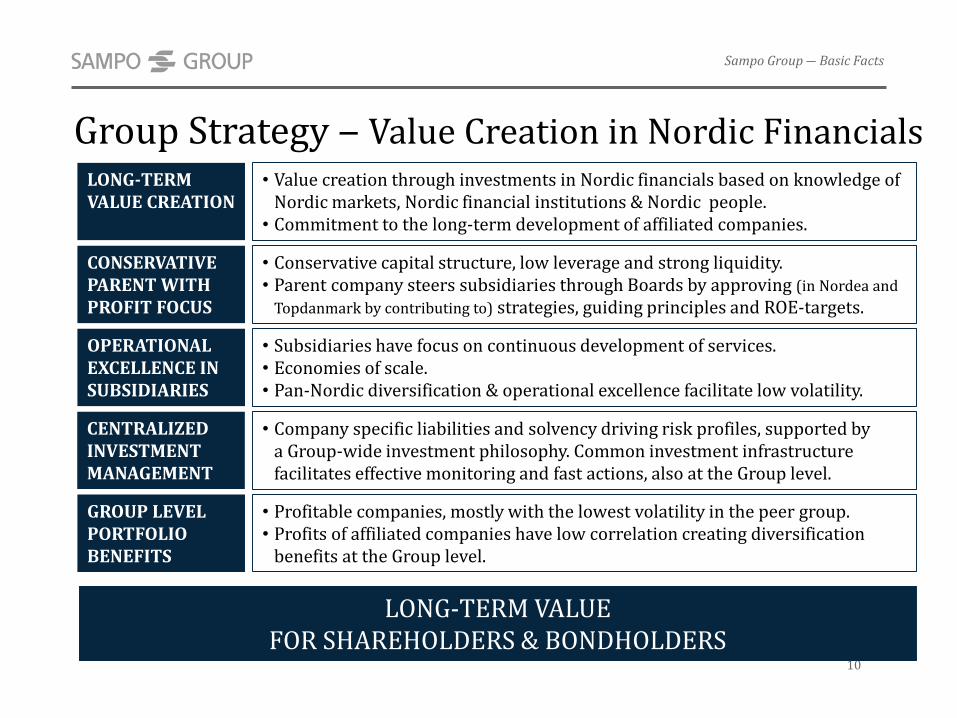
Group Strategy ‒ Value Creation in Nordic Financials
10
Sampo Group ― Basic Facts
LONG-TERM VALUE CREATION
• Value creation through investments in Nordic financials based on knowledge of Nordic markets, Nordic financial institutions & Nordic people.
• Commitment to the long-term development of affiliated companies.
OPERATIONAL EXCELLENCE IN SUBSIDIARIES
• Subsidiaries have focus on continuous development of services.• Economies of scale.• Pan-Nordic diversification & operational excellence facilitate low volatility.
CONSERVATIVE PARENT WITH PROFIT FOCUS
• Conservative capital structure, low leverage and strong liquidity.• Parent company steers subsidiaries through Boards by approving (in Nordea and
Topdanmark by contributing to) strategies, guiding principles and ROE-targets.
GROUP LEVEL PORTFOLIO BENEFITS
• Profitable companies, mostly with the lowest volatility in the peer group.• Profits of affiliated companies have low correlation creating diversification
benefits at the Group level.
LONG-TERM VALUE FOR SHAREHOLDERS & BONDHOLDERS
CENTRALIZEDINVESTMENT MANAGEMENT
• Company specific liabilities and solvency driving risk profiles, supported bya Group-wide investment philosophy. Common investment infrastructure facilitates effective monitoring and fast actions, also at the Group level.
11
Sampo Group Basic Facts 3-10If P&C The Leading Nordic P&C Insurer 11-19Mandatum Life A Finnish Financial Services Company 20-28Sampo Group A Productive Value Creator 29-36Sampo plc The Listed Parent Company – A Stable Dividend Payer 37-43
Appendix 44-57
Expense Ratios 2014, %
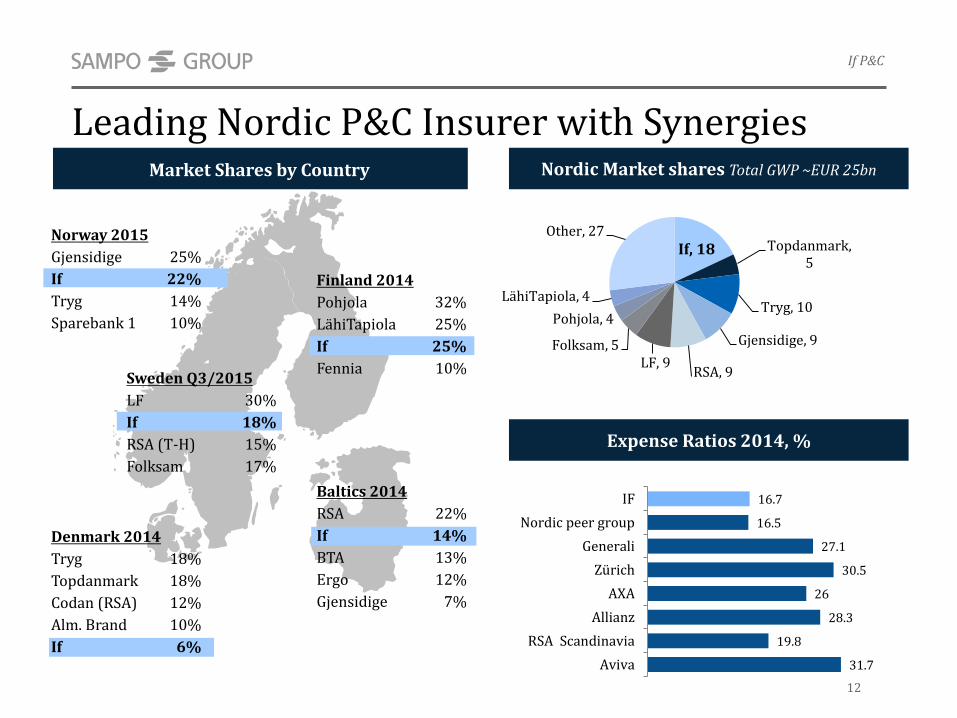
Leading Nordic P&C Insurer with Synergies
Norway 2015
Gjensidige 25%
If 22%
Tryg 14%
Sparebank 1 10%
Denmark 2014
Tryg 18%
Topdanmark 18%
Codan (RSA) 12%
Alm. Brand 10%
If 6%
Finland 2014
Pohjola 32%
LähiTapiola 25%
If 25%
Fennia 10%Sweden Q3/2015
LF 30%
If 18%
RSA (T-H) 15%
Folksam 17%
Baltics 2014
RSA 22%
If 14%
BTA 13%
Ergo 12%
Gjensidige 7%
Market Shares by Country
If, 18 Topdanmark, 5
Tryg, 10
Gjensidige, 9
RSA, 9LF, 9
Folksam, 5
Pohjola, 4
LähiTapiola, 4
Other, 27
16.7
16.5
27.1
30.5
26
28.3
19.8
31.7
IF
Nordic peer group
Generali
Zürich
AXA
Allianz
RSA Scandinavia
Aviva
If P&C
12
Nordic Market shares Total GWP ~EUR 25bn
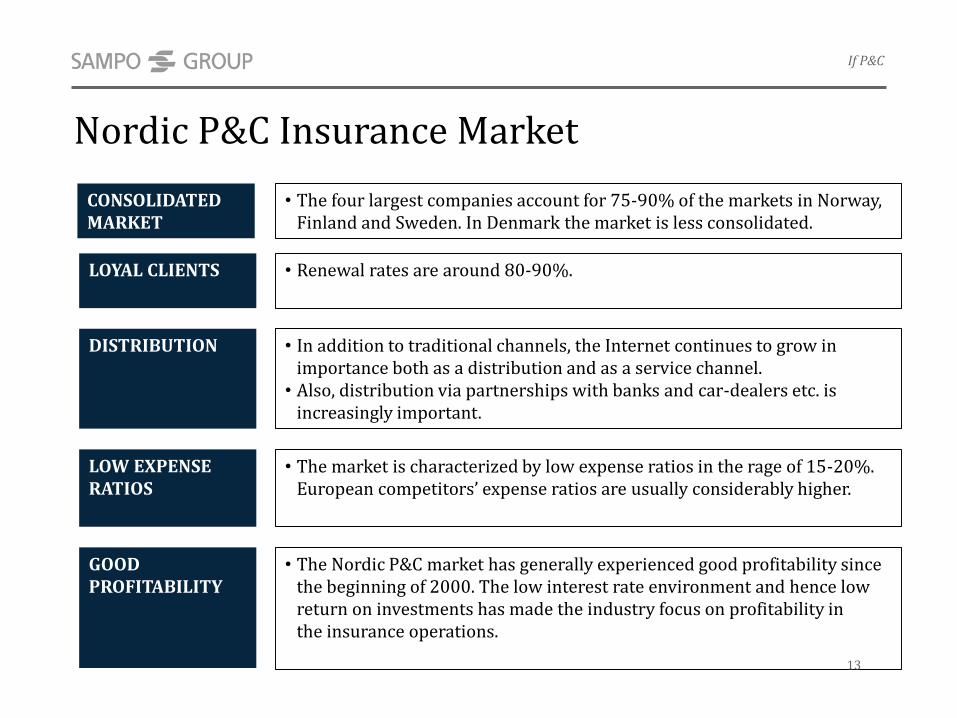
Nordic P&C Insurance Market
CONSOLIDATED MARKET
LOW EXPENSE RATIOS
• In addition to traditional channels, the Internet continues to grow in importance both as a distribution and as a service channel.
• Also, distribution via partnerships with banks and car-dealers etc. is increasingly important.
GOOD PROFITABILITY
• The Nordic P&C market has generally experienced good profitability since the beginning of 2000. The low interest rate environment and hence low return on investments has made the industry focus on profitability in the insurance operations.
• Renewal rates are around 80-90%.LOYAL CLIENTS
DISTRIBUTION
• The market is characterized by low expense ratios in the rage of 15-20%. European competitorsʼ expense ratios are usually considerably higher.
• The four largest companies account for 75-90% of the markets in Norway, Finland and Sweden. In Denmark the market is less consolidated.
13
If P&C
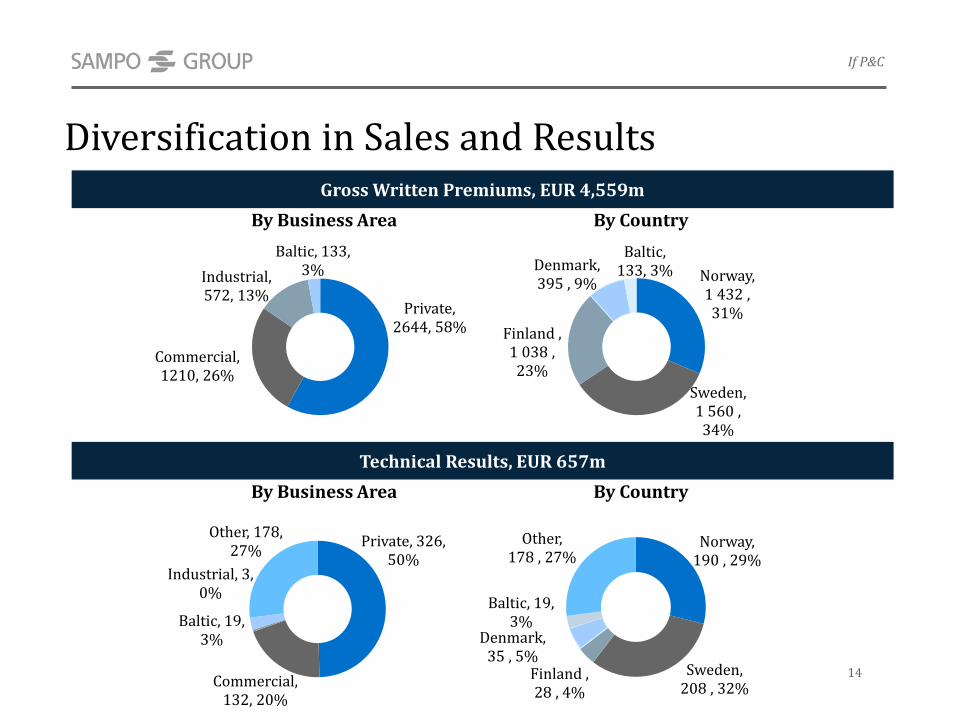
By Business Area By Country
Private, 326, 50%
Commercial, 132, 20%
Industrial, 3, 0%
Baltic, 19, 3%
Other, 178, 27%
Technical Results, EUR 657m
Norway, 190 , 29%
Sweden, 208 , 32%
Finland , 28 , 4%
Denmark, 35 , 5%
Baltic, 19, 3%
Other, 178 , 27%
Gross Written Premiums, EUR 4,559m
By Business Area By Country
Private, 2644, 58%
Commercial, 1210, 26%
Industrial, 572, 13%
Baltic, 133, 3% Norway,
1 432 , 31%
Sweden, 1 560 , 34%
Finland , 1 038 , 23%
Denmark, 395 , 9%
Baltic, 133, 3%
If P&C
14
Diversification in Sales and Results
If- Total If Sweden If Norway
If Finland If Denmark
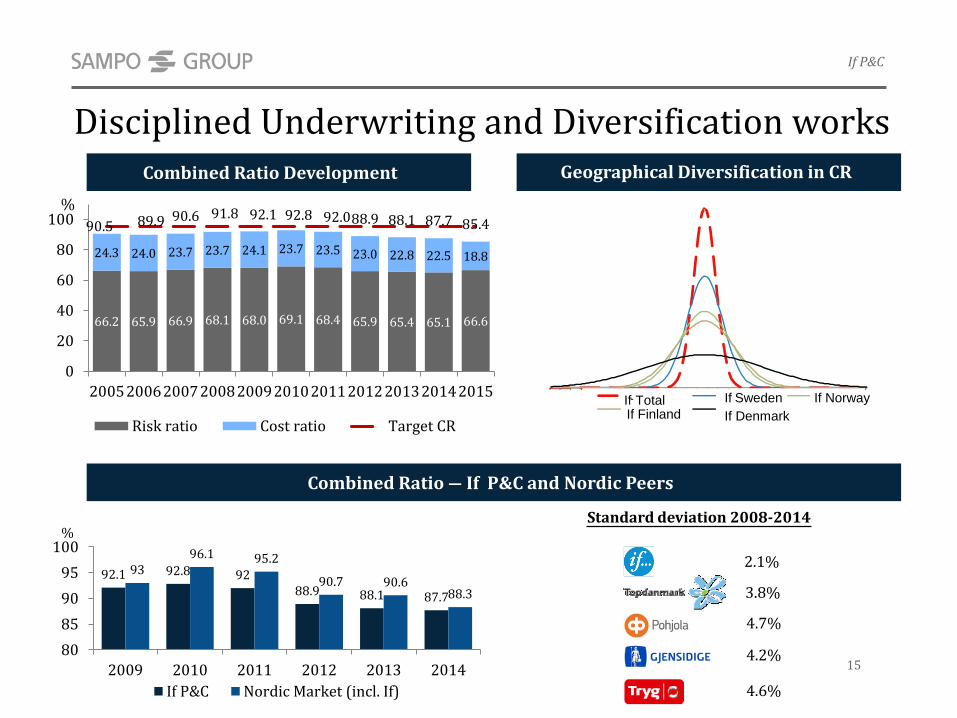
Geographical Diversification in CR
Combined Ratio ― If P&C and Nordic Peers
Combined Ratio Development
Standard deviation 2008-2014
2.1%
4.6%
4.2%
4.7%
3.8%
66.2 65.9 66.9 68.1 68.0 69.1 68.4 65.9 65.4 65.1 66.6
24.3 24.0 23.7 23.7 24.1 23.7 23.5 23.0 22.8 22.5 18.8
90.5 89.9 90.6 91.8 92.1 92.8 92.088.9 88.1 87.7 85.4
0
20
40
60
80
100
20052006200720082009201020112012201320142015
%
Risk ratio Cost ratio Target CR
15
If P&C
92.1 92.8 9288.9 88.1 87.7
9396.1 95.2
90.7 90.688.3
80
85
90
95
100
2009 2010 2011 2012 2013 2014
%
If P&C Nordic Market (incl. If)
Disciplined Underwriting and Diversification works
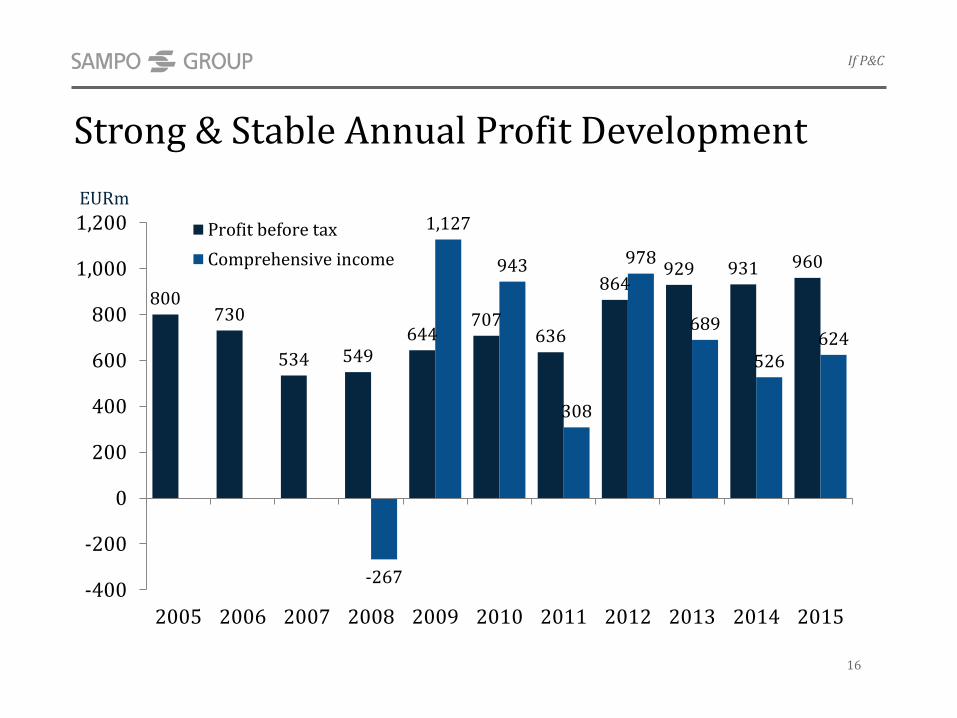
Strong & Stable Annual Profit Development
800730
534 549644
707636
864929 931 960
-267
1,127
943
308
978
689
526624
-400
-200
0
200
400
600
800
1,000
1,200
2005 2006 2007 2008 2009 2010 2011 2012 2013 2014 2015
Profit before tax
Comprehensive income
EURm
16
If P&C
0
50
100
150
200
250
300
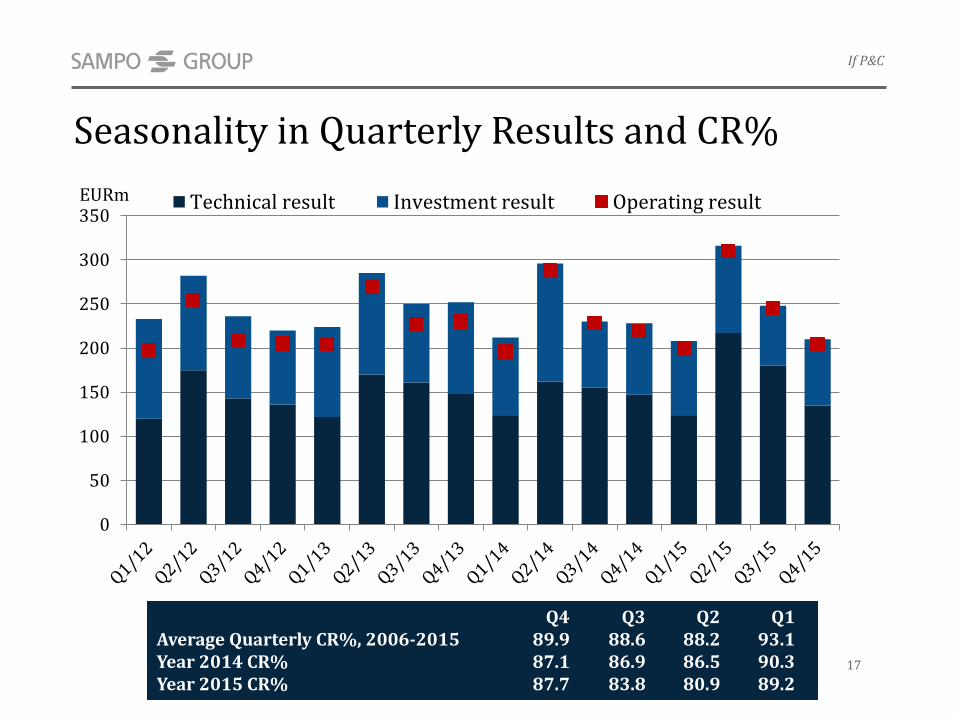
350Technical result Investment result Operating result
Seasonality in Quarterly Results and CR%
Q4 Q3 Q2 Q1Average Quarterly CR%, 2006-2015 89.9 88.6 88.2 93.1Year 2014 CR% 87.1 86.9 86.5 90.3Year 2015 CR% 87.7 83.8 80.9 89.2
If P&C
17
EURm
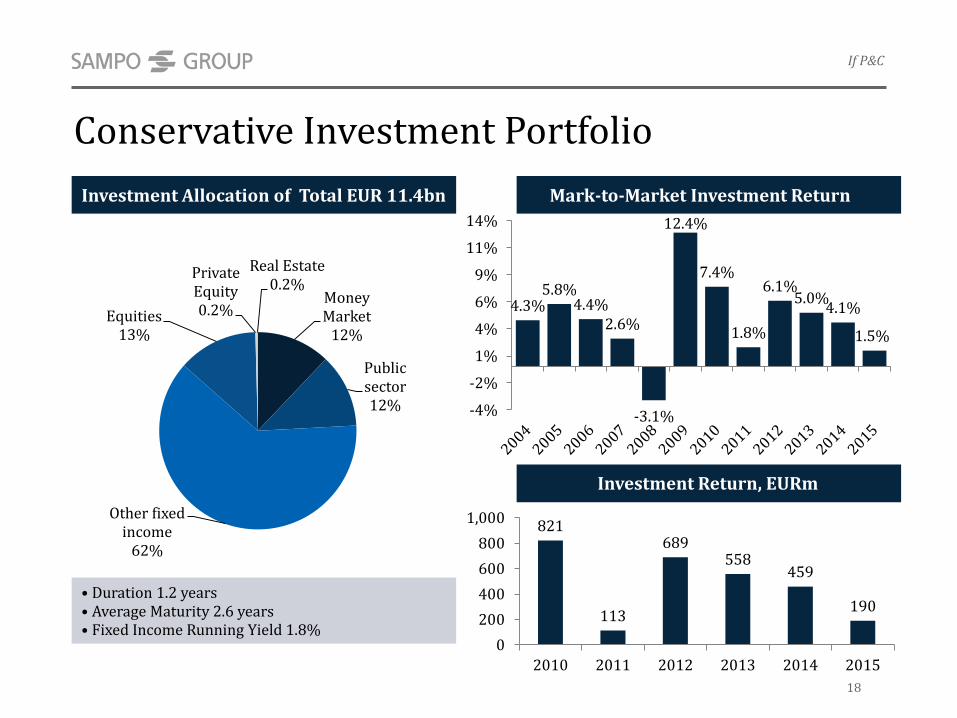
Conservative Investment Portfolio
• Duration 1.2 years• Average Maturity 2.6 years• Fixed Income Running Yield 1.8%
Mark-to-Market Investment ReturnInvestment Allocation of Total EUR 11.4bn
4.3%5.8%
4.4%2.6%
-3.1%
12.4%
7.4%
1.8%
6.1%5.0%
4.1%
1.5%
-4%
-2%
1%
4%
6%
9%
11%
14%
Money Market
12%
Public sector12%
Other fixed income
62%
Equities13%
Private Equity0.2%
Real Estate0.2%
18
If P&C
821
113
689558
459
190
0
200
400
600
800
1,000
2010 2011 2012 2013 2014 2015
Investment Return, EURm
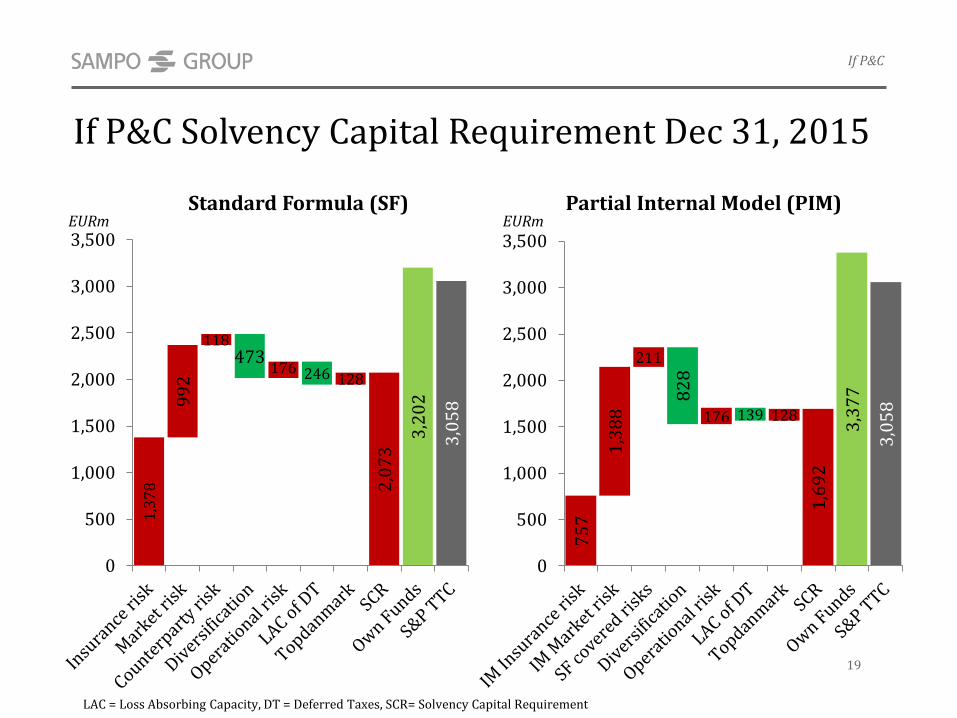
75
7
1,3
88
211
82
8
176 139 128
1,6
92
3,3
77
3,0
58
0
500
1,000
1,500
2,000
2,500
3,000
3,500
Partial Internal Model (PIM)EURm
If P&C
19
If P&C Solvency Capital Requirement Dec 31, 20151
,37
8
99
2
118473
176 246 1282
,07
3
3,2
02
3,0
58
0
500
1,000
1,500
2,000
2,500
3,000
3,500
Standard Formula (SF)
LAC = Loss Absorbing Capacity, DT = Deferred Taxes, SCR= Solvency Capital Requirement
EURm
20
Sampo Group Basic Facts 3-10If P&C The Leading Nordic P&C Insurer 11-19Mandatum Life A Finnish Financial Services Company 20-28Sampo Group A Productive Value Creator 29-36Sampo plc The Listed Parent Company – A Stable Dividend Payer 37-43
Appendix 44-57
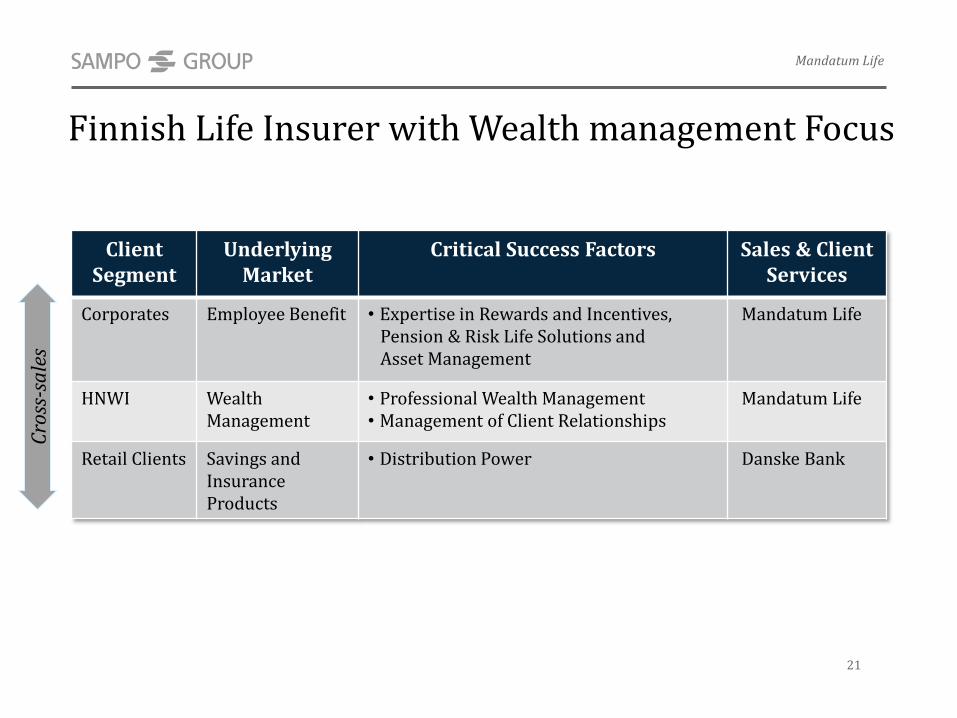
Finnish Life Insurer with Wealth management Focus
ClientSegment
UnderlyingMarket
Critical Success Factors Sales & ClientServices
Corporates Employee Benefit • Expertise in Rewards and Incentives, Pension & Risk Life Solutions and Asset Management
Mandatum Life
HNWI WealthManagement
• Professional Wealth Management• Management of Client Relationships
Mandatum Life
Retail Clients Savings and Insurance Products
• Distribution Power Danske Bank
Mandatum Life
21
Cro
ss-s
ale
s
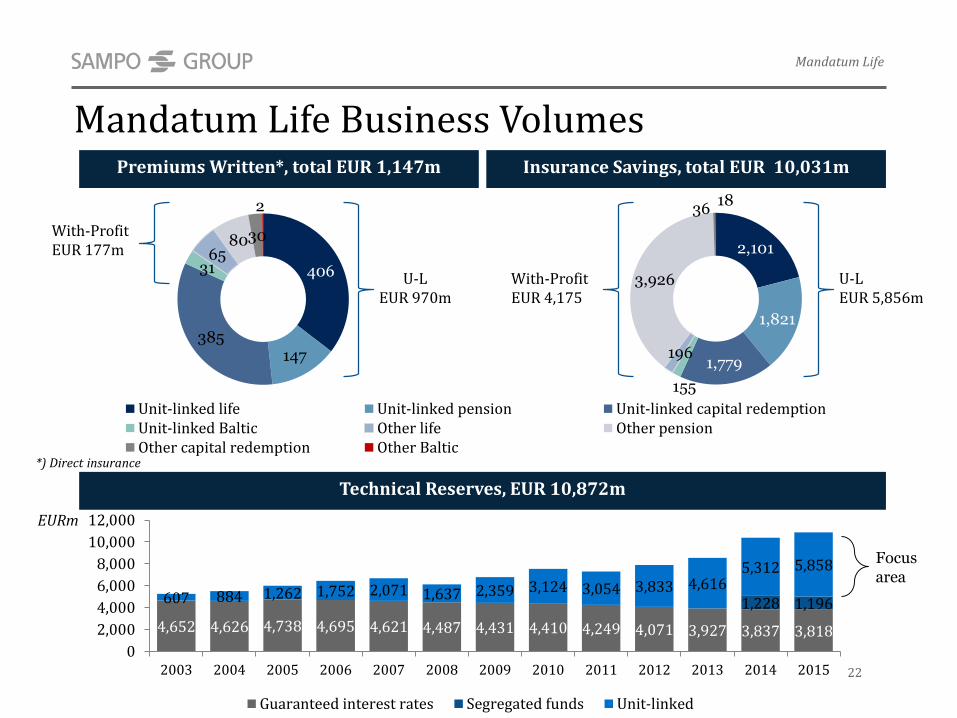
Premiums Written*, total EUR 1,147m Insurance Savings, total EUR 10,031m
*) Direct insurance
406
147385
3165
8030
2
Unit-linked life Unit-linked pension Unit-linked capital redemptionUnit-linked Baltic Other life Other pensionOther capital redemption Other Baltic
2,101
1,821
1,779
155
196
3,926
3618
Mandatum Life Business Volumes
U-LEUR 5,856m
With-ProfitEUR 4,175
U-L EUR 970m
With-ProfitEUR 177m
Focus area
4,652 4,626 4,738 4,695 4,621 4,487 4,431 4,410 4,249 4,071 3,927 3,837 3,818
1,228 1,196607 884 1,262 1,752 2,071 1,637 2,359 3,124 3,054 3,833 4,6165,312 5,858
0
2,000
4,000
6,000
8,000
10,000
12,000
2003 2004 2005 2006 2007 2008 2009 2010 2011 2012 2013 2014 2015
Guaranteed interest rates Segregated funds Unit-linked
Technical Reserves, EUR 10,872m
EURm
Mandatum Life
22
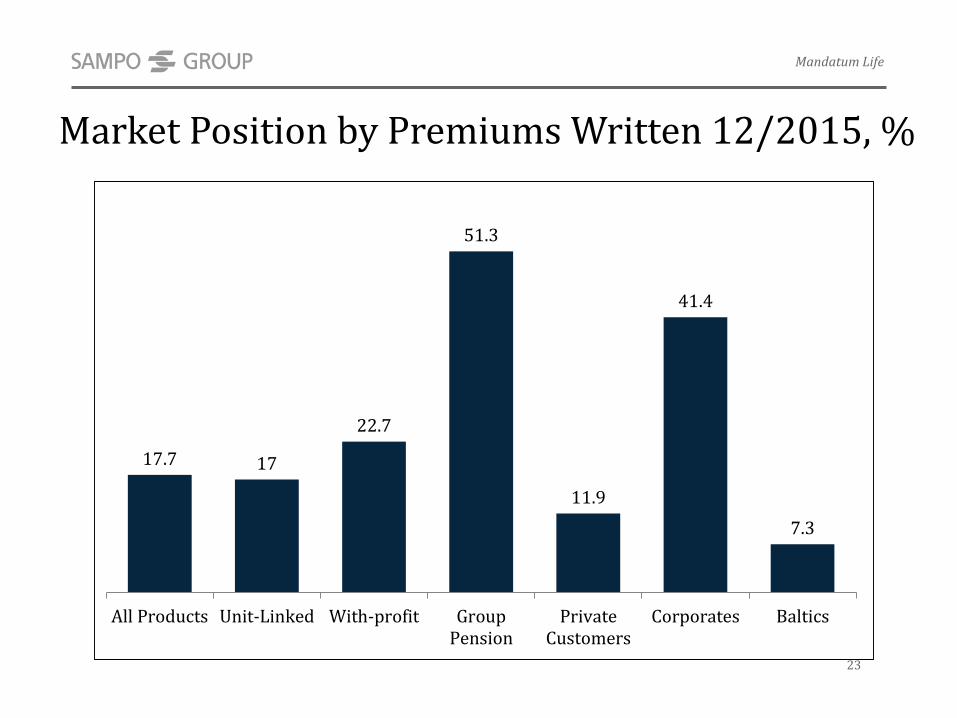
Market Position by Premiums Written 12/2015, %
Market Shares in Finland
Mandatum Life
23
17.7 17
22.7
51.3
11.9
41.4
7.3
All Products Unit-Linked With-profit GroupPension
PrivateCustomers
Corporates Baltics
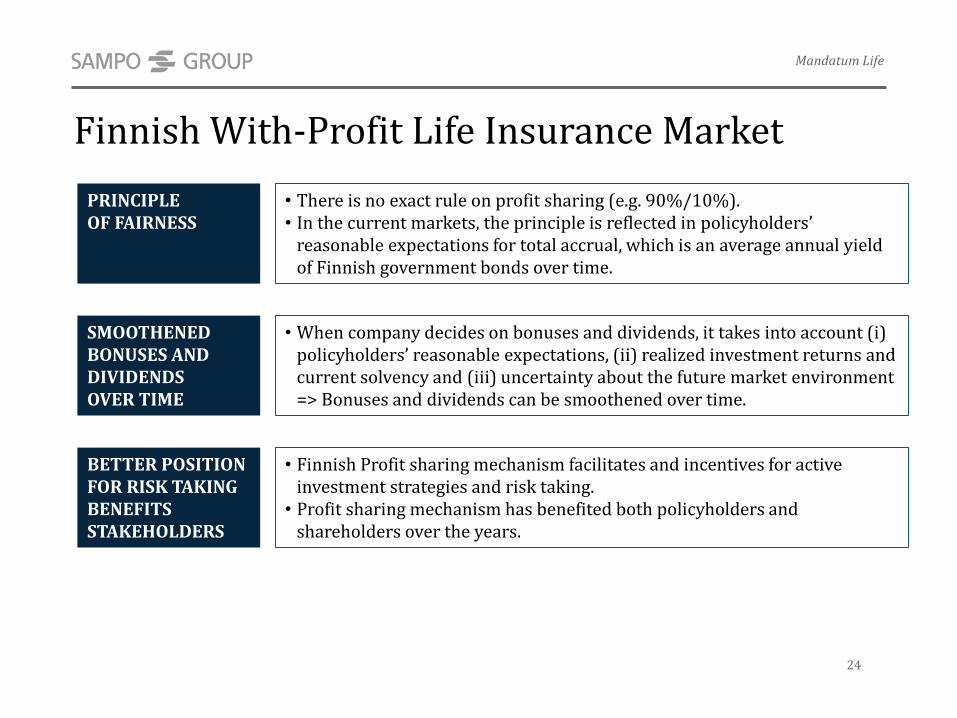
Finnish With-Profit Life Insurance Market
PRINCIPLE OF FAIRNESS
• There is no exact rule on profit sharing (e.g. 90%/10%). • In the current markets, the principle is reflected in policyholdersʼ
reasonable expectations for total accrual, which is an average annual yield of Finnish government bonds over time.
SMOOTHENED BONUSES AND DIVIDENDS OVER TIME
• When company decides on bonuses and dividends, it takes into account (i) policyholdersʼ reasonable expectations, (ii) realized investment returns and current solvency and (iii) uncertainty about the future market environment => Bonuses and dividends can be smoothened over time.
BETTER POSITION FOR RISK TAKING BENEFITS STAKEHOLDERS
• Finnish Profit sharing mechanism facilitates and incentives for active investment strategies and risk taking.
• Profit sharing mechanism has benefited both policyholders and shareholders over the years.
Mandatum Life
24
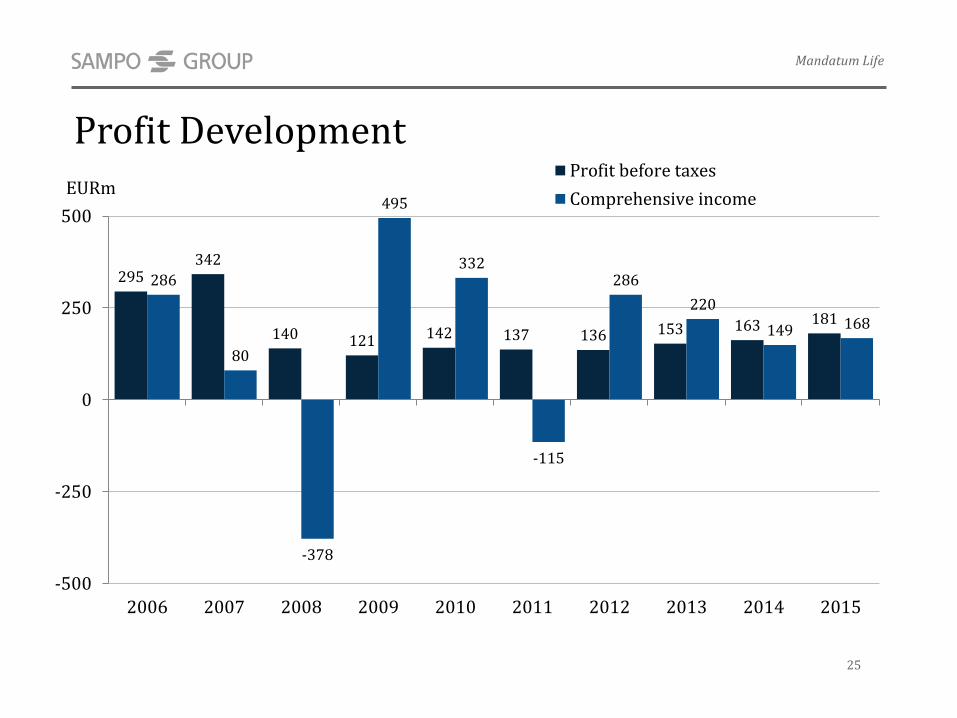
Profit Development
295342
140 121 142 137 136 153 163 181
286
80
-378
495
332
-115
286
220
149 168
-500
-250
0
250
500
2006 2007 2008 2009 2010 2011 2012 2013 2014 2015
EURmProfit before taxes
Comprehensive income
Mandatum Life
25
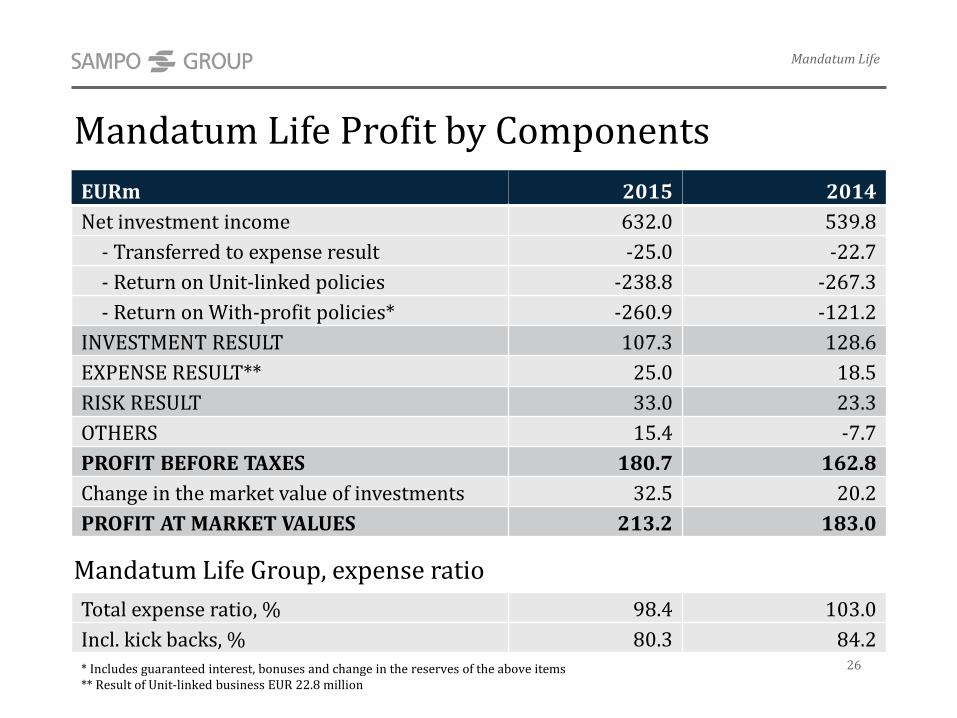
Mandatum Life Profit by Components
Mandatum Life Group, expense ratio
Mandatum Life
26
Total expense ratio, % 98.4 103.0
Incl. kick backs, % 80.3 84.2
* Includes guaranteed interest, bonuses and change in the reserves of the above items** Result of Unit-linked business EUR 22.8 million
EURm 2015 2014
Net investment income 632.0 539.8
- Transferred to expense result -25.0 -22.7
- Return on Unit-linked policies -238.8 -267.3
- Return on With-profit policies* -260.9 -121.2
INVESTMENT RESULT 107.3 128.6
EXPENSE RESULT** 25.0 18.5
RISK RESULT 33.0 23.3
OTHERS 15.4 -7.7
PROFIT BEFORE TAXES 180.7 162.8
Change in the market value of investments 32.5 20.2
PROFIT AT MARKET VALUES 213.2 183.0
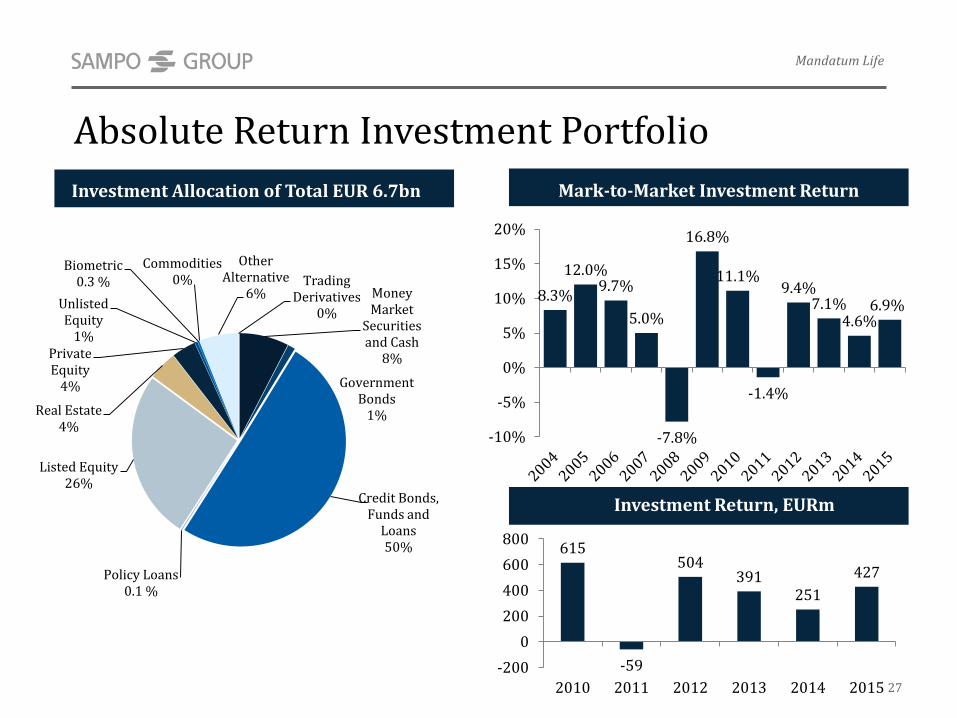
Absolute Return Investment Portfolio
Mark-to-Market Investment ReturnInvestment Allocation of Total EUR 6.7bn
8.3%
12.0%9.7%
5.0%
-7.8%
16.8%
11.1%
-1.4%
9.4%7.1%
4.6%6.9%
-10%
-5%
0%
5%
10%
15%
20%
Mandatum Life
27
615
-59
504391
251
427
-200
0
200
400
600
800
2010 2011 2012 2013 2014 2015
Investment Return, EURm
Money Market
Securities and Cash
8%
Government Bonds
1%
Credit Bonds, Funds and
Loans50%
Policy Loans0.1 %
Listed Equity26%
Real Estate4%
Private Equity
4%
Unlisted Equity
1%
Biometric0.3 %
Commodities0%
Other Alternative
6%Trading
Derivatives0%
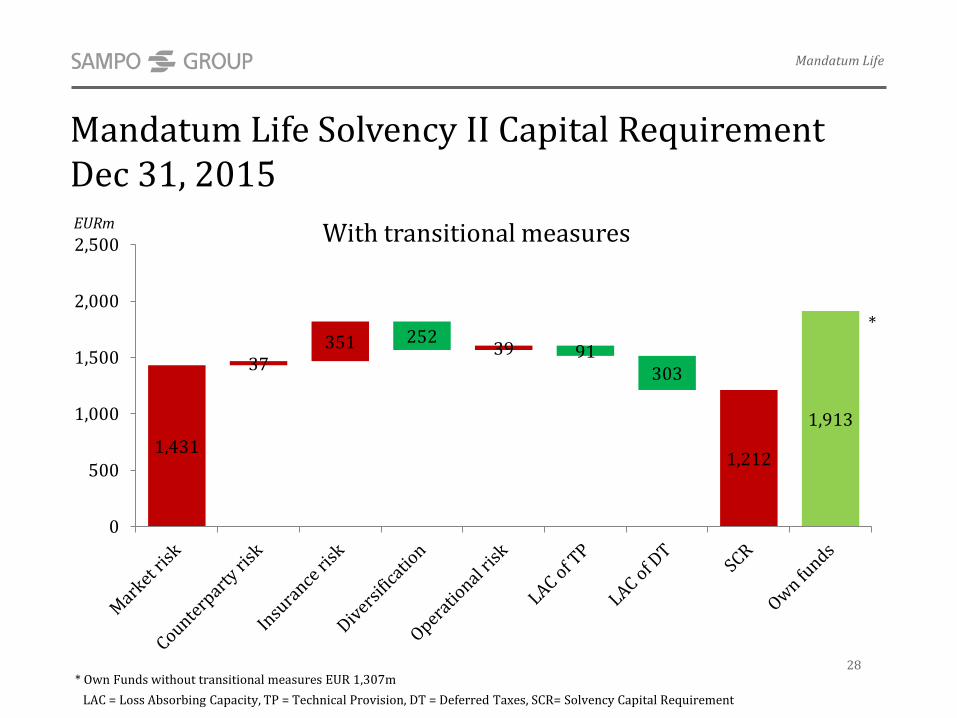
Mandatum Life Solvency II Capital RequirementDec 31, 2015
LAC = Loss Absorbing Capacity, TP = Technical Provision, DT = Deferred Taxes, SCR= Solvency Capital Requirement
*
* Own Funds without transitional measures EUR 1,307m
EURm
Mandatum Life
28
1,431
37351 252
39 91303
1,212
1,913
0
500
1,000
1,500
2,000
2,500 With transitional measures
29
Sampo Group Basic Facts 3-10If P&C The Leading Nordic P&C Insurer 11-19Mandatum Life A Finnish Financial Services Company 20-28Sampo Group A Productive Value Creator 29-36Sampo plc The Listed Parent Company - A Stable Dividend Payer 37-43
Appendix 44-57
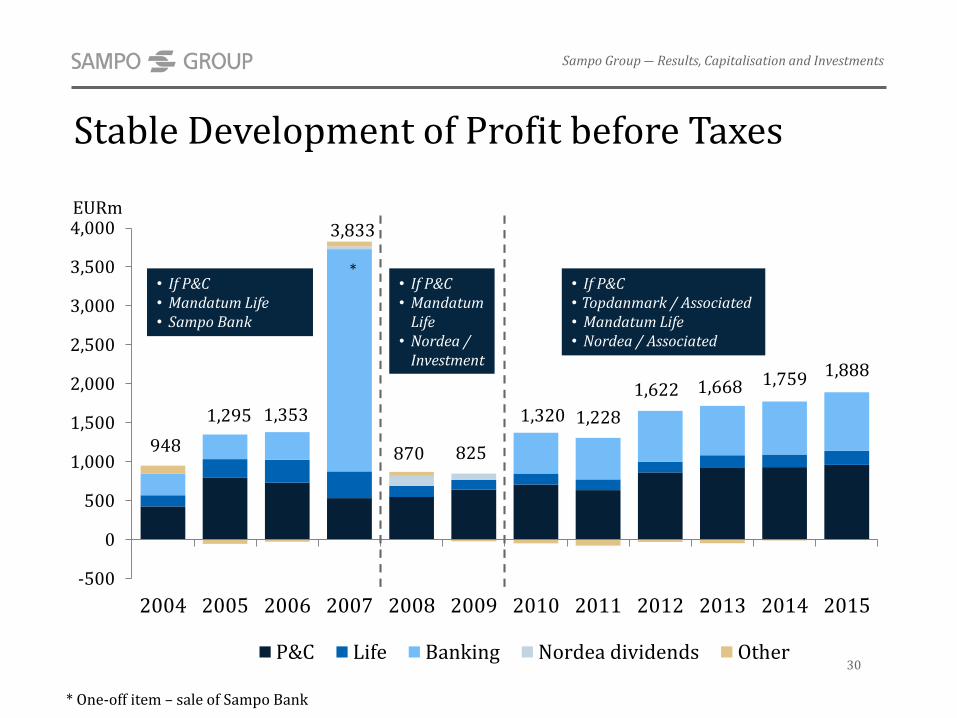
948
1,295 1,353
870 825
1,320 1,228
1,622 1,668 1,759 1,888
-500
0
500
1,000
1,500
2,000
2,500
3,000
3,500
4,000
2004 2005 2006 2007 2008 2009 2010 2011 2012 2013 2014 2015
P&C Life Banking Nordea dividends Other
Stable Development of Profit before Taxes
* One-off item – sale of Sampo Bank
EURm
*• If P&C• Mandatum Life• Sampo Bank
• If P&C• Mandatum
Life• Nordea /
Investment
• If P&C• Topdanmark / Associated• Mandatum Life• Nordea / Associated
Sampo Group ― Results, Capitalisation and Investments
30
3,833
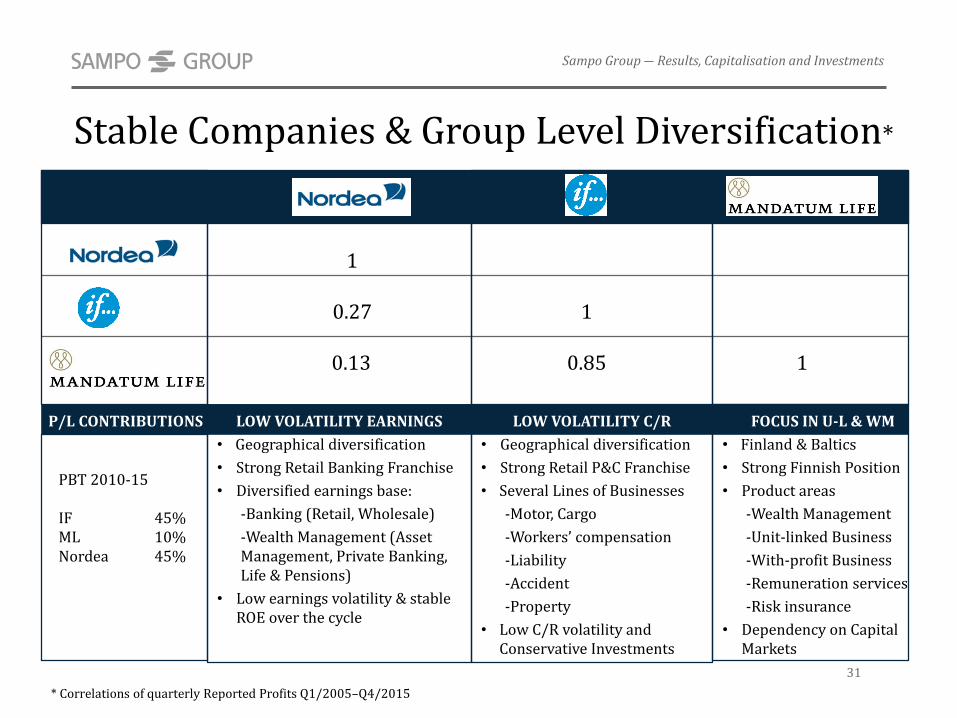
Stable Companies & Group Level Diversification*
LOW VOLATILITY EARNINGS
• Geographical diversification
• Strong Retail Banking Franchise
• Diversified earnings base:
-Banking (Retail, Wholesale)
-Wealth Management (AssetManagement, Private Banking, Life & Pensions)
• Low earnings volatility & stableROE over the cycle
LOW VOLATILITY C/R
• Geographical diversification
• Strong Retail P&C Franchise
• Several Lines of Businesses
-Motor, Cargo
-Workersʼ compensation
-Liability
-Accident
-Property
• Low C/R volatility and Conservative Investments
FOCUS IN U-L & WM
• Finland & Baltics
• Strong Finnish Position
• Product areas
-Wealth Management
-Unit-linked Business
-With-profit Business
-Remuneration services
-Risk insurance
• Dependency on Capital Markets
1
0.27 1
0.13 0.85 1
* Correlations of quarterly Reported Profits Q1/2005–Q4/2015
PBT 2010-15
IF 45%ML 10%Nordea 45%
P/L CONTRIBUTIONS
Sampo Group ― Results, Capitalisation and Investments
31
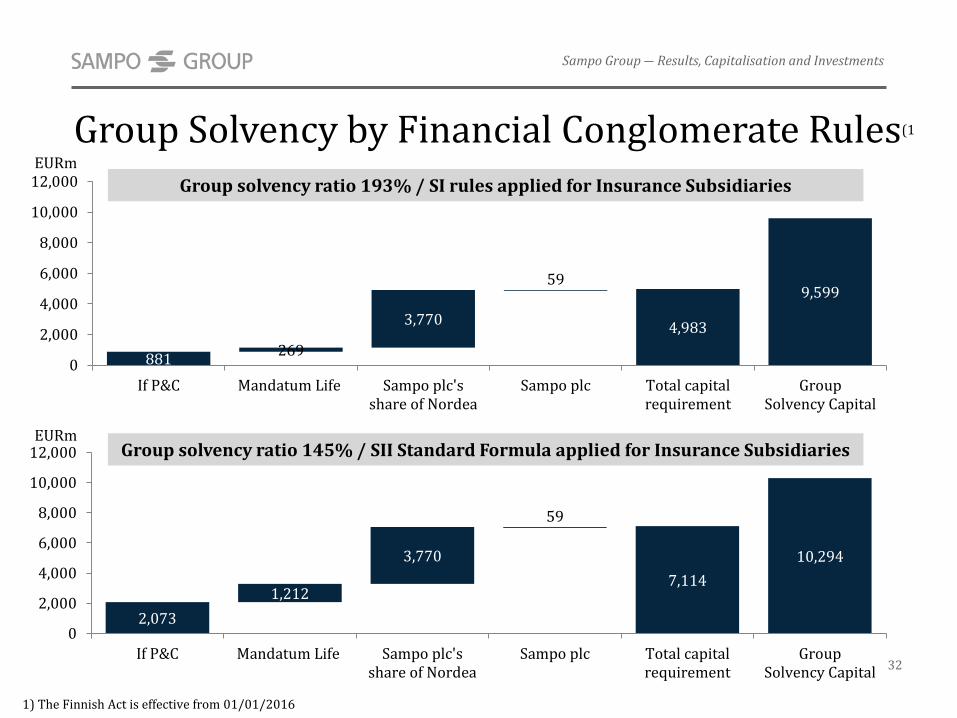
2,073
1,212
3,770
59
7,114
10,294
0
2,000
4,000
6,000
8,000
10,000
12,000
If P&C Mandatum Life Sampo plc'sshare of Nordea
Sampo plc Total capitalrequirement
GroupSolvency Capital
881269
3,770
59
4,983
9,599
0
2,000
4,000
6,000
8,000
10,000
12,000
If P&C Mandatum Life Sampo plc'sshare of Nordea
Sampo plc Total capitalrequirement
GroupSolvency Capital
Group Solvency by Financial Conglomerate Rules(1
Sampo Group ― Results, Capitalisation and Investments
32
EURmGroup solvency ratio 145% / SII Standard Formula applied for Insurance Subsidiaries
1) The Finnish Act is effective from 01/01/2016
Group solvency ratio 193% / SI rules applied for Insurance Subsidiaries
EURm
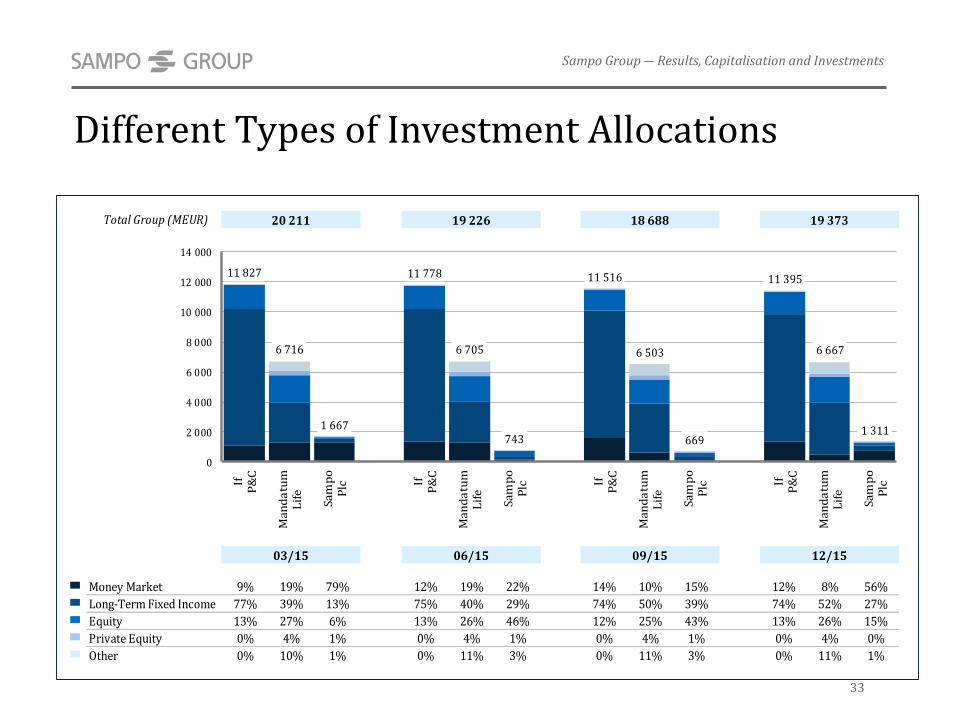
Different Types of Investment Allocations
Sampo Group ― Results, Capitalisation and Investments
33
Total Group (MEUR) 20 211 19 226 18 688 19 373
03/15 06/15 09/15 12/15
Money Market 9% 19% 79% 12% 19% 22% 14% 10% 15% 12% 8% 56%
Long-Term Fixed Income 77% 39% 13% 75% 40% 29% 74% 50% 39% 74% 52% 27%
Equity 13% 27% 6% 13% 26% 46% 12% 25% 43% 13% 26% 15%
Private Equity 0% 4% 1% 0% 4% 1% 0% 4% 1% 0% 4% 0%
Other 0% 10% 1% 0% 11% 3% 0% 11% 3% 0% 11% 1%
11 827
6 716
1 667
11 778
6 705
743
11 516
6 503
669
11 395
6 667
1 311
0
2 000
4 000
6 000
8 000
10 000
12 000
14 000
IfP
&C
Man
da
tum
Lif
e
Sam
po
Plc If
P&
C
Man
da
tum
Lif
e
Sam
po
Plc If
P&
C
Man
da
tum
Lif
e
Sam
po
Plc If
P&
C
Man
da
tum
Lif
e
Sam
po
Plc
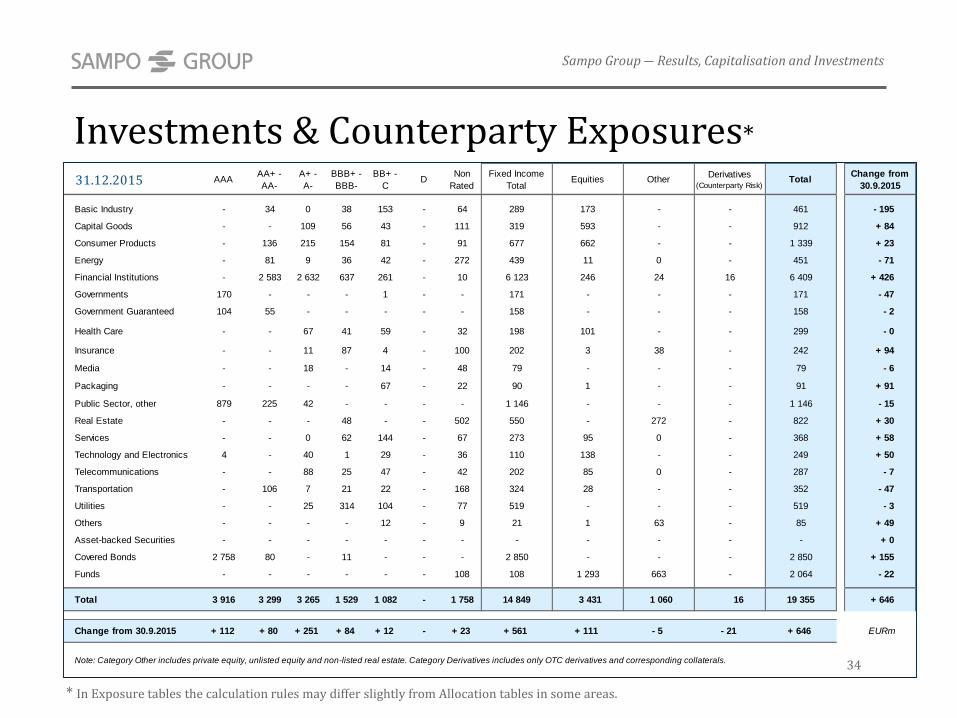
Investments & Counterparty Exposures*
* In Exposure tables the calculation rules may differ slightly from Allocation tables in some areas.
Sampo Group ― Results, Capitalisation and Investments
34
31.12.2015 AAAAA+ -
AA-
A+ -
A-
BBB+ -
BBB-
BB+ -
CD
Non
Rated
Fixed Income
TotalEquities Other
Derivatives (Counterparty Risk)
TotalChange from
30.9.2015
Basic Industry - 34 0 38 153 - 64 289 173 - - 461 - 195
Capital Goods - - 109 56 43 - 111 319 593 - - 912 + 84
Consumer Products - 136 215 154 81 - 91 677 662 - - 1 339 + 23
Energy - 81 9 36 42 - 272 439 11 0 - 451 - 71
Financial Institutions - 2 583 2 632 637 261 - 10 6 123 246 24 16 6 409 + 426
Governments 170 - - - 1 - - 171 - - - 171 - 47
Government Guaranteed 104 55 - - - - - 158 - - - 158 - 2
Health Care - - 67 41 59 - 32 198 101 - - 299 - 0
Insurance - - 11 87 4 - 100 202 3 38 - 242 + 94
Media - - 18 - 14 - 48 79 - - - 79 - 6
Packaging - - - - 67 - 22 90 1 - - 91 + 91
Public Sector, other 879 225 42 - - - - 1 146 - - - 1 146 - 15
Real Estate - - - 48 - - 502 550 - 272 - 822 + 30
Services - - 0 62 144 - 67 273 95 0 - 368 + 58
Technology and Electronics 4 - 40 1 29 - 36 110 138 - - 249 + 50
Telecommunications - - 88 25 47 - 42 202 85 0 - 287 - 7
Transportation - 106 7 21 22 - 168 324 28 - - 352 - 47
Utilities - - 25 314 104 - 77 519 - - - 519 - 3
Others - - - - 12 - 9 21 1 63 - 85 + 49
Asset-backed Securities - - - - - - - - - - - - + 0
Covered Bonds 2 758 80 - 11 - - - 2 850 - - - 2 850 + 155
Funds - - - - - - 108 108 1 293 663 - 2 064 - 22
Total 3 916 3 299 3 265 1 529 1 082 - 1 758 14 849 3 431 1 060 16 19 355 + 646
Change from 30.9.2015 + 112 + 80 + 251 + 84 + 12 - + 23 + 561 + 111 - 5 - 21 + 646 EURm
Note: Category Other includes private equity, unlisted equity and non-listed real estate. Category Derivatives includes only OTC derivatives and corresponding collaterals.
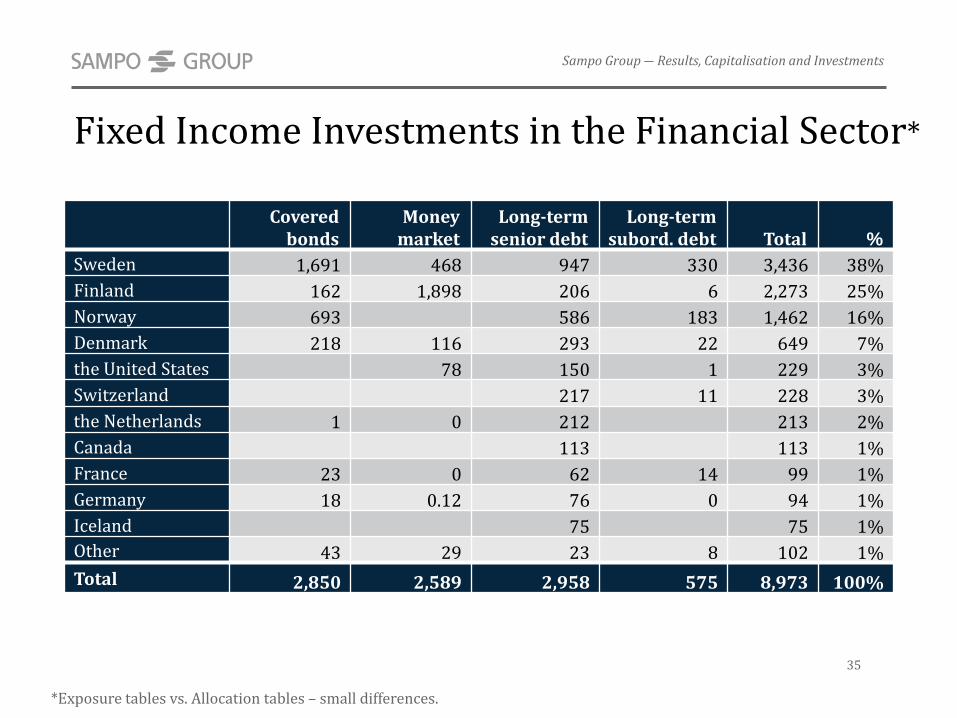
Fixed Income Investments in the Financial Sector*
*Exposure tables vs. Allocation tables – small differences.
Sampo Group ― Results, Capitalisation and Investments
35
Covered bonds
Money market
Long-term senior debt
Long-term subord. debt Total %
Sweden 1,691 468 947 330 3,436 38%
Finland 162 1,898 206 6 2,273 25%
Norway 693 586 183 1,462 16%
Denmark 218 116 293 22 649 7%
the United States 78 150 1 229 3%
Switzerland 217 11 228 3%
the Netherlands 1 0 212 213 2%
Canada 113 113 1%
France 23 0 62 14 99 1%
Germany 18 0.12 76 0 94 1%
Iceland 75 75 1%
Other 43 29 23 8 102 1%
Total 2,850 2,589 2,958 575 8,973 100%
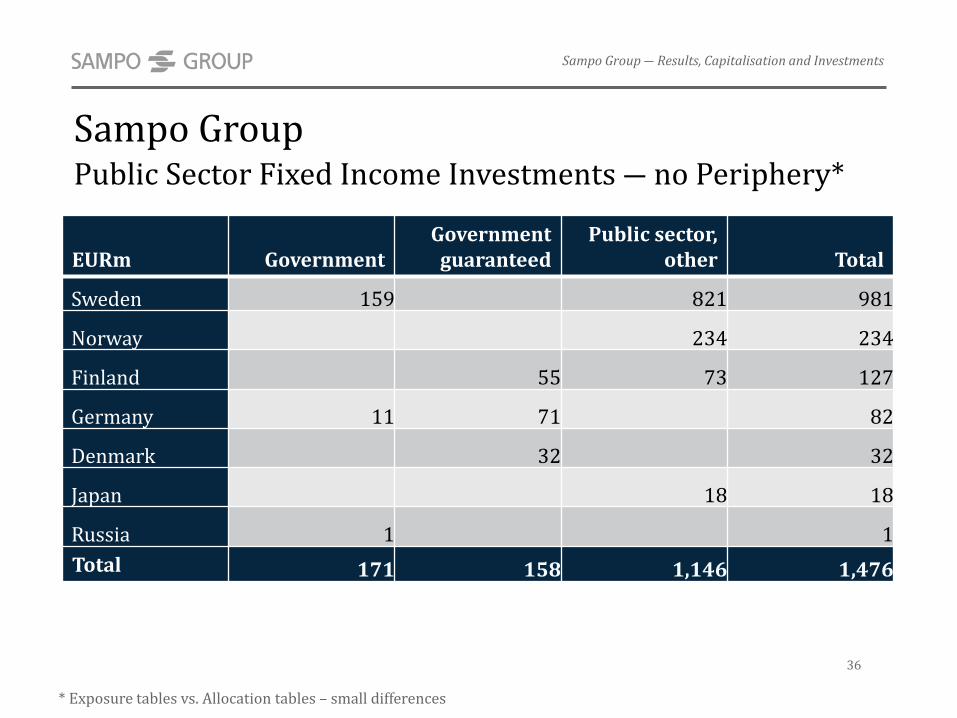
Sampo Group Public Sector Fixed Income Investments ― no Periphery*
* Exposure tables vs. Allocation tables – small differences
36
Sampo Group ― Results, Capitalisation and Investments
EURm GovernmentGovernment
guaranteedPublic sector,
other Total
Sweden 159 821 981
Norway 234 234
Finland 55 73 127
Germany 11 71 82
Denmark 32 32
Japan 18 18
Russia 1 1
Total 171 158 1,146 1,476
37
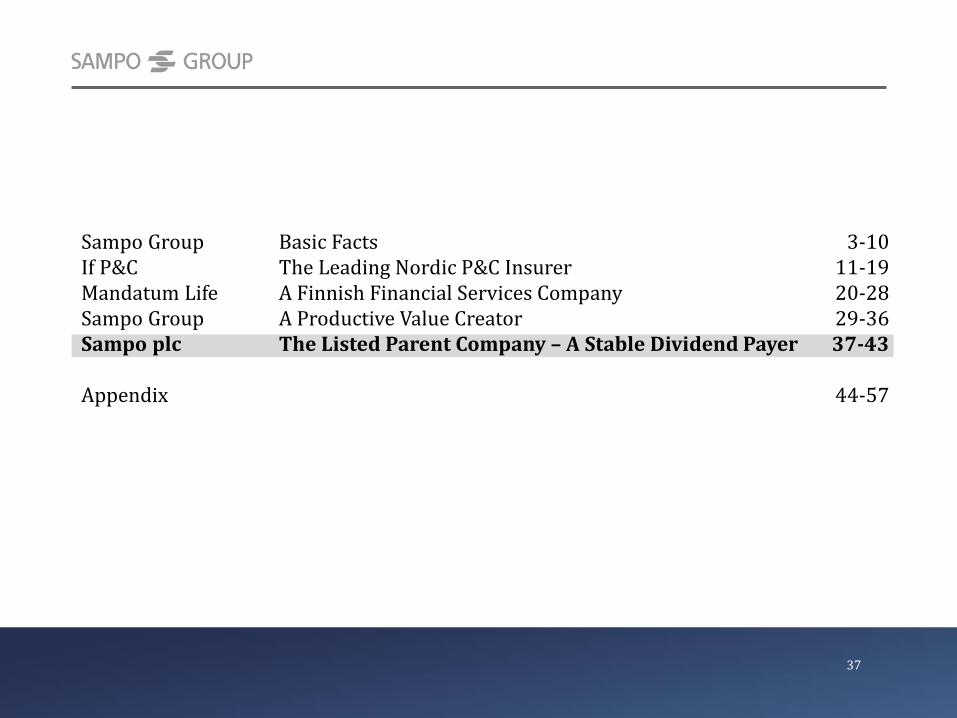
Sampo Group Basic Facts 3-10If P&C The Leading Nordic P&C Insurer 11-19Mandatum Life A Finnish Financial Services Company 20-28Sampo Group A Productive Value Creator 29-36Sampo plc The Listed Parent Company – A Stable Dividend Payer 37-43
Appendix 44-57
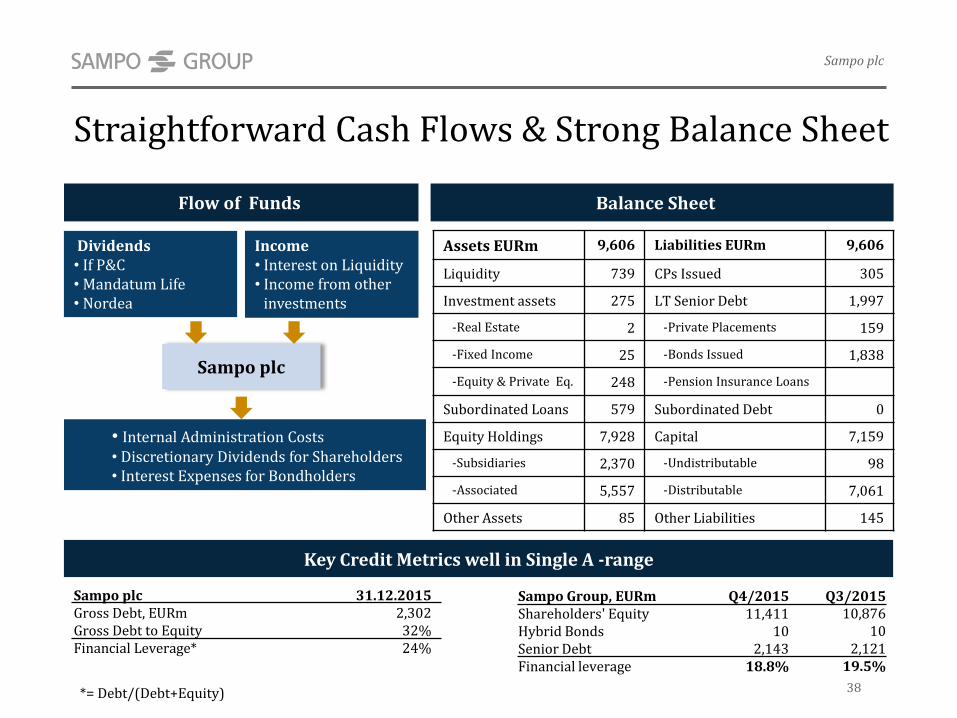
Straightforward Cash Flows & Strong Balance Sheet
Dividends • If P&C• Mandatum Life• Nordea
• Internal Administration Costs• Discretionary Dividends for Shareholders• Interest Expenses for Bondholders
Income• Interest on Liquidity • Income from other
investments
Sampo plc
Assets EURm 9,606 Liabilities EURm 9,606
Liquidity 739 CPs Issued 305
Investment assets 275 LT Senior Debt 1,997
-Real Estate 2 -Private Placements 159
-Fixed Income 25 -Bonds Issued 1,838
-Equity & Private Eq. 248 -Pension Insurance Loans
Subordinated Loans 579 Subordinated Debt 0
Equity Holdings 7,928 Capital 7,159
-Subsidiaries 2,370 -Undistributable 98
-Associated 5,557 -Distributable 7,061
Other Assets 85 Other Liabilities 145
Flow of Funds Balance Sheet
Key Credit Metrics well in Single A -range
Sampo plc 31.12.2015Gross Debt, EURm 2,302Gross Debt to Equity 32%Financial Leverage* 24%
Sampo Group, EURm Q4/2015 Q3/2015 Shareholders' Equity 11,411 10,876 Hybrid Bonds 10 10 Senior Debt 2,143 2,121Financial leverage 18.8% 19.5%
Sampo plc
38*= Debt/(Debt+Equity)
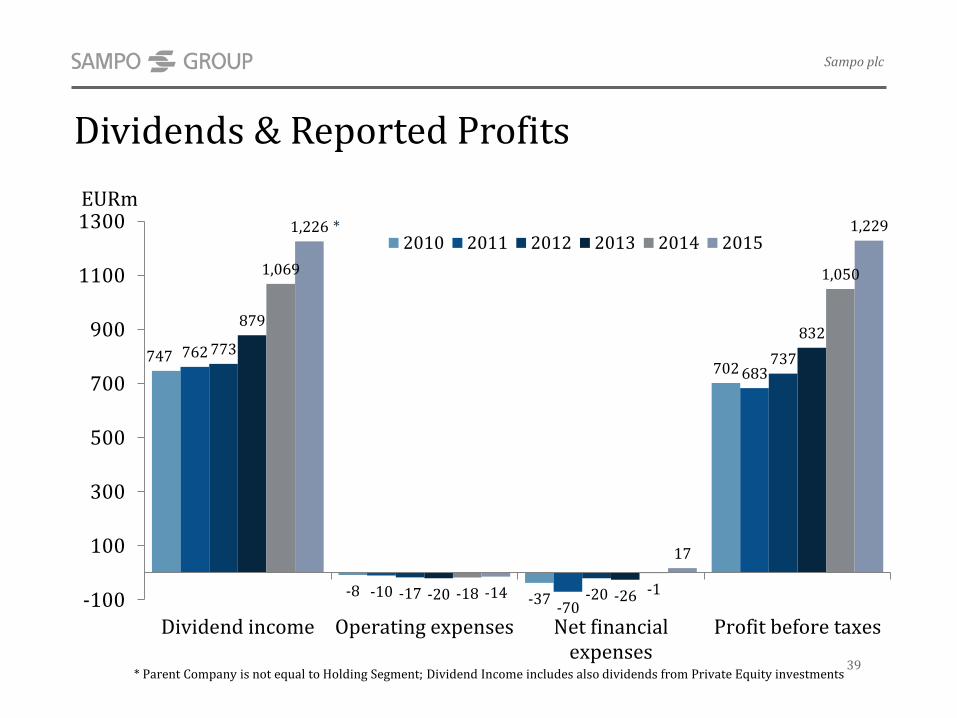
Dividends & Reported Profits
* Parent Company is not equal to Holding Segment; Dividend Income includes also dividends from Private Equity investments
747
-8 -37
702762
-10-70
683
773
-17 -20
737
879
-20 -26
832
1,069
-18 -1
1,050
1,226
-14
17
1,229
-100
100
300
500
700
900
1100
1300
Dividend income Operating expenses Net financialexpenses
Profit before taxes
2010 2011 2012 2013 2014 2015*
EURm
Sampo plc
39
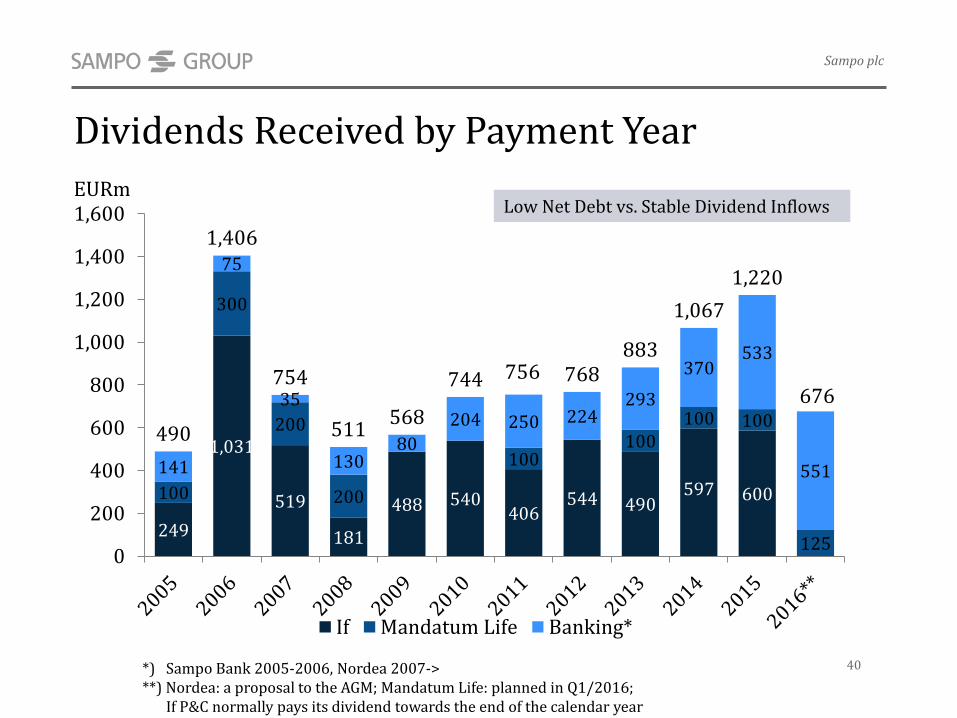
Dividends Received by Payment Year
EURm
249
1,031
519
181
488 540406
544 490597 600100
300
200
200
100100
100 100
125
141
75
35
13080
204 250 224293
370533
551
490
1,406
754
511568
744 756 768883
1,067
1,220
0
200
400
600
800
1,000
1,200
1,400
1,600
If Mandatum Life Banking*
Sampo plc
40
Low Net Debt vs. Stable Dividend Inflows
*) Sampo Bank 2005-2006, Nordea 2007->**) Nordea: a proposal to the AGM; Mandatum Life: planned in Q1/2016;
If P&C normally pays its dividend towards the end of the calendar year
676
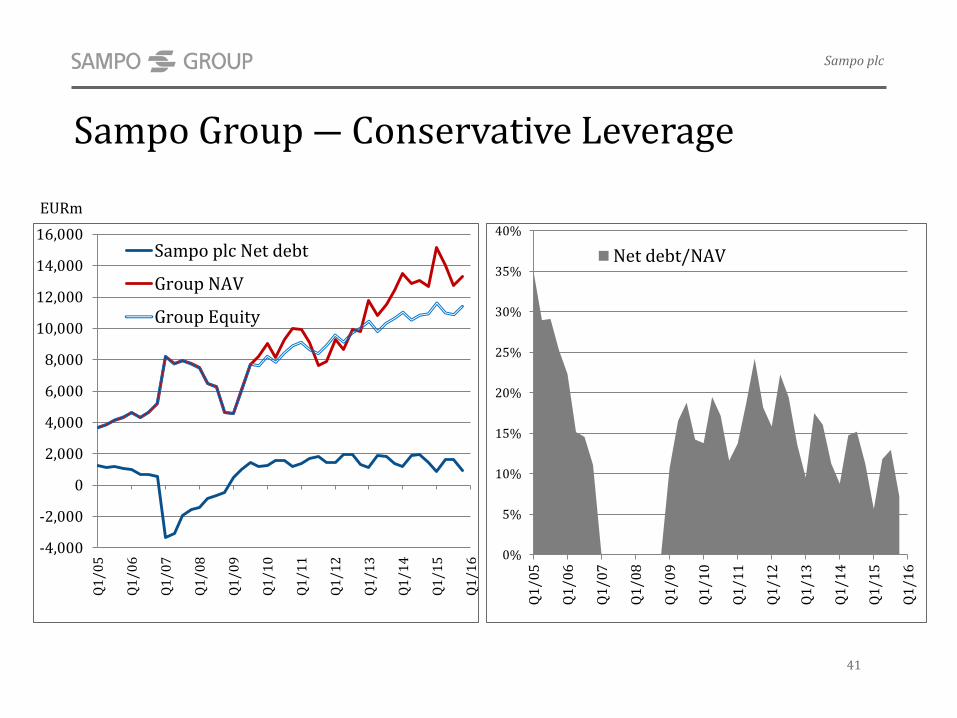
Sampo Group ― Conservative Leverage
-4,000
-2,000
0
2,000
4,000
6,000
8,000
10,000
12,000
14,000
16,000
Q1
/05
Q1
/06
Q1
/07
Q1
/08
Q1
/09
Q1
/10
Q1
/11
Q1
/12
Q1
/13
Q1
/14
Q1
/15
Q1
/16
Sampo plc Net debt
Group NAV
Group Equity
41
Sampo plc
EURm
0%
5%
10%
15%
20%
25%
30%
35%
40%
Q1
/05
Q1
/06
Q1
/07
Q1
/08
Q1
/09
Q1
/10
Q1
/11
Q1
/12
Q1
/13
Q1
/14
Q1
/15
Q1
/16
Net debt/NAV
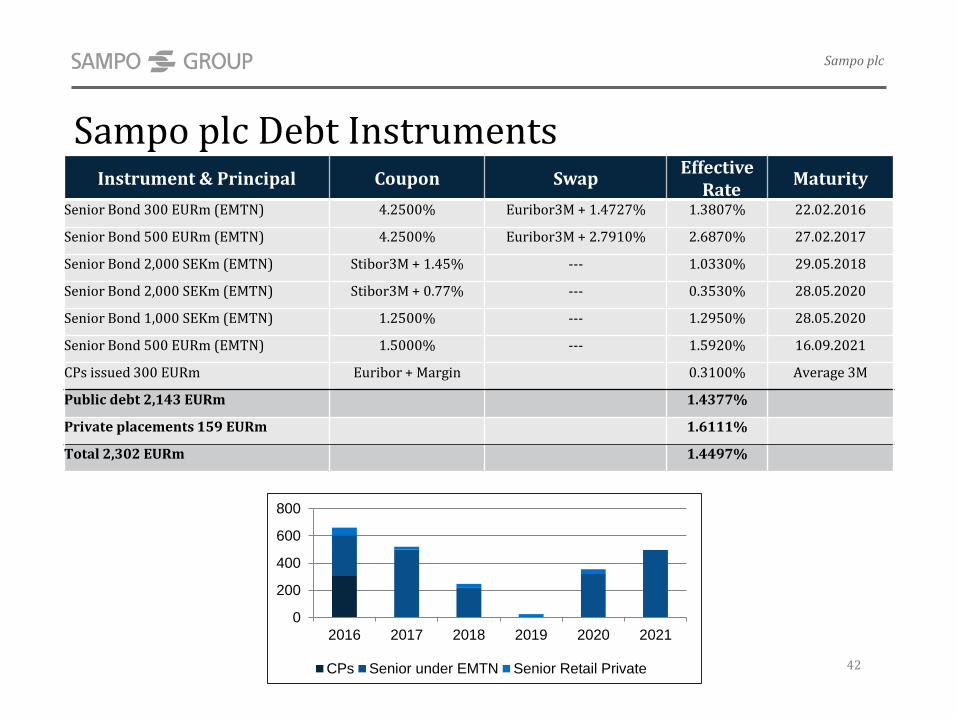
Sampo plc Debt Instruments
42
Sampo plc
EURm
Instrument & Principal Coupon SwapEffective
RateMaturity
Senior Bond 300 EURm (EMTN) 4.2500% Euribor3M + 1.4727% 1.3807% 22.02.2016
Senior Bond 500 EURm (EMTN) 4.2500% Euribor3M + 2.7910% 2.6870% 27.02.2017
Senior Bond 2,000 SEKm (EMTN) Stibor3M + 1.45% --- 1.0330% 29.05.2018
Senior Bond 2,000 SEKm (EMTN) Stibor3M + 0.77% --- 0.3530% 28.05.2020
Senior Bond 1,000 SEKm (EMTN) 1.2500% --- 1.2950% 28.05.2020
Senior Bond 500 EURm (EMTN) 1.5000% --- 1.5920% 16.09.2021
CPs issued 300 EURm Euribor + Margin 0.3100% Average 3M
Public debt 2,143 EURm 1.4377%
Private placements 159 EURm 1.6111%
Total 2,302 EURm 1.4497%
0
200
400
600
800
2016 2017 2018 2019 2020 2021
CPs Senior under EMTN Senior Retail Private
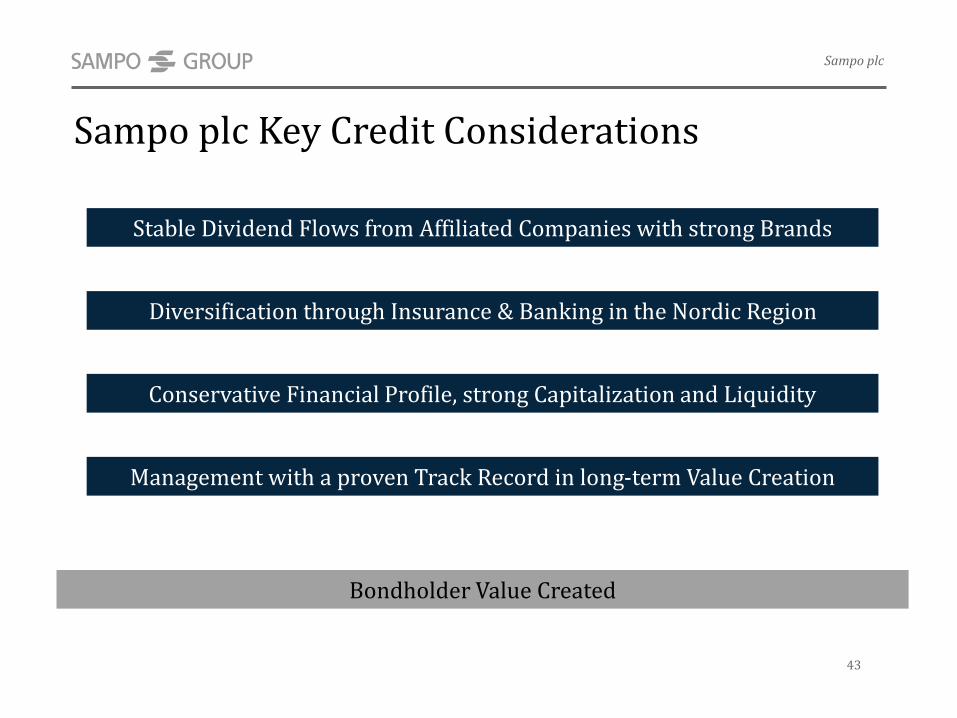
Sampo plc Key Credit Considerations
Diversification through Insurance & Banking in the Nordic Region
Management with a proven Track Record in long-term Value Creation
Conservative Financial Profile, strong Capitalization and Liquidity
Stable Dividend Flows from Affiliated Companies with strong Brands
Bondholder Value Created
Sampo plc
43
44
Appendix 44-57
45
Sampo Group’s Outlook for 2016
Appendix
• Sampo Group’s business areas are expected to report good operating results for 2016.
• However, the mark-to-market results are, particularly in life insurance, highly dependent on capital market developments. The continuing low interest rate level also creates a challenging environment for reinvestment in fixed income instruments.
• The P&C insurance operations are expected to reach their long-term combined ratio target of below 95 per cent in 2016 by a margin.
• Nordea’s contribution to the Group’s profit is expected to be significant.
Principles of Investment Management
• Company specific needs form the basis for all investments
– Liabilities intensively analysed and modelled.
– Regulatory requirements.
• Strategy
– Absolute Return targets taking into account the liabilities and general business targets.
– Direct Investments into Nordic countries mainly, outside Nordics Funds mainly.
– No diversification for the sake of diversification.
• Centrally Managed
– Sampo plc Chief Investment Officer responsible for all investments, all portfolio managers have a direct reporting line to him.
– Common infrastructure for investment administration and reporting.
– Investment strategies coordinated and streamlined, no overlapping activities
to prevent Group wide concentrations.
46
Appendix
Risk Management Principles
• Scope
– Sampo’s Board of Directors requires that all activities involving the exposure of any Sampo Group company to risks, as well as activities controlling those risks, are arranged to comply with these general guidelines and related instructions as well
as with applicable legislation and regulations
– The Board of Directors will supervise the risk taking and risk control activities
– The Principles apply to all Sampo Group companies
• The Key Objectives
– Balance between risks, capital and profits
– Cost efficiency and high quality processes
– Strategic and operational flexibility
• The Central Tasks
– Identification of risks
– Assessment of required capital
– Pricing of risks
– Managing risk exposures, capital positions and operative processes
– Measuring and reporting risks47
Appendix
For more detailed description of Sampo Group´s Risk Management Principles, see http://www.sampo.com/governance/internal-control/risk-management/
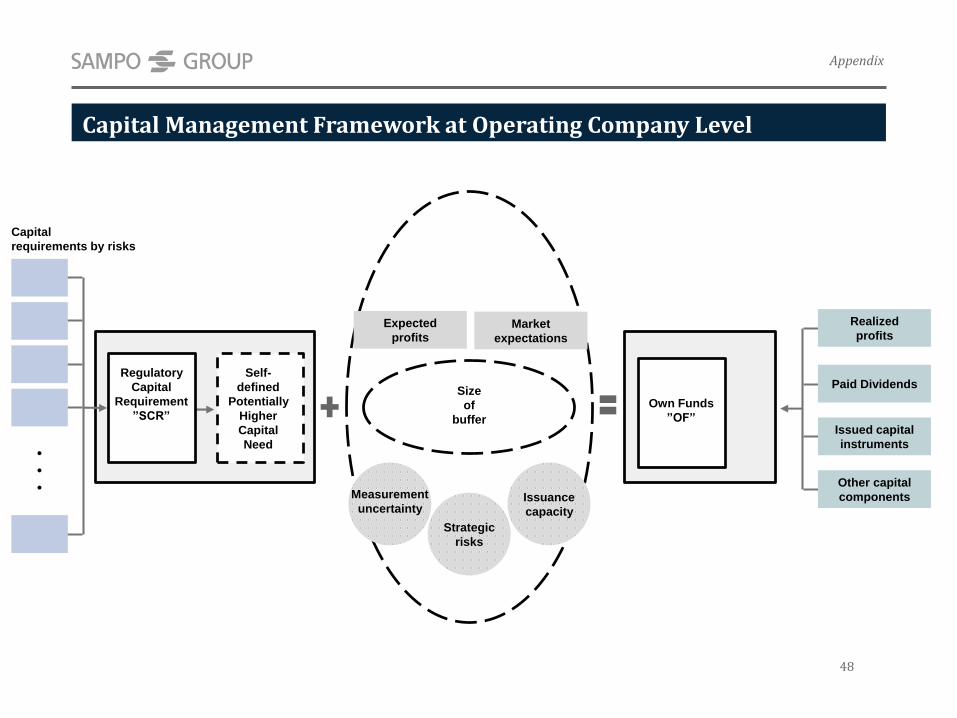
Capital Management Framework at Operating Company Level
48
Appendix
Own Funds
”OF”
•
••
Capital
requirements by risks
Self-
defined
Potentially
Higher
Capital
Need
Regulatory
Capital
Requirement
”SCR”
Measurement
uncertainty
Strategic
risks
Issuance
capacity
Expected
profits
Realized
profits
Paid Dividends
Issued capital
instruments
Other capital
components
Market
expectations
Size
of
buffer
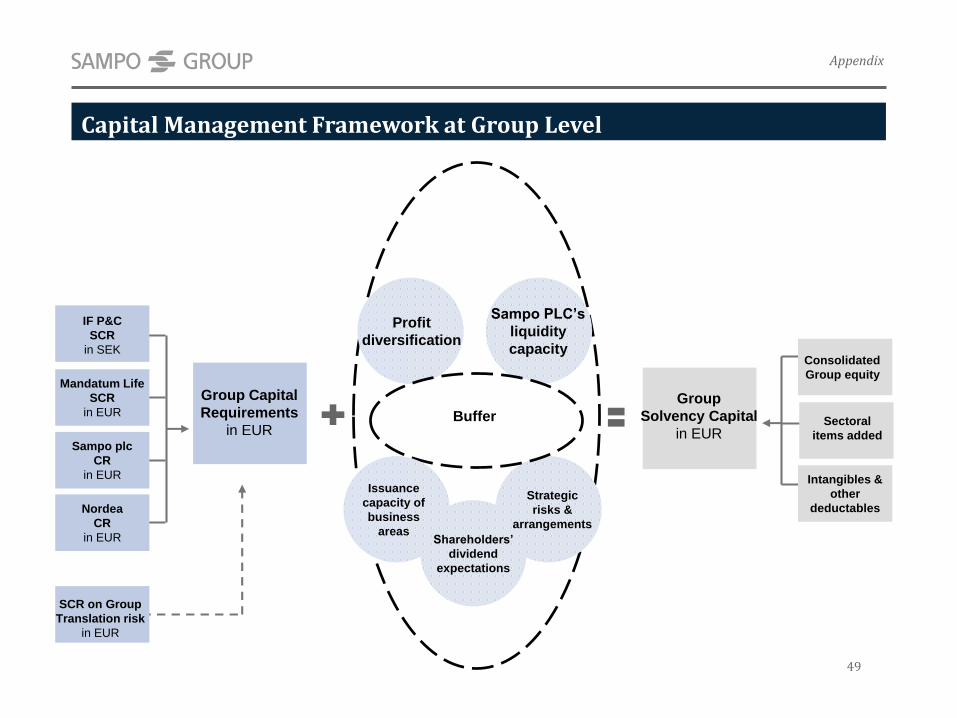
Capital Management Framework at Group Level
49
Appendix
Group Capital
Requirements
in EUR
Group
Solvency Capital
in EUR
IF P&C
SCR
in SEK
Mandatum Life
SCR
in EUR
Sampo plc
CR
in EUR
Nordea
CR
in EUR
SCR on Group
Translation risk
in EUR
Buffer
Issuance
capacity of
business
areas
Strategic
risks &
arrangements
Profit
diversification
Shareholders’
dividend
expectations
Consolidated
Group equity
Sectoral
items added
Intangibles &
other
deductables
Sampo PLC’s
liquidity
capacity
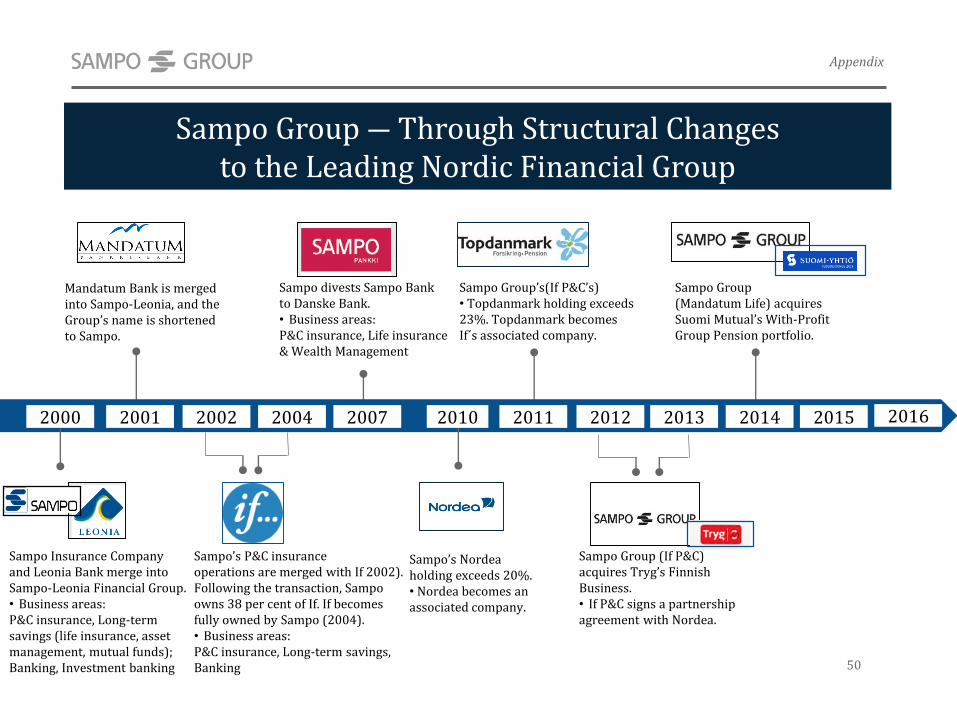
Sampo’s P&C insurance operations are merged with If 2002). Following the transaction, Sampoowns 38 per cent of If. If becomes fully owned by Sampo (2004).• Business areas:P&C insurance, Long-term savings,Banking
Sampo Insurance Companyand Leonia Bank merge into Sampo-Leonia Financial Group. • Business areas: P&C insurance, Long-term savings (life insurance, asset management, mutual funds); Banking, Investment banking
Mandatum Bank is merged into Sampo-Leonia, and the Group’s name is shortenedto Sampo.
Sampo divests Sampo Bank to Danske Bank.• Business areas: P&C insurance, Life insurance & Wealth Management
Sampo’s Nordea holding exceeds 20%. • Nordea becomes an associated company.
20072004200220012000 2010 2011
Sampo Group’s(If P&Cʼs) • Topdanmark holding exceeds 23%. Topdanmark becomes If´s associated company.
2012
Sampo Group (If P&C)acquires Tryg’s FinnishBusiness.• If P&C signs a partnership agreement with Nordea.
Sampo Group ― Through Structural Changes to the Leading Nordic Financial Group
2013 2014
Sampo Group(Mandatum Life) acquires Suomi Mutualʼs With-ProfitGroup Pension portfolio.
2015
Appendix
50
2016
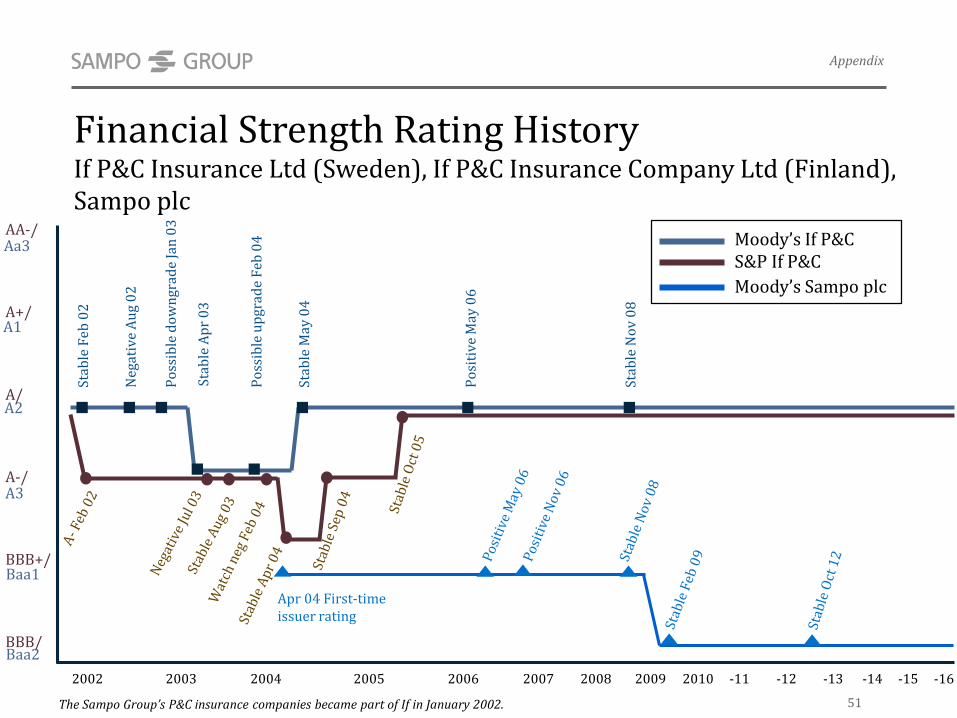
Financial Strength Rating HistoryIf P&C Insurance Ltd (Sweden), If P&C Insurance Company Ltd (Finland),Sampo plc
The Sampo Groupʼs P&C insurance companies became part of If in January 2002.
AA-/
A+/
A/
A-/
BBB+/
BBB/
Moodyʼs If P&CS&P If P&C
2002 2003 2004 2005 2006 2007 2008 2009 2010 -11 -12 -13 -14 -15 -16
Po
ssib
le d
ow
ngr
ade
Jan
03
Stab
le F
eb 0
2
Neg
ativ
e A
ug
02
Stab
le A
pr
03
Po
ssib
le u
pgr
ade
Feb
04
Stab
le M
ay 0
4
Po
siti
ve M
ay 0
6
Stab
le N
ov
08
51
Moodyʼs Sampo plc
Apr 04 First-time issuer rating
Appendix
Aa3
A1
A2
A3
Baa1
Baa2
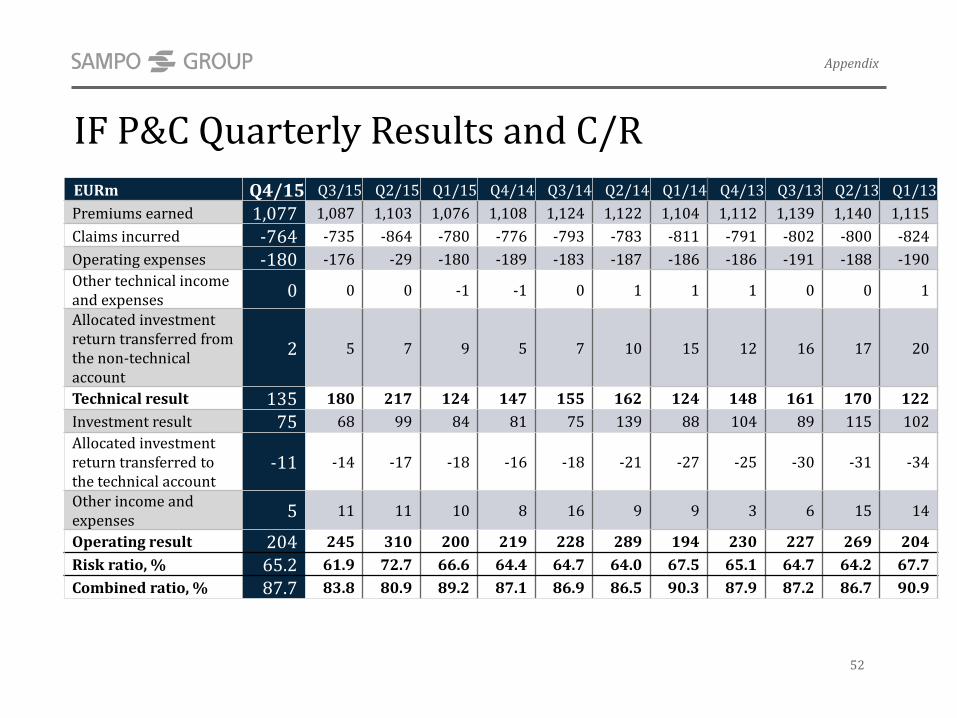
IF P&C Quarterly Results and C/R
EURm Q4/15 Q3/15 Q2/15 Q1/15 Q4/14 Q3/14 Q2/14 Q1/14 Q4/13 Q3/13 Q2/13 Q1/13
Premiums earned 1,077 1,087 1,103 1,076 1,108 1,124 1,122 1,104 1,112 1,139 1,140 1,115
Claims incurred -764 -735 -864 -780 -776 -793 -783 -811 -791 -802 -800 -824
Operating expenses -180 -176 -29 -180 -189 -183 -187 -186 -186 -191 -188 -190
Other technical income and expenses
0 0 0 -1 -1 0 1 1 1 0 0 1
Allocated investment return transferred from the non-technical account
2 5 7 9 5 7 10 15 12 16 17 20
Technical result 135 180 217 124 147 155 162 124 148 161 170 122
Investment result 75 68 99 84 81 75 139 88 104 89 115 102
Allocated investment return transferred tothe technical account
-11 -14 -17 -18 -16 -18 -21 -27 -25 -30 -31 -34
Other income and expenses
5 11 11 10 8 16 9 9 3 6 15 14
Operating result 204 245 310 200 219 228 289 194 230 227 269 204
Risk ratio, % 65.2 61.9 72.7 66.6 64.4 64.7 64.0 67.5 65.1 64.7 64.2 67.7
Combined ratio, % 87.7 83.8 80.9 89.2 87.1 86.9 86.5 90.3 87.9 87.2 86.7 90.9
Appendix
52
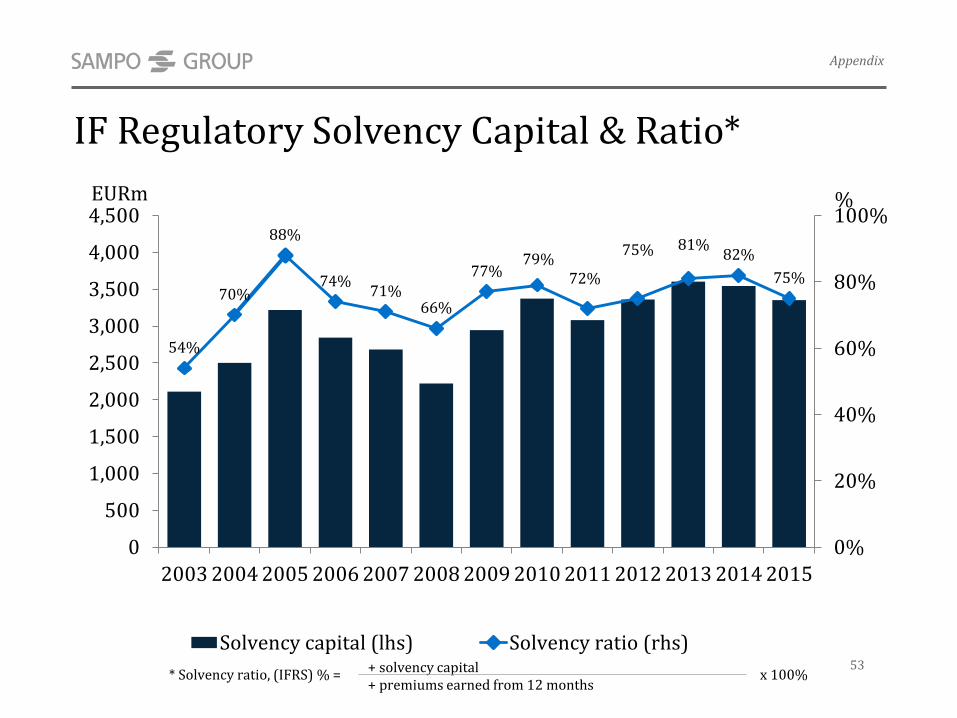
IF Regulatory Solvency Capital & Ratio*
54%
70%
88%
74%71%
66%
77%79%
72%
75% 81%82%
75%
0%
20%
40%
60%
80%
100%
0
500
1,000
1,500
2,000
2,500
3,000
3,500
4,000
4,500
2003 2004 2005 2006 2007 2008 2009 2010 2011 2012 2013 2014 2015
%EURm
Solvency capital (lhs) Solvency ratio (rhs)
* Solvency ratio, (IFRS) % =+ solvency capital+ premiums earned from 12 months
x 100%53
Appendix
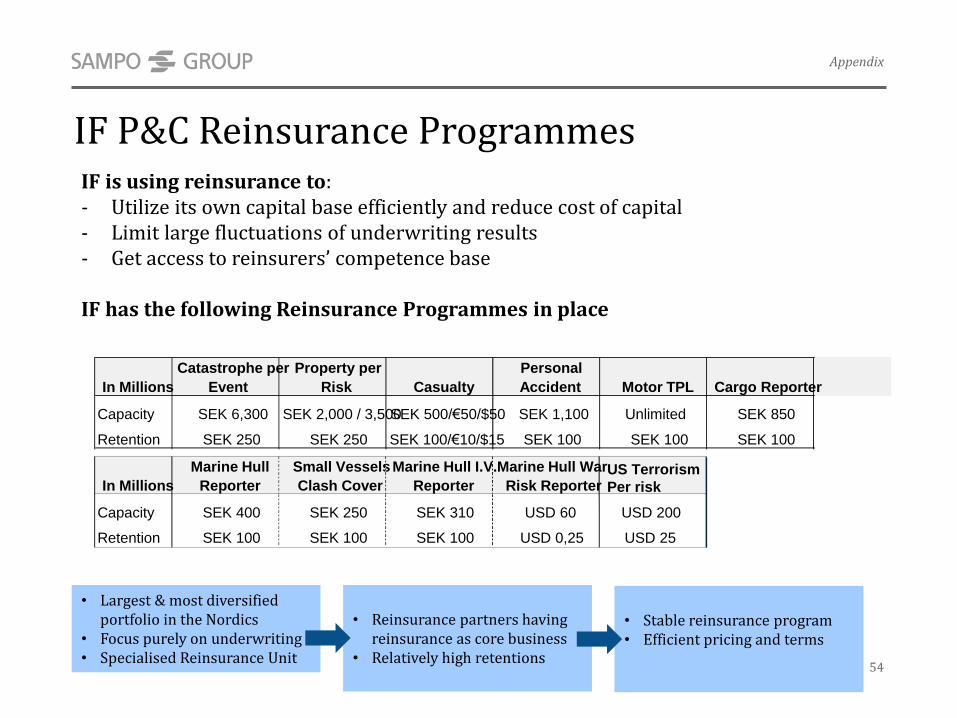
IF P&C Reinsurance ProgrammesIF is using reinsurance to:- Utilize its own capital base efficiently and reduce cost of capital- Limit large fluctuations of underwriting results- Get access to reinsurers’ competence base
IF has the following Reinsurance Programmes in place
• Largest & most diversifiedportfolio in the Nordics
• Focus purely on underwriting• Specialised Reinsurance Unit
• Reinsurance partners having reinsurance as core business
• Relatively high retentions
• Stable reinsurance program • Efficient pricing and terms
Appendix
In Millions
Marine Hull
Reporter
Small Vessels
Clash Cover
Marine Hull I.V.
Reporter
Marine Hull War
Risk ReporterUS Terrorism
Per risk
Capacity SEK 400 SEK 250 SEK 310 USD 60 USD 200
Retention SEK 100 SEK 100 SEK 100 USD 0,25 USD 25
In Millions
Catastrophe per
Event
Property per
Risk Casualty
Personal
Accident Motor TPL Cargo Reporter
Capacity SEK 6,300 SEK 2,000 / 3,500SEK 500/€50/$50 SEK 1,100 Unlimited SEK 850
Retention SEK 250 SEK 250 SEK 100/€10/$15 SEK 100 SEK 100 SEK 100
54
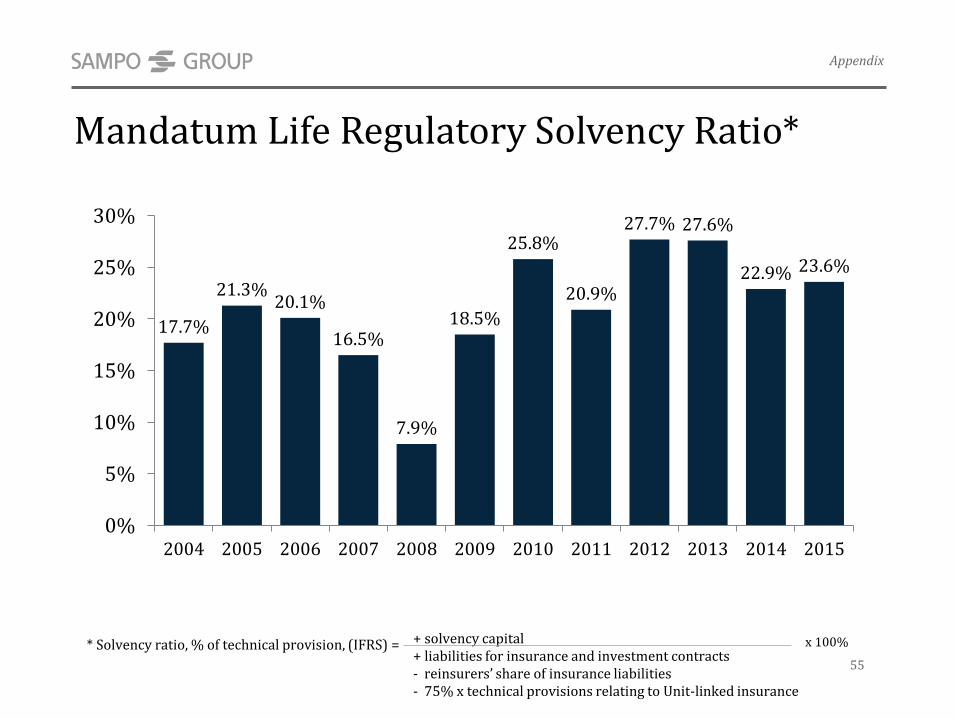
Mandatum Life Regulatory Solvency Ratio*
* Solvency ratio, % of technical provision, (IFRS) = + solvency capital+ liabilities for insurance and investment contracts- reinsurers’ share of insurance liabilities- 75% x technical provisions relating to Unit-linked insurance
x 100%
17.7%
21.3%20.1%
16.5%
7.9%
18.5%
25.8%
20.9%
27.7% 27.6%
22.9% 23.6%
0%
5%
10%
15%
20%
25%
30%
2004 2005 2006 2007 2008 2009 2010 2011 2012 2013 2014 2015
55
Appendix
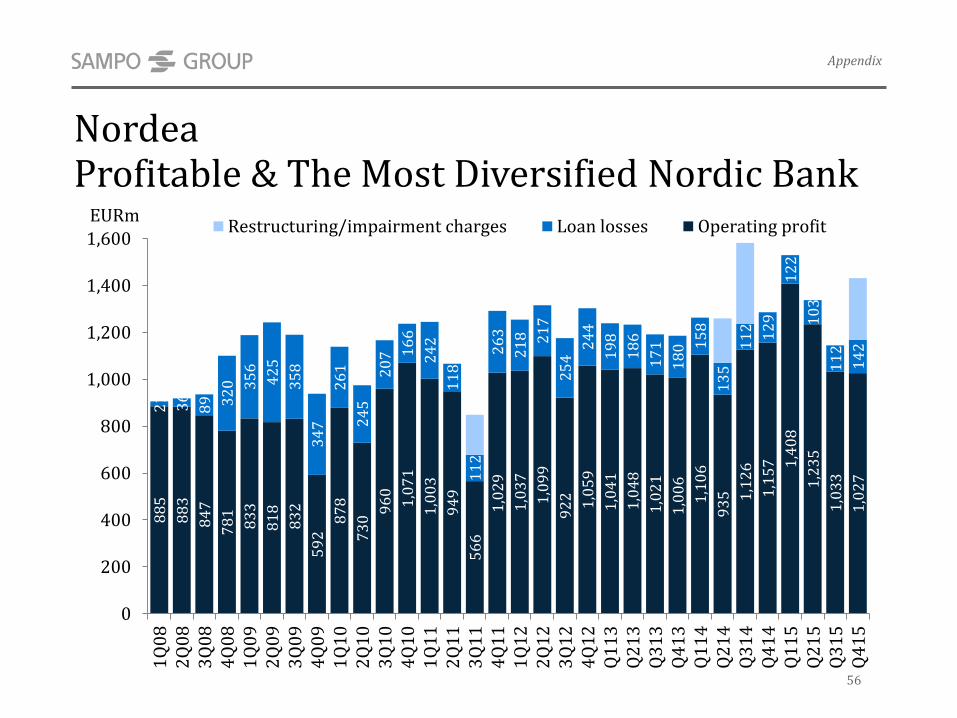
NordeaProfitable & The Most Diversified Nordic Bank
88
5
88
3
84
7
78
1
83
3
81
8
83
2
59
2
87
8
73
0
96
0
1,0
71
1,0
03
94
9
56
6
1,0
29
1,0
37
1,0
99
92
2 1,0
59
1,0
41
1,0
48
1,0
21
1,0
06
1,1
06
93
5 1,1
26
1,1
57 1
,40
8
1,2
35
1,0
33
1,0
27
21 36
89 3
20 3
56
42
5
35
8
34
7
26
1
24
5
20
7 16
6
24
2
11
8
11
2
26
3
21
8 21
7
25
4
24
4
19
8
18
6
17
1
18
0 15
8
13
5
11
2
12
9
12
2
10
3
11
2
14
2
0
200
400
600
800
1,000
1,200
1,400
1,600
1Q
08
2Q
08
3Q
08
4Q
08
1Q
09
2Q
09
3Q
09
4Q
09
1Q
10
2Q
10
3Q
10
4Q
10
1Q
11
2Q
11
3Q
11
4Q
11
1Q
12
2Q
12
3Q
12
4Q
12
Q1
13
Q2
13
Q3
13
Q4
13
Q1
14
Q2
14
Q3
14
Q4
14
Q1
15
Q2
15
Q3
15
Q4
15
EURmRestructuring/impairment charges Loan losses Operating profit
56
Appendix
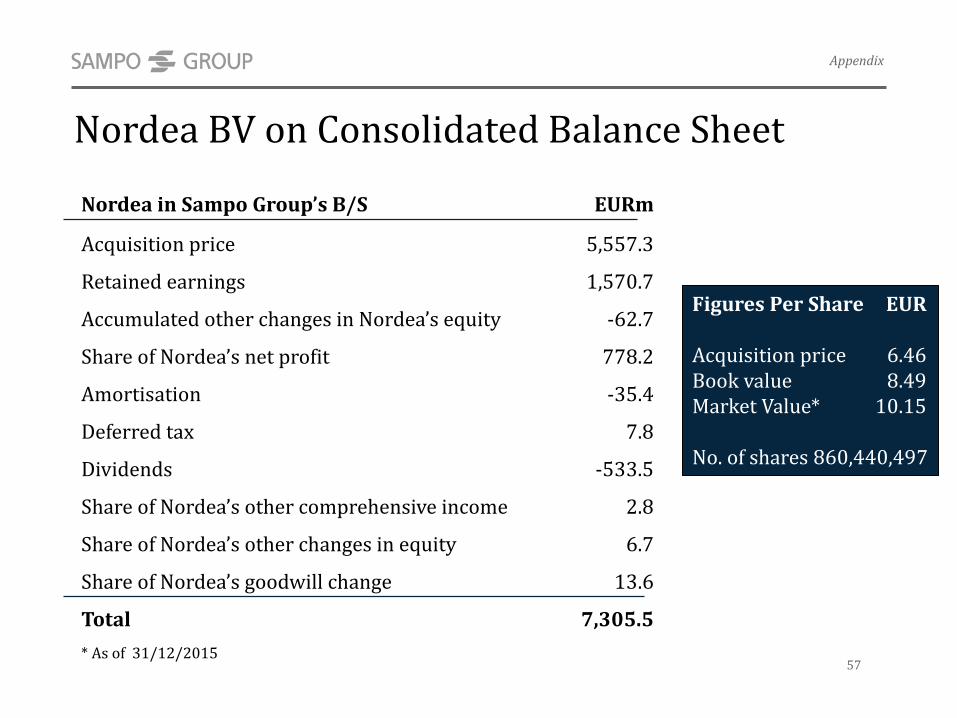
Nordea BV on Consolidated Balance Sheet
Figures Per Share EUR
Acquisition price 6.46Book value 8.49Market Value* 10.15
No. of shares 860,440,497
* As of 31/12/2015
Nordea in Sampo Group’s B/S EURm
Acquisition price 5,557.3
Retained earnings 1,570.7
Accumulated other changes in Nordea’s equity -62.7
Share of Nordea’s net profit 778.2
Amortisation -35.4
Deferred tax 7.8
Dividends -533.5
Share of Nordea’s other comprehensive income 2.8
Share of Nordea’s other changes in equity 6.7
Share of Nordea’s goodwill change 13.6
Total 7,305.5
Appendix
57