Embed Size (px)
Citation preview

LATVIJAS LAUKSAIMNIECĪBAS UNIVERSITĀTE
LATVIA UNIVERSITY OF AGRICULTURE
LATVIJAS VALSTS MEŽZINĀTNES INSTITŪTS „SILAVA”
LATVIA STATE FOREST RESEARCH INSTITUTE „SILAVA”
Mg.envir.sc. ENDIJS BĀDERS
SASALSTOŠA LIETUS UN VĒJA KĀ DABISKO TRAUCĒJUMU
IETEKME SKUJU KOKU AUDZĒS HEMIBOREĀLAJOS
MEŽOS LATVIJĀ
IMPACT OF FREEZING RAIN AND WIND AS NATURAL
DISTURBANCES ON CONIFEROUS HEMIBOREAL FORESTS
IN LATVIA
PROMOCIJAS DARBA KOPSAVILKUMS
Dr.silv. zinātniskā grāda iegūšanai
SUMMARY OF ACADEMIC DISSERTATION
for acquiring the Doctor’s degree of Forest sciences
JELGAVA 2016
2
Promocijas darba zinātniskais vadītājs: Āris Jansons
Supervisor: Dr. silv.
Promocijas darba zinātniskais konsultants: Jānis Donis
Scientific consultant: Mg. silv.
Darbs izstrādāts Latvijas Valsts mežzinātnes institūtā „Silava”.
Research has been carried out at Latvian State Forest Research Institute „Silava”.
Oficiālie recenzenti / Official reviewers:
Dr. silv. Inga Straupe, Latvijas Lauksaimniecības universitātes profesore/ Professor of
Latvia University of Agriculture;
Dr. silv. Tālis Gaitnieks, Latvijas Valsts mežzinātnes institūta „Silava” vadošais pētnieks/
Senior researcher of Latvian State Forest Research Institute "Silava";
Dr. Gediminas Brazaitis, Aleksandra Stulginska universitātes, profesors/ Professor of
Aleksandras Stulginskis University.
Pētījums izstrādāts Meža nozares kompetences centra (ERAF) projekta "Metodes un
tehnoloģijas meža kapitālvērtības palielināšanai" (L-KC-11-0004) un LVMI Silava
realizēta Eiropas Sociālā fonda projekta „Vitālu egļu audžu izaudzēšanas ekoloģiskie un
tehnoloģiskie aspekti” Nr. 2013/0022/1DP/1.1.1.2.0/13/APIA/VIAA/052 ietvaros. / The
study has been developed within the Forest Competence Centre’s (European Regional
Development Fund) project „Methods and technologies for increasing forest capital
value” (No L-KC-11-0004) and European Social Fund project „Management of vital
Norway spruce stands: ecological and technological aspects” (No.
2013/0022/1DP/1.1.1.2.0/13/APIA/VIAA/052).
Dati Slīteres nacionālā parka teritorijā ievākti ar Dabas aizsardzības pārvaldes atļauju. /
Data from the Slitere National Park has been collected with permission of the Nature
Conservation Agency.
Promocijas darba aizstāvēšana notiks LLU Mežzinātņu un Materiālzinātņu nozares
promocijas padomes atklātā sēdē 2016. gada 25. augustā plkst. 10:00 Jelgavā, Dobeles
ielā 41, Kokapstrādes katedras sēžu zālē / To be presented for public criticism in an open
session of the Promotion Council of Forest Sciences and Material Sciences of Latvia
University of Agriculture held on August 25th
, 2016 at 10:00 in Jelgava, Dobeles iela 41.
Ar promocijas darbu un kopsavilkumu var iepazīties LLU Fundamentālajā bibliotēkā / The
thesis is available at the Fundamental Library of LUA: Lielā iela 2, Jelgava vai/ or:
http://llufb.llu.lv/promoc_darbi.html.
Atsauksmes sūtīt promocijas padomes sekretārei Mg.silv. Sarmītei Berņikovai- Bondarei /
References are welcome to be sent to Mg.silv. Sarmītei. Berņikovai- Bondarei, the
Secretary of the Promotion Council: Dobeles iela 41, Jelgava, LV-3001, Latvija, vai / or:

3
SATURS / CONTENTS 1. DARBA VISPĀRĪGS RAKSTUROJUMS 4
1.1. Tēmas aktualitāte 4
1.2. Promocijas darba mērķis 4
1.3. Promocijas darba pētnieciskie uzdevumi 4
1.4. Promocijas darba tēzes 5
1.5. Zinātniskā novitāte 5
1.6. Praktiskā nozīme 5
1.7. Promocijas darba struktūra un apjoms 5
1.8. Zinātniskā darba aprobācija 6
2. MATERIĀLS UN METODES 8
3. REZULTĀTI UN DISKUSIJA 10
3.1. Sasalstoša lietus izraisīto bojājumu apjomu determinējošo koka un audzes
pazīmju novērtējums 10
3.2. Audzes atjaunošanās pēc intensīva dabiskā traucējuma 18
3.3. Ainavas ilgtermiņa dinamika pēc traucējuma 24
SECINĀJUMI 30
1. GENERAL DESCRIPTION 31
1.1. Topicality of the theme 31
1.2. Aim of the thesis 31
1.5. Scientific novelty 32
1.6. Practical significance 32
1.7. Structure and coverage of thesis 32
1.8. Approbation of research results 33
2. MATERIAL AND METHODS 33
3. RESULTS AND DISCUSSION 35
3.1. Assessment of tree and stand parameters that determine the extent of damage
caused by freezing rain 35
3.2. Stand regeneration after intense natural disturbance 38
3.3. Long-term dynamic of landscape after disturbance 41
CONCLUSIONS 43
4
1. DARBA VISPĀRĪGS RAKSTUROJUMS 1.1. Tēmas aktualitāte
Dabiskie traucējumi ietekmē gan atsevišķas mežaudzes, gan meža ainavas un to
turpmāko attīstību. Hemiboreālajos mežos nozīmīgākie dabiskie abiotiskie traucējumi ir
vētras (izraisot gan vējgāzes, gan vējlauzes) un ugunsgrēki, kā arī sniegs un sasalstošs
lietus (viens no atkalas veidiem). Šo traucējumu nozīme ir gan ekonomiska (piemēram,
samazinot koksnes vērtību, ietekmējot kāda reģiona koksnes resursu pieejamību, koksnes
cenu, reģiona piemērotību tūrismam), gan ekoloģiska (piemēram, samazinot vecu koku
īpatsvaru audzē vai meža ainavā, radot piemērotas dzīvotnes atsevišķām dzīvo organismu
sugām, izmainot atsevišķu sugu pārvietošanās iespējas ainavā).
Sasalstoša lietus biežums dažādos Latvijas reģionos nozīmīgi atšķiras, turklāt netiek
prognozēts, ka klimata izmaiņu ietekmē tas varētu mazināties vai arī varētu mainīties
reģioni ar dažādu tā iespējamību. Tādēļ būtiski novērtēt šīs meteoroloģiskās parādības
ietekmi uz kokaudzi un to determinējošos faktorus, rezultātā izstrādājot rekomendācijas
bojājumu mazināšanas pasākumiem, kā arī audžu apsekošanas prioritātēm varbūtējo
bojājumu savlaicīgai konstatācijai pēc sasalstoša lietus notikuma.
Pēdējās desmitgadēs novērota palielināta ciklonu aktivitāte, kas Eiropas ziemeļu
daļā saistīta ar biežākām stiprām vētrām. Tiek prognozēts, ka vētru radītie bojājumi
Eiropas mežos nākotnē pieaugs, kas saistīts ne tikai ar vētru biežuma vai stipruma
izmaiņām, bet arī ar klimata izmaiņu ietekmi, kuras dēļ vētras mežu biežāk skars
veģetācijas periodā, kā arī periodā ar nesasalušu augsni. Informācija par mežaudžu
atjaunošanos un augšanu ilgākā laika posmā pēc vētras teritorijā bez saimnieciskās
darbības ir būtiska, padziļinot un precizējot izpratni par dabisko sukcesiju hemiboreālajos
mežos. Tā izmantojama, izstrādājot meža apsaimniekošanas rekomendācijas specifiskām
situācijām un teritorijām, kurās darbības princips ir dabisko traucējumu imitācija, nolūkā
paaugstināt meža bioloģisko daudzveidību, kā arī novērtējot specifiskus šim mērķim
paredzētus pasākumus. Tāpat iegūtā informācija par kokaudžu sastāvu saimnieciskās
darbības neietekmētās audzēs ir būtiska, novērtējot oglekļa piesaisti mežos šādās teritorijās
kā daļu no Latvijas mežu kopējās oglekļa piesaistes valsts starptautisko saistību izpildes
ietvaros.
1.2. Promocijas darba mērķis
Promocijas darba mērķis ir raksturot vētras ilgtermiņa sekas saimnieciskās darbības
neietekmētās audzēs un meža ainavā, kā arī novērtēt kokaudzes noturību pret sasalstoša
lietus ietekmi determinējošos faktorus saimnieciskajos mežos.
1.3. Promocijas darba pētnieciskie uzdevumi: 1. novērtēt sasalstoša lietus bojājumus determinējošos rādītājus skujkoku audzēs,
2. raksturot pēc liela mēroga vējgāzes atjaunojušos kokaudžu struktūru un to
ietekmējošos faktorus,
3. novērtēt liela mēroga vējgāzes ilgtermiņa ietekmi uz meža ainavu.

5
1.4. Promocijas darba tēzes:
1. sasalstoša lietus bojājumu apjoms kokaudzē ir atkarīgs gan no tās individuālo,
gan kolektīvo noturību noteicošajiem parametriem,
2. egles atjaunošanās pēc liela mēroga vētras galvenokārt notiek ar paaugas kokiem,
pirmajā stāvā konstatējamas vairāku vecumklašu egles,
3. intensīva liela mēroga traucējuma ietekme uz meža ainavas telpiskajiem
indikatoriem saglabājas ilgāk nekā 20 gadus.
1.5. Zinātniskā novitāte
Pirmo reizi Latvijā veikta tik plaša meža atjaunošanās novērtēšana vētras nopostītās
platībās bez saimnieciskās darbības ietekmes tik ilgu laiku pēc šī dabiskā traucējuma (45
gadi); līdz šim hemiboreālajos mežos Eiropā bijuši tikai daži pētījumi par šo tēmu,
analizējot līdz 20 gadus ilgu periodu pēc vētras.
Pirmo reizi Latvijā veikta vētras ilgtermiņa ietekmes uz meža ainavas fragmentāciju
vērtēšana, radot pamatu turpmākiem pētījumiem par iespējamo dabisko traucējumu un to
dinamikas izmaiņu ietekmi uz bioloģisko daudzveidību.
Promocijas darbā veiktais novērtējums pirmo reizi tik plaši un detalizēti raksturo
sasalstoša lietus bojājumus skuju kokiem hemiboreālajos mežos Eiropā; līdzšinējie
pētījumi par tā ietekmi uz kokaudzēm veikti galvenokārt Ziemeļamerikā. Promocijas darba
ietvaros pirmo reizi izstrādāti šīs meteoroloģiskās parādības ietekmi uz audzes bojājumiem
raksturojoši vienādojumi.
1.6. Praktiskā nozīme
Promocijas darbā sagatavotie sasalstoša lietus ietekmi uz audzes bojājumiem
raksturojošie vienādojumi izmantojami, novērtējot audžu apsekošanas pēc šīs
meteoroloģiskās parādības nepieciešamību un prioritātes, nodrošinot iespējami ātru
bojājumu konstatāciju un koksnes savākšanu, gan iespējami maz zaudējot tās vērtību, gan
mazinot dendrofāgo kukaiņu savairošanās risku. Izpratne par vētras kā Latvijas teritorijā
nozīmīgākā dabiskā traucējuma ilgtermiņa ietekmi ne tikai uz konkrētu mežaudzi, bet uz
meža ainavu kopumā, izmantojama bioloģiskās daudzveidības aizsardzības plānu
(koncepciju) izstrādāšanai.
1.7. Promocijas darba struktūra un apjoms
Promocijas darba pirmajā nodaļā apkopotas līdzšinējo pētījumu atziņas par dabisko
traucējumu ietekmi uz mežaudzi. Pirmajā apakšnodaļā raksturoti sasalstoša lietus
veidošanos izraisošie klimatiskie un meteoroloģiskie faktori, aprakstīti apledojuma
novērojumi pasaulē, kā arī apkopoti pētījumu rezultāti par sasalstoša lietus un sniega
ietekmi uz kokaudzēm. Otrajā apakšnodaļā aprakstītas vētras izraisošās atmosfēras
parādības un apkopoti pētījumu rezultāti par mežaudzes un meža ainavas noturību pret vēja
bojājumiem saistībā ar bojājumu mērogu un augsnes apstākļiem, kā arī par audžu
atjaunošanos un palikušo koku reakciju pēc vētras. Otrajā nodaļā aprakstīts pētījuma
materiāls un metodika. Trešajā nodaļā analizēti pētījuma rezultāti. Pirmajā apakšnodaļā
novērtētas sasalstoša lietus izraisīto bojājumu apjomu determinējošās koka individuālās un

6
mežaudzi raksturojošās pazīmes. Otrajā apakšnodaļā analizēta audzes atjaunošanās pēc
intensīva dabiskā traucējuma – vētras, bet trešajā apakšnodaļā raksturotas meža ainavas
telpiskās struktūras indikatoru izmaiņas pēc šī traucējuma.
Promocijas darbam ir 132 lappuses, informācija apkopota 19 tabulās un 87 attēlos,
izmantoti 229 literatūras avoti.
1.8. Zinātniskā darba aprobācija
Pētījuma rezultāti apkopoti četrās publikācijās:
1. Bāders, E., Puriņa, L., Lībiete, Z., Nartišs, M., un Jansons, Ā., 2014.
Fragmentācijas ilgtermiņa dinamika meža ainavā bez cilvēka saimnieciskās
darbības ietekmes. Mežzinātne 28, 91-107. (AGRIS; CAB ABSTRACTS)
2. Baders E., Jansons A., Jogiste K., Polyachenko O., Kiviste A. Stand structure 40
years after the major storm in two different site types of spruce hemi-boreal forests
in Slitere Natural Park, Latvia. Iesniegts žurnālā Forest Ecology and Management.
3. Baders E., Senhofa S., Libiete Z., Purina L., Jansons A. Natural succession of
Norway spruce stands in hemiboreal forests: case study in Slitere national park,
Latvia. Akceptēts publicēšanai žurnālā Baltic Forestry.
4. Bāders E., Adamovičs A., Puriņš M., Džeriņa B., Tree damages by icing in Scots
pine stands and factors affecting them. Akceptēts publicēšanai konferences
„Research for Rural Development 2016” zinātnisko rakstu krājumā.
Pētījuma rezultāti prezentēti 12 zinātniskajās konferencēs:
1. 11-12.11.2013. Zviedrijas Lauksaimniecības universitāte, Upsala, Zviedrija,
Referāts:
Jansons A., Baders E., Rieksts-Riekstins J., Neimane U. (2013). Ice Damages of
Coniferous Trees in Hemiboreal Forests in Context of Climatic Changes: a Case
Study in Latvia. In: International scientific conference: Climate change and
forestry in northern Europe. Book of abstracts of international scientific
conference, 11 to 12 November, Uppsala, Sweden. SLU, p. 27.
2. 16.–19.06.2014. Šveices Federālais pētniecības institūts WSL, Birmensdorfa,
Šveice, Stenda referāts:
Jansons A., Baders E., Jõgiste K., Donis J., Dzerina B. (2014). Towards mimicking
natural disturbances in hemiboreal forest management: case study in Slitere
National Park, Latvia. In: The 9th IUFRO International Conference on Uneven-
Aged Silviculture: Future Concepts in Uneven-Aged Silviculture for a Changing
World. International Conference Book of Abstracts, 16 to 19 June 2014,
Birmensdorf, Swiss. Federal Research Institute WSL, p. 53.
3. 11.-14.08.2014, Igaunijas Dzīvības zinātņu universitāte, Tartu, Igaunija. Referāts:
Baders E., Jõgiste K., Taukacs K., Donis J., Jansons A. (2014). Long-term impact
of wind storm on stand composition in hemiboreal forests: case study in Slitere
National Park, Latvia. In: Forest landscape mosaics: disturbance, restoration and
management at times of global change. International Conference Book of Abstracts,
11 to 14 August 2014, Tartu, Estonia. Transactions of the Institute of Forestry and
Rural Engineering, Estonian University of Life Sciences, p. 19.
7
4. 11.-14.08.2014, Igaunijas Dzīvības zinātņu universitāte, Tartu, Igaunija. Referāts:
Jansons A, Baders E., Rieksts-Riekstins J., Jansons J. (2014). Ice damages of
coniferous trees in hemiboreal forests: case study in Latvia. In: Forest landscape
mosaics: disturbance, restoration and management at times of global change.
International Conference Book of Abstracts, 11 to 14 August 2014, Tartu, Estonia.
Transactions of the Institute of Forestry and Rural Engineering, Estonian University
of Life Sciences, p. 40.
5. 15.10.2014., Daugavpils universitāte, Daugavpils, Latvija. Referāts:
Baders E., Libiete Z., Jansons A, Nartiss M. (2014). Long-term natural
fragmentation dynamics in semi-natural forest massif. In: Special session of 9th
Baltic Theriological Conference: Forest ecosystem and its management: towards
understanding the complexity. International Conference Book of Abstracts, 15.
October 2014, Ilgas, Daugavpils, Latvia. University of Daugavpils, p. 21.
6. 23-24.04.2015, Rīga, Latvija, Stenda referāts.
Aris Jansons, Endijs Baders, Mara Zadina (2015). Building-up understanding of
long term natural dynamics in forest landscape: cases studies from Slitere National
park, Latvia. In: Adaptation and mitigation: strategies for management of forest
ecosystms. International Conference Book of Abstract, 23 to 24 April 2015,
Salaspils, Latvia. LSFRI Silava, p. 39.
7. 16-18.06.2015. Latvijas Universitāte Riga, Latvia. Referāts:
Baders E., Taukacs K., Dzerina B., Jansons A. (2015). Characteristics of un-
managed Norway spruce stands in windthrow area in Slitere national park, Latvia.
In: 25th NJF congress: Nordic view to sustainable rural development. Proceedings
of the 25th NJF Congress, 16 to 18 June 2015, Riga, Latvia. Latvian National
Association of NJF, p.402.
8. 22.-28.08.2015, Igaunijas Dzīvības zinātņu universitāte, Tartu, Igaunija. Referāts:
Baders E., Jansons A., Taukacs K., Pobiarzens A., Katrevics J. (2015). The
structure of semi-natural un-even aged Norway spruce stands in hemiboreal zone: A
case study in windthrow area in Slitere National Park, Latvia. In: IUFRO
Landscape Ecology Conference: Sustaining ecosystem services in forest
landscapes. International Conference Book of Abstracts, 22 to 28 August 2015,
Tartu, Estonia. Estonian University of Life Sciences, p. 33.
9. 3.-5.11.2015, Kopenhāgenas universitāte, Kopenhāgena, Dānija. Stenda referāts:
Baders, E., Purina, L., Libiete, Z., Lazdina, D., Jansons, A. (2015). Wind and
Freezing Rain Damages in Forest – Impact on Fragmentation Dynamics: Case
Studies in Latvia. In: Centre of Advanced Research on Environmental Services from
Nordic Forest Ecosystems Conference: Managing Forests to Promote
Environmental Services: Climate change adaptation and mitigation, water
protection, biodiversity conservation, and soil quality maintenance. International
Conference Book of Abstracts, 3 to 5 November 2015, Copenhagen. University of
Copenhagen, p. 53.
10. 4-6.11.2015. a/s Latvijas valsts meži, Rīga, Latvija, Referāts:
Baders E., Donis J., Krisans O., Adamovics A., Jansons A. (2015). Impact on
Freezing Rain on Forest Stands: a Case Study in Eastern Part of Latvia. In:

8
Scientific Conference of the Forest Sector: Knowledge based forest sector.
International Conference Book of Abstracts, 4 to 6 November 2015, Riga, Latvia.
LSFRI Silava, p. 70.
11. 4-6.11.2015. a/s Latvijas valsts meži, Rīga, Latvija, Stenda referāts:
Baders E, Jogiste K., Adamovics A., Jansons A., (2015). Posts-storm Regeneration
and Stand Structure of Norway Spruce (Picea Abies (L.) Karst.) in Oxalidosa Forest
Type. In: Scientific Conference of the Forest Sector: Knowledge based forest
sector. International Conference Book of Abstracts, 4 to 6 November 2015, Riga,
Latvia. LSFRI Silava, p. 91.
12. 4-6.11.2015. a/s Latvijas valsts meži, Rīga, Latvija, Stenda referāts:
Baders E., Purina L., Libiete Z., Jansons A. (2015). Impact of Wind and Freezing
Rain Damages on Fragmentation Dynamics of Forest Landscape: Case Studies in
Latvia. In: Scientific Conference of the Forest Sector: Knowledge based forest
sector. International Conference Book of Abstracts, 4 to 6 November 2015, Riga,
Latvia. LSFRI Silava, p. 96.
2. MATERIĀLS UN METODES Dabiskie traucējumi ir jebkāda veida ārēji procesi vai apstākļi, kas izraisa pēkšņu
augu biomasas bojāeju ievērojami īsākā laika posmā nekā jaunas biomasas veidošanās.
Šajā pētījumā katrs dabiskais traucējums vērtēts tajā Latvijas reģionā, kur, kā liecina
pēdējo 50 gadu meteoroloģisko novērojumu dati (LVĢMC), tas sastopams visbiežāk.
Atkala ir meteoroloģiska parādība, kad ledus un sniegs uzkrājas uz atmosfērā
eksponēta objekta virsmas (ISO‐12494). Atkalas veidošanās parasti ir saistīta ar salīdzinoši
specifiskiem atmosfēras apstākļiem, un tā veidošanās norit ne tikai miglai nosēžoties, bet
arī lietus laikā gaisa temperatūrai strauji pazeminoties zem 0°C (Zirnītis, 1968; Ahrens,
2007). Sasalstošs lietus veidojas krasi atšķirīgas temperatūras gaisa masu saskares joslā: no
augstāk esošā siltā slāņa izkritušie lietus nokrišņi, krītot cauri noteikta biezuma aukstajam
slānim, formē sīkas ledus lodītes, kuru centrā ir nesasalis ūdens. Tām atsitoties pret cietu
virsmu un sašķīstot, veidojas apledojums (Fikke et al., 2005). Tā kā darbā tiks analizēti
tikai sasalstoša lietus parādības izraisītie mežaudžu bojājumi, bet citi nokrišņu veidi, kas
ietver pēc ģenēzes atšķirīgas meteoroloģiskās parādības, darbā netiks skatīti, termins
„atkala” netiks lietots.
Sasalstoša lietus ietekmi determinējošo faktoru vērtēšanai dati ievākti skuju koku
mežaudzēs, kuras šis dabiskais traucējums skāris 2012. gada decembrī: a/s „Latvijas valsts
meži” Ziemeļlatgales mežsaimniecības meža masīvos Rēzeknes, Baltinavas, Balvu un
Kārsavas novadā.
Izlozēto skujkoku audžu (taksācijas aprakstā sastāva formulā sugas koeficients 7
līdz 10) vecums priedei bija no 12 līdz 123 gadiem, eglei – no 20 līdz 123 gadiem.
Nogabali atradās 12 meža tipos: silā, mētrājā, lānā, damaksnī, vērī, slapjajā mētrājā,
slapjajā damaksnī, slapjajā vērī, niedrājā, šaurlapju ārenī, šaurlapju kūdrenī, platlapju
kūdrenī. Kopumā 163 nogabalos (platība ≥0.8 ha) – 98 priedes audzēs, 51 egles audzē un
14 skujkoku mistraudzēs (kopsavilkumā nav analizētas) – sistemātiski izvietoti vidēji
9
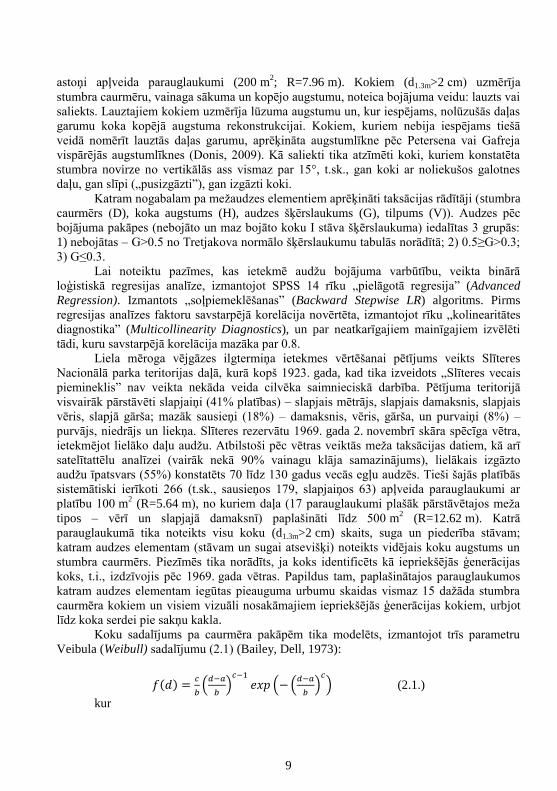
astoņi apļveida parauglaukumi (200 m2; R=7.96 m). Kokiem (d1.3m>2 cm) uzmērīja
stumbra caurmēru, vainaga sākuma un kopējo augstumu, noteica bojājuma veidu: lauzts vai
saliekts. Lauztajiem kokiem uzmērīja lūzuma augstumu un, kur iespējams, nolūzušās daļas
garumu koka kopējā augstuma rekonstrukcijai. Kokiem, kuriem nebija iespējams tiešā
veidā nomērīt lauztās daļas garumu, aprēķināta augstumlīkne pēc Petersena vai Gafreja
vispārējās augstumlīknes (Donis, 2009). Kā saliekti tika atzīmēti koki, kuriem konstatēta
stumbra novirze no vertikālās ass vismaz par 15°, t.sk., gan koki ar noliekušos galotnes
daļu, gan slīpi („pusizgāzti”), gan izgāzti koki.
Katram nogabalam pa mežaudzes elementiem aprēķināti taksācijas rādītāji (stumbra
caurmērs (D), koka augstums (H), audzes šķērslaukums (G), tilpums (V)). Audzes pēc
bojājuma pakāpes (nebojāto un maz bojāto koku I stāva šķērslaukuma) iedalītas 3 grupās:
1) nebojātas – G>0.5 no Tretjakova normālo šķērslaukumu tabulās norādītā; 2) 0.5≥G>0.3;
3) G≤0.3.
Lai noteiktu pazīmes, kas ietekmē audžu bojājuma varbūtību, veikta binārā
loģistiskā regresijas analīze, izmantojot SPSS 14 rīku „pielāgotā regresija” (Advanced
Regression). Izmantots „soļpiemeklēšanas” (Backward Stepwise LR) algoritms. Pirms
regresijas analīzes faktoru savstarpējā korelācija novērtēta, izmantojot rīku „kolinearitātes
diagnostika” (Multicollinearity Diagnostics), un par neatkarīgajiem mainīgajiem izvēlēti
tādi, kuru savstarpējā korelācija mazāka par 0.8.
Liela mēroga vējgāzes ilgtermiņa ietekmes vērtēšanai pētījums veikts Slīteres
Nacionālā parka teritorijas daļā, kurā kopš 1923. gada, kad tika izveidots „Slīteres vecais
piemineklis” nav veikta nekāda veida cilvēka saimnieciskā darbība. Pētījuma teritorijā
visvairāk pārstāvēti slapjaiņi (41% platības) – slapjais mētrājs, slapjais damaksnis, slapjais
vēris, slapjā gārša; mazāk sausieņi (18%) – damaksnis, vēris, gārša, un purvaiņi (8%) –
purvājs, niedrājs un liekņa. Slīteres rezervātu 1969. gada 2. novembrī skāra spēcīga vētra,
ietekmējot lielāko daļu audžu. Atbilstoši pēc vētras veiktās meža taksācijas datiem, kā arī
satelītattēlu analīzei (vairāk nekā 90% vainagu klāja samazinājums), lielākais izgāzto
audžu īpatsvars (55%) konstatēts 70 līdz 130 gadus vecās egļu audzēs. Tieši šajās platībās
sistemātiski ierīkoti 266 (t.sk., sausieņos 179, slapjaiņos 63) apļveida parauglaukumi ar
platību 100 m2 (R=5.64 m), no kuriem daļa (17 parauglaukumi plašāk pārstāvētajos meža
tipos – vērī un slapjajā damaksnī) paplašināti līdz 500 m2 (R=12.62 m). Katrā
parauglaukumā tika noteikts visu koku (d1.3m>2 cm) skaits, suga un piederība stāvam;
katram audzes elementam (stāvam un sugai atsevišķi) noteikts vidējais koku augstums un
stumbra caurmērs. Piezīmēs tika norādīts, ja koks identificēts kā iepriekšējās ģenerācijas
koks, t.i., izdzīvojis pēc 1969. gada vētras. Papildus tam, paplašinātajos parauglaukumos
katram audzes elementam iegūtas pieauguma urbumu skaidas vismaz 15 dažāda stumbra
caurmēra kokiem un visiem vizuāli nosakāmajiem iepriekšējās ģenerācijas kokiem, urbjot
līdz koka serdei pie sakņu kakla.
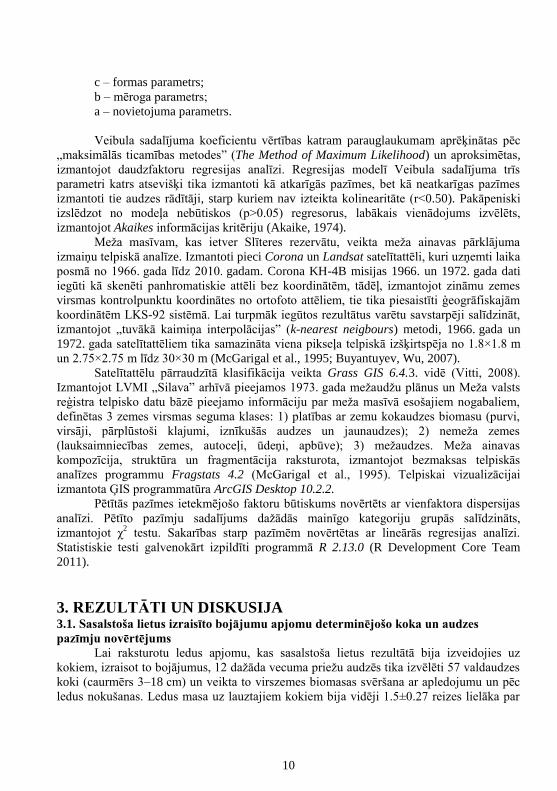
Koku sadalījums pa caurmēra pakāpēm tika modelēts, izmantojot trīs parametru
Veibula (Weibull) sadalījumu (2.1) (Bailey, Dell, 1973):
𝑓(𝑑) =𝑐
𝑏(
𝑑−𝑎
𝑏)
𝑐−1
𝑒𝑥𝑝 (− (𝑑−𝑎
𝑏)
𝑐
) (2.1.)
kur
10
c – formas parametrs;
b – mēroga parametrs;
a – novietojuma parametrs.
Veibula sadalījuma koeficientu vērtības katram parauglaukumam aprēķinātas pēc
„maksimālās ticamības metodes” (The Method of Maximum Likelihood) un aproksimētas,
izmantojot daudzfaktoru regresijas analīzi. Regresijas modelī Veibula sadalījuma trīs
parametri katrs atsevišķi tika izmantoti kā atkarīgās pazīmes, bet kā neatkarīgas pazīmes
izmantoti tie audzes rādītāji, starp kuriem nav izteikta kolinearitāte (r<0.50). Pakāpeniski
izslēdzot no modeļa nebūtiskos (p>0.05) regresorus, labākais vienādojums izvēlēts,
izmantojot Akaikes informācijas kritēriju (Akaike, 1974).
Meža masīvam, kas ietver Slīteres rezervātu, veikta meža ainavas pārklājuma
izmaiņu telpiskā analīze. Izmantoti pieci Corona un Landsat satelītattēli, kuri uzņemti laika
posmā no 1966. gada līdz 2010. gadam. Corona KH-4B misijas 1966. un 1972. gada dati
iegūti kā skenēti panhromatiskie attēli bez koordinātēm, tādēļ, izmantojot zināmu zemes
virsmas kontrolpunktu koordinātes no ortofoto attēliem, tie tika piesaistīti ģeogrāfiskajām
koordinātēm LKS-92 sistēmā. Lai turpmāk iegūtos rezultātus varētu savstarpēji salīdzināt,
izmantojot „tuvākā kaimiņa interpolācijas” (k-nearest neigbours) metodi, 1966. gada un
1972. gada satelītattēliem tika samazināta viena pikseļa telpiskā izšķirtspēja no 1.8×1.8 m
un 2.75×2.75 m līdz 30×30 m (McGarigal et al., 1995; Buyantuyev, Wu, 2007).
Satelītattēlu pārraudzītā klasifikācija veikta Grass GIS 6.4.3. vidē (Vitti, 2008).
Izmantojot LVMI „Silava” arhīvā pieejamos 1973. gada mežaudžu plānus un Meža valsts
reģistra telpisko datu bāzē pieejamo informāciju par meža masīvā esošajiem nogabaliem,
definētas 3 zemes virsmas seguma klases: 1) platības ar zemu kokaudzes biomasu (purvi,
virsāji, pārplūstoši klajumi, iznīkušās audzes un jaunaudzes); 2) nemeža zemes
(lauksaimniecības zemes, autoceļi, ūdeņi, apbūve); 3) mežaudzes. Meža ainavas
kompozīcija, struktūra un fragmentācija raksturota, izmantojot bezmaksas telpiskās
analīzes programmu Fragstats 4.2 (McGarigal et al., 1995). Telpiskai vizualizācijai
izmantota ĢIS programmatūra ArcGIS Desktop 10.2.2.
Pētītās pazīmes ietekmējošo faktoru būtiskums novērtēts ar vienfaktora dispersijas
analīzi. Pētīto pazīmju sadalījums dažādās mainīgo kategoriju grupās salīdzināts,
izmantojot χ2 testu. Sakarības starp pazīmēm novērtētas ar lineārās regresijas analīzi.
Statistiskie testi galvenokārt izpildīti programmā R 2.13.0 (R Development Core Team
2011).
3. REZULTĀTI UN DISKUSIJA
3.1. Sasalstoša lietus izraisīto bojājumu apjomu determinējošo koka un audzes
pazīmju novērtējums
Lai raksturotu ledus apjomu, kas sasalstoša lietus rezultātā bija izveidojies uz
kokiem, izraisot to bojājumus, 12 dažāda vecuma priežu audzēs tika izvēlēti 57 valdaudzes
koki (caurmērs 3–18 cm) un veikta to virszemes biomasas svēršana ar apledojumu un pēc
ledus nokušanas. Ledus masa uz lauztajiem kokiem bija vidēji 1.5±0.27 reizes lielāka par
11
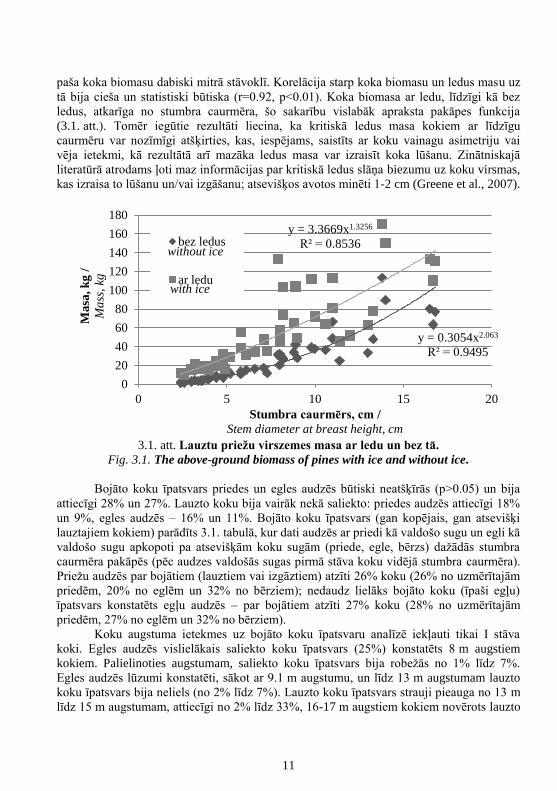
paša koka biomasu dabiski mitrā stāvoklī. Korelācija starp koka biomasu un ledus masu uz
tā bija cieša un statistiski būtiska (r=0.92, p<0.01). Koka biomasa ar ledu, līdzīgi kā bez
ledus, atkarīga no stumbra caurmēra, šo sakarību vislabāk apraksta pakāpes funkcija
(3.1. att.). Tomēr iegūtie rezultāti liecina, ka kritiskā ledus masa kokiem ar līdzīgu
caurmēru var nozīmīgi atšķirties, kas, iespējams, saistīts ar koku vainagu asimetriju vai
vēja ietekmi, kā rezultātā arī mazāka ledus masa var izraisīt koka lūšanu. Zinātniskajā
literatūrā atrodams ļoti maz informācijas par kritiskā ledus slāņa biezumu uz koku virsmas,
kas izraisa to lūšanu un/vai izgāšanu; atsevišķos avotos minēti 1-2 cm (Greene et al., 2007).
3.1. att. Lauztu priežu virszemes masa ar ledu un bez tā.
Fig. 3.1. The above-ground biomass of pines with ice and without ice.
Bojāto koku īpatsvars priedes un egles audzēs būtiski neatšķīrās (p>0.05) un bija
attiecīgi 28% un 27%. Lauzto koku bija vairāk nekā saliekto: priedes audzēs attiecīgi 18%
un 9%, egles audzēs – 16% un 11%. Bojāto koku īpatsvars (gan kopējais, gan atsevišķi
lauztajiem kokiem) parādīts 3.1. tabulā, kur dati audzēs ar priedi kā valdošo sugu un egli kā
valdošo sugu apkopoti pa atsevišķām koku sugām (priede, egle, bērzs) dažādās stumbra
caurmēra pakāpēs (pēc audzes valdošās sugas pirmā stāva koku vidējā stumbra caurmēra).
Priežu audzēs par bojātiem (lauztiem vai izgāztiem) atzīti 26% koku (26% no uzmērītajām
priedēm, 20% no eglēm un 32% no bērziem); nedaudz lielāks bojāto koku (īpaši egļu)
īpatsvars konstatēts egļu audzēs – par bojātiem atzīti 27% koku (28% no uzmērītajām
priedēm, 27% no eglēm un 32% no bērziem).
Koku augstuma ietekmes uz bojāto koku īpatsvaru analīzē iekļauti tikai I stāva
koki. Egles audzēs vislielākais saliekto koku īpatsvars (25%) konstatēts 8 m augstiem
kokiem. Palielinoties augstumam, saliekto koku īpatsvars bija robežās no 1% līdz 7%.
Egles audzēs lūzumi konstatēti, sākot ar 9.1 m augstumu, un līdz 13 m augstumam lauzto
koku īpatsvars bija neliels (no 2% līdz 7%). Lauzto koku īpatsvars strauji pieauga no 13 m
līdz 15 m augstumam, attiecīgi no 2% līdz 33%, 16-17 m augstiem kokiem novērots lauzto
y = 0.3054x2.063
R² = 0.9495
y = 3.3669x1.3256
R² = 0.8536
0
20
40
60
80
100
120
140
160
180
0 5 10 15 20
Ma
sa, k
g /
Ma
ss, kg
Stumbra caurmērs, cm /
Stem diameter at breast height, cm
bez ledus
ar ledu
without ice
with ice
12
koku īpatsvara kritums līdz aptuveni 20%. Vislielākais kopējais bojāto koku īpatsvars
(41%) egles audzēs konstatēts 18 m augstiem kokiem, bet augstākiem kokiem bojāto koku
īpatsvars samazinājās. Bojājuma ietekmes uz sortimentu iznākumu noteikšanai nozīmīgi
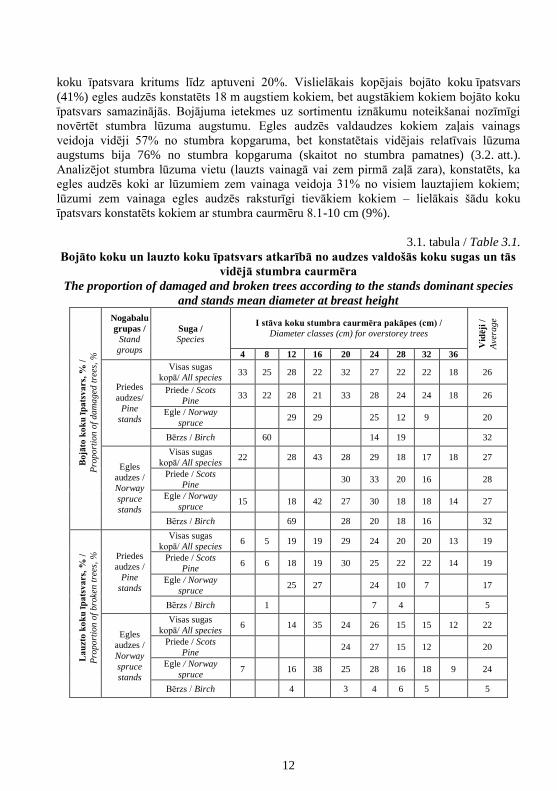
novērtēt stumbra lūzuma augstumu. Egles audzēs valdaudzes kokiem zaļais vainags
veidoja vidēji 57% no stumbra kopgaruma, bet konstatētais vidējais relatīvais lūzuma
augstums bija 76% no stumbra kopgaruma (skaitot no stumbra pamatnes) (3.2. att.).
Analizējot stumbra lūzuma vietu (lauzts vainagā vai zem pirmā zaļā zara), konstatēts, ka
egles audzēs koki ar lūzumiem zem vainaga veidoja 31% no visiem lauztajiem kokiem;
lūzumi zem vainaga egles audzēs raksturīgi tievākiem kokiem – lielākais šādu koku
īpatsvars konstatēts kokiem ar stumbra caurmēru 8.1-10 cm (9%).
3.1. tabula / Table 3.1.
Bojāto koku un lauzto koku īpatsvars atkarībā no audzes valdošās koku sugas un tās
vidējā stumbra caurmēra
The proportion of damaged and broken trees according to the stands dominant species
and stands mean diameter at breast height
Bojā
to k
ok
u ī
pa
tsv
ars,
% /
Pro
po
rtio
n o
f d
am
ag
ed t
rees
, %
Nogabalu
grupas /
Stand
groups
Suga /
Species
I stāva koku stumbra caurmēra pakāpes (cm) /
Diameter classes (cm) for overstorey trees
Vid
ēji
/
Ave
rag
e
4 8 12 16 20 24 28 32 36
Priedes
audzes/
Pine
stands
Visas sugas
kopā/ All species 33 25 28 22 32 27 22 22 18 26
Priede / Scots
Pine 33 22 28 21 33 28 24 24 18 26
Egle / Norway
spruce 29 29
25 12 9
20
Bērzs / Birch
60
14 19
32
Egles
audzes /
Norway
spruce
stands
Visas sugas
kopā/ All species 22
28 43 28 29 18 17 18 27
Priede / Scots
Pine 30 33 20 16
28
Egle / Norway
spruce 15
18 42 27 30 18 18 14 27
Bērzs / Birch
69
28 20 18 16
32
La
uzto
ko
ku
īp
ats
vars,
% /
Pro
po
rtio
n o
f bro
ken t
rees
, %
Priedes
audzes /
Pine
stands
Visas sugas
kopā/ All species 6 5 19 19 29 24 20 20 13 19
Priede / Scots
Pine 6 6 18 19 30 25 22 22 14 19
Egle / Norway
spruce 25 27 24 10 7 17
Bērzs / Birch 1 7 4 5
Egles
audzes /
Norway
spruce
stands
Visas sugas
kopā/ All species 6 14 35 24 26 15 15 12 22
Priede / Scots
Pine 24 27 15 12 20
Egle / Norway
spruce 7 16 38 25 28 16 18 9 24
Bērzs / Birch 4 3 4 6 5 5
13
Koku īpatsvars ar lūzumiem zem koka vainaga samazinājās kokiem ar stumbra
caurmēru no 10.1 cm līdz 36 cm. Lūzumi zaļajā vainagā, palielinoties stumbra caurmēram,
pakāpeniski pieauga, sasniedzot 21% kokiem ar stumbra caurmēru no 22.1 cm līdz 24 cm,
un pēc tam samazinājās.
3.2. att. Egļu vidējais koka augstums, vainaga un lūzuma vietas augstums
atkarībā no stumbra caurmēra
Fig. 3.2. The mean height, crown-base height and breakage height of Norway
sprucess according to stem diameter at breast height.
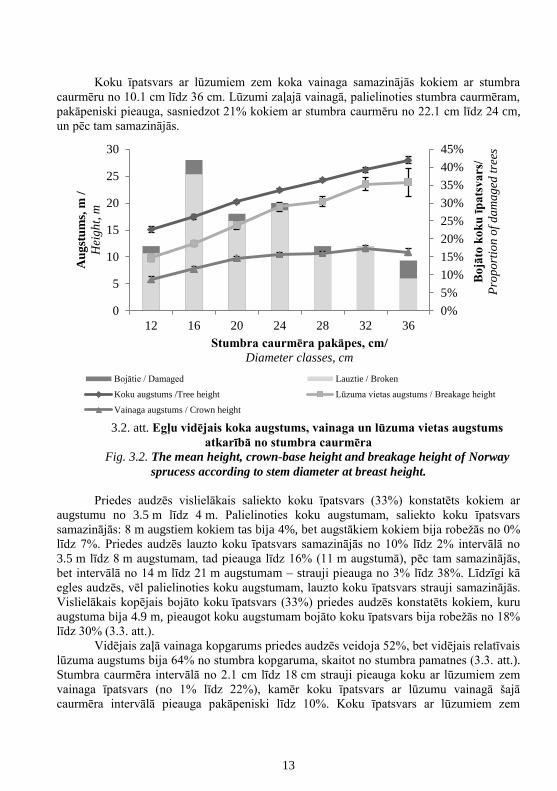
Priedes audzēs vislielākais saliekto koku īpatsvars (33%) konstatēts kokiem ar
augstumu no 3.5 m līdz 4 m. Palielinoties koku augstumam, saliekto koku īpatsvars
samazinājās: 8 m augstiem kokiem tas bija 4%, bet augstākiem kokiem bija robežās no 0%
līdz 7%. Priedes audzēs lauzto koku īpatsvars samazinājās no 10% līdz 2% intervālā no
3.5 m līdz 8 m augstumam, tad pieauga līdz 16% (11 m augstumā), pēc tam samazinājās,
bet intervālā no 14 m līdz 21 m augstumam – strauji pieauga no 3% līdz 38%. Līdzīgi kā
egles audzēs, vēl palielinoties koku augstumam, lauzto koku īpatsvars strauji samazinājās.
Vislielākais kopējais bojāto koku īpatsvars (33%) priedes audzēs konstatēts kokiem, kuru
augstuma bija 4.9 m, pieaugot koku augstumam bojāto koku īpatsvars bija robežās no 18%
līdz 30% (3.3. att.).
Vidējais zaļā vainaga kopgarums priedes audzēs veidoja 52%, bet vidējais relatīvais
lūzuma augstums bija 64% no stumbra kopgaruma, skaitot no stumbra pamatnes (3.3. att.).
Stumbra caurmēra intervālā no 2.1 cm līdz 18 cm strauji pieauga koku ar lūzumiem zem
vainaga īpatsvars (no 1% līdz 22%), kamēr koku īpatsvars ar lūzumu vainagā šajā
caurmēra intervālā pieauga pakāpeniski līdz 10%. Koku īpatsvars ar lūzumiem zem
0%
5%
10%
15%
20%
25%
30%
35%
40%
45%
0
5
10
15
20
25
30
12 16 20 24 28 32 36
Bo
jāto
ko
ku
īp
ats
va
rs/
Pro
po
rtio
n o
f d
am
ag
ed t
rees
Au
gst
um
s, m
/
Hei
gh
t, m
Stumbra caurmēra pakāpes, cm/
Diameter classes, cm
Bojātie / Damaged Lauztie / Broken
Koku augstums /Tree height Lūzuma vietas augstums / Breakage height
Vainaga augstums / Crown height
14
vainaga caurmēra intervālā no 16.1 cm līdz 24 cm bija robežās no 20% līdz 22%, savukārt,
stumbra caurmēram palielinoties, šādu bojājumu īpatsvars strauji saruka un kokiem ar
stumbra caurmēru virs 42 cm, koku ar lūzumiem zem vainaga nebija. Lūzumi zaļajā
vainagā no caurmēra intervālā no 18.1 cm līdz 28 cm palielinājās no 9% līdz 16%, bet,
caurmēram vēl palielinoties, vainagā lauzto koku īpatsvars saruka. Lauzto koku īpatsvara
pieauguma tendence lūzumiem vainagā un zem tā izmainījās caurmēra intervālā no
18.1 cm līdz 20 cm – sākot ar caurmēra pakāpi 24 cm, lūzumi vainagā, nevis zem tā
veidoja lielāku daļu no visiem lūzumiem. Salīdzinot lūzumus dažādās priedes stumbra
daļās, konstatēts, ka lūzumi zem vainaga vairāk raksturīgi salīdzinoši tievākiem kokiem,
kamēr lūzumi vainagā biežāk konstatēti resnākiem kokiem.
3.3. att. Priežu vidējais koka augstums, vainaga un lūzuma vietas augstums
atkarībā no stumbra caurmēra.
Fig. 3.3. The mean height, crown-base height and breakage height of Scots pines
according to stem diameter at breast height.
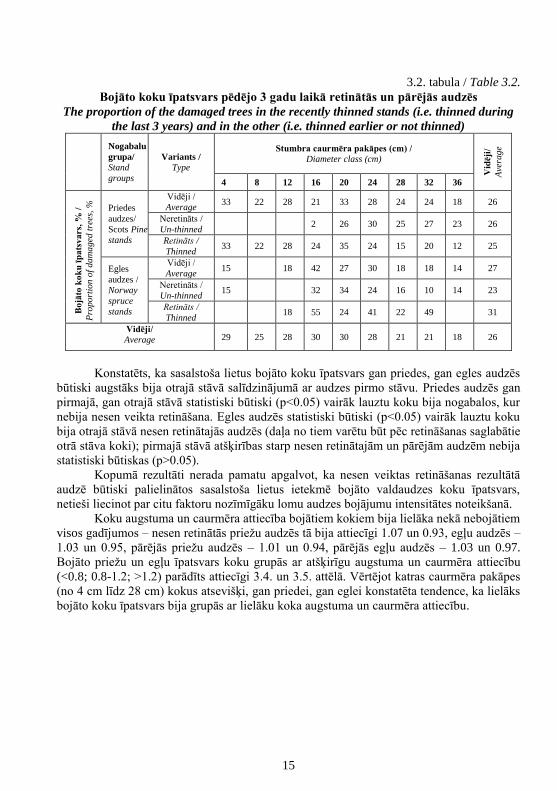
Analizējot retināšanas iespējamo ietekmi uz bojājumu apjomu, audžu kopa sadalīta
divās grupās – nesen (pēdējo trīs gadu laikā pirms sasalstošā lietus bojājumiem) retinātas
un pārējās audzes; izmantoti valdaudzes koku dati. Pēdējo trīs gadu laikā retinātās priežu
audzēs bojāto koku (lauztie un izgāztie kopā) īpatsvars bija 25%, bet pārējās audzēs – 26%;
egļu audzēs – 31% bojātu koku retinātās un 23% pārējās audzēs (3.2. tab.).
0%
5%
10%
15%
20%
25%
30%
35%
0
5
10
15
20
25
30
35
4 8 12 16 20 24 28 32 36Stumbra caurmēra pakāpes, cm /
Diameter classes, cm B
ojā
to k
ok
u ī
pa
tsva
rs /
Pro
po
rtio
n o
f d
am
ag
ed t
rees
Au
gst
um
s, m
/
Hei
gh
t, m
Bojātie / Damaged Lauztie / Broken
Koku augstums /Tree height Lūzuma vietas augstums / Breakage height
Vainaga augstums / Crown height
15
3.2. tabula / Table 3.2.
Bojāto koku īpatsvars pēdējo 3 gadu laikā retinātās un pārējās audzēs
The proportion of the damaged trees in the recently thinned stands (i.e. thinned during
the last 3 years) and in the other (i.e. thinned earlier or not thinned)
Nogabalu
grupa/
Stand
groups
Variants /
Type
Stumbra caurmēra pakāpes (cm) /
Diameter class (cm)
Vid
ēji
/
Ave
rag
e
4 8 12 16 20 24 28 32 36
Bo
jāto
ko
ku
īp
ats
va
rs,
% /
Pro
po
rtio
n o
f d
am
ag
ed t
rees
, %
Priedes
audzes/
Scots Pine
stands
Vidēji /
Average 33 22 28 21 33 28 24 24 18 26
Neretināts /
Un-thinned 2 26 30 25 27 23 26
Retināts /
Thinned 33 22 28 24 35 24 15 20 12 25
Egles
audzes /
Norway
spruce
stands
Vidēji /
Average 15
18 42 27 30 18 18 14 27
Neretināts /
Un-thinned 15
32 34 24 16 10 14 23
Retināts /
Thinned 18 55 24 41 22 49
31
Vidēji/
Average 29 25 28 30 30 28 21 21 18 26
Konstatēts, ka sasalstoša lietus bojāto koku īpatsvars gan priedes, gan egles audzēs
būtiski augstāks bija otrajā stāvā salīdzinājumā ar audzes pirmo stāvu. Priedes audzēs gan
pirmajā, gan otrajā stāvā statistiski būtiski (p<0.05) vairāk lauztu koku bija nogabalos, kur
nebija nesen veikta retināšana. Egles audzēs statistiski būtiski (p<0.05) vairāk lauztu koku
bija otrajā stāvā nesen retinātajās audzēs (daļa no tiem varētu būt pēc retināšanas saglabātie
otrā stāva koki); pirmajā stāvā atšķirības starp nesen retinātajām un pārējām audzēm nebija
statistiski būtiskas (p>0.05).
Kopumā rezultāti nerada pamatu apgalvot, ka nesen veiktas retināšanas rezultātā
audzē būtiski palielinātos sasalstoša lietus ietekmē bojāto valdaudzes koku īpatsvars,
netieši liecinot par citu faktoru nozīmīgāku lomu audzes bojājumu intensitātes noteikšanā.
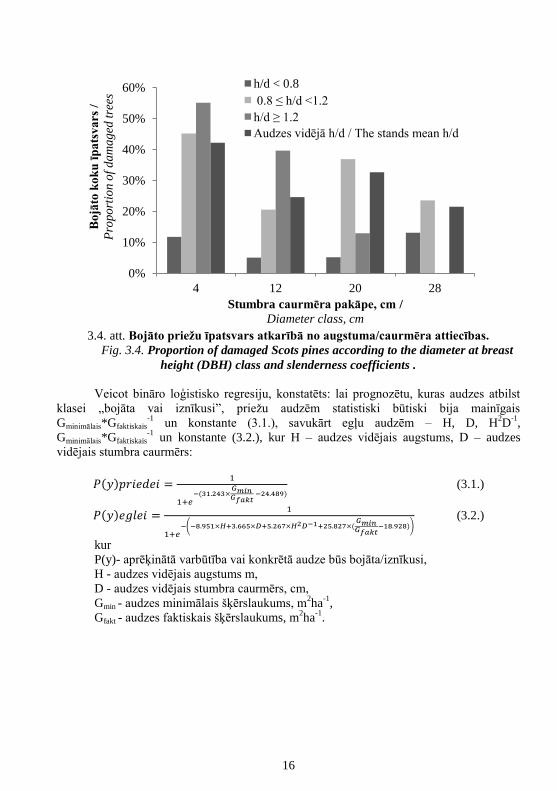
Koku augstuma un caurmēra attiecība bojātiem kokiem bija lielāka nekā nebojātiem
visos gadījumos – nesen retinātās priežu audzēs tā bija attiecīgi 1.07 un 0.93, egļu audzēs –
1.03 un 0.95, pārējās priežu audzēs – 1.01 un 0.94, pārējās egļu audzēs – 1.03 un 0.97.
Bojāto priežu un egļu īpatsvars koku grupās ar atšķirīgu augstuma un caurmēra attiecību
(<0.8; 0.8-1.2; >1.2) parādīts attiecīgi 3.4. un 3.5. attēlā. Vērtējot katras caurmēra pakāpes
(no 4 cm līdz 28 cm) kokus atsevišķi, gan priedei, gan eglei konstatēta tendence, ka lielāks
bojāto koku īpatsvars bija grupās ar lielāku koka augstuma un caurmēra attiecību.
16
3.4. att. Bojāto priežu īpatsvars atkarībā no augstuma/caurmēra attiecības.
Fig. 3.4. Proportion of damaged Scots pines according to the diameter at breast
height (DBH) class and slenderness coefficients .
Veicot bināro loģistisko regresiju, konstatēts: lai prognozētu, kuras audzes atbilst
klasei „bojāta vai iznīkusi”, priežu audzēm statistiski būtiski bija mainīgais
Gminimālais*Gfaktiskais-1
un konstante (3.1.), savukārt egļu audzēm – H, D, H2D
-1,
Gminimālais*Gfaktiskais-1
un konstante (3.2.), kur H – audzes vidējais augstums, D – audzes
vidējais stumbra caurmērs:
𝑃(𝑦)𝑝𝑟𝑖𝑒𝑑𝑒𝑖 =1
1+𝑒−(31.243×
𝐺𝑚𝑖𝑛𝐺𝑓𝑎𝑘𝑡
−24.489) (3.1.)
𝑃(𝑦)𝑒𝑔𝑙𝑒𝑖 =1
1+𝑒−(−8.951×𝐻+3.665×𝐷+5.267×𝐻2𝐷−1+25.827×(
𝐺𝑚𝑖𝑛𝐺𝑓𝑎𝑘𝑡
−18.928)) (3.2.)
kur
P(y)- aprēķinātā varbūtība vai konkrētā audze būs bojāta/iznīkusi,
H - audzes vidējais augstums m,
D - audzes vidējais stumbra caurmērs, cm,
Gmin - audzes minimālais šķērslaukums, m2ha
-1,
Gfakt - audzes faktiskais šķērslaukums, m2ha
-1.
0%
10%
20%
30%
40%
50%
60%
4 12 20 28
Bo
jāto
ko
ku
īp
ats
va
rs /
Pro
po
rtio
n o
f d
am
ag
ed t
rees
Stumbra caurmēra pakāpe, cm /
Diameter class, cm
h/d < 0.8
0.8 ≤ h/d <1.2
h/d ≥ 1.2
Audzes vidējā h/d / The stands mean h/d

17
3.5. att. Bojāto egļu īpatsvars atkarībā no augstuma/caurmēra attiecības.
Fig. 3.5. Proportion of damaged Norway spruces according to the diameter at
breast height (DBH) class and slenderness coefficients.
Iegūto rezultātu interpretācija: ja audzei aprēķinātā varbūtība P(y)<0.5, tad audze
nav iznīkusi, ja P(y)≥0.5 – audze ir bojāta/iznīkusi. Izmantojot iegūtās sakarības, pēc
sasalstoša lietus iespējams saskaņā ar meža inventarizācijas informāciju prognozēt, kurās
audzēs potenciāli būs nozīmīgākie bojājumi, attiecīgi plānojot apsekošanas un seku
likvidācijas pasākumus. Šīs prognozes iespējams ņemt vērā stratēģiskajā plānošanā,
izstrādājot kopšanas ciršu modeli teritorijās, kur sasalstoša lietus bojājumu varbūtība ir
visaugstākā.
Pirmā stāva bojātās daļas šķērslaukums priežu audzēs ir atkarīgs no retināšanas (ir
vai nav retināts pēdējos 3 gados), H10 un H2D
-1 (3.3.), bet egļu audzēs – no H10, H
2D
-1 un
pirmā stāva šķērslaukuma (3.4.), kur H10 – pirmā stāva valdošās sugas vidējais augstums:
𝐺𝑏𝑜𝑗ā𝑡𝑎𝑖𝑠(𝑃𝑟𝑖𝑒𝑑𝑒) = 6.106 − 1.442 × 𝑅 − 0.403 × 𝐻 + (0.420 ×𝐻2
𝐷) (3.3.)
𝐺𝑏𝑜𝑗ā𝑡𝑎𝑖𝑠(𝐸𝑔𝑙𝑒) = 6.033 − 0.137 × 𝐺 − 0.837 × 𝐻 + (0.706 ×𝐻2
𝐷) (3.4.)
kur
R - ja veikta retināšana pēdējo 3 gadu laikā pirms sasalstošā lietus, tad R =1,
H10 - pirmā stāva valdošās sugas vidējais augstums, m,
H2D
-1- koka augstums (m) kvadrātā attiecībā pret stumbra caurmēru (cm),
G - pirmā stāva šķērslaukums, m2 ha
-1.
Šīs sakarības izmantojamas, nosakot audzes, kur iespējams lielākais pirmā stāva
bojāto koku šķērslaukums, kā arī plānojot audžu kopšanas modeli teritorijās ar augstāko
0%
5%
10%
15%
20%
25%
30%
35%
40%
45%
4 12 20 28
Bo
jāto
ko
ku
īp
ats
va
rs /
Pro
po
rtio
n o
f d
am
ag
ed t
rees
Stumbra caurmēra pakāpe, cm /
Diameter class, cm
h/d <0.8
h/d 0.8-1.2
h/d >1.2
Audzes vidējā h/dThe stand mean h/d
/
18
sasalstoša lietus bojājumu varbūtību tādā veidā, lai iespējami veicinātu pirmā stāva koku
noturību pret šo bojājumu.
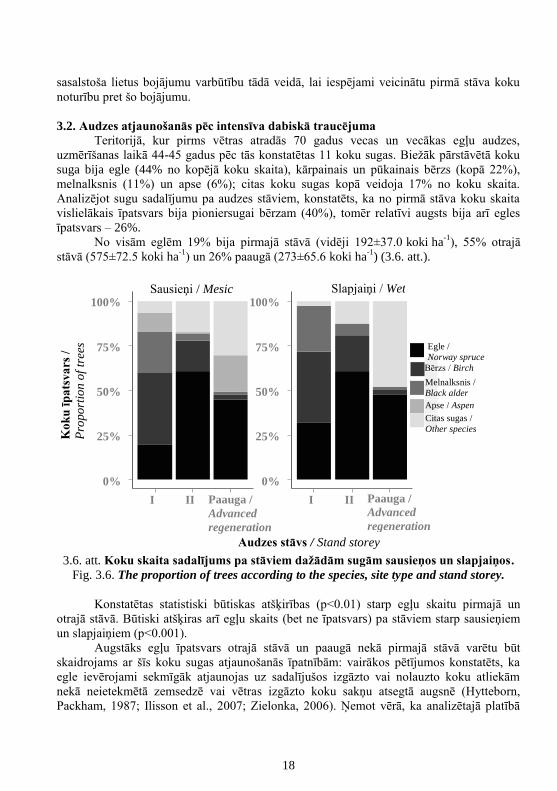
3.2. Audzes atjaunošanās pēc intensīva dabiskā traucējuma
Teritorijā, kur pirms vētras atradās 70 gadus vecas un vecākas egļu audzes,
uzmērīšanas laikā 44-45 gadus pēc tās konstatētas 11 koku sugas. Biežāk pārstāvētā koku
suga bija egle (44% no kopējā koku skaita), kārpainais un pūkainais bērzs (kopā 22%),
melnalksnis (11%) un apse (6%); citas koku sugas kopā veidoja 17% no koku skaita.
Analizējot sugu sadalījumu pa audzes stāviem, konstatēts, ka no pirmā stāva koku skaita
vislielākais īpatsvars bija pioniersugai bērzam (40%), tomēr relatīvi augsts bija arī egles
īpatsvars – 26%.
No visām eglēm 19% bija pirmajā stāvā (vidēji 192±37.0 koki ha-1
), 55% otrajā
stāvā (575±72.5 koki ha-1
) un 26% paaugā (273±65.6 koki ha-1
) (3.6. att.).
3.6. att. Koku skaita sadalījums pa stāviem dažādām sugām sausieņos un slapjaiņos.
Fig. 3.6. The proportion of trees according to the species, site type and stand storey.
Konstatētas statistiski būtiskas atšķirības (p<0.01) starp egļu skaitu pirmajā un
otrajā stāvā. Būtiski atšķiras arī egļu skaits (bet ne īpatsvars) pa stāviem starp sausieņiem
un slapjaiņiem (p<0.001).
Augstāks egļu īpatsvars otrajā stāvā un paaugā nekā pirmajā stāvā varētu būt
skaidrojams ar šīs koku sugas atjaunošanās īpatnībām: vairākos pētījumos konstatēts, ka
egle ievērojami sekmīgāk atjaunojas uz sadalījušos izgāzto vai nolauzto koku atliekām
nekā neietekmētā zemsedzē vai vētras izgāzto koku sakņu atsegtā augsnē (Hytteborn,
Packham, 1987; Ilisson et al., 2007; Zielonka, 2006). Ņemot vērā, ka analizētajā platībā
Sausieņi / Mesic Slapjaiņi / Wet
0%
25%
50%
75%
100%
0%
25%
50%
75%
100%
I II Paauga /
Advanced
regeneration
I II Paauga /
Advanced
regeneration Audzes stāvs / Stand storey
Ko
ku
īp
ats
va
rs /
Pro
po
rtio
n o
f tr
ees Egle /
Norway spruce Bērzs / Birch Melnalksnis /
Black alder Apse / Aspen Citas sugas /
Other species

19
mežaudzes nopostītas pilnībā, koku atliekas bija sakritušas kaudzēs, kas varēja kavēt to
sadalīšanos un pārveidošanos par egļu sējeņiem piemērotu substrātu (Harrington, Bluhm,
2001; Storaunet, Rolstad, 2002).
Egle pirmajā stāvā bija pārstāvēta 48% parauglaukumu, un bija valdošā koku suga
23% sausieņu un 43% slapjaiņu platību. Egles īpatsvars vismaz 70% no koku skaita
parauglaukumā bija 18% no visiem apsekotajiem parauglaukumiem, turklāt platību ar šādu
egles īpatsvaru I stāvā ievērojami un statistiski būtiski (p<0.001) mazāk bija sausieņos
(11%) nekā slapjaiņos (33%). Audzes otrajā stāvā egle bija sastopama ievērojami biežāk –
83% no visiem parauglaukumiem. Šajā audzes stāvā augsts egles īpatsvars (≥70%)
konstatēts 40% parauglaukumu.
Konstatēts, ka distancei līdz vētras neskartai vai maz bojātai audzei (kas noteikta ar
programmas ArcGIS rīku Analyst tools (ESRI, Inc. Redlands, CA)) ir būtiska ietekme
(p<0.01) uz egļu īpatsvaru I stāvā slapjaiņos (nozīmīgi augstāks tas ir līdz 50 m attālumam
no vismaz 40 gadus vecas egļu audzes), taču ne sausieņos (3.7. att.). Citu autoru pētījumos
norādīts, ka egļu telpisko izplatību teritorijā turpmākajos gados pēc traucējuma nosaka
distance līdz sēklu avotam (Coates, 2002). Sēklu avota nozīmes detalizētu analīzi šī
pētījuma ietvaros apgrūtina tas, ka nav informācijas par vēja virzienu un stiprumu egļu
sēklu izbiršanas laikā, kā arī par pašu egļu sēklu ražu. Zināms tikai, ka egļu ziedēšana
Latvijas rietumu daļā 1969. un 1970. gadā bija vidēja, no koka iegūstamais sēklu apjoms
salīdzinoši mazs, bet to kvalitāte augsta (Zviedre, 1971). Taču šajos aspektos var pastāvēt
nozīmīgas atšķirības starp audzēm, īpaši, ja tās aug meža tipos ar dažādu augsnes mitrumu
(Rone, 1965).
3.7. att. Distances līdz 1969. gada vētrā nebojāta vai maz bojāta nogabala malai saikne
ar egļu dominanci sausieņos un slapjaiņos.
Fig. 3.7. The distance from undisturbed stands edge according to the proportion of
Norway spruce in mesic and wet plots.
Pirmā stāvā egļu vienmērīgo biezumu dažādā attālumā no saglabājušos egļu audžu
sienas sausieņos varētu izskaidrot ar iesēšanos no vētrā nogāzto egļu čiekuriem, kuros
sēklas vētras brīdī jau bija nogatavojušās. Tāpat vētras radītajos atvērumos konstatētas
atsevišķas izdzīvojušas egles (vidēji 33 koki ha-1
), kas arī varēja kalpot kā sēklu avots.

20
Distancei no meža sienas nebija būtiskas ietekmes uz I stāva egļu augstumu nedz
sausieņos, nedz slapjaiņos. Jāņem vērā, ka šī brīža audzes sastāvu ietekmējusi ne tikai
sēklu pieejamība, bet arī dīgšana, ko, savukārt, nosaka klimatisko un mikroklimatisko
apstākļu dažādība (Clinton, Bake, 2000).
Būtiski lielāks parauglaukumu īpatsvars ar augstu otrā stāva egļu īpatsvaru
konstatēts vairāk nekā 25 m attālumā no vētras nenopostītās egļu audzes. To, visticamāk,
noteikusi sēklu pieejamības un vienlaikus ne pārāk augstas konkurences (no vecās audzes),
kā arī augsta egļu īpatsvara pirmajā stāvā kombinācija.
Egļu dominanci jaunajās audzēs vētras skartajā teritorijā ietekmēja arī paaugas
klātbūtne. Paauga 1963. gada (pirms vētras) taksācijas aprakstā bija atzīmēta tikai 3 no 32
nogabaliem, kuros ierīkoti šī pētījuma parauglaukumi. Parauglaukumos, kur vizuāli
konstatēta pirms vētras paaugas egļu klātbūtne, tās 95% gadījumu bija I stāvā, turklāt
kopumā šajos parauglaukumos konstatēti 49% no visām I stāva eglēm. Parauglaukumos,
kur tika identificēta paaugas egles klātbūtne, nav konstatēts statistiski būtiski mazāks
audzes biezums nekā parauglaukumos ar egli, bet bez iepriekšējās ģenerācijas paaugas
kokiem, taču ir konstatēts statistiski būtiski (p<0.01) mazāks I stāva egļu skaits – attiecīgi
177±96 egles ha-1
un 256±53 egles ha-1
, netieši liecinot, ka atjaunošanās ar sēklām nav
bijusi tik sekmīga platībās, kur augstāks paaugas koku biezums.
Lai precizētu vizuāli novērtēto iepriekšējās ģenerācijas koku klātbūtni, ierīkotie
parauglaukumi divos meža tipos (Vr un Dms) egļu audzēs (egle 70-90% no šķērslaukuma)
paplašināti līdz 500 m2 un tajos ievākti pieaugumu urbumi. To datu analīze liecina, ka
pirms vētras paauga slapjajā damaksnī un vērī nodrošinājusi attiecīgi 19% un 59% no
kopējā 45 gadus pēc šīs meteoroloģiskās parādības konstatētā pirmā stāva egļu skaita.
Sekmīgākā egļu ieviešanās pēc vētras notikusi pirmajos desmit gados, kad iesējusies
lielākā daļa jauno I stāva egļu: Dms – 85%, Vr – 62% (3.8. att.).
Paaugas koku ietekme uz egļu klātbūtni jaunajās audzēs pēc vētras bija ievērojami
lielāka, nekā to būtu iespējams prognozēt no pirms vētras taksācijas apraksta, liecinot, ka
arī relatīvi nelielām paaugas grupām ar zemu biezumu (kas netiek atzīmētas) bijusi būtiska
loma. Nav konstatēts, ka sākotnēji paaugā augušo koku dimensijas sausieņos vai slapjaiņos
būtiski atšķirtos no pēc vētras iesējušos koku dimensijām. Tas saistīs ar nepieciešamību
šiem kokiem vispirms, nonākot krasi atšķirīgā apgaismojumā (un, atsevišķos gadījumos, –
arī augsnes mitrumā), nomainīt skujas (fotosintezējošo aparātu) un jaunajiem apstākļiem
pielāgot sakņu sistēmu (Kneeshaw et al., 2002), un tikai pēc tam tiem var veidoties
ievērojami augstuma un radiālie pieaugumi (Panayotov et al., 2011). Šai laikā pēc vētras
iesējušies koki, strauji augot, var sasniegt līdzīgas dimensijas.
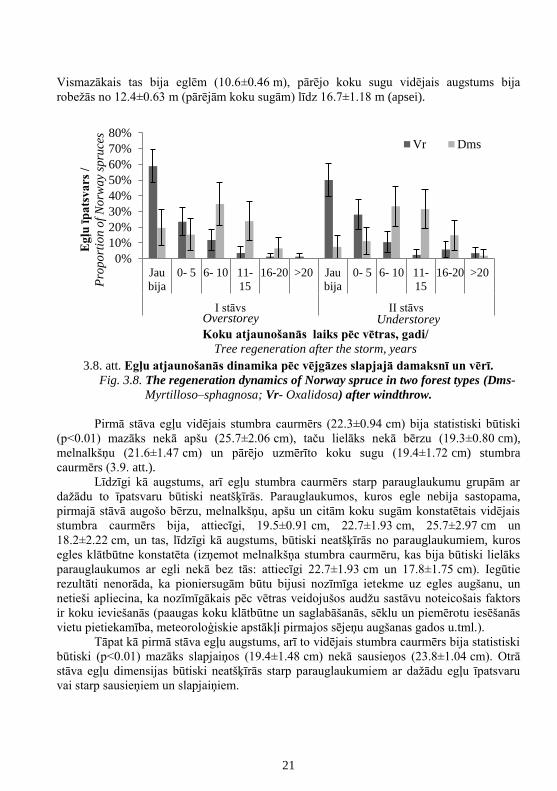
Analizējot visu pēc vētras atjaunojušos koku dimensijas, konstatēts, ka pirmā stāva
egļu vidējais augstums (20.7±0.66 m) bija statistiski būtiski (p<0.01) mazāks nekā apšu
(27.3±1.53 m) augstums, līdzīgs bērzu (21.7±0.50 m), melnalkšņu (21.5±0.68 m) un pārējo
uzmērīto koku sugu (19.2±1.03 m) augstumam. Pirmā stāva egļu augstums parauglaukumu
grupām ar dažādu egļu īpatsvaru būtiski neatšķīrās. Arī bērza un melnalkšņa augstums
neatšķīrās parauglaukumos ar atšķirīgu egles īpatsvaru. Sausieņos egles augstums bija
statistiski būtiski (p<0.001) lielāks nekā slapjaiņos, attiecīgi 22.5±0.54 m un 17.7±1.01 m.
Otrā stāvā koku vidējais augstums starp sugām atšķīrās statistiski būtiski (p<0.001).
21
Vismazākais tas bija eglēm (10.6±0.46 m), pārējo koku sugu vidējais augstums bija
robežās no 12.4±0.63 m (pārējām koku sugām) līdz 16.7±1.18 m (apsei).
3.8. att. Egļu atjaunošanās dinamika pēc vējgāzes slapjajā damaksnī un vērī.
Fig. 3.8. The regeneration dynamics of Norway spruce in two forest types (Dms-
Myrtilloso–sphagnosa; Vr- Oxalidosa) after windthrow.
Pirmā stāva egļu vidējais stumbra caurmērs (22.3±0.94 cm) bija statistiski būtiski
(p<0.01) mazāks nekā apšu (25.7±2.06 cm), taču lielāks nekā bērzu (19.3±0.80 cm),
melnalkšņu (21.6±1.47 cm) un pārējo uzmērīto koku sugu (19.4±1.72 cm) stumbra
caurmērs (3.9. att.).
Līdzīgi kā augstums, arī egļu stumbra caurmērs starp parauglaukumu grupām ar
dažādu to īpatsvaru būtiski neatšķīrās. Parauglaukumos, kuros egle nebija sastopama,
pirmajā stāvā augošo bērzu, melnalkšņu, apšu un citām koku sugām konstatētais vidējais
stumbra caurmērs bija, attiecīgi, 19.5±0.91 cm, 22.7±1.93 cm, 25.7±2.97 cm un
18.2±2.22 cm, un tas, līdzīgi kā augstums, būtiski neatšķīrās no parauglaukumiem, kuros
egles klātbūtne konstatēta (izņemot melnalkšņa stumbra caurmēru, kas bija būtiski lielāks
parauglaukumos ar egli nekā bez tās: attiecīgi 22.7±1.93 cm un 17.8±1.75 cm). Iegūtie
rezultāti nenorāda, ka pioniersugām būtu bijusi nozīmīga ietekme uz egles augšanu, un
netieši apliecina, ka nozīmīgākais pēc vētras veidojušos audžu sastāvu noteicošais faktors
ir koku ieviešanās (paaugas koku klātbūtne un saglabāšanās, sēklu un piemērotu iesēšanās
vietu pietiekamība, meteoroloģiskie apstākļi pirmajos sējeņu augšanas gados u.tml.).
Tāpat kā pirmā stāva egļu augstums, arī to vidējais stumbra caurmērs bija statistiski
būtiski (p<0.01) mazāks slapjaiņos (19.4±1.48 cm) nekā sausieņos (23.8±1.04 cm). Otrā
stāva egļu dimensijas būtiski neatšķīrās starp parauglaukumiem ar dažādu egļu īpatsvaru
vai starp sausieņiem un slapjaiņiem.
0%
10%
20%
30%
40%
50%
60%
70%
80%
Jau
bija
0- 5 6- 10 11-
15
16-20 >20 Jau
bija
0- 5 6- 10 11-
15
16-20 >20
I stāvs II stāvs
Eg
ļu ī
pa
tsva
rs /
Pro
po
rtio
n o
f N
orw
ay
spru
ces
Koku atjaunošanās laiks pēc vētras, gadi/
Tree regeneration after the storm, years
Vr Dms
Overstorey Understorey
22
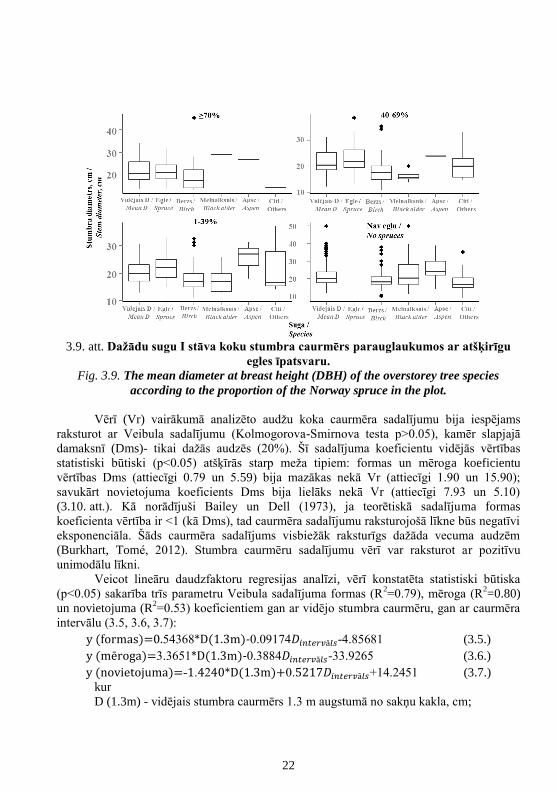
3.9. att. Dažādu sugu I stāva koku stumbra caurmērs parauglaukumos ar atšķirīgu
egles īpatsvaru.
Fig. 3.9. The mean diameter at breast height (DBH) of the overstorey tree species
according to the proportion of the Norway spruce in the plot.
Vērī (Vr) vairākumā analizēto audžu koka caurmēra sadalījumu bija iespējams
raksturot ar Veibula sadalījumu (Kolmogorova-Smirnova testa p>0.05), kamēr slapjajā
damaksnī (Dms)- tikai dažās audzēs (20%). Šī sadalījuma koeficientu vidējās vērtības
statistiski būtiski (p<0.05) atšķīrās starp meža tipiem: formas un mēroga koeficientu
vērtības Dms (attiecīgi 0.79 un 5.59) bija mazākas nekā Vr (attiecīgi 1.90 un 15.90);
savukārt novietojuma koeficients Dms bija lielāks nekā Vr (attiecīgi 7.93 un 5.10)
(3.10. att.). Kā norādījuši Bailey un Dell (1973), ja teorētiskā sadalījuma formas
koeficienta vērtība ir <1 (kā Dms), tad caurmēra sadalījumu raksturojošā līkne būs negatīvi
eksponenciāla. Šāds caurmēra sadalījums visbiežāk raksturīgs dažāda vecuma audzēm
(Burkhart, Tomé, 2012). Stumbra caurmēru sadalījumu vērī var raksturot ar pozitīvu
unimodālu līkni.
Veicot lineāru daudzfaktoru regresijas analīzi, vērī konstatēta statistiski būtiska
(p<0.05) sakarība trīs parametru Veibula sadalījuma formas (R2=0.79), mēroga (R
2=0.80)
un novietojuma (R2=0.53) koeficientiem gan ar vidējo stumbra caurmēru, gan ar caurmēra
intervālu (3.5, 3.6, 3.7):
y (formas)=0.54368*D(1.3m)-0.09174𝐷𝑖𝑛𝑡𝑒𝑟𝑣ā𝑙𝑠-4.85681 (3.5.)
y (mēroga)=3.3651*D(1.3m)-0.3884𝐷𝑖𝑛𝑡𝑒𝑟𝑣ā𝑙𝑠-33.9265 (3.6.)
y (novietojuma)=-1.4240*D(1.3m)+0.5217𝐷𝑖𝑛𝑡𝑒𝑟𝑣ā𝑙𝑠+14.2451 (3.7.)
kur
D (1.3m) - vidējais stumbra caurmērs 1.3 m augstumā no sakņu kakla, cm;
23
D intervāls - starpība starp lielāko stumbra caurmēra vērtību un mazāko stumbra
caurmēra vērtību parauglaukumā.
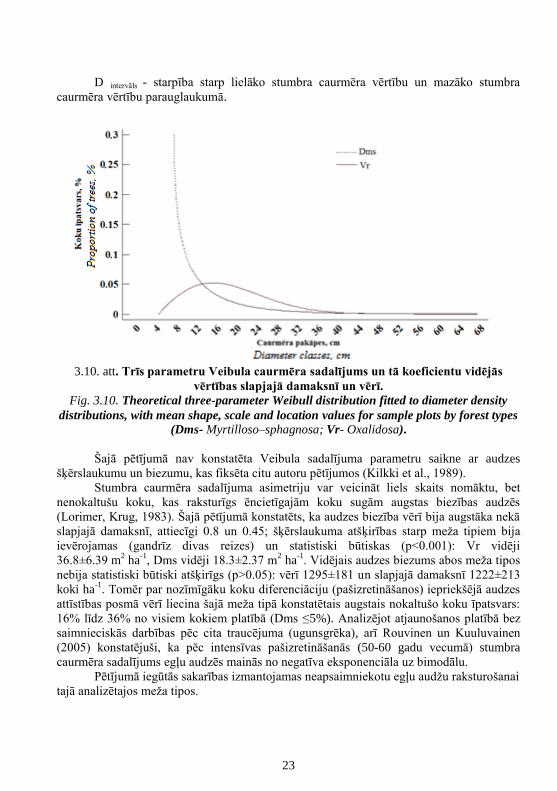
3.10. att. Trīs parametru Veibula caurmēra sadalījums un tā koeficientu vidējās
vērtības slapjajā damaksnī un vērī.
Fig. 3.10. Theoretical three-parameter Weibull distribution fitted to diameter density
distributions, with mean shape, scale and location values for sample plots by forest types
(Dms- Myrtilloso–sphagnosa; Vr- Oxalidosa).
Šajā pētījumā nav konstatēta Veibula sadalījuma parametru saikne ar audzes
šķērslaukumu un biezumu, kas fiksēta citu autoru pētījumos (Kilkki et al., 1989).
Stumbra caurmēra sadalījuma asimetriju var veicināt liels skaits nomāktu, bet
nenokaltušu koku, kas raksturīgs ēncietīgajām koku sugām augstas biezības audzēs
(Lorimer, Krug, 1983). Šajā pētījumā konstatēts, ka audzes biezība vērī bija augstāka nekā
slapjajā damaksnī, attiecīgi 0.8 un 0.45; šķērslaukuma atšķirības starp meža tipiem bija
ievērojamas (gandrīz divas reizes) un statistiski būtiskas (p<0.001): Vr vidēji
36.8±6.39 m2 ha
-1, Dms vidēji 18.3±2.37 m
2 ha
-1. Vidējais audzes biezums abos meža tipos
nebija statistiski būtiski atšķirīgs (p>0.05): vērī 1295±181 un slapjajā damaksnī 1222±213
koki ha-1
. Tomēr par nozīmīgāku koku diferenciāciju (pašizretināšanos) iepriekšējā audzes
attīstības posmā vērī liecina šajā meža tipā konstatētais augstais nokaltušo koku īpatsvars:
16% līdz 36% no visiem kokiem platībā (Dms ≤5%). Analizējot atjaunošanos platībā bez
saimnieciskās darbības pēc cita traucējuma (ugunsgrēka), arī Rouvinen un Kuuluvainen
(2005) konstatējuši, ka pēc intensīvas pašizretināšanās (50-60 gadu vecumā) stumbra
caurmēra sadalījums egļu audzēs mainās no negatīva eksponenciāla uz bimodālu.
Pētījumā iegūtās sakarības izmantojamas neapsaimniekotu egļu audžu raksturošanai
tajā analizētajos meža tipos.

24
3.3. Ainavas ilgtermiņa dinamika pēc traucējuma
Pētījuma teritorijā Slīteres nacionālajā parkā pēc 1969. gada vējgāzes ainavā
konstatētas pēdējo 50 gadu laikā lielākās izmaiņas. Mežs tika ietekmēts lielās platībās, gan
pilnībā iznīcinot kokaudzi, gan bojājot atsevišķus kokus vai koku grupas, tādējādi pēc
vējgāzes izveidojot ainavā dažāda izmēra un struktūras homogēnas platības jeb plankumus.
Šajā pētījumā terminu „plankums” saprot kā relatīvi homogēnu nelineāru teritoriju, kas
atšķiras no apkārtnes pēc raksturojuma un izskata (Forman, 1995). Ainavas fragmentācijas
analīzē iekļautā meža masīva platība bija 1646 ha (izņemot 1966. gada satelītattēlu, kurā
analizētā platība bija 1610 ha mākoņu nosegtās teritorijas dēļ). Meža masīva kartes ar
dažādām zemes virsmas seguma klasēm un to ilgtermiņa dinamika redzama 3.11. attēlā.
3.11. att. Meža masīva kartes ar dažādām zemes virsmas seguma klasēm 1966.-
2010. gadā.
Fig. 3.11. Maps of forest massif with different land cover classes from 1966 to 2010.
Kopējais plankumu skaits bija līdzīgs gan trīs gadus pirms vētras (1966. gadā), gan
trīs gadus pēc tās (1972. gadā), attiecīgi 956 un 997, bet 2010. gadā ainavu veidoja
ievērojami mazāks skaits (207) plankumu (3.3. tab.). Vidējā plankuma platība laikā no
1966. līdz 2010. gadam pieauga no 1.68 ha līdz 7.95 ha. Ainavās, kur izteikti dominē viens
25
vai vairāki plankumi un ir daudz maza izmēra plankumu, iesaka lietot vidējo svērto
plankuma platību (Tērauds, 2011).
3.3. tabula/ Table 3.3.
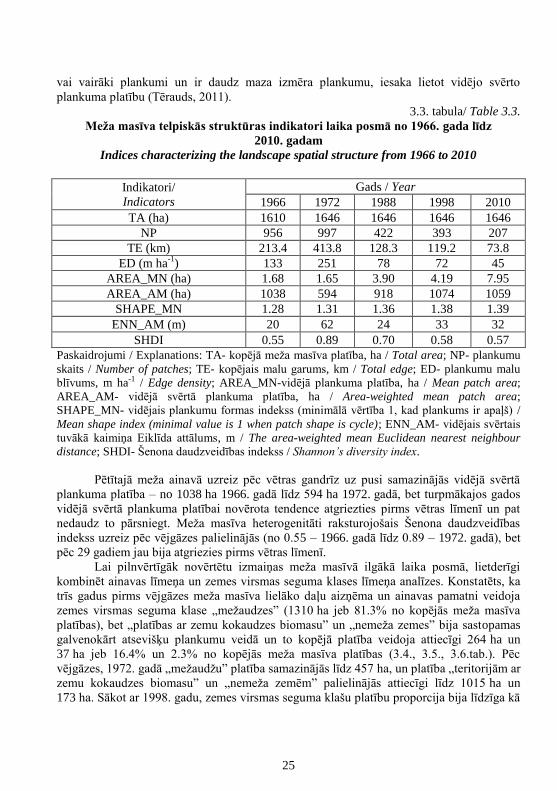
Meža masīva telpiskās struktūras indikatori laika posmā no 1966. gada līdz
2010. gadam
Indices characterizing the landscape spatial structure from 1966 to 2010
Indikatori/
Indicators
Gads / Year
1966 1972 1988 1998 2010
TA (ha) 1610 1646 1646 1646 1646
NP 956 997 422 393 207
TE (km) 213.4 413.8 128.3 119.2 73.8
ED (m ha-1
) 133 251 78 72 45
AREA_MN (ha) 1.68 1.65 3.90 4.19 7.95
AREA_AM (ha) 1038 594 918 1074 1059
SHAPE_MN 1.28 1.31 1.36 1.38 1.39
ENN_AM (m) 20 62 24 33 32
SHDI 0.55 0.89 0.70 0.58 0.57
Paskaidrojumi / Explanations: TA- kopējā meža masīva platība, ha / Total area; NP- plankumu
skaits / Number of patches; TE- kopējais malu garums, km / Total edge; ED- plankumu malu
blīvums, m ha-1 / Edge density; AREA_MN-vidējā plankuma platība, ha / Mean patch area;
AREA_AM- vidējā svērtā plankuma platība, ha / Area-weighted mean patch area;
SHAPE_MN- vidējais plankumu formas indekss (minimālā vērtība 1, kad plankums ir apaļš) /
Mean shape index (minimal value is 1 when patch shape is cycle); ENN_AM- vidējais svērtais
tuvākā kaimiņa Eiklīda attālums, m / The area-weighted mean Euclidean nearest neighbour
distance; SHDI- Šenona daudzveidības indekss / Shannon’s diversity index.
Pētītajā meža ainavā uzreiz pēc vētras gandrīz uz pusi samazinājās vidējā svērtā
plankuma platība – no 1038 ha 1966. gadā līdz 594 ha 1972. gadā, bet turpmākajos gados
vidējā svērtā plankuma platībai novērota tendence atgriezties pirms vētras līmenī un pat
nedaudz to pārsniegt. Meža masīva heterogenitāti raksturojošais Šenona daudzveidības
indekss uzreiz pēc vējgāzes palielinājās (no 0.55 – 1966. gadā līdz 0.89 – 1972. gadā), bet
pēc 29 gadiem jau bija atgriezies pirms vētras līmenī.
Lai pilnvērtīgāk novērtētu izmaiņas meža masīvā ilgākā laika posmā, lietderīgi
kombinēt ainavas līmeņa un zemes virsmas seguma klases līmeņa analīzes. Konstatēts, ka
trīs gadus pirms vējgāzes meža masīva lielāko daļu aizņēma un ainavas pamatni veidoja
zemes virsmas seguma klase „mežaudzes” (1310 ha jeb 81.3% no kopējās meža masīva
platības), bet „platības ar zemu kokaudzes biomasu” un „nemeža zemes” bija sastopamas
galvenokārt atsevišķu plankumu veidā un to kopējā platība veidoja attiecīgi 264 ha un
37 ha jeb 16.4% un 2.3% no kopējās meža masīva platības (3.4., 3.5., 3.6.tab.). Pēc
vējgāzes, 1972. gadā „mežaudžu” platība samazinājās līdz 457 ha, un platība „teritorijām ar
zemu kokaudzes biomasu” un „nemeža zemēm” palielinājās attiecīgi līdz 1015 ha un
173 ha. Sākot ar 1998. gadu, zemes virsmas seguma klašu platību proporcija bija līdzīga kā
26
pirms vējgāzes, t.i., 1998. gadā „mežaudzes” veidoja 80.8%, „platības ar zemu kokaudzes
biomasu” – 15.4%, bet „nemeža zemes” – 3.7% no kopējās meža masīva teritorijas. Tātad
lielākajā daļā vētrā bojāto mežaudžu novērota sekmīga atjaunošanās – 29 gadu laikā pēc
vētras izveidojies jauns nepārtraukts vainagu klājs.
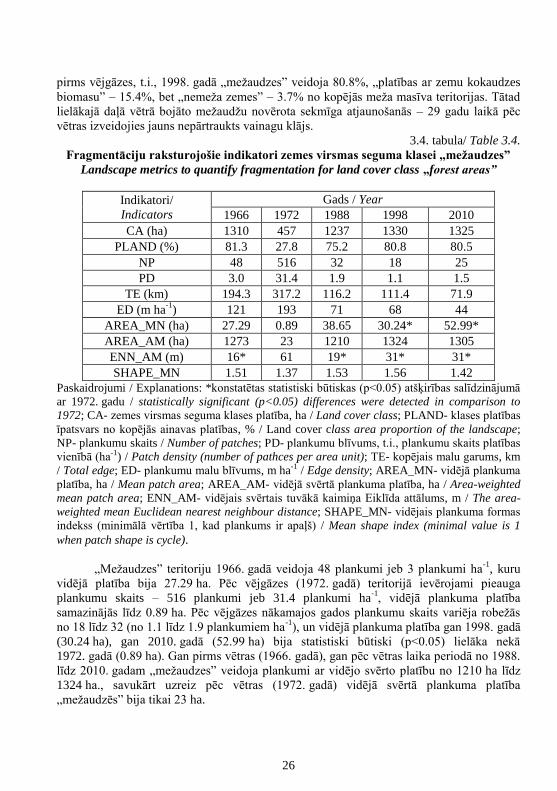
3.4. tabula/ Table 3.4.
Fragmentāciju raksturojošie indikatori zemes virsmas seguma klasei „mežaudzes”
Landscape metrics to quantify fragmentation for land cover class „forest areas”
Indikatori/
Indicators
Gads / Year
1966 1972 1988 1998 2010
CA (ha) 1310 457 1237 1330 1325
PLAND (%) 81.3 27.8 75.2 80.8 80.5
NP 48 516 32 18 25
PD 3.0 31.4 1.9 1.1 1.5
TE (km) 194.3 317.2 116.2 111.4 71.9
ED (m ha-1
) 121 193 71 68 44
AREA_MN (ha) 27.29 0.89 38.65 30.24* 52.99*
AREA_AM (ha) 1273 23 1210 1324 1305
ENN_AM (m) 16* 61 19* 31* 31*
SHAPE_MN 1.51 1.37 1.53 1.56 1.42
Paskaidrojumi / Explanations: *konstatētas statistiski būtiskas (p<0.05) atšķirības salīdzinājumā
ar 1972. gadu / statistically significant (p<0.05) differences were detected in comparison to
1972; CA- zemes virsmas seguma klases platība, ha / Land cover class; PLAND- klases platības
īpatsvars no kopējās ainavas platības, % / Land cover class area proportion of the landscape;
NP- plankumu skaits / Number of patches; PD- plankumu blīvums, t.i., plankumu skaits platības
vienībā (ha-1) / Patch density (number of pathces per area unit); TE- kopējais malu garums, km
/ Total edge; ED- plankumu malu blīvums, m ha-1 / Edge density; AREA_MN- vidējā plankuma
platība, ha / Mean patch area; AREA_AM- vidējā svērtā plankuma platība, ha / Area-weighted
mean patch area; ENN_AM- vidējais svērtais tuvākā kaimiņa Eiklīda attālums, m / The area-
weighted mean Euclidean nearest neighbour distance; SHAPE_MN- vidējais plankuma formas
indekss (minimālā vērtība 1, kad plankums ir apaļš) / Mean shape index (minimal value is 1
when patch shape is cycle).
„Mežaudzes” teritoriju 1966. gadā veidoja 48 plankumi jeb 3 plankumi ha-1
, kuru
vidējā platība bija 27.29 ha. Pēc vējgāzes (1972. gadā) teritorijā ievērojami pieauga
plankumu skaits – 516 plankumi jeb 31.4 plankumi ha-1
, vidējā plankuma platība
samazinājās līdz 0.89 ha. Pēc vējgāzes nākamajos gados plankumu skaits variēja robežās
no 18 līdz 32 (no 1.1 līdz 1.9 plankumiem ha-1
), un vidējā plankuma platība gan 1998. gadā
(30.24 ha), gan 2010. gadā (52.99 ha) bija statistiski būtiski (p<0.05) lielāka nekā
1972. gadā (0.89 ha). Gan pirms vētras (1966. gadā), gan pēc vētras laika periodā no 1988.
līdz 2010. gadam „mežaudzes” veidoja plankumi ar vidējo svērto platību no 1210 ha līdz
1324 ha., savukārt uzreiz pēc vētras (1972. gadā) vidējā svērtā plankuma platība
„mežaudzēs” bija tikai 23 ha.
27
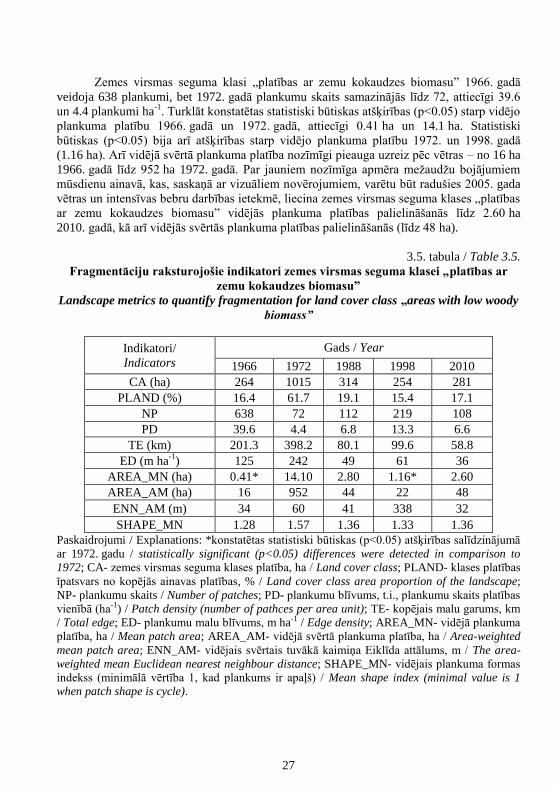
Zemes virsmas seguma klasi „platības ar zemu kokaudzes biomasu” 1966. gadā
veidoja 638 plankumi, bet 1972. gadā plankumu skaits samazinājās līdz 72, attiecīgi 39.6
un 4.4 plankumi ha-1
. Turklāt konstatētas statistiski būtiskas atšķirības (p<0.05) starp vidējo
plankuma platību 1966. gadā un 1972. gadā, attiecīgi 0.41 ha un 14.1 ha. Statistiski
būtiskas (p<0.05) bija arī atšķirības starp vidējo plankuma platību 1972. un 1998. gadā
(1.16 ha). Arī vidējā svērtā plankuma platība nozīmīgi pieauga uzreiz pēc vētras – no 16 ha
1966. gadā līdz 952 ha 1972. gadā. Par jauniem nozīmīga apmēra mežaudžu bojājumiem
mūsdienu ainavā, kas, saskaņā ar vizuāliem novērojumiem, varētu būt radušies 2005. gada
vētras un intensīvas bebru darbības ietekmē, liecina zemes virsmas seguma klases „platības
ar zemu kokaudzes biomasu” vidējās plankuma platības palielināšanās līdz 2.60 ha
2010. gadā, kā arī vidējās svērtās plankuma platības palielināšanās (līdz 48 ha).
3.5. tabula / Table 3.5.
Fragmentāciju raksturojošie indikatori zemes virsmas seguma klasei „platības ar
zemu kokaudzes biomasu”
Landscape metrics to quantify fragmentation for land cover class „areas with low woody
biomass”
Indikatori/
Indicators
Gads / Year
1966 1972 1988 1998 2010
CA (ha) 264 1015 314 254 281
PLAND (%) 16.4 61.7 19.1 15.4 17.1
NP 638 72 112 219 108
PD 39.6 4.4 6.8 13.3 6.6
TE (km) 201.3 398.2 80.1 99.6 58.8
ED (m ha-1
) 125 242 49 61 36
AREA_MN (ha) 0.41* 14.10 2.80 1.16* 2.60
AREA_AM (ha) 16 952 44 22 48
ENN_AM (m) 34 60 41 338 32
SHAPE_MN 1.28 1.57 1.36 1.33 1.36
Paskaidrojumi / Explanations: *konstatētas statistiski būtiskas (p<0.05) atšķirības salīdzinājumā
ar 1972. gadu / statistically significant (p<0.05) differences were detected in comparison to
1972; CA- zemes virsmas seguma klases platība, ha / Land cover class; PLAND- klases platības
īpatsvars no kopējās ainavas platības, % / Land cover class area proportion of the landscape;
NP- plankumu skaits / Number of patches; PD- plankumu blīvums, t.i., plankumu skaits platības
vienībā (ha-1) / Patch density (number of pathces per area unit); TE- kopējais malu garums, km
/ Total edge; ED- plankumu malu blīvums, m ha-1 / Edge density; AREA_MN- vidējā plankuma
platība, ha / Mean patch area; AREA_AM- vidējā svērtā plankuma platība, ha / Area-weighted
mean patch area; ENN_AM- vidējais svērtais tuvākā kaimiņa Eiklīda attālums, m / The area-
weighted mean Euclidean nearest neighbour distance; SHAPE_MN- vidējais plankuma formas
indekss (minimālā vērtība 1, kad plankums ir apaļš) / Mean shape index (minimal value is 1
when patch shape is cycle).

28
Pēc platības vismazākā zemes virsmas seguma klase bija „nemeža zemes”. Pēc
vējgāzes novērotais „nemeža zemju” platības pieaugums daļēji skaidrojams ar šīs zemes
virsmas seguma klases spektrālā parauga diezgan nelielo atšķirību no zemes virsmas
seguma klases „platības ar zemu kokaudzes biomasu” spektrālā parauga vērtībām.
„Nemeža zemju” platība turpmākajos gados pēc vētras samazinājās līdz 40 ha
(2010. gadā), kas varētu liecināt par nemeža zemju aizaugšanu.
3.6. tabula / Table 3.6.
Fragmentāciju raksturojošie indikatori zemes virsmas seguma klasei
„nemeža zemes”
Landscape metrics to quantify fragmentation for land cover class „non-forest land”
Indikatori/
Indicators
Gads / Year
1966 1972 1988 1998 2010
CA (ha) 37 173 95 61 40
PLAND (%) 2.3 10.5 5.8 3.7 2.4
NP 270 409 278 156 74
PD 16.8 24.9 16.9 9.5 4.5
TE (km) 31.2 112.1 60.2 27.3 16.8
ED (m ha-1
) 19 68 37 17 10
AREA_MN (ha) 0.14 0.42* 0.34 0.39 0.54*
AREA_AM (ha) 1 4 3 5 5
ENN_AM (m) 61 75 41 65 84
SHAPE_MN 1.26 1.18 1.35*** 1.42*** 1.43***
Paskaidrojumi / Explanations: *konstatētas statistiski būtiskas (p<0.05) atšķirības salīdzinājumā
ar 1966. gadu / statistically significant (p<0.05) differences were detected in comparison to
1966; ***konstatētas statistiski būtiskas (p<0.05) atšķirības gan ar 1966., gan 1972. gadu/
statistically significant (p<0.05) differences were detected in comparison to both 1966 and
1972; CA- zemes virsmas seguma klases platība, ha / Land cover class; PLAND- klases platības
īpatsvars no kopējās ainavas platības, % / Land cover class area proportion of the landscape;
NP- plankumu skaits / Number of patches; PD- plankumu blīvums, t.i., plankumu skaits platības
vienībā (ha-1) / Patch density (number of pathces per area unit); TE- kopējais malu garums, km
/ Total edge; ED- plankumu malu blīvums, m ha-1 / Edge density; AREA_MN- vidējā plankuma
platība, ha / Mean patch area; AREA_AM- vidējā svērtā plankuma platība, ha / Area-weighted
mean patch area; ENN_AM- vidējais svērtais tuvākā kaimiņa Eiklīda attālums, m / The area-
weighted mean Euclidean nearest neighbour distance; SHAPE_MN- vidējais plankuma formas
indekss (minimālā vērtība 1, kad plankums ir apaļš) / Mean shape index (minimal value is 1
when patch shape is cycle).
Ainavu ekoloģijā svarīga nozīme ir arī ainavas konfigurāciju raksturojošajiem
indikatoriem, t.i., plankuma formai un plankuma malas (robežas) garumam (Fahrig, 2003).
Pētījumā par Ziemeļvidzemes biosfēras rezervātu A.Tērauds secinājis, ka saimnieciskās
darbības rezultātā ainavas konfigurācija ir kļuvusi vienkāršāka, un pārsvarā konstatēta
vienkāršotu, četrstūrainu laukumu formu veidošanās (Tērauds, 2011). Analizējot plankumu
29
formas indeksu dabisko mežu ainavā šajā pētījumā, nav konstatēti sarežģītas formas
plankumi. Lai gan novērota tendence plankuma formām kļūt sarežģītākām, konstatēts, ka
laika periodā no 1972. līdz 2010. gadam vidējais formas indekss mainījās nelielās robežās
no 1.31 līdz 1.39 (p>0.05). Analizējot zemes virsmas seguma klases atsevišķi, konstatēts,
ka „mežaudzēm” vidējais plankuma formas indekss pirms vētras bija 1.51 un uzreiz pēc
vētras tas samazinājās līdz 1.37, savukārt 20-40 gadus pēc vētras plankumu formas indekss
bija robežās no 1.42 līdz 1.56. Tātad iepriekšējās saimnieciskās darbības ietekme uz
laukumu formu bija zudusi jau laika periodā līdz vētrai (40-50 gadi, kopš pētījuma
teritorijā pārtraukta jebkāda veida saimnieciskā darbība). Laika periodā no 1988. līdz
2010. gadam vidējais formas indekss kategorijai „nemeža zemes” bija robežās no 1.35 līdz
1.43, vērtības bija statistiski būtiski (p<0.05) lielākas salīdzinājumā gan ar 1966. gadu
(1.26), gan ar 1972. gadu (1.18). Tas varētu būt saistīts ar sarežģītākas formas platību zem
ūdeņiem izveidošanos intensīvas bebru darbības ietekmē. „Platībās ar zemu kokaudzes
biomasu” pēc vētras pieaugusi plankumu formas sarežģītība, par ko liecina formas indekss:
tas pieauga no 1.28 pirms vētras līdz 1.57 pēc vētras. Mežam atjaunojoties pēc vētras,
„platībās ar zemu kokaudzes biomasu” plankumu formas indekss samazinājās līdz 1.33
(1998. gadā), un nedaudz pieauga 2010. gadā, kas, iespējams, skaidrojams ar jauniem
bojājumiem, piemēram, 2005. gada vētras ietekmē.
Analizējot plankuma malas garuma izmaiņas ainavā pēc vētras, konstatēts, ka,
palielinoties plankumu platībai un samazinoties plankumu blīvumam teritorijā,
likumsakarīgi samazinājies plankuma vidējais malu garums. Vislielākais kopējais malu
garums un malu blīvums konstatēts 1972. gadā – attiecīgi 413.8 km un 251 m ha-1
. Pirms
vētras 1966. gadā šie indikatori bija attiecīgi 213.4 km un 133 m ha-1
, bet vismazākais
kopējais malu garums un malu blīvums konstatēts 2010. gadā, attiecīgi, 73.8 km un
45 m ha-1
.
Nozīmīgs ainavas konfigurācijas rādītājs ir plankumu izolācija jeb biotopu
pieejamības rādītājs, pēc kura var spriest par sugu izplatīšanās iespējām (Foster et al.,
1998; Kouki et al., 2001), kā arī vērtēt dažādu sugu dzīvotspēju fragmentētos biotopos
(Tērauds, 2011). Pētījuma rezultāti liecina, ka vidējais svērtais tuvākā kaimiņa Eiklīda
attālums mežaudzes klases ietvaros uzreiz pēc vētras (1972. gadā) pieauga par 45 m, un
bija statistiski būtiski lielāks gan par šo rādītāju pirms vētras 1966 gadā, gan 1988. gadā
(attiecīgi 61, 16, 19 m) un vēlākajos gados 31 m).
Konstatēts, ka lielākā daļa ainavas fragmentāciju raksturojošo indikatoru līdz 29
gadus ilgā laika posmā pēc 1969. gada liela mēroga vējgāzes bija atgriezušies pirms vētras
līmenī. Tātad, ja spēcīgas vētras (vai citi dabiskie traucējumi) seko cita citai ar pietiekami
lielu laika intervālu, tām līdzīgos apstākļos nebūs paliekošas ietekmes uz ainavas
fragmentāciju teritorijās bez cilvēka saimnieciskās darbības.
30
SECINĀJUMI
1. Sasalstoša lietus bojāto koku īpatsvars priedes un egles audzēs būtiski neatšķīrās
(attiecīgi 28% un 27%). Abu skuju koku sugu audzēs lauzto koku bija vairāk
nekā saliekto vai izgāzto, liecinot, ka skuju koku sugu savstarpēja nomaiņa nav
izmantojama kā līdzeklis bojājumu apjoma (riska) samazināšanai.
2. Skujkoku individuālo un kolektīvo noturību pret sasalstoša lietus bojājumiem
noteicošie rādītāji bija koku augstums, augstuma/caurmēra attiecība un audzes
šķērslaukums; to ietekmi koriģēja pēdējo 3 gadu periodā pirms šīs
meteoroloģiskās parādības veikta retināšana. Savlaicīga audžu kopšana, veicinot
koku individuālo noturību un vainaga simetriju, samazina ar šo meteoroloģisko
parādību saistīto kokaudžu bojājumu risku.
3. Vētras izgāzto egļu audžu vietā 45 gadus pēc tās platībā bez saimnieciskās
darbības visbiežāk sastopamā koku suga bija egle (44%). Tā sekmīgi konkurēja
ar pioniersugām un bija valdošā 23% sausieņu un 43% slapjaiņu platību, turklāt
mežaudzes pirmā stāva koku vidējais augstums un caurmērs statistiski būtiski
neatšķīrās no pioniersugām (izņemot apsi) konstatētā.
4. Bērzu, melnalkšņu un apšu vidējais stumbra caurmērs un augstums būtiski
neatšķīrās platībās ar dažādu egļu īpatsvaru audzes pirmajā stāvā, liecinot par šo
platību vienādu piemērotību pioniersugu augšanai. Tātad egļu sastopamību
noteica paaugas klātbūtne vētras brīdī un tās atjaunošanās pēc vētras. Slapjaiņos
attālumam līdz potenciālajam sēklu avotam bija statistiski būtiska ietekme uz
egļu īpatsvaru audzes pirmajā stāvā. Savukārt sausieņos, kur ievērojami biežāk
konstatēti pirms vētras paaugas koki (vērī 59% no pirmā stāva eglēm),
attālumam līdz sēklu avotam nebija būtiskas ietekmes.
5. Pirmā stāva egļu vecums pārsniedza vienas vecumklases robežas 29% platību.
No pašreiz pirmajā stāvā augošajām eglēm 49% vētras brīdī bijušas paaugā, bet
pārējās ieviesušās galvenokārt pirmajos 10 gados pēc vētras. Nav konstatētas
būtiskas koku dimensiju atšķirības starp šīm divām egļu grupām.
6. Vējgāze palielināja meža ainavas fragmentāciju, un tās ietekme uz mežaudzi
saglabājās līdz pat 30 gadus ilgā laika periodā, par ko liecināja plankumu platību,
formu un savstarpējo attālumu raksturojošie indikatori. Vētrām atkārtojoties
biežāk, sagaidāmas paliekošas telpiskās struktūras izmaiņas ainavā.
31
1. GENERAL DESCRIPTION 1.1. Topicality of the theme
Natural disturbances affect individual stand and forest landscape, and their
development. Most important natural disturbances in hemiboreal forests are windthrows
(causing both tree felling and breakage), forest fires, snow, and freezing rain. Natural
disturbances have influence on economy by changing availability of local wood resources,
reducing timber quality and value, reducing recreational value etc. Additionally, they have
ecological impact by, for instance, reducing a proportion of old trees within forest stand
and landscape, creating novel habitats, and changing movement possibilities of species
within landscape.
Occurrence of freezing rain has notable differences among regions in Latvia; and
there are no predictions that, under a changing climate, there would be a change in
possibility of occurrence or in regions where the freezing rain is the most common.
Therefore, effect of this meteorological phenomenon should be assessed on stand level,
leading to recommendations to risk mitigation, reducing damage and main concerns of
stand monitoring to timely detect damage after an event of freezing rain.
During the last decades, the activity of cyclones has increased, causing more severe
storms in Northern Europe. The damage caused by storms in European forests is expected
to increase in relation to more frequent and severe storms and changing climate, i.e., due to
a prolonged vegetation period, the storms will occur before trees have dropt leaves, and
while soil is not frozen. Information about long-term stand regeneration and growth after
windthrow in unmanaged forests is important to extend knowledge of natural succession in
hemiboreal forests. Such knowledge would complement recommendations to develop
management of specific situations and regions, where mimicking natural disturbances is
practised in order to increase biological diversity, as well as this knowledge would improve
an evaluation of specific measures, which are used to simulate natural disturbances.
Additionally, information about species structure in unmanaged stands is crucial for carbon
sequestration calculations, and it is needed for total carbon sequestration assessment in
Latvia regarding its international commitments.
1.2. Aim of the thesis
To describe long-term impacts of disturbances in unmanaged stands and forest
landscape, as well as to assess the factors that determine resistance of forest stands to
impact of freezing rain.
1.3. Research objectives:
1. to assess factors, that determine resistance of forest stand to freezing rain in
coniferous stands;
2. to characterize structure of forest stands, that are regenerated after large scale
windthrow, and factors affecting them;
3. to assess long-term effect of large scale windthrow on forest landscape.
32
1.4. Proposed theses:
1. damage caused by freezing rain depends on both individual tree and stand
stability determining parameters;
2. spruce regeneration after large scale windthrow mainly occurs by advance
regeneration, spruces of different age classes are found in overstorey;
3. effect of intense large scale disturbance on spatial indicators of forest landscape
remains for longer than 20 years.
1.5. Scientific novelty
This is the first extensive long-term assessment of forest regeneration (in the length
of 45 years) in unmanaged areas after windthrow in Latvia. Only few such studies have
been carried out in hemiboreal forests by now, with an investigating period up to 20 years.
Furthermore, the first long-term assessment of forest fragmentation after windthrow in
Latvia provides basis for further studies of possible natural disturbances and influence of
their dynamics on biological diversity.
Assessment in the following research provides extended and detailed description of
freezing rain damages in hemiboreal coniferous forests of Europe; former studies of
influence of freezing rain on forests have mainly been carried out in North America. In this
study, for the first time in Latvia, equations to describe freezing rain effect on stand
damage, have been developed.
1.6. Practical significance
The developed equations of freezing rain effect on stand damage could be
implemented in stand monitoring after occurrence of this meteorological phenomenon to
assess necessity and priorities of following measures, therefore ensuring fast determination
of damage and timber extraction to reduce loss of its value and decrease risk of pest
outbreak.
Knowledge of long-term effect of windthrow (the most important natural
disturbance in Latvia) on forest stand and landscape should be adopted in development of
biological diversity protection schemes (concepts).
1.7. Structure and coverage of thesis
Chapter 1 contains a summary of earlier studies, related to effect of natural
disturbances on forest stand. In the first sub-chapter, climatic and meteorological factors,
which cause formation of freezing rain, as well as observations of effect of icing and snow-
caused damage on forest stands are described. The second sub-chapter contains
information about storm-causing atmospheric phenomena and summarises results of
studies on forest stand and landscape resistance and resilience to windthrow in relation to
spatial scale and soil conditions, as well as stand regeneration and development of
remaining trees. Chapter 2 contains description of study materials and methods. Chapter 3
contains results of the studies. The first sub-chapter includes analysis of characteristics of
individual trees and a stand, which determines freezing rain caused damage. The second
sub-chapter contains analysis of stand regeneration after intense natural disturbance –

33
windthrow, while the third sub-chapter describes changes to indicator of forest landscape
spatial structure after this disturbance.
This thesis contains 132 pages, information has been summarised in 19 tables and
87 figures, 229 literature references have been used.
1.8. Approbation of research results:
Research results have been summarised in four publications and research results have been
presented in 12 scientific conferences.
2. MATERIAL AND METHODS Natural disturbances are any kind of external processes or conditions, which cause
sudden plant biomass reduction in a considerably shorter period of time than production of
new biomass. In this research, each natural disturbance was assessed in the region of
Latvia, where it has occurred most frequently according to observations during the last 50
years by Latvian Environment, Geology and Meteorology Centre (LEGMC). Icing is a
meteorological phenomenon, when ice and snow accumulate on surface, which is exposed
in atmosphere (ISO‐12494). Formation of icing is usually related to specific atmospheric
conditions, and it could form not only by condensation of fog, but also by rain when air
temperature rapidly decreases below 0°C (Zirnītis, 1968, Ahrens, 2007). One of the icing
types – freezing rain – forms in a contact zone of air masses with radically different
temperature: precipitation from a higher warm layer falls through a particularly thick cold
layer and forms small ice drops filled with unfrozen water. Icing forms, when these ice
drops fall and disperse on a hard surface (Fikke et al., 2005). The research includes only
damage, which is caused by freezing rain, and not by the other types of icing, therefore the
term “icing” is not further used.
Data for assessment of factors that determine impact of freezing rain was collected
in coniferous stands (at least 70% of standing volume according to stand inventory data),
which were damaged by this disturbance in December 2012 in forests of JSC “Latvia’s
State Forests” in municipalities of Rēzekne, Baltinava, Balvi, and Kārsava. Randomly
selected pine and spruce stands were 12 to 123 and 20 to 123 years old, respectively. The
stands were located on 12 forest types: Cladinoso–callunosa, Vacciniosa, Myrtillosa,
Hylocomiosa, Oxalidosa, Vaccinioso–sphagnosa, Myrtilloso–sphagnosa, Myrtilloso–
polytrichosa, Caricoso–phragmitosa, Myrtillosa mel., Myrtillosa turf. mel., and Oxalidosa
turf. mel. In 98 pine, 51 spruce and 14 mixed pine-spruce (the latter is not included in the
summary) stands (area ≥0.8 ha) on average eight circular sample plots (200 m2; R=7.96 m)
were systematically distributed. For each tree (DBH>2 cm), stem diameter at breast height
(DBH), height of living crown and total height were measured, and type of damage (broken
or bent) was determined. For broken trees, height of breakage was measured and, if
possible, height of the broken part was measured to reconstruct the total tree height. When
direct measurements of a broken part were not possible, tree height was calculated by
Petersen or Gaffrey height curves (Donis, 2009). Tree was classified as bent, if stem
deviation from vertical axis exceeded 15°, including trees with bent top, leaning and bent
34
trees. For each stand mean DBH, height (H), basal area (G) and volume (V) was calculated.
Stands were classified into three groups according to severity of damage: (1) G>0.5 from
Tretjakov normal basal area; (2) 0.5≥G>0.3; and (3) G≤0.3.
Binary logical regression was applied to determine factors, which influence
possibility of stand damage, using SPSS 14 tool “Advanced Regression” and “Backward
Stepwise LR” algorithm. Multicollinearity was assessed with tool “Multicollinearity
Diagnostics”. Factors were assumed independent, if correlation coefficient was lower than
0.8.
Long-term effect of large scale windthrow was assessed in the oldest part of Slitere
National Park (SNP), where no silvicultural measures have been done since 1923. Forests
are located on wet mineral soils (41% of area) – Vaccinioso–sphagnosa, Myrtilloso–
sphagnosa, Myrtilloso–polytrichosa, and Dryopteriosa, further in the study classified as the
site type “wet”; dry mineral soils (18% of area) – Hylocomiosa, Oxalidosa, and
Aegopodiosa; and wet peat soils (8% of area) – Sphagnosa, Caricoso–phragmitosa, and
Filipendulosa, classified as the site type “mesic”. SNP was damaged by severe windthrow
on November 2, 1969. According to the post-storm stand inventory data and satellite image
analysis (more than 90% of canopy loss), most (55%) of damaged stands were 70–130
years old spruce dominated stands. In these areas, 226 (179 on mesic site and 63 on wet
sites) circular plots (R=5.64 m) were systematically distributed; 17 plots on most
represented forest types were extended to 500 m2
(R=12.62 m). In each plot, all trees
(DBH>2 cm) were counted, and mean height and DBH were measured according to
species and stand layer. A note was added, if a tree was classified as survived from
previous generation, i.e., established before the storm in 1969. In the extended plots,
increment cores of at least 15 trees of different DBH were sampled according to species.
Additionally, increment cores of all trees which were classified as survived from previous
generation were sampled coring near the root collar.
Tree diameter distribution was calculated using Weibull distribution of three
parameters (2.1) (Bailey, Dell, 1973):
𝑓(𝑑) =𝑐
𝑏(
𝑑−𝑎
𝑏)
𝑐−1
𝑒𝑥𝑝 (− (𝑑−𝑎
𝑏)
𝑐
) (2.1.)
where,
c – parameter of shape;
b – parameter of scale;
a – parameter of location.
Coefficients of Weibull distribution for each plot was calculated using ‘the Method
of Maximum Likelihood” and approximated using multiple regression. In regression model,
each of Weibull parameters was used as resultative value, and stand parameters, which had
low collinearity (r<0.50), were used as independent values. The best equation was found
with “Backward Stepwise LR” algorithm excluding non-significant (p>0.05) regressors,
and using Akaike information criteria (Akaike, 1974).
Changes of forest cover spatial distribution within landscape was analysed to the
forest massif that is a part of the SNP and is situated in Slitere Nature Reserve. Five
35
satellite images were obtained from Corona and Landsat, which were collected from 1966
to 2010. Images of Corona KH-4B mission in 1966 and 1972 were scanned panchromatic
scenes without coordinates. Therefore, Corona images were georeferenced to LKS92
coordinate system according to the ground control points recognizable on the original
Corona images as well on recent aerial and satellite images. To compare multiple datasets,
the images cell size must be the same, therefore “k-nearest neighbours” interpolation
method was used. For the images of 1966 and 1972, a spatial resolution of one pixel was
reduced from 1.8×1.8 m and 2.75×2.75 m to 30×30 m, respectively (McGarigal et al.,
1995, Buyantuyev, Wu, 2007).
Supervised classification of satellite images was done using Grass GIS 6.4.3. (Vitti,
2008). Forest maps of 1973 from LVMI “Silava” archive and available information about
stands within studied forest area from State Register of Forests were used to classify three
land cover classes: (1) “areas with low woody biomass” (swamps, heathlands, flooding
areas, obsolescent stands, and young stands); (2) “non-forest land” (agricultural land,
roads, water bodies, and industrial areas); and (3) “forest areas”. Forest landscape
composition, structure, and fragmentation were assessed using Fragstats 4.2 software
(McGarigal et al., 1995). Software ArcGIS Desktop 10.2.2. was used for spatial
visualization.
One-way ANOVA was used to assess influence of studied parameters. Distribution
of the studied parameters within different categories was assessed using Chi-squared test.
Relation between the parameters was assessed using linear regression. Calculations were
mainly done using R 2.13.0 (R Development Core Team 2011).
3. RESULTS AND DISCUSSION 3.1. Assessment of tree and stand parameters that determine the extent of damage
caused by freezing rain
Amount of ice, which was accumulated on trees after freezing rain, was assessed
for 57 broken overstorey trees (representing DBH 3–18 cm) from 12 stands – aboveground
biomass of these trees was measured with and without icing. Mass of ice was 1.5±0.27
times higher than tree biomass in a naturally moist stage. Correlation between tree biomass
and ice mass on it was tight and significant (r=0.92, p<0.01). Tree biomass with and
without ice was dependent on a stem diameter, and this relation was described the best by a
power function (Fig. 3.1.). However, results suggest that threshold of ice mass of trees with
similar DBH could notably differ. Presumably, it is related to tree crown asymmetry or
impact of wind, which might result in the tree breakage under lower ice mass. There is
insufficient information about thresholds of ice layer thickness that cause tree breakage;
some studies have reported 1–2 cm (Greene et al., 2007).
The proportion of damaged trees in pine and spruce stands was similar (p>0.05) —
26% and 27%, respectively. The proportion of broken trees was higher than that of bent
trees: 18% and 9% in pine stands and 16% and 11% in spruce stands, respectively. The
proportion of damaged (total and broken) trees is summarized in Table 3.1. according to
stands dominant species (pine or spruce), and these stands are divided by different stem
DBH groups (mean DBH of dominating species overstorey trees) and tree species (pine,
36
spruce, and birch). In pine stands, 26% of trees (26% of pines, 20% of spruces, and 32% of
birches) were damaged. There was a similar proportion of damaged trees in spruce stands –
27% (28% of pines, 27% of spruces, and 32% of birches).
The effect of tree height on the proportion of damaged trees was analysed using
overstorey trees. In the spruce stands, 8 m high trees had the highest proportion (25%) of
bent trees. For higher trees, the proportion of bent trees was from 1% to 7%. No broken
trees were found for trees smaller than 9.1 m, and the proportion of broken trees was low
(2–7%) when they did not exceed 13 m height. A rapid increase in the proportion of broken
trees was for 13 to 15 m high trees – from 2% to 33%, respectively. It was followed by a
decrease to ca. 20% for 16–17 m high trees. The highest proportion (41%) of broken trees
was observed for 18 m high trees, and it was followed by a decrease for higher trees.
For assessment of height of stem breakage, it is necessary to analyse types and
quality classes of extracted timber. In spruce stands, overstorey trees have 57% of living
crown, but mean relative height of breakage was 76% (Fig. 3.2.). In spruce stands 31% of
broken trees were damaged below the crown, i.e., lower than the first living branch. Stem
breakage below the crown was mostly (9%) found for trees with DBH 8.1–10.0 cm, and it
decreased for larger trees. Crown breakage gradually increased in the trees with stem DBH,
peaked (21%) for trees with DBH 22.1–24.0 cm, and decreased for larger trees.
In pine stands, 3.5–4.0 m high trees had the highest (33%) proportion of bent trees.
For larger trees, the proportion of bent trees decreased: 8 m high trees had 4%, while
higher trees – 0–7% of bent trees. The proportion of broken trees decreased from 10% to
2% for 3.5 m to 8 m high trees, followed by an increase to 16% for 11 m high trees. A
rapid increase (from 3% to 38%) was observed for 14 m to 21 m tall trees. Just like spruce
stands, higher trees had rapid decrease in the proportion of broken trees.
Mean crown length of pines was 52%, but relative height of stem breakage – 64%
(Fig. 3.3.). The proportion of trees, which were broken below the crown, rapidly (from 1%
to 22%) increased for trees with DBH from 2.1 to 18.0 cm, but the proportion of trees with
crown breakage increased gradually and reached 10%. The proportion of trees, which were
broken below the crown, peaked (20% to 22%) for trees with DBH from 16.1 to 24.0%,
followed by a rapid decrease, and no such tree was found among the trees with DBH larger
than 42 cm. The proportion of trees with crown breakage increased from 9% to 16% for
trees with DBH from 18.1 to 28.0 cm, and decreased for larger trees. Tendency of a higher
proportion of trees broken below the crown changed, when trees reached 21.4–26.0 cm
DBH – and larger trees had a higher proportion of trees which were broken at living crown
than below it. The results suggest that stem breakage below the crown is more common for
smaller trees, while crown breakage – for larger trees.
Stands were divided into two groups: recently (during the last three years before
freezing rain) thinned and other stands; data of overstorey trees was used. In the recently
thinned pine stands proportion of damaged trees was 25%, but in other pine stands 26%; in
recently thinned spruce stands – 31%, and in other spruce stands – 23% of damaged trees
(Tab. 3.2.).
The proportion of damaged trees in both pine and spruce stands was significantly
higher for understory trees, in comparison to overstorey trees. In both overstorey and
understory of pine stands, there were significantly (p<0.05) more broken trees found in the
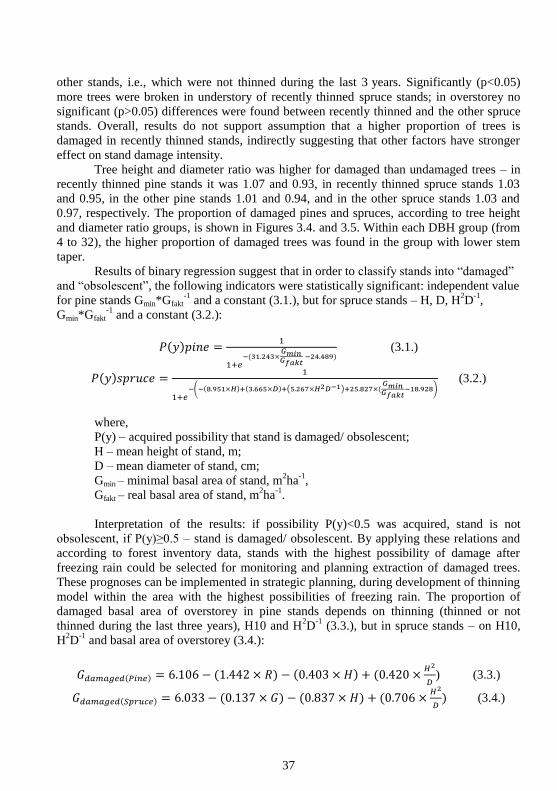
37
other stands, i.e., which were not thinned during the last 3 years. Significantly (p<0.05)
more trees were broken in understory of recently thinned spruce stands; in overstorey no
significant (p>0.05) differences were found between recently thinned and the other spruce
stands. Overall, results do not support assumption that a higher proportion of trees is
damaged in recently thinned stands, indirectly suggesting that other factors have stronger
effect on stand damage intensity.
Tree height and diameter ratio was higher for damaged than undamaged trees – in
recently thinned pine stands it was 1.07 and 0.93, in recently thinned spruce stands 1.03
and 0.95, in the other pine stands 1.01 and 0.94, and in the other spruce stands 1.03 and
0.97, respectively. The proportion of damaged pines and spruces, according to tree height
and diameter ratio groups, is shown in Figures 3.4. and 3.5. Within each DBH group (from
4 to 32), the higher proportion of damaged trees was found in the group with lower stem
taper.
Results of binary regression suggest that in order to classify stands into “damaged”
and “obsolescent”, the following indicators were statistically significant: independent value
for pine stands Gmin*Gfakt-1
and a constant (3.1.), but for spruce stands – H, D, H2D
-1,
Gmin*Gfakt-1
and a constant (3.2.):
𝑃(𝑦)𝑝𝑖𝑛𝑒 =1
1+𝑒−(31.243×
𝐺𝑚𝑖𝑛𝐺𝑓𝑎𝑘𝑡
−24.489) (3.1.)
𝑃(𝑦)𝑠𝑝𝑟𝑢𝑐𝑒 =1
1+𝑒−(−(8.951×𝐻)+(3.665×𝐷)+(5.267×𝐻2𝐷−1)+25.827×(
𝐺𝑚𝑖𝑛𝐺𝑓𝑎𝑘𝑡
−18.928) (3.2.)
where,
P(y) – acquired possibility that stand is damaged/ obsolescent;
H – mean height of stand, m;
D – mean diameter of stand, cm;
Gmin – minimal basal area of stand, m2ha
-1,
Gfakt – real basal area of stand, m2ha
-1.
Interpretation of the results: if possibility P(y)<0.5 was acquired, stand is not
obsolescent, if P(y)≥0.5 – stand is damaged/ obsolescent. By applying these relations and
according to forest inventory data, stands with the highest possibility of damage after
freezing rain could be selected for monitoring and planning extraction of damaged trees.
These prognoses can be implemented in strategic planning, during development of thinning
model within the area with the highest possibilities of freezing rain. The proportion of
damaged basal area of overstorey in pine stands depends on thinning (thinned or not
thinned during the last three years), H10 and H2D
-1 (3.3.), but in spruce stands – on H10,
H2D
-1 and basal area of overstorey (3.4.):
𝐺𝑑𝑎𝑚𝑎𝑔𝑒𝑑(𝑃𝑖𝑛𝑒) = 6.106 − (1.442 × 𝑅) − (0.403 × 𝐻) + (0.420 ×𝐻2
𝐷) (3.3.)
𝐺𝑑𝑎𝑚𝑎𝑔𝑒𝑑(𝑆𝑝𝑟𝑢𝑐𝑒) = 6.033 − (0.137 × 𝐺) − (0.837 × 𝐻) + (0.706 ×𝐻2
𝐷) (3.4.)
38
where,
R – if thinning was done during the last three years, R=1;
H10 – mean height of dominating species overstorey trees, m;
H2D
-1 – tree height (m) squared relative to stem diameter (cm);
G – basal area of overstorey, m2 ha
-1.
These relations can be used to determine stands, where the highest damage of
overstorey basal area is possible, as well as to plan a thinning model for stands in the
regions with the highest possibility of freezing rain occurrence in order to promote
resistance to this damage.
3.2. Stand regeneration after intense natural disturbance
In the area, where 70 years and older spruce stands were present prior to windstorm,
11 tree species were found 44–45 years after this disturbance. The most common species
was spruce (44% of total number of trees), silver and downy birch (22%), black alder
(11%), and aspen (6%). Analysis of species distribution among stand layers suggests that
most common species in overstorey was pioneer species birch (40%), and also spruce has
relatively high proportion (26%). From all spruces, 19% were overstorey trees
(192±37.0 trees ha-1
), 55% understory trees (575±72.5 trees ha-1
), and 26% advance
regeneration trees (273±65.6 trees ha-1
) (Fig. 3.6.). Significant (p<0.01) differences were
found between the number of spruces in overstorey and understory, as well as between the
number of trees (but not the proportion) between mesic and wet sites, according to stand
layer. The higher proportion of spruces in understory and as advance regeneration in
comparison to overstorey could be related to regeneration specifics of this species. A
number of studies have shown that spruce has more successful regeneration on
decomposed uprooted or broken tree debris than on undamaged soil or on open soil, which
is formed by tree uprooting (Hytteborn, Packham, 1987; Ilisson et al., 2007; Zielonka,
2006). In the study area, stands were completely obsolescent, trees were felled into piles,
thus their decomposition into suitable substrate for spruce regeneration could be delayed
(Harrington, Bluhm, 2001; Storaunet, Rolstad, 2002).
In overstorey, spruce was found in 48% of plots, and was dominant species in 23%
of plots on mesic and in 43% of plots on wet sites. The proportion of spruce higher than
70% of all trees in a plot was in 18% of plots, and such plots were found significantly
(p<0.001) more on wet sites (33%) than on mesic sites (11%). In understory, spruce was
more common – it was found in 83% of plots. In this stand layer, a high (≥70%) proportion
of spruce was found in 40% of plots.
Distance to undamaged or little damaged stand had significant effect (p<0.001) on
the proportion of overstorey spruce on the wet sites, but not on the mesic sites (Fig. 3.7.).
These results are consistent with other studies where spatial distribution of spruce
depending on distance to seed source have been examined (Coates, 2002). More detailed
analysis of seed source effect is hampered by lack of information about wind direction and
speed during the seed dispersal, as well as lack of information about seed production at this
time. It is known, that spruce flowering in the western part of Latvia in 1969 and 1970 was
estimated as medium and number of seeds available from tree was relatively low, but seeds

39
had high quality (Zviedre, 1971). However, these aspects can notably differ among the
stands, especially if they are located on forest types with different soil moisture regime
(Rone, 1965). Even density of overstorey spruces, regardless of a distance from undamaged
(remaining after windthrow) spruce stands on mesic sites, could be due to establishing
from seeds of windthrown spruces, which had cones of mature seeds at the time of
disturbance. Nevertheless, several remaining spruces (33 trees ha-1
on average) were
detected within the windthrown areas, which also could serve as a seed source. The
distance from undamaged forest had no effect on height of overstorey spruces neither on
dry nor on wet sites. It should be kept in mind, that the present stand structure was affected
not only by seed availability but also by establishment, which, in turn, is determined by
differences of climatic and microclimatic conditions (Clinton, Bake, 2000). A significantly
higher proportion of plots with the high proportion of understory spruces was found farther
than 25 m from undamaged stands. Presumably, this is a result of simultaneous seed
availability and not too high competition from undamaged stands, in combination with the
high proportion of spruces in overstorey.
Occurrence of spruce in regenerated stands was also affected by pre-storm advance
regeneration. In stand inventory data of 1963 (pre-storm), advance regeneration was
denoted only in three out of 32 plots, where this study was carried out. During the data
collection, in the plots where the occurrence of pre-storm advance regeneration was
detected visually, 95% of these trees were now classified as overstorey trees. Furthermore,
49% of all overstorey spruces were found in these plots, where pre-storm advance
regeneration was detected. Stand density in the plots, where pre-storm advance
regeneration was denoted, and in plots, where pre-storm advance regeneration was not
denoted, was similar. However, significant (p<0.01) differences of overstorey density were
found – in the plots, where pre-storm advance regeneration was or was not denoted,
overstorey density was 177.0±95.8 spruces ha-1
un 256±53 spruces ha-1
. These results
suggest that regeneration by seeds was hampered in the plots where pre-storm regeneration
was established.
In order to justify visual assessment of advance regeneration, in spruce stands on
two forest types (Myrtilloso–sphagnosa and Oxalidosa), the size of plots was extended and
increment cores were sampled from the trees, which were visually classified as pre-storm
advance regeneration. Results show that the pre-storm regeneration ensures 19% and 59%
of the total number of overstorey trees 45 years after windthrow. The most successful
establishment occurred during the first 10 years after windthrow, when most of overstorey
spruces were established – 85% on Myrtilloso–sphagnosa forest type and 62% on
Oxalidosa forest type (Fig. 3.8.).
Impact of pre-storm advance regeneration on spruce occurrence after 45 years was
higher than could be predicted from the pre-storm stand inventory data, indicating that also
relatively small groups of advance regeneration with low density (which are not denoted in
inventory data) have notable impact on stand regeneration. No differences were found
between dimensions of initial pre-storm advance regeneration trees and trees that emerged
after the windthrow. This is related to a necessity of adapting to notably different light (and
in certain cases also soil moisture regime), changing needles (photosynthetic mechanism),
and adapting their root system to altered conditions (Kneeshaw et al., 2002). Only

40
afterwards these trees can form height and radial increment (Panayotov et al., 2011). In a
meantime, trees that were established after the windthrow can reach similar dimensions.
The analysis of all regenerated trees showed that height of overstorey spruces
(20.7±0.66 m) was significantly (p<0.01) lower than height of aspen (27.3±1.53 m), and
similar to height of birch (21.7±0.50 m), black alder (21.5±0.68 m), and other species
(19.2±1.03 m). Height of overstorey spruces, as well as birch and black alder, was similar,
regardless of different spruce density within the plots. Height of spruces on mesic sites was
significantly (p<0.001) higher than on wet sites, 22.5±0.54 m and 17.7±1.01 m,
respectively. Height of understory trees differed significantly (p<0.001) among the species.
Spruces (10.6±0.46 m) had the lowest height, and height of other species was from
12.4±0.63 m (for other species) to 16.7±1.18 m (for aspen).
The DBH of overstorey spruce (22.3±0.94 cm) was significantly (p<0.01) lower
than DBH of aspen (25.7±2.06 cm), but higher than DBH of birch (19.3±0.80 cm), black
alder (21.6±1.47 cm), and other (19.4±1.72 cm) species (Fig. 3.9.).
Like height, also DBH of spruce was similar, regardless of its density between the
plots. Within the plots with no spruce, overstorey birch, aspen, and other species had DBH
19.5±0.91 cm, 25.7±2.97 cm and 18.2±2.22 cm, and it was similar within the plots, where
spruce was found. In contrast, black alder was thicker within the plots, where spruce was
found than where it was not found: 22.7±1.93 cm and 17.8±1.75 cm, respectively. These
results indicated that pioneer species had no noticeable effect on growth of spruce, and
indirectly indicated that tree establishment (occurrence and survival of pre-storm advance
regeneration, seed and suitable substrate availability, climatic conditions during the first
years of seedling establishment, etc.) is the main factor that affects species composition
after windthrow.
Similarly to overstorey spruce height, also its DBH was significantly (p<0.01)
lower on wet sites (19.4±1.48 cm) than on mesic sites (23.8±1.04 cm). Dimensions of
understorey spruce were similar, regardless of the proportion of spruce within the plots and
between the forest types.
In most stands on Oxalidosa forest type, the proportion of trees according to tree
DBH fit to Weibull distribution (Kolmogorov-Smirnov test; p>0.05), but on Myrtilloso–
sphagnosa forest type – only few (20%) stands fit therein. Mean values of this distribution
between the forest types differed significantly (p<0.05): values of shape and scale on
Myrtilloso–sphagnosa forest type (0.79 and 5.60, respectively) were lower than on
Oxalidosa forest type (1.90 and 15.90, respectively); however, the coefficient of location
on Myrtilloso–sphagnosa forest type was higher (7.93 and 5.10, respectively) than on
Oxalidosa forest type (Fig. 3.10.). According to Bailey and Dell (1973), if theoretical
distribution coefficient of shape is <1 (likewise on Myrtilloso–sphagnosa forest type), tree
diameter distribution can be characterised by a negative exponential function. Such tree
diameter distribution is commonly found for stands with trees of different age (Burkhart,
Tomé, 2012). On Oxalidosa forest type, tree diameter distribution can be explained by a
unimodal positive function.
Multiple factor ANOVA showed significant (p<0.05) relation among coefficients of
shape (R2=0.79), scale (R
2=0.80), and location (R
2=0.53) of Weibull distribution with mean
DBH and DBH range (3.5., 3.6., and 3.7.).

41
y (shape)=0.54368*D-0.09174𝐷𝑟𝑎𝑛𝑔𝑒-4.85681 (3.5.)
y (scale)=3.3651*D-0.3884𝐷𝑟𝑎𝑛𝑔𝑒-33.9265 (3.6.)
y (location)=-1.4240*D+0.5217𝐷𝑟𝑎𝑛𝑔𝑒+14.2451 (3.7.)
where
D – the mean stem diameter at 1.3 m height, cm;
Drange – residual between the highest and the lowest DBH within plot.
Relation between coefficients of Weibull distribution and stand basal area and
density, which has been observed in other studies (Kilkki et al., 1989), was not found in
this study.
Asymmetry of DBH distribution can be caused by a large number of supressed, but
still living trees, which is common for shade-tolerant species in high density stands
(Lorimer, Krug, 1983). In this study, stand relative density on Oxalidosa forest type was
higher than on Myrtilloso–sphagnosa forest type: 0.8 and 0.45, respectively. Difference
between the basal area of these forest types was notable and significant (p<0.001):
36.8±6.39 m2 ha
-1 on Oxalidosa forest type and 18.3±2.37 m
2 ha
-1 on Myrtilloso–sphagnosa
forest type. Mean stand density of both forest types was similar (p>0.05):
1295±181 trees ha-1
on Oxalidosa forest type and 1222±213 trees ha-1
on Myrtilloso–
sphagnosa forest type. However, a high proportion of dead trees indicated intense
self-thinning on Oxalidosa forest type: from 16 to 36% of all trees, compared to
Myrtilloso–sphagnosa forest type where it was ≤5%. Rouvinen and Kuuluvainen (2005) in
an unmanaged area after another natural disturbance (forest fire) have found, that after
intense self-thinning (at age of 50–60 years), DBH distribution in spruce forest changes
from negative exponential to bimodal.
The equation from this study could be applied to characterize unmanaged forests in
similar forest types.
3.3. Long-term dynamic of landscape after disturbance
During the last 50 years after windthrow in 1969, the largest changes of landscape
were observed in the study area of Slitere National Park. Large area of forest was affected
in large area damaging both stands and individual trees and groups of trees; as a result,
homogeneous areas, i.e., patches, of different size and structure were formed. In this
research, the term “patch” is defined as relatively homogenous nonlinear area that differs
from the surrounding area by its characteristics and appearance (Forman, 1995).
Forest maps with different land cover classes and their dynamics are showed in
Figure 3.11.
The total number of the patches was similar three years before (956 in 1966) and
three years after (997 in 1972) windthrow, but in 2010, the landscape consisted of a notably
lower (207) number of the patches (Tab. 3.3.). Mean area of a patch from 1966 to 2010
increased from 1.68 ha to 7.95 ha. Within landscapes, where one or several patches
dominate and a high number of small patches occurs, it is recommended to use area-
weighted mean patch size (Tērauds, 2011). In the studied area, the area-weighted mean
patch size decreased after the windthrow – from 1038 ha in 1966 to 594 ha in 1972; but in
42
following years, it reached the pre-storm size and even slightly exceeded it. The indices of
landscape heterogeneity – Shannon diversity index increased (from 0.55 in 1966 to 0.89 in
1972), but after 29 years, it returned to pre-storm level.
Long-term changes within the forest landscape could be combined with analysis of
landscape level and land cover class level. Three years before the windstorm, most of
forest landscape was covered by land cover class “forest areas” (1310 ha or 81.3% of the
total area), but land cover class “areas with low woody biomass” and “non-forest land”
were found as several discrete patches, and they formed 264 ha and 37 ha or 16.4% and
2.3% from the total area, respectively (Tabs. 3.4., 3.5., and 3.6.). After the windthrow,
“forest areas” area decreased to 457 ha, but “areas with low woody biomass” and
“non-forest land” increased to 1015 ha and 173 ha, respectively. Since 1988, the proportion
of land cover was similar to the pre-storm level, i.e., in 1988 “forest areas” covered 80.8%,
“areas with low woody biomass” 15.4%, and “non-forest land” 3.7% of the total studied
area. Hence, forest has successfully regenerated in the major part of the damaged area–
canopy cover has formed continuously 29 years after windthrow.
In 1966, the area of “forest areas” consisted of 48 patches (three patches per ha),
with mean area 27.29 ha. After windthrow (in 1972), the number of patches notably
increased – 516 patches or 31.4 patches ha-1
with mean size of 0.89 ha. In the following
years, the number of patches varied from 18 to 32 (from 1.1 to 1.9 patches ha-1
), and mean
patch area in 1998 (30.24 ha) and 2010 (52.99 ha) was significantly (p<0.05) larger than in
1972 (0.89 ha). Before the storm (in 1966) and from 1988 to 2010, the area- weighted
mean patch size of “forest areas” was from 1210 ha to 1324 ha, but soon after the
windthrow (in 1972) it was only 23 ha.
Land cover class “areas with low woody biomass” consisted of 638 patches in
1966, and decreased to 72 in 1972; 39.6 and 4.4 patches ha-1
, respectively. Significant
(p<0.05) differences were found between the mean patch size in 1966 and 1972, 0.41 ha
and 14.1 ha, respectively. Significant (p<0.05) differences were found also between the
mean patch size in 1972 and 1988 (1.16 ha). Also the area-weighted mean patch size
increased after the windthrow – from 16 ha in 1966 to 952 ha in 1972. Notable additional
damage to landscape caused by beavers was visually observed – since 2005 land cover
class “areas with low woody biomass” increased to 2.60 ha in 2010, and the area-weighted
mean patch size increased to 48 ha.
The smallest land cover class was “non-forest land”. After windthrow, its area
partly increased due to small spectral value differences from that of “areas with low woody
biomass”. “Non-forest land” decreased to 40 ha in 2010, which could indicate natural
afforestation of these areas.
In landscape ecology, also patch shape and length of its edge are important
parameters (Fahrig, 2003). In the study of The Northern Vidzeme Biosphere Reserve,
A Tērauds has observed that land management alters configuration of landscape, and it
becomes simpler and mostly has quadrangular shaped patches (Tērauds, 2011). Similarly,
also in this study natural forest landscape has simple shaped patches. Tendency of shapes
to become more complex was observed, but during the 1972 to 2010 the mean index of
shape changed from 1.31 to 1.39 (p>0.05). Analysis of each land-use category showed that
the mean shape index of “forest areas” before windthrow was 1.51 and decreased to 1.37
43
after it, but 20–40 years after the windthrow it was from 1.42 to 1.56. Thus, effect of
former land management was gone already before the windthrow. From 1988 to 2010, the
mean shape index of “non-forest land” was from 1.35 to 1.43, and it was significantly
(p<0.05) higher in comparison to 1966 (1.26) and 1972 (1.18). That could be related to
more complex shaped patches below waterbodies, caused by an activity of beavers.
Complexity of the patches shape increased for “areas with low woody biomass”,
indicated by the shape index increase from 1.28 before the windthrow to 1.57 after it.
During the forest regeneration, the shape index decreased to 1.33 in 1998. It slightly
increased in 2010, presumably caused by new damage after windthrow in 2005.
Analysis of length of the patch edge showed that decrease in the patch size and
increase in the patch density within landscape cause decrease of the mean length of the
patch edge. The largest total length and density of the edges were observed in 1972 –
413.8 km and 251 m ha-1
, respectively. Before the windthrow, these indicators were
213.4 km and 133 m ha-1
, respectively; but the lowest total length and density of the edges
were observed in 2010 – 73.8 km and 45 m ha-1
, respectively.
Patch isolation or an indicator of habitat availability is an important indicator of
landscape configuration, and it shows possibilities for species to spread and move (Foster
et al., 1998; Kouki et al., 2001), as well as it allows assessing vitality of species within
fragmented habitats (Tērauds, 2011). The results of the study show that the area-weighted
mean nearest neighbour distance soon after the windthrow (in 1972) increased by 45 m and
was significantly higher before and after the storm (61, 16, and 19 m, respectively).
The results indicate that most of the indicators of landscape fragmentation reached
their pre-storm level in 29 years after the windthrow in 1969. Hence, if intense windthrows
or other natural disturbances follow subsequently each other after a long-enough time lapse
under similar conditions, they will not have permanent impact on landscape fragmentation
in an unmanaged area.
CONCLUSIONS 1. The proportion of trees damaged by freezing rain in pine and spruce stands did not
differ significantly and was 28% and 27%, respectively. Both coniferous species
stands had more broken trees than bent/uprooted, indicating that the
interchangeability with both coniferous species should not be used as a measure to
reduce risk of the freezing rain damages.
2. The parameters of individual and collective stability coniferous trees against
freezing rain damages are tree height, the height to diameter at breast height ratio,
and stands basal area; the impact has been adjusted by recent (in the last 3 years
before this meteorological phenomena) commercial thinning. Timely thinning in
advance to improve the tree individual stability and crown asymmetry can reduce
the resilience of the stands to this meteorological phenomenon.
3. In the place of the storm disturbed Norway spruce stands 45 years after the storm
and without any management, the most abundant tree species were spruce (44 %).
44
However, it successfully competed with the pioneer species and dominated in 23 %
on the mesic sites and in 43 % on the wet sites, in addition the height and diameter
at breast height of the overstorey spruce did not differ statistically significantly
between the pioneer species (except aspen).
4. Both the mean diameter and height did not differ significantly among birch, black
alder, and aspen regardless of the proportion of spruce in the overstorey showing
these areas as suitable for the growth of the pioneer species. Consequently, the
occurrence and regeneration of spruce was determined by the presence of the initial
pre-storm advance regeneration trees. The distance to the seed source had
statistically significant impact on the proportion of overstorey spruces on the wet
sites. In contrast, on the mesic sites, where advance regeneration (59 % of
overstorey spruces on Oxalidosa forest type) was detected more commonly, the
proportion of spruces was not affected by the distance to the seed source.
5. Overstorey spruces exceeded one age-class on 29 % of the area. Furthermore, 49 %
from all these overstorey spruces prior to the storm in 1969 were detected as
advance regeneration. No significant differences were detected between initial pre-
storm advance regeneration trees and trees that had emerged after the windthrow.
6. Windthrow increased forest landscape fragmentation, and its impact on forest was
maintained over the time period of up to 30 years, as showed by the patch size,
shape, and distance indices. More often recurrence of the storms is expected to
make permanent changes to the spatial structure of the landscape.


![[PPT]KONSEP DASAR KEPERAWATAN KOMUNITAS · Web view... Hospital with aged care facilities Hostels Aged Care Assessment Team Community Family/older people Day care Respite care Support](https://img.pdfslide.tips/doc/110x75/5b3fec937f8b9a91078ca937/pptkonsep-dasar-keperawatan-komunitas-web-view-hospital-with-aged-care.jpg)