Embed Size (px)
Citation preview
Mol2Net, 2015, 1(Section B), pages 1-11, Proceedings 1
http://sciforum.net/conference/mol2net-1
Mol2Net
Prediction of the Total Antioxidant Capacity of Food
Based on Artificial Intelligence Algorithms Estela Guardado Yordi 1,2*, Raúl Koelig 1, Yailé Caballero Mota 1, Maria João Matos 2,
Lourdes Santana 2, Eugenio Uriarte 2and Enrique Molina 1,2 1 Universidad de Camagüey Ignacio Agramonte Loynaz, Circunvalación Norte Km 51/2, Camagüey,
Cuba; E-Mials: [email protected] (R.K.); [email protected] (Y.C.M.);
[email protected] (E.M.) 2 Universidade de Santiago de Compostela, Campus Vida, Santiago de Compostela;
E-Mials: [email protected] (M.J.M.); [email protected] (L.S.);
[email protected] (E.U.)
* Author to whom correspondence should be addressed; E-Mail: [email protected]; Tel.:
+53-32-261192.
Received: 12 October 2015 / Accepted: 9 November 2015 / Published: 4 December 2015
Abstract: The growing increase in the amount and type of nutrients in food created the necessity for a
more efficient use applied to dietetics and nutrition. Flavonoids are exogenous dietetic antioxidants
and contribute to the total antioxidant capacity of the food. This paper aims to explore the data using
different algorithms of artificial intelligence to find the one that best predict the total antioxidant
capacity of food by the oxygen radical absorbance capacity (ORAC) method. A record of composition
data based on the Database for the Flavonoid Content of Selected Foods and the Database for the
Isoflavone Content of Selected Foods, was created. The KNN (K-Nearest Neighbors) and supervised
unidirectional networks MLP (MultiLayer Perceptron) technics were used. The attributes were: a)
amount of flavonoid (mean), b) class of flavonoid, c) Trolox equivalent antioxidant capacity (TEAC)
value of each flavonoid, d) probability of clastogenicity and clastogenicity classification by
Quantitative Structure-Activity Relationship (QSAR) method and e) total polyphenol (TP) value. The
variable to predict the activities was the ORAC value. For the prediction, a cross-validation method
was used. For the KNN algorithm the optimal K value was 3, making clear the importance of the
similarity between objects for the success of the results. It was concluded the successful use of the
MLP and KNN techniques to predict the antioxidant capacity in the studied food groups.
Keywords: Flavonoid, Artificial intelligence, MultiLayer Perceptron algorithm, K-Nearest
Neighbors algorithm.
Mol2Net YouTube channel: http://bit.do/mol2net-tube
SciForum
Mol2Net, 2015, 1(Section B), pages 1-11, Proceedings 2
http://sciforum.net/conference/mol2net-1
1. Introduction
In the recent years, database including
information about the emerging food
composition database were created [1-3]. These
databases are centred in the composition of
bioactive substances including flavonoids.
Flavonoids are present in several sources in the
vegetal kingdom and display a large range of
biological properties. They are already proved
their benefits for health [4,5]. Therefore, their
study is a topic of interest. One of the most
important activities is related to their antioxidant
capacity [1,6-8].
An antioxidant is a substance, even in small
amounts comparing to the substrate, that is able
to decrease the oxidation of that substrate [9].
Furthermore, the antioxidant activity is
correlated to the prevention of chronic diseases
of high prevalence in different countries [10].
The food composition database of flavonoids
has huge chemical information due to the
structural diversity of the compounds included
on it. This database provides researchers with
new values on the flavonoid content of many
foods in order to better ascertain the impact of
flavonoid consumption against several chronic
diseases [2, 3]. Flavonoids, particularly flavan-3-
ols, have been associated with the reduction in
the risk of cardiovascular diseases by modulating
different mechanisms of primary and secondary
prevention [11].
This project was developed taking into account
the possibility of generating predictive
information related to the data found in the food
composition database. In particular, we were
looking for a tool to predict the antioxidant
capacity of food containing different compounds
with flavonoid scaffold (dietary exogenous
antioxidants). This project was focus on the idea
that a dietary antioxidant is a substance that
significantly decreases the adverse effects of
reactive species, such as reactive oxygen and
nitrogen species, on normal physiological
function in humans [12].
The data regarding the composition of food is
complex and extensive [13]. Therefore, it is hard
to process all the information regarding the
different assays presented in the literature.
However, the processing of the information is
still performed by classic statistical
methodologies [14,15]. When the problem is
complex and mediated by non-lineal behaviours,
it could be studied either by a multivariate
perspective or by using artificial intelligence
technics (AI) [16]. In particular, artificial
neuronal networks (ANN) are able to develop a
predictive model that automatically includes
relationships between the analysed variables,
with no necessity of included them in the model.
In the biomedical field, several unidirectional
supervised networks were used, specially based
on the MultiLayer Perceptron (MLP) [16].
However, as far as we know, these technics were
never been used related to food composition
databases. Therefore, the current work is centred
in the development of an AI algorithm that allow
the prediction of the total antioxidant capacity of
the food, based on quantitative information,
topologic-structural and the bioactivity of
flavonoids.
2. Results and Discussion
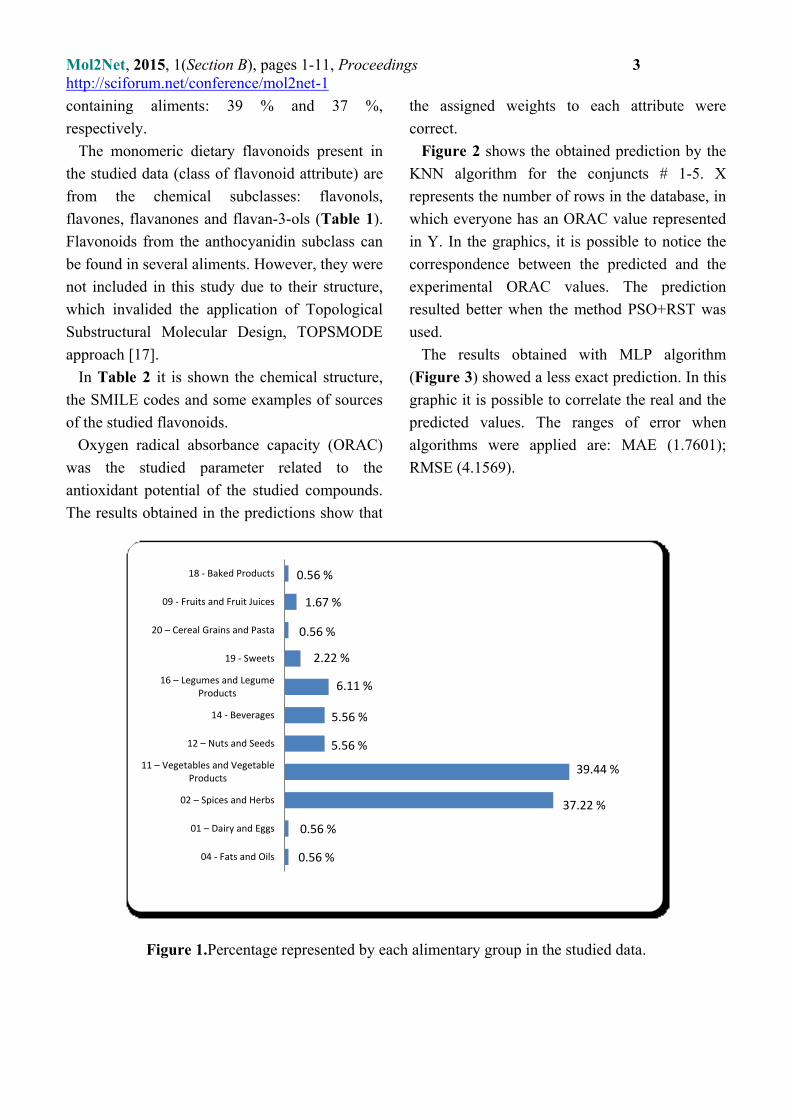
The studied food was divided in 11 groups
(Figure 1). Vegetables, vegetable spices and
herbs, are the groups with more flavonoid-
Mol2Net, 2015, 1(Section B), pages 1-11, Proceedings 3
http://sciforum.net/conference/mol2net-1
containing aliments: 39 % and 37 %,
respectively.
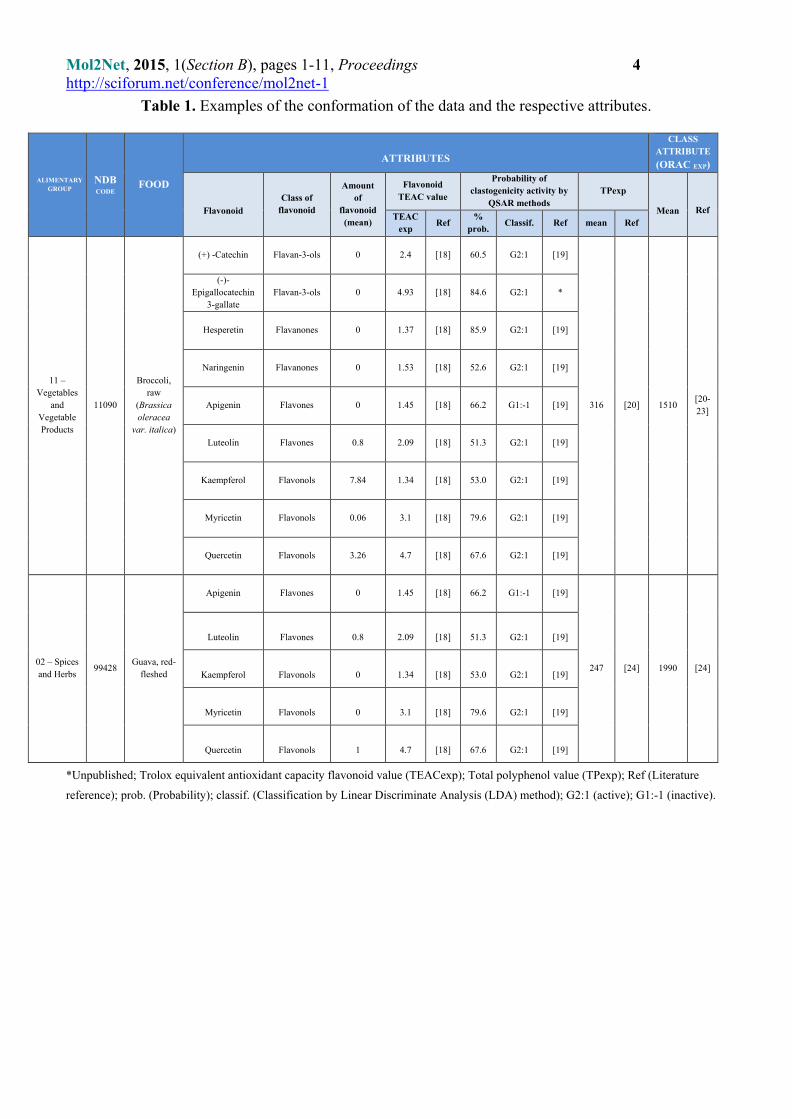
The monomeric dietary flavonoids present in
the studied data (class of flavonoid attribute) are
from the chemical subclasses: flavonols,
flavones, flavanones and flavan-3-ols (Table 1).
Flavonoids from the anthocyanidin subclass can
be found in several aliments. However, they were
not included in this study due to their structure,
which invalided the application of Topological
Substructural Molecular Design, TOPSMODE
approach [17].
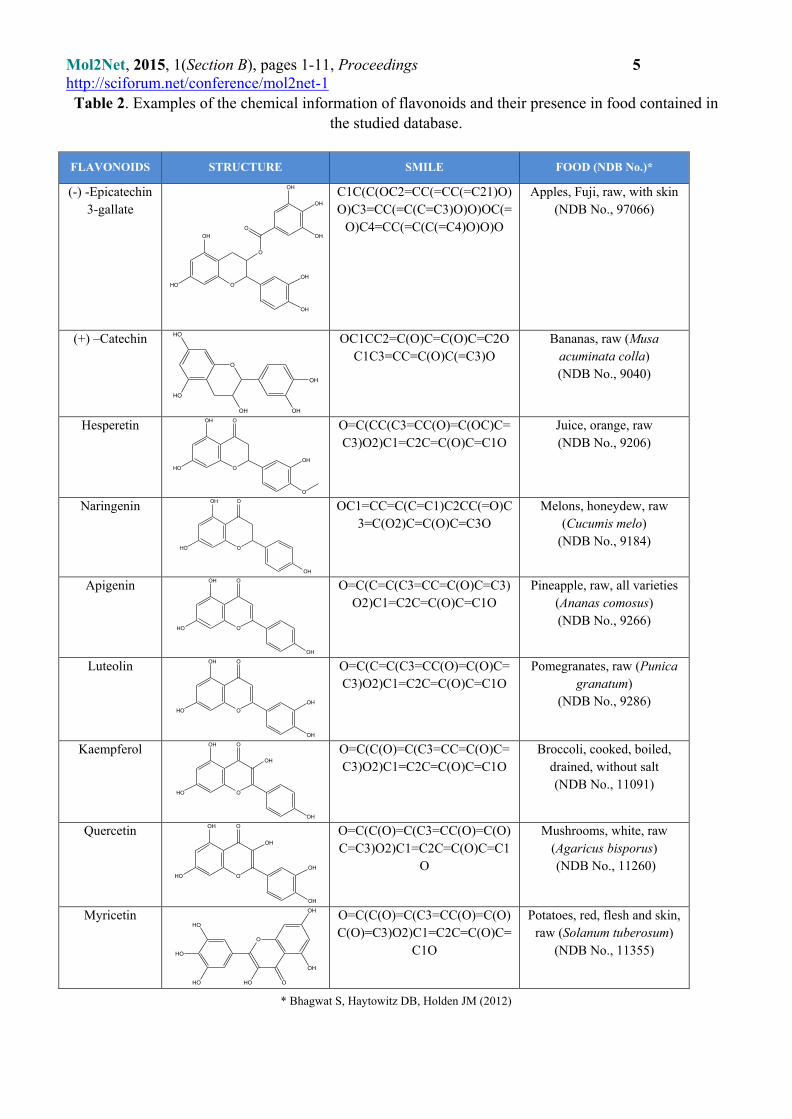
In Table 2 it is shown the chemical structure,
the SMILE codes and some examples of sources
of the studied flavonoids.
Oxygen radical absorbance capacity (ORAC)
was the studied parameter related to the
antioxidant potential of the studied compounds.
The results obtained in the predictions show that
the assigned weights to each attribute were
correct.
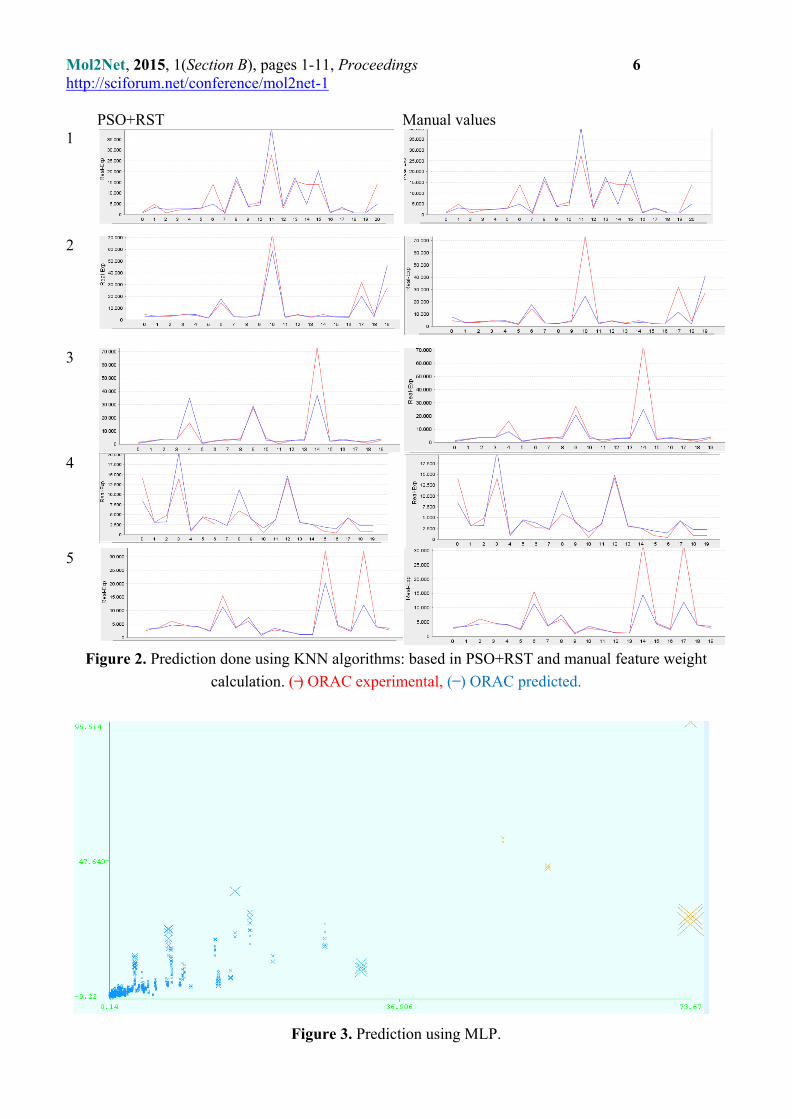
Figure 2 shows the obtained prediction by the
KNN algorithm for the conjuncts # 1-5. X
represents the number of rows in the database, in
which everyone has an ORAC value represented
in Y. In the graphics, it is possible to notice the
correspondence between the predicted and the
experimental ORAC values. The prediction
resulted better when the method PSO+RST was
used.
The results obtained with MLP algorithm
(Figure 3) showed a less exact prediction. In this
graphic it is possible to correlate the real and the
predicted values. The ranges of error when
algorithms were applied are: MAE (1.7601);
RMSE (4.1569).
Figure 1.Percentage represented by each alimentary group in the studied data.
0.56 %
0.56 %
37.22 %
39.44 %
5.56 %
5.56 %
6.11 %
2.22 %
0.56 %
1.67 %
0.56 %
04 - Fats and Oils
01 – Dairy and Eggs
02 – Spices and Herbs
11 – Vegetables and Vegetable Products
12 – Nuts and Seeds
14 - Beverages
16 – Legumes and Legume Products
19 - Sweets
20 – Cereal Grains and Pasta
09 - Fruits and Fruit Juices
18 - Baked Products
Mol2Net, 2015, 1(Section B), pages 1-11, Proceedings 4
http://sciforum.net/conference/mol2net-1
Table 1. Examples of the conformation of the data and the respective attributes.
ALIMENTARY
GROUP
NDB
CODE FOOD
ATTRIBUTES
CLASS
ATTRIBUTE
(ORAC EXP)
Flavonoid
Class of
flavonoid
Amount
of
flavonoid
(mean)
Flavonoid
TEAC value
Probability of
clastogenicity activity by
QSAR methods
TPexp
Mean
Ref TEAC
exp Ref
%
prob. Classif. Ref mean Ref
11 –
Vegetables
and
Vegetable
Products
11090
Broccoli,
raw
(Brassica
oleracea
var. italica)
(+) -Catechin Flavan-3-ols 0 2.4 [18] 60.5 G2:1 [19]
316 [20] 1510 [20-
23]
(-)-
Epigallocatechin
3-gallate
Flavan-3-ols 0 4.93 [18] 84.6 G2:1 *
Hesperetin Flavanones 0 1.37 [18] 85.9 G2:1 [19]
Naringenin Flavanones 0 1.53 [18] 52.6 G2:1 [19]
Apigenin Flavones 0 1.45 [18] 66.2 G1:-1 [19]
Luteolin Flavones 0.8 2.09 [18] 51.3 G2:1 [19]
Kaempferol Flavonols 7.84 1.34 [18] 53.0 G2:1 [19]
Myricetin Flavonols 0.06 3.1 [18] 79.6 G2:1 [19]
Quercetin Flavonols 3.26 4.7 [18] 67.6 G2:1 [19]
02 – Spices
and Herbs 99428
Guava, red-
fleshed
Apigenin Flavones 0 1.45 [18] 66.2 G1:-1 [19]
247 [24] 1990 [24]
Luteolin Flavones 0.8 2.09 [18] 51.3 G2:1 [19]
Kaempferol Flavonols 0 1.34 [18] 53.0 G2:1 [19]
Myricetin Flavonols 0 3.1 [18] 79.6 G2:1 [19]
Quercetin Flavonols 1 4.7 [18] 67.6 G2:1 [19]
*Unpublished; Trolox equivalent antioxidant capacity flavonoid value (TEACexp); Total polyphenol value (TPexp); Ref (Literature
reference); prob. (Probability); classif. (Classification by Linear Discriminate Analysis (LDA) method); G2:1 (active); G1:-1 (inactive).
Mol2Net, 2015, 1(Section B), pages 1-11, Proceedings 5
http://sciforum.net/conference/mol2net-1
Table 2. Examples of the chemical information of flavonoids and their presence in food contained in
the studied database.
FLAVONOIDS STRUCTURE SMILE FOOD (NDB No.)*
(-) -Epicatechin
3-gallate
O
OH
HO
OH
OH
O
O
OH
OH
OH
C1C(C(OC2=CC(=CC(=C21)O)
O)C3=CC(=C(C=C3)O)O)OC(=
O)C4=CC(=C(C(=C4)O)O)O
Apples, Fuji, raw, with skin
(NDB No., 97066)
(+) –Catechin
OH
HO
HO
O
OH
OH
OC1CC2=C(O)C=C(O)C=C2O
C1C3=CC=C(O)C(=C3)O
Bananas, raw (Musa
acuminata colla)
(NDB No., 9040)
Hesperetin O
OH
O
OHO
OH
O=C(CC(C3=CC(O)=C(OC)C=
C3)O2)C1=C2C=C(O)C=C1O
Juice, orange, raw
(NDB No., 9206)
Naringenin
OH
O
OHO
OH
OC1=CC=C(C=C1)C2CC(=O)C
3=C(O2)C=C(O)C=C3O
Melons, honeydew, raw
(Cucumis melo)
(NDB No., 9184)
Apigenin O
OH
OHO
OH
O=C(C=C(C3=CC=C(O)C=C3)
O2)C1=C2C=C(O)C=C1O
Pineapple, raw, all varieties
(Ananas comosus)
(NDB No., 9266)
Luteolin O
OH
OH
OHO
OH
O=C(C=C(C3=CC(O)=C(O)C=
C3)O2)C1=C2C=C(O)C=C1O
Pomegranates, raw (Punica
granatum)
(NDB No., 9286)
Kaempferol O
OH
OH
OHO
OH
O=C(C(O)=C(C3=CC=C(O)C=
C3)O2)C1=C2C=C(O)C=C1O
Broccoli, cooked, boiled,
drained, without salt
(NDB No., 11091)
Quercetin O
OH
OH
OH
OHO
OH
O=C(C(O)=C(C3=CC(O)=C(O)
C=C3)O2)C1=C2C=C(O)C=C1
O
Mushrooms, white, raw
(Agaricus bisporus)
(NDB No., 11260)
Myricetin
OHOHO
HO
HO
O
OH
OH
O=C(C(O)=C(C3=CC(O)=C(O)
C(O)=C3)O2)C1=C2C=C(O)C=
C1O
Potatoes, red, flesh and skin,
raw (Solanum tuberosum)
(NDB No., 11355)
* Bhagwat S, Haytowitz DB, Holden JM (2012)
Mol2Net, 2015, 1(Section B), pages 1-11, Proceedings 6
http://sciforum.net/conference/mol2net-1
PSO+RST
Manual values
1
2
3
4
5
Figure 2. Prediction done using KNN algorithms: based in PSO+RST and manual feature weight
calculation. ( ̶) ORAC experimental, ( ̶ ) ORAC predicted.
Figure 3. Prediction using MLP.
Mol2Net, 2015, 1(Section B), pages 1-11, Proceedings 7
http://sciforum.net/conference/mol2net-1
MAE (1.7601) and RMSE (4.1569)
3. Materials and Methods
1. Conformation of the data related to the
food composition
The information was obtained in different
food composition database: a) database for the
flavonoid content of selected foods, Release 3.1
(FDB 3.1) and b) isoflavones database released
by the USDA in 2008 (IDB 2) [2,3]. Therefore, it
was used the estimation techniques for
calculating unavailable values, and decision
making procedure described by Bhagwat S et al
[15]. This information was used to prepare the
register of the data related to the composition of
flavonoids in different foods. The Standard
Reference (SR) [5] was used to identify each
unique food entry if it matches a food in SR.
2. Prediction using AI algorithms
Training set and test set. To obtain the
training set and test set it was used k-fold cross
validation method of k10 iterations [4].
Attribute selections and weight assignation.
To the attributes, different weights were assigned
taking into account their influence in the attribute
class:
i) Trolox equivalent antioxidant capacity
flavonid value (TEACexp),
ii) Class of flavonoid,
iii) Flavonoids,
iv) Amount of flavonoid (mean),
v) Total polyphenol value (TPexp),
vi) Probability of clastogenicity and
clastogenicity classification by
Quantitative Structure-Activity
Relationship (QSAR) method.
These experimental parameters were taken
from the scientific literature. The variable
selected (attribute class) to predict was the
ORACexp value, expressed in μmolTE/100 g.
ORAC was selected because it is considered to
be the preferable methodology to evaluate the
antioxidant capacity due to the biological
relevance to the in vivo antioxidant efficacy [25].
The assay has been used to measure the
antioxidant activity of foods and measures the
degree of inhibition of peroxy-radical-induced
oxidation by the compounds of interest in a
chemical milieu.
ORACexp and TPexp (mgGAE/100 g) for each
substrate were found in the literature. The
analytical method developed by Prior et al was
used as the reference method for select published
sources [26].
A different weight was assigned to each
attribute using the measure of the quality of a
similarity decision system. Weights were
assigned manually and using the Particle Swarm
Optimization+Rougt Set Theory method
(PSO+RST) [21,22,27]. PSO+RST was
implemented in PROCONS software.
AI algorithms. KNN (K-Nearest Neighbors)
and supervised unidirectional networks MLP,
MultiLayer Perceptron algorithms, were used.
These algorithms were implemented in the
PROCONS software version 4.0 [27] and
WEKA version 3.5.7, respectively.
i) KNN, K-Nearest Neighbors
KNN method is based in the paradigm that
similar entrance values have the same similar
exits. They are calculated based on the nearest
neighbors.
Using KNN, if the neighbors k{e1,…,ek}
have values {v1,..,vk} for the studied variable,
tan the value e’ is:
Mol2Net, 2015, 1(Section B), pages 1-11, Proceedings 8
http://sciforum.net/conference/mol2net-1
a) if all are similar weights:
𝑣 =∑ 𝑣𝑖
𝑘𝑖=1
𝑘 (I)
b) if they are different weights:
𝑣 =∑ 𝑤𝑖𝑣𝑖
𝑘𝑖=1
∑ 𝑤𝑖𝑘𝑖=1
(II)
ii) MLP, MultiLayer Perceptron
Units called neurons compose a neuronal
network. Each neuron receives a series of
entrances related to interconnexions and emits an
exit. Furthermore the weights and connexions,
each neuron was associated a transference
mathematic function. This function generates the
exit signal of the neuron based on the entrance
signals.
Evaluation of the precision of the
algorithms. To evaluate the precision of the
results obtained for both methods, they were
used [28]: (a) Mean Absolute Error, MAE and
(b) Root Mean Square Error, RMSE, (III)-(IV):
𝑀𝐴𝐸 =∑ |𝑎𝑖−𝑦𝑖
𝑎𝑖|𝑁
𝑖=1
𝑁∗ 100 % (III)
𝑅𝑀𝑆𝐸 = √∑ |𝑎𝑖−𝑦𝑖𝑎𝑖
|2
𝑁𝑖=1
𝑁∗ 100 % (IV)
Where: ai is the desirable exit value; yi is the
value produced by the method and N is the
numbers of objects.
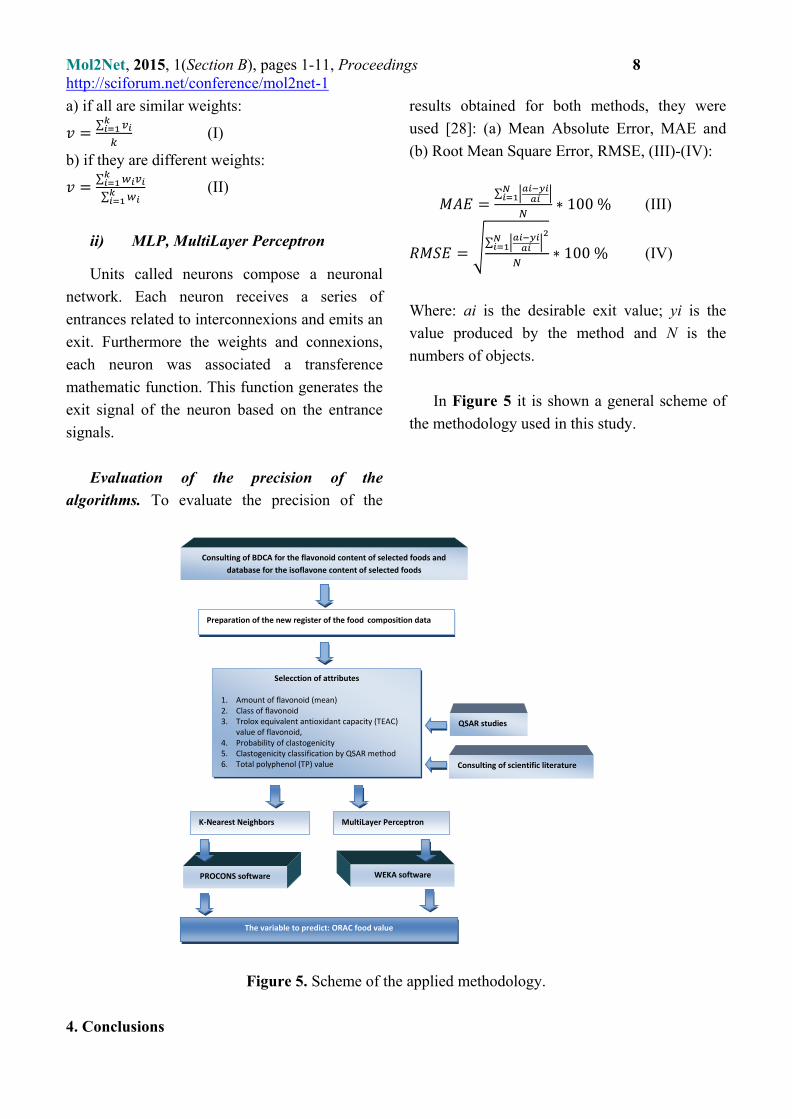
In Figure 5 it is shown a general scheme of
the methodology used in this study.
Figure 5. Scheme of the applied methodology.
4. Conclusions
QSAR studies
Consulting of scientific literature
Selecction of attributes
1. Amount of flavonoid (mean) 2. Class of flavonoid 3. Trolox equivalent antioxidant capacity (TEAC)
value of flavonoid, 4. Probability of clastogenicity 5. Clastogenicity classification by QSAR method 6. Total polyphenol (TP) value
Preparation of the new register of the food composition data
Consulting of BDCA for the flavonoid content of selected foods and
database for the isoflavone content of selected foods
K-Nearest Neighbors
MultiLayer Perceptron
PROCONS software WEKA software
The variable to predict: ORAC food value
Mol2Net, 2015, 1(Section B), pages 1-11, Proceedings 9
http://sciforum.net/conference/mol2net-1
The best results were obtained when the calculation of weight and similarity were included in the
algorithms. Using KNN, the optimum k value was 3, making evident the importance of the similarity
between objects for the good predictive results. The results obtained in the predictions show that the
weights assigned to the attributes, taking into account their influence in the attribute class (ORACexp)
were right.
It was concluded the importance of the use of KNN and MLP technic for the prediction of the
antioxidant activity en different alimentary groups. These algorithms can be used, in future work, to
identify the responsible features for the relationship between quantity of flavonoids, topologic-
structural information and alimentary matrix. It will be further studied the relationship between
antioxidant capacity of the food and the composition in flavonoids of a complex alimentary matrix.
Acknowledgments
The authors thank the partial financial support of University of Santiago de Compostela, University
of Camagüey Ignacio Agramonte Loynaz and Galician Plan of research, innovation and growth 2011-
2015 (Plan I2C). The authors also thank Y. Filiberto et al. for the access to the PROCONS software.
Author Contributions
All the authors contributed equally for the execution of the work and writing of the manuscript.
Conflicts of Interest
The authors declare no conflict of interest.
References
1. Holdena, J.M.; Bhagwata, S.A.; Haytowitza, D.B.; Gebhardta, S.E.; Dwyerb, J.T.; Petersonb, J.;
Beechera, G.R.; Eldridgec, A.L.; Balentined, D. Development of a database of critically evaluated
flavonoids data: Application of usda’s data quality evaluation system. Journal of Food
Composition and Analysis 2005, 18, 829–844.
2. Bhagwat, S.; Haytowitz, D.B.; Holden, J.M. Usda database for the flavonoid content of selected
foods, release 3.1. NDL Web site: http://www.ars.usda.gov/Services/docs.htm?docid=6231, 2012.
3. U.S. Department of Agriculture, A.R.S. Usda database for the isoflavone content of selected
foods. Release 2.0. http://www.ars.usda.gov/Services/docs.htm?docid=6382, 2008
4. Bhagwat, S.; Haytowitz, D.B.; Wasswa-Kintu, S.I.; Holden, J.M. USDA develops a database for
flavonoids to assess dietary intakes. Procedia Food Science 2013, 2, 81-86.
5. U.S. Department of agriculture, A.R.S. Usda national nutrient database for standard reference.
Available online: http://www.ars.usda.gov/nutrientdata. (April 22/2015).
6. Harnly, J.M.; Doherty, R.F.; Beecher, G.R.; Holden, J.M.; Haytowitz, D.B.; Bhagwar, S.;
Gebhardt, S. Flavonoid content of u.S. Fruits, vegetables, and nuts. J. Agric. Food Chem. 2006,
54, 9966-9977.
7. Kay, C.D. The future of flavonoid research. Brit. J. Nutr 2010, 104, S91-S95.
8. Robards, K.; Antolovich, M. Analytical chemistry of fruit bioflavonoids.A review. Analyst 1997,
122, 11R-34R.
Mol2Net, 2015, 1(Section B), pages 1-11, Proceedings 10
http://sciforum.net/conference/mol2net-1
9. Halliwell, B. Oxidative stress, nutrition and health. Experimental strategies for optimization of
nutritional antioxidant intake in humans. Free Rad. Res. 1996, 25, 57-74.
10. Chun, O.; Floegel, A.; Chung, S.; Chung, C.; Song, W.; Koo, S. Estimation of antioxidant intakes
from diet and supplements in us adults. J Nutr 2010, 140, 317-324.
11. Schroeter, H.; Heiss, C.; Spencer, J.P.E.; Lupton, J.R.; Schmitz, H.H.; Keen, C.L. Recommending
flavanols and procyanidins for cardiovascular health: Current knowledge and future needs.
Molecular Aspects of Medicine 2010, 31, 546-557.
12. Institute of Medicine of the Nation al Academies. Dietary reference intakes for vitamin c, vitamin
e, selenium, and carotenoids. National Academy Press: Washington, D.C., 2000.
13. FAO. Retos sobre la composicion de alimentos. Available online:
http//www.fao.org/infoods/infoods/retos (May 13/2015)
14. Haytowitz, D.B.; Bhagwat, S.; Holden, J.M. Sources of variability in the flavonoid content of
foods. Procedia Food Science 2013, 2, 46-51.
15. Bhagwat, S.A.; Haytowitz, D.B.; Wasswa-Kintu, S.; Pehrsson, P.R. 2015. Development of
USDA's expanded flavonoid database: A Tool for Epidemiological Research. British Journal of
Nutrition. DOI: 10.1017/S0007114515001580.
16. Trujillano, J.; March, J.; Sorribas, A. Aproximación metodológica al uso de redes neuronales
artificiales para la predicción de resultados en medicina. Medicina clinica 2004, 122, 22-26.
17. Estrada, E.; Molina, E. Novel local (fragment-based) topological molecular descriptors for
qspr/qsar and molecular design. Journal of Molecular Graphics and Modelling 2001, 20, 54-64.
18. Miller, N.J. The relative antioxidant activities of plant-derived polyphenolic flavonoids. In
Natural antioxidants and food quality in atherosclerosis and cancer prevention, Kumpulainen,
J.T.; Salonen, J.T., Eds. The Royal Society of Chemistry: Cambridge, UK, 1996; pp 256-259.
19. Yordi, E.G.; Molina, E.; Matos, M.J.; Uriarte, E. Structural alerts for predicting clastogenic
activity of pro-oxidant flavonoid compounds: Quantitative structure-activity relationship study. J
Biomol Screen 2012, 17, 216-224.
20. Wu, X.; Beecher, G.R.; Holden J. M.; Haytowitz, D.B.; Gebhardt, S.E.; and Prior, R.L. Lipophilic
and hydrophilic antioxidant capacities of common foods in the united states. J. Agric. Food Chem.
2004, 52, 4026-4037.
21. Kevers, C.; Falkowski, M.; Tabart, J.; Defraigne, J.-O.; Dommes, J.; Pincemail, J. Evolution of
antioxidant capacity during storage of selected fruits and vegetables. J. Agric. Food Chem. 2007,
55, 8596-8603.
22. Ou, B.; Huang, D.; Hampsch-Woodill, M.; Flanagan, J.A.; Deemer, E.K. Analysis of antioxidant
activities of common vegetables employing oxygen radical absorbance capacity (orac) and ferric
reducing antioxidant power (frap) assays: A comparative study. J. Agric. Food Chem. 2002, 50,
3122-3128.
23. Roy, M.K.; Juneja, L.R.; Isobe, S.; Tsushida, T. Steam processed broccoli (brassica oleracea) has
higher antioxidant activity in chemical and cellular assay systems. Food Chem 2009, 114, 263-269.
24. Thaipong, K.; Boonprakob, U.; Crosby, K.; Cisneros-Zevallos, L.; Byrne, D.H. Comparison of
abts, dpph, frap, and orac assays for estimating antioxidant activity from guava fruit extracts. J.
Food Comp. Anal 2006, 19, 669-675.
Mol2Net, 2015, 1(Section B), pages 1-11, Proceedings 11
http://sciforum.net/conference/mol2net-1
25. Awika, J.M.; Rooney, L.W.; Wu, X.; Prior, R.L.; Cisneros-Zevallos, L. Screening methods to
measure antioxidant activity of sorghum (sorghum bicolor) and sorghum products. J. Agric. Food
Chem. 2003, 51, 6657-6662.
26. Prior, R.L.; Hoang, H.; Gu, L.; Wu, X.; Bacchocca, M.; Howard, L.; Hampsch Woodill, M.;
Huang, D.; Ou, B.; Jacob, R. Assays for hydrophilic and lipophilic antioxidant capacity (oxygen
radical absorbance capacity (orac ) of plasma and other biological and food samples. J. Agric.
Food Chem. 2003, 51, 3273-3279.
27. Filiberto, Y.; Bello, R.; Caballero, Y.; Frias, M. In A method to build similarity relations into
extended rough set theory, 10 th International Conference on Intelligent Systems and Applications
ISDA 2010, Cairo, Egypt., 2010; IEEE Catalog Number CFP 10384 CDR: Cairo, Egypt.
28. Filiberto, Y.; Bello, R.; Caballero, Y.; Larrua, R. Una medida de la teoría de los conjuntos
aproximados para sistemas de decisión con rasgosde dominio continuo. Rev. Fac. Ing. Univ.
Antioquia 2011, 60 141-152.
© 2015 by the authors; licensee MDPI, Basel, Switzerland. This article is an open access article
distributed under the terms and conditions defined by MDPI AG, the publisher of the Sciforum.net
platform. Sciforum papers authors the copyright to their scholarly works. Hence, by submitting a paper
to this conference, you retain the copyright, but you grant MDPI AG the non-exclusive and un-
revocable license right to publish this paper online on the Sciforum.net platform. This means you can
easily submit your paper to any scientific journal at a later stage and transfer the copyright to its
publisher (if required by that publisher). (http://sciforum.net/about).


![[2] Whitening Bleaching and Antioxidant](https://img.pdfslide.tips/doc/110x75/563db985550346aa9a9e1e68/2-whitening-bleaching-and-antioxidant.jpg)