Embed Size (px)
Citation preview

Report 930-490
SCOUR EVALUATIONS OF SELECTED
BRIDGES IN ALABAMA
Prepared by
John E. Curry Oktay Guven
Joel G. Melville Samuel H. Crim, Jr.
Prepared for
Alabama Department of Transportation Montgomery, Alabama
NOVEMBER 2002

SCOUR EVALUATIONS OF SELECTED BRIDGES IN ALABAMA
ALDOT Research Project 930-490
Prepared by
John E. Curry Oktay Güven
Joel G. Melville Samuel H. Crim, Jr.
Highway Research Center Harbert Engineering Center
Auburn University, Alabama 36849
November 2002

ABSTRACT This report presents the results of a study of foundation scour at 18 bridge sites in
Alabama which have experienced large floods with recurrence intervals of 100 years or
larger. These sites are located throughout the state. Seven of the sites are in the north,
two are located in the central east, three are located in the central west, and the last six are
located in the south east. These locations provided a variety of soil types from sand in
the south to marl in the central west to rock foundations in the north. The purpose of the
study was to perform a comparative evaluation of actual pier foundation depths and
calculated scour depths during actual past floods based on available scour formulas. The
results of the report show that the maximum scour depths computed by using the
available scour equations are reasonable for foundations consisting of sand, but the
formulas, which have been developed for noncohesive foundation materials, are not
suitable for determining the scour depths for foundations with cohesive soils.
ACKNOWLEDGMENTS
This project was supported by the Alabama Department of Transportation
(Research Project No. 930-490) and administered by the Highway Research Center of
Auburn University. The authors thank Dr. Frazier Parker, Professor of Civil Engineering
and Director of the Highway Research Center, for his support of the project. The authors
also thank the Bridge Scour Section of the Maintenance Bureau and the Materials and
Test Bureau of the Alabama Department of Transportation, and the Montgomery Branch
and Tuscaloosa Branch of the United States Geological Survey for their help in data
collection for the sites presented in the report. Thanks are also given to Mr. Brian Vines
and Mrs. Lori Veal who aided in typing and figure preparation of the report and Ms.
Priscilla Clark who helped with the hardcopy and web publication of the report.

TABLE OF CONTENTS
PAGE ABSTRACT i ACKNOWLEDGMENTS ii LIST OF TABLES v LIST OF FIGURES vi I. INTRODUCTION 1 II. SELECTED BRIDGE SITES 4 III. AVAILABLE INFORMATION 7 IV. MODEL DEVELOPMENT AND SCOUR CALCULATIONS 11 V. CRITICAL EVALUATIONS 24
Limestone Creek near Athens 25
Indian Creek near Madison 28
Paint Rock River near Woodville 31
Vest Creek near Baldwin 35
Buttahatchee River below Hamilton 38

Buttahatchee River near Sulligent 41
Mulberry Fork near Garden City 50
Talladega Creek near Talladega 53
Osanippa Creek near Fairfax 56
Sucarnoochee River at Livingston 59
Tuckabum Creek near Butler 64
Turkey Creek at Kimbrough 67
West Fork Choctawhatchee River at Blue Springs 73
Abbie Creek near Abbeville 76
Pea River near Ariton 80
Pea River at Elba 84
Choctawhatchee River near Newton 87
Lightwood Knot Creek at Babbie 91 VI. CONCLUSION 96 REFERENCES 97

LIST OF TABLES
PAGE
Table 1. Selected bridge sites in Alabama 5

LIST OF FIGURES
PAGE
Figure 1. Locations of selected bridge sites in Alabama 6 Figure 2. Site inspection sketch and elevation view for the
Limestone Creek bridge near Athens 10 Figure 3. Limestone Creek near Athens (BIN# 6544); view looking west toward abutment 1. 26 Figure 4. Limestone Creek near Athens (BIN# 6544); view from the upstream side looking at debris around pier 4. 26 Figure 5. Sounding profiles and scour evaluations for the main channel bridge
at the Limestone Creek site near Athens 27 Figure 6. Indian Creek near Madison (BIN# 5509); view looking north, at gage on pier 8. 29 Figure 7. Indian Creek near Madison (BIN# 5509); view of scour hole under Bridge A at pier 3. 29 Figure 8. Sounding profiles and scour evaluations for the main channel bridge
at the Indian Creek site near Madison 30 Figure 9. Paint Rock River near Woodville (BIN# 13564); view looking west toward abutment 1. 32 Figure 10. Paint Rock River near Woodville (BIN# 13564); view under Bridge A from pier 13 looking northwest toward abutment 1. 32

Figure 11. Sounding profiles and scour evaluations for the main channel bridge at the Paint Rock River site near Woodville 34
Figure 12. Vest Creek near Baldwin (BIN# 1127); view from the upstream side looking southwest toward abutment 4. 36 Figure 13. Vest Creek near Baldwin (BIN# 1127); view from the upstream side looking west toward abutment 4. 36 Figure 14. Sounding profiles and scour evaluations for the main channel bridge
at the Vest Creek site near Baldwin 37 Figure 15. Buttahatchee River below Hamilton (BIN# 4202); view from the downstream side looking north
toward abutment 10. 39 Figure 16. Buttahatchee River below Hamilton (BIN# 4202); view from pier 6 looking south toward abutment 1. 39 Figure 17. Sounding profiles and scour evaluations for the main channel bridge
at the Buttahatchee River site below Hamilton 40 Figure 18. Buttahatchee River near Sulligent, Relief Bridge 4 (BIN# 2557);
view from the downstream side looking south toward abutment 1. 42
Figure 19. Buttahatchee River near Sulligent, Relief Bridge 4 (BIN# 2557);
view from the downstream side looking southeast at ponded water near abutment 1. 42
Figure 20. Sounding profiles and scour evaluations for the main channel bridge
at the Buttahatchee River site near Sulligent 43 Figure 21. Sounding profiles and scour evaluations for relief bridge 1
at the Buttahatchee River site near Sulligent 44

Figure 22. Sounding profiles and scour evaluations for relief bridge 2 at the Buttahatchee River site near Sulligent 45
Figure 23. Sounding profiles and scour evaluations for relief bridge 3
at the Buttahatchee River site near Sulligent 46 Figure 24. Sounding profiles and scour evaluations for relief bridge 4
at the Buttahatchee River site near Sulligent 47 Figure 25. Mulberry Fork near Garden City (BIN# 6914); view from the downstream side looking north
toward abutment 8. 51 Figure 26. Mulberry Fork near Garden City (BIN# 6914); view from the upstream side looking north toward abutment 8. 51 Figure 27. Sounding profiles and scour evaluations for the main channel bridge
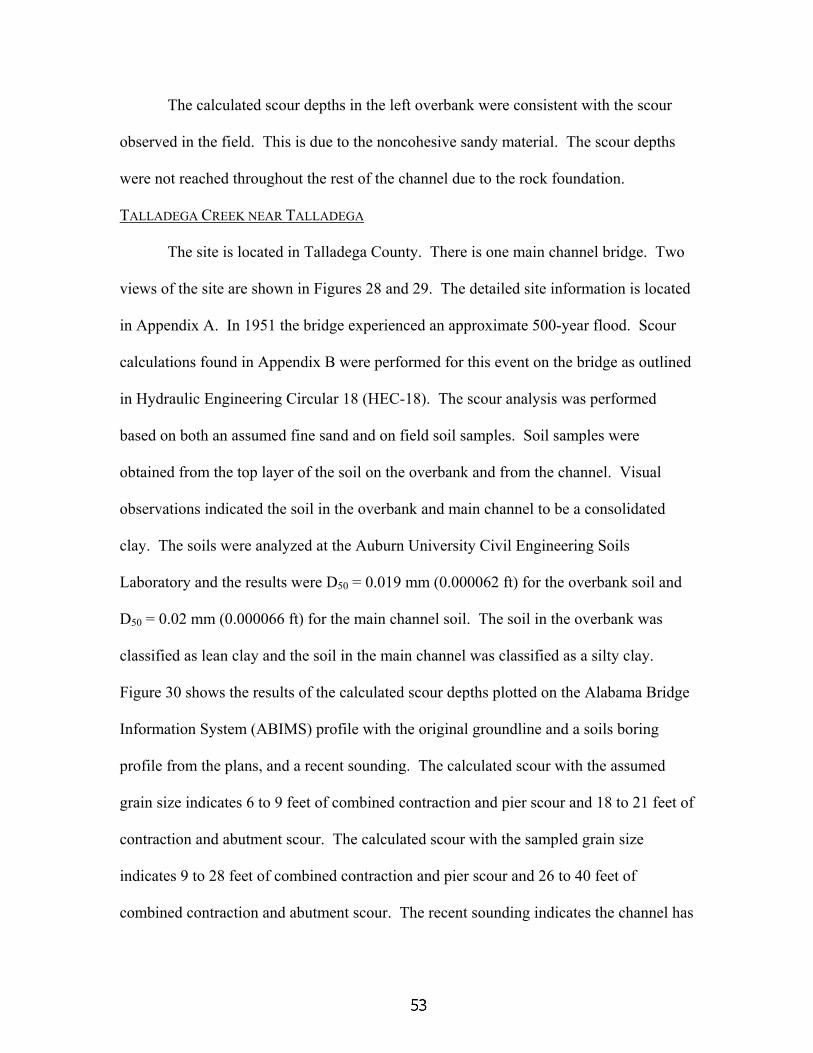
at the Mulberry Fork site near Garden City 52 Figure 28. Talladega Creek near Talladega (BIN# 4470); view from the upstream side looking west
toward abutment 1. 54 Figure 29. Talladega Creek near Talladega (BIN# 4470); view from the upstream side looking northeast toward abutment 8. 54 Figure 30. Sounding profiles and scour calculations for the main channel bridge
at the Talladega Creek site near Talladega 55 Figure 31. Osanippa Creek near Fairfax (BIN# 615); view from the upstream side looking south
toward abutment 1. 57

Figure 32. Osanippa Creek near Fairfax (BIN# 615); view from the upstream side looking east
toward abutment 9. 57 Figure 33. Sounding profiles and scour calculations for the main channel bridge
at the Osanippa Creek site near Fairfax 58 Figure 34. Sucarnoochee River at Livingston (BIN# 2911); view from pier 22 looking south toward abutment 1. 60 Figure 35. Sucarnoochee River at Livingston (BIN# 2911); view from the upstream side looking south
toward abutment 1. 60 Figure 36. Sounding profiles and scour evaluations for the main channel bridge
at the Sucarnoochee River site at Livingston 62 Figure 37. Sounding profiles and scour evaluations for relief bridge 1
at the Sucarnoochee River site at Livingston 63 Figure 38. Tuckabum Creek near Butler (BIN# 1095); view from the downstream side looking north
toward abutment 32. 65 Figure 39. Tuckabum Creek near Butler (BIN# 1095); facing south toward abutment 1
view of scour at pier 2 . 65 Figure 40. Sounding profiles and scour evaluations for the main channel bridge
at the Tuckabum Creek site near Butler 66 Figure 41. Turkey Creek at Kimbrough, Relief Bridge 2 (BIN# 2266);
view from pier 10 looking south toward abutment 1. 68

Figure 42. Turkey Creek at Kimbrough, Relief Bridge 2 (BIN# 2266); view from the downstream side looking southwest at abutment 1. 68
Figure 43. Sounding profiles and scour evaluations for the main channel bridge at the Turkey Creek site at Kimbrough 69
Figure 44. Sounding profiles and scour evaluations for relief bridge 1
at the Turkey Creek site at Kimbrough 70 Figure 45. Sounding profiles and scour evaluations for relief bridge 2
at the Turkey Creek site at Kimbrough 71 Figure 46. West Fork Choctawhatchee River at Blue Springs (BIN#16717);
view from the downstream side looking northwest toward abutment 1. 74
Figure 47. West Fork Choctawhatchee River at Blue Springs (BIN#16717); view looking south at pier 3. 74 Figure 48. Sounding profiles and scour evaluations for the main channel bridge
at the West Fork Choctawhatchee River site at Blue Springs 75 Figure 49. Abbie Creek near Abbeville (BIN# 2540); view from the downstream side looking west
toward abutment 1. 77 Figure 50. Abbie Creek near Abbeville (BIN# 2540); view from the upstream side looking west
toward abutment 1. 77 Figure 51a. Sounding profiles and scour evaluations for the main channel bridge
at the Abbie Creek site near Abbeville (left side of bridge) 78 Figure 51b. Sounding profiles and scour evaluations for the main channel bridge
at the Abbie Creek site near Abbeville (right side of bridge) 79

Figure 52. Pea River near Ariton (BIN# 5573); view from the upstream side of Bridge B looking northeast toward historic structure. 81
Figure 53. Pea River near Ariton (BIN# 5573); view from the upstream side of historic structure looking south. 81
Figure 54. Sounding profiles and scour evaluations for the main channel bridge
at the Pea River site near Ariton 82 Figure 55. Sounding profiles and scour evaluations for relief bridge 1
at the Pea River site near Ariton 83 Figure 56. Pea River at Elba (BIN# 6434);
view from the downstream side looking east toward abutment 19. 85
Figure 57. Pea River at Elba (BIN# 6434);
view from the upstream side looking southwest toward abutment 1. 85
Figure 58. Sounding profiles and scour evaluations for the main channel bridge
at the Pea River site at Elba 86 Figure 59. Choctawhatchee River near Newton (BIN# 11857); view from the upstream side looking
northwest toward abutment 11. 88 Figure 60. Choctawhatchee River near Newton (BIN# 11857); view from the downstream side looking
southeast toward abutment 1. 88 Figure 61. Sounding profiles and scour evaluations for the main channel bridge
at the Choctawhatchee River site near Newton 90

Figure 62. Lightwood Knot Creek at Babbie (BIN# 12968); view from the downstream side looking
west toward abutment 1. 92 Figure 63. Lightwood Knot Creek at Babbie (BIN# 12968); view from the upstream side looking
west toward abutment 1. 92 Figure 64. Sounding profiles and scour evaluations for the main channel bridge
at the Lightwood Knot Creek site at Babbie 93 Figure 65. Sounding profiles and scour evaluations for relief bridge 1
at the Lightwood Knot Creek site at Babbie 94

I. INTRODUCTION
BACKGROUND:
In a recent review of Alabama highway research needs, one of the topics identified
was titled Evaluation of the Effects of Scour Models on Required Pile Lengths (HRC,
1998). It was concluded in that review that “more research needs to be conducted on
foundation requirements,” and that “current scour models require minimum pile tip
elevations that are often beyond reasonably obtained limits.” Similar observations are
also made in the Federal Highway Administration’s (FHWA) Hydraulic Engineering
Circular No. 18 (HEC-18), Evaluating Scour at Bridges (Federal Highway
Administration, 1995). In particular, it is noted in that publication that “adequate
consideration must be given to the limitations and gaps in existing knowledge when using
currently available formulas for scour. The designer needs to apply engineering
judgment in comparing results obtained from scour computations with available
hydrologic and hydraulic data to achieve a prudent design.” It is further stated that such
data should include “performance of existing structures during past floods.”
PURPOSE AND SCOPE:
In view of a definite need for a better understanding of the utility of available
scour formulas, this project was undertaken to collect data on 18 designated bridge sites
throughout Alabama and perform scour evaluations for known (100-year, 200-year or
500-year) flood events which occurred at these sites. Plots were developed to compare
field measurements obtained during yearly site inspections, ground elevations taken
during flood measurements where available, and the computed scour from the estimated

and measured flood events. A critical evaluation of each site presents an indication of
how and why the scour calculations may compute excessive scour depths.
METHODS OF STUDY:
In order to study a bridge site in depth, all of the supporting information must be
collected. This collection includes a history of hydrologic information, hydraulic
information, structural information, and geotechnical information. The Alabama
Department of Transportation (ALDOT) houses structural and geotechnical information
on all bridges that they maintain; usually in the form of construction plans, and through
the use of its bridge information management system. The United States Geological
Survey (USGS) stores a history of hydrologic and hydraulic information on selected
bridges throughout Alabama in the form of a hardcopy database and through websites
depending on the information required. All of the data needed and that was available was
collected from these two organizations and compiled in a format to facilitate a scour
evaluation. Scour calculations were performed using methodologies described in HEC-
18 by Hydrologic Engineering Center’s River Analysis System (HEC-RAS) computer
program. This information is presented in the report.
ORGANIZATION OF THE REPORT:
Compilations of the bridge sites, which have been evaluated, are presented in
Section II. A discussion of the type and extent of the available data and how it was
collected is in Section III. A presentation and discussion of the model development and
HEC-18 scour calculations are presented in Section IV followed by critical evaluations of
the collected and analyzed data in Section V. The main conclusions are presented in
Section VI. There are two appendices printed separately from the main report. Appendix

A contains detailed information about the sites and Appendix B contains the hydraulic
scour calculations. Both the main report and the appendices are also available separately
as Adobe Portable Document Format (PDF) files.

II. SELECTED BRIDGE SITES
The bridge sites, which have been studied, are listed in Table 1. The table gives
the U.S. Geological Survey gage station number for each site, followed by station name,
the construction date (year) of the main bridge at the site, the date (year) of the most
extreme flood experienced by the bridge, an approximate lower-bound estimate of the
recurrence interval of the flood (as 100, 200, or 500 years) as determined with the flood
frequency (regression equation) method of Atkins (1996), and the bridge identification
numbers of the bridges at the site. The locations of the selected bridge sites, along with
their U.S. Geological Survey Station numbers, are indicated in Figure 1.
There are 18 sites identified in Table 1, which have all experienced an extreme
flood of recurrence interval of at least 100 years, and 6 of these sites have experienced a
flood of a recurrence interval of 500 years or more. A few of the bridges, most notably
southeastern Alabama bridges with soils similar to sand, required countermeasures after
the flood events. All bridges having soils characterized with cohesive properties had
little scour and few or no scour countermeasures in place.

Table 1. Selected bridge sites in Alabama
Gage Station STATION NAME
*Built Date
FloodDate
Recurrence Interval
Main Channel Bridges BIN
Relief Bridges BIN
3576250 Limestone Creek near Athens
1952 1973 200 463; 6544
3574500 Paint Rock River near Woodville
1985 1990 100 13564; 11960
2367500 Lightwood Knot Creek at Babbie
1982 1990 100 12968 12969
2361000 Choctawhatchee River near Newton
1976 1990 500 11857
2363000 Pea River near Ariton 1970 1990 100 10355 10354; 5572; 5573
2450000 Mulberry Fork near Garden City
1960 1990 200 6914
2364000 Pea River at Elba 1959 1990 100 6434
3575830 Indian Creek near Madison
1965 1973 100 5509; 8735
2438000 Buttahatchee River below Hamilton
1953 1973 500 4202 13690
2467500 Sucarnoochee River at Livingston
1946 1979 200 2911 2912
2439000 Buttahatchee River near Sulligent
1940 1973 500 2561 2560; 2559; 2558; 2557
2343275 Abbie Creek near Abbevile
1941 1953 100 2540
2427700 Turkey Creek at Kimbrough
1940 1961 200 2264 2265; 2266
2360000 West Fork Choctawhatchee River at Blue Springs
1938 1990 500 1731
2451750 Vest Creek near Baldwin
1934 1964 200 1127
2469500 Tuckabum Creek near Butler
1934 1964 200 1095 1096; 1097; 970
2340750 Osanippa Creek near Fairfax
1929 1961 500 615
2406000 Talladega Creek near Talladega
1928 1951 500 4470
*some relief bridges may have been built at different years


III. AVAILABLE INFORMATION
There were three primary sources for information: the Alabama Department of
Transportation (ALDOT), the United States Geological Survey (USGS) and site field
inspections conducted by the investigators. In general, ALDOT provided information on
the structural details of the bridge and a history of the ground line at the bridge. The
USGS provided a record of detailed hydrologic data and some hydraulic data for each
site. The site inspections provided soil samples and observations of what scour had
occurred at each site.
ALDOT information included the Alabama Bridge Information Management
System (ABIMS) information, plan information, and bridge card information. The data
base of the Alabama Bridge Information Management System (ABIMS) contains
information about Alabama’s bridges which includes profiles of the bridge structures, the
original ground level and subsequent periodic sounding profiles, bridge footing and piling
types, and elevations and structural appraisal information derived from historic data and
visual inspections by ALDOT bridge inspectors. Along with ABIMS information,
historical structural information exists in hardcopy form. Some of this information is
used to supply the ABIMS database. Construction plans consisting of a cover sheet,
plan/profile sheets, general elevation views, and core borings were available in full or
partially for the bridge sites. A bridge card was also available for most bridges, which
was used to supply historic information about a structure. ALDOT has created bridge
cards for every bridge in the ALDOT inventory. The data includes superstructure
information (floor depth, railing description, stringers – beams or girders, trusses, etc.),
substructure information (length of piles, foundation material, etc.), and general

information (name, construction dates, overall length, number of spans, original cost,
minimum design rating, pavement width, shoulder width, sight distance, etc.). The
majority of this ALDOT information was obtained from ALDOT’s main office in
Montgomery, but some inspection reports and plans came from ALDOT Division offices
and County Engineers.
The USGS hydrologic data and hydraulic data were obtained from the Alabama
USGS offices in Montgomery and in Tuscaloosa and from their website. Each bridge site
in the study had at present or previously a gage in place at or near the bridge.
Historically, gaging station data have been used for management of national land
and water resources. Many of the gages were used to record stages over periods of time.
During large storm events and when possible the USGS measures velocities and areas to
calculate discharges per stage heights to develop rating curves. The rating curves and
measured stages are then used for determining discharges for daily flows. This data is
used for determining low flows, average flows, and peak flows. This information can be
used for several applications. For example, low flows and average flows can be used in
determining water supply constraints while peak discharges may be used in the design of
bridges and culverts.
The data compiled in a recent report by Atkins (1996) for annual storm events in
Alabama aided in the choosing of the sites for this study. All of the sites have
experienced a storm event of a recurrence interval of at least 100-years. The majority of
the sites were located at or near state structures to ensure sufficient data existed for
analysis. All available field measurements of velocities, ground lines, and calculated
discharges were obtained for all of the bridge sites that were selected.

Field inspections were conducted during the fall months of 2001 when vegetation
was sparse. The field crews consisted of three men. Each site bridge was videoed,
photographed, and reviewed based on visual inspections. Clues to scour including old
mud lines, timber piles originally cut off to the ground, in-place riprap countermeasures,
and obvious contraction, pier, and abutment scour were identified and labeled on site
sketches found in Appendix A. An example of one of the site sketches found in
Appendix A can be seen in Figure 2. Soil samples were taken from the channel and from
the overbank for the main channel bridges, and from representative areas reflecting the
entire reach of the relief bridges. Each sample was analyzed to determine the diameter of
the soil for which 50% of the sizes were smaller (D50), the diameter of the soil for which
90% of the sizes were smaller (D90), the liquid limit (LL), the plastic limit (PL),
and the plasticity index (PI) at the Auburn University Civil Engineering Soil Mechanics
Laboratory. All data were logged and recorded including the soil samples, video,
photographs, site inspection notes, aerial photos, quadrangle location maps, structure
history, plan information, ABIMS profiles and structure appraisal history, and USGS
hydrologic and hydraulic information. The available data for each site are presented in
detail in a separate appendix, Appendix A.


IV. MODEL DEVELOPMENT AND SCOUR CALCULATIONS
MODEL DEVELOPMENT
Each bridge site was modeled using the Hydrologic Engineering Center River
Analysis System (HEC-RAS) software (Brunner, 2001a, b). The models are defined in
HEC-RAS as a series of cross-sections and associated parameters. Stream cross-sections
were obtained from the plan/profile sheet of the construction plans. Each cross-section
was propagated approximately a bridge length upstream and downstream of the site using
the average slope of the channel estimated from a USGS quadrangle map.
Several parameters were required to define the HEC-RAS model such as
Manning’s n-values and boundary conditions. Manning’s n-values were estimated for the
channel and overbank areas based on engineering judgment of the site. The n-values
were adjusted in some cases to calibrate the models to known depth averaged velocity
and stage measurements. Discharges and starting downstream water surface elevations
were two boundary conditions needed in modeling the sites. The discharges were taken
from USGS records or from field measurements. The starting downstream water surface
elevations were either taken from USGS records and field measurements or were
calculated based on assuming uniform flow using the average channel slope and
conveyance at the downstream section.

HEC-18 SCOUR CALCULATIONS
The hydraulic variables of the output of HEC-RAS were used to calculate scour
depths. HEC-RAS has built in routines for calculating scour based on methods described
in Hydraulic Engineering Circular No. 18 (HEC No. 18, FHWA, 1995). Contraction
scour and local scour (pier scour and abutment scour) were computed for each site.
As stated previously, all scour calculations were based on methods described in HEC-18.
The calculation results are presented in detail in a separate appendix, Appendix B. The
following section describes how scour is calculated with excerpts taken directly from
HEC-18 (FHWA, 1993, 1995, 2001) and the HEC-RAS Hydraulic Reference Manual
(Brunner, 2001b).
Contraction Scour
As presented in HEC-18 and HEC-RAS, contraction scour occurs when the flow
area of a stream at flood stage is reduced, either by a natural contraction or a bridge. It
also occurs when overbank flow is forced back to the channel by roadway embankments
at the approaches to a bridge. The contraction of flow due to a bridge can be caused by
either a natural decrease in flow area of the stream channel or by abutments projecting
into the channel and/or piers blocking a portion of the flow area. Contraction can also be
caused by the approaches to a bridge cutting off floodplain flow. This flow from the
floodplain can cause clear-water scour on a setback portion of a bridge section or a relief
bridge because the floodplain flow does not normally transport significant concentrations
of bed material sediments. This clear-water picks up additional sediment from the bed
upon reaching the bridge opening. In addition, local scour at abutments may well be
greater due to the clear-water floodplain flow returning to the main channel at the end of
the abutment.
There are two conditions for contraction scour: clear-water and live-bed scour.
Clear-water scour occurs when the bed material sediment transport in the uncontracted
approach section is negligible or material transported through the contracted section is
mostly in suspension. Live-bed scour occurs when there is transport of bed material from
the upstream reach into the crossing.
Four conditions of contraction scour are commonly encountered:
Case 1. Involves overbank flow on a floodplain being forced back to the main channel by
the approaches to the bridge. Case 1 conditions include:
a. The river channel width becomes narrower either due to the bridge abutments
projecting into the channel or the bridge being located at a narrowing reach of
the river;
b. No contraction of the main channel, but the overbank flow area is completely
obstructed by an embankment; or
c. Abutments are set back from the stream channel.
Case 2. Flow is confined to the main channel (i.e., there is no overbank flow). The
normal river channel width becomes narrower due to the bridge itself or the bridge site is
located at a narrower reach of the river.

Case 3. A relief bridge in the overbank area with little or no bed material transport in the
overbank area (i.e., clear-water scour).
Case 4. A relief bridge over a secondary stream in the overbank area with bed material
transport (similar to case 1).
D50 values can be used to determine the velocity associated with the initiation of
motion, which in turn can be used as an indicator for clear-water or live-bed scour
conditions. If the mean velocity (V) in the upstream reach is equal to or less than the
critical velocity (Vc) of the median diameter (D50) of the bed material, then contraction
and local scour will be clear-water scour. Also, if the ratio of the shear velocity of the
flow to the fall velocity of the D50 of the bed material (V*/ω) is greater than 3,
contraction and local scour may be clear-water. If the mean velocity is greater than the
critical velocity of the median bed material size, live-bed scour will occur.
The following equation is used by HEC-RAS to calculate the critical velocity.
The derivation of the equation can be seen in HEC-18 (Second Edition, FHWA, 1993, p.
12).
3/150
6/1195.10 DyVc = (1)
Where:
Vc = Critical velocity above which bed material of size D50 and smaller will be transported, ft/s
1y = Average depth of flow in the main channel or overbank area at the approach section, ft
50D = Bed material particle size in a mixture of which 50% are smaller, ft

Live-Bed Contraction Scour
Live-bed contraction scour was calculated in HEC-RAS using a modified version
of Laursen's 1960 equation (HEC-18 Fourth Edition, FHWA, 2001 p. 5.10) for live-bed
scour at a long contraction. The modification is to eliminate the ratio of Manning's n.
The equation assumes that bed material is being transported in the upstream section.
1
2
1
7/6
1
212
k
WW
QQyy
= (2)
02 yyys −= (3)
Where: sy = Average depth of contraction scour, ft.
1y = Average depth in the upstream main channel, ft. 2y = Average depth after scour in the contracted section, ft. This is taken as the section inside the bridge at the upstream end in HEC-RAS. 0y = Average depth before scour in the main channel or floodplain at the contracted section, ft.
1Q = Flow in the main channel or floodplain at the approach section, which is transporting sediment, cfs.
2Q = Flow in the main channel or floodplain at the contracted section, which is transporting sediment, cfs.
1W = Bottom width in the main channel or floodplain at the approach section, feet. This is approximated as the top width of the active area in HEC-RAS.
2W = Bottom width of the main channel or floodplain at the contracted section less pier widths, feet. This is approximated as the top width of the active flow area.
= Exponent for mode of bed material transport
1k

V*/ω k1 Mode of Bed Material Transport <0.50 0.59 Mostly contact bed material discharge
0.50 to 2.0 0.64 Some suspended bed material discharge >2.0 0.69 Mostly suspended bed material discharge
V* = (τo/ρ)1/2 = (gy1 S1)1/2, shear velocity in the upstream section, ft/s ω = Fall velocity of bed material based on the D50, ft/s g = Acceleration of gravity, ft/s2 S1 = Slope of energy grade line of main channel, ft/ft Clear-Water Contraction Scour
The following equation is used by HEC-RAS to calculate clear-water contraction
scour. The derivation of the equation can be seen in HEC-18 (Second Edition, FHWA,
1993, p. 12).
7/3
22
3/2
22
2
=
WCDQym
(4)
02 yyys −= (5)
Where:
Dm = Diameter of the smallest non-transportable particle in the bed material (1.25D50) in the contracted section, ft.
D50 = Median diameter of the bed material, ft C = 120 for English units W2 = Bottom width of the bridge less pier widths, or overbank width (set back distance), ft

Local Scour
Local Scour at Piers
Pier scour occurs due to acceleration of flow around the pier and the formation of
flow vortices (known as the horseshoe vortex). The horseshoe vortex removes material
from the base of the pier, creating a scour hole. The factors that affect the depth of local
scour at a pier are: velocity of the flow just upstream of the pier, depth of flow, width of
the pier, length of the pier if skewed to the flow, size and gradation of bed material, angle
of attack of approach flow, shape of pier, bed configuration, and the formation of ice
jams and debris.
HEC-RAS uses the Colorado State University (CSU) equation to calculate pier
scour under both live-bed and clear-water conditions. The equation is presented in HEC-
18 (Fourth Edition, FHWA, 2001, p. 6.4).
43.01
35.01
43210.2 FrayKKKK
ays
= (6)
Where: sy = Depth of scour in feet
1K = Correction factor for pier nose shape 2K = Correction factor for angle of attack of flow 3K = Correction factor for bed condition 4K = Correction factor for armoring of bed material
a = Pier width in feet 1y = Flow depth directly upstream of the pier in feet.
1Fr = Froude Number directly upstream of the pier.

For round nose piers aligned with the flow, the maximum scour depth is limited as follows: 4.2≤sy times the pier width (a) for 8.01 ≤Fr 0.3≤sy times the pier width (a) for 8.01 >Fr
The correction factor for pier nose shape, 1K , is given below:
Shape of Pier Nose 1K Square nose 1.1 Round nose 1.0 Circular cylinder 1.0 Group of cylinders 1.0 Sharp nose (triangular) 0.9
The correction factor for the attack of the flow, 2K , is calculated using the equation shown in HEC-18 (Fourth Edition, FHWA, 2001, p. 6.4):
65.0
2 sincos
+= θθ
aLK (7)
Where: L = Length of the pier along the flow line, ft.
θ = Angle of attack of the flow, with respect to the pier.
If L/a is larger than 12, the program uses L/a = 12 as a maximum. If the angle of
attack is greater than 5 degrees, 2K dominates and 1K should be set to 1.0.
The correction factor for bed condition, 3K , is shown in the table below:
Bed Condition Dune Height H feet 3K
Clear-Water Scour N/A 1.1 Plane Bed and Antidune Flow N/A 1.1 Small Dunes 210 ≥> H 1.1 Medium Dunes 1030 ≥> H 1.1 to 1.2 Large Dunes H 30 1.3

The correction factor 4K decreases scour depths for armoring of the scour hole for
bed materials that have a D50 equal to or larger than 0.20 feet. The correction factor
results from recent research by A. Molinas at CSU, which showed that when velocity (V1)
is less than the critical velocity ( 90cV ) of the D90 size of the bed material, and there is a
gradation in sizes in the bed material, the D90 will limit the scour depth. The equations
are presented in HEC-18 (Third Edition, FHWA, 1993, pp. 37-38):
( )[ ] 5.024 189.01 RVK −−= (8)
where:
−
−=
ic
iR VV
VVV
90
1 (9)
50
053.050645.0 ci V
aDV
= (10)
R V = Velocity ratio 1V = Average velocity in the main channel or overbank area at the cross section just upstream of the bridge, ft/s iV = Velocity when particles at a pier begin to move, ft/s 90cV = Critical velocity for D90 bed material size, ft/s 50cV = Critical velocity for D50 bed material size, ft/s a = Pier width, ft
3/16/195.10 cc DYV = (11) where: Y = The depth of water just upstream of the pier, ft Dc = Critical particle size for critical velocity Vc, ft

Limiting K4 values and bed material size are given below: Limits for Bed Material Size and K4 Values
Factor Minimum Bed Material Size Minimum K4 Value VR>1.0
K4 2.050 ≥D ft 0.7 1.0 Local Scour at Abutments
Local scour occurs at abutments when the abutment obstructs the flow. The
obstruction of the flow forms a horizontal vortex starting at the upstream end of the
abutment and running along the toe of the abutment, and forms a vertical wake vortex at
the downstream end of the abutment.
HEC No. 18 report recommends two equations for the computation of live-
bed abutment scour. When the wetted embankment length (L) divided by the approach
flow depth (y1) is greater than 25, the HEC No. 18 report suggests using the Highways in
the River Environment (HIRE) equation (Richardson et al., 1990, p.V-101). When the
wetted embankment length divided by the approach depth is less than or equal to 25, the
HEC No. 18 report suggests using an equation by Froelich (Froelich, 1989, pp.13-18).

HIRE Equation
The HIRE equation is based on field data of scour at the end of spurs in the
Mississippi River (obtained by the USACE). The HIRE equation presented in HEC-18
(Fourth Edition, FHWA, 2001, p. 7.9) is:
33.0
21
1 55.04 FrK
Kyys
= (12)
Where: sy =Scour depth in ft
1y =Depth of flow at the tow of the abutment on the overbank or in the main channel, ft
1K =Correction factor for abutment shape 2K =Correction factor for angle of attack (θ ) of flow
with abutment. Fr =Froude number based on velocity and depth
adjacent and just upstream of the abutment toe
Description K1 Vertical-wall Abutment 1.00 Vertical-wall Abutment with wingwalls 0.82 Spill-through Abutment 0.55
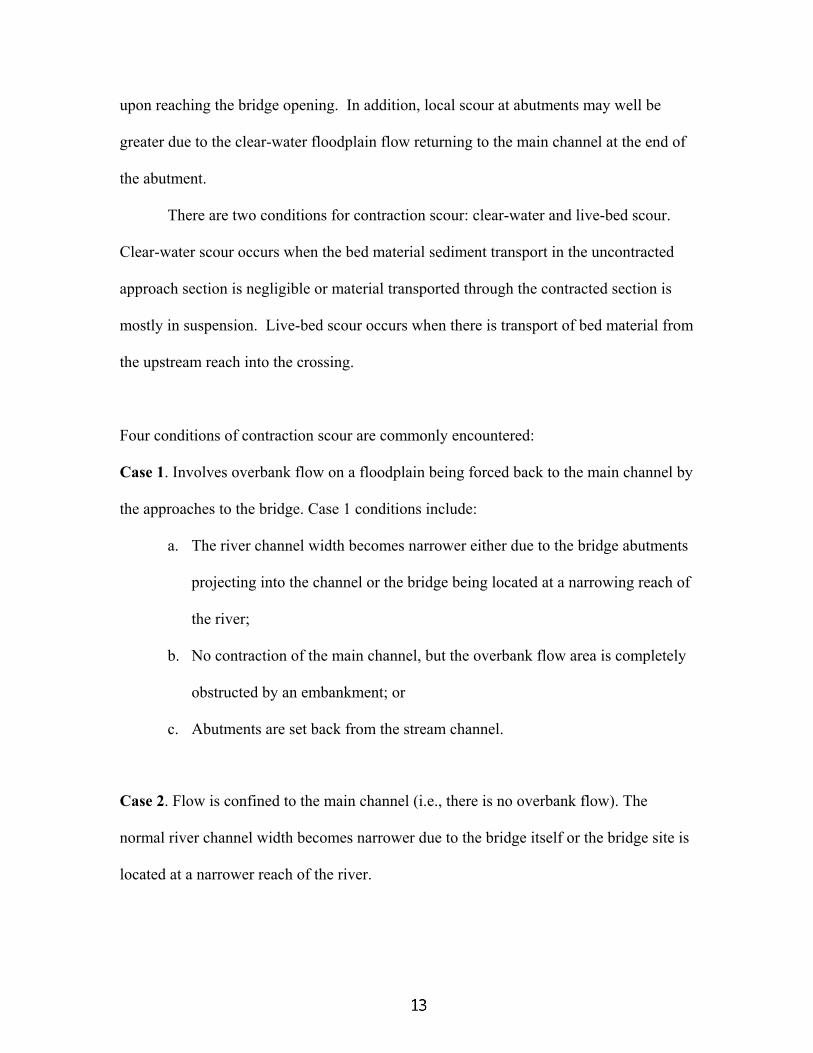
The correction factor, K2, for angle of attack can be taken from below
Angle of Attack, θ, degrees
Correction factor for abutment skew, K2
Froelich’s Equation
Froelich analyzed 170 live-bed scour measurements in laboratory flumes by
regression analysis to obtain the following equation presented in HEC-18 (Fourth
Edition, FHWA, 2001, p. 7.8):
1'27.2 61.043.0
21 +
= Fr
yLKK
yy
aa
s (13)
Where: sy = Scour depth in ft
1K = Correction factor for abutment shape 2K = Correction factor for angle of attack (θ ) of flow
with abutment.

'L = Length of abutment (embankment) projected normal to flow, ft ay = Average depth of flow on the floodplain at the approach section, ft
Fr = Froude number of the floodplain flow at the approach section
= ( ) 2/1
a
e
gyV
eV = Average velocity of the approach flow, ft/s
= e
e
AQ , ft/s
eQ = Flow obstructed by the abutment and embankment at the approach section, cfs eA = Flow area of the approach section obstructed by the abutment and embankment, ft2

V. CRITICAL EVALUATIONS
RESULTS AND DISCUSSION
Detailed site data and calculations are presented in Appendix A and Appendix B.
Here, a critical evaluation of each site is presented using plots developed from the
measured soundings from ALDOT, original groundline and soil boring profiles from the
plans, and soundings taken during the measured flood when available. Scoured bed
profiles were added to the plots based on conventional calculations with an assumed fine
sand D50 equal to 0.16 mm (0.00050 ft). (Such assumptions are usually made by some
engineers in the absence of direct soils information from a site). Calculations were also
made using a D50 from soils sampled during the site inspections. Conventional
calculation of scour depths does not account for cohesion in the bed material. Cohesive
soils are less erodible than noncohesive soils of similar grain size. Cohesive bonds in the
bed material increase the critical bed shear stress, which delays the onset of scour. Also,
if the critical bed shear stress is exceeded, cohesion in the bed material reduces the rate of
scour (see, e.g., Briaud et al., 1999, 2001a, 2001b; Güven et al., 2001; Güven et al., 2002,
TRB Paper No. 02-2127, accepted for publication). Conventional scour calculations do
not account for consolidated soil or rock bed material. General site characteristics are
pointed out and opinions are expressed based on site comparisons. The evaluations are
summarized in this chapter.

LIMESTONE CREEK NEAR ATHENS
This site is located in Limestone County. There are two parallel main channel
bridges. Two views of the site are shown in Figures 3 and 4. The detailed site
information is contained in Appendix A. In 1973 the bridge experienced an approximate
200-year flood. The bridges were analyzed for this event together. Scour calculations
found in Appendix B were performed as outlined in Hydraulic Engineering Circular 18
(HEC-18). The scour analysis was performed based on both an assumed fine sand and on
field soil samples. Soil samples were obtained from the top layer of the soil on the
overbank and from the channel. Visual observations indicated the soil in the overbank to
be consolidated clay while the soil from the channel was a loose sand and gravel. The
soils were analyzed at the Auburn University Soils Laboratory and the results were D50 =
0.022 mm (0.000070 ft) for the overbank soil and D50 = 2.7 mm (0.0089 ft) for the main
channel soil. The soil in the overbank was classified as lean clay and the soil in the main
channel was classified as a well graded sand with gravel. Figure 5 shows the results of
the calculated scour depths plotted on the Alabama Bridge Information System (ABIMS)
profile with the original groundline and a soils boring profile from the plans, a recent
sounding, and a sounding taken during the measured flood. The calculated scour with the
assumed grain size indicates 4 to 25 feet of combined contraction and pier scour and 34
to 47 feet of contraction and abutment scour. The recent sounding and site inspection
determined these depths were not reached in the overbank and it is highly unlikely the
channel reached those depths as well. The calculated scour with the sampled grain size
indicates 4 to 47 feet of combined contraction and pier scour and 34 to 69 feet of
combined contraction and abutment scour. Scour observed in the field consisted mainly

Figure 3. Limestone Creek near Athens (BIN# 6544); view looking west toward abutment 1.
Figure 4. Limestone Creek near Athens (BIN# 6544); view from the upstream side looking at debris around pier 4.


of 2 to 3 feet deep local scour at piers #5, #9, and #10 on the upstream bridge and almost
no scour at these piers on the downstream bridge. The sounding also indicates very little
if any long-term degradation.
The reason these calculated scour depths were not reached at this site is due to the
cohesive nature of the soil. Even if the top cohesive layer were scoured away, a hard
limestone rock is present which would provide even more resistance to scour than the
cohesive material. Calculated scour depths do not account for cohesion on the limestone
rock.
INDIAN CREEK NEAR MADISON
The site is located in Madison County. There are two parallel main channel
bridges. Two views of the site are shown in Figures 6 and 7. The detailed site
information is located in Appendix A. In 1973 the bridge experienced an approximate
100-year flood. Scour calculations found in Appendix B were performed for this event
on the bridge as outlined in Hydraulic Engineering Circular 18 (HEC-18). The scour
analysis was performed based on both an assumed fine sand and on field soil samples.
Soil samples were obtained from the top layer of soil in the overbank and in the channel.
Visual observations indicated the soil in the overbank to be consolidated clay while the
soil from the channel was loose sand. The soils were analyzed at the Auburn University
Civil Engineering Soils Laboratory and the results were D50 = 0.020 mm (0.000070 ft)
for the overbank soil and D50 = 1.28 mm (0.00420 ft) for the main channel soil. The soil
in the overbank was classified as lean clay and the soil in the main channel was classified
as a well graded sand. Figure 8 shows the results of the calculated scour depths plotted
on the Alabama Bridge Information System (ABIMS) profile with the original groundline

Figure 6. Indian Creek near Madison (BIN# 5509); view looking north at gage on pier 8.
Figure 7. Indian Creek near Madison (BIN# 5509); view of scour hole under Bridge A at pier 3.


and a soils boring profile from the plans, and a recent sounding. The calculated scour
with the assumed grain size indicates 14 to 27 feet of combined contraction and pier
scour and 23 to 30 feet of contraction and abutment scour. The calculated scour with the
sampled grain size indicates 25 to 27 feet of combined contraction and pier scour and 23
to 43 feet of combined contraction and abutment scour. The recent sounding indicates
the main channel has aggraded and there is 2 to 3 feet of local scour at pier #2 and pier
#3. Scour observed in the field consisted of a 3 to 4 feet deep scour hole around pier #2
of bridge A, and several piles had been re-encased with concrete on piers #2 and #3.
Another 3 to 4 feet scour hole was found around pier #9 of bridge B, with several piles
being re-encased there as well.
The reason these calculated scour depths were not found on the overbank and
main channel is due to the cohesive nature of the soil. Even if the top sand layer were
scoured away in the main channel a clay layer is present which would provide resistance
to scour.
PAINT ROCK RIVER NEAR WOODVILLE
The site is located in Jackson County. There are two parallel main channel
bridges. Two views of the site are shown in Figures 9 and 10. The detailed site
information is located in Appendix A. In 1990 the bridge experienced an approximate
100-year flood. Scour calculations found in Appendix B were performed for this event
on the bridge as outlined in Hydraulic Engineering Circular 18 (HEC-18). The scour
analysis was performed based on both an assumed fine sand and on field soil samples.
Soil samples were obtained from the top layer of the soil on the overbank and from the
channel. Visual observations indicated the soil in the overbank to be compact sand and

Figure 9. Paint Rock River near Woodville (BIN# 13564); view looking west toward abutment 1.
Figure 10. Paint Rock River near Woodville (BIN# 13564); view under Bridge A from pier 13
looking northwest toward abutment 1.

the channel was loose sand. The soils were analyzed at the Auburn University Civil
Engineering Soils Laboratory and the results were D50 = 0.0310 mm (0.00010 ft) for the
overbank soil and D50 = 0.65 mm (0.00210 ft) for the main channel soil. The soil in the
overbank was classified as silt and the soil in the main channel was classified as a well
graded sand. Figure 11 shows the results of the calculated scour depths plotted on the
Alabama Bridge Information System (ABIMS) profile with the original groundline and a
soils boring profile from the plans, and a recent sounding. The calculated scour with the
assumed grain size indicates 25 to 33 feet of combined contraction and pier scour and 35
to 38 feet of contraction and abutment scour. The calculated scour with the sampled
grain size indicates 31 to 48 feet of combined contraction and pier scour and 55 to 56 feet
of combined contraction and abutment scour. The recent sounding indicates the main
channel has aggraded slightly and there is 3 to 4 feet of degradation at piers #4 and #5.
The bridges were plated with class 2 riprap indicating scour had occurred throughout the
bridge reach. The exact amount of scour damage was unknown, but it is obvious that the
calculated depths were not reached, since this would have caused a bridge failure.
The reason these calculated scour depths were not reached on the overbank and
main channel is due to the clay layer below the silt and sand layer in the overbank and
main channel. This cohesive layer would provide resistance to scour.


VEST CREEK NEAR BALDWIN
The site is located in Cullman County. There is one main channel bridge. Two
views of the site are shown in Figures 12 and 13. The detailed site information is located
in Appendix A. In 1964 the bridge experienced an approximate 200-year flood. Scour
calculations found in Appendix B were performed for this event on the bridge as outlined
in Hydraulic Engineering Circular 18 (HEC-18). The scour analysis was performed
based on both an assumed fine sand and on field soil samples. Visual observations
indicated rock was present throughout this site therefore no soil samples were taken.
Figure 14 shows the results of the calculated scour depths plotted on the Alabama Bridge
Information System (ABIMS) profile with the original groundline and a soils boring
profile from the plans, and a recent sounding. The calculated scour with the assumed
grain size indicates 3 to 8 feet of combined contraction and pier scour and 0 to 3 feet of
contraction and abutment scour. The recent sounding indicates the channel has aggraded
in the channel approximately 2 to 3 feet. The site inspection revealed local erosion on the
east abutment due to local runoff. Rock outcroppings can be found throughout the
channel. No scour was present in the channel. The basis for the calculated scour depths
not being reached throughout the site is due to a rock foundation.

Figure 12. Vest Creek near Baldwin (BIN# 1127); view from the upstream side looking southwest toward abutment 4.
Figure 13. Vest Creek near Baldwin (BIN# 1127); view from the upstream side looking west toward abutment 4.


BUTTAHATCHEE RIVER BELOW HAMILTON
The site is located in Marion County. There are two bridges, a main channel
bridge and relief bridge. Two views of the site are shown in Figures 15 and 16. The
detailed site information is located in Appendix A. In 1973 the bridges experienced an
approximate 500-year flood. Scour calculations found in Appendix B were performed
for this event on the main channel bridge as outlined in Hydraulic Engineering Circular
18 (HEC-18). The relief bridge was replaced in 1985 and was not included in the
analysis. The scour analysis was performed based on both an assumed fine sand and on
field soil samples. Soil samples were obtained from the top layer of the soil on the
overbank and from the channel. Visual observations indicated the soil in the overbank to
be consolidated clay while the soil from the channel was loose sand. The soils were
analyzed at the Auburn University Civil Engineering Soils Laboratory and the results
were D50 = 0.055 mm (0.00018 ft) for the overbank soil and D50 = 0.27 mm (0.00089 ft)
for the main channel soil. The soil in the overbank was classified as lean clay and the
soil in the main channel was classified as a poorly graded sand. Figure 17 shows the
results of the calculated scour depths plotted on the Alabama Bridge Information System
(ABIMS) profile with the original groundline and a soils boring profile from the plans, a
recent sounding, and a sounding taken during the measured flood. The calculated scour
with the assumed grain size indicates 12 to 31 feet of combined contraction and pier
scour and 12 to 30 feet of contraction and abutment scour. The calculated scour with the
sampled grain size indicates 20 to 30 feet of combined contraction and pier scour and 12
to 38 feet of combined contraction and abutment scour.

Figure 15. Buttahatchee River below Hamilton (BIN# 4202); view from the downstream side looking north
toward abutment 10.
Figure 16. Buttahatchee River below Hamilton (BIN# 4202); view from pier 6 looking south toward abutment 1.


The 1973 flood sounding indicated that the calculated scour depths with the
assumed fine sand D50 values were reached on the left overbank, but the calculated scour
depths with the sampled soil size were not reached. The core borings and analyzed
sampled soil indicate a silty sand and clay is present. The site inspection suggested
possible long-term degradation in the overbank. The calculated scour depths were not
observed anywhere else at the bridge site due to the cohesive nature of the soil. Below
the clay layer is a rock layer that would provide even more resistance to scour.
BUTTAHATCHEE RIVER NEAR SULLIGENT
The site is located in Lamar County. There is one main channel bridge and four
relief bridges. Two views of the site are shown in Figures 18 and 19. The detailed site
information is located in Appendix A. In 1973 the bridges experienced an approximate
500-year flood. Scour calculations found in Appendix B were performed for this event
on the bridges as outlined in Hydraulic Engineering Circular 18 (HEC-18). The scour
analysis was performed based on both an assumed fine sand and on field soil samples.
Soil samples were obtained from the top layer of the soil on the overbank and from the
channel. Visual observations indicated the soil in the overbank to be consolidated clay
while the soil from the channel was silt. Sand was present in the overbank of the main
channel as well. The soils were analyzed at the Auburn University Civil Engineering
Soils Laboratory and the results were D50 = 0.020 mm (0.000070 ft) for the overbank soil
and D50 = 0.33 mm (0.0011 ft) for the main channel soil. The soil in the overbank was
classified as lean clay and the soil in the main channel was classified as poorly graded
sand. Figures 20, 21, 22, 23, and 24 show the results of the calculated scour depths
plotted on the ABIMS profiles for the main channel and all four relief bridges. The plots

Figure 18. Buttahatchee River near Sulligent, Relief Bridge 4 (BIN# 2557); view from the downstream side looking south toward abutment 1.
Figure 19. Buttahatchee River near Sulligent, Relief Bridge 4 (BIN# 2557); view from the downstream side looking southeast at ponded water near abutment 1.


consist of original groundline from the plans, a recent sounding, a sounding from the
1973 flood, and calculated scour with the assumed grain size and with the measured grain
size for the measured event.
The calculated scour at the main channel with the assumed grain size indicates 10
to 27 feet of combined contraction and pier scour and 24 to 26 feet of contraction and
abutment scour. The recent sounding and site inspection determined these depths were
reached for the assumed soil on the left overbank and not reached on the right overbank
or in the channel. Scour observed in the field consisted of a 2 foot scour hole at pier #2.
The sounding indicates a widening of the channel. The calculated scour depths for the
sampled soils were not reached. The reason these calculated scour depths were not
reached is due to the cohesive nature of the soil.
The calculated scour at relief #1 for the assumed grain size indicates 12 to 26 feet
of combined contraction and pier scour and 30 to 31 feet combined contraction and
abutment scour. The calculated scour at relief #1 for the sampled grain size indicates 24
to 50 feet of combined contraction and pier scour and 42 to 44 feet of combined
contraction and abutment scour. Scour observed in the field consisted mainly of 3 feet
deep local scour at pier #4. Riprap has been added between piers #5 and #6. The
sounding indicates 3 to 4 feet deep scour between piers #4 and pier #5 and at the
abutments. The calculated scour depths were not reached for either soils condition due to
the cohesive nature of the soil.
The calculated scour at relief #2 for the assumed grain size indicates 11 to13 feet
of combined contraction and pier scour and 31 to 36 feet combined contraction and
abutment scour. The calculated scour at relief #2 for the sampled grain size indicates 23

to 27 feet of combined contraction and pier scour and 44 to 51 feet of combined
contraction and abutment scour. Scour observed in the field consisted of 2 feet deep local
pier scour located from pier #11 to pier #16. The sounding indicates the channel has
shifted. The calculated scour depths were not reached for either soils condition due to the
cohesive nature of the soil.
The calculated scour at relief #3 for the assumed grain size indicates 12 to 27 feet
of combined contraction and pier scour and 35 to 49 feet combined contraction and
abutment scour. The calculated scour at relief #3 for the sampled grain size indicates 27
to 53 feet of combined contraction and pier scour and 49 to 68 feet of combined
contraction and abutment scour. Riprap was in place from abutment #1 to pier #3
indicating scour may have occurred in the past. The soundings indicate the channel has
scoured between pier #6 and pier #7. The calculated scour depths were not reached for
either the assumed or the sampled soil size due to the cohesive nature of the soil and
riprap placement.
The calculated scour at relief #4 for the assumed grain size indicates 17 to 30 feet
of combined contraction and pier scour and 35 to 39 feet combined contraction and
abutment scour. The calculated scour at relief #4 for the sampled grain size indicates 34
to 58 feet of combined contraction and pier scour and 53 to 57 feet of combined
contraction and abutment scour. The entire bridge reach had ponded water around it.
The soundings indicate the channel has scoured 20 feet between pier #1 and pier #5 and
was filled sometime after 1990. The calculated scour depths were exceeded at piers #3
and #4 for the assumed grain size, but were not exceeded for the sampled soil size. The

reason these calculated scour depths were not reached for the sampled soils at this site is
due to the cohesive nature of the soil.
MULBERRY FORK NEAR GARDEN CITY
The site is located in Blount County. There is one main channel bridge. Two
views of the site are shown in Figures 25 and 26. The detailed site information is located
in Appendix A. In 1990 the bridge experienced an approximate 200-year flood. Scour
calculations found in Appendix B were performed for this event on the bridge as outlined
in Hydraulic Engineering Circular 18 (HEC-18). The scour analysis was performed
based on both an assumed fine sand and on field soil samples. Soil samples were
obtained from the top layer of the soil on the overbank and from the channel. Visual
observations indicated the soil in the overbank and in the channel to be sand. The soils
were analyzed at the Auburn University Civil Engineering Soils Laboratory and the
results were D50 = 0.25 mm (0.00082 ft) for the overbank soil and D50 = 0.90 mm (0.0030
ft) for the main channel soil. The soil in the overbank was classified as a poorly graded
sand and the soil in the main channel was classified as a well graded sand with some
gravel. Figure 27 shows the results of the calculated scour depths plotted on the Alabama
Bridge Information System (ABIMS) profile with the original groundline and a soils
boring profile from the plans, and a recent sounding. The calculated scour with the
assumed grain sizes and with the sampled grain sizes indicate 7 to 14 feet of combined
contraction and pier scour and 0 to 7 feet of contraction and abutment scour for both.
The recent sounding indicates the left overbank has aggraded by 5 to 6 feet between piers
#3 and #4. The site inspection revealed sand overbanks and rock outcropping in the
channel. Scour observed in the field consisted of 5 feet of pier scour at pier #3.

Figure 25. Mulberry Fork near Garden City (BIN# 6914); view from the downstream side looking north
toward abutment 8.
Figure 26. Mulberry Fork near Garden City (BIN# 6914); view from the upstream side looking north toward abutment 8.

The calculated scour depths in the left overbank were consistent with the scour
observed in the field. This is due to the noncohesive sandy material. The scour depths
were not reached throughout the rest of the channel due to the rock foundation.
TALLADEGA CREEK NEAR TALLADEGA
The site is located in Talladega County. There is one main channel bridge. Two
views of the site are shown in Figures 28 and 29. The detailed site information is located
in Appendix A. In 1951 the bridge experienced an approximate 500-year flood. Scour
calculations found in Appendix B were performed for this event on the bridge as outlined
in Hydraulic Engineering Circular 18 (HEC-18). The scour analysis was performed
based on both an assumed fine sand and on field soil samples. Soil samples were
obtained from the top layer of the soil on the overbank and from the channel. Visual
observations indicated the soil in the overbank and main channel to be a consolidated
clay. The soils were analyzed at the Auburn University Civil Engineering Soils
Laboratory and the results were D50 = 0.019 mm (0.000062 ft) for the overbank soil and
D50 = 0.02 mm (0.000066 ft) for the main channel soil. The soil in the overbank was
classified as lean clay and the soil in the main channel was classified as a silty clay.
Figure 30 shows the results of the calculated scour depths plotted on the Alabama Bridge
Information System (ABIMS) profile with the original groundline and a soils boring
profile from the plans, and a recent sounding. The calculated scour with the assumed
grain size indicates 6 to 9 feet of combined contraction and pier scour and 18 to 21 feet of
contraction and abutment scour. The calculated scour with the sampled grain size
indicates 9 to 28 feet of combined contraction and pier scour and 26 to 40 feet of
combined contraction and abutment scour. The recent sounding indicates the channel has

Figure 28. Talladega Creek near Talladega (BIN# 4470); view from the upstream side looking west
toward abutment 1.
Figure 29. Talladega Creek near Talladega (BIN# 4470); view from the upstream side looking northeast toward abutment 8.


widened slightly and has aggraded 2 to 3 feet in the channel. No scour was observed at
the site but signs of erosion existed between piers #5 and #6 and had been deterred by
riprap.
The reason these calculated scour depths were not reached anywhere at the site is
due to the cohesive nature of the soil. Even if the top cohesive layer were scoured away,
a marl is present which would provide even more resistance to scour than the cohesive
material.
OSANIPPA CREEK NEAR FAIRFAX
The site is located in Chambers County. There is one main channel bridge. Two
views of the site are shown in Figures 31 and 32. The detailed site information is located
in Appendix A. In 1961 the bridge experienced an approximate 500-year flood. Scour
calculations found in Appendix B were performed for this event on the bridge as outlined
in Hydraulic Engineering Circular 18 (HEC-18). The scour analysis was performed
based on both an assumed fine sand and on field soil samples. Soil samples were
obtained from the top layer of the soil on the overbank and from the channel. Visual
observations indicated the soil in the overbank to be consolidated clay while the soil from
the channel was loose sand. The soils were analyzed at the Auburn University Civil
Engineering Soils Laboratory and the results were D50 = 0.052 mm (0.00017 ft) for the
overbank soil and D50 = 1.1 mm (0.0036 ft) for the main channel soil. The soil in the
overbank was classified as lean clay and the soil in the main channel was classified as a
poorly graded sand. Figure 33 shows the results of the calculated scour depths plotted on
the Alabama Bridge Information System (ABIMS) profile with the original groundline
and a soils boring profile from the plans, and a recent sounding. The calculated scour

Figure 31. Osanippa Creek near Fairfax (BIN# 615); view from the upstream side looking south
toward abutment 1.
Figure 32. Osanippa Creek near Fairfax (BIN# 615); view from the upstream side looking east
toward abutment 9.


with the assumed grain size indicates 4 to 21 feet of combined contraction and pier scour
and 13 to 17 feet of contraction and abutment scour. The calculated scour with the
sampled grain size indicates 7 to 21 feet of combined contraction and pier scour and 16 to
22 feet of combined contraction and abutment scour. The recent sounding indicates the
channel has widened significantly and has degraded on the left and right overbanks
approximately 4 to 8 feet and has aggraded in the channel approximately 4 feet. The site
inspection revealed the channel is skewed greatly under the bridge almost running
parallel causing the soundings to indicate the main channel to have widened. Scour
observed in the field consisted of 2 to 3 feet deep combined local scour and contraction
scour in the main channel.
The reason these calculated scour depths were exceeded on the left overbank is
due to the shift in the channel. The basis for the scour depths not being reached
throughout the rest of the site is due to the cohesive nature of the soil. Even if the top
cohesive layer were scoured away, rock is present which would provide even more
resistance to scour than the cohesive material.
SUCARNOOCHEE RIVER AT LIVINGSTON
The site is located in Sumter County. There is one main channel bridge and one
relief bridge. Two views of the site are shown in Figures 34 and 35. The detailed site
information is located in Appendix A. In 1979 the bridges experienced an approximate
200-year flood. Scour calculations found in Appendix B were performed for this event
on the bridges as outlined in Hydraulic Engineering Circular 18 (HEC-18). The scour
analysis was performed based on both an assumed fine sand and on field soil samples.
Soil samples were obtained from the top layer of the soil on the overbank and from the

Figure 34. Sucarnoochee River at Livingston (BIN# 2911); view from pier 22 looking south toward abutment 1.
Figure 35. Sucarnoochee River at Livingston (BIN# 2911); view from the upstream side looking south toward abutment 1.

channel. Visual observations indicated the soil in the overbank and main channel to be
clay. The soils were analyzed at the Auburn University Civil Engineering Soils
Laboratory and the results were D50 = 0.060 mm (0.00020 ft) for the overbank soil and
D50 = 0.055 mm (0.00018 ft) for the main channel soil. The soil in the overbank was
classified as silt and the soil in the main channel was classified as a lean clay. Figures 36
and 37 show the results of the calculated scour depths plotted on the ABIMS profiles for
the main channel and the relief bridges. The plots consist of the original groundline from
the plans, core boring depths of a marl layer, a recent sounding, a sounding from the measured
flood, and calculated scour with the assumed grain size and with the measured grain size
for the measured event.
The calculated scour at the main channel with the assumed grain size indicates 6
to 11 feet of combined contraction and pier scour and 24 to 26 feet of contraction and
abutment scour. The calculated scour at the main channel with the sampled soil sizes
indicates 6 to 21 feet of combined contraction and pier scour and 12 to 36 feet of
combined abutment and contraction scour. The recent sounding indicates these depths
were not reached for the assumed and sampled soils calculations. Scour observed in the
field consisted of erosion just upstream of pier #6 in the channel bank. The reason these
calculated scour depths were not reached for the sampled soil is due to the cohesive
nature of the soil.
The calculated scour at relief #1 for the assumed grain size indicates 24 feet of
combined contraction and pier scour and 38 to 40 feet combined contraction and
abutment scour. The calculated scour at relief #1 for the sampled grain size indicates 33
feet of combined contraction and pier scour and 47 to 49 feet of combined contraction


and abutment scour. Scour observed in the field consisted mainly of 1 to 2 feet deep
local scour at pier #2 through #5. The calculated scour depths were not reached for either
soils condition due to the cohesive nature of the soil.
TUCKABUM CREEK NEAR BUTLER
The site is located in Choctaw County. There is one main channel bridge and
three relief bridges. Two views of the site are shown in Figures 38 and 39. The detailed
site information is located in Appendix A. In 1964 the bridges experienced an
approximate 200-year flood. Scour calculations found in Appendix B were performed
for this event on the main channel bridge as outlined in Hydraulic Engineering Circular
18 (HEC-18). The relief bridges have been replaced with new structures. The scour
analysis was performed based on both an assumed fine sand and on field soil samples.
Soil samples were obtained from the top layer of the soil on the overbank and from the
channel of the main channel bridge. Visual observations indicated the soil in the
overbank to be a silty sandy clay and the main channel to be a sand. The soils were
analyzed at the Auburn University Civil Engineering Soils Laboratory and the results
were D50 = 0.049 mm (0.00016 ft) for the overbank soil and D50 = 0.29 mm (0.00094 ft)
for the main channel soil. The soil in the overbank was classified as a lean clay and the
soil in the main channel was classified as a poorly graded sand. Figure 40 shows the
results of the calculated scour depths plotted on the ABIMS profiles for the main channel.
The plots consist of original groundline from the plans, core boring depths of a marl
layer, a recent sounding, and calculated scour with the assumed grain size and with the
measured grain size for the measured event.

Figure 38. Tuckabum Creek near Butler (BIN# 1095); view from the downstream side looking north
toward abutment 32.
Figure 39. Tuckabum Creek near Butler (BIN# 1095); facing south toward abutment 1
view of scour at pier 2.


The calculated scour at the main channel with the assumed grain size indicates 7
to 22 feet of combined contraction and pier scour and 36 to 37 feet of contraction and
abutment scour. The calculated scour at the main channel with the sampled soil sizes
indicates 7 to 15 feet of combined contraction and pier scour and 30 feet of combined
abutment and contraction scour. The recent sounding indicates these depths were not
reached for the assumed and sampled soils calculations. Scour observed in the field
consisted of 1 to 2 feet of scour from piers #2 to #25. The reason these calculated scour
depths were not reached for the sampled soil is due to the cohesive nature of the soil.
TURKEY CREEK AT KIMBROUGH
The site is located in Wilcox County. There is one main channel bridge and two
relief bridges. Two views of the site are shown in Figures 41 and 42. The detailed site
information is located in Appendix A. In 1962 the bridge experienced an approximate
200-year flood. Scour calculations found in Appendix B were performed for this event
on the bridges as outlined in Hydraulic Engineering Circular 18 (HEC-18). The scour
analysis was performed based on both an assumed fine sand and on field soil samples.
Soil samples were obtained from the top layer of the soil on the overbank and from the
channel. Visual observations indicated the soil in the overbank to be consolidated clay
while the soil from the channel was silt. Sand was present in the overbank of the main
channel as well. The soils were analyzed at the Auburn University Soils Laboratory and
the results were D50 = 0.036 mm (0.00012 ft) for the overbank soil and D50 = 0.067 mm
(0.00022 ft) for the main channel soil. The soil in the overbank was classified as silty
clay and the soil in the main channel was classified as a silt. Figures 43, 44, and 45 show
the results of the calculated scour depths plotted on the ABIMS profiles for the main

Figure 41. Turkey Creek at Kimbrough, Relief Bridge 2 (BIN# 2266); view from pier 10 looking south toward abutment 1.
Figure 42. Turkey Creek at Kimbrough, Relief Bridge 2 (BIN# 2266); view from the downstream side looking southwest at abutment 1.


channel and both relief bridges. The plots consist of the original groundline from the
plans, a recent sounding, a flood measurement from 1979, and calculated scour with the
assumed grain size and with the measured grain size for the measured event.
The calculated scour at the main channel with the assumed grain size indicates 8
to 11 feet of combined contraction and pier scour and 0 to 17 feet of contraction and
abutment scour. The recent sounding and site inspection determined these depths were
not reached in the overbank or in the channel. Due to livebed conditions in the overbank
and main channel, there was no difference in scour depths for the assumed and sampled
soils. Scour observed in the field consisted of erosion at abutment #1 embankment and a
scour hole at pier #3. The flood measurement sounding also indicates a widening of the
channel at abutment #1 during the flood, but seems to have been filled by riprap.
The calculated scour at relief #1 for the assumed grain size indicates 22 feet of
combined contraction and pier scour and 34 to 35 feet combined contraction and
abutment scour. The calculated scour at relief #1 for the sampled grain size indicates 35
feet of combined contraction and pier scour and 47 to 48 feet of combined contraction
and abutment scour. Scour observed in the field consisted mainly of 1 to 2 feet deep
local scour at pier #2 and 1 foot of scour extending from pier #4 to pier #12. The
sounding also indicates very little long-term degradation.
The calculated scour at relief #2 for the assumed grain size indicates 12 feet of
combined contraction and pier scour and 21 to 24 feet combined contraction and
abutment scour. The calculated scour at relief #2 for the sampled grain size indicates 19
feet of combined contraction and pier scour and 29 to 31 feet of combined contraction
and abutment scour. Scour observed in the field consisted of a large scour hole 2 to 3 feet

deep located between abutment #1 and pier #2 (Figure 42). Another 1 foot deep scour
hole was located at pier #8. The sounding indicates aggradation throughout the bridge.
The reason these calculated scour depths were not reached at this site is due to the
cohesive nature of the soil.
WEST FORK CHOCTAWHATCHEE RIVER AT BLUE SPRINGS
The site is located in Barbour County. There is one main channel bridge. Two
views of the site are shown in Figures 46 and 47. The detailed site information is located
in Appendix A. In 1990 the bridge experienced an approximate 500-year flood. Scour
calculations found in Appendix B were performed for this event on the bridge as outlined
in Hydraulic Engineering Circular 18 (HEC-18). The scour analysis was performed
based on an assumed fine sand. Visual observations indicated the soil in the overbank
and in the channel to be a brown sandy clay. Figure 48 shows the results of the
calculated scour depths plotted on the Alabama Bridge Information System (ABIMS)
profile with the original groundline and a soils boring profile from the plans, and a recent
sounding. The calculated scour indicates 6 to 7 feet of combined contraction and pier
scour and 3 to 11 feet of contraction and abutment scour. The recent sounding indicates
the right overbank has degraded 2 to 3 feet throughout the bridge site. The site inspection
revealed the bridge had been replaced. The date on the barrier rail was 2000.
The calculated scour depth was reached at pier #4 due to a shift in the main
channel. The calculated scour depths were not reached throughout the rest of the channel
due to the cohesive nature of the soil.

Figure 46. West Fork Choctawhatchee River at Blue Springs (BIN# 16717); view from the downstream side looking northwest toward abutment 1.
Figure 47. West Fork Choctawhatchee River at Blue Springs (BIN# 16717); view looking south at pier 3.


ABBIE CREEK NEAR ABBEVILLE
The site is located in Henry County. There is one main channel bridge. Two
views of the site are shown in Figures 49 and 50. The detailed site information is located
in Appendix A. In 1953 the bridge experienced an approximate 100-year flood. Scour
calculations found in Appendix B were performed for this event on the bridge as outlined
in Hydraulic Engineering Circular 18 (HEC-18). The scour analysis was performed
based on both an assumed fine sand and on field soil samples. A soil sample was
obtained from the top layer of the soil on the overbank. Visual observations indicated the
soil in the overbank and in the channel to be a brown sandy material. The soil was
analyzed at the Auburn University Soils Laboratory and the results were D50 = 0.037 mm
(0.00012 ft). The soil was classified as a silt. Figures 51a and 51b show the results of the
calculated scour depths plotted on the Alabama Bridge Information System (ABIMS)
profile with the original groundline and a recent sounding. The calculated scour with the
assumed grain sizes indicates 6 to 10 feet of combined contraction and pier scour and 25
to 34 feet of contraction and abutment scour. The calculated scour with the sampled
grain sizes indicates 6 to 17 feet of combined contraction and pier scour and 31 to 41 feet
of contraction and abutment scour. The recent sounding does not indicate any
appreciable scour. The site inspection revealed the bridge had scour countermeasures in-
place (Figures 49 and 50). Riprap was located at abutment #1 and from pier #4 to pier #8
and from pier #22 to pier #26. A large scour hole 2 to 3 feet deep was located under the
bridge from pier #2 to pier #4. One to 2 feet of pier scour was also present from pier #14
to pier #22 and evidence of an old scour hole that had been filled was located at abutment
#26.

Figure 49. Abbie Creek near Abbeville (BIN# 2540); view from the downstream side looking west
toward abutment 1.
Figure 50. Abbie Creek near Abbeville (BIN# 2540); view from the upstream side looking west
toward abutment 1.


It is not known if the calculated scour depths were reached throughout the bridge,
but it is apparent that the bridge has experienced scour damage. The soil, a silty material,
is noncohesive which may be the reason for the excessive scour damage.
PEA RIVER NEAR ARITON
The site is located in Dale County. There are two parallel main channel bridges
and two parallel relief bridges. Two views of the site are shown in Figures 52 and 53.
The detailed site information is located in Appendix A. In 1990 the bridges experienced
an approximate 100-year flood. Scour calculations found in Appendix B were performed
for this event on the bridges as outlined in Hydraulic Engineering Circular 18 (HEC-18).
The scour analysis was performed based on both an assumed fine sand and on field soil
samples. Soil samples were obtained from the top layer of the soil on the overbank and
from the channel of the main channel bridges and from the overbank of the relief bridges.
Visual observations indicated the soils to be sand. The soils were analyzed at the Auburn
University Civil Engineering Soils Laboratory and the results were D50 = 0.18 mm
(0.00059 ft) for the overbank soil and D50 = 0.19 mm (0.00062 ft) for the main channel
soil at the main channel bridges and D50 = 0.031 mm (0.0001 ft) for the overbank soil at
the relief bridges. The soil in the overbank and main channel was classified as a poorly
graded sand from the main channel bridges and classified as a lean clay from the relief
bridges. Figures 54 and 55 show the results of the calculated scour depths plotted on the
ABIMS profiles for the main channel and the relief bridges. The plots consist of the
original groundlines from the plans, core boring depths of a marl layer, a recent sounding,
calculated scour with the assumed grain size and with the measured grain size for the
measured event, and a sounding from the 1975 flood.

Figure 52. Pea River near Ariton (BIN# 5573); view from the upstream side of Bridge B looking northeast toward historic structure.
Figure 53. Pea River near Ariton (BIN# 5573); view from the upstream side of historic structure looking south.
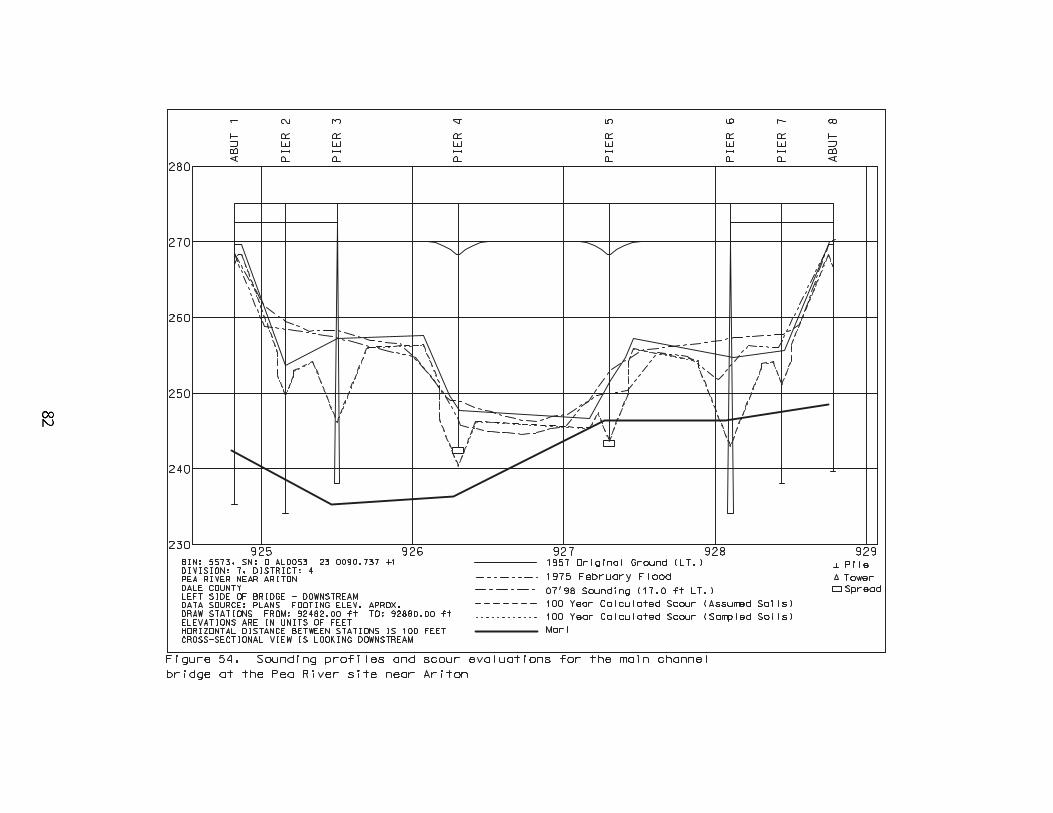


The calculated scour at the main channel bridges with the assumed grain size and
with the sampled grain size indicates 4 to 12 feet of combined contraction and pier scour
and 3 feet of contraction and abutment scour. The calculated scour at the relief bridges
with the assumed grain soil sizes indicates 15 feet of combined contraction and pier scour
and 19 to 20 feet of combined abutment and contraction scour. The recent sounding
indicates these scour depths were not reached for the assumed and sampled soils
calculations. No significant scour was observed in the field although riprap was in-place
showing evidence that scour has occurred in the past at both the main channel bridges
and throughout the relief bridges. It is unknown to what extent the scour was at this site.
PEA RIVER AT ELBA
The site is located in Coffee County. There is one main channel bridge. Two
views of the site are shown in Figures 56 and 57. The detailed site information is located
in Appendix A. In 1990 the bridge experienced an approximate 100-year flood. Scour
calculations found in Appendix B were performed for this event on the bridge as outlined
in Hydraulic Engineering Circular 18 (HEC-18). The scour analysis was performed
based on both an assumed fine sand and on field soil samples. Soil samples were
obtained from the top layer of the soil on the overbank and from the channel. Visual
observations indicated the soil in the overbank to be a sand and in the channel to be a
marl. The soils were analyzed at the Auburn University Civil Engineering Soils
Laboratory and the results were D50 = 0.46 mm (0.0015 ft) for the overbank soil and D50
= 0.041 mm (0.00014 ft) for the main channel soil. The soil in the overbank was
classified as a poorly graded sand and the soil in the main channel was classified as a silt.
Figure 58 shows the results of the calculated scour depths plotted on the Alabama Bridge

Figure 56. Pea River at Elba (BIN# 6434); view from the downstream side looking east toward abutment 19.
Figure 57. Pea River at Elba (BIN# 6434); view from the upstream side looking southwest toward abutment 1.


Information System (ABIMS) profile with the original groundline and a soils boring
profile from the plans, and a recent sounding. The calculated scour with the assumed
grain size indicates 3 to 17 feet of combined contraction and pier scour and 10 to 13 feet
of contraction and abutment scour. The calculated scour with the sampled grain size
indicates 3 to 17 feet of combined contraction and pier scour and 10 to 14 feet of
contraction and abutment scour. The recent sounding indicates the left overbank has
degraded 10 feet at pier #10. This exceeds the calculated scour at that point. The
downstream sounding does not reflect the erosion. The site inspection revealed the left
overbank had experienced erosion and had been filled.
The left overbank had shown signs of scour although it had been filled. The
extent of the scour depths is unknown but the erosion is probably due to the noncohesive
sandy material. The scour depths were not reached throughout the rest of the channel due
to the marl foundation.
CHOCTAWHATCHEE RIVER NEAR NEWTON
The site is located in Dale County. There is one main channel bridge. Two views
of the site are shown in Figures 59 and 60. The detailed site information is located in
Appendix A. In 1990 the bridge experienced an approximate 500-year flood. Scour
calculations found in Appendix B were performed for this event on the bridge as outlined
in Hydraulic Engineering Circular 18 (HEC-18). The scour analysis was performed
based on both an assumed fine sand and on field soil samples. Soil samples were
obtained from the top layer of the soil on the overbank and from the channel. Visual
observations indicated the soil in the overbank to be a sand and in the channel to be a
marl. The soils were analyzed at the Auburn University Civil Engineering Soils

Figure 59. Choctawhatchee River near Newton (BIN# 11857); view from the upstream side looking northwest toward abutment 11.
Figure 60. Choctawhatchee River near Newton (BIN# 11857); view from the downstream side looking southeast toward abutment 1.

Laboratory and the results were D50 = 0.36 mm (0.0012 ft) for the overbank soil and D50
= 0.031 mm (0.00010 ft) for the main channel soil. The soil in the overbank was
classified as a poorly graded sand and the soil in the main channel was classified as an
elastic silt. Figure 61 shows the results of the calculated scour depths plotted on the
Alabama Bridge Information System (ABIMS) profile with the original groundline and a
soils boring profile from the plans, a recent sounding, and a sounding from a known flood
event. The calculated scour with the assumed grain size indicates 14 to 31 feet of
combined contraction and pier scour and 9 to 35 feet of contraction and abutment scour.
The calculated scour with the sampled grain size indicates 11 to 22 feet of combined
contraction and pier scour and 6 to 27 feet of contraction and abutment scour. The recent
sounding indicates the left overbank has degraded 3 to 4 feet at pier #3 and 2 to 3 feet
between piers #6 and #7. The site inspection revealed riprap in-place on the upstream
right bank extending to the end of the guide bank. The riprap added was a scour
countermeasure placed after a large scour hole had formed during the 1990 event.
The scour is probably due to the upper layer of noncohesive sandy material. The
calculated scour depths were not reached throughout the rest of the channel due to the
hard silt foundation, which provides resistance to scour.


LIGHTWOOD KNOT CREEK AT BABBIE
The site is located in Covington County. There is one main channel bridge and
one relief bridge. Two views of the site are shown in Figures 62 and 63. The site
information is located in Appendix A. In 1990 the bridges experienced an approximate
100-year flood. Scour calculations found in Appendix B were performed for this event
on the bridges as outlined in Hydraulic Engineering Circular 18 (HEC-18). The scour
analysis was performed based on both an assumed fine sand and on field soil samples. A
soil sample was obtained from the top layer of the soil from the main channel bridge.
Visual observations indicated the soils to be sand. The soil was analyzed at the Auburn
University Civil Engineering Soils Laboratory and the results were D50 = 0.30 mm
(0.00098 ft) for the main channel bridge and assumed to be the same for the relief bridge
soil. The soil was classified as a poorly graded sand. Figures 64 and 65 show the results
of the calculated scour depths plotted on the ABIMS profiles for the main channel bridge
and the relief bridge. The plots consist of original groundline from the plans, core boring
depths of a sandy clay and sandrock layer, a recent sounding, and calculated scour with
the assumed grain size and with the measured grain size for the measured event.
The calculated scour at the main channel bridge with the assumed grain size
indicates 3 to 23 feet of combined contraction and pier scour and 40 to 43 feet of
contraction and abutment scour. The calculated scour at the main channel bridge with the
sampled grain size indicates 3 to 19 feet of combined contraction and pier scour and 34 to
38 feet of contraction and abutment scour. The calculated scour at the relief bridge with
the assumed grain soil sizes indicates 18 feet of combined contraction and pier scour and
30 to 32 feet of combined abutment and contraction scour. The calculated scour at the

Figure 62. Lightwood Knot Creek at Babbie (BIN# 12968); view from the downstream side looking west toward abutment 1.
Figure 63. Lightwood Knot Creek at Babbie (BIN# 12968); view from the upstream side looking west toward abutment 1.


relief bridge with the sampled grain soil sizes indicates 15 feet of combined contraction
and pier scour and 27 to 29 feet of combined abutment and contraction scour. The recent
sounding indicates the main channel deepened past the calculated scour depth. There was
3 to 4 feet of scour around pier #3 at the main channel bridge and at pier #2 at the relief
bridge. The site inspection in 2001 revealed riprap was in-place from abutment to
abutment at the main channel bridge and at the relief bridge. This indicates that scour has
occurred in the past at both the main channel bridge and throughout the relief bridge.
Local scour was indicated on the 1990 inspection report to be around all of the piers and
approximately 4 feet deep around piers #3 and #4 per the ALDOT bridge inspector. The
reason for the scour is probably due to the noncohesive soil.

VI. CONCLUSION
Scour evaluations were performed for 18 selected bridge sites in Alabama that
had experienced an event equal to or greater than a 100-year flood event. Plots were
derived for comparing field measurements made during yearly site inspections, ground
elevations taken during floods where available, core boring information, and the
computed scour from the estimated and measured flood events. Critical evaluation of
each site shows differences between calculated and evident scour at the sites. It was
found that scour evaluations performed on bridges with sand foundations experienced
scour problems consistent with scour depths calculated from the HEC-18 equations.
Scour evaluations performed on sites with cohesive soils showed that calculated scour
depths were not consistent with observed scour at the site. For most cases, the reason for
this discrepancy is due to higher critical shear stress in soils with cohesive forces. Also,
even if the critical shear stress is exceeded, the rate of scour is less for cohesive soil.
Thus, the flow of water over this soil would have to generate a higher shear stress over a
long period of time to reach the calculated scour depths from HEC-18. In contrast, for
noncohesive sandy soils, it is assumed that maximum scour depths occur instantaneously
for a given discharge. The equations in HEC-18 do not consider cohesive forces to
determine scour depths. Beyond the input for the HEC-18 equations, additional site-
specific information and improved scour calculation methods are needed for design and
for analyzing existing bridges at sites as discussed by Briaud et al. (1999, 2001a, 2001b),
Güven et al. (2001), and Güven et al. (2002, TRB Paper No. 02-2127, accepted for
publication).

REFERENCES
Atkins, J.B., 1996. Magnitude and frequency of floods in Alabama: U.S. Geological Survey Water-Resources Investigations Report 95-4199, 234p. Briaud, J.L., F.C.K Ting, H.C. Chen, R. Gudavalli, S. Perugu, and G. Wei, 1999. SRICOS: Prediction of Scour Rate in Cohesive Soils at Bridge Piers. Journal of Geotechnical and Geoenvironmental Engineering, Vol. 125, No. 4, April 1999, pp. 237-246, American Society of Civil Engineers, Reston, Virginia, U.S.A. Briaud, J.L., F.C.K Ting, H.C. Chen, Y. Cao, S.W. Han, and K.W. Kwak, 2001a. Erosion Function Apparatus for Scour Rate Predictions. Journal of Geotechnical and Geoenvironmental Engineering, Vol. 127, No. 2, February 2001, pp. 105-113, American Society of Civil Engineers, Reston, Virginia, U.S.A. Briaud, J.L., H.C. Chen, K.W. Kwak, S. W. Han, and F.C. Ting, 2001b. Multiflood and Multilayer Method for Scour Rate Prediction at Bridge Piers. Journal of Geotechnical and Geoenvironmental Engineering, Vol. 127, No. 2, February 2001, pp. 114-125, American Society of Civil Engineers, Reston, Virginia, U.S.A. Brunner, G.W. 2001a. HEC-RAS, River Analysis System User’s Manual, US Army Corps of Engineers, Hydrologic Engineering Center, Report No. CPD 68, January 2001, Davis, C.A. Brunner, G.W., 2001b. HEC-RAS, River Analysis System Hydraulic Reference Manual, US Army Corps of Engineers, Hydrologic Engineering Center, Report No. CPD 69, January 2001, Davis, C.A. Federal Highway Administration, 1993. Evaluating Scour at Bridges, Federal Highway Administration, HEC No. 18, Publication No. FHWA-IP-90-017, 2nd Edition, April 1993, Washington D.C. Federal Highway Administration, 1995. Evaluating Scour at Bridges, Federal Highway Administration, HEC No. 18, Publication No. FHWA-IP-90-017, 3rd Edition, November 1995, Washington D.C. Federal Highway Administration, 2001. Evaluating Scour at Bridges, Federal Highway Administration, HEC No. 18, Publication No. FHWA-NHI-01-001, 4th Edition, May 2001, Washington D.C. Froelich, D.C., 1989. Local Scour at Bridge Abutments, Proceedings of the 1989 National Conference on Hydraulic Engineering, ASCE, New Orleans, LA, pp. 13-18. Güven, O., J.G. Melville, and J.E. Curry, 2001. Analysis of Clear-Water Scour At Bridge Contractions in Cohesive Soils, Highway Research Center IR-930-490, June 2001, Auburn, AL.

Güven, O., J.G. Melville, and J.E. Curry, 2002. “Analysis of Clear-Water Scour at Bridge Contractions in Cohesive Soils”, TRB Paper No. 02-2127, scheduled for publication in 2002 in the Transportation Research Record, National Research Council. Washington, D.C. HRC, 1998, Internal memorandum on Alabama’s Highway research needs, Auburn University Highway Research Center, Auburn University, Alabama. Richardson, E.V., Simons, D.B. and Julien, P., 1990. Highways in the River Environment, FHWA-HI-90-016, Federal Highway Administration, U.S. Department of Transportation, February 1990, Washington, D.C.