Embed Size (px)
Citation preview
Page 1 of 21
STUDY NOTES EPISODE 25: ACADEMIC WRITING WRITING TASK 1, ACADEMIC MODULE The instructions given for Task 1, Academic Writing require a summary of the information supplied in a graphic text. The candidate must select and report the main features. One of the key skills required for this task is the ability to identify the main features of the graphic text supplied. This text might be a table, graph, object, process or procedure. A further skill, spelt out in the instructions, is the ability to make comparisons where relevant. What do I have to do? Writing Task 1, Academic Module requires the test candidate to
• summarise the information supplied in a graphic text
• select and report main features • make comparisons where relevant
What do these graphic texts actually look like? There are different types of graphic texts:
• table • graph – line, bar, column, pie chart • object • process or • procedure
The following pages contain some examples:
STUDY TIPS It is necessary in Task 1, Academic Writing, to quickly identify the main or significant features of a given graphic text (a table, graph, object, process or procedure), summarise these and make comparisons where relevant. Look for significant features such as trends, which stand out in a graph, key stages in a process or procedure, important characteristics of an object. Develop your skills in organising a summary of information supplied, including relevant information, using a variety of sentence types, and appropriate vocabulary. Always check your spelling.
Page 2 of 21
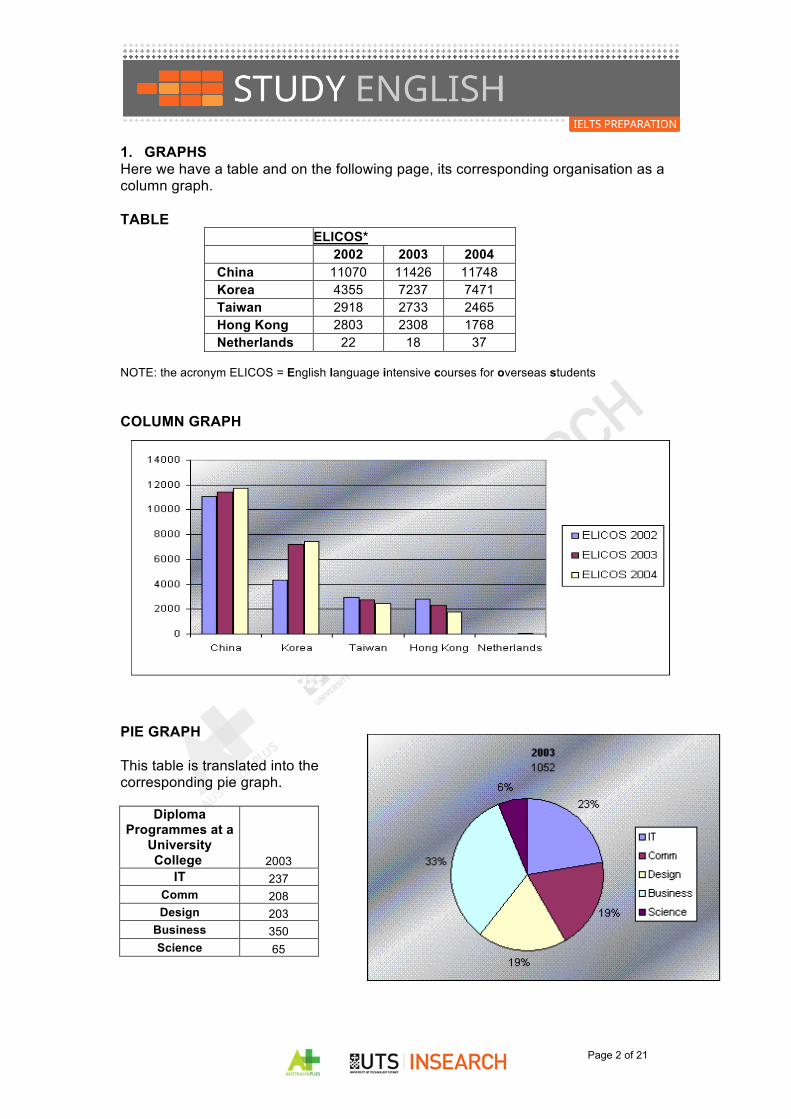
1. GRAPHS Here we have a table and on the following page, its corresponding organisation as a column graph. TABLE
ELICOS* 2002 2003 2004 China 11070 11426 11748 Korea 4355 7237 7471 Taiwan 2918 2733 2465 Hong Kong 2803 2308 1768 Netherlands 22 18 37
NOTE: the acronym ELICOS = English language intensive courses for overseas students COLUMN GRAPH PIE GRAPH This table is translated into the corresponding pie graph.
Diploma Programmes at a
University College 2003
IT 237 Comm 208 Design 203 Business 350 Science 65
Page 3 of 21
0
2
4
6
8
10
12
1960 1970 1980 1990 2000
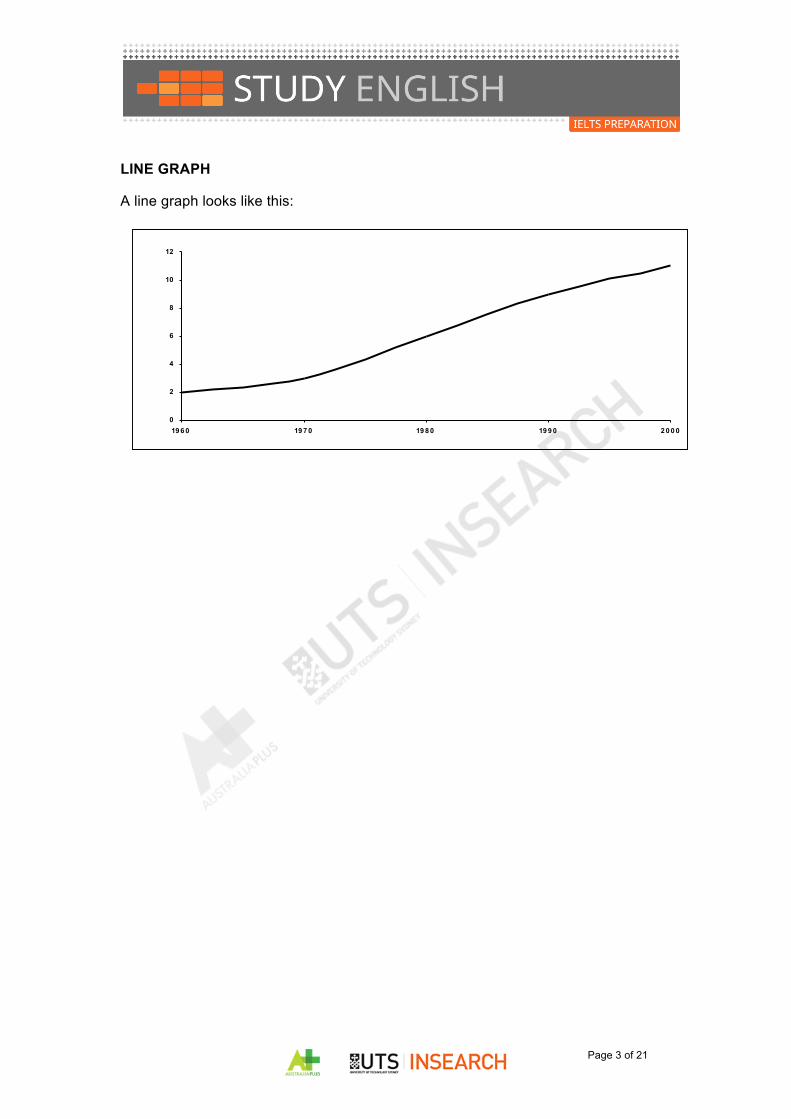
LINE GRAPH A line graph looks like this:
Page 4 of 21
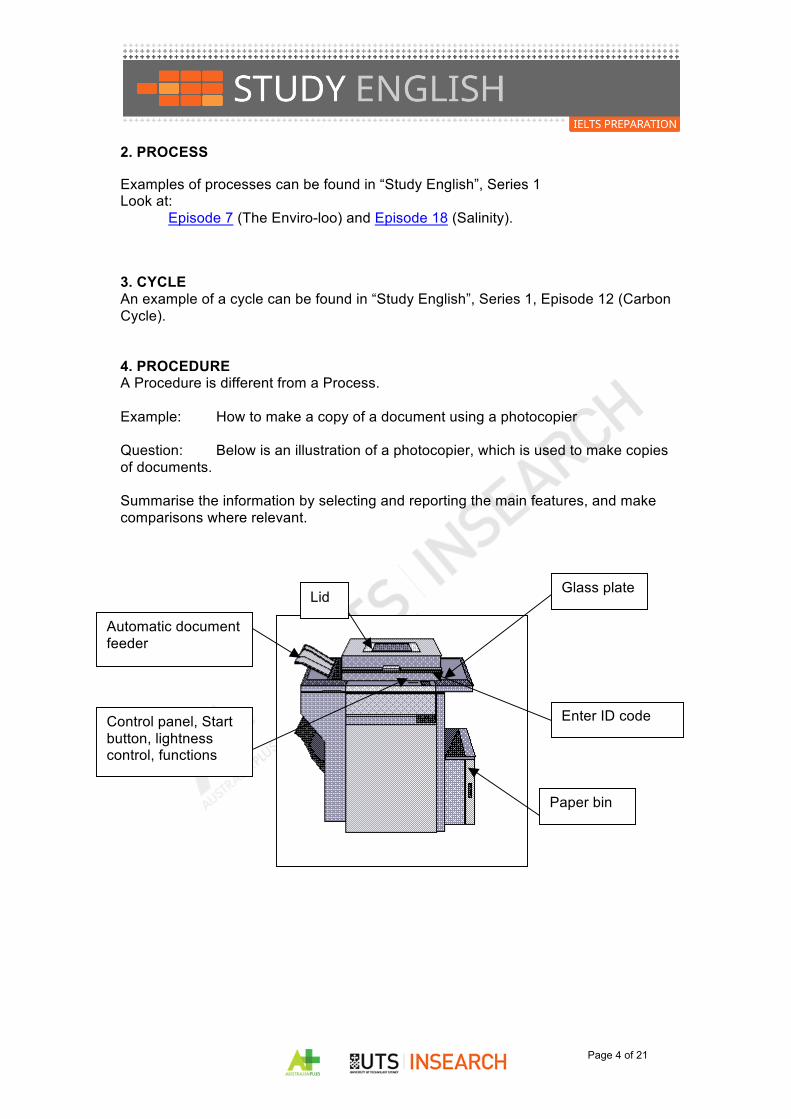
2. PROCESS Examples of processes can be found in “Study English”, Series 1 Look at: Episode 7 (The Enviro-loo) and Episode 18 (Salinity). 3. CYCLE An example of a cycle can be found in “Study English”, Series 1, Episode 12 (Carbon Cycle). 4. PROCEDURE A Procedure is different from a Process. Example: How to make a copy of a document using a photocopier Question: Below is an illustration of a photocopier, which is used to make copies of documents. Summarise the information by selecting and reporting the main features, and make comparisons where relevant.
Automatic document feeder
Enter ID code
Glass plate Lid
Control panel, Start button, lightness control, functions
Paper bin
Page 5 of 21
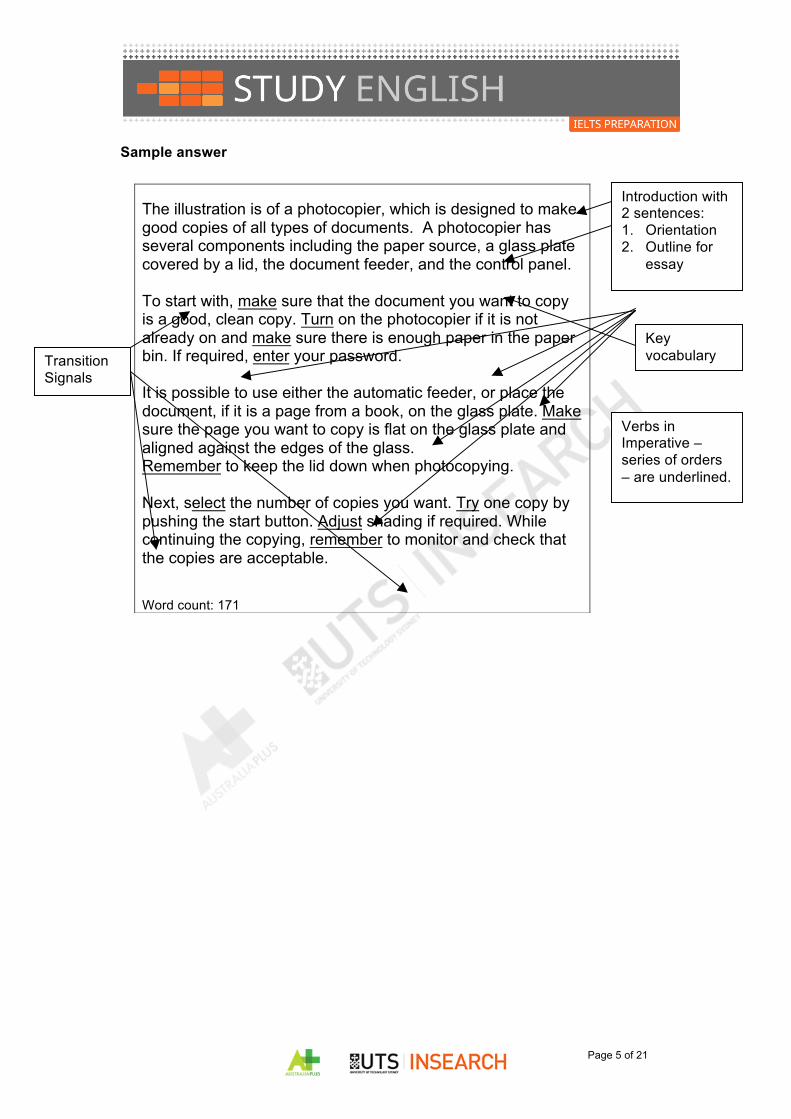
Sample answer
The illustration is of a photocopier, which is designed to make good copies of all types of documents. A photocopier has several components including the paper source, a glass plate covered by a lid, the document feeder, and the control panel. To start with, make sure that the document you want to copy is a good, clean copy. Turn on the photocopier if it is not already on and make sure there is enough paper in the paper bin. If required, enter your password. It is possible to use either the automatic feeder, or place the document, if it is a page from a book, on the glass plate. Make sure the page you want to copy is flat on the glass plate and aligned against the edges of the glass. Remember to keep the lid down when photocopying. Next, select the number of copies you want. Try one copy by pushing the start button. Adjust shading if required. While continuing the copying, remember to monitor and check that the copies are acceptable. Word count: 171
Introduction with 2 sentences: 1. Orientation 2. Outline for
essay
Key vocabulary
Verbs in Imperative – series of orders – are underlined.
Transition Signals
Page 6 of 21
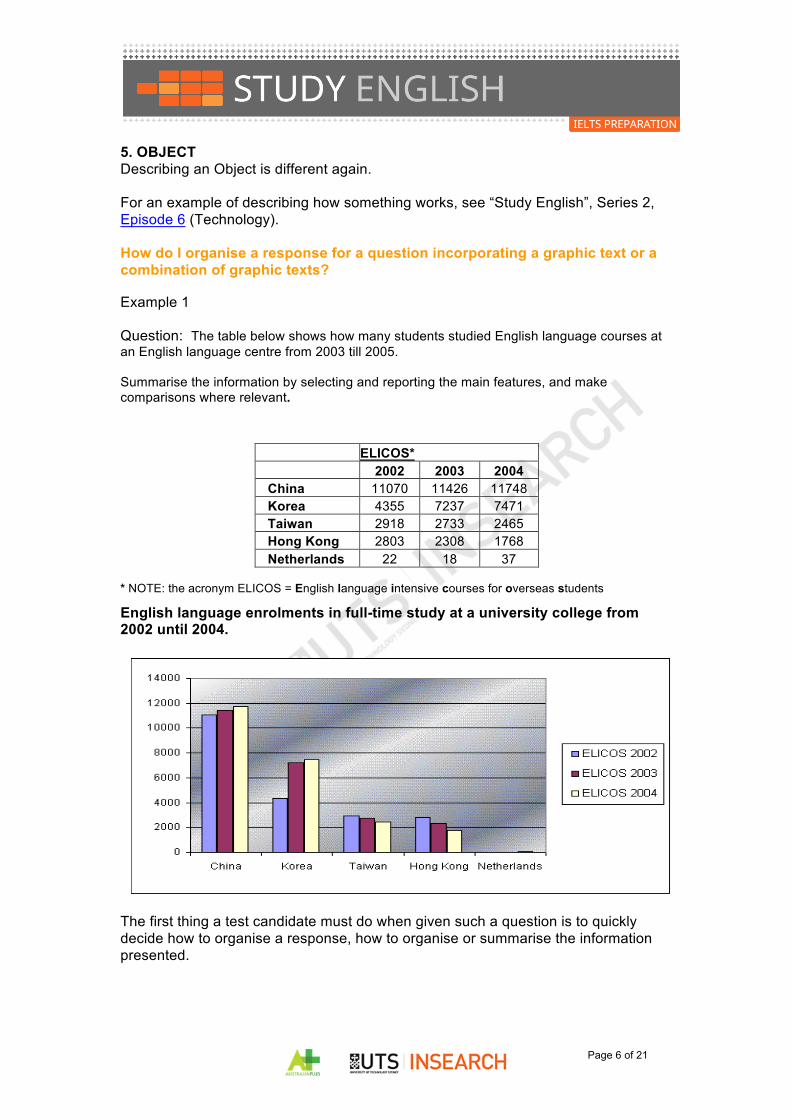
5. OBJECT Describing an Object is different again. For an example of describing how something works, see “Study English”, Series 2, Episode 6 (Technology). How do I organise a response for a question incorporating a graphic text or a combination of graphic texts? Example 1 Question: The table below shows how many students studied English language courses at an English language centre from 2003 till 2005. Summarise the information by selecting and reporting the main features, and make comparisons where relevant.
ELICOS* 2002 2003 2004 China 11070 11426 11748 Korea 4355 7237 7471 Taiwan 2918 2733 2465 Hong Kong 2803 2308 1768 Netherlands 22 18 37
* NOTE: the acronym ELICOS = English language intensive courses for overseas students
English language enrolments in full-time study at a university college from 2002 until 2004. The first thing a test candidate must do when given such a question is to quickly decide how to organise a response, how to organise or summarise the information presented.
Page 7 of 21
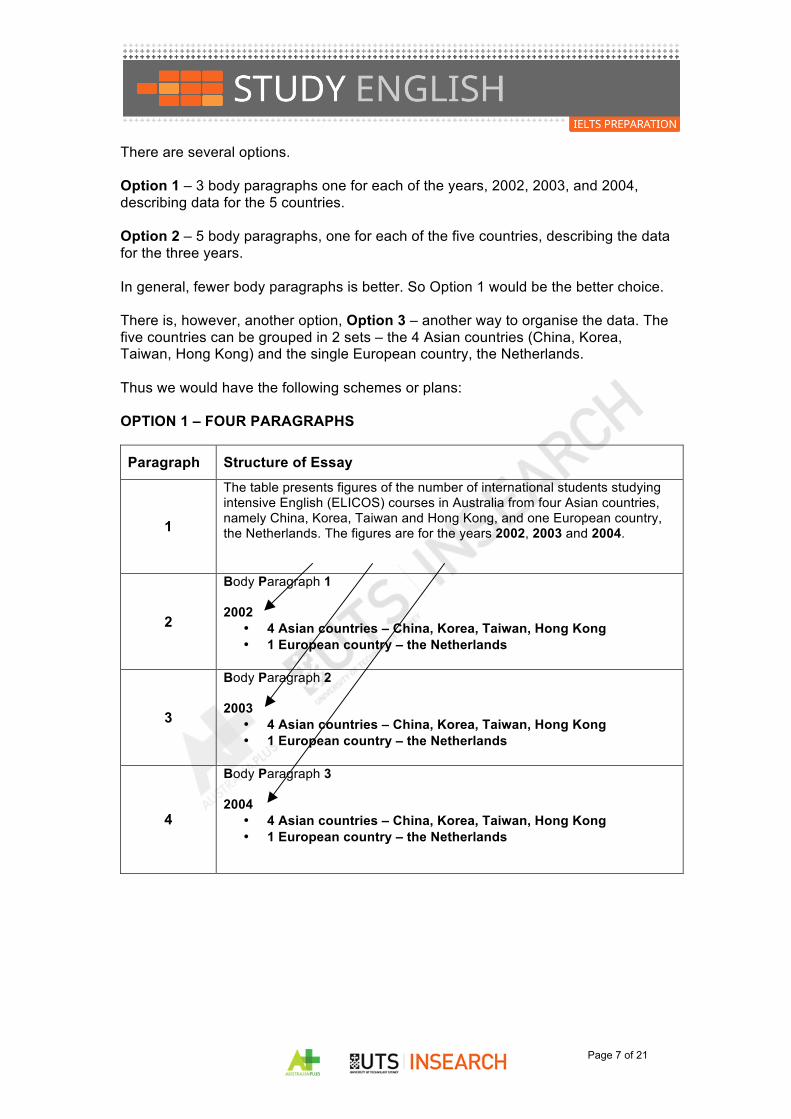
There are several options. Option 1 – 3 body paragraphs one for each of the years, 2002, 2003, and 2004, describing data for the 5 countries. Option 2 – 5 body paragraphs, one for each of the five countries, describing the data for the three years. In general, fewer body paragraphs is better. So Option 1 would be the better choice. There is, however, another option, Option 3 – another way to organise the data. The five countries can be grouped in 2 sets – the 4 Asian countries (China, Korea, Taiwan, Hong Kong) and the single European country, the Netherlands. Thus we would have the following schemes or plans: OPTION 1 – FOUR PARAGRAPHS
Paragraph Structure of Essay
1
The table presents figures of the number of international students studying intensive English (ELICOS) courses in Australia from four Asian countries, namely China, Korea, Taiwan and Hong Kong, and one European country, the Netherlands. The figures are for the years 2002, 2003 and 2004.
2
Body Paragraph 1 2002
• 4 Asian countries – China, Korea, Taiwan, Hong Kong • 1 European country – the Netherlands
3
Body Paragraph 2 2003
• 4 Asian countries – China, Korea, Taiwan, Hong Kong • 1 European country – the Netherlands
4
Body Paragraph 3 2004
• 4 Asian countries – China, Korea, Taiwan, Hong Kong • 1 European country – the Netherlands
Page 8 of 21
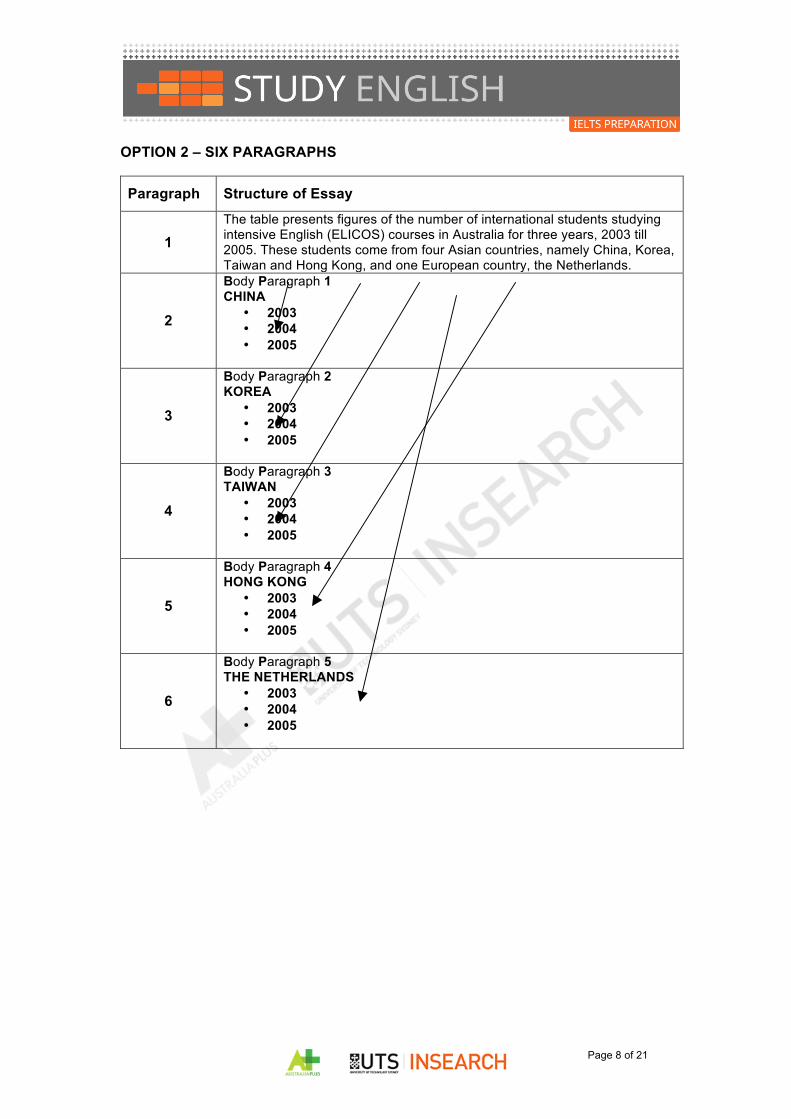
OPTION 2 – SIX PARAGRAPHS
Paragraph Structure of Essay
1 The table presents figures of the number of international students studying intensive English (ELICOS) courses in Australia for three years, 2003 till 2005. These students come from four Asian countries, namely China, Korea, Taiwan and Hong Kong, and one European country, the Netherlands.
2
Body Paragraph 1 CHINA
• 2003 • 2004 • 2005
3
Body Paragraph 2 KOREA
• 2003 • 2004 • 2005
4
Body Paragraph 3 TAIWAN
• 2003 • 2004 • 2005
5
Body Paragraph 4 HONG KONG
• 2003 • 2004 • 2005
6
Body Paragraph 5 THE NETHERLANDS
• 2003 • 2004 • 2005
Page 9 of 21
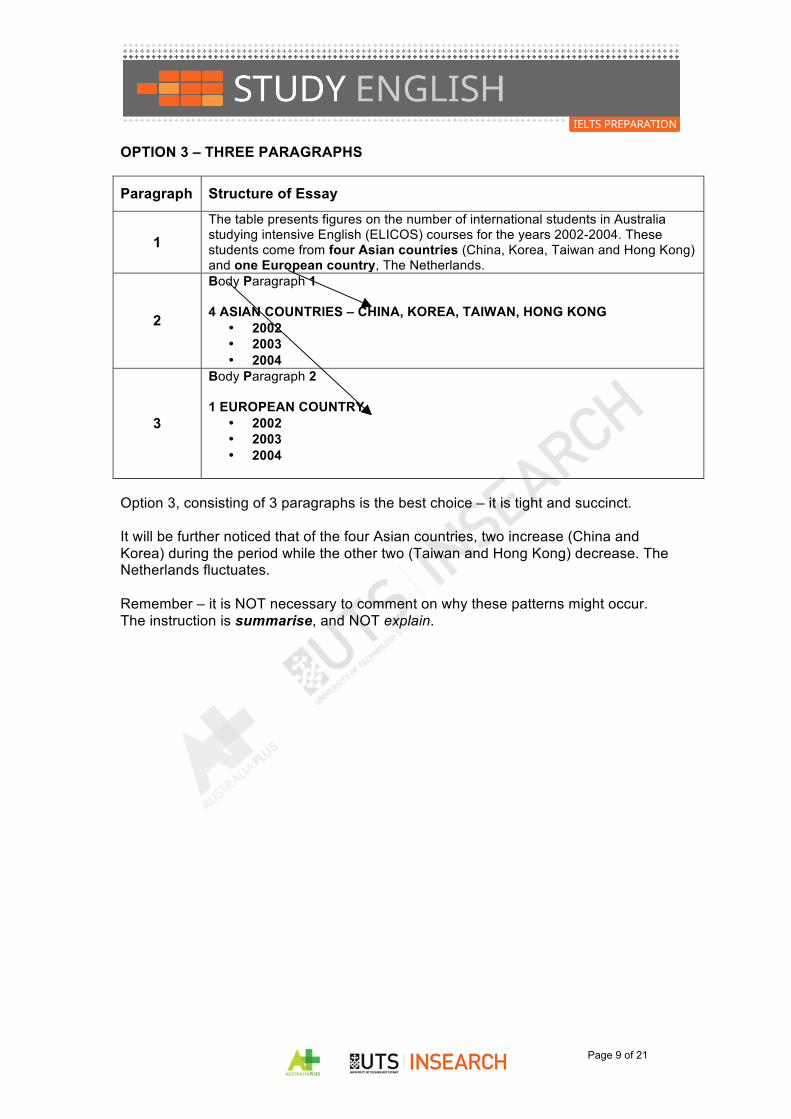
OPTION 3 – THREE PARAGRAPHS
Paragraph Structure of Essay
1 The table presents figures on the number of international students in Australia studying intensive English (ELICOS) courses for the years 2002-2004. These students come from four Asian countries (China, Korea, Taiwan and Hong Kong) and one European country, The Netherlands.
2
Body Paragraph 1 4 ASIAN COUNTRIES – CHINA, KOREA, TAIWAN, HONG KONG
• 2002 • 2003 • 2004
3
Body Paragraph 2 1 EUROPEAN COUNTRY
• 2002 • 2003 • 2004
Option 3, consisting of 3 paragraphs is the best choice – it is tight and succinct. It will be further noticed that of the four Asian countries, two increase (China and Korea) during the period while the other two (Taiwan and Hong Kong) decrease. The Netherlands fluctuates. Remember – it is NOT necessary to comment on why these patterns might occur. The instruction is summarise, and NOT explain.
Page 10 of 21
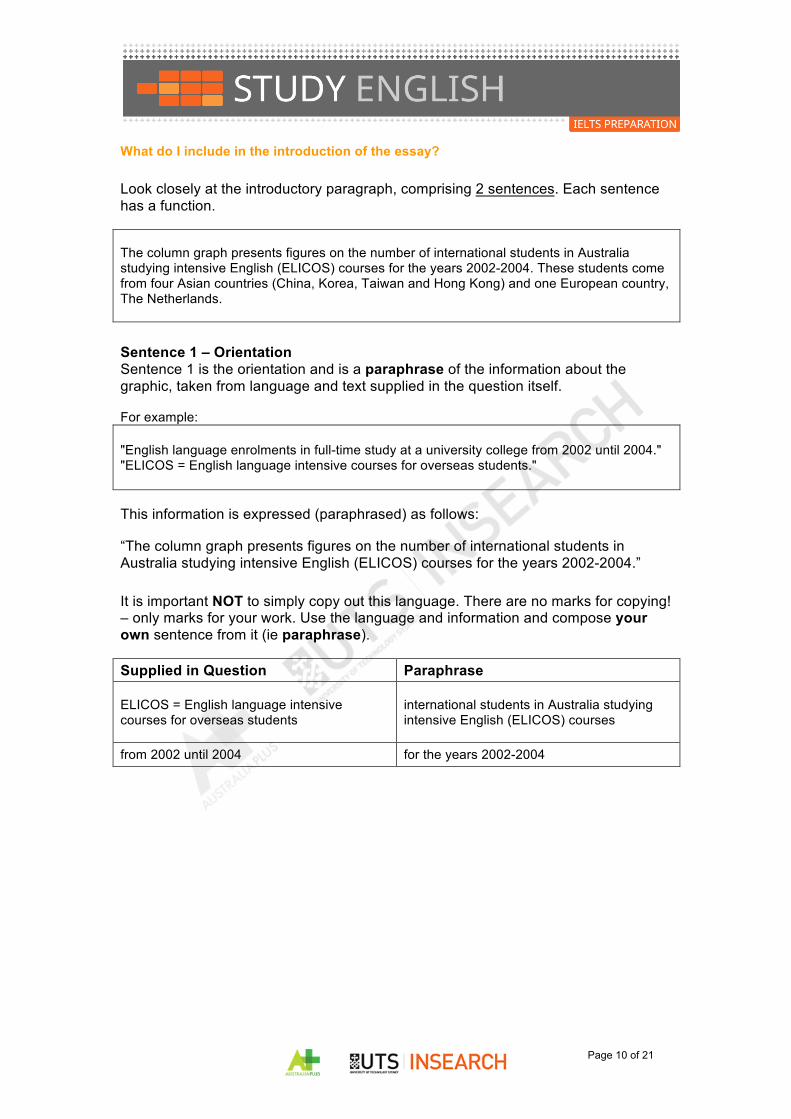
What do I include in the introduction of the essay? Look closely at the introductory paragraph, comprising 2 sentences. Each sentence has a function.
The column graph presents figures on the number of international students in Australia studying intensive English (ELICOS) courses for the years 2002-2004. These students come from four Asian countries (China, Korea, Taiwan and Hong Kong) and one European country, The Netherlands.
Sentence 1 – Orientation Sentence 1 is the orientation and is a paraphrase of the information about the graphic, taken from language and text supplied in the question itself. For example:
"English language enrolments in full-time study at a university college from 2002 until 2004." "ELICOS = English language intensive courses for overseas students."
This information is expressed (paraphrased) as follows: “The column graph presents figures on the number of international students in Australia studying intensive English (ELICOS) courses for the years 2002-2004.” It is important NOT to simply copy out this language. There are no marks for copying! – only marks for your work. Use the language and information and compose your own sentence from it (ie paraphrase). Supplied in Question Paraphrase
ELICOS = English language intensive courses for overseas students
international students in Australia studying intensive English (ELICOS) courses
from 2002 until 2004 for the years 2002-2004
Page 11 of 21
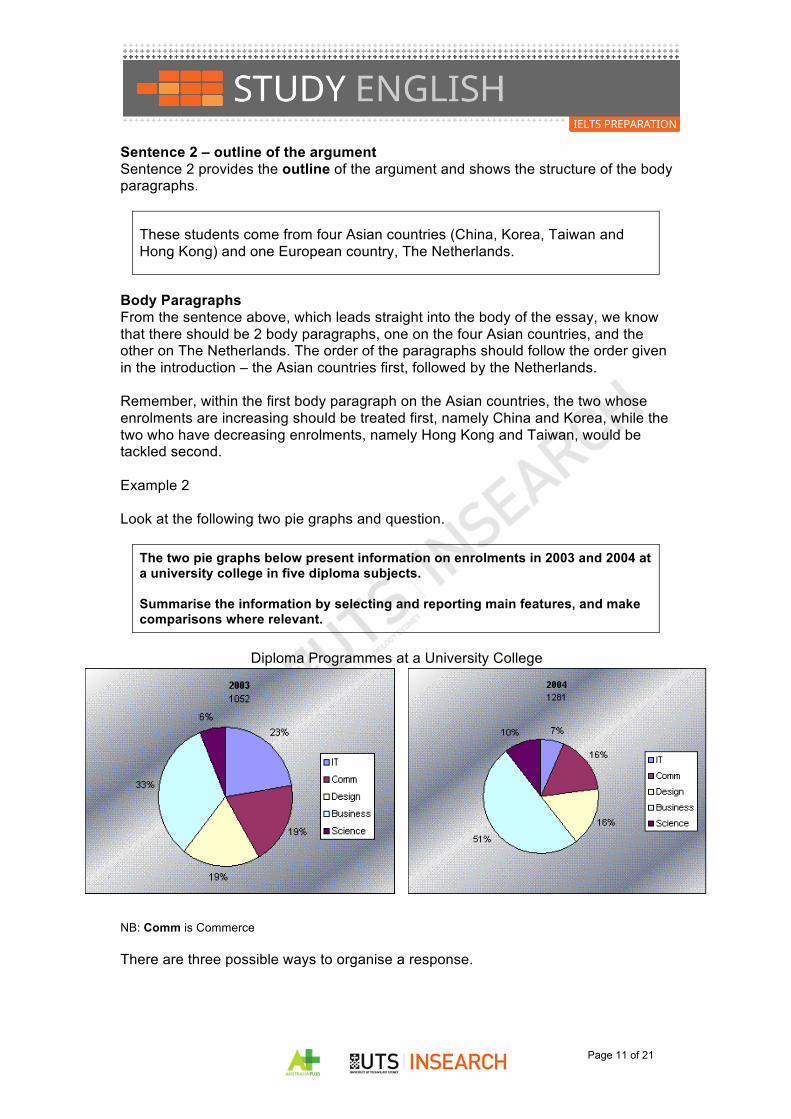
Sentence 2 – outline of the argument Sentence 2 provides the outline of the argument and shows the structure of the body paragraphs.
These students come from four Asian countries (China, Korea, Taiwan and Hong Kong) and one European country, The Netherlands.
Body Paragraphs From the sentence above, which leads straight into the body of the essay, we know that there should be 2 body paragraphs, one on the four Asian countries, and the other on The Netherlands. The order of the paragraphs should follow the order given in the introduction – the Asian countries first, followed by the Netherlands. Remember, within the first body paragraph on the Asian countries, the two whose enrolments are increasing should be treated first, namely China and Korea, while the two who have decreasing enrolments, namely Hong Kong and Taiwan, would be tackled second. Example 2 Look at the following two pie graphs and question. The two pie graphs below present information on enrolments in 2003 and 2004 at a university college in five diploma subjects.
Summarise the information by selecting and reporting main features, and make comparisons where relevant.
Diploma Programmes at a University College
NB: Comm is Commerce There are three possible ways to organise a response.
Page 12 of 21
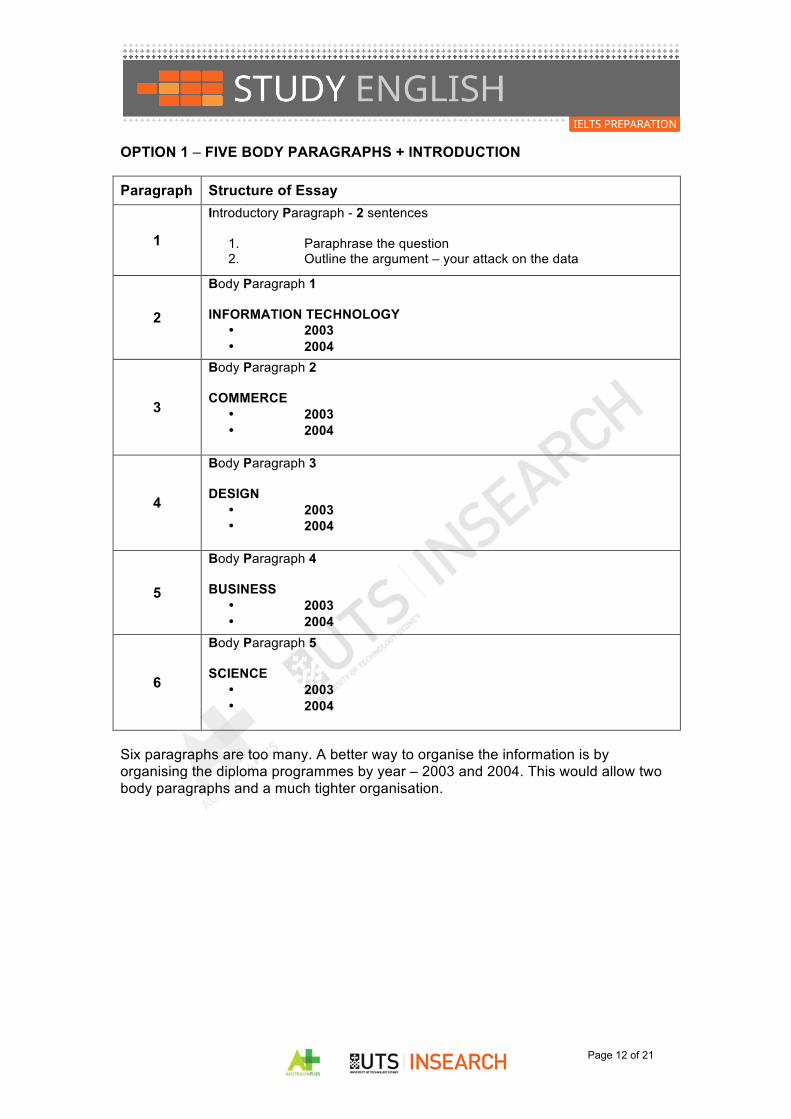
OPTION 1 – FIVE BODY PARAGRAPHS + INTRODUCTION
Paragraph Structure of Essay
1
Introductory Paragraph - 2 sentences
1. Paraphrase the question 2. Outline the argument – your attack on the data
2
Body Paragraph 1 INFORMATION TECHNOLOGY
• 2003 • 2004
3
Body Paragraph 2 COMMERCE
• 2003 • 2004
4
Body Paragraph 3 DESIGN
• 2003 • 2004
5
Body Paragraph 4 BUSINESS
• 2003 • 2004
6
Body Paragraph 5 SCIENCE
• 2003 • 2004
Six paragraphs are too many. A better way to organise the information is by organising the diploma programmes by year – 2003 and 2004. This would allow two body paragraphs and a much tighter organisation.
Page 13 of 21
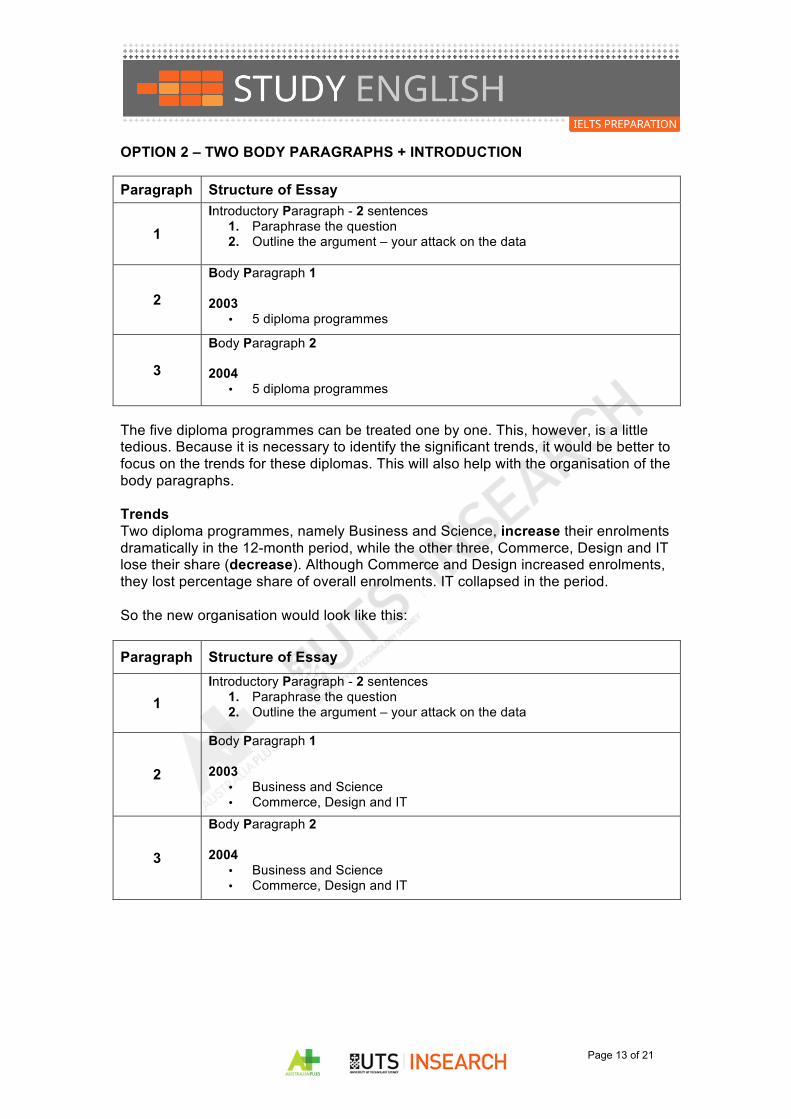
OPTION 2 – TWO BODY PARAGRAPHS + INTRODUCTION Paragraph Structure of Essay
1 Introductory Paragraph - 2 sentences
1. Paraphrase the question 2. Outline the argument – your attack on the data
2
Body Paragraph 1 2003
• 5 diploma programmes
3
Body Paragraph 2 2004
• 5 diploma programmes
The five diploma programmes can be treated one by one. This, however, is a little tedious. Because it is necessary to identify the significant trends, it would be better to focus on the trends for these diplomas. This will also help with the organisation of the body paragraphs. Trends Two diploma programmes, namely Business and Science, increase their enrolments dramatically in the 12-month period, while the other three, Commerce, Design and IT lose their share (decrease). Although Commerce and Design increased enrolments, they lost percentage share of overall enrolments. IT collapsed in the period. So the new organisation would look like this:
Paragraph Structure of Essay
1 Introductory Paragraph - 2 sentences
1. Paraphrase the question 2. Outline the argument – your attack on the data
2
Body Paragraph 1 2003
• Business and Science • Commerce, Design and IT
3
Body Paragraph 2 2004
• Business and Science • Commerce, Design and IT
Page 14 of 21
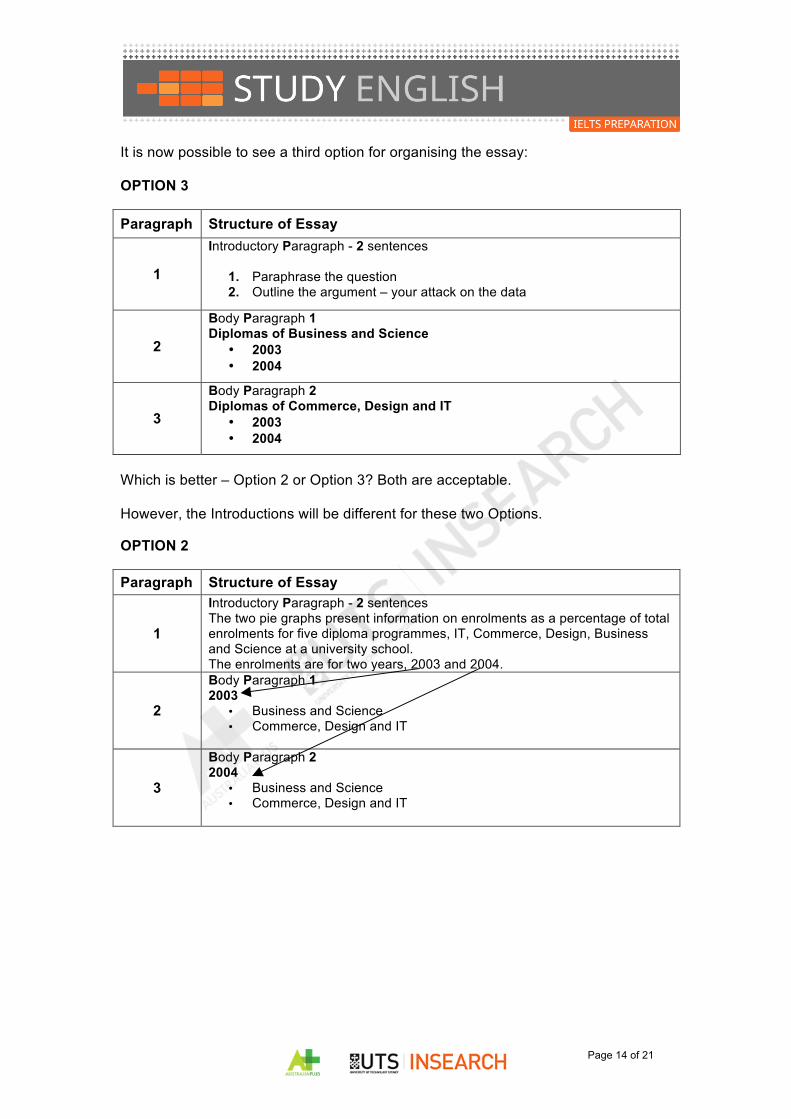
It is now possible to see a third option for organising the essay: OPTION 3
Paragraph Structure of Essay
1
Introductory Paragraph - 2 sentences
1. Paraphrase the question 2. Outline the argument – your attack on the data
2
Body Paragraph 1 Diplomas of Business and Science
• 2003 • 2004
3
Body Paragraph 2 Diplomas of Commerce, Design and IT
• 2003 • 2004
Which is better – Option 2 or Option 3? Both are acceptable. However, the Introductions will be different for these two Options. OPTION 2 Paragraph Structure of Essay
1
Introductory Paragraph - 2 sentences The two pie graphs present information on enrolments as a percentage of total enrolments for five diploma programmes, IT, Commerce, Design, Business and Science at a university school. The enrolments are for two years, 2003 and 2004.
2
Body Paragraph 1 2003
• Business and Science • Commerce, Design and IT
3
Body Paragraph 2 2004
• Business and Science • Commerce, Design and IT
Page 15 of 21
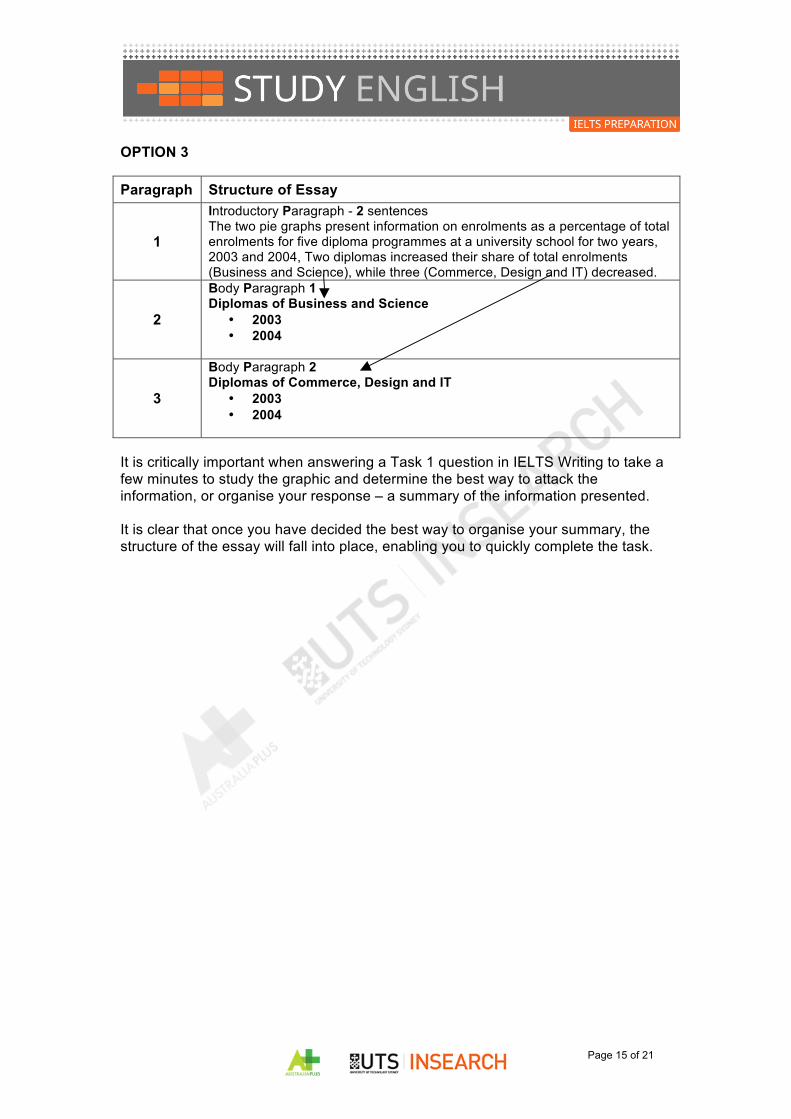
OPTION 3 Paragraph Structure of Essay
1
Introductory Paragraph - 2 sentences The two pie graphs present information on enrolments as a percentage of total enrolments for five diploma programmes at a university school for two years, 2003 and 2004, Two diplomas increased their share of total enrolments (Business and Science), while three (Commerce, Design and IT) decreased.
2
Body Paragraph 1 Diplomas of Business and Science
• 2003 • 2004
3
Body Paragraph 2 Diplomas of Commerce, Design and IT
• 2003 • 2004
It is critically important when answering a Task 1 question in IELTS Writing to take a few minutes to study the graphic and determine the best way to attack the information, or organise your response – a summary of the information presented. It is clear that once you have decided the best way to organise your summary, the structure of the essay will fall into place, enabling you to quickly complete the task.
Page 16 of 21
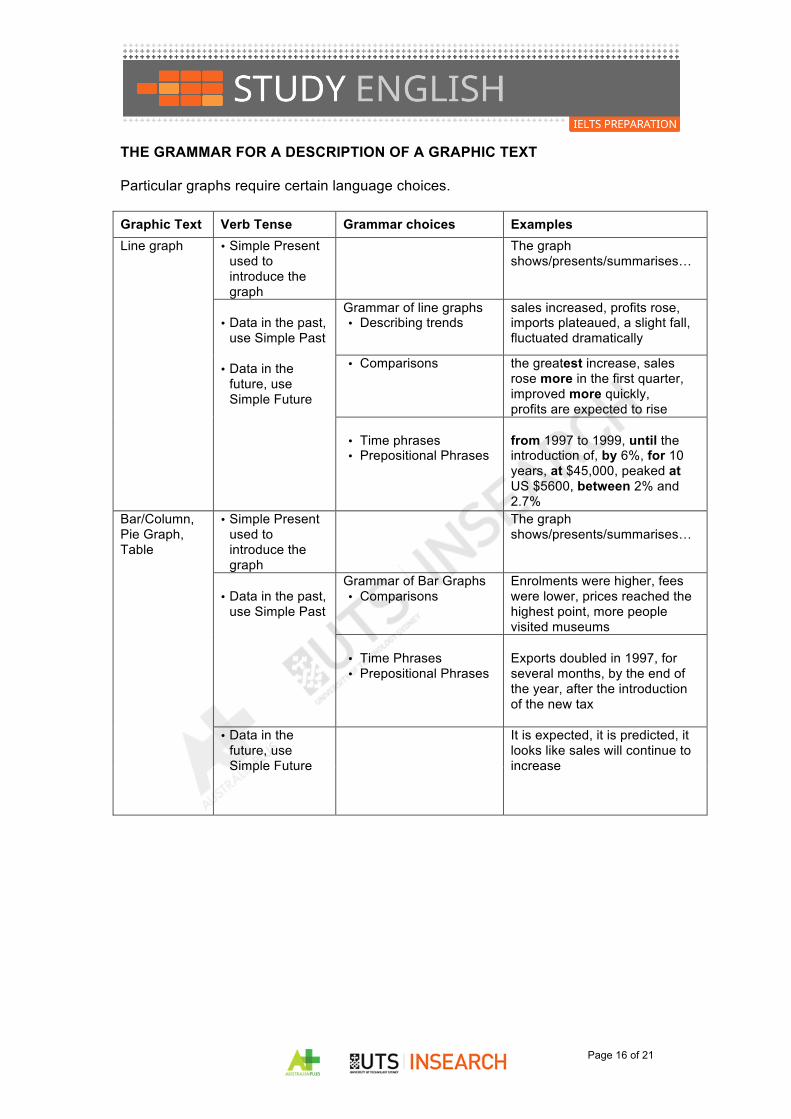
THE GRAMMAR FOR A DESCRIPTION OF A GRAPHIC TEXT Particular graphs require certain language choices. Graphic Text Verb Tense Grammar choices Examples Line graph • Simple Present
used to introduce the graph
The graph shows/presents/summarises…
• Data in the past, use Simple Past • Data in the future, use Simple Future
Grammar of line graphs • Describing trends
sales increased, profits rose, imports plateaued, a slight fall, fluctuated dramatically
• Comparisons the greatest increase, sales rose more in the first quarter, improved more quickly, profits are expected to rise
• Time phrases • Prepositional Phrases
from 1997 to 1999, until the introduction of, by 6%, for 10 years, at $45,000, peaked at US $5600, between 2% and 2.7%
Bar/Column, Pie Graph, Table
• Simple Present used to introduce the graph
The graph shows/presents/summarises…
• Data in the past, use Simple Past
Grammar of Bar Graphs • Comparisons
Enrolments were higher, fees were lower, prices reached the highest point, more people visited museums
• Time Phrases • Prepositional Phrases
Exports doubled in 1997, for several months, by the end of the year, after the introduction of the new tax
• Data in the future, use Simple Future
It is expected, it is predicted, it looks like sales will continue to increase
Page 17 of 21
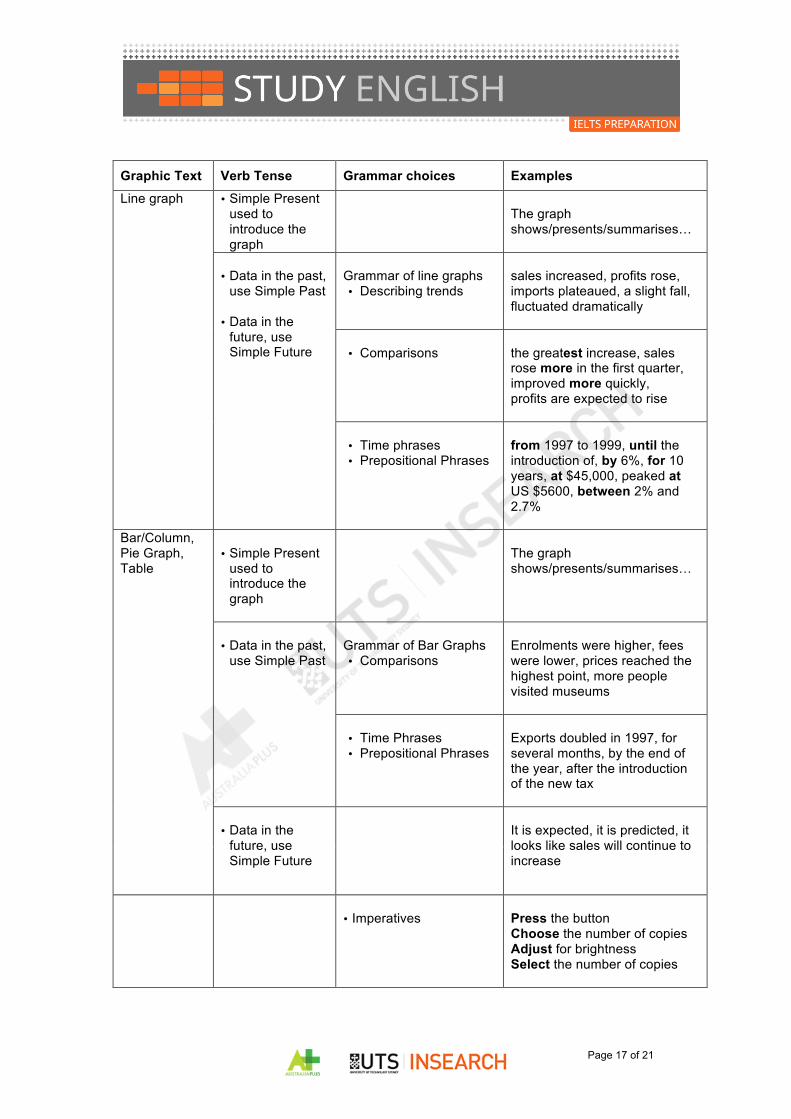
Graphic Text Verb Tense Grammar choices Examples Line graph • Simple Present
used to introduce the graph
The graph shows/presents/summarises…
• Data in the past, use Simple Past • Data in the future, use Simple Future
Grammar of line graphs • Describing trends
sales increased, profits rose, imports plateaued, a slight fall, fluctuated dramatically
• Comparisons
the greatest increase, sales rose more in the first quarter, improved more quickly, profits are expected to rise
• Time phrases • Prepositional Phrases
from 1997 to 1999, until the introduction of, by 6%, for 10 years, at $45,000, peaked at US $5600, between 2% and 2.7%
Bar/Column, Pie Graph, Table
• Simple Present used to introduce the graph
The graph shows/presents/summarises…
• Data in the past, use Simple Past
Grammar of Bar Graphs • Comparisons
Enrolments were higher, fees were lower, prices reached the highest point, more people visited museums
• Time Phrases • Prepositional Phrases
Exports doubled in 1997, for several months, by the end of the year, after the introduction of the new tax
• Data in the future, use Simple Future
It is expected, it is predicted, it looks like sales will continue to increase
• Imperatives
Press the button Choose the number of copies Adjust for brightness Select the number of copies
Page 18 of 21
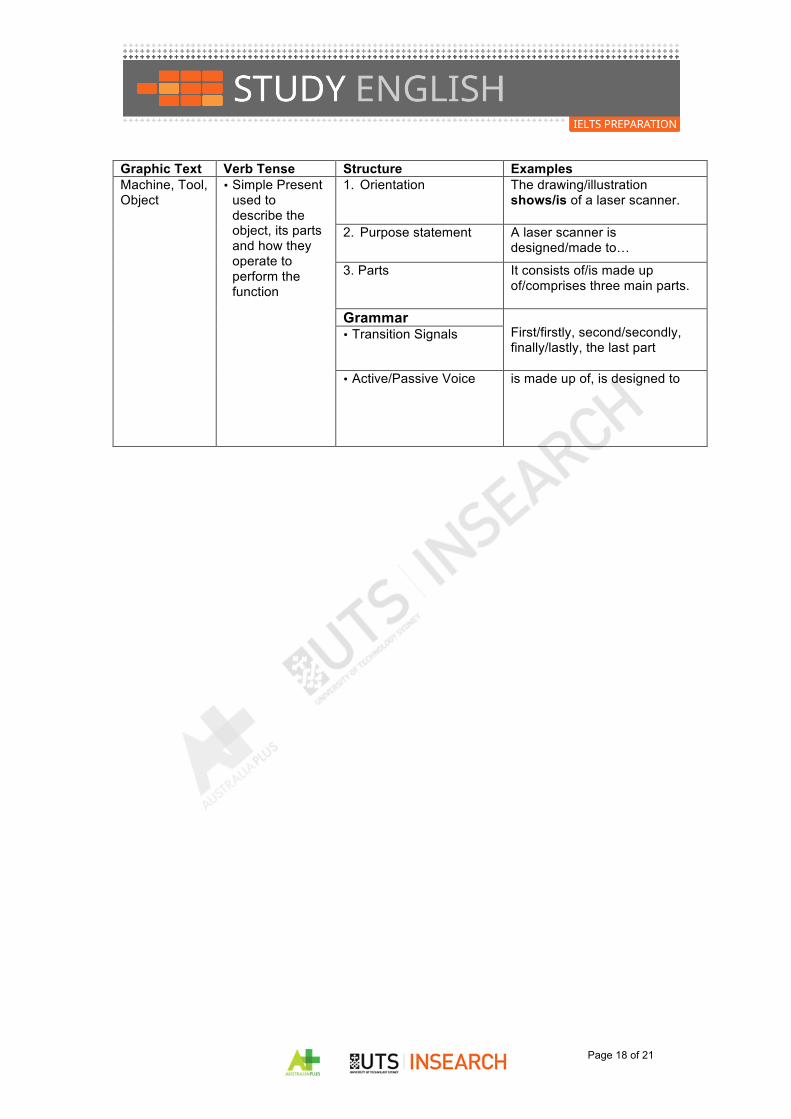
Graphic Text Verb Tense Structure Examples Machine, Tool, Object
• Simple Present used to describe the object, its parts and how they operate to perform the function
1. Orientation
The drawing/illustration shows/is of a laser scanner.
2. Purpose statement
A laser scanner is designed/made to…
3. Parts It consists of/is made up of/comprises three main parts.
Grammar First/firstly, second/secondly, finally/lastly, the last part
• Transition Signals
• Active/Passive Voice is made up of, is designed to
Page 19 of 21
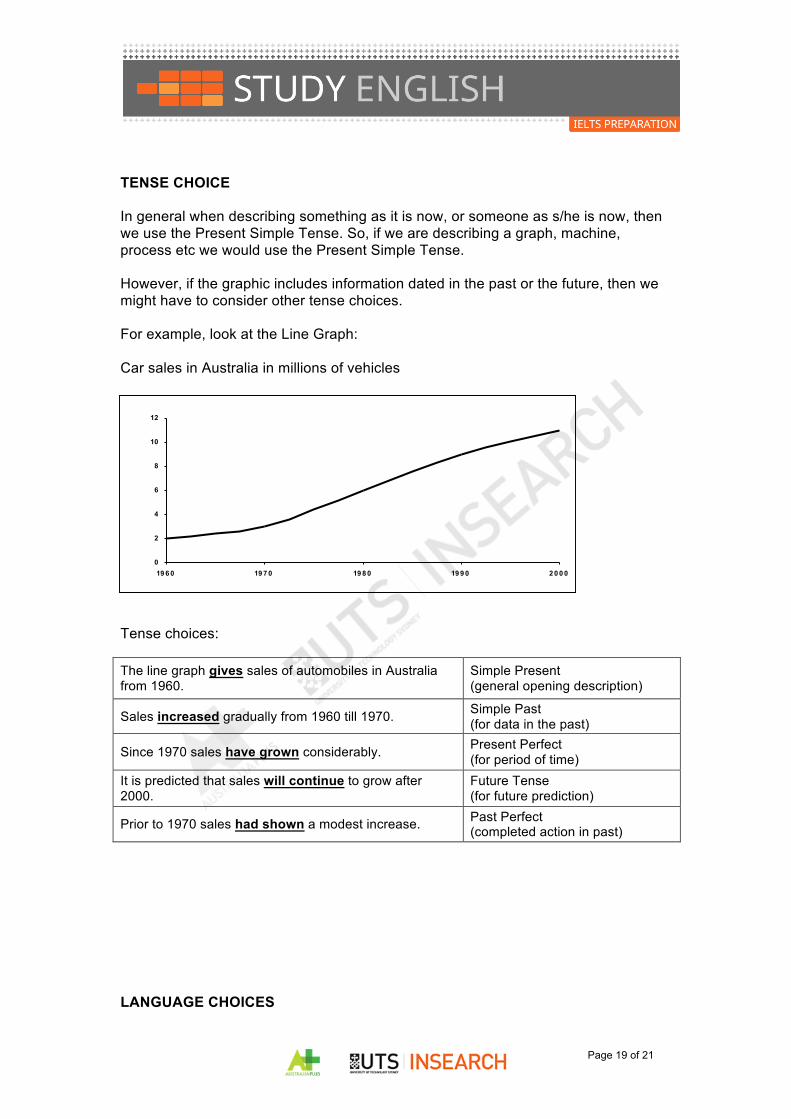
TENSE CHOICE In general when describing something as it is now, or someone as s/he is now, then we use the Present Simple Tense. So, if we are describing a graph, machine, process etc we would use the Present Simple Tense. However, if the graphic includes information dated in the past or the future, then we might have to consider other tense choices. For example, look at the Line Graph: Car sales in Australia in millions of vehicles
Tense choices: The line graph gives sales of automobiles in Australia from 1960.
Simple Present (general opening description)
Sales increased gradually from 1960 till 1970. Simple Past (for data in the past)
Since 1970 sales have grown considerably. Present Perfect (for period of time)
It is predicted that sales will continue to grow after 2000.
Future Tense (for future prediction)
Prior to 1970 sales had shown a modest increase. Past Perfect (completed action in past)
LANGUAGE CHOICES
0
2
4
6
8
10
12
1960 1970 1980 1990 2000
Page 20 of 21
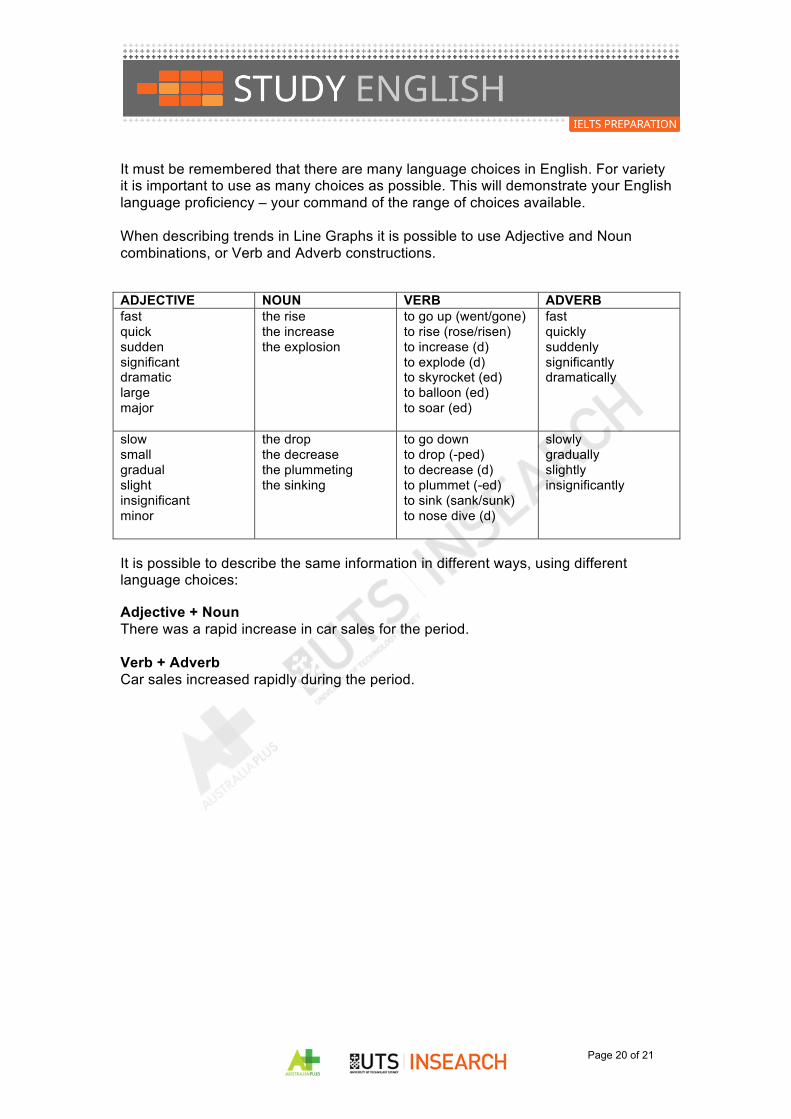
It must be remembered that there are many language choices in English. For variety it is important to use as many choices as possible. This will demonstrate your English language proficiency – your command of the range of choices available. When describing trends in Line Graphs it is possible to use Adjective and Noun combinations, or Verb and Adverb constructions. ADJECTIVE NOUN VERB ADVERB fast quick sudden significant dramatic large major
the rise the increase the explosion
to go up (went/gone) to rise (rose/risen) to increase (d) to explode (d) to skyrocket (ed) to balloon (ed) to soar (ed)
fast quickly suddenly significantly dramatically
slow small gradual slight insignificant minor
the drop the decrease the plummeting the sinking
to go down to drop (-ped) to decrease (d) to plummet (-ed) to sink (sank/sunk) to nose dive (d)
slowly gradually slightly insignificantly
It is possible to describe the same information in different ways, using different language choices: Adjective + Noun There was a rapid increase in car sales for the period. Verb + Adverb Car sales increased rapidly during the period.
Page 21 of 21
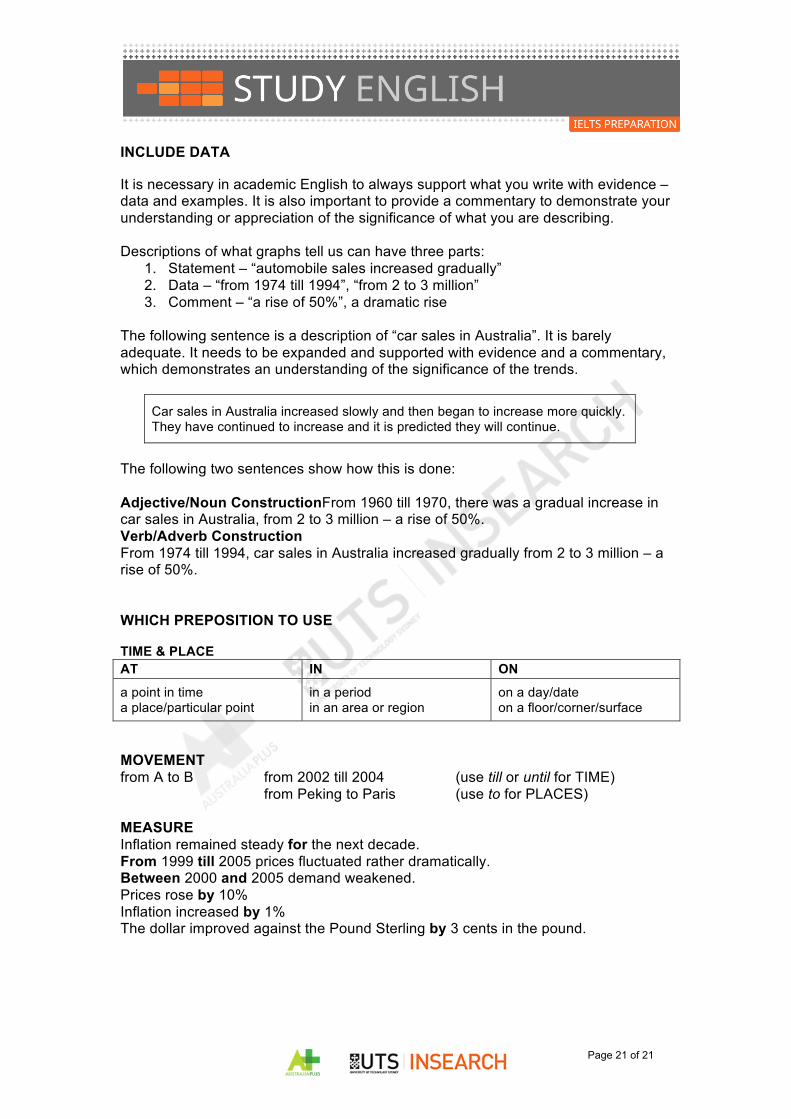
INCLUDE DATA It is necessary in academic English to always support what you write with evidence – data and examples. It is also important to provide a commentary to demonstrate your understanding or appreciation of the significance of what you are describing. Descriptions of what graphs tell us can have three parts:
1. Statement – “automobile sales increased gradually” 2. Data – “from 1974 till 1994”, “from 2 to 3 million” 3. Comment – “a rise of 50%”, a dramatic rise
The following sentence is a description of “car sales in Australia”. It is barely adequate. It needs to be expanded and supported with evidence and a commentary, which demonstrates an understanding of the significance of the trends.
Car sales in Australia increased slowly and then began to increase more quickly. They have continued to increase and it is predicted they will continue.
The following two sentences show how this is done: Adjective/Noun ConstructionFrom 1960 till 1970, there was a gradual increase in car sales in Australia, from 2 to 3 million – a rise of 50%. Verb/Adverb Construction From 1974 till 1994, car sales in Australia increased gradually from 2 to 3 million – a rise of 50%. WHICH PREPOSITION TO USE TIME & PLACE AT IN ON a point in time a place/particular point
in a period in an area or region
on a day/date on a floor/corner/surface
MOVEMENT from A to B from 2002 till 2004 (use till or until for TIME) from Peking to Paris (use to for PLACES) MEASURE Inflation remained steady for the next decade. From 1999 till 2005 prices fluctuated rather dramatically. Between 2000 and 2005 demand weakened. Prices rose by 10% Inflation increased by 1% The dollar improved against the Pound Sterling by 3 cents in the pound.
Page 22 of 21
What is the examiner looking for? For information on the criteria used by IELTS examiners when marking an essay for Task 1, go to www.ielts.org There are four criteria, which IELTS examiners refer to:
1. Task Response 2. Coherence and Cohesion 3. Lexical Resource 4. Grammatical Range and Accuracy
What do these criteria mean? 1. Task Response This criteria is a measure of your ability to construct a summary which:
1. presents, highlights and illustrates key aspects of the graphic text in the test question, using a minimum of 150 words, in the time allowed (20 minutes is recommended). The content must be relevant and accurate.
2. is organised in a particular way with:
i. an opening paragraph or orientation to the essay ii. clear paragraphs addressing main trends, differences or stages
3. adopts an appropriate tone. Level of formality is achieved in the use of:
i. objective statements ii. more formal vocabulary, less use of slang and phrasal verbs
punctuation
2. Coherence and Cohesion It is important that your essay is easy to follow – that it is logically organised, from sentence to sentence, and from the beginning to the end, from the opening paragraph, to the closing. Information and ideas should be sequenced logically through the essay so that it is easy for the examiner to follow. Coherence means logical organisation of information and ideas across the whole essay and is achieved through:
i. clear use of paragraphs, from the opening to the closing paragraphs. Each paragraph should open with a clear topic sentence and have a series of supporting and developing sentences.
ii. transition signals and conjunctions, time words and phrases, and discourse markers.
Page 23 of 21
Cohesion means the organisation of language at the sentence level, inside and between sentences. This is achieved through:
i. correct word order ii. agreement of subject and verb (in number and case);; noun and
pronoun agreement (number, case and gender) iii. correct use of articles (a/an and the) iv. choice and sequence of tenses, and v. correct use of conjunctions.
3. Lexical Resource Here the examiner looks at your vocabulary and your ability to communicate meaning precisely and accurately. Do you have the vocabulary to carry out the requirements of the task? Lexical resource means:
i. extensive vocabulary to enable you to easily write an essay in response to the instructions in the task question. These questions will be on a broad range of topics.
ii. command of word forms. There should be a degree of flexibility in your use of language, so that you can move smoothly from adjective/noun constructions to verb/adverb constructions. You should have a command of word forms (economical/economy/economise/ economically etc)
iii. ability to paraphrase iv. an understanding of usage (collocation – “high building” or “tall
building”;; “beautiful man” or “handsome man”;; “white and black” or “black and white”?)
v. spelling 4. Grammatical Range and Accuracy This criteria includes:
i. range of sentence types – simple, compound and complex sentences. Complex sentences contain a dependent clause introduced by a subordinating conjunction, relative pronoun or participle.
ii. range of structures – active/passive voice;; cause/effect language;; reported speech and projections;; conditionals
iii. level of error iv. punctuation