Embed Size (px)
Citation preview
SEB Nordic SeminarThreats and opportunities related to digitization
Powering Digital Payments
CFO Klaus Pedersen, 9 January 2017
Disclaimer
This presentation contains forward-looking statements. Forward-looking statements are statements (other than statements of historical fact) relating to future events and Nets’ anticipated or planned financial and operational performance. The words ‘may’, ‘will’, ‘will continue’, ‘should’, ‘expect’, ‘foresee’, ‘anticipate’, ‘believe’, ‘estimate’, ‘plan’, ‘predict’, ‘intend’ or variations of these words, including negatives thereof, as well as other statements regarding matters that are not historical fact or regarding future events or prospects, constitute forward-looking statements. Nets has based these forward-looking statements on its current viewswith respect to future events and financial performance. These views involve a number of risks and uncertainties, which couldcause actual results to differ materially from those predicted in the forward-looking statements and from the past performance of Nets. Although Nets believes that the estimates and projections reflected in the forward-looking statements are reasonable, theymay prove materially incorrect, and actual results may materially differ, e.g. as the result of risks related to the industry in general or Nets in particular, including those described in Nets Holding’s Annual Report 2015, Offering Circular of 13 September 2016and other information made available by Nets.
Factors that may affect future results include, but are not limited to, global and economic conditions, including currency exchange rate and interest rate fluctuations, delay or failure of projects related to research and/or development, unexpected contractbreaches or terminations, unplanned loss of patents, government-mandated or market-driven price decreases for Nets’ products, introduction of competing products, reliance on information technology, Nets’ ability to successfully market current and new products, exposure to product liability, litigation and investigations, regulatory developments, actual or perceived failure to adhere to ethical marketing practices, unexpected growth in costs and expenses, failure to recruit and retain the right employees, and failure to maintain a culture of compliance.
As a result, forward-looking statements should not be relied on as a prediction of actual results. Nets undertakes no obligation to update or revise any forward-looking statements, whether as a result of new information, future events or otherwise, except to the extent required by law.
The Annual Report 2015 of Nets Holding A/S and the Offering Circular are available at www.nets.eu
Forward looking statements
2
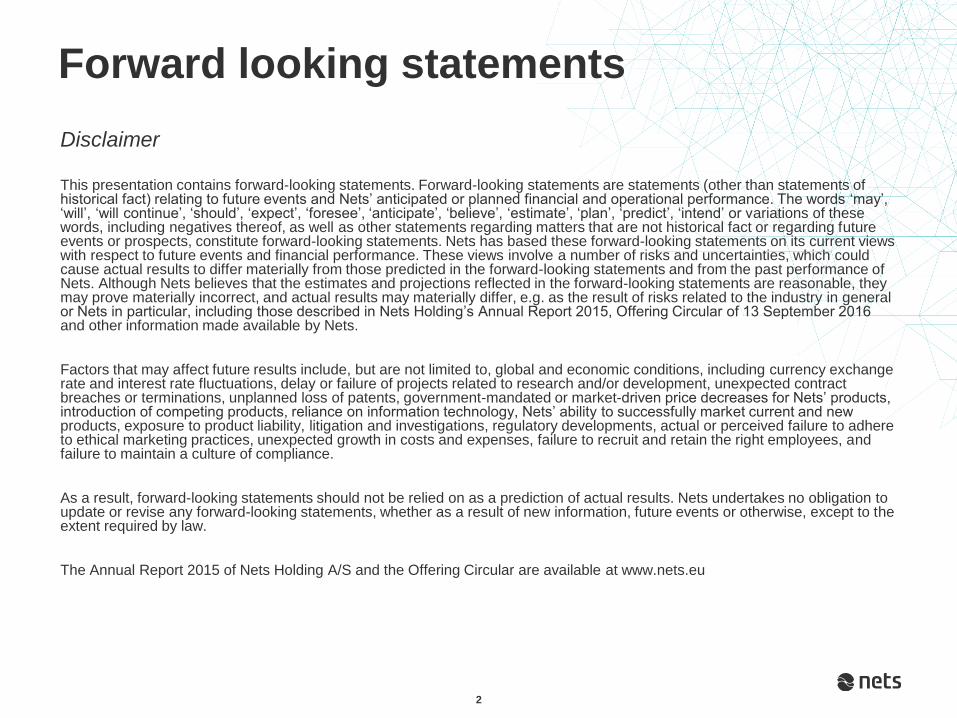
Nets is at the Centre of Daily Life
in the Nordics…
Powering Digital Payments
of Danish households use Nets’ e-Bill
payments to pay utility bills in Denmark>90%
of Danish merchant payments authorised
& processed by Nets98%
of Norwegians access online/mobile banking
through the e-ID platform operated by Nets80%
of Norwegian e-merchant payments
authorised & processed by Nets>60%
Source Management estimates as of and for the year ended 31 December 20153
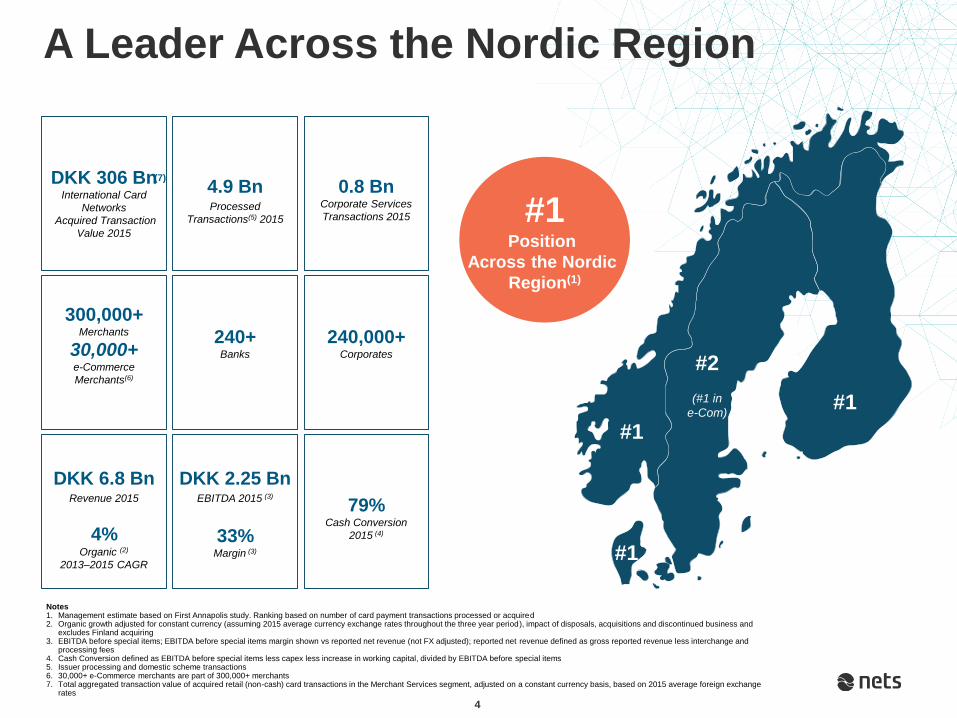
A Leader Across the Nordic Region
#1Position
Across the Nordic
Region(1)
DKK 306 BnInternational Card
Networks
Acquired Transaction
Value 2015
4.9 Bn Processed
Transactions(5) 2015
0.8 BnCorporate Services
Transactions 2015
DKK 6.8 BnRevenue 2015
4%Organic (2)
2013–2015 CAGR
79%Cash Conversion
2015 (4)
DKK 2.25 BnEBITDA 2015 (3)
33%Margin (3)
300,000+Merchants
30,000+e-Commerce
Merchants(6)
240+Banks
240,000+Corporates
Notes1. Management estimate based on First Annapolis study. Ranking based on number of card payment transactions processed or acquired2. Organic growth adjusted for constant currency (assuming 2015 average currency exchange rates throughout the three year period), impact of disposals, acquisitions and discontinued business and
excludes Finland acquiring3. EBITDA before special items; EBITDA before special items margin shown vs reported net revenue (not FX adjusted); reported net revenue defined as gross reported revenue less interchange and
processing fees4. Cash Conversion defined as EBITDA before special items less capex less increase in working capital, divided by EBITDA before special items5. Issuer processing and domestic scheme transactions6. 30,000+ e-Commerce merchants are part of 300,000+ merchants7. Total aggregated transaction value of acquired retail (non-cash) card transactions in the Merchant Services segment, adjusted on a constant currency basis, based on 2015 average foreign exchange
rates
#1
#1
#1
#2
(#1 in
e-Com)
(7)
4
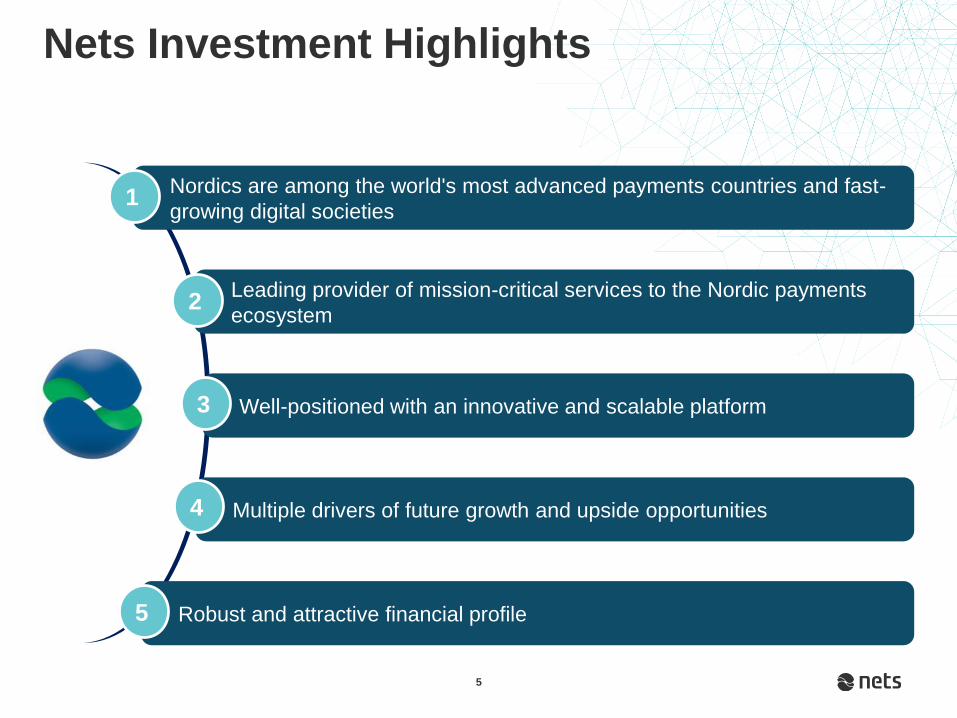
Nets Investment Highlights
Nordics are among the world's most advanced payments countries and fast-
growing digital societies1
Leading provider of mission-critical services to the Nordic payments
ecosystem2
Well-positioned with an innovative and scalable platform3
Multiple drivers of future growth and upside opportunities4
Robust and attractive financial profile5
5
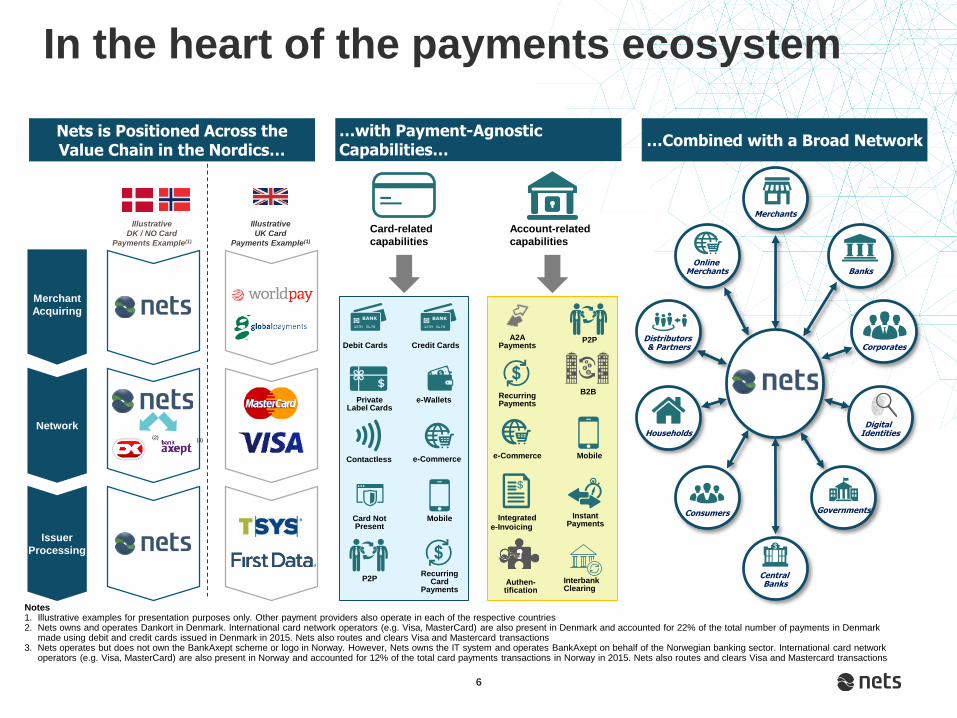
In the heart of the payments ecosystem
…Combined with a Broad Network Nets is Positioned Across the Value Chain in the Nordics…
Merchant
Acquiring
Network
Issuer
Processing
Illustrative
UK Card
Payments Example(1)
Illustrative
DK / NO Card
Payments Example(1)
Merchants
Online Merchants Banks
Consumers Governments
Central Banks
HouseholdsDigital
Identities
CorporatesDistributors & Partners
(3)(2)
Notes1. Illustrative examples for presentation purposes only. Other payment providers also operate in each of the respective countries 2. Nets owns and operates Dankort in Denmark. International card network operators (e.g. Visa, MasterCard) are also present in Denmark and accounted for 22% of the total number of payments in Denmark
made using debit and credit cards issued in Denmark in 2015. Nets also routes and clears Visa and Mastercard transactions3. Nets operates but does not own the BankAxept scheme or logo in Norway. However, Nets owns the IT system and operates BankAxept on behalf of the Norwegian banking sector. International card network
operators (e.g. Visa, MasterCard) are also present in Norway and accounted for 12% of the total card payments transactions in Norway in 2015. Nets also routes and clears Visa and Mastercard transactions
Card-related
capabilities
Mobile
Credit Cards
Recurring Card
Payments
e-Wallets
e-Commerce
Card Not Present
Debit Cards
P2P
Private Label Cards
Contactless
Account-related
capabilities
Mobile
P2P
Interbank Clearing
B2B
e-Commerce
Recurring Payments
Integratede-Invoicing
$
Instant Payments
Authen-tification
…with Payment-Agnostic Capabilities…
A2A Payments
6

Scale Across the Nordic Region
Source The Nilson Report 2015, Company data
4.2
2.0
0.4 0.2
0.0
1.5
3.0
4.5
Acquired Nordic Transactions 2014 (Bn) (2)
Scale Achieved – Acquiring Example
(3)
Significant Scale Advantages (illustrative) (4)
Country Position
#1
#1
#2
#1
(#1 in e-Com)
Local Position(1)
Denmark
Norway
Sweden
Finland
Source Company estimates
Cost Per-Transaction
Number of Transactions
c.50%
Volumes x 4
Merchant Acquiring Curve
Notes1. All rankings are based on number of card payment transactions processed or acquired2. Captive (in-house) volumes highlighted in grey3. Nets volumes include processed Dankort and BankAxept transactions of 2.5 Bn and acquired international transactions of 1.7 Bn4. c.50% lower cost as a result of movement from c.0.5 Bn to 2 Bn acquiring transactions
Babs
Source First Annapolis
7
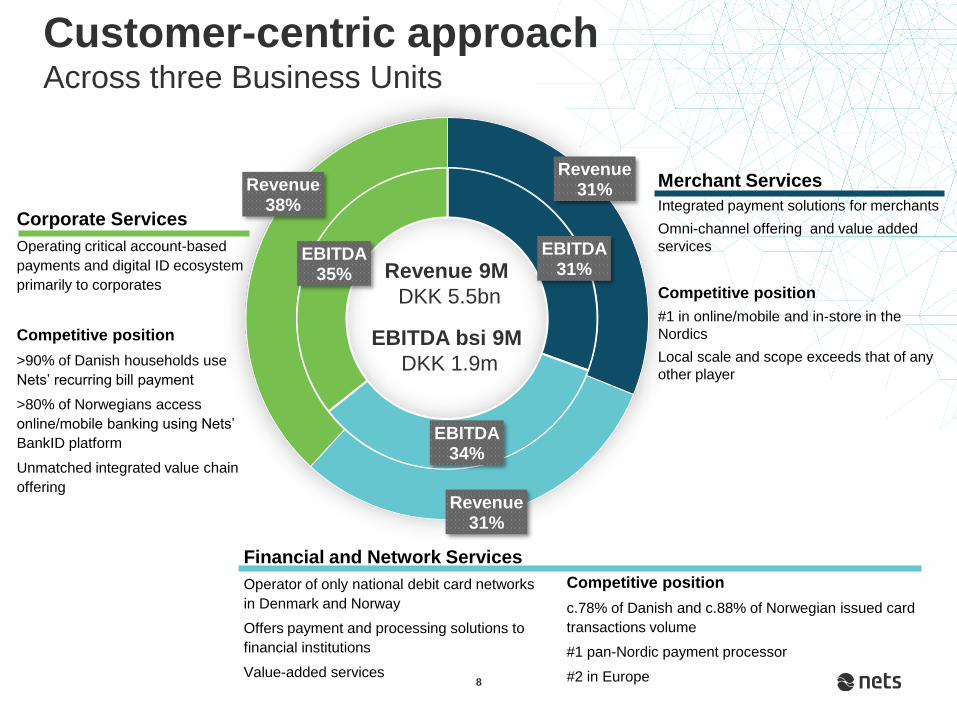
Customer-centric approachAcross three Business Units
8
EBITDA31%
EBITDA34%
EBITDA35%
Revenue31%
Revenue31%
Revenue38%
Merchant Services
Integrated payment solutions for merchants
Omni-channel offering and value added
services
Competitive position
#1 in online/mobile and in-store in the
Nordics
Local scale and scope exceeds that of any
other player
Revenue 9M
DKK 5.5bn
EBITDA bsi 9M
DKK 1.9m
Competitive position
c.78% of Danish and c.88% of Norwegian issued card
transactions volume
#1 pan-Nordic payment processor
#2 in Europe
Corporate Services
Operating critical account-based
payments and digital ID ecosystem
primarily to corporates
Competitive position
>90% of Danish households use
Nets’ recurring bill payment
>80% of Norwegians access
online/mobile banking using Nets’
BankID platform
Unmatched integrated value chain
offering
Financial and Network Services
Operator of only national debit card networks
in Denmark and Norway
Offers payment and processing solutions to
financial institutions
Value-added services
14%
28%
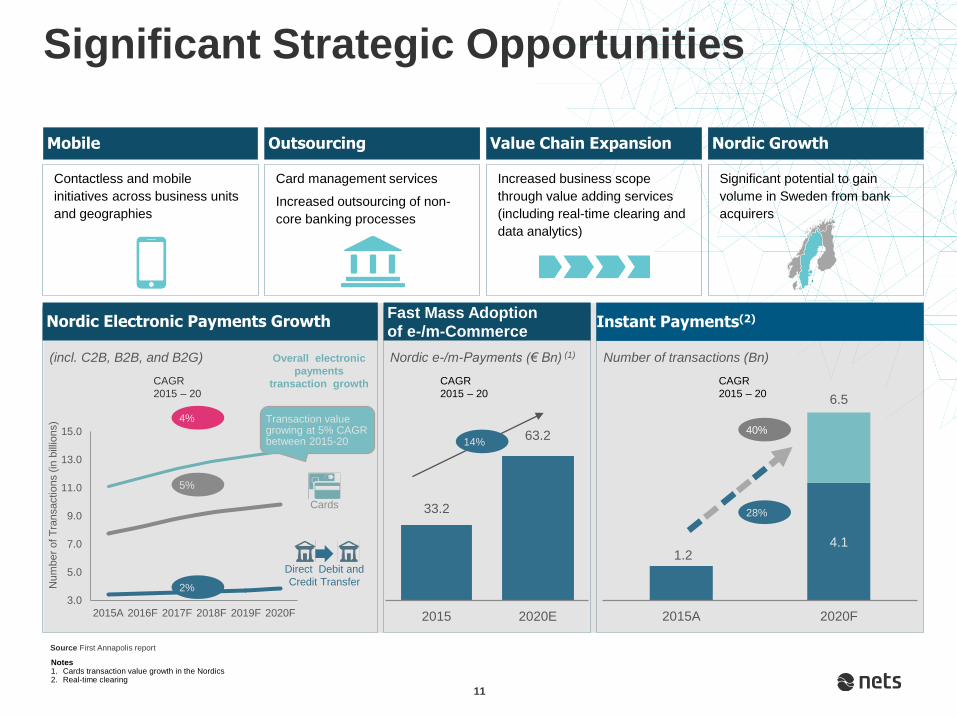
Significant potential to gain
volume in Sweden from bank
acquirers
3.0
5.0
7.0
9.0
11.0
13.0
15.0
2015A 2016F 2017F 2018F 2019F 2020F
Num
ber
of T
ransactio
ns (
in b
illio
ns)
Notes1. Cards transaction value growth in the Nordics2. Real-time clearing
Mobile
Source First Annapolis report
Significant Strategic Opportunities
Outsourcing Value Chain Expansion Nordic Growth
Contactless and mobile
initiatives across business units
and geographies
Card management services
Increased outsourcing of non-
core banking processes
Increased business scope
through value adding services
(including real-time clearing and
data analytics)
4.11.2
6.5
2015A 2020F
Number of transactions (Bn)(incl. C2B, B2B, and B2G)
CAGR
2015 – 20
2%
4%
5%
Overall electronic
payments
transaction growth
Cards
Direct Debit and
Credit Transfer
Transaction value growing at 5% CAGR between 2015-20
33.2
63.2
2015 2020E
Nordic e-/m-Payments (€ Bn) (1)
Nordic Electronic Payments Growth Instant Payments(2)
CAGR
2015 – 20
CAGR
2015 – 20
40%
Fast Mass Adoption of e-/m-Commerce
11
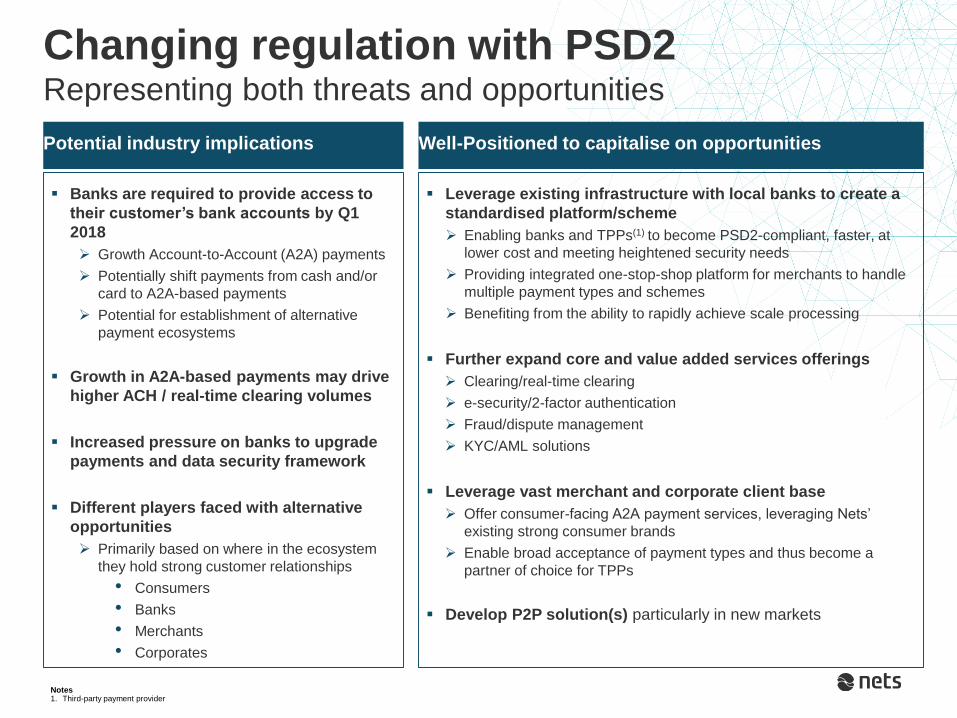
Notes1. Third-party payment provider
Well-Positioned to capitalise on opportunities Potential industry implications
Banks are required to provide access to
their customer’s bank accounts by Q1
2018
Growth Account-to-Account (A2A) payments
Potentially shift payments from cash and/or
card to A2A-based payments
Potential for establishment of alternative
payment ecosystems
Growth in A2A-based payments may drive
higher ACH / real-time clearing volumes
Increased pressure on banks to upgrade
payments and data security framework
Different players faced with alternative
opportunities
Primarily based on where in the ecosystem
they hold strong customer relationships
• Consumers
• Banks
• Merchants
• Corporates
Leverage existing infrastructure with local banks to create a
standardised platform/scheme
Enabling banks and TPPs(1) to become PSD2-compliant, faster, at
lower cost and meeting heightened security needs
Providing integrated one-stop-shop platform for merchants to handle
multiple payment types and schemes
Benefiting from the ability to rapidly achieve scale processing
Further expand core and value added services offerings
Clearing/real-time clearing
e-security/2-factor authentication
Fraud/dispute management
KYC/AML solutions
Leverage vast merchant and corporate client base
Offer consumer-facing A2A payment services, leveraging Nets’
existing strong consumer brands
Enable broad acceptance of payment types and thus become a
partner of choice for TPPs
Develop P2P solution(s) particularly in new markets
Changing regulation with PSD2Representing both threats and opportunities

Mobile Dankort launching in Q1 2017
•Mobile Dankort is a result of a close
cooperation between Dankort merchants,
banks and Nets
•Strong support from terminal vendors
•Several large retailers recently signed on
the platform to accept mobile payments
•Simple payment experience and strong
merchant support
•Acceptance by NFC, QR and Bluetooth
Mobile Dankort offers low cost and scale to merchants and is user friendly and secure
Contactless Dankort is important to establish the user experience in mobile Dankort
2016 2017
11
0.0% 0.0% 0.1% 0.3%0.6%
0.9%1.5%
2.2%
3.1%
4.0%
4.9%
6.2%
7.1%
8.8%
10.7%
12.2%
14.0%
1 11 119312 558 869 1,210 1,848
2,8023,767
4,8116,030 6,681
8,2469,846
11,392
13,318
Dankort CL trans Share of trans. in chip term.
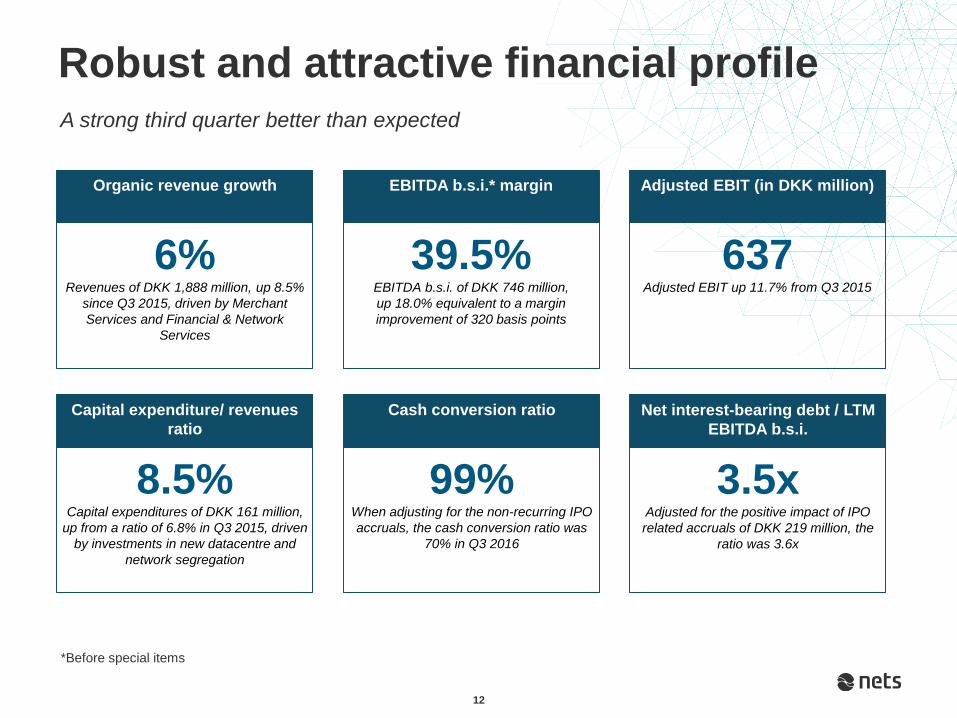
A strong third quarter better than expected
Robust and attractive financial profile
6%Revenues of DKK 1,888 million, up 8.5%
since Q3 2015, driven by Merchant
Services and Financial & Network
Services
Organic revenue growth
39.5%EBITDA b.s.i. of DKK 746 million,
up 18.0% equivalent to a margin
improvement of 320 basis points
EBITDA b.s.i.* margin
8.5%Capital expenditures of DKK 161 million,
up from a ratio of 6.8% in Q3 2015, driven
by investments in new datacentre and
network segregation
Capital expenditure/ revenues
ratio
637 Adjusted EBIT up 11.7% from Q3 2015
Adjusted EBIT (in DKK million)
3.5xAdjusted for the positive impact of IPO
related accruals of DKK 219 million, the
ratio was 3.6x
Net interest-bearing debt / LTM
EBITDA b.s.i.
99%When adjusting for the non-recurring IPO
accruals, the cash conversion ratio was
70% in Q3 2016
Cash conversion ratio
12
*Before special items
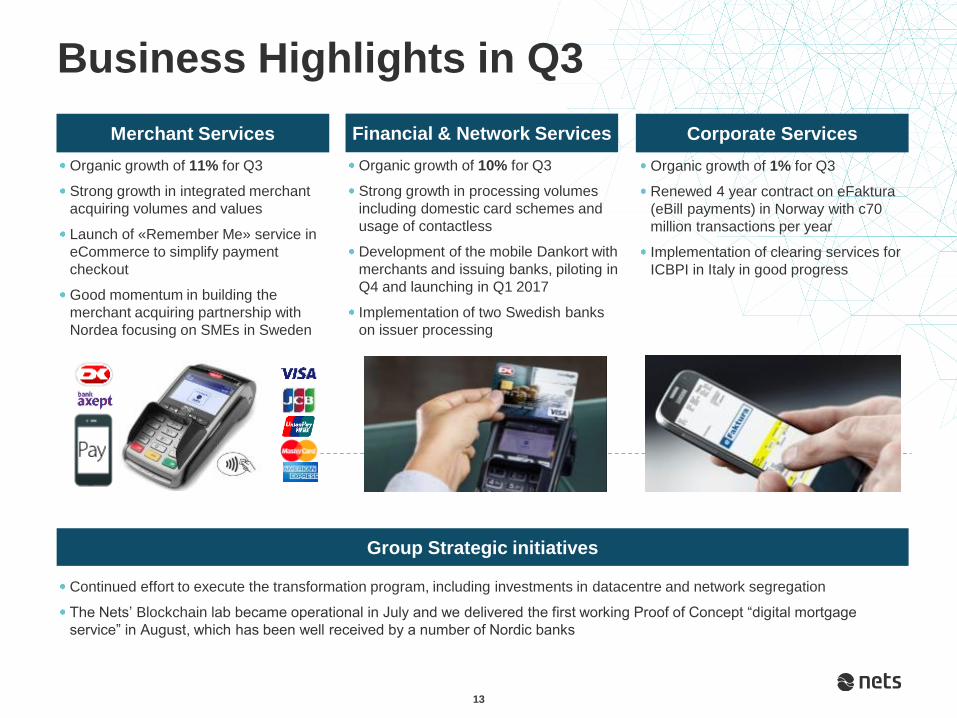
Merchant Services
Business Highlights in Q3
Organic growth of 11% for Q3
Strong growth in integrated merchant
acquiring volumes and values
Launch of «Remember Me» service in
eCommerce to simplify payment
checkout
Good momentum in building the
merchant acquiring partnership with
Nordea focusing on SMEs in Sweden
Group Strategic initiatives
Organic growth of 10% for Q3
Strong growth in processing volumes
including domestic card schemes and
usage of contactless
Development of the mobile Dankort with
merchants and issuing banks, piloting in
Q4 and launching in Q1 2017
Implementation of two Swedish banks
on issuer processing
Continued effort to execute the transformation program, including investments in datacentre and network segregation
The Nets’ Blockchain lab became operational in July and we delivered the first working Proof of Concept “digital mortgage
service” in August, which has been well received by a number of Nordic banks
Organic growth of 1% for Q3
Renewed 4 year contract on eFaktura
(eBill payments) in Norway with c70
million transactions per year
Implementation of clearing services for
ICBPI in Italy in good progress
Financial & Network Services Corporate Services
13
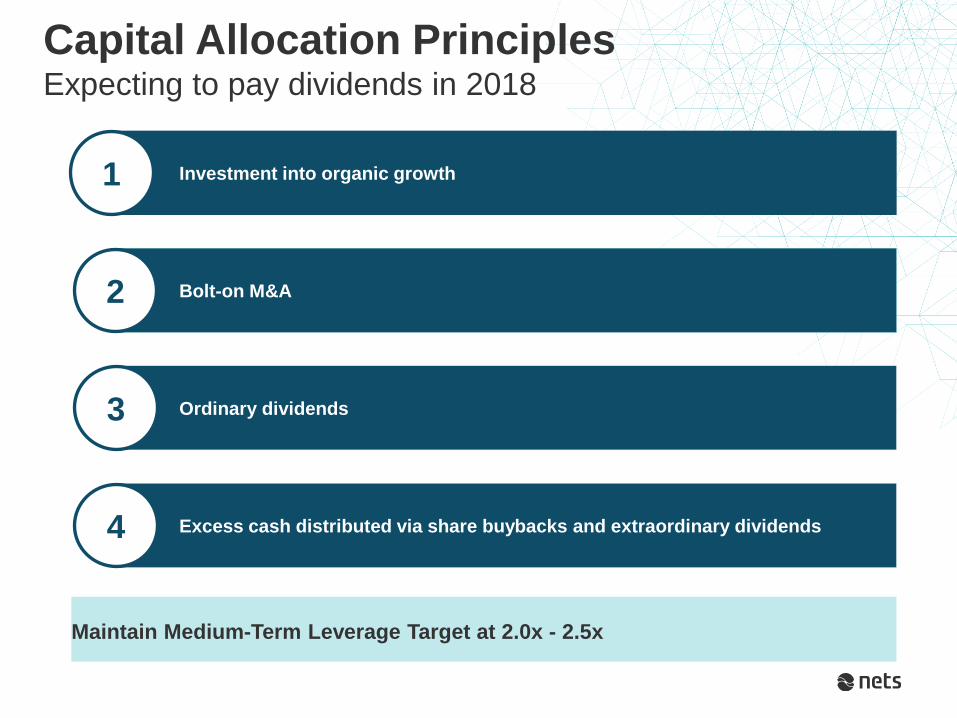
Capital Allocation PrinciplesExpecting to pay dividends in 2018
Investment into organic growth1
Ordinary dividends3
Excess cash distributed via share buybacks and extraordinary dividends4
Bolt-on M&A2
Maintain Medium-Term Leverage Target at 2.0x - 2.5x
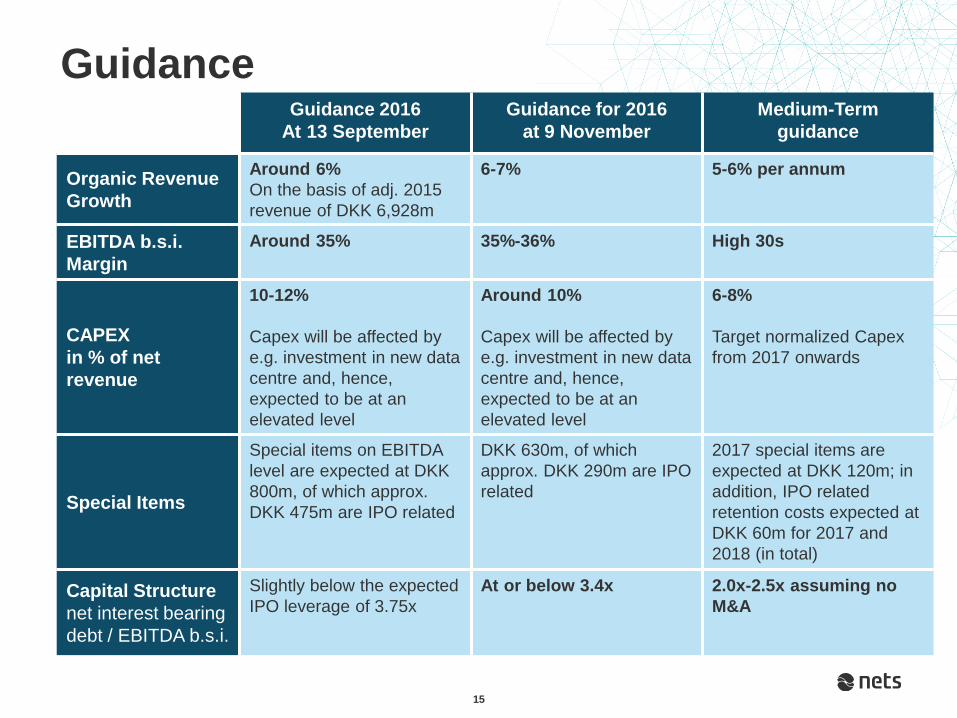
Guidance
15
Guidance 2016
At 13 September
Guidance for 2016
at 9 November
Medium-Term
guidance
Organic Revenue
Growth
Around 6%
On the basis of adj. 2015
revenue of DKK 6,928m
6-7% 5-6% per annum
EBITDA b.s.i.
Margin
Around 35% 35%-36% High 30s
CAPEX
in % of net
revenue
10-12%
Capex will be affected by
e.g. investment in new data
centre and, hence,
expected to be at an
elevated level
Around 10%
Capex will be affected by
e.g. investment in new data
centre and, hence,
expected to be at an
elevated level
6-8%
Target normalized Capex
from 2017 onwards
Special Items
Special items on EBITDA
level are expected at DKK
800m, of which approx.
DKK 475m are IPO related
DKK 630m, of which
approx. DKK 290m are IPO
related
2017 special items are
expected at DKK 120m; in
addition, IPO related
retention costs expected at
DKK 60m for 2017 and
2018 (in total)
Capital Structure
net interest bearing
debt / EBITDA b.s.i.
Slightly below the expected
IPO leverage of 3.75x
At or below 3.4x 2.0x-2.5x assuming no
M&A
Back-up
16
17
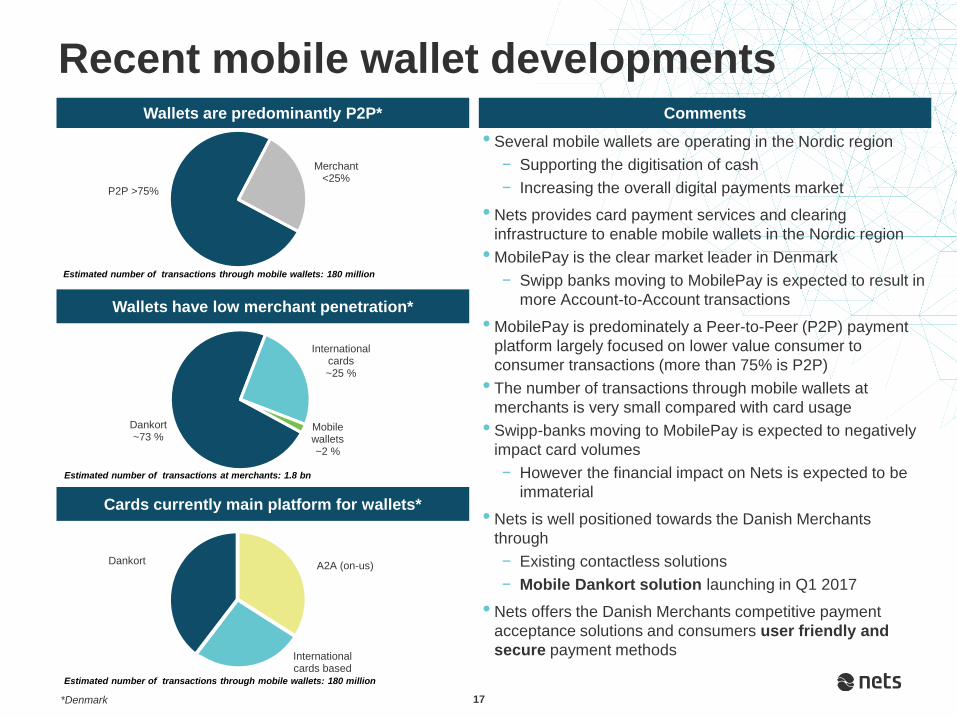
Recent mobile wallet developmentsComments
Dankort~73 %
International cards~25 %
Mobile wallets~2 %
P2P >75%
Merchant <25%
A2A (on-us) Dankort
International cards based
• Several mobile wallets are operating in the Nordic region
− Supporting the digitisation of cash
− Increasing the overall digital payments market
• Nets provides card payment services and clearing
infrastructure to enable mobile wallets in the Nordic region
• MobilePay is the clear market leader in Denmark
− Swipp banks moving to MobilePay is expected to result in
more Account-to-Account transactions
• MobilePay is predominately a Peer-to-Peer (P2P) payment
platform largely focused on lower value consumer to
consumer transactions (more than 75% is P2P)
• The number of transactions through mobile wallets at
merchants is very small compared with card usage
• Swipp-banks moving to MobilePay is expected to negatively
impact card volumes
− However the financial impact on Nets is expected to be
immaterial
• Nets is well positioned towards the Danish Merchants
through
− Existing contactless solutions
− Mobile Dankort solution launching in Q1 2017
• Nets offers the Danish Merchants competitive payment
acceptance solutions and consumers user friendly and
secure payment methods
Wallets have low merchant penetration*
Wallets are predominantly P2P*
Cards currently main platform for wallets*
*Denmark
Estimated number of transactions through mobile wallets: 180 million
Estimated number of transactions at merchants: 1.8 bn
Estimated number of transactions through mobile wallets: 180 million