Embed Size (px)
Citation preview

Sewer Charge & Surcharge ProvisionDevelopment, Implementation & Benefits
2013 Industrial Wastewater ConferenceBethlehem, PA (October 4, 2013)

Sewer Charge & Surcharge
Human Waste Treatment History
(1) Historically dilution in streams (Pits & discharge to streams)
(2) 1887 : First biological treatment (Intermittent sand filter) in Medford, MA
(3) 1899 : First Federal regulation of sewage – Rivers & harbors Appropriations “Refuse Act” prohibiting discharge of solids to navigational waters without permit from US Army Corps of Engineers
(4) 1901 – First Trickling filter in Madison WI; 1909 – Imhoff tank for solids settling;
(5) 1914 – liquid chlorine disinfection;
(6) 1916 – Activated sludge plant, St. Marcos, TX; 1940’s – Secondary Treatment process to remove BOD
(7) 1948 – Federal Water Pollution Control Act for water quality surveys & construction of sewage collection and treatment plants. 1972 Clean Water Act
(8) 1960 – Present : Treatment process advances include improved activated sludge processes, nutrient removals (ammonia, phosphorus, nitrates), oxic/anoxic systems, sequencing batch reactors, MBR, improved sludge digestion (high temp), etc.

Sewer Charge & Surcharge
Wastewater (Sewage) Treatment Plant & Treatment Capabilities
(1) Design to treat human waste (domestic wastewater)
(2) Design for specific parameters: BOD, TSS, NH3 (TKN)
(Others: Phosphorus, Nitrate, Metals)
(3) Treatment/Removal of Pollutants as a by‐product of biological treatment
• Biodegrade: O&G/TPHC, organics
• Release to air: Volatile organics
• Sludge Accumulation: Conventional pollutants, Metals, organics (untreated)
(4) Untreated pollutants released to Surface Waters (submit to the permit)
(5) Accumulated sludge – Disposed offsite

Sewer Charge & Surcharge
Sewer Charge & Surcharge
Sewer Charge & Surcharge
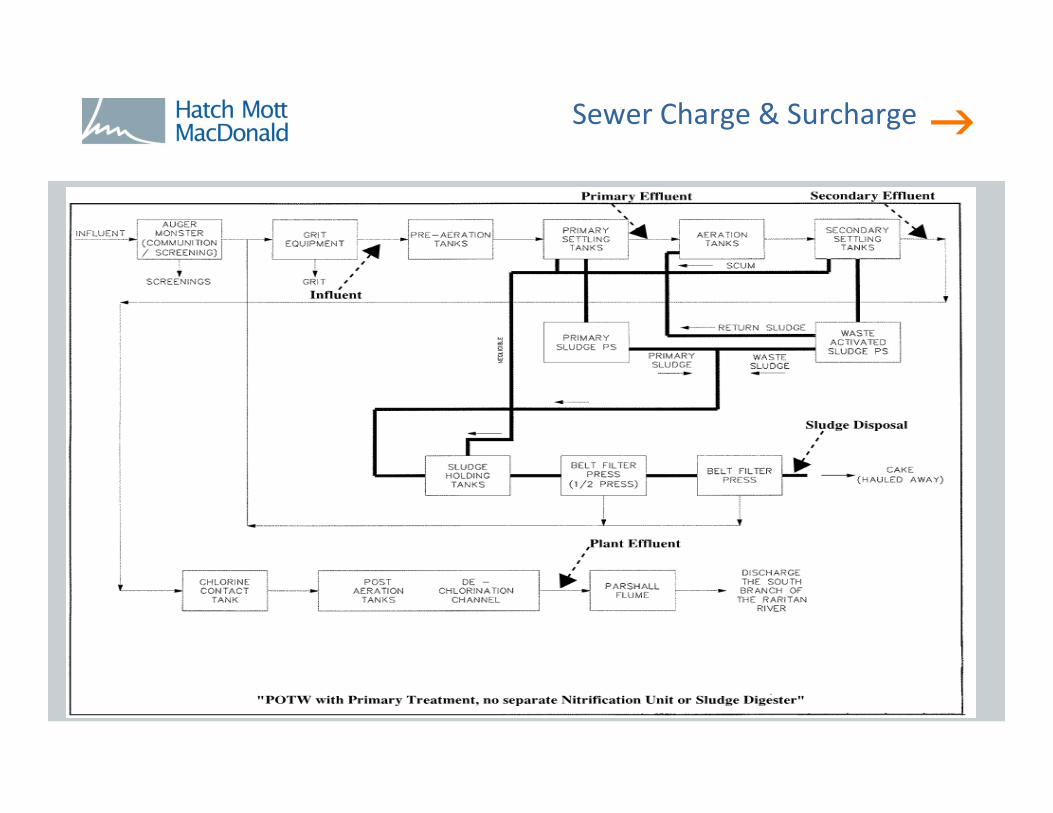
Discharges to Sanitary Sewer System
(1) Sanitary discharge from households;
(2) Stormwater (runoffs/overflows/combined sewers)
(3) Groundwater inflow/infiltration
(4) Commercial Discharge (Non‐domestic in nature)
(Restaurants, laundries, carwash, garages, print/photo, NCCW, etc.)
(5) Industrial Wastewater
(Manufacturing and processing)

Sewer Charge & Surcharge
Protecting Wastewater Treatment Plant
Design for domestic wastewater (human / household waste)
Protect the treatment plant from any plant interference, inhibition, and by‐pass from non‐designed or incompatible discharge sources;
Document all criteria applicable to plant and its operations: plant Design, process inhibition, process interference, sludge quality interference, NPDES (stream) discharge criteria, sludge disposal criteria, and worker safety
Define what quality of non‐domestic wastewater could be acceptable to protect the plant.
Development of plant specific local discharge limits
Adopt and implement the local sewer discharge limitations
Sewer Charge & Surcharge
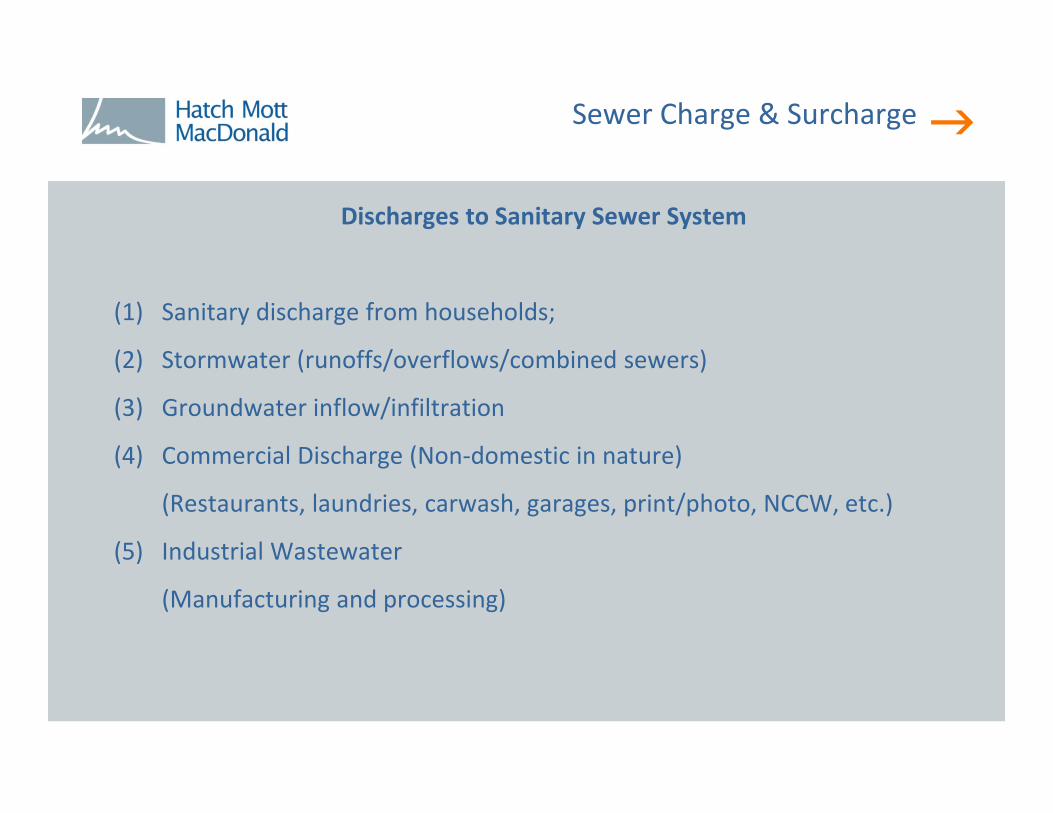
Typical Local Discharge Limitations
BOD5 250 (2) TSS 250 (2) NH3‐N) 25 (2)
TKN 40 (2) Oil/Grease 100 Temp. 65 Celsius
pH 5.5 – 10.0 S.U. Arsenic (T) 1.00 Beryllium(T) 0.10
Cadmium(T) 0.25 Chromium(T) 2.12 Copper (T) 2.88
Lead (T) 2.22 Mercury (T) 0.13 Molybdenum 0.16
Nickel (T) 3.09 Selenium (T) 0.20 Silver (T) 2.60
Zinc (T) 4.26 Cyanide (T) 1.04 Flash Point 140 0F (Min.)
Total Toxic Organics (TTO) ‐ (3)
(1) All units in mg/l, unless otherwise specified. All limits as Daily maximum (composite samples), except for theinstantaneous limits for the grab sample parameters.
(2) A surcharge option for higher BOD5, TSS, NH3, and/or TKN limits may be available (see Section 6.4).
(3) TTO limits may be imposed on a case‐by‐case basis. Discharge of toxic or hazardous substances is also prohibited under Section V. See Appendix‐B for the list of Total Toxic Organics.
6.4 SURCHARGE PROVISION FOR CONVENTIONAL POLLUTANTS
6.5 EXCEPTION & EXEMPTION PROVISIONS

Sewer Charge & Surcharge
Plant Available Treatment Capacities & Future Planning
Review available excess capacities for: Flow, BOD, TSS, Ammonia and other plant design parameters;
Address the service area (participating municipalities) future planning and growth;
Assess available excess treatment capacities for the “Designed pollutant parameters”

Sewer Charge & Surcharge
Typical Plant Design and Compliance Criteria
(A) Typical biological WWTP design criteria are (Varies with plants):
(1) BOD5 200‐250 mg/l (Influent) 90% Removal rate (EPA minimum 85%)
(2) TSS 200‐250 mg/l (Influent) 90% Removal rate (EPA minimum
(3) NH3 25‐40 mg/l (Influent) 90 ‐ 95% Removal rate
(B) Typical WWTP Discharge/Effluent Limitations:
(1) BOD5 8 ‐ 12 mg/l
(2) TSS 30 ‐ 45 mg/l
(3) NH3 1.0 – 3.0 mg/l (Varies ‐ Summer/Winter limits)
(4) Others: Phosphorus, Nitrates, Metals
(Additional pollutants and discharge limitations and requirements based upon Federal and State permits)
Sewer Charge & Surcharge
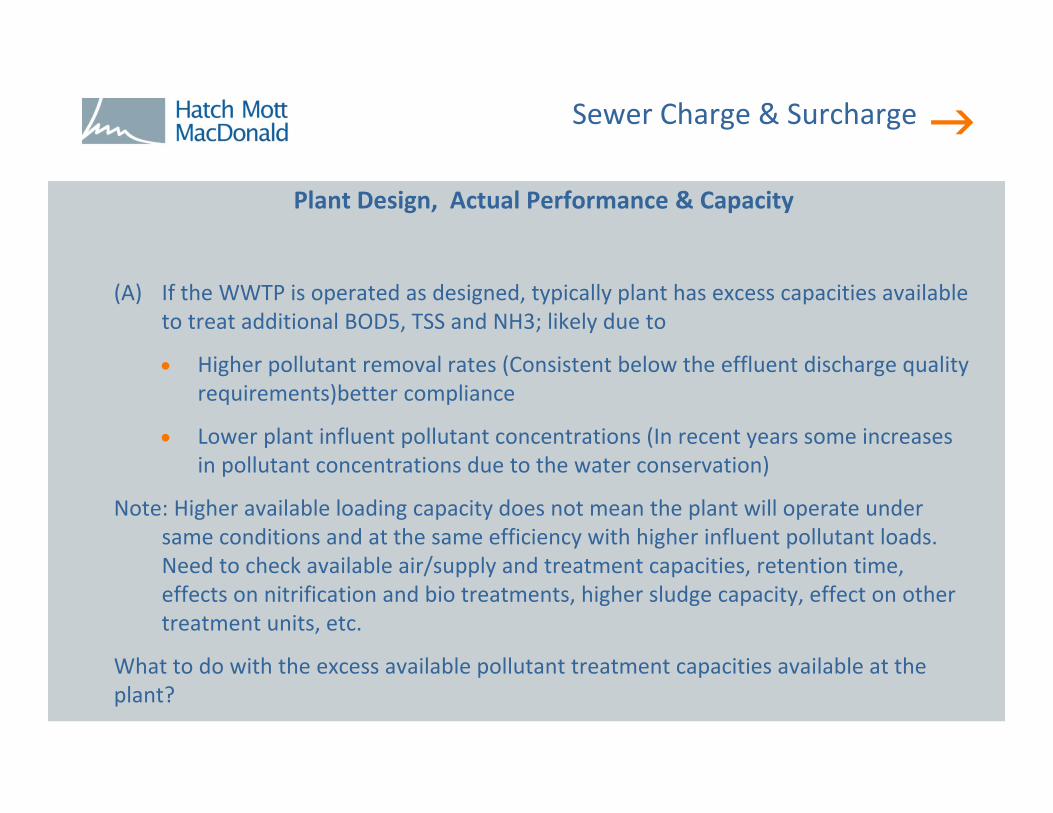
Plant Design, Actual Performance & Capacity
(A) If the WWTP is operated as designed, typically plant has excess capacities available to treat additional BOD5, TSS and NH3; likely due to
Higher pollutant removal rates (Consistent below the effluent discharge quality requirements)better compliance
Lower plant influent pollutant concentrations (In recent years some increases in pollutant concentrations due to the water conservation)
Note: Higher available loading capacity does not mean the plant will operate under same conditions and at the same efficiency with higher influent pollutant loads. Need to check available air/supply and treatment capacities, retention time, effects on nitrification and bio treatments, higher sludge capacity, effect on other treatment units, etc.
What to do with the excess available pollutant treatment capacities available at the plant?

Sewer Charge & Surcharge
Plant Design, Actual Performance & Capacity (Example)
NJPDES DAILY Calculated Daily Safety Available (5)PARAMETERS LIMIT CONCEN. LOADINGS Influent Effluent Removal LOADING Domestic Commercial Industrial Loading For Factor Daily Loading
CAPACITY Loading Loading Loading Ind./Comm. ( @ 10% ) For Ind./Comm.(mg/l) (mg/l) (lbs/day) (mg/l) (mg/l) (% ) (lbs/day) (lbs/day) (lbs/day) (lbs/day) (lbs/day) (lbs/day) (lbs/day)
FLOW in MGD 4.61 4.61 2.26 2.260 2.220 2.26 1.649 0.370 0.241
BOD5 (6) 8.0 220.0 4146.6 119.3 2.00 98.3 8994.5 1640.7 7353.8 735.4 6618.4
TSS 30.0 220.0 4146.6 221.0 1.06 99.5 117891.4 3039.3 114852.1 11485.2 103366.9(< 1.00)
NH3 2.0 29.0 546.6 26.7 0.42 98.4 2396.4 367.2 2029.2 202.9 1826.3(< 1.00)
TKN (7) 3.0 60.0 1130.9 37.3 1.00 97.3 2109.1 513.0 1596.2 159.6 1436.5
PHOSPHORUS(8) 4.5 4.63 1.46 68.3 267.6 63.7 203.9 20.4 183.5
2011 POTW DATA (1) 2011 POTW LOADINGS (3)POTW DESIGN

Sewer Charge & Surcharge
Sewer Surcharge Option
Develop data base for at least 2 – 3 years and verify excess capacities are available;
Hold about 20 % loadings as reserve to address any variations & unforeseen event;
Calculate available excess loadings for the design pollutants (BOD5, TSS, NH3)
These excess loadings could be made available to industrial and commercial dischargers for a surcharge payment for the actual loadings discharge over the domestic equivalent loadings.
Implementation of the sewer surcharge provision is not mandatory, but quite common and recommended (Could be beneficial to POTW and industries)

Sewer Charge & Surcharge
SamplePollutant Month-Year Plant Plant Primary Primary Secondary Nitrification Plant Primary Secondary Nitrification Total
FLOW Influent Influent Effluent Effluent Effluent Effluent Removal Removal Removal Removal
BOD5 (in MGD) (in MG/L) (in MG/L) (in MG/L) (in MG/L) (in MG/L) (in MG/L) (in % ) (in % ) (in % ) (in % )1st Quarter 2/14/11-2/15/11 2.420 123.0 130.0 75.8 33.9 5.8 < 2.0 41.69% 32.23% 21.62% 99.19%2nd Quarter 4/11/11-4/12/11 2.490 171.0 158.0 70.3 39.5 6.5 < 2.0 55.51% 19.49% 20.87% 99.42%3rd Quarter 7/11/11-7/12/11 1.960 170.0 152.0 72.0 29.1 5.3 < 2.0 52.63% 28.22% 15.67% 99.41%4th Quarter 10/3/11-10/4/11 1.940 158.0 132.0 75.3 27.3 4.0 < 2.0 42.95% 36.36% 17.63% 99.37%
2011 AVERAGE 2.203 155.5 143.0 73.4 32.5 5.4 < 2.0 48.20% 29.08% 18.95% 99.35%2011 LOADINGS 2561.8 =Lbs/day influent load Lbs/day load Removed= 2545.3
TSS (in MGD) (in MG/L) (in MG/L) (in MG/L) (in MG/L) (in MG/L) (in MG/L) (in % ) (in % ) (in % ) (in % )1st Quarter 2/14/11-2/15/11 2.420 140.0 174.0 76.0 35.6 4.2 1.0 56.32% 23.22% 18.05% 99.29%2nd Quarter 4/11/11-4/12/11 2.490 204.0 244.0 63.3 34.4 8.2 1.3 74.06% 11.84% 10.74% 99.36%3rd Quarter 7/11/11-7/12/11 1.960 290.0 254.0 60.0 20.6 4.0 < 1.0 76.38% 15.51% 6.54% 99.83%4th Quarter 10/3/11-10/4/11 1.940 236.0 192.0 85.0 35.0 2.4 < 1.0 55.73% 26.04% 16.98% 99.79%
2011 AVERAGE 2.203 217.5 216.0 71.1 31.4 4.7 0.8 65.62% 19.15% 13.07% 99.57%2011 LOADINGS 3583.2 =Lbs/day influent load Lbs/day load Removed= 3569.6
NH3-N (in MGD) (in MG/L) (in MG/L) (in MG/L) (in MG/L) (in MG/L) (in MG/L) (in % ) (in % ) (in % ) (in % )1st Quarter 2/14/11-2/15/11 2.420 19.80 19.00 18.60 17.50 0.05 0.38 2.11% 5.79% 91.85% 98.08%2nd Quarter 4/11/11-4/12/11 2.490 24.50 23.00 22.80 19.00 0.08 0.38 0.87% 16.52% 82.26% 98.45%3rd Quarter 7/11/11-7/12/11 1.960 31.10 28.00 26.20 20.60 0.10 0.51 6.43% 20.00% 73.22% 98.36%4th Quarter 10/3/11-10/4/11 1.940 27.00 27.40 26.20 22.00 0.05 0.36 4.38% 15.33% 80.12% 98.67%
2011 AVERAGE 2.203 25.60 24.35 23.45 19.78 0.07 0.41 3.45% 14.41% 81.86% 98.39%2011 LOADINGS 421.8 =Lbs/day influent load Lbs/day load Removed= 415.0
P(T) (in MGD) (in MG/L) (in MG/L) (in MG/L) (in MG/L) (in MG/L) (in MG/L) (in % ) (in % ) (in % ) (in % )1st Quarter 2/14/11-2/15/11 2.420 3.71 4.74 3.46 3.23 1.21 1.04 27.00% 4.85% 42.62% 71.97%2nd Quarter 4/11/11-4/12/11 2.490 4.77 5.12 3.90 3.65 1.80 1.53 23.83% 4.88% 36.13% 67.92%3rd Quarter 7/11/11-7/12/11 1.960 5.11 5.21 3.87 2.94 1.82 1.66 25.72% 17.85% 21.50% 67.51%4th Quarter 10/3/11-10/4/11 1.940 4.26 4.87 3.76 3.50 1.54 1.54 22.79% 5.34% 40.25% 63.85%
2011 AVERAGE 2.203 4.46 4.99 3.75 3.33 1.59 1.44 24.84% 8.23% 35.12% 67.81%2011 LOADINGS 73.5 =Lbs/day influent load Lbs/day load Removed= 49.8
Primary Treatment Removal Rates Treatment Process Removal Rates

Sewer Charge & Surcharge
Calculating Sewer Rates & Sewer Surcharge Rates
(1) USEPA guidelines (early 1980’s) for “User Charge & Related Revenue System –Requirement for a POTW”
(2) More than one way to calculate rates, as long as it covers POTW costs and reasonably distribute them work related to corresponding pollutants removal
(3) Basically calculating the treatment plant capital and operating costs and distributing the cost in the plant design parameters including:
Flow (mostly sewer collection system operation)
BOD5
TSS
NH3 (TKN)
Phosphorus & Others (if the plant is designed)
Sewer Charge & Surcharge
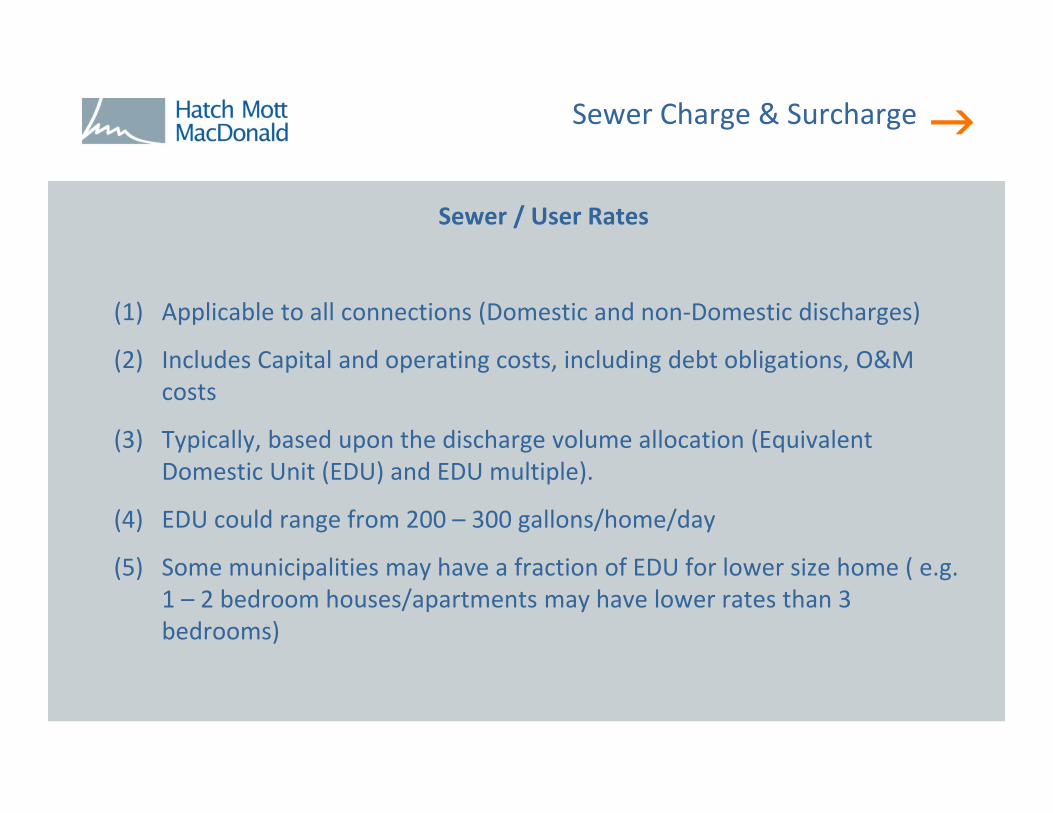
Sewer / User Rates
(1) Applicable to all connections (Domestic and non‐Domestic discharges)
(2) Includes Capital and operating costs, including debt obligations, O&M costs
(3) Typically, based upon the discharge volume allocation (Equivalent Domestic Unit (EDU) and EDU multiple).
(4) EDU could range from 200 – 300 gallons/home/day
(5) Some municipalities may have a fraction of EDU for lower size home ( e.g. 1 – 2 bedroom houses/apartments may have lower rates than 3 bedrooms)

Sewer Charge & Surcharge
Sewer Surcharge Rates Calculation
(1) Allowed for only pollutants for which the plant is specifically designed
(2) Sewer Surcharge Rates are in addition to the Sewer/User Charges
(3) Sewer Surcharge “Rates” are calculated using only “Plant O&M and Related Costs”, including:
All plant operation and maintenance costs, including electricity, chemicals, property maintenance, vehicles, sludge disposal cost, etc.
Employee salaries and benefits
Plant administration cost
Regulatory and compliance cost
Related engineering and legal cost
DO NOT INCLUDED: Capital cost, debt service cost, IPP cost

Sewer Charge & Surcharge
Sewer Surcharge Rates Calculation
(1) Breakdown of costs to specific Flow, BOD5, TSS, NH3 (TKN), etc. operations
(2) Split O&M costs into specific process operations: Collection system (flow), primary treatment, biological/aeration treatment, nitrification, chemical treatment, disinfection, sludge operations, etc.
(3) Estimate pollutant removal rate for each treatment unit operation
(4) Split general cost items (administration, regulatory, legal, etc.) proportional to overall pollutant removal rates by each treatment unit.
(5) Calculate surcharge rates ($$/pound of pollutant) for each pollutant:
BOD5, TSS, NH3, etc.

Sewer Charge & Surcharge
HSA ADMINISTRATIVE COST Yearly CostRef.# % Factor Cost % Factor Cost % Factor Cost % Factor Cost % Factor Cost
1100 Administration : Salaries & wages $198,000 21.32% $42,214 31.61% $62,588 37.39% $74,032 6.80% $13,464 2.88% $5,7021200 Administration : Fringe benefits $98,471 21.32% $20,994 31.61% $31,127 37.39% $36,818 6.80% $6,696 2.88% $2,8361300 Administration : Other $61,700 21.32% $13,154 31.61% $19,503 37.39% $23,070 6.80% $4,196 2.88% $1,7771500 Administration : Insurance $9,500 21.32% $2,025 31.61% $3,003 37.39% $3,552 6.80% $646 2.88% $2742100 Plant : Salaries & wages $1,540,000 21.32% $328,328 31.61% $486,794 37.39% $575,806 6.80% $104,720 2.88% $44,3522200 Plant : Fringe benefits $776,900 21.32% $165,635 31.61% $245,578 37.39% $290,483 6.80% $52,829 2.88% $22,3752500 Plant : Insurance $80,900 21.32% $17,248 31.61% $25,572 37.39% $30,249 6.80% $5,501 2.88% $2,3302401 Plant : Electricity $330,000 0.00% $0 40.17% $132,561 47.52% $156,816 8.65% $28,545 3.66% $12,0782402 Plant : Sludge cost $162,000 0.00% $0 38.69% $62,678 54.23% $87,853 6.31% $10,222 0.76% $1,2312403 Plant : Fuel & water $167,000 0.00% $0 40.17% $67,084 47.52% $79,358 8.65% $14,446 3.66% $6,1122404 Plant : Maintenance supplies $78,000 0.00% $0 40.17% $31,333 47.52% $37,066 8.65% $6,747 3.66% $2,8552405 Plant : Maintenance services $149,300 0.00% $0 40.17% $59,974 47.52% $70,947 8.65% $12,914 3.66% $5,4642406 Plant : Equipment $20,000 0.00% $0 40.17% $8,034 47.52% $9,504 8.65% $1,730 3.66% $7322407 Plant : Chemicals (Overall plant) $51,700 0.00% $0 40.17% $20,768 47.52% $24,568 8.65% $4,472 3.66% $1,8922407 Plant : Chemicals (Alum for P(T)) $50,000 0.00% $0 0.00% $0 0.00% $0 0.00% $0 100.00% $50,0002410 Plant : Permits & Regulatory $20,800 0.00% $0 40.17% $8,355 47.52% $9,884 8.65% $1,799 3.66% $7612411 Plant : Office supplies $13,400 0.00% $0 40.17% $5,383 47.52% $6,368 8.65% $1,159 3.66% $4902412 Plant : Laboratory $122,300 0.00% $0 40.17% $49,128 47.52% $58,117 8.65% $10,579 3.66% $4,4762414 Plant : Safety $21,200 0.00% $0 40.17% $8,516 47.52% $10,074 8.65% $1,834 3.66% $7761400 Professional Services (4) (7) $194,900 0.00% $0 40.17% $78,291 47.52% $92,616 8.65% $16,859 3.66% $7,1332408 Vehicle expense (5) $30,500 80.00% $24,400 7.47% $2,278 7.37% $2,248 4.49% $1,370 0.67% $204
$0 $0 $0 $0 $01600 Township Reimbursement $64,015 100.00% $64,015 $0 $0 $0 $01700 Administration : Fiscal Agent $0 100.00% $0 $0 $0 $0 $02409 Collection System $263,600 100.00% $263,600 $0 $0 $0 $02413 Industrial Pretreatment Program (7) $210,600 $0 $0 $0 $0 $03000 Debt Service $225,000 100.00% $225,000 $0 $0 $0 $04000 Plant Expansion $500,000 100.00% $500,000 $0 $0 $0 $0
Total Other Admin. Costs $5,439,786 $1,666,613 $1,408,548 $1,679,429 $300,728 $173,852
FLOW COST BOD5 COST TSS COST AMMONIA COST PHOSPHORUS COST

Sewer Charges & Surcharge
Allocating Excess capacity for Payment of Surcharge
(1) Calculate overall plant excess capacities for each BOD5, TSS, NH3, etc.
(2) Reserve about 20% of excess pollutant capacities
(3) Allocate excess “Available” capacities to industrial/commercial dischargers (typically on a first come first serve basis)
(4) Establish upper cutoff discharge limits (Concentrations and/or loadings) for each User, as necessary
(5) Document, review and update “Available” excess capacities each year.
(6) Recommended to update the sewer surcharge rates ($$/lb) every two years.

Sewer Charges & Surcharge
Assessing Individual Surcharge Cost
Equation #1: Rx = Ex(8.34) (365) (QT) (CT)
Equation #2: Sind. = (Rx) (Qind) (Cind ‐ Cx,L) (8.34)
Rx = Surcharge rate for parameter (x) in dollars per pound.
Ex = Annual O&M cost of the POTW associated with treatment of parameter(s) in dollars per year.
QT = Average daily influent flow to the wastewater treatment plant (POTW) in million gallons per day.
CT = Average daily influent concentration of parameter (x) to the WTP in mg/l.
X = Pollutant parameters e.g. BOD5, TSS, NH3, TKN, etc.
(8.34) = Conversion factor.
Sind. = Monthly sewer surcharge for Users/dischargers in dollars, which is summation of sewer surcharges for all applicable pollutant parameters.
Qind = Total monthly discharge from the User in millions of gallons.
Cind = Average discharge concentration of pollutant parameter (x) in milligrams per liter of the Users’ discharge
Cx,L = Discharge (domestic‐Equivalent) concentration for the pollutant parameter (x) in mg/l.

Sewer Charges & Surcharge
Case History
(1) Beverage Manufacturer #1 (High BOD loadings)
Typical range: Flow ‐ 70,000 gpd, BOD5 ‐ 1,800 mg/l, TSS ‐ 600 mg/l
Large WWTP with available excess loadings
Issued a discharge permit with a surcharge provision (no cutoff limits)
Monthly surcharge fees for BOD5 and TSS in the range of $14,000
(2) Beverage Manufacturer #2 (High BOD loadings)
Typical range: Flow ‐ 350,000 gpd, BOD5 ‐ 2700 mg/l, TSS ‐ 1000 mg/l
Medium WWTP with limited available loadings
Issued a discharge permit with a surcharge provision (with cutoff limits)
Monthly surcharge fees for BOD5 and TSS in the range of $125,000‐ $150,000

Sewer Charges & Surcharge
Case History (Continued)
(3) Food Processer #1 (High BOD & TSS loadings)
Typical range: Flow ‐ 120,000 gpd, BOD5 – 2,200 mg/l, TSS ‐ 500 mg/l
Large WWTP with available excess loadings
Issued a discharge permit with a surcharge provision (no cutoff limits)
Monthly surcharge fees for BOD5 and TSS in the range of $40,000
(4) Food Processer #2 (High BOD & TSS loadings)
Typical range: Flow ‐ 250,000 gpd, BOD5 ‐ 1,800 mg/l, TSS ‐ 600 mg/l
Large WWTP with available excess loadings
Issued a discharge permit with a surcharge provision (no cutoff limits)
Monthly surcharge fees for BOD5 and TSS in the range of $60,000 ‐ $75,000

Sewer Charges & Surcharge
Case History (Continued)
(5) Cheese Processer #1 (High BOD & TSS loadings)
Typical range: Flow ‐ 15,000 gpd, BOD5 ‐ 900 mg/l, TSS ‐ 600 mg/l
Large WWTP with available excess loadings
Issued a discharge permit with a surcharge provision (no cutoff limits)
Monthly surcharge fees for BOD5 and TSS in the range of $2,000
(6) Small Slaughter House (High BOD, TSS & NH3 loadings)
Typical range: Flow ‐ 7,000 gpd, BOD5 – 8,000 mg/l, TSS – 1,200 mg/l, NH3 – 100 mg/l
Small WWTP with limited available excess loadings
Issued a discharge permit with a surcharge provision (With cutoff limits)
Monthly surcharge fees for BOD5 and TSS in the range of $20,000
Sewer Charges & Surcharge
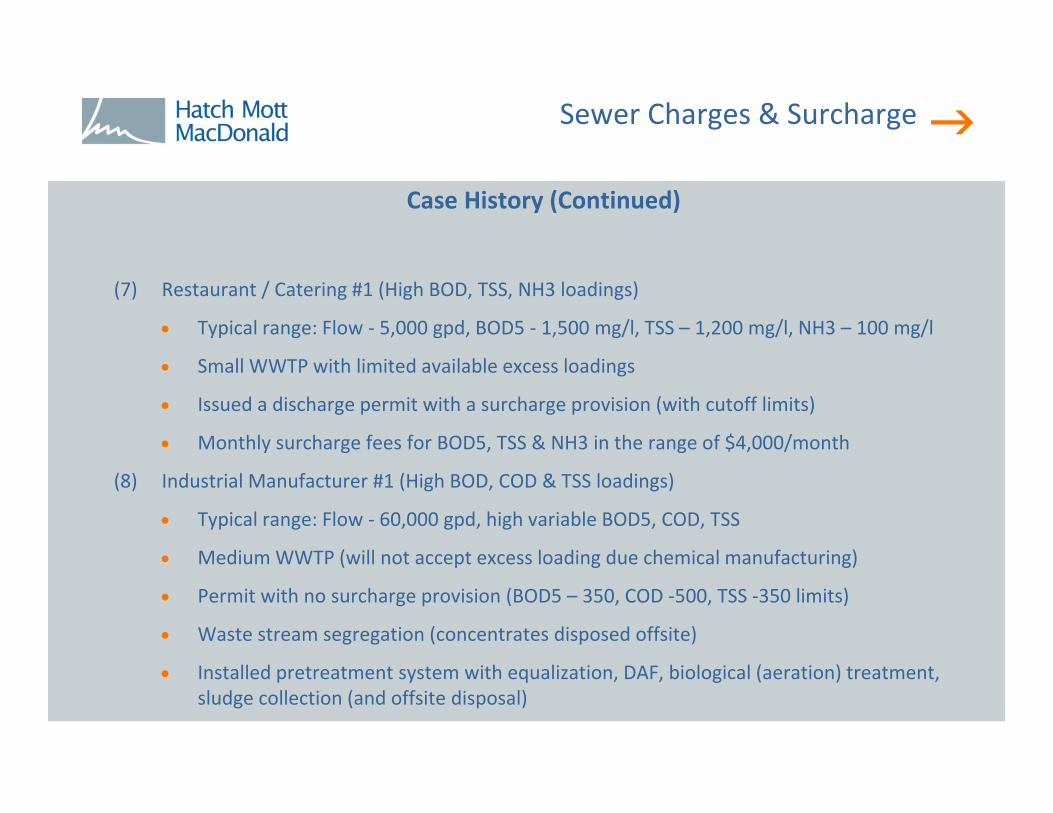
Case History (Continued)
(7) Restaurant / Catering #1 (High BOD, TSS, NH3 loadings)
Typical range: Flow ‐ 5,000 gpd, BOD5 ‐ 1,500 mg/l, TSS – 1,200 mg/l, NH3 – 100 mg/l
Small WWTP with limited available excess loadings
Issued a discharge permit with a surcharge provision (with cutoff limits)
Monthly surcharge fees for BOD5, TSS & NH3 in the range of $4,000/month
(8) Industrial Manufacturer #1 (High BOD, COD & TSS loadings)
Typical range: Flow ‐ 60,000 gpd, high variable BOD5, COD, TSS
Medium WWTP (will not accept excess loading due chemical manufacturing)
Permit with no surcharge provision (BOD5 – 350, COD ‐500, TSS ‐350 limits)
Waste stream segregation (concentrates disposed offsite)
Installed pretreatment system with equalization, DAF, biological (aeration) treatment, sludge collection (and offsite disposal)

Sewer Charges & Surcharge
Surcharge Option or Pretreatment (Pay or Treat)
(1) Typically industrial and commercial users are not in business of waste treatment
(2) Pretreatment will most likely require biological treatment system (aerobic / anaerobic)
(3) Pretreatment design, construction & operation cost varies with flow and load
(4) Check available space
(5) Check other regulatory compliance requirements
(Construction permits, sludge disposal issues, air or other permits, safety)
(6) Evaluate costs pretreatment and surcharge rates & decide.

Sewer Charges & Surcharge
THANK YOU
Contact Information:Richard Lulla, P.E.Senior Associate
Hatch Mott MacDonald111 South Wood AvenueIselin, New Jersey 08830
973‐912‐[email protected]