Embed Size (px)
Citation preview
1Snavely ME, et al. BMJ Glob Health 2018;3:e000507. doi:10.1136/bmjgh-2017-000507
Sociocultural and health system factors associated with mortality among febrile inpatients in Tanzania: a prospective social biopsy cohort study
Michael E Snavely,1 Michael J Maze,2 Charles Muiruri,1 Lilian Ngowi,3 Flora Mboya,3 Julia Beamesderfer,4 Glory F Makupa,5 Anthon G Mwingwa,5 Bingileki F Lwezaula,6 Blandina T Mmbaga,3 Venance P Maro,5 John A Crump,2 Jan Ostermann,7 Matthew P Rubach8
Research
To cite: Snavely ME, Maze MJ, Muiruri C, et al. Sociocultural and health system factors associated with mortality among febrile inpatients in Tanzania: a prospective social biopsy cohort study. BMJ Glob Health 2018;3:e000507. doi:10.1136/bmjgh-2017-000507
Handling editor Soumitra Bhuyan
► Additional material is published online only. To view please visit the journal online (http:// dx. doi. org/ 10. 1136/ bmjgh- 2017- 000507).
Received 1 August 2017Revised 21 December 2017Accepted 20 January 2018
For numbered affiliations see end of article.
Correspondence toDr Matthew P Rubach; matthew. rubach@ duke. edu
AbstrACtIntroduction Communicable diseases are the leading causes of death in Tanzania despite the existence of effective treatment tools. We aimed to assess the sociocultural and health system factors associated with mortality from febrile illness in northern Tanzania.Methods We interviewed febrile inpatients to determine prevalence of barriers in seeking or receiving care and grouped these barriers using the Three Delays model (delays at home, in transport and at healthcare facilities). We assessed 6-week mortality and, after matching on age, gender and severity of illness, measured the association between delays and mortality using conditional logistic regression.results We enrolled 475 children, of whom 18 (3.8%) died, and 260 adults, of whom 34 (13.0%) died. For children, home delays were not associated with mortality. Among adults, a delay in care-seeking due to not recognising severe symptoms was associated with mortality (OR: 3.01; 95% CI 1.24 to 7.32). For transport delays, taking >1 hour to reach a facility increased odds of death in children (OR: 3.27; 95% CI 1.11 to 9.66) and adults (OR: 3.03; 95% CI 1.32 to 6.99). For health system delays, each additional facility visited was associated with mortality for children (OR: 1.59; 95% CI 1.06 to 2.38) and adults (OR: 2.00; 95% CI 1.17 to 3.41), as was spending >4 days between the first facility visit and reaching tertiary care (OR: 4.39; 95% CI 1.49 to 12.93).Conclusion Our findings suggest that delays at home, in transport and in accessing tertiary care are risk factors for mortality from febrile illness in northern Tanzania. Interventions that may reduce mortality include community education regarding severe symptoms, expanding transportation infrastructure and streamlining referrals to tertiary care for the sickest patients.
IntroduCtIonFever is common in low-resource areas, with a 2-week period prevalence as high as 27%.1 In Tanzania, common aetiologies among febrile inpatients include bloodstream infections and bacterial zoonoses,2 and febrile illnesses are
still major causes of death3 4 despite the exist-ence of effective treatment tools such as anti-microbials and clinical management guide-lines.5 As such, sociocultural, behavioural and health system factors6–8 may contribute to mortality from infectious diseases.
Social autopsy has been used to describe non-biological contributors to fatal infections,
Key questions
What is already known about this topic? ► Social autopsy is a retrospective interview tool that has been used successfully to assess sociocultural and health systems barriers to care in febrile illness.
► Social autopsy is limited, however, by its retrospective approach and lack of control group.
What are the new findings? ► Ours is the first study to our knowledge to use the social autopsy framework in a prospective cohort study and to determine which sociocultural and health system factors are associated with mortality.
► We found that delays in care-seeking, delays in transport and spending more time between initial presentation to a health facility and reaching tertiary level care were all associated with an increased odds of mortality.
recommendations for policy ► Our results suggest that there are social and health system factors associated with mortality from febrile illness, which may help explain why communicable diseases are still the leading causes of death in Tanzania.
► Interventions to improve severe illness recognition in the community, shorten transport times and expedite referrals to tertiary care when necessary may help prevent deaths from febrile illness in northern Tanzania.
on March 26, 2020 by guest. P
rotected by copyright.http://gh.bm
j.com/
BM
J Glob H
ealth: first published as 10.1136/bmjgh-2017-000507 on 21 F
ebruary 2018. Dow
nloaded from
2 Snavely ME, et al. BMJ Glob Health 2018;3:e000507. doi:10.1136/bmjgh-2017-000507
BMJ Global Health
including malaria in Tanzania9 and febrile illness and pneumonia in Uganda.10 11 Administered as a structured interview to family members following a person’s death, social autopsy solicits information on healthcare-seeking, sociocultural barriers to care and barriers within the healthcare system.12 13 Identification of delays through social autopsy can provide evidence to inform interven-tions. For example, a social autopsy study in Niger found that transport was the main barrier to effective perinatal care, and the government responded by making motor-cycle ambulances available for mothers in labour.14
Standard retrospective social autopsy is limited by substantial recall15 16 and selection17 bias. In addition, without non-fatal controls, social autopsy studies have
been unable to conclude whether non-biological factors are truly associated with increased odds of mortality. Furthermore, few social autopsy studies have enrolled non-maternal adults. In our study, we adapted social autopsy for a prospective cohort study of febrile inpa-tients of all ages. Since our tool is used during life, it is best described as a ‘social biopsy’. Our objective was to determine the sociocultural barriers, healthcare-seeking behaviour and health system factors that are associated with mortality from febrile illness in northern Tanzania.
MetHodsstudy area and populationWe enrolled participants at two hospitals in Moshi, Tanzania, the administrative capital of the Kilimanjaro Region. Mawenzi Regional Referral Hospital (MRRH) serves as the region’s tertiary referral hospital with 300 beds. Kilimanjaro Christian Medical Centre (KCMC) is one of four consultant tertiary hospitals in Tanzania and has 458 beds, serving a catchment population of more than 10 million people, including people served by MRRH.
Study team members screened all patients admitted to paediatric and adult medical wards at MRRH and KCMC from June 2015 to June 2016. Patients were screened as soon as possible and no later than 48 hours after admis-sion. Patients with a history of fever in the past 72 hours; tympanic, rectal or oral temperature of ≥38.0°C at admis-sion; or axillary temperature of >37.5°C at admission were eligible to participate in the study.
data collectionAfter obtaining informed consent from the patient or guardian, trained clinical officers administered a struc-tured interview in Kiswahili. We designed our question-naire based on the International Network for the Demo-graphic Evaluation of Populations and Their Health standardised social autopsy tools for child and maternal death12 and the Child Health Epidemiology Reference Group social autopsy questionnaire.13 Our questionnaire captured information on participant demographics, soci-oeconomic characteristics and barriers to care. We also asked about the presence of severe symptoms that should prompt immediate referral to a hospital, as defined by the World Health Organization Integrated Management of Childhood Illness (IMCI) and Integrated Management of Adolescent and Adult Illness (IMAI) guidelines.18 19 We telephoned participants to assess their vital status within 6 weeks of enrolment in the study.
We defined cases as participants who died within 6 weeks of enrolment and controls as those who were alive at the time of follow-up between 3 and 6 weeks after enrolment. Mirroring the age threshold used at MRRH and KCMC, we defined paediatric participants as those under 13 years of age and adults as those 13 years and older. For analysis of IMCI severe symptoms, we defined infants as participants younger than 12 months of age and children as paediatric participants 12 months of age or older.
Box 1 List of all 15 barriers to care as used in the severe febrile illness social biopsy study, tanzania, 2015–2016, categorised by home, transport and health system delays according to the three delays model.
Home delays ► Patient reported delay in seeking care due to thinking illness was not severe but severe symptom was present.
► Patient waited >24 hours to seek care after onset of severe symptom.*†
► Patient treated at home despite severe symptom.
transport delays ► Patient reported a delay due to transport or cost of transport at any point.
► Patient delayed >1 hour to reach a facility at any point.†‡
Health system delay ► Patient did not get referred to a hospital from the first facility after onset of severe symptom.
► Patient did not take themselves to a hospital after onset of severe symptom (ie, did not ‘short-circuit’ referral).
► Patient did not receive antibiotics at the first peripheral facility after onset of severe symptom.
► Patient reported a barrier at a health facility due to discrimination, language or physical access.
► Patient waited >1 hour to receive medication at any point.* ► Patient visited >2 facilities.† § ► Patient waited>1 hour to be seen by a provider at any point.* ► Patient reported delay due to cost of healthcare. ► Patient did not complete a given treatment due to patient or caregiver decision.
► Patient spent >4 days in the healthcare system.†¶
*This threshold was based on a cut-off value used in the social autopsy literature.†This delay was also analysed as a continuous variable (see Results).‡Social autopsy literature has used a cut-off of >2 hours, but our participants’ average transport time was lower and thus a cut-off of 2 hours was not instructive.§Social autopsy literature has used a cut-off of >1 facility, but since our study was hospital based and we were hoping to test whether the WHO Integrated Management of Childhood Illness and Adult and Adolescent Illness guidelines of a severe symptom prompting referral to a hospital were being followed, we set our threshold at >2 facilities.¶The threshold of >4 days was set post hoc based on our participants’ mean number days spent in the healthcare system.
on March 26, 2020 by guest. P
rotected by copyright.http://gh.bm
j.com/
BM
J Glob H
ealth: first published as 10.1136/bmjgh-2017-000507 on 21 F
ebruary 2018. Dow
nloaded from
Snavely ME, et al. BMJ Glob Health 2018;3:e000507. doi:10.1136/bmjgh-2017-000507 3
BMJ Global Health
statistical analysisWe used a matched case–control analysis nested within our prospective cohort study to measure the association between barriers to care and mortality for paediatric and for adult participants, respectively. We assessed 15 barriers to care, categorised into delays at home, in transport and within the healthcare system based on the Three Delays model (box 1).20
Within the paediatric and adult cohorts, respectively, we matched cases with controls based on age quintile, gender and severity of illness. We matched on age quintile to allow for more precise matching on other covariates, and because in estimating outcome from infection, the broader age group is likely an appropriate predictor.21–23 When analysing home and transport delays, we matched only on age and gender, as the presence of a severe symptom was implicit in home delays, and transport delays were assessed at multiple
points in time and thus did not have reference points at which to measure severity. For healthcare system delays, we matched on age, gender and severity of illness at the time of the first encounter with a healthcare facility during the current illness.
To match on severity of illness, we first determined separately for infants, children and adults whether cases and controls had similar distributions of IMCI or IMAI severe symptoms using the Kolmogorov-Smirnov equal-ity-of-distributions test. If there was a significant differ-ence in distributions, we included a severity of illness score in the matching algorithm. We generated the severity of illness score using principal component anal-ysis of the IMCI or IMAI severe symptoms present at time of study enrolment. Next, we used a logistic regression of mortality with the principal components as explanatory variables to predict a severity of illness score at the time
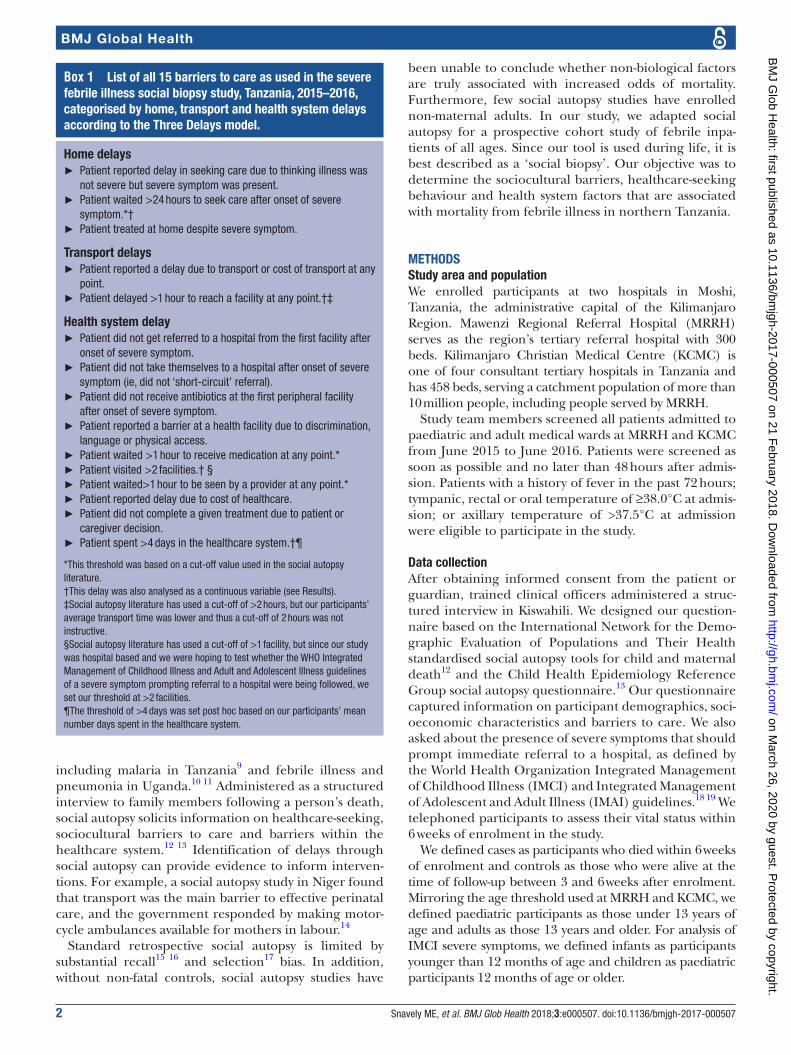
Figure 1 Patients screened, enrolled and reached for follow-up during 1 year of data collection in the severe febrile illness social biopsy study, Tanzania, 2015-2016.
on March 26, 2020 by guest. P
rotected by copyright.http://gh.bm
j.com/
BM
J Glob H
ealth: first published as 10.1136/bmjgh-2017-000507 on 21 F
ebruary 2018. Dow
nloaded from
4 Snavely ME, et al. BMJ Glob Health 2018;3:e000507. doi:10.1136/bmjgh-2017-000507
BMJ Global Health
of first encounter with a healthcare facility during the current illness.
Our matching algorithm used nearest-neighbour matching with replacement and subsequent dedupli-cation of controls.24 25 If any cases were left without a matched control, we reassigned controls such that every case was matched with at least one control while main-taining maximum closeness of matching. We then consol-idated cases and controls across infants and children to make one paediatric cohort. We measured matching quality using standardised biases and variance ratios of covariates between cases and controls.26 27 The ratio of controls to cases was set at a minimum of two but was maximised such that the standardised bias remained below 10.0% for each covariate.28
We measured the association between each delay and 6-week mortality using conditional logistic regression. We reported results as ORs of mortality with associated popu-lation attributable fraction (AF). Statistical analysis was done using Stata V.14.1. We depicted the differences in the sequence and type of facilities visited between cases and controls using an adapted Sankey diagram, generated with ‘The Sankey Diagram Generator’ (Acquire Procurement Services, Brisbane, Australia).29 30 We designated private clinics and government-run dispensaries and health centres as first level facilities. We designated district hospitals as secondary level care and regional referral and consultant referral hospitals as tertiary care.31–33
To assess the impact of loss to follow-up, we compared baseline characteristics between those lost to follow-up and those included in the analysis using t-tests for means and χ2 tests for proportions. To determine whether a participant’s clinical presentation was a confounder, we conducted a sensitivity analysis in which we repeated the conditional logistic regression of mortality for each delay among the subset of participants who had each severe symptom.
Patient involvementA pilot period ensured patient feedback was incorpo-rated into the questionnaire design. The results of the study will be made available to patients through dissemi-nation to healthcare providers at MRRH and KCMC.
research ethicsInformed consent was obtained from all participants. All authors had full access to relevant study data at all times. The funding sources had no role in the planning, collec-tion or analysis of data. We attest that we have obtained appropriate permissions and paid any required fees for use of copyright protected materials.
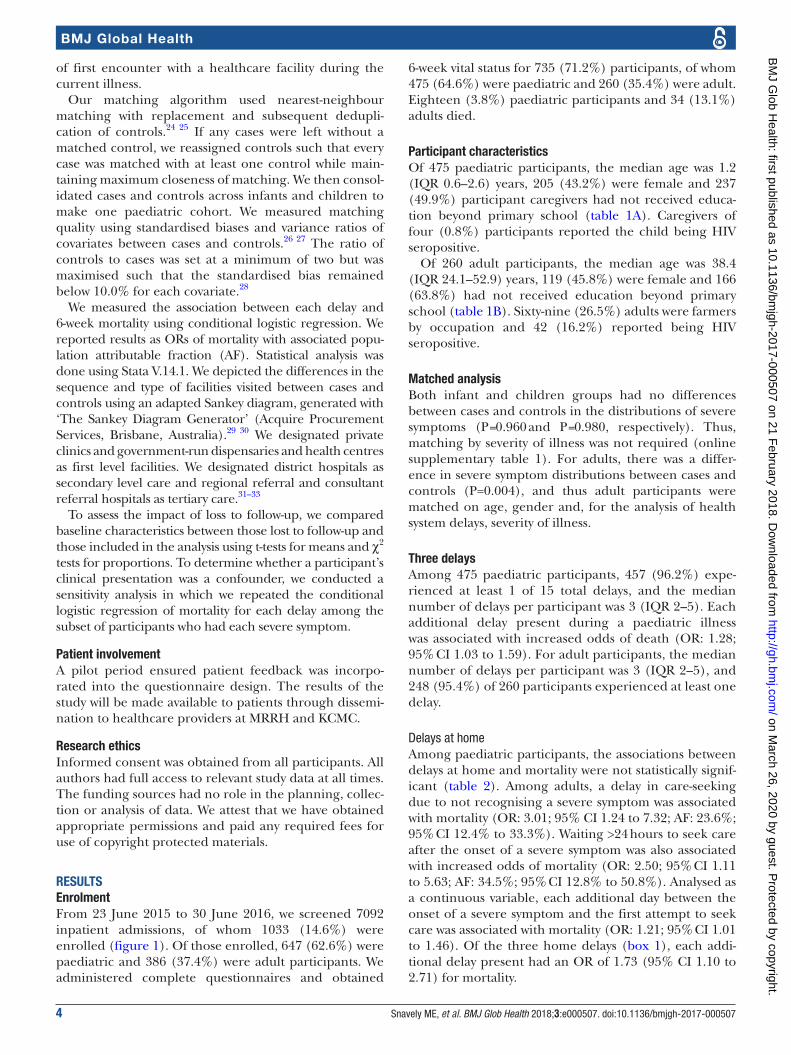
resuLtsenrolmentFrom 23 June 2015 to 30 June 2016, we screened 7092 inpatient admissions, of whom 1033 (14.6%) were enrolled (figure 1). Of those enrolled, 647 (62.6%) were paediatric and 386 (37.4%) were adult participants. We administered complete questionnaires and obtained
6-week vital status for 735 (71.2%) participants, of whom 475 (64.6%) were paediatric and 260 (35.4%) were adult. Eighteen (3.8%) paediatric participants and 34 (13.1%) adults died.
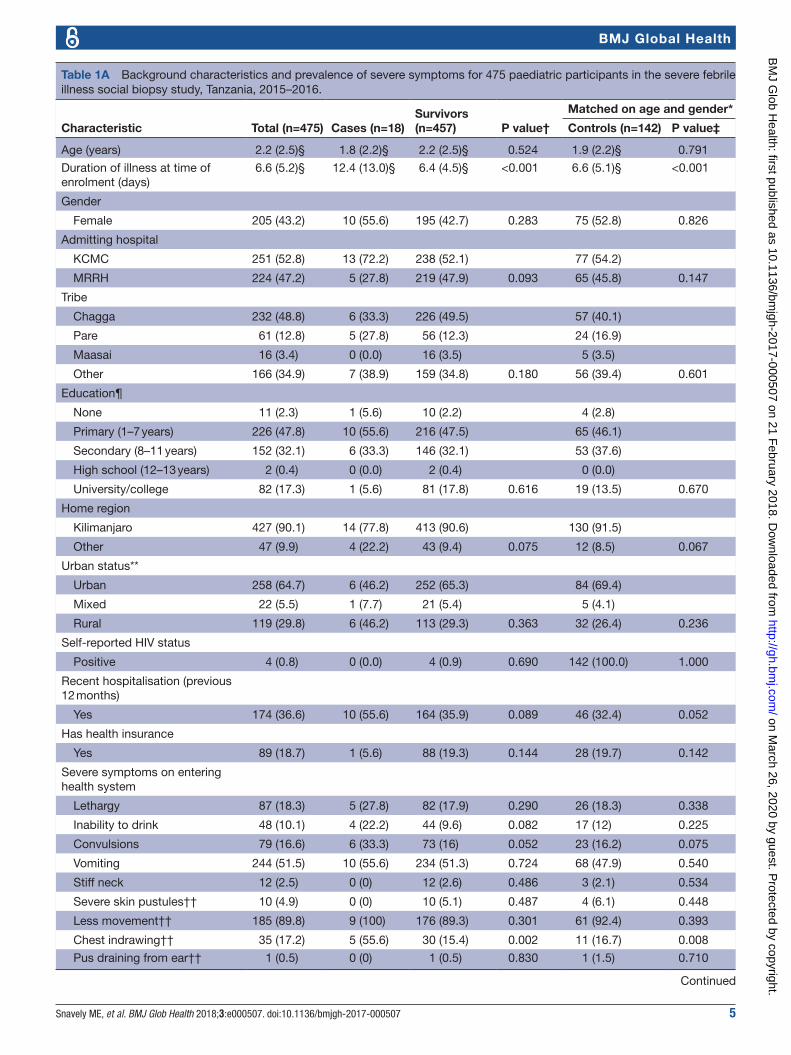
Participant characteristicsOf 475 paediatric participants, the median age was 1.2 (IQR 0.6–2.6) years, 205 (43.2%) were female and 237 (49.9%) participant caregivers had not received educa-tion beyond primary school (table 1A). Caregivers of four (0.8%) participants reported the child being HIV seropositive.
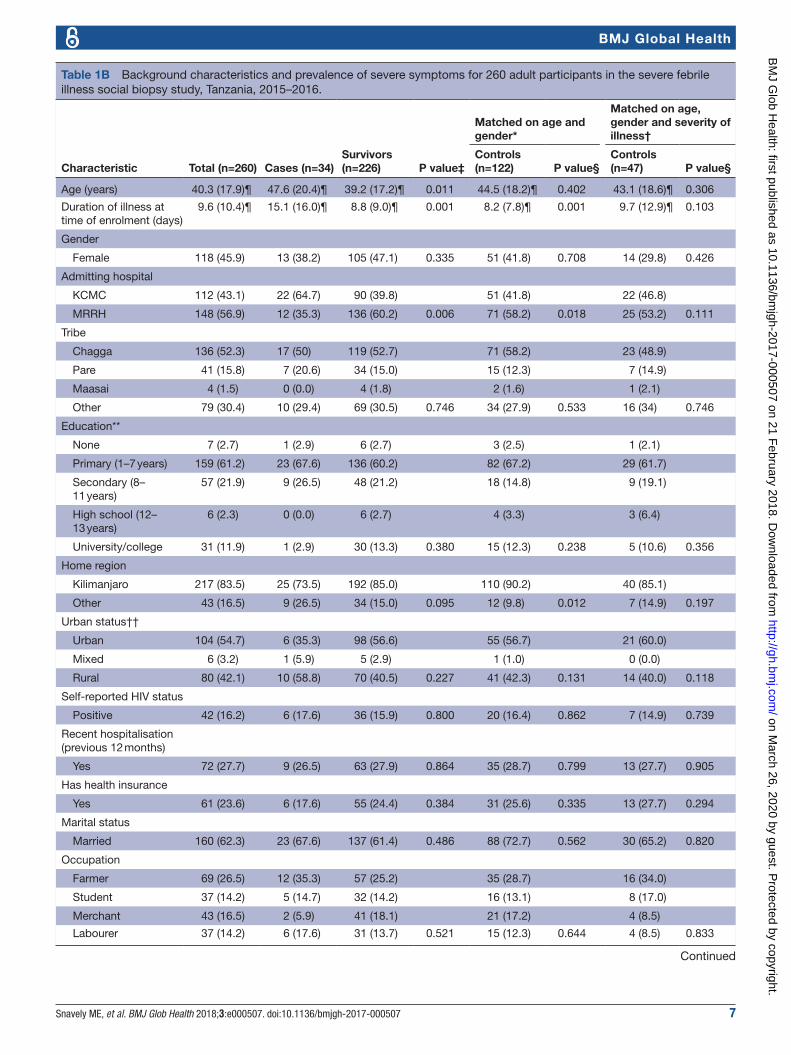
Of 260 adult participants, the median age was 38.4 (IQR 24.1–52.9) years, 119 (45.8%) were female and 166 (63.8%) had not received education beyond primary school (table 1B). Sixty-nine (26.5%) adults were farmers by occupation and 42 (16.2%) reported being HIV seropositive.
Matched analysisBoth infant and children groups had no differences between cases and controls in the distributions of severe symptoms (P=0.960 and P=0.980, respectively). Thus, matching by severity of illness was not required (online supplementary table 1). For adults, there was a differ-ence in severe symptom distributions between cases and controls (P=0.004), and thus adult participants were matched on age, gender and, for the analysis of health system delays, severity of illness.
three delaysAmong 475 paediatric participants, 457 (96.2%) expe-rienced at least 1 of 15 total delays, and the median number of delays per participant was 3 (IQR 2–5). Each additional delay present during a paediatric illness was associated with increased odds of death (OR: 1.28; 95% CI 1.03 to 1.59). For adult participants, the median number of delays per participant was 3 (IQR 2–5), and 248 (95.4%) of 260 participants experienced at least one delay.
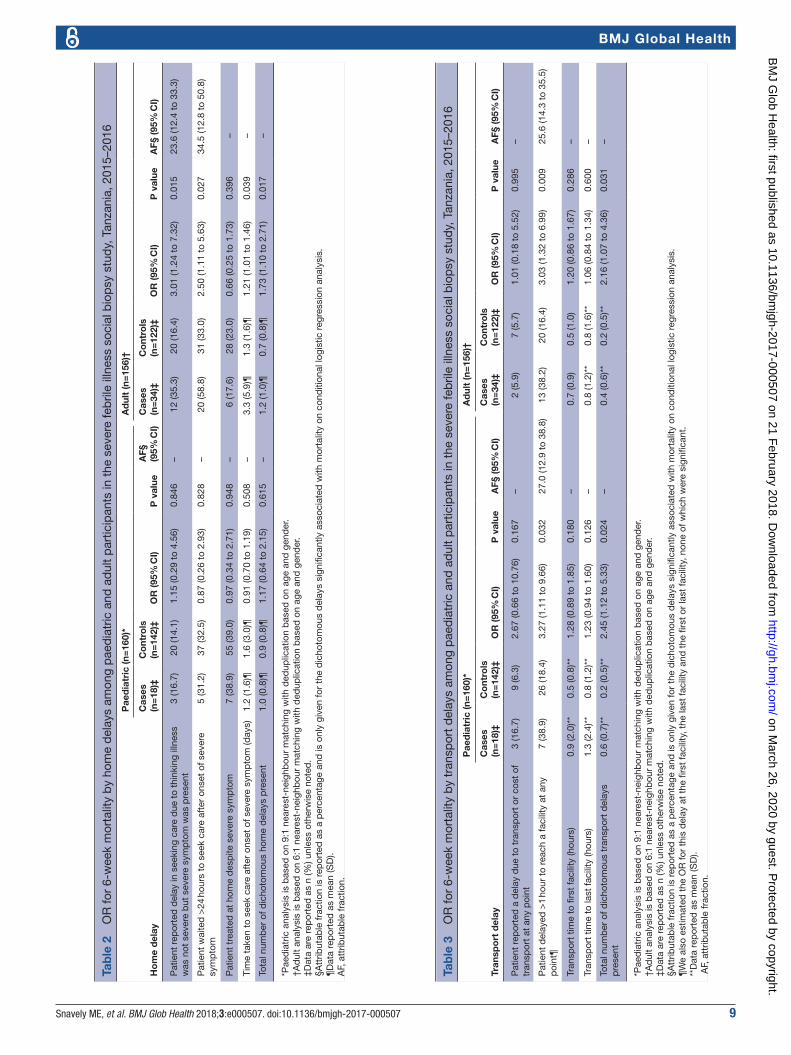
Delays at homeAmong paediatric participants, the associations between delays at home and mortality were not statistically signif-icant (table 2). Among adults, a delay in care-seeking due to not recognising a severe symptom was associated with mortality (OR: 3.01; 95% CI 1.24 to 7.32; AF: 23.6%; 95% CI 12.4% to 33.3%). Waiting >24 hours to seek care after the onset of a severe symptom was also associated with increased odds of mortality (OR: 2.50; 95% CI 1.11 to 5.63; AF: 34.5%; 95% CI 12.8% to 50.8%). Analysed as a continuous variable, each additional day between the onset of a severe symptom and the first attempt to seek care was associated with mortality (OR: 1.21; 95% CI 1.01 to 1.46). Of the three home delays (box 1), each addi-tional delay present had an OR of 1.73 (95% CI 1.10 to 2.71) for mortality.
on March 26, 2020 by guest. P
rotected by copyright.http://gh.bm
j.com/
BM
J Glob H
ealth: first published as 10.1136/bmjgh-2017-000507 on 21 F
ebruary 2018. Dow
nloaded from
Snavely ME, et al. BMJ Glob Health 2018;3:e000507. doi:10.1136/bmjgh-2017-000507 5
BMJ Global Health
Table 1A Background characteristics and prevalence of severe symptoms for 475 paediatric participants in the severe febrile illness social biopsy study, Tanzania, 2015–2016.
Characteristic Total (n=475) Cases (n=18)Survivors (n=457) P value†
Matched on age and gender*
Controls (n=142) P value‡
Age (years) 2.2 (2.5)§ 1.8 (2.2)§ 2.2 (2.5)§ 0.524 1.9 (2.2)§ 0.791
Duration of illness at time of enrolment (days)
6.6 (5.2)§ 12.4 (13.0)§ 6.4 (4.5)§ <0.001 6.6 (5.1)§ <0.001
Gender
Female 205 (43.2) 10 (55.6) 195 (42.7) 0.283 75 (52.8) 0.826
Admitting hospital
KCMC 251 (52.8) 13 (72.2) 238 (52.1) 77 (54.2)
MRRH 224 (47.2) 5 (27.8) 219 (47.9) 0.093 65 (45.8) 0.147
Tribe
Chagga 232 (48.8) 6 (33.3) 226 (49.5) 57 (40.1)
Pare 61 (12.8) 5 (27.8) 56 (12.3) 24 (16.9)
Maasai 16 (3.4) 0 (0.0) 16 (3.5) 5 (3.5)
Other 166 (34.9) 7 (38.9) 159 (34.8) 0.180 56 (39.4) 0.601
Education¶
None 11 (2.3) 1 (5.6) 10 (2.2) 4 (2.8)
Primary (1–7 years) 226 (47.8) 10 (55.6) 216 (47.5) 65 (46.1)
Secondary (8–11 years) 152 (32.1) 6 (33.3) 146 (32.1) 53 (37.6)
High school (12–13 years) 2 (0.4) 0 (0.0) 2 (0.4) 0 (0.0)
University/college 82 (17.3) 1 (5.6) 81 (17.8) 0.616 19 (13.5) 0.670
Home region
Kilimanjaro 427 (90.1) 14 (77.8) 413 (90.6) 130 (91.5)
Other 47 (9.9) 4 (22.2) 43 (9.4) 0.075 12 (8.5) 0.067
Urban status**
Urban 258 (64.7) 6 (46.2) 252 (65.3) 84 (69.4)
Mixed 22 (5.5) 1 (7.7) 21 (5.4) 5 (4.1)
Rural 119 (29.8) 6 (46.2) 113 (29.3) 0.363 32 (26.4) 0.236
Self-reported HIV status
Positive 4 (0.8) 0 (0.0) 4 (0.9) 0.690 142 (100.0) 1.000
Recent hospitalisation (previous 12 months)
Yes 174 (36.6) 10 (55.6) 164 (35.9) 0.089 46 (32.4) 0.052
Has health insurance
Yes 89 (18.7) 1 (5.6) 88 (19.3) 0.144 28 (19.7) 0.142
Severe symptoms on entering health system
Lethargy 87 (18.3) 5 (27.8) 82 (17.9) 0.290 26 (18.3) 0.338
Inability to drink 48 (10.1) 4 (22.2) 44 (9.6) 0.082 17 (12) 0.225
Convulsions 79 (16.6) 6 (33.3) 73 (16) 0.052 23 (16.2) 0.075
Vomiting 244 (51.5) 10 (55.6) 234 (51.3) 0.724 68 (47.9) 0.540
Stiff neck 12 (2.5) 0 (0) 12 (2.6) 0.486 3 (2.1) 0.534
Severe skin pustules†† 10 (4.9) 0 (0) 10 (5.1) 0.487 4 (6.1) 0.448
Less movement†† 185 (89.8) 9 (100) 176 (89.3) 0.301 61 (92.4) 0.393
Chest indrawing†† 35 (17.2) 5 (55.6) 30 (15.4) 0.002 11 (16.7) 0.008
Pus draining from ear†† 1 (0.5) 0 (0) 1 (0.5) 0.830 1 (1.5) 0.710
Continued
on March 26, 2020 by guest. P
rotected by copyright.http://gh.bm
j.com/
BM
J Glob H
ealth: first published as 10.1136/bmjgh-2017-000507 on 21 F
ebruary 2018. Dow
nloaded from
6 Snavely ME, et al. BMJ Glob Health 2018;3:e000507. doi:10.1136/bmjgh-2017-000507
BMJ Global Health
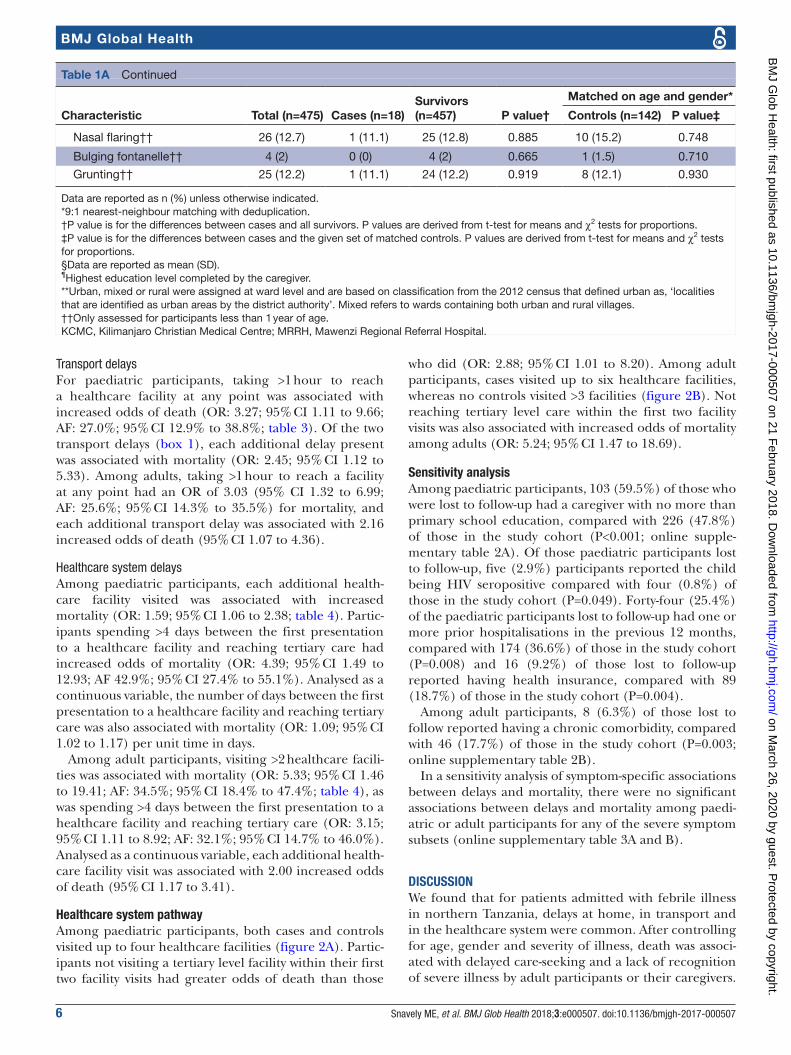
Transport delaysFor paediatric participants, taking >1 hour to reach a healthcare facility at any point was associated with increased odds of death (OR: 3.27; 95% CI 1.11 to 9.66; AF: 27.0%; 95% CI 12.9% to 38.8%; table 3). Of the two transport delays (box 1), each additional delay present was associated with mortality (OR: 2.45; 95% CI 1.12 to 5.33). Among adults, taking >1 hour to reach a facility at any point had an OR of 3.03 (95% CI 1.32 to 6.99; AF: 25.6%; 95% CI 14.3% to 35.5%) for mortality, and each additional transport delay was associated with 2.16 increased odds of death (95% CI 1.07 to 4.36).
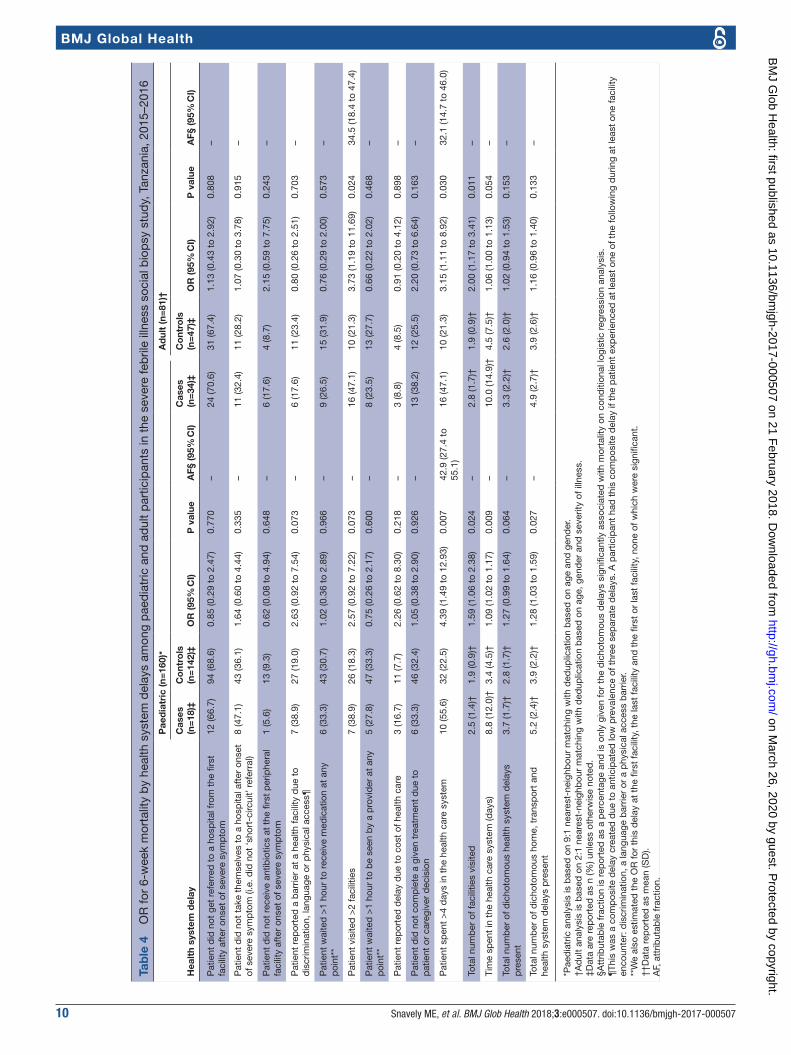
Healthcare system delaysAmong paediatric participants, each additional health-care facility visited was associated with increased mortality (OR: 1.59; 95% CI 1.06 to 2.38; table 4). Partic-ipants spending >4 days between the first presentation to a healthcare facility and reaching tertiary care had increased odds of mortality (OR: 4.39; 95% CI 1.49 to 12.93; AF 42.9%; 95% CI 27.4% to 55.1%). Analysed as a continuous variable, the number of days between the first presentation to a healthcare facility and reaching tertiary care was also associated with mortality (OR: 1.09; 95% CI 1.02 to 1.17) per unit time in days.
Among adult participants, visiting >2 healthcare facili-ties was associated with mortality (OR: 5.33; 95% CI 1.46 to 19.41; AF: 34.5%; 95% CI 18.4% to 47.4%; table 4), as was spending >4 days between the first presentation to a healthcare facility and reaching tertiary care (OR: 3.15; 95% CI 1.11 to 8.92; AF: 32.1%; 95% CI 14.7% to 46.0%). Analysed as a continuous variable, each additional health-care facility visit was associated with 2.00 increased odds of death (95% CI 1.17 to 3.41).
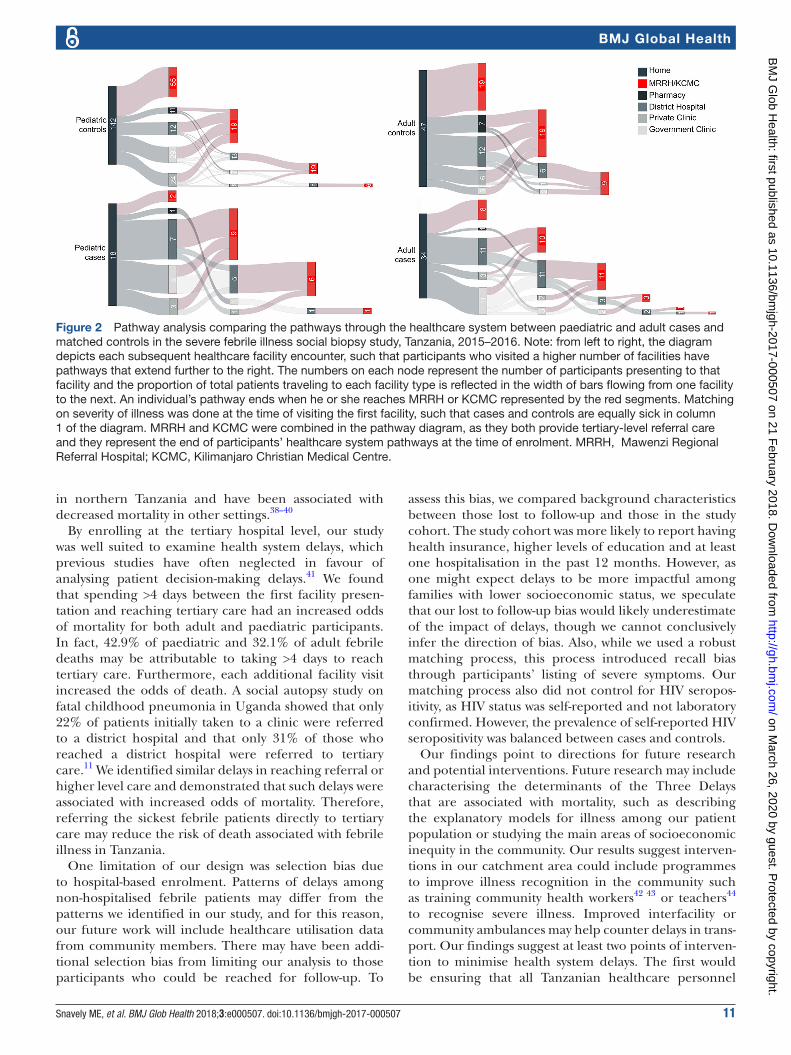
Healthcare system pathwayAmong paediatric participants, both cases and controls visited up to four healthcare facilities (figure 2A). Partic-ipants not visiting a tertiary level facility within their first two facility visits had greater odds of death than those
who did (OR: 2.88; 95% CI 1.01 to 8.20). Among adult participants, cases visited up to six healthcare facilities, whereas no controls visited >3 facilities (figure 2B). Not reaching tertiary level care within the first two facility visits was also associated with increased odds of mortality among adults (OR: 5.24; 95% CI 1.47 to 18.69).
sensitivity analysisAmong paediatric participants, 103 (59.5%) of those who were lost to follow-up had a caregiver with no more than primary school education, compared with 226 (47.8%) of those in the study cohort (P<0.001; online supple-mentary table 2A). Of those paediatric participants lost to follow-up, five (2.9%) participants reported the child being HIV seropositive compared with four (0.8%) of those in the study cohort (P=0.049). Forty-four (25.4%) of the paediatric participants lost to follow-up had one or more prior hospitalisations in the previous 12 months, compared with 174 (36.6%) of those in the study cohort (P=0.008) and 16 (9.2%) of those lost to follow-up reported having health insurance, compared with 89 (18.7%) of those in the study cohort (P=0.004).
Among adult participants, 8 (6.3%) of those lost to follow reported having a chronic comorbidity, compared with 46 (17.7%) of those in the study cohort (P=0.003; online supplementary table 2B).
In a sensitivity analysis of symptom-specific associations between delays and mortality, there were no significant associations between delays and mortality among paedi-atric or adult participants for any of the severe symptom subsets (online supplementary table 3A and B).
dIsCussIonWe found that for patients admitted with febrile illness in northern Tanzania, delays at home, in transport and in the healthcare system were common. After controlling for age, gender and severity of illness, death was associ-ated with delayed care-seeking and a lack of recognition of severe illness by adult participants or their caregivers.
Characteristic Total (n=475) Cases (n=18)Survivors (n=457) P value†
Matched on age and gender*
Controls (n=142) P value‡
Nasal flaring†† 26 (12.7) 1 (11.1) 25 (12.8) 0.885 10 (15.2) 0.748
Bulging fontanelle†† 4 (2) 0 (0) 4 (2) 0.665 1 (1.5) 0.710
Grunting†† 25 (12.2) 1 (11.1) 24 (12.2) 0.919 8 (12.1) 0.930
Data are reported as n (%) unless otherwise indicated.*9:1 nearest-neighbour matching with deduplication.†P value is for the differences between cases and all survivors. P values are derived from t-test for means and χ2 tests for proportions.‡P value is for the differences between cases and the given set of matched controls. P values are derived from t-test for means and χ2 tests for proportions.§Data are reported as mean (SD).¶Highest education level completed by the caregiver.**Urban, mixed or rural were assigned at ward level and are based on classification from the 2012 census that defined urban as, ‘localities that are identified as urban areas by the district authority’. Mixed refers to wards containing both urban and rural villages.††Only assessed for participants less than 1 year of age.KCMC, Kilimanjaro Christian Medical Centre; MRRH, Mawenzi Regional Referral Hospital.
Table 1A Continued
on March 26, 2020 by guest. P
rotected by copyright.http://gh.bm
j.com/
BM
J Glob H
ealth: first published as 10.1136/bmjgh-2017-000507 on 21 F
ebruary 2018. Dow
nloaded from
Snavely ME, et al. BMJ Glob Health 2018;3:e000507. doi:10.1136/bmjgh-2017-000507 7
BMJ Global Health
Table 1B Background characteristics and prevalence of severe symptoms for 260 adult participants in the severe febrile illness social biopsy study, Tanzania, 2015–2016.
Characteristic Total (n=260) Cases (n=34)Survivors (n=226) P value‡
Matched on age and gender*
Matched on age, gender and severity of illness†
Controls (n=122) P value§
Controls (n=47) P value§
Age (years) 40.3 (17.9)¶ 47.6 (20.4)¶ 39.2 (17.2)¶ 0.011 44.5 (18.2)¶ 0.402 43.1 (18.6)¶ 0.306
Duration of illness at time of enrolment (days)
9.6 (10.4)¶ 15.1 (16.0)¶ 8.8 (9.0)¶ 0.001 8.2 (7.8)¶ 0.001 9.7 (12.9)¶ 0.103
Gender
Female 118 (45.9) 13 (38.2) 105 (47.1) 0.335 51 (41.8) 0.708 14 (29.8) 0.426
Admitting hospital
KCMC 112 (43.1) 22 (64.7) 90 (39.8) 51 (41.8) 22 (46.8)
MRRH 148 (56.9) 12 (35.3) 136 (60.2) 0.006 71 (58.2) 0.018 25 (53.2) 0.111
Tribe
Chagga 136 (52.3) 17 (50) 119 (52.7) 71 (58.2) 23 (48.9)
Pare 41 (15.8) 7 (20.6) 34 (15.0) 15 (12.3) 7 (14.9)
Maasai 4 (1.5) 0 (0.0) 4 (1.8) 2 (1.6) 1 (2.1)
Other 79 (30.4) 10 (29.4) 69 (30.5) 0.746 34 (27.9) 0.533 16 (34) 0.746
Education**
None 7 (2.7) 1 (2.9) 6 (2.7) 3 (2.5) 1 (2.1)
Primary (1–7 years) 159 (61.2) 23 (67.6) 136 (60.2) 82 (67.2) 29 (61.7)
Secondary (8–11 years)
57 (21.9) 9 (26.5) 48 (21.2) 18 (14.8) 9 (19.1)
High school (12–13 years)
6 (2.3) 0 (0.0) 6 (2.7) 4 (3.3) 3 (6.4)
University/college 31 (11.9) 1 (2.9) 30 (13.3) 0.380 15 (12.3) 0.238 5 (10.6) 0.356
Home region
Kilimanjaro 217 (83.5) 25 (73.5) 192 (85.0) 110 (90.2) 40 (85.1)
Other 43 (16.5) 9 (26.5) 34 (15.0) 0.095 12 (9.8) 0.012 7 (14.9) 0.197
Urban status††
Urban 104 (54.7) 6 (35.3) 98 (56.6) 55 (56.7) 21 (60.0)
Mixed 6 (3.2) 1 (5.9) 5 (2.9) 1 (1.0) 0 (0.0)
Rural 80 (42.1) 10 (58.8) 70 (40.5) 0.227 41 (42.3) 0.131 14 (40.0) 0.118
Self-reported HIV status
Positive 42 (16.2) 6 (17.6) 36 (15.9) 0.800 20 (16.4) 0.862 7 (14.9) 0.739
Recent hospitalisation (previous 12 months)
Yes 72 (27.7) 9 (26.5) 63 (27.9) 0.864 35 (28.7) 0.799 13 (27.7) 0.905
Has health insurance
Yes 61 (23.6) 6 (17.6) 55 (24.4) 0.384 31 (25.6) 0.335 13 (27.7) 0.294
Marital status
Married 160 (62.3) 23 (67.6) 137 (61.4) 0.486 88 (72.7) 0.562 30 (65.2) 0.820
Occupation
Farmer 69 (26.5) 12 (35.3) 57 (25.2) 35 (28.7) 16 (34.0)
Student 37 (14.2) 5 (14.7) 32 (14.2) 16 (13.1) 8 (17.0)
Merchant 43 (16.5) 2 (5.9) 41 (18.1) 21 (17.2) 4 (8.5)
Labourer 37 (14.2) 6 (17.6) 31 (13.7) 0.521 15 (12.3) 0.644 4 (8.5) 0.833
Continued
on March 26, 2020 by guest. P
rotected by copyright.http://gh.bm
j.com/
BM
J Glob H
ealth: first published as 10.1136/bmjgh-2017-000507 on 21 F
ebruary 2018. Dow
nloaded from
8 Snavely ME, et al. BMJ Glob Health 2018;3:e000507. doi:10.1136/bmjgh-2017-000507
BMJ Global Health
Mortality was also higher among paediatric and adult participants who experienced delays in transport and delays in reaching tertiary level care. Presenting to multiple lower-level healthcare facilities was associated with increased odds of death and may be one reason for delayed presentations to tertiary-level care. The findings in this ‘social biopsy’ study suggest that community educa-tion regarding severe symptom recognition, improved transport infrastructure and ensuring rapid referrals to tertiary level facilities may help prevent deaths from febrile illnesses.
Delays at home were associated with increased odds of mortality among adult but not paediatric partici-pants. The distinction between the effects of paediatric and adult delays is important for two reasons. First, social autopsy studies have reported the importance of delays at home among fatal paediatric illness. A study in Uganda found that 42% of 174 fatal childhood illnesses had delayed seeking care for >24 hours after the onset of a severe symptom.12 In Ghana, it was shown that 50% of 264 severe childhood illness were not recognised as severe.34 However, we have demonstrated that delays at home were common in both fatal and non-fatal paedi-atric febrile illnesses, yet they did not increase the odds
of death and thus may not be the most important targets for intervention. Second, social autopsy studies have not focused on non-maternal adults. We found that delayed care-seeking due to a lack of severe illness recognition is associated with mortality among adults. This association suggests that >30% of febrile deaths among working-age adults might be prevented through education about the severe symptoms that should prompt care-seeking.
We found that a delay >1 hour in reaching a facility at any point during an illness increased the odds of mortality among paediatric and adult participants. Several social autopsy studies have found transport delays to be common.12 14 35–37 However, these studies only considered transport delays to the first or last facility. When we limited our analysis to the first or last facility, the association between >1 hour delay and mortality was not significant. We also found that each additional trans-port delay was associated with increased odds of death. Thus, the association of transport delays with mortality was additive and delays in transport to facilities between the first and last were associated with mortality. An initial intervention may be to strengthen referral transporta-tion infrastructure, which could be followed by commu-nity ambulance services, which currently are unavailable
Characteristic Total (n=260) Cases (n=34)Survivors (n=226) P value‡
Matched on age and gender*
Matched on age, gender and severity of illness†
Controls (n=122) P value§
Controls (n=47) P value§
Has chronic comorbidity
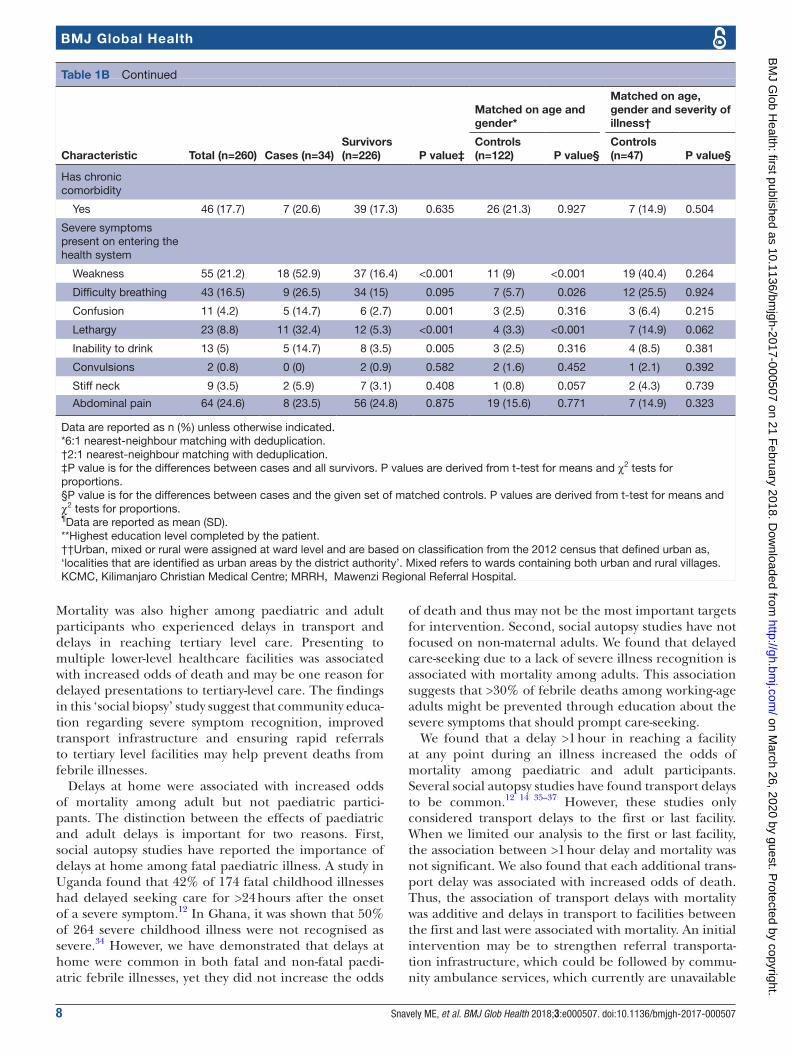
Yes 46 (17.7) 7 (20.6) 39 (17.3) 0.635 26 (21.3) 0.927 7 (14.9) 0.504
Severe symptoms present on entering the health system
Weakness 55 (21.2) 18 (52.9) 37 (16.4) <0.001 11 (9) <0.001 19 (40.4) 0.264
Difficulty breathing 43 (16.5) 9 (26.5) 34 (15) 0.095 7 (5.7) 0.026 12 (25.5) 0.924
Confusion 11 (4.2) 5 (14.7) 6 (2.7) 0.001 3 (2.5) 0.316 3 (6.4) 0.215
Lethargy 23 (8.8) 11 (32.4) 12 (5.3) <0.001 4 (3.3) <0.001 7 (14.9) 0.062
Inability to drink 13 (5) 5 (14.7) 8 (3.5) 0.005 3 (2.5) 0.316 4 (8.5) 0.381
Convulsions 2 (0.8) 0 (0) 2 (0.9) 0.582 2 (1.6) 0.452 1 (2.1) 0.392
Stiff neck 9 (3.5) 2 (5.9) 7 (3.1) 0.408 1 (0.8) 0.057 2 (4.3) 0.739
Abdominal pain 64 (24.6) 8 (23.5) 56 (24.8) 0.875 19 (15.6) 0.771 7 (14.9) 0.323
Data are reported as n (%) unless otherwise indicated.*6:1 nearest-neighbour matching with deduplication.†2:1 nearest-neighbour matching with deduplication.‡P value is for the differences between cases and all survivors. P values are derived from t-test for means and χ2 tests for proportions.§P value is for the differences between cases and the given set of matched controls. P values are derived from t-test for means and χ2 tests for proportions.¶Data are reported as mean (SD).**Highest education level completed by the patient.††Urban, mixed or rural were assigned at ward level and are based on classification from the 2012 census that defined urban as, ‘localities that are identified as urban areas by the district authority’. Mixed refers to wards containing both urban and rural villages.KCMC, Kilimanjaro Christian Medical Centre; MRRH, Mawenzi Regional Referral Hospital.
Table 1B Continued
on March 26, 2020 by guest. P
rotected by copyright.http://gh.bm
j.com/
BM
J Glob H
ealth: first published as 10.1136/bmjgh-2017-000507 on 21 F
ebruary 2018. Dow
nloaded from
Snavely ME, et al. BMJ Glob Health 2018;3:e000507. doi:10.1136/bmjgh-2017-000507 9
BMJ Global Health
Tab
le 2
O
R fo
r 6-
wee
k m
orta
lity
by
hom
e d
elay
s am
ong
pae
dia
tric
and
ad
ult
par
ticip
ants
in t
he s
ever
e fe
bril
e ill
ness
soc
ial b
iop
sy s
tud
y, T
anza
nia,
201
5–20
16
Ho
me
del
ay
Pae
dia
tric
(n=
160)
*A
dul
t (n
=15
6)†
Cas
es
(n=
18)‡
Co
ntro
ls
(n=
142)
‡O
R (9
5% C
I)P
val
ueA
F§
(95%
CI)
Cas
es
(n=
34)‡
Co
ntro
ls
(n=
122)
‡O
R (9
5% C
I)P
val
ueA
F§ (9
5% C
I)
Pat
ient
rep
orte
d d
elay
in s
eeki
ng c
are
due
to
thin
king
illn
ess
was
not
sev
ere
but
sev
ere
sym
pto
m w
as p
rese
nt3
(16.
7)20
(14.
1)1.
15 (0
.29
to 4
.56)
0.84
6–
12 (3
5.3)
20 (1
6.4)
3.01
(1.2
4 to
7.3
2)0.
015
23.6
(12.
4 to
33.
3)
Pat
ient
wai
ted
>24
hou
rs t
o se
ek c
are
afte
r on
set
of s
ever
e sy
mp
tom
5 (3
1.2)
37 (3
2.5)
0.87
(0.2
6 to
2.9
3)0.
828
– 20
(58.
8)31
(33.
0)2.
50 (1
.11
to 5
.63)
0.02
734
.5 (1
2.8
to 5
0.8)
Pat
ient
tre
ated
at
hom
e d
esp
ite s
ever
e sy
mp
tom
7 (3
8.9)
55 (3
9.0)
0.97
(0.3
4 to
2.7
1)0.
948
– 6
(17.
6)28
(23.
0)0.
66 (0
.25
to 1
.73)
0.39
6–
Tim
e ta
ken
to s
eek
care
aft
er o
nset
of s
ever
e sy
mp
tom
(day
s)1.
2 (1
.6)¶
1.6
(3.0
)¶
0.91
(0.7
0 to
1.1
9)0.
508
– 3.
3 (5
.9)¶
1.3
(1.6
)¶1.
21 (1
.01
to 1
.46)
0.03
9–
Tota
l num
ber
of d
icho
tom
ous
hom
e d
elay
s p
rese
nt1.
0 (0
.8)¶
0.
9 (0
.8)¶
1.
17 (0
.64
to 2
.15)
0.61
5–
1.2
(1.0
)¶0.
7 (0
.8)¶
1.73
(1.1
0 to
2.7
1)0.
017
–
*Pae
dia
tric
ana
lysi
s is
bas
ed o
n 9:
1 ne
ares
t-ne
ighb
our
mat
chin
g w
ith d
edup
licat
ion
bas
ed o
n ag
e an
d g
end
er.
†Ad
ult
anal
ysis
is b
ased
on
6:1
near
est-
neig
hbou
r m
atch
ing
with
ded
uplic
atio
n b
ased
on
age
and
gen
der
.‡D
ata
are
rep
orte
d a
s n
(%) u
nles
s ot
herw
ise
note
d.
§Att
ribut
able
frac
tion
is r
epor
ted
as
a p
erce
ntag
e an
d is
onl
y gi
ven
for
the
dic
hoto
mou
s d
elay
s si
gnifi
cant
ly a
ssoc
iate
d w
ith m
orta
lity
on c
ond
ition
al lo
gist
ic r
egre
ssio
n an
alys
is.
¶D
ata
rep
orte
d a
s m
ean
(SD
).A
F, a
ttrib
utab
le fr
actio
n.
Tab
le 3
O
R fo
r 6-
wee
k m
orta
lity
by
tran
spor
t d
elay
s am
ong
pae
dia
tric
and
ad
ult
par
ticip
ants
in t
he s
ever
e fe
bril
e ill
ness
soc
ial b
iop
sy s
tud
y, T
anza
nia,
201
5–20
16
Tran
spo
rt d
elay
Pae
dia
tric
(n=
160)
*A
dul
t (n
=15
6)†
Cas
es
(n=
18)‡
Co
ntro
ls
(n=
142)
‡O
R (9
5% C
I)P
val
ueA
F§ (9
5% C
I)C
ases
(n
=34
)‡C
ont
rols
(n
=12
2)‡
OR
(95%
CI)
P v
alue
AF§
(95%
CI)
Pat
ient
rep
orte
d a
del
ay d
ue t
o tr
ansp
ort
or c
ost
of
tran
spor
t at
any
poi
nt3
(16.
7)9
(6.3
)2.
67 (0
.66
to 1
0.76
)0.
167
–2
(5.9
)7
(5.7
)1.
01 (0
.18
to 5
.52)
0.99
5–
Pat
ient
del
ayed
>1
hour
to
reac
h a
faci
lity
at a
ny
poi
nt¶
7 (3
8.9)
26 (1
8.4)
3.27
(1.1
1 to
9.6
6)0.
032
27.0
(12.
9 to
38.
8)13
(38.
2)20
(16.
4)3.
03 (1
.32
to 6
.99)
0.00
925
.6 (1
4.3
to 3
5.5)
Tran
spor
t tim
e to
firs
t fa
cilit
y (h
ours
)0.
9 (2
.0)*
*0.
5 (0
.8)*
*1.
28 (0
.89
to 1
.85)
0.18
0–
0.7
(0.9
)0.
5 (1
.0)
1.20
(0.8
6 to
1.6
7)0.
286
–
Tran
spor
t tim
e to
last
faci
lity
(hou
rs)
1.3
(2.4
)**
0.8
(1.2
)**
1.23
(0.9
4 to
1.6
0)0.
126
– 0.
8 (1
.2)*
*0.
8 (1
.6)*
*1.
06 (0
.84
to 1
.34)
0.60
0–
Tota
l num
ber
of d
icho
tom
ous
tran
spor
t d
elay
s p
rese
nt0.
6 (0
.7)*
*0.
2 (0
.5)*
*2.
45 (1
.12
to 5
.33)
0.02
4–
0.4
(0.6
)**
0.2
(0.5
)**
2.16
(1.0
7 to
4.3
6)0.
031
–
*Pae
dia
tric
ana
lysi
s is
bas
ed o
n 9:
1 ne
ares
t-ne
ighb
our
mat
chin
g w
ith d
edup
licat
ion
bas
ed o
n ag
e an
d g
end
er.
†Ad
ult
anal
ysis
is b
ased
on
6:1
near
est-
neig
hbou
r m
atch
ing
with
ded
uplic
atio
n b
ased
on
age
and
gen
der
.‡D
ata
are
rep
orte
d a
s n
(%) u
nles
s ot
herw
ise
note
d.
§Att
ribut
able
frac
tion
is r
epor
ted
as
a p
erce
ntag
e an
d is
onl
y gi
ven
for
the
dic
hoto
mou
s d
elay
s si
gnifi
cant
ly a
ssoc
iate
d w
ith m
orta
lity
on c
ond
ition
al lo
gist
ic r
egre
ssio
n an
alys
is.
¶W
e al
so e
stim
ated
the
OR
for
this
del
ay a
t th
e fir
st fa
cilit
y, t
he la
st fa
cilit
y an
d t
he fi
rst
or la
st fa
cilit
y, n
one
of w
hich
wer
e si
gnifi
cant
.**
Dat
a re
por
ted
as
mea
n (S
D).
AF,
att
ribut
able
frac
tion.
on March 26, 2020 by guest. P
rotected by copyright.http://gh.bm
j.com/
BM
J Glob H
ealth: first published as 10.1136/bmjgh-2017-000507 on 21 F
ebruary 2018. Dow
nloaded from
10 Snavely ME, et al. BMJ Glob Health 2018;3:e000507. doi:10.1136/bmjgh-2017-000507
BMJ Global Health
Tab
le 4
O
R fo
r 6-
wee
k m
orta
lity
by
heal
th s
yste
m d
elay
s am
ong
pae
dia
tric
and
ad
ult
par
ticip
ants
in t
he s
ever
e fe
bril
e ill
ness
soc
ial b
iop
sy s
tud
y, T
anza
nia,
201
5–20
16
Hea
lth
syst
em d
elay
Pae
dia
tric
(n=
160)
*A
dul
t (n
=81
)†
Cas
es
(n=
18)‡
Co
ntro
ls
(n=
142)
‡O
R (9
5% C
I)P
val
ueA
F§ (9
5% C
I)C
ases
(n
=34
)‡C
ont
rols
(n
=47
)‡O
R (9
5% C
I)P
val
ueA
F§ (9
5% C
I)
Pat
ient
did
not
get
ref
erre
d t
o a
hosp
ital f
rom
the
firs
t fa
cilit
y af
ter
onse
t of
sev
ere
sym
pto
m
12 (6
6.7)
94 (6
8.6)
0.85
(0.2
9 to
2.4
7)0.
770
–24
(70.
6)31
(67.
4)1.
13 (0
.43
to 2
.92)
0.80
8–
Pat
ient
did
not
tak
e th
emse
lves
to
a ho
spita
l aft
er o
nset
of
sev
ere
sym
pto
m (i
.e. d
id n
ot ‘s
hort
-circ
uit’
ref
erra
l) 8
(47.
1)43
(36.
1)1.
64 (0
.60
to 4
.44)
0.33
5–
11 (3
2.4)
11 (2
8.2)
1.07
(0.3
0 to
3.7
8)0.
915
–
Pat
ient
did
not
rec
eive
ant
ibio
tics
at t
he fi
rst
per
iphe
ral
faci
lity
afte
r on
set
of s
ever
e sy
mp
tom
1
(5.6
)13
(9.3
)0.
62 (0
.08
to 4
.94)
0.64
8–
6 (1
7.6)
4 (8
.7)
2.15
(0.5
9 to
7.7
5)0.
243
–
Pat
ient
rep
orte
d a
bar
rier
at a
hea
lth fa
cilit
y d
ue t
o d
iscr
imin
atio
n, la
ngua
ge o
r p
hysi
cal a
cces
s¶
7 (3
8.9)
27 (1
9.0)
2.63
(0.9
2 to
7.5
4)0.
073
– 6
(17.
6)11
(23.
4)0.
80 (0
.26
to 2
.51)
0.70
3–
Pat
ient
wai
ted
>1
hour
to
rece
ive
med
icat
ion
at a
ny
poi
nt**
6
(33.
3)43
(30.
7)1.
02 (0
.36
to 2
.89)
0.96
6–
9 (2
6.5)
15 (3
1.9)
0.76
(0.2
9 to
2.0
0)0.
573
–
Pat
ient
vis
ited
>2
faci
litie
s 7
(38.
9)26
(18.
3)2.
57 (0
.92
to 7
.22)
0.07
3–
16 (4
7.1)
10 (2
1.3)
3.73
(1.1
9 to
11.
69)
0.02
434
.5 (1
8.4
to 4
7.4)
Pat
ient
wai
ted
>1
hour
to
be
seen
by
a p
rovi
der
at
any
poi
nt**
5
(27.
8)47
(33.
3)0.
75 (0
.26
to 2
.17)
0.60
0–
8 (2
3.5)
13 (2
7.7)
0.66
(0.2
2 to
2.0
2)0.
468
–
Pat
ient
rep
orte
d d
elay
due
to
cost
of h
ealth
car
e 3
(16.
7)11
(7.7
)2.
26 (0
.62
to 8
.30)
0.21
8–
3 (8
.8)
4 (8
.5)
0.91
(0.2
0 to
4.1
2)0.
898
–
Pat
ient
did
not
com
ple
te a
giv
en t
reat
men
t d
ue t
o p
atie
nt o
r ca
regi
ver
dec
isio
n 6
(33.
3)46
(32.
4)1.
05 (0
.38
to 2
.90)
0.92
6–
13 (3
8.2)
12 (2
5.5)
2.20
(0.7
3 to
6.6
4)0.
163
–
Pat
ient
sp
ent
>4
day
s in
the
hea
lth c
are
syst
em
10 (5
5.6)
32 (2
2.5)
4.39
(1.4
9 to
12.
93)
0.00
742
.9 (2
7.4
to
55.1
)16
(47.
1)10
(21.
3)3.
15 (1
.11
to 8
.92)
0.03
032
.1 (1
4.7
to 4
6.0)
Tota
l num
ber
of f
acili
ties
visi
ted
2.
5 (1
.4)†
1.9
(0.9
)†1.
59 (1
.06
to 2
.38)
0.02
4–
2.8
(1.7
)†1.
9 (0
.9)†
2.00
(1.1
7 to
3.4
1)0.
011
–
Tim
e sp
ent
in t
he h
ealth
car
e sy
stem
(day
s)
8.8
(12.
0)†
3.4
(4.5
)†1.
09 (1
.02
to 1
.17)
0.00
9–
10.0
(14.
9)†
4.5
(7.5
)†1.
06 (1
.00
to 1
.13)
0.05
4–
Tota
l num
ber
of d
icho
tom
ous
heal
th s
yste
m d
elay
s p
rese
nt
3.7
(1.7
)†2.
8 (1
.7)†
1.27
(0.9
9 to
1.6
4)0.
064
– 3.
3 (2
.2)†
2.6
(2.0
)†1.
02 (0
.94
to 1
.53)
0.15
3–
Tota
l num
ber
of d
icho
tom
ous
hom
e, t
rans
por
t an
d
heal
th s
yste
m d
elay
s p
rese
nt
5.2
(2.4
)†3.
9 (2
.2)†
1.28
(1.0
3 to
1.5
9)0.
027
– 4.
9 (2
.7)†
3.9
(2.6
)†1.
16 (0
.96
to 1
.40)
0.13
3–
*Pae
dia
tric
ana
lysi
s is
bas
ed o
n 9:
1 ne
ares
t-ne
ighb
our
mat
chin
g w
ith d
edup
licat
ion
bas
ed o
n ag
e an
d g
end
er.
†Ad
ult
anal
ysis
is b
ased
on
2:1
near
est-
neig
hbou
r m
atch
ing
with
ded
uplic
atio
n b
ased
on
age,
gen
der
and
sev
erity
of i
llnes
s.‡D
ata
are
rep
orte
d a
s n
(%) u
nles
s ot
herw
ise
note
d.
§Att
ribut
able
frac
tion
is r
epor
ted
as
a p
erce
ntag
e an
d is
onl
y gi
ven
for
the
dic
hoto
mou
s d
elay
s si
gnifi
cant
ly a
ssoc
iate
d w
ith m
orta
lity
on c
ond
ition
al lo
gist
ic r
egre
ssio
n an
alys
is.
¶Th
is w
as a
com
pos
ite d
elay
cre
ated
due
to
antic
ipat
ed lo
w p
reva
lenc
e of
thr
ee s
epar
ate
del
ays.
A p
artic
ipan
t ha
d t
his
com
pos
ite d
elay
if t
he p
atie
nt e
xper
ienc
ed a
t le
ast
one
of t
he fo
llow
ing
dur
ing
at le
ast
one
faci
lity
enco
unte
r: d
iscr
imin
atio
n, a
lang
uage
bar
rier
or a
phy
sica
l acc
ess
bar
rier.
**W
e al
so e
stim
ated
the
OR
for
this
del
ay a
t th
e fir
st fa
cilit
y, t
he la
st fa
cilit
y an
d t
he fi
rst
or la
st fa
cilit
y, n
one
of w
hich
wer
e si
gnifi
cant
.††
Dat
a re
por
ted
as
mea
n (S
D).
AF,
att
ribut
able
frac
tion.
on March 26, 2020 by guest. P
rotected by copyright.http://gh.bm
j.com/
BM
J Glob H
ealth: first published as 10.1136/bmjgh-2017-000507 on 21 F
ebruary 2018. Dow
nloaded from
Snavely ME, et al. BMJ Glob Health 2018;3:e000507. doi:10.1136/bmjgh-2017-000507 11
BMJ Global Health
in northern Tanzania and have been associated with decreased mortality in other settings.38–40
By enrolling at the tertiary hospital level, our study was well suited to examine health system delays, which previous studies have often neglected in favour of analysing patient decision-making delays.41 We found that spending >4 days between the first facility presen-tation and reaching tertiary care had an increased odds of mortality for both adult and paediatric participants. In fact, 42.9% of paediatric and 32.1% of adult febrile deaths may be attributable to taking >4 days to reach tertiary care. Furthermore, each additional facility visit increased the odds of death. A social autopsy study on fatal childhood pneumonia in Uganda showed that only 22% of patients initially taken to a clinic were referred to a district hospital and that only 31% of those who reached a district hospital were referred to tertiary care.11 We identified similar delays in reaching referral or higher level care and demonstrated that such delays were associated with increased odds of mortality. Therefore, referring the sickest febrile patients directly to tertiary care may reduce the risk of death associated with febrile illness in Tanzania.
One limitation of our design was selection bias due to hospital-based enrolment. Patterns of delays among non-hospitalised febrile patients may differ from the patterns we identified in our study, and for this reason, our future work will include healthcare utilisation data from community members. There may have been addi-tional selection bias from limiting our analysis to those participants who could be reached for follow-up. To
assess this bias, we compared background characteristics between those lost to follow-up and those in the study cohort. The study cohort was more likely to report having health insurance, higher levels of education and at least one hospitalisation in the past 12 months. However, as one might expect delays to be more impactful among families with lower socioeconomic status, we speculate that our lost to follow-up bias would likely underestimate of the impact of delays, though we cannot conclusively infer the direction of bias. Also, while we used a robust matching process, this process introduced recall bias through participants’ listing of severe symptoms. Our matching process also did not control for HIV seropos-itivity, as HIV status was self-reported and not laboratory confirmed. However, the prevalence of self-reported HIV seropositivity was balanced between cases and controls.
Our findings point to directions for future research and potential interventions. Future research may include characterising the determinants of the Three Delays that are associated with mortality, such as describing the explanatory models for illness among our patient population or studying the main areas of socioeconomic inequity in the community. Our results suggest interven-tions in our catchment area could include programmes to improve illness recognition in the community such as training community health workers42 43 or teachers44 to recognise severe illness. Improved interfacility or community ambulances may help counter delays in trans-port. Our findings suggest at least two points of interven-tion to minimise health system delays. The first would be ensuring that all Tanzanian healthcare personnel
Figure 2 Pathway analysis comparing the pathways through the healthcare system between paediatric and adult cases and matched controls in the severe febrile illness social biopsy study, Tanzania, 2015–2016. Note: from left to right, the diagram depicts each subsequent healthcare facility encounter, such that participants who visited a higher number of facilities have pathways that extend further to the right. The numbers on each node represent the number of participants presenting to that facility and the proportion of total patients traveling to each facility type is reflected in the width of bars flowing from one facility to the next. An individual’s pathway ends when he or she reaches MRRH or KCMC represented by the red segments. Matching on severity of illness was done at the time of visiting the first facility, such that cases and controls are equally sick in column 1 of the diagram. MRRH and KCMC were combined in the pathway diagram, as they both provide tertiary-level referral care and they represent the end of participants’ healthcare system pathways at the time of enrolment. MRRH, Mawenzi Regional Referral Hospital; KCMC, Kilimanjaro Christian Medical Centre.
on March 26, 2020 by guest. P
rotected by copyright.http://gh.bm
j.com/
BM
J Glob H
ealth: first published as 10.1136/bmjgh-2017-000507 on 21 F
ebruary 2018. Dow
nloaded from
12 Snavely ME, et al. BMJ Glob Health 2018;3:e000507. doi:10.1136/bmjgh-2017-000507
BMJ Global Health
at lower level healthcare facilities can recognise severe symptoms. The second would be strengthening referral pathways and developing explicit criteria for referral of severely ill febrile patients to tertiary care. Jointly these interventions may decrease mortality associated with febrile illness >30% in adult and >40% in paediatric patients who reach tertiary care during their illness.
In conclusion, we found that delays at home, in trans-port and in the healthcare system were associated with increased odds of death from febrile illness in northern Tanzania. Our social biopsy approach effectively measured the association between delays and mortality and could be applied in other settings to identify socio-cultural, behavioural and health system factors that contribute to fatal outcomes from febrile illnesses.
Author affiliations1Duke Global Health Institute, Duke University, Durham, North Carolina, USA2Centre for International Health, University of Otago, Dunedin, New Zealand3KCMC-Duke Collaboration, Kilimanjaro Christian Medical Centre, Moshi, Tanzania4Perelman School of Medicine, University of Pennsylvania, Philadelphia, Pennsylvania, USA5Kilimanjaro Christian Medical University College, Moshi, Tanzania6Mawenzi Regional Referral Hospital, Moshi, Tanzania7Arnold School of Public Health, University of South Carolina, Columbia, South Carolina, USA8Division of Infectious Diseases, Duke University Medical Center, Durham, North Carolina, USA
Acknowledgements We would like to thank the study participants and their families as well as the clinical staff at Mawenzi Regional Referral Hospital and Kilimanjaro Christian Medical Center. We thank Francis P Karia, Frank M Kimaro, Tumsifu G Tarimo, Luig Mbuya and Edward Mshara for their administrative and logistical support. We would also like to thank Alphonce S Mushi and Robert Chuwa for data management and Elizabeth L Turner for guidance on statistical analysis.
transparency declaration The guarantor affirms that this manuscript is an honest, accurate and transparent account of the study being reported. No important aspects of the study have been omitted. Any discrepancies from the study as planned have been explained.
Contributors Conceived and designed the study: MPR, JAC, JB and MJM. Performed the study: MJM, LN, FM, BTM, VPM, BFL, GFM and AGM. Analysed the data: MES, JO, CM, MJM and MPR. Wrote the manuscript: MES, MJM, CM, JB, BTM, VPM, JAC, JO and MPR. Sought and obtained funding: MPR, VPM, BTM and JAC. Guarantor: MES. All author contributions were made independently from any funding source.
Funding This study was supported by the US Health Resources and Services Administration through the Medical Education Partnership Initiative (T84HA21123), the US National Institutes of Allergy and Infectious Diseases through the Investigating Febrile Deaths in Tanzania (INDITe) grant (R01AI121378) and the Fogarty International Center through The Impact and Society Ecology of Bacterial Zoonoses in Northern Tanzania grant (R01TW009237). MPR received support from a National Institutes of Health Early Career Award (K23) grant (AI116869) and a Fogarty International Center Global Health Training Grant (R25TW009343). JB received support from Doris Duke International Clinical Research Fellowship. MJM received support from a University of Otago Frances G Cotter Scholarship.
Competing interests None declared.
ethics approval This study was approved by the KCMC Research Ethics Committee, the Tanzania National Institute for Medical Research National Research Ethics Coordinating Committee and an institutional review board of Duke University Health System.
Provenance and peer review Not commissioned; externally peer reviewed.
data sharing statement The full dataset and statistical code are available from the corresponding author at matthew. rubach@ duke. edu. The presented data are anonymised, and risk of identification is low.
open Access This is an Open Access article distributed in accordance with the Creative Commons Attribution Non Commercial (CC BY-NC 4.0) license, which permits others to distribute, remix, adapt, build upon this work non-commercially, and license their derivative works on different terms, provided the original work is properly cited and the use is non-commercial. See: http:// creativecommons. org/ licenses/ by- nc/ 4. 0/
© Article author(s) (or their employer(s) unless otherwise stated in the text of the article) 2018. All rights reserved. No commercial use is permitted unless otherwise expressly granted.
RefeRences 1. Prasad N, Sharples KJ, Murdoch DR, et al. Community prevalence
of fever and relationship with malaria among infants and children in low-resource areas. Am J Trop Med Hyg 2015;93:178–80.
2. Crump JA, Morrissey AB, Nicholson WL, et al. Etiology of severe non-malaria febrile illness in Northern Tanzania: a prospective cohort study. PLoS Negl Trop Dis 2013;7:e2324.
3. Wang H, Naghavi M, Allen C, et al. Global, regional, and national life expectancy, all-cause mortality, and cause-specific mortality for 249 causes of death, 1980-2015: a systematic analysis for the Global Burden of Disease Study 2015. Lancet 2016;388:1459–544.
4. Institute for Health Metrics and Evaluation (IHME). GBD Compare Data Visualization. Seattle, WA: IHME, University of Washington. http:// vizhub. healthdata. org/ gbd- compare
5. Jones G, Steketee RW, Black RE, et al. How many child deaths can we prevent this year? Lancet 2003;362:65–71.
6. Wilkinson RG, Marmot MG. Social Determinants of Health: The Solid Facts. 2nd ed: World Health Organization, 2003. http://www. euro. who. int/__ data/ assets/ pdf_ file/ 0005/ 98438/ e81384. pdf (accessed 4 Jan 2017).
7. Farmer P. Infections and Inequalities: The Modern Plagues: University of California Press, 2001.
8. Solar O, Irwin A. WHO Commision on Social Determinants of Health. A Conceptual Framework for Action on the Social Determinants of Health. 2007.
9. de Savigny D, Mayombana C, Mwageni E, et al. Care-seeking patterns for fatal malaria in Tanzania. Malar J 2004;3:27.
10. Hildenwall H, Tomson G, Kaija J, et al. "I never had the money for blood testing" - caretakers' experiences of care-seeking for fatal childhood fevers in rural Uganda - a mixed methods study. BMC Int Health Hum Rights 2008;8:12.
11. Källander K, Hildenwall H, Waiswa P, et al. Delayed care seeking for fatal pneumonia in children aged under five years in Uganda: a case-series study. Bull World Health Organ 2008;86:332–8.
12. Källander K, Kadobera D, Williams TN, et al. Social autopsy: INDEPTH Network experiences of utility, process, practices, and challenges in investigating causes and contributors to mortality. Popul Health Metr 2011;9:44.
13. Kalter HD, Salgado R, Babille M, et al. Social autopsy for maternal and child deaths: a comprehensive literature review to examine the concept and the development of the method. Popul Health Metr 2011;9:45.
14. Bensaïd K, Yaroh AG, Kalter HD, et al. Verbal/Social Autopsy in Niger 2012-2013: A new tool for a better understanding of the neonatal and child mortality situation. J Glob Health 2016;6:10602.
15. Feikin DR, Audi A, Olack B, et al. Evaluation of the optimal recall period for disease symptoms in home-based morbidity surveillance in rural and urban Kenya. Int J Epidemiol 2010;39:450–8.
16. Zafar SN, Luby SP, Mendoza C. Recall errors in a weekly survey of diarrhoea in Guatemala: determining the optimal length of recall. Epidemiol Infect 2010;138:264–9.
17. Arnold BF, Ercumen A, Benjamin-Chung J, et al. Brief report. Epidemiology 2016;27:637–41.
18. World Health Organization Dept of Child and Adolescent Health and Development. Handbook: Integrated Management of Childhood Illness (IMCI): World Health Organization, 2005.
19. World Health Organization Department of HIV. Integrated Management of Adolescent and Adult Illness: Interim Guidelines for First-Level Facility Health Workers at Health Centre and District Outpatient Clinic. WHO. 2005 http://www. who. int/ hiv/ pub/ imai/ en/ acutecarerev2_ e. pdf
20. Thaddeus S, Maine D. Too far to walk: maternal mortality in context. Soc Sci Med 1994;38:1091–110.
21. Kang CI, Song JH, Ko KS, Ks K, et al. Clinical features and outcome of Staphylococcus aureus infection in elderly versus younger adult patients. Int J Infect Dis 2011;15:e58–62.
on March 26, 2020 by guest. P
rotected by copyright.http://gh.bm
j.com/
BM
J Glob H
ealth: first published as 10.1136/bmjgh-2017-000507 on 21 F
ebruary 2018. Dow
nloaded from
Snavely ME, et al. BMJ Glob Health 2018;3:e000507. doi:10.1136/bmjgh-2017-000507 13
BMJ Global Health
22. Cooper GS, Shlaes DM, Salata RA. Intraabdominal infection: differences in presentation and outcome between younger patients and the elderly. Clin Infect Dis 1994;19:146–8.
23. Kaplan V, Angus DC, Griffin MF, et al. Hospitalized community-acquired pneumonia in the elderly: age- and sex-related patterns of care and outcome in the United States. Am J Respir Crit Care Med 2002;165:766–72.
24. Abadie A, Imbens GW. Large sample properties of matching estimators for average treatment effects. Econometrica 2006;74:235–67.
25. Abadie A, Imbens GW. Bias-corrected matching estimators for average treatment effects. J Bus Econ Stat 2011;29:1–11.
26. Austin PC. Balance diagnostics for comparing the distribution of baseline covariates between treatment groups in propensity-score matched samples. Stat Med 2009;28:3083–107.
27. Rosenbaum PR, Rubin DB. Constructing a Control Group Using Multivariate Matched Sampling Methods that Incorporate the Propensity Score. Am Stat 1985;39:33–8.
28. Normand ST, Landrum MB, Guadagnoli E, et al. Validating recommendations for coronary angiography following acute myocardial infarction in the elderly: a matched analysis using propensity scores. J Clin Epidemiol 2001;54:387–98.
29. Soundararajan K, Ho HK, Su B. Sankey diagram framework for energy and exergy flows. Appl Energy 2014;136:1035–42.
30. Schmidt M. The Sankey Diagram in Energy and Material Flow Management. J Ind Ecol 2008;12:82–94.
31. World Health Organization Country Office for Africa. Health Systems Profile: United Republic of Tanzania. 2004 http://www. afro. who. int/ index. php? option= com_ docman& task= doc_ download& gid= 2839
32. Manzi F, Schellenberg JA, Hutton G, et al. Human resources for health care delivery in Tanzania: a multifaceted problem. Hum Resour Health 2012;10:3.
33. Mubyazi G, Kamugisha M, Mushi A, et al. Implications of decentralization for the control of tropical diseases in Tanzania: a case study of four districts. Int J Health Plann Manage 2004;19(Suppl 1):S167–S185.
34. Hill Z, Kendall C, Arthur P, et al. Recognizing childhood illnesses and their traditional explanations: exploring options for care-seeking
interventions in the context of the IMCI strategy in rural Ghana. Trop Med Int Health 2003;8:668–76.
35. Koffi AK, Libite PR, Moluh S, et al. Social autopsy study identifies determinants of neonatal mortality in Doume, Nguelemendouka and Abong-Mbang health districts, Eastern Region of Cameroon. J Glob Health 2015;5:10413.
36. Kalter HD, Yaroh AG, Maina A, et al. Verbal/social autopsy study helps explain the lack of decrease in neonatal mortality in Niger, 2007-2010. J Glob Health 2016;6:10604.
37. Koffi AK, Maina A, Yaroh AG, et al. Social determinants of child mortality in Niger: Results from the 2012 National Verbal and Social Autopsy Study. J Glob Health 2016;6:10603.
38. Mathew TP, Menown IB, McCarty D, et al. Impact of pre-hospital care in patients with acute myocardial infarction compared with those first managed in-hospital. Eur Heart J 2003;24:161–71.
39. London JA, Mock CN, Quansah RE, et al. Priorities for improving hospital-based trauma care in an African city. J Trauma 2001;51:747–53.
40. Mock CN, Adzotor KE, Conklin E, et al. Trauma outcomes in the rural developing world: comparison with an urban level I trauma center. J Trauma 1993;35:518–23.
41. Knight HE, Self A, Kennedy SH. Why are women dying when they reach hospital on time? A systematic review of the 'third delay'. PLoS One 2013;8:e63846.
42. Khanal S, Sharma J, GC VS, et al. Community health workers can identify and manage possible infections in neonates and young infants: MINI--a model from Nepal. J Health Popul Nutr 2011;29:255–64.
43. Lewin S, Munabi-Babigumira S, Glenton C, et al. Lay health workers in primary and community health care for maternal and child health and the management of infectious diseases. Lewin S, ed. Cochrane database of systematic reviews. 94. Chichester, UK: John Wiley & Sons, Ltd, 2010.
44. Healthy Kids/Brighter Future. Healthy Kids/Brighter Future: Annual Report 2015-2016. 2016 http ://m edia .wix .com /ugd /db99a5_ 0bc c39983 0a64 3189 f679 3bb983d9777. pdf (accessed 6 Apr 2017).
on March 26, 2020 by guest. P
rotected by copyright.http://gh.bm
j.com/
BM
J Glob H
ealth: first published as 10.1136/bmjgh-2017-000507 on 21 F
ebruary 2018. Dow
nloaded from