Embed Size (px)
Citation preview
SOIL, FERTILIZER AND TOPOGRAPHY AFFECT
EMISSIONS OF NITROUS OXIDE AND CARBON
DIOXIDE, AND YIELD OF OIL PALM
IN INDONESIA AND MALAYSIA
January 2017
ROSNAENI SAKATA
Graduate School of Horticulture
CHIBA UNIVERSITY
(千葉大学審査学位論文)
SOIL, FERTILIZER AND TOPOGRAPHY AFFECT
EMISSIONS OF NITROUS OXIDE AND CARBON
DIOXIDE, AND YIELD OF OIL PALM
IN INDONESIA AND MALAYSIA
インドネシアとマレーシア油ヤシ農園における土壌、肥料 および地形が一酸化二窒素と二酸化炭素放出
および収量に与える影響
January 2017
ROSNAENI SAKATA
Graduate School of Horticulture
CHIBA UNIVERSITY
iii
Acknowledgments
I would like to express the deepest appreciation to my academic supervisor
Professor Kazuyuki Inubushi, at Bioresource Science, Graduate School of Horticulture,
Chiba University, Japan. He continually and generously spared his time counseling and
guiding me in regard to my research. This thesis would not have been possible without
his supervision and constant mentorship.
Besides my academic supervisor, I would like to thank to my thesis committee
members: Professor Kazunori Sakamoto, Professor Nabuhiro Matsuoka, and Professor
Tang Changyuan for their insightful comments and hard questions which have been
absolutely invaluable to improve explanation and the structure of my thesis.
I would like express my special gratitude to lecturer, Dr. Miwa Yashima and
my fellow students of Soil Science laboratory, Shuzoh Shimada, Dr. Hironori Arai, Ryo
Yoshioka, and Naho Yoshioka, who have helped me gain insight into my research. My
thanks also send to Mrs. Yuka Komurasaki and other fellow students which cannot be
individually listed here. I gratefully acknowledge the support of research project
collaboration Mr. Hiroshi Aoki, Dr. Narutoshi Kimoto and Dr. Atsushi Sakamoto from
JCAM AGRI. Co. LTD, Tokyo. Japan. I also would like to thank Dr. Lulie Melling,
director Tropical Peat Laboratory of Sarawak, Malaysia and her staff as well as staff of

iv
oil palm plantations in Indonesia for their assistance in the field.
I would especially like to thank my father in law, Yaaki Sakata for his
encouragement, my mother-in-law, Ayako Sakata and aunt-in- law, Masako Suzuki for
their financially support, which cannot be adequately expressed in words. And, I would
especially express my heartfelt thanks to my caring, loving and supportive husband,
Akio Sakata. He is sincerely encouraging me and lifting my confidence up completing
my study. Many thanks to my sisters and brothers and all my family in Indonesia for
their supporting while I am living far away from my home country.
Finally, I hope this thesis would give a valuable contribution toward better
understanding related with greenhouse gases and oil palm plantation in Indonesia and
Malaysia.
v
General Abstract
Due to increasing of global demand for palm oil, Indonesia and Malaysia are
pursuing the expansion of oil palm plantations which is accomplishing considerable
concern and debate on global warming as impact of the greenhouse gas emission into
the atmosphere. Oil palm plantations as a major contributor on the greenhouse gas
emission as related with land use changes had been reported in many research. However,
there are still limited studies concerning effect of soil types, fertilizer and topography on
nitrous oxide (N2O), carbon dioxide (CO2) and yield of oil palm.
These studies were conducted on mineral soil in Tunggal, Indonesia, and in
Simunjan, Malaysia and also on peat soil in Tatau, Malaysia. The type of fertilizer
application was coated fertilizer and conventional fertilizer. Measurement of N2O and
CO2 emissions conducted 2 years continuously. The results show that N2O and CO2
fluxes showed high variabilities with seasons, soil and fertilizer types. N2O and CO2
fluxes in the tropical oil palm plantations were significantly affected by the soil types,
but not consistently by fertilizer types.
Since the oil palm plantations have been expanding into the different slope
positions, observation the interaction of soil properties and topography influencing
greenhouse gas fluxes which are still poorly understood is required. Topography affects
vi
the movement of surface and subsurface water and causes the variability of soil
processes, which makes the accurate estimation of greenhouse gas fluxes more difficult.
In addition, assessment of the dissolved N2O concentration as source of indirect
emission was also considered. The study result show N2O and CO2 fluxes showed
variability with seasons and slope positions. Dissolved N2O concentrations varied by
water sources and sampling time, sometimes supersaturated than ambient equilibrated
concentration. Therefore, topography effect is needed carefully recognized on
estimating the whole gases emissions including the indirect emissions.
Soils and fertilizers are essential factors on the growth and production of oil
palm. By applied coated fertilizer by a half and quarter of dosage from conventional
fertilizer showed that coated fertilizer was more productively on FFB yields.
Consequently, reducing the dosage of coated fertilizer in each soils type showed more
productive on FFB yields.
From the above studies, it is important to understand the oil palm plantation on
influence toward the greenhouse gas and yield related with the sequence of soil,
fertilizer and topography.
vii
インドネシアとマレーシア油ヤシ農園における土壌、肥料および地形が
一酸化二窒素と二酸化炭素放出および収量に与える影響
要約
インドネシアとマレーシアにおいて、栽培面積が急速に拡大している油ヤシ
農園は、近年、温室効果ガス一酸化二窒素(N2O)の発生源として、環境に対する
潜在的な影響が注目されている。しかし、土壌タイプや窒素施肥が、N2O と二
酸化炭素(CO2)生成能に及ぼす影響を検討した例は限られている。そこで本研究
では、この2つの要因が、油ヤシ農園からの N2Oと CO2放出に及ぼす影響を評
価することを目指した。現地の油ヤシ農園において、土壌、肥料および地形が、
N2Oと CO2放出および収量に与える影響について研究したものである。
本研究は、インドネシアの鉱質土壌の油ヤシ農園と、マレーシアの鉱質土壌
と泥炭土壌の油ヤシ農園において実施された。油ヤシ栽培に必須な施肥窒素に
ついて、慣行肥料と被覆肥料とで比較して、N2O と CO2放出量を 2 年間継続し
て測定した。その結果、N2O と CO2放出量が、季節変化や土壌タイプおよび肥
料の種類により大きく変動することが示された。被覆肥料区の施肥窒素量は、
慣行肥料区の約半分で深層施肥したため、被覆肥料区の施肥窒素あたりの N2O
放出量は、慣行肥料区を下回る例が見い出された。
油ヤシ栽培は、様々な地形において拡大されている。地形と土壌の特性の相
互関係が、温室効果ガスに影響しているか否かについての検討は、まだ限定的
viii
である。地形は、水の流れにより、土壌中の物質変化に影響し、温室ガスの正
確な測定は難しくなると考えられた。さらに溶存 N2O が排出されることに注目
することが必要である。研究の結果、N2O と CO2の放出量は、季節と地形によ
って変動した。そして、溶存 N2Oは、水源と水の採取時期によって変化した。
油ヤシの成長と生産のため、土壌と窒素肥料は必須要因である。現地施肥試
験では被覆肥料区の施肥窒素量は、慣行肥料区の約半分を施用した。被覆肥料
区と慣行肥料区と比べた結果、油ヤシの収量は、被覆肥料の方が生産性が高い
ことが確認された。土壌型が違っても、被覆肥料の量を減らしても、油ヤシの
生産性は高いという結果であった。
上記の研究結果から、油ヤシ農園において土壌、肥料および地形が温室効果
ガス放出に重要な影響を与えていることが結論づけられた。
ix
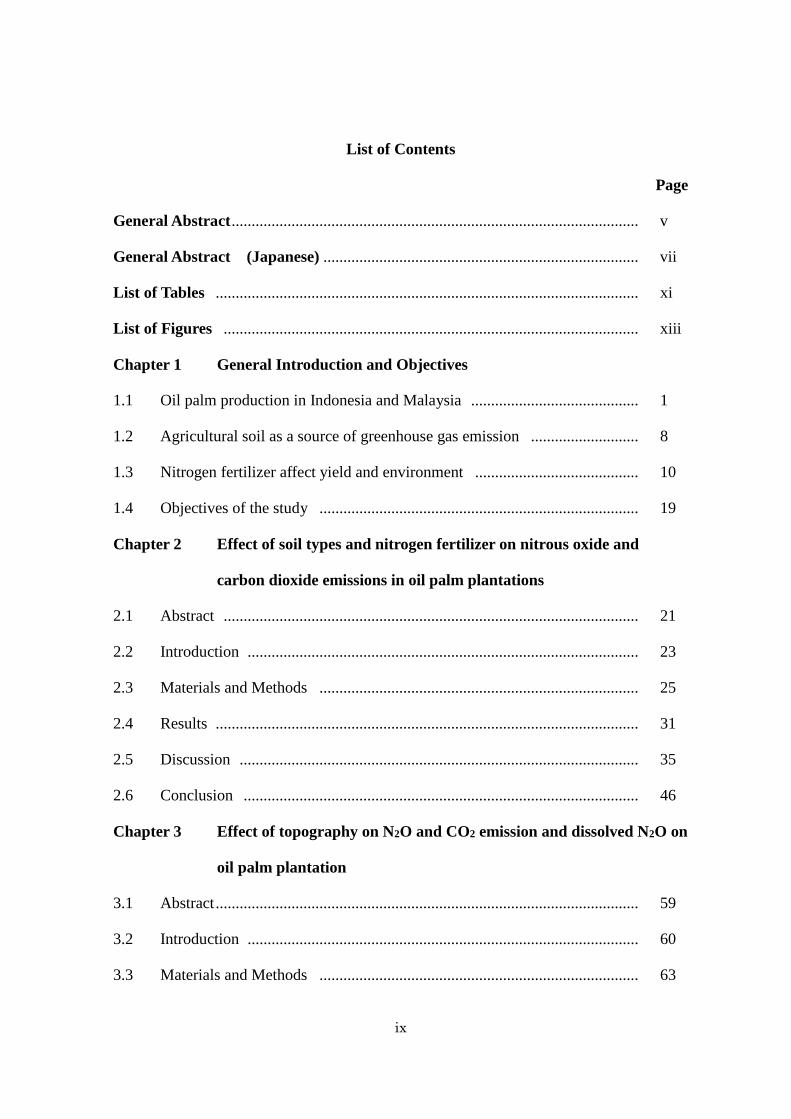
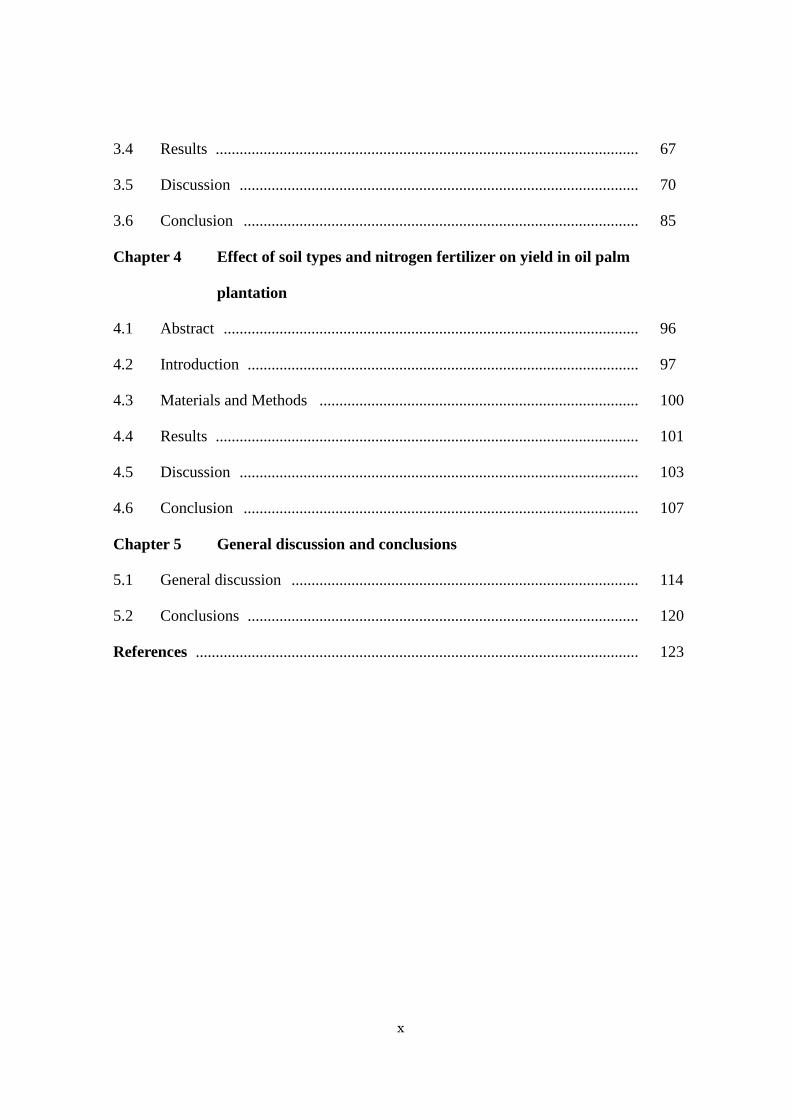
List of Contents
Page
General Abstract ...................................................................................................... v
General Abstract (Japanese) ............................................................................... vii
List of Tables .......................................................................................................... xi
List of Figures ........................................................................................................ xiii
Chapter 1 General Introduction and Objectives
1.1 Oil palm production in Indonesia and Malaysia .......................................... 1
1.2 Agricultural soil as a source of greenhouse gas emission ........................... 8
1.3 Nitrogen fertilizer affect yield and environment ......................................... 10
1.4 Objectives of the study ................................................................................ 19
Chapter 2 Effect of soil types and nitrogen fertilizer on nitrous oxide and
carbon dioxide emissions in oil palm plantations
2.1 Abstract ........................................................................................................ 21
2.2 Introduction .................................................................................................. 23
2.3 Materials and Methods ................................................................................ 25
2.4 Results .......................................................................................................... 31
2.5 Discussion .................................................................................................... 35
2.6 Conclusion ................................................................................................... 46
Chapter 3 Effect of topography on N2O and CO2 emission and dissolved N2O on
oil palm plantation
3.1 Abstract .......................................................................................................... 59
3.2 Introduction .................................................................................................. 60
3.3 Materials and Methods ................................................................................ 63
x
3.4 Results .......................................................................................................... 67
3.5 Discussion .................................................................................................... 70
3.6 Conclusion ................................................................................................... 85
Chapter 4 Effect of soil types and nitrogen fertilizer on yield in oil palm
plantation
4.1 Abstract ........................................................................................................ 96
4.2 Introduction .................................................................................................. 97
4.3 Materials and Methods ................................................................................ 100
4.4 Results .......................................................................................................... 101
4.5 Discussion .................................................................................................... 103
4.6 Conclusion ................................................................................................... 107
Chapter 5 General discussion and conclusions
5.1 General discussion ....................................................................................... 114
5.2 Conclusions .................................................................................................. 120
References ............................................................................................................... 123
xi
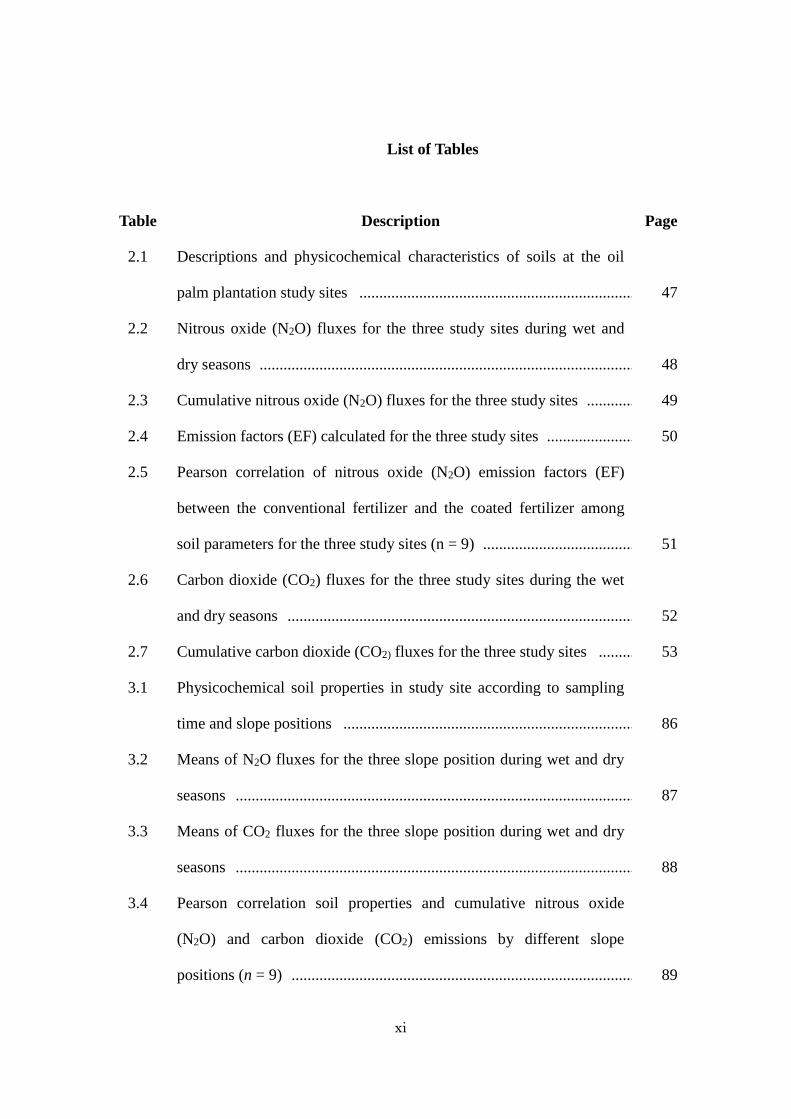
List of Tables
Table Description Page
2.1 Descriptions and physicochemical characteristics of soils at the oil
palm plantation study sites .................................................................................
47
2.2 Nitrous oxide (N2O) fluxes for the three study sites during wet and
dry seasons ..........................................................................................................
48
2.3 Cumulative nitrous oxide (N2O) fluxes for the three study sites ............................. 49
2.4 Emission factors (EF) calculated for the three study sites ....................................... 50
2.5 Pearson correlation of nitrous oxide (N2O) emission factors (EF)
between the conventional fertilizer and the coated fertilizer among
soil parameters for the three study sites (n = 9) ..................................................
51
2.6 Carbon dioxide (CO2) fluxes for the three study sites during the wet
and dry seasons ...................................................................................................
52
2.7 Cumulative carbon dioxide (CO2) fluxes for the three study sites ..................... 53
3.1 Physicochemical soil properties in study site according to sampling
time and slope positions .....................................................................................
86
3.2 Means of N2O fluxes for the three slope position during wet and dry
seasons ................................................................................................................
87
3.3 Means of CO2 fluxes for the three slope position during wet and dry
seasons ................................................................................................................
88
3.4 Pearson correlation soil properties and cumulative nitrous oxide
(N2O) and carbon dioxide (CO2) emissions by different slope
positions (n = 9) ..................................................................................................
89

xii
4.1 Application of fertilizer in each study sites ............................................................. 108
4.2 Soil fertility condition in each study sites based on classification of
soil fertility for oil palm ......................................................................................
109
4.3 Classification of soil nutrient status for oil palm (adapted from Goh
2005) ...................................................................................................................
109
xiii
List of Figures
Figure Description Page
1.1 Largest producers of palm oil (thousands of tons of oil produced) in
2012 ....................................................................................................................
2
1.2 Oil palm plantation harvested areas (ha) in Indonesia and Malaysia
from 1980 to 2014. .............................................................................................
3
1.3 Palm Oil productions in the world, Indonesia, and Malaysia. ............................ 3
1.4 Location of oil palm plantations in Indonesia, 2014. ......................................... 4
1.5 Location of oil palm plantations in Malaysia, 2014. .......................................... 5
1.6 Expansion of oil palm plantation on mineral soil and peat soil between
1990 and 2010 in Indonesia and Malaysia .........................................................
7
1.7 Soil distributions in Indonesia based on classification of soils orders ................. 7
1.8 Greenhouse Gas Emissions by Sector ................................................................ 8
1.9 Correlation between water-filled pore space (%) and net flux of
nitrogen gases .....................................................................................................
14
1.10 Framework of studies showing effect of soil, fertilizer and topography
on N2O, CO2, and yield of oil palm ....................................................................
20
2.1 Map of study sites in Indonesia and Malaysia .................................................... 54
2.2 Precipitation, soil moisture tension, soil temperature, nitrous oxide
(N2O) flux and carbon dioxide (CO2) flux in Tunggal sandy loam soil.
Vertical bars indicate ± standard deviation. Treatment B: no nitrogen
(N) fertilizer and no tillage; C: conventional fertilizer; B2: no N
fertilizer with tillage; M: coated fertilizer. Solid arrows and dashed
xiv
arrows indicate conventional and coated fertilization timing,
respectively. Vertical dashed lines indicate transition period for dry
and wet seasons ··············································································
55
2.3 Precipitation, soil moisture tension, soil temperature, N2O flux, and
CO2 flux, in Simunjan sandy soil. ........................................................................
56
2.4 Precipitation, soil moisture tension, soil temperature, N2O flux, and
CO2 flux, in Tatau peat soil. .................................................................................
57
2.5 Linear relationship between N2O and CO2 flux in (a) Tunggal, (b)
Simunjan, and (c) Tatau. .....................................................................................
58
3.1 Map of study site at Tunggal Plantation, Riau Province and topography
positions of data measurement ····························································
90
3.2 Precipitation, temperature, N2O flux, and CO2 flux in the upper,
middle, and lower slope in Tunggal. Vertical bars ± indicated standard
deviation (n=3). Solid arrows indicate fertilization timing. Vertical
dashed lines indicate transition period for dry and wet seasons .........................
91
3.3 Cumulative nitrous oxide (N2O) (a) and carbon dioxide (CO2) (b)
fluxes in the upper, middle, and lower slope positions. The vertical bars
indicate the standard error (n = 3). Cumulative N2O fluxes showed
significant differences between slope were determined with a one-way
ANOVA (p = 0.043) and are displayed as different letters. There was
no effect of slope on cumulative CO2 fluxes (p = 0.075) ...................................
92
3.4 NH4+, NO3
-, and dissolved N2O concentrations in water samples.
Vertical bars ± indicated standard deviation ......................................................
93
3.5 pH and dissolved CO2 concentrations in water samples. Vertical bars ±
xv
indicated standard deviation…………………………………………… 94
3.6 Relationship between NO3- and dissolved N2O concentrations by
source of water. EF5-g, emission factor for ground water; p, value of
statistical linear regression ..................................................................................
95
4.1 Layout of each treatment in study sites .............................................................. 110
4.2 Accumulation of FFB productions per palms in each site study by
different fertilizer treatments. C; conventional fertilizer, M1; coated
fertilizer with a half of C dosage, M2; coated fertilizer with a quarter of
C dosage .............................................................................................................
111
4.3 Annual FFB productions in each site study by different fertilizer
treatments. C; conventional fertilizer, M1; coated fertilizer with a half
of C dosage, M2; coated fertilizer with a quarter of C dosage ...........................
112
4.4 Partial Factor Productivity (PFP) in each site study by different
fertilizer treatments. C; conventional fertilizer, M1; coated fertilizer
with a half of C dosage, M2; coated fertilizer with a quarter of C
dosage .................................................................................................................
113
5.1 General conclusion of study on soil, fertilizer and topography affect
N2O oxide, CO2 and yield of oil palm in Indonesia and Malaysia .....................
122
Chapter 1
1
Chapter 1
General Introduction
1.1 Oil palm plantation in Indonesia and Malaysia
Oil palm (Elaeis guineensis Jacq.) is a tropical crop and originated from West
Africa. In1848, oil palm first planted in Java Island and it had been spread to Southeast
Asian plantations development (Henderson and Osborne 2000). Oil palm is important
supplier of vegetable oil in the world and one of the most rapidly expanding crops in the
tropics. Indonesia and Malaysia had taken over from Nigeria and Zaire in dominating
world trade in palm oil since 1966 (Poku 2002). Comparing with others crop-based oil
seeds, oil palm trees produces the highest yield per unit area. From 1 ha of oil palm
produces average oil yield as 4.09 tonnes, as compared with rapeseed, sunflower and
soybean which yields 0.75, 0.5 and 0.37 tonnes, respectively (World Growth 2011). The
oil palm tree produces high-quality oil used primarily for cooking in developing
countries. It is also used in food products, detergents, cosmetics, and a small extent as
biofuel.
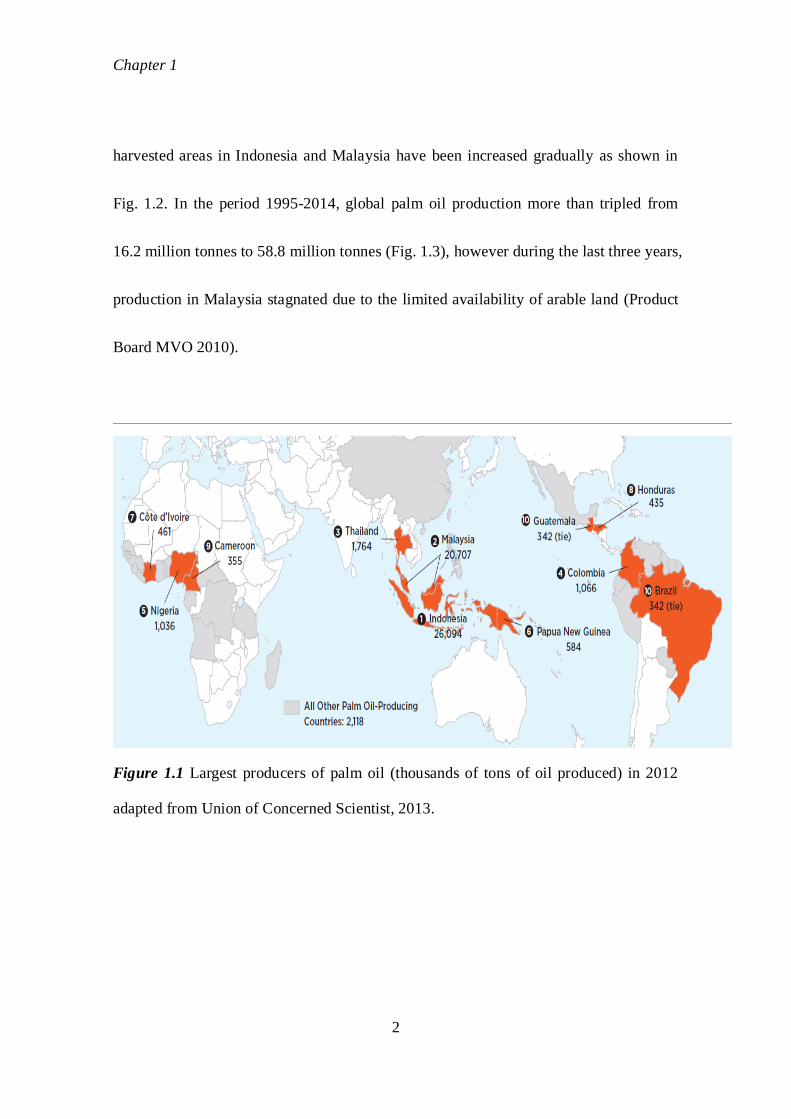
From all the worlds, the largest producers of palm oil in the world are still
dominated by Indonesia and Malaysia (Fig. 1.1). Since early 1980s, oil palm plantation
Chapter 1
2
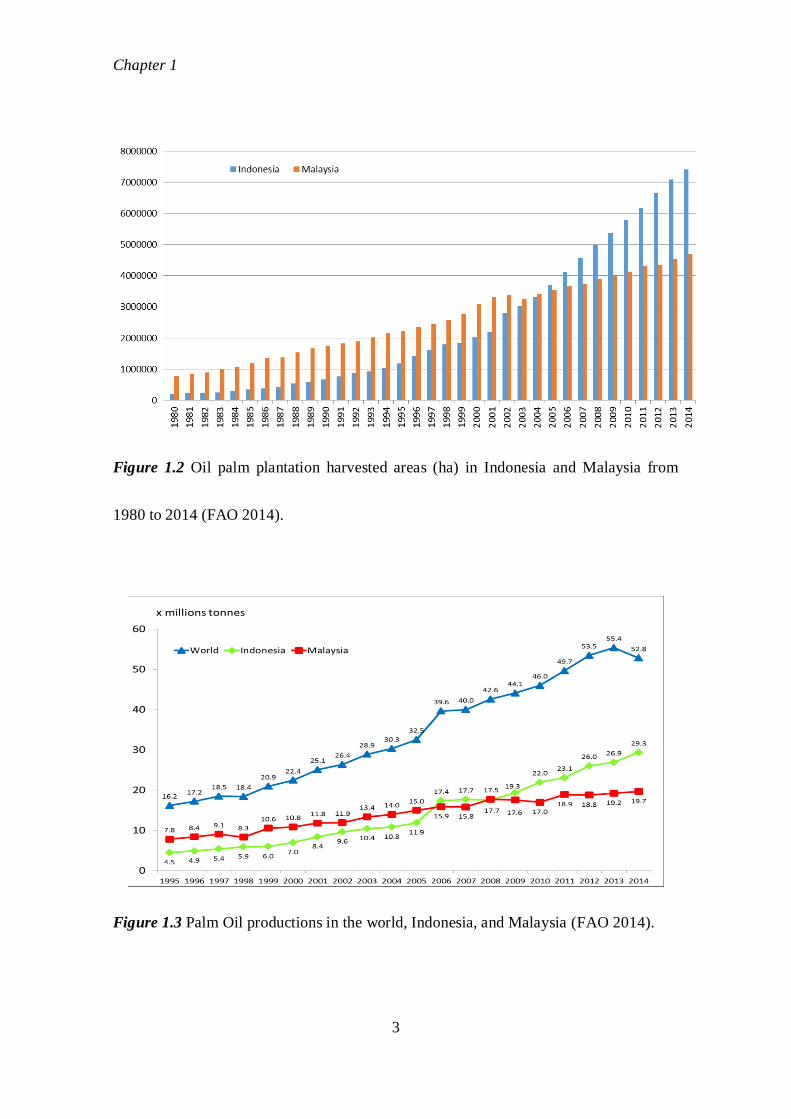
harvested areas in Indonesia and Malaysia have been increased gradually as shown in
Fig. 1.2. In the period 1995-2014, global palm oil production more than tripled from
16.2 million tonnes to 58.8 million tonnes (Fig. 1.3), however during the last three years,
production in Malaysia stagnated due to the limited availability of arable land (Product
Board MVO 2010).
Figure 1.1 Largest producers of palm oil (thousands of tons of oil produced) in 2012
adapted from Union of Concerned Scientist, 2013.
Chapter 1
3
Figure 1.2 Oil palm plantation harvested areas (ha) in Indonesia and Malaysia from
1980 to 2014 (FAO 2014).
Figure 1.3 Palm Oil productions in the world, Indonesia, and Malaysia (FAO 2014).
Chapter 1
4
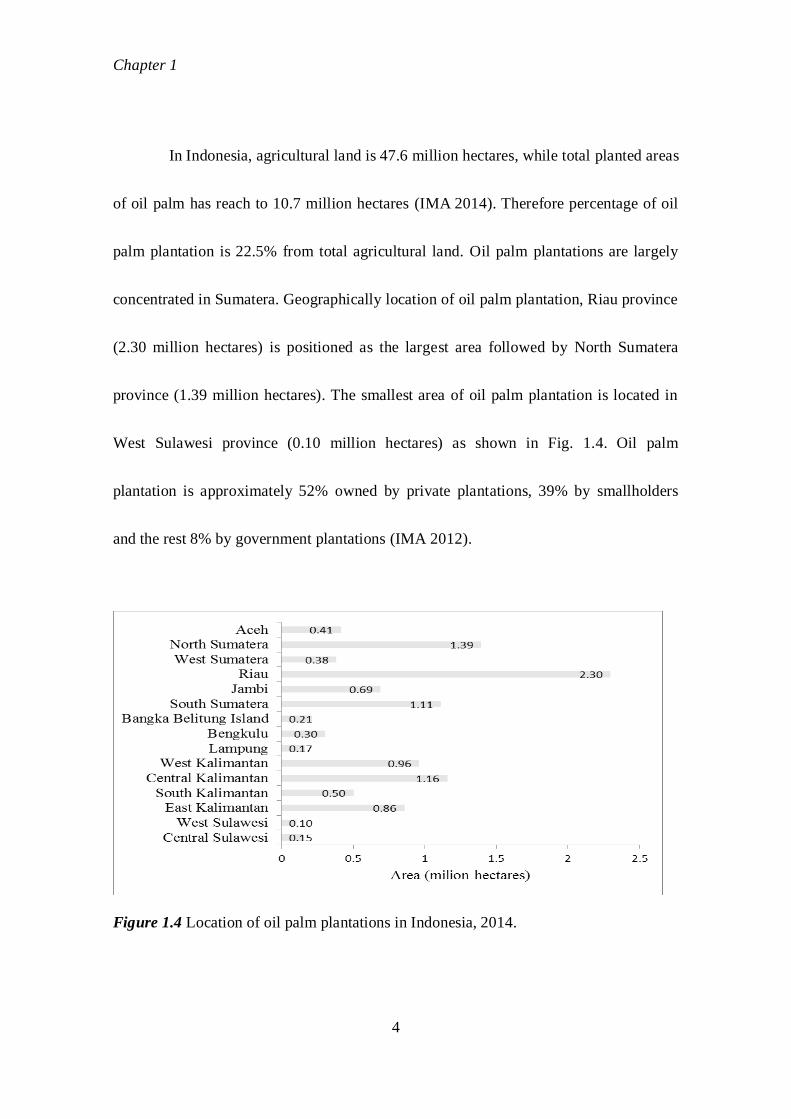
In Indonesia, agricultural land is 47.6 million hectares, while total planted areas
of oil palm has reach to 10.7 million hectares (IMA 2014). Therefore percentage of oil
palm plantation is 22.5% from total agricultural land. Oil palm plantations are largely
concentrated in Sumatera. Geographically location of oil palm plantation, Riau province
(2.30 million hectares) is positioned as the largest area followed by North Sumatera
province (1.39 million hectares). The smallest area of oil palm plantation is located in
West Sulawesi province (0.10 million hectares) as shown in Fig. 1.4. Oil palm
plantation is approximately 52% owned by private plantations, 39% by smallholders
and the rest 8% by government plantations (IMA 2012).
Figure 1.4 Location of oil palm plantations in Indonesia, 2014.
Chapter 1
5
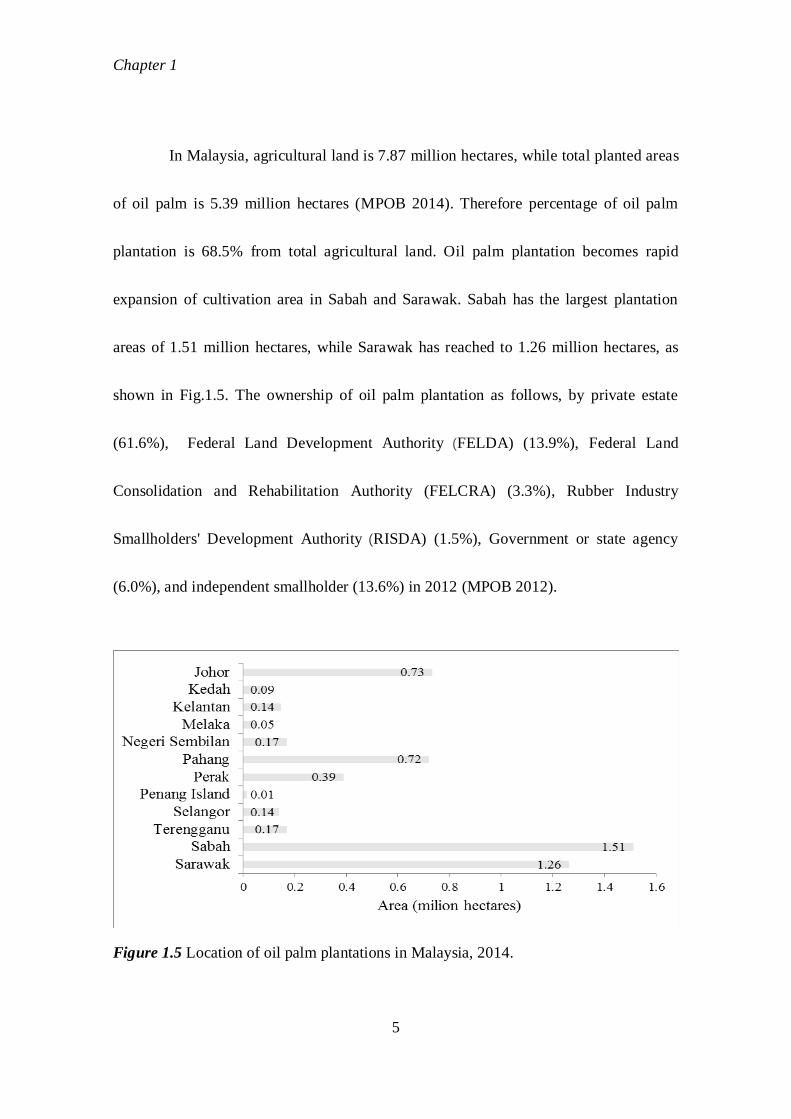
In Malaysia, agricultural land is 7.87 million hectares, while total planted areas
of oil palm is 5.39 million hectares (MPOB 2014). Therefore percentage of oil palm
plantation is 68.5% from total agricultural land. Oil palm plantation becomes rapid
expansion of cultivation area in Sabah and Sarawak. Sabah has the largest plantation
areas of 1.51 million hectares, while Sarawak has reached to 1.26 million hectares, as
shown in Fig.1.5. The ownership of oil palm plantation as follows, by private estate
(61.6%), Federal Land Development Authority (FELDA) (13.9%), Federal Land
Consolidation and Rehabilitation Authority (FELCRA) (3.3%), Rubber Industry
Smallholders' Development Authority (RISDA) (1.5%), Government or state agency
(6.0%), and independent smallholder (13.6%) in 2012 (MPOB 2012).
Figure 1.5 Location of oil palm plantations in Malaysia, 2014.
Chapter 1
6
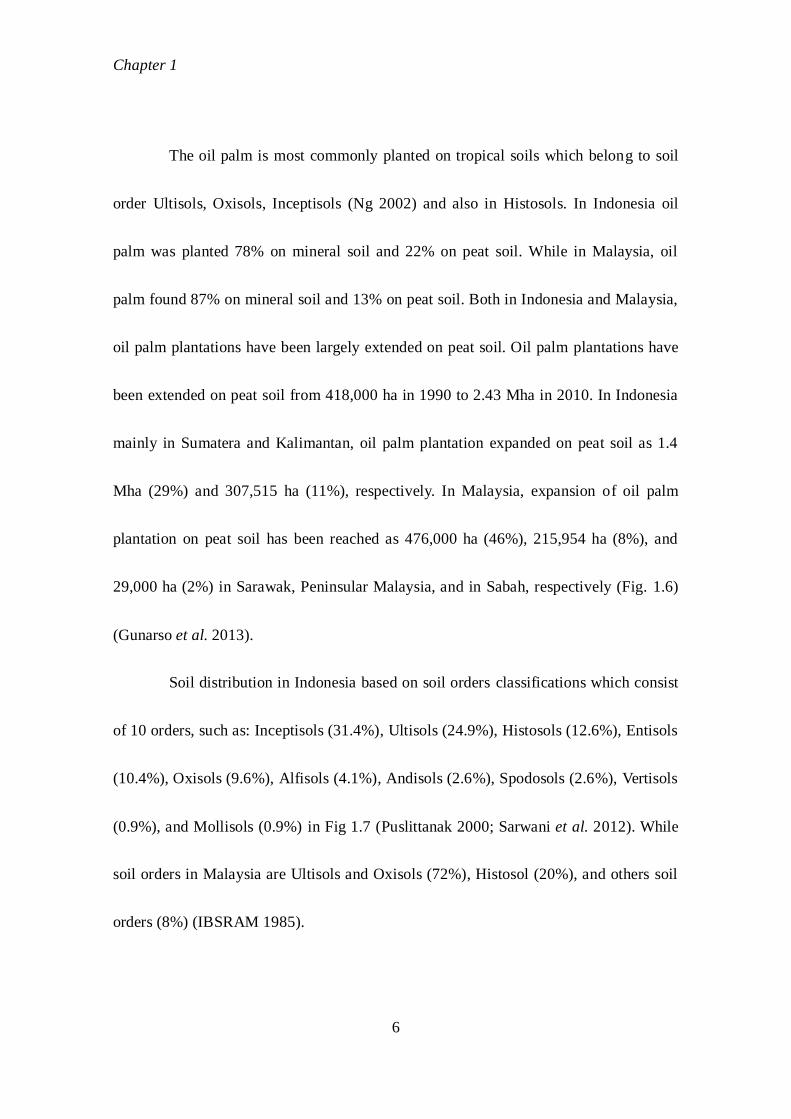
The oil palm is most commonly planted on tropical soils which belong to soil
order Ultisols, Oxisols, Inceptisols (Ng 2002) and also in Histosols. In Indonesia oil
palm was planted 78% on mineral soil and 22% on peat soil. While in Malaysia, oil
palm found 87% on mineral soil and 13% on peat soil. Both in Indonesia and Malaysia,
oil palm plantations have been largely extended on peat soil. Oil palm plantations have
been extended on peat soil from 418,000 ha in 1990 to 2.43 Mha in 2010. In Indonesia
mainly in Sumatera and Kalimantan, oil palm plantation expanded on peat soil as 1.4
Mha (29%) and 307,515 ha (11%), respectively. In Malaysia, expansion of oil palm
plantation on peat soil has been reached as 476,000 ha (46%), 215,954 ha (8%), and
29,000 ha (2%) in Sarawak, Peninsular Malaysia, and in Sabah, respectively (Fig. 1.6)
(Gunarso et al. 2013).
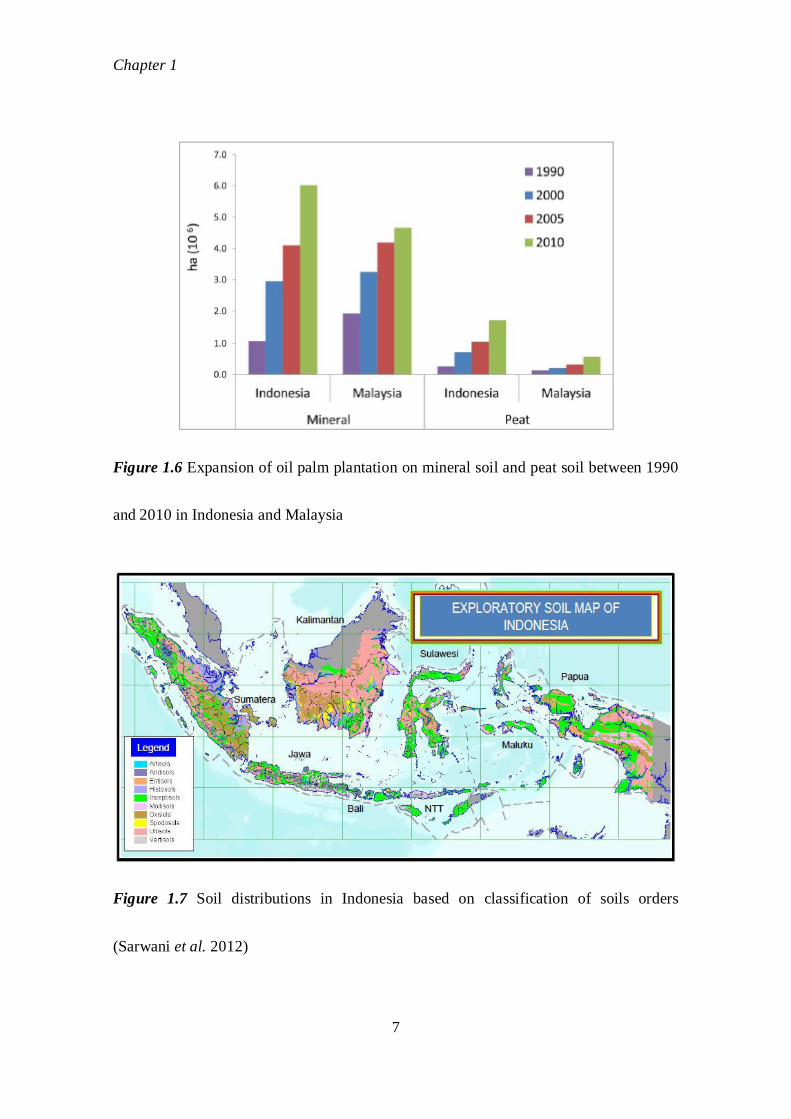
Soil distribution in Indonesia based on soil orders classifications which consist
of 10 orders, such as: Inceptisols (31.4%), Ultisols (24.9%), Histosols (12.6%), Entisols
(10.4%), Oxisols (9.6%), Alfisols (4.1%), Andisols (2.6%), Spodosols (2.6%), Vertisols
(0.9%), and Mollisols (0.9%) in Fig 1.7 (Puslittanak 2000; Sarwani et al. 2012). While
soil orders in Malaysia are Ultisols and Oxisols (72%), Histosol (20%), and others soil
orders (8%) (IBSRAM 1985).
Chapter 1
7
Figure 1.6 Expansion of oil palm plantation on mineral soil and peat soil between 1990
and 2010 in Indonesia and Malaysia
Figure 1.7 Soil distributions in Indonesia based on classification of soils orders
(Sarwani et al. 2012)
Chapter 1
8
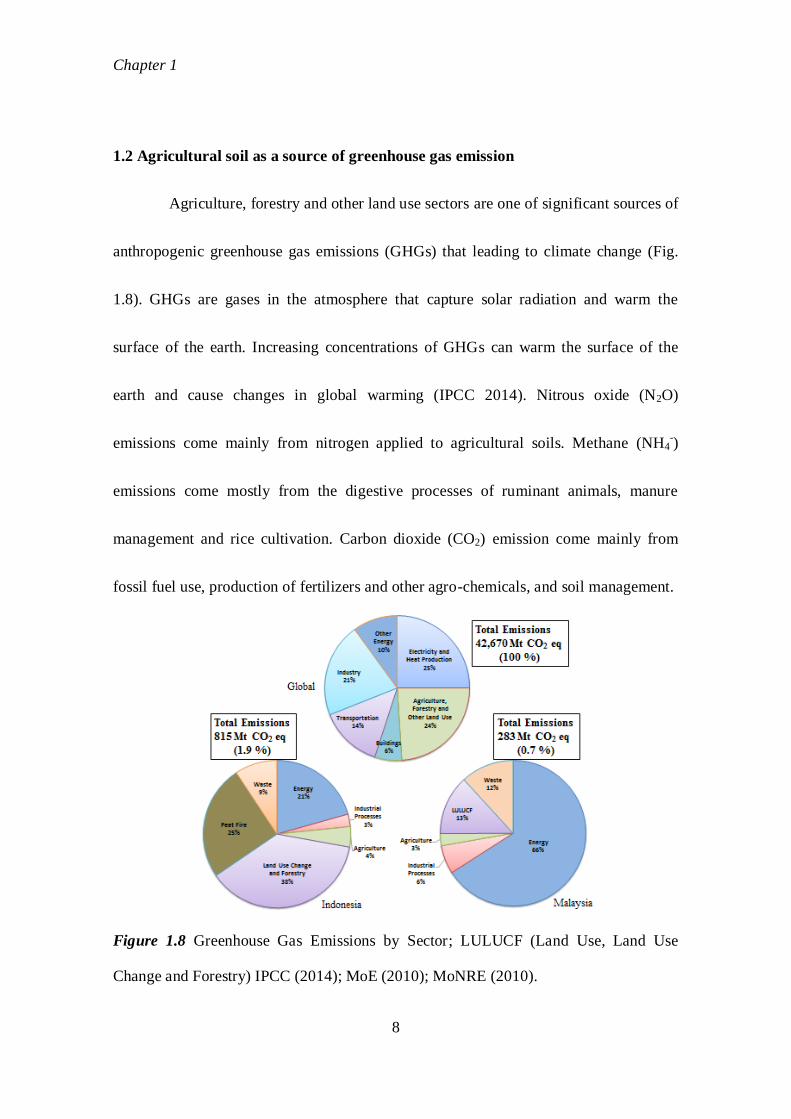
1.2 Agricultural soil as a source of greenhouse gas emission
Agriculture, forestry and other land use sectors are one of significant sources of
anthropogenic greenhouse gas emissions (GHGs) that leading to climate change (Fig.
1.8). GHGs are gases in the atmosphere that capture solar radiation and warm the
surface of the earth. Increasing concentrations of GHGs can warm the surface of the
earth and cause changes in global warming (IPCC 2014). Nitrous oxide (N2O)
emissions come mainly from nitrogen applied to agricultural soils. Methane (NH4-)
emissions come mostly from the digestive processes of ruminant animals, manure
management and rice cultivation. Carbon dioxide (CO2) emission come mainly from
fossil fuel use, production of fertilizers and other agro-chemicals, and soil management.
Figure 1.8 Greenhouse Gas Emissions by Sector; LULUCF (Land Use, Land Use
Change and Forestry) IPCC (2014); MoE (2010); MoNRE (2010).
Chapter 1
9
Indonesia and Malaysia dominate global production of oil palm, with rapid
expansion of plantation area by the conversion of tropical forest and peatlands to oil
palm plantation has been focus of debates due to its potential impact on environment
(Dewi et al. 2009), and emerged as globally significant driver of greenhouse gas
emission (Seymour 2014). Over the last 20 years deforestation has been driven
predominantly by agricultural expansion, especially of oil palm plantation monocultures
(Singh and Bhagwat 2013). Expanding oil palm plantation cause GHGs emissions when
the new plantations replaced the forest habitat due to amount of carbon stored in the
stems, leaves and roots are small compared with carbon stocks of the natural forest
(Wicke et al. 2008a). While expansion of oil palm converted from peat soils, it creates
two sources of CO2 emissions, namely emissions due to soil burning and soil drainage.
Burning land has been chosen to clear the old vegetation to establish new plantation.
Peat soil will burn down into soil profile until it is sufficiently humid to extinguish the
fire. Afterwards, upper horizon of peat soil is drained to create suitable soil condition
for oil palm. These processes changed the ecological condition of soil biota and leads to
gradual oxidation and decomposition of peat matrix, and as a consequence, peat soil
release the CO2 (Agus et al. 2009). Expansion of oil palm from forest conversion on
mineral soil caused a net release emission of approximately 650 Mg CO2eq ha-1
, while
Chapter 1
10
on peat soil released over 1,300 Mg CO2eq ha-1
during the first 25 year circle of oil palm
growth. Emission from peat conversion is even higher due to the composition of drained
peat and the resulting emission of CO2 and N2O (Germer and Sauerbon 2008). In
Indonesia, net annual emissions from land use change and emissions from peat soil link
to the expansion of oil palm plantation were reported approximately at 58 Tg CO2 yr-1
(from 1990 to 2000), 65 Tg CO2 yr-1
(from 2001 to 2005), and 127 Tg CO2 yr-1
(from
2006 to 2010). While in Malaysia were estimated at 33 Tg CO2 yr-1
(from 1990 to 2000),
40 Tg CO2 yr-1
(from 2001 to 2005), and 57 Tg CO2 yr-1
(from 2006 to 2010) (Agus et
al. 2013).
1.3 Nitrogen fertilizers affect environment and yield
1.3.1 Nitrogen fertilizers affect environment
In recent years concern has grown over the contribution of nitrogen (N)
fertilizers to the environmental problems. Nitrogen and other nutrients are used
inefficiently in most of the world’s agricultural systems resulting in enormous and
largely unnecessary losses to the environment. According to IPCC (2007), 60% of N
fertilizers can be lost as pollutants through leaching of mobile N compounds such as
nitrate (NO3-) and emission of nitrous oxide (N2O) as one of potent greenhouse gas.
Chapter 1
11
Once N fertilizers are applied to agricultural systems, the fertilizers are absorbed
directly by plants or converted into various other forms through the oxidation process.
Excess nitrogen is lost in ionic or gaseous form through leaching, volatilization, and
denitrification (Liu 2014). Leaching is the downward movement of N through the soil
profile. Water movement in the soil profile can be vertical to groundwater of horizontal
to surface drain. Nitrate leaching has negative impact on groundwater quality and it
contributes to eutrophication of surface water. Groundwater is very essential source of
drinking water, therefore concentration of NO3- in the groundwater have a serious
consideration. The maximum tolerable concentration of NO3- is 10 mg per liter for
drinking water. Nitrate exceed that tolerable concentration may present serious health
concern is called blue baby syndrome in human infants (WHO 2011; DEQ 2015).
From a greenhouse gas perspective, the fertilizers with the largest effects are
the N-based forms that produce N2O, including ammonium nitrate, ammonium sulphate
and urea. According to the Intergovernmental Panel on Climate Change ((IPCC) 2007),
1 kg of N2O has an equivalent impact of approximately 298 kg of CO2. N2O is
responsible for 6% of the calculated greenhouse effect caused by human activity. The
concentration of N2O in the atmosphere is increasing at a rate of approximately 0.2%
per year (IPCC 2007). N2O is produced by both the oxidation of ammonium (NH4+) to
Chapter 1
12
nitrate (NO3–) (i.e., nitrification) and the reduction of NO3
– to dinitrogen gas (N2) (i.e.,
denitrification). N2O is either the by-product (nitrification) or the intermediate product
(denitrification) of these processes (Firestone and Davidson 1989). Because of these
changes to the N cycling 100-yr lifetime caused by soil disturbance and use of N
fertilizers, N2O emissions from agricultural soils are particularly large, and obtaining
reliable estimates is not straightforward (Syväsalo et al. 2004). The amount of N2O
released is usually related to N application as organic or mineral fertilizers; a linear
relationship between N2O emission and fertilizer input has been found (Bouwman 1990),
and it is dependent on the form in which the N fertilizers are used, the location (i.e., soil
type and climatic conditions) and the cultivated crops present (Corre et al. 1995;
MacKenzie et al. 1998; Nagano et al. 2012).
There has been a much stronger focus on N2O emission from soil. However
there is another gas from the soil which contributes to pollution of atmosphere, namely
nitric oxide (NO). Even though NO indirectly contributes to global warming, NO works
to the formation of tropospheric ozone, and the formation of acid rain (McTaggart et al.
2002). Generally, N2O and NO were emitted from all soils by the microbial process of
nitrification and denitrification (Bouwman 1990; Granli and Bockman 1994; Smith et al.
1997: Pilegaard 2013) by cause of N fertilizer application by increasing available N in
Chapter 1
13
the soil. Microbial activity and chemical reactions influence the production and
consumption of NO in soil. Nitrifiers and denitrifier are two most significant of
micro-organism involved in those processes (Pilegaard 2013).
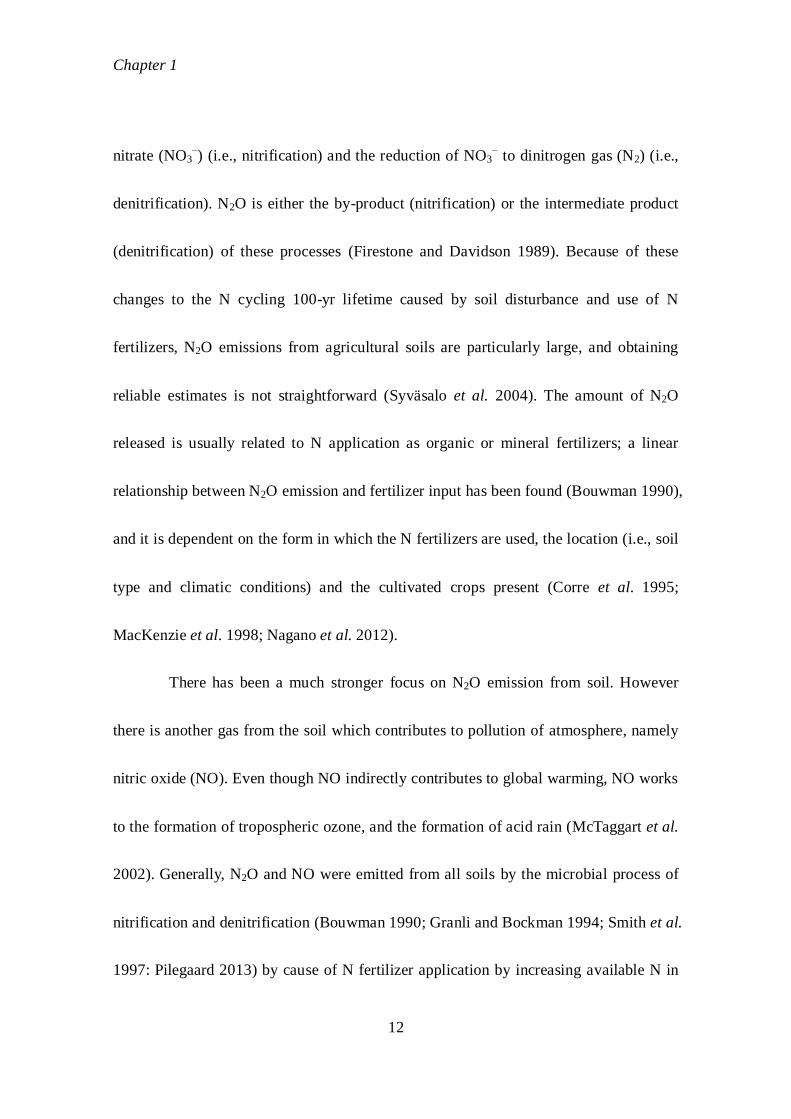
The net of chemical reaction of nitrification is:
While, the net of chemical reaction of denitrification is:
The N gases diffuse through the soil pore system and before escaping from the soil to
the atmosphere, NO in particular rapidly may be taken up by plants or consumed by
microorganisms when the soil water content increased (Firestone and Davidson 1989).
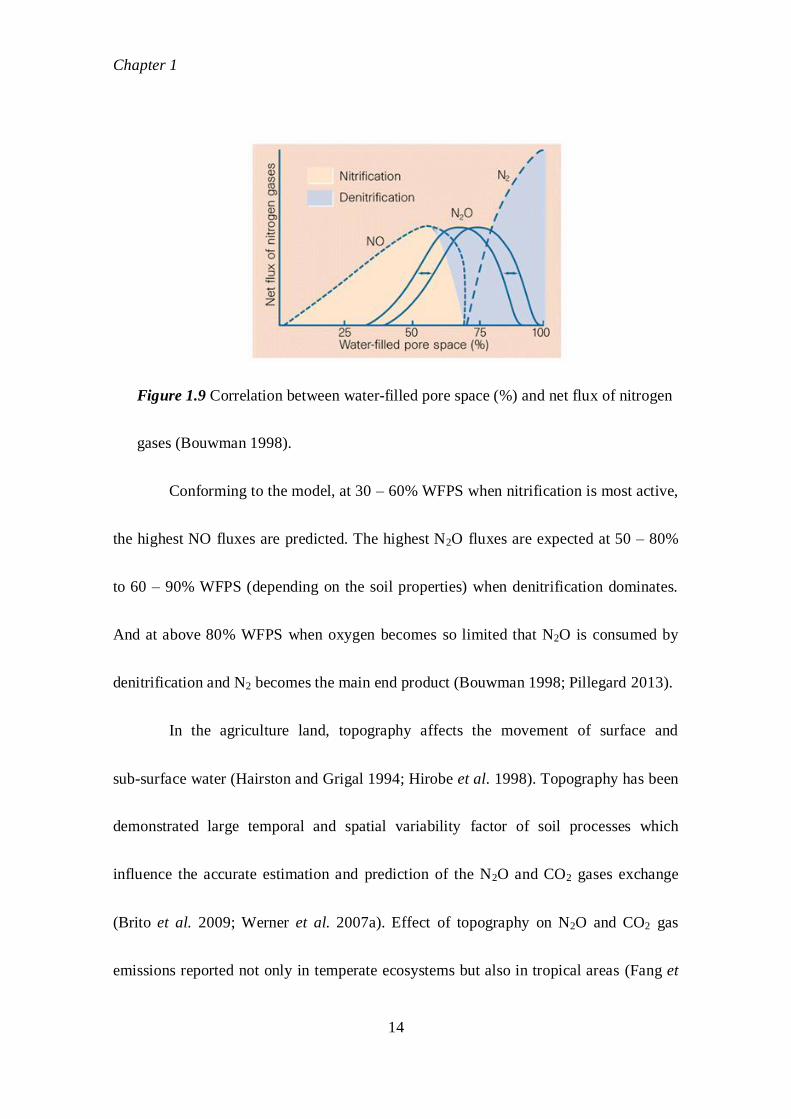
Additionally, Bouwman (1998) showed a model of correlations between
water-filled pore space (WFPS) and production of N gases in Fig. 1.9. Generally, both
NO and N2O are produced by same processes, however in opposite to N2O, production
of NO in soils assumes to be nitrification rather than denitrification (Conrad 2002).
Chapter 1
14
Figure 1.9 Correlation between water-filled pore space (%) and net flux of nitrogen
gases (Bouwman 1998).
Conforming to the model, at 30 – 60% WFPS when nitrification is most active,
the highest NO fluxes are predicted. The highest N2O fluxes are expected at 50 – 80%
to 60 – 90% WFPS (depending on the soil properties) when denitrification dominates.
And at above 80% WFPS when oxygen becomes so limited that N2O is consumed by
denitrification and N2 becomes the main end product (Bouwman 1998; Pillegard 2013).
In the agriculture land, topography affects the movement of surface and
sub-surface water (Hairston and Grigal 1994; Hirobe et al. 1998). Topography has been
demonstrated large temporal and spatial variability factor of soil processes which
influence the accurate estimation and prediction of the N2O and CO2 gases exchange
(Brito et al. 2009; Werner et al. 2007a). Effect of topography on N2O and CO2 gas
emissions reported not only in temperate ecosystems but also in tropical areas (Fang et
Chapter 1
15
al. 2009). A significant amount of N2O emissions originates from agricultural soil as
direct emission and from aquatic systems as indirect emission (Mosier et al. 1998).
Indirect N2O emissions are estimated from N leaching in agro-ecosystems.
1.3.2 Nitrogen fertilizers affect yield
The oil palm is a heavy feeder and requires quite large quantities of fertilizers
especially with N fertilizer to produce good yield (Comte et al. 2012) and optimum
economic return (Ahmad 2000). Fertilization is one factor as most contributors which
accounting for 29% of the yield increment. Requirements of N are up to 1.2 kg N per
palm per year has been recorded (Kwan 1998). It is reported that applications of
nitrogen fertilizer and Fresh Fruit Bunch (FFB) production of oil palm on mineral soils
have a linear correlation. FFB production increased with increasing amount of N
fertilizer rate (Khasanah et al. 2012). Approximately 18.8 t ha-1
yr-1
FFB productions
were produced from the application of 141 kg N ha-1
yr-1
of N fertilizer application. N
rates should be higher where planting density are low (112 – 128 palm ha-1
) and usually
lower when planting density are high (138 – 148 palm ha-1
) (Von Uexkull and Fairhurst
1991). FFB yields are attained peak yield earlier at between 8 and 10 years after
planting. However, FFB yield will usually decline 16 year after planting, due to
Chapter 1
16
increasing difficulty in harvesting and need to maintain number of fronds for better
harvesting efficiency (Goh and Teo 1997). Any difference in FFB yield responses are
depends on climate, soil condition, fertilization, uptake and demand of nutrient. Nutrient
uptake rate is generally influenced by root length, soil nutrient concentration and soil
water content, and nutrient demand is dominated by oil palm growth and production
(Tinker and Nye 2000). Therefore, it is necessary to ensure that the oil palm is planted
on suitable land and keep maintain on fertilizer management to gain high oil palm yield.
1.3.3 Nitrogen fertilizer types
N is important plant nutrient in biochemical process and affects very important
physiological process such as photosynthesis which in turn affects growth and yield of
palm. Oil palm requires four macronutrients from fertilizer such as nitrogen (N),
phosphorus (P), potassium (K), and magnesium (Mg). N fertilizers namely ammonium
nitrate (26% N), ammonium sulphate (21% N), ammonium chloride (25% N), urea
(46% N), blended NPK, NP and PK are commonly used as a form of conventional
fertilizer. While rock phosphates (27-34% P2O5), muriate of potash (MOP, 62% K2O),
for kieserite or magnesium sulfate (17% Mg; 23% S), sodium borate are also used (FAO
2005; Gerendas and Heng 2010). Currently, urea and urea based fertilizers mostly used
Chapter 1
17
for oil palm to its high N content and low price (Zakaria and Tarmizi 2007). However,
conventional N fertilizer is easily be released and lost during its biochemical
transformation in the soil, water and atmospheric system. Tremendous loss of N from
conventional fertilizer decreased yield and brought negative impact on the environment
by leaching, volatilization and nitrous oxide emissions.
Considering the problem of conventional N fertilizer, Shoji and Gandeza
(1992) reported the practical application to increase the efficiency of fertilizer by
introducing the concept of controlled release fertilizer. One type of controlled release
fertilizer is coated urea, Meister (41-42% N). Meister is used as raw materials of
blended fertilizer, since it is a straight fertilizer containing only nitrogen. It is mixed
with phosphate, potassium, microelement, ammonium fertilizer granules (Sakamoto
2012). Coated fertilizer is required to avoid N loss through leaching, volatilization, and
denitrification. Coated fertilizer inhibits the N loss and serve to release N in a mode that
is compatible with the metabolic requirements of plants. Coated fertilizer is basically
determined by blending water permeable and water impermeable resins and surfactants.
The release rate is primarily governed by soil temperature and is hardly affected by
other soil conditions. Application of coated fertilizer in agriculture is great because of
Chapter 1
18
such advantages as labor saving, increased nutrient efficiency, improved yield, and
reduced negative environmental effects (Trenkel 1997).
N fertilizer additive which has potentially effective for N loss and reducing of
N2O emissions is nitrification inhibitors. Nitrification inhibitors are chemicals that slow
down or delay the nitirification process, thereby decreasing the possibility the large
losses of nitrate will occur before the fertilizer nitrogen is taken up by the plants
(Nelson and Huber 2001). Nitrification inhibitors have used in the field to improve the
efficiency of fertilizers and to reduce both nitrate leaching and denitrification by
maintaining the N in the soil as NH4+. Dicyandiamide (DCD) act as a nitrification
inhibitor by inhibing the first stage of the nitrification process, the oxidation of NH4+ to
NO2-, and rendering bacterial enzymes ineffective. Therefore DCD can regarded as a
slow release N fertilizer (containing about 65% N) (Di and Cameron 2006; Jumadi
2008b).
The development of innovative technologies plays an important priming effect
of the extensive fertilizers use for agriculture. The potential benefit from any kind of
fertilizers application depends on a number of site-specific, such as soil type, climate,
cultural practices, and N management program.
Chapter 1
19
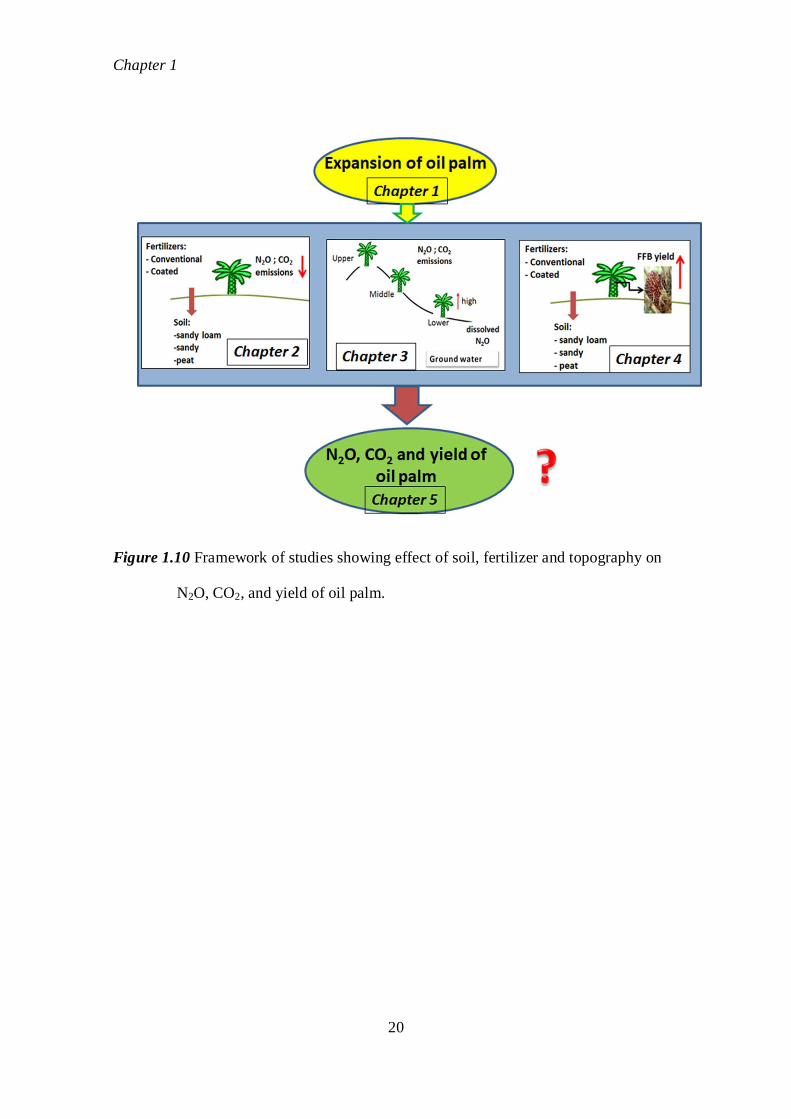
1.4 Objective of studies
Global demand for palm oil is expected to increase and the expansion of oil
palm plantations raises environmental concern. Assessments to develop alternatives
relating to soil, fertilizers and topography are necessary to improve high value of oil
palm more environmentally compatible (Fig. 1.10). Therefore, objectives of studies as
below:
1. To determine effect of soil types and N fertilizers on emissions of greenhouse gases,
N2O and CO2 under tropic oil palm.
2. To determine effect of topography to control spatial variation on N2O and CO2
emission and to assess dissolved N2O concentration as a source of indirect emission
under tropic oil palm.
3. To determine effect of conventional and coated fertilizers on fresh fruit bunch (FFB)
yield in different soil types under tropic oil palm.
Chapter 1
20
Figure 1.10 Framework of studies showing effect of soil, fertilizer and topography on
N2O, CO2, and yield of oil palm.
Chapter 2
21
Chapter 2
Effect of soil types and nitrogen fertilizer on nitrous oxide and carbon dioxide
emissions in oil palm plantations
2.1 Abstract
Oil palm (Elaeis guineensis Jacq.) production in Indonesia and Malaysia is
currently the focus of concern due to its potential impact on the environment via
greenhouse gas emissions. Oil palm plantations have been reported to release large
quantities of nitrous oxide (N2O) into the atmosphere, which is most likely linked to
nitrogen (N) fertilizer use. However, there are still limited studies comparing effects of
the type of soil and N fertilizer on N2O and carbon dioxide (CO2) emissions. This study
aimed to evaluate the effects of soil types and N fertilizer on N2O and CO2 emissions in
oil palm plantations. N2O and CO2 emissions were measured for 15–16 months from
2010–2012 in Tunggal sandy loam soil, Indonesia, and in Simunjan sandy soil and
Tatau peat soil, Malaysia. Within each site, treatments with coated fertilizer and
conventional fertilizer, and unfertilized with and without tillage, were established. N2O
and CO2 fluxes showed high variabilities with seasons, types of soil and fertilizer
treatments. The mean of the N2O fluxes from each treatment in the Simunjan sandy soil
Chapter 2
22
was the lowest among the three soils, ranging from 0.80 to 3.81 and 1.63 to 5.34 μg N
m−2
h−1
in the wet and dry seasons, respectively. The mean of the N2O fluxes from each
treatment in the Tunggal sandy loam soil ranged from 27.4 to 89.7 and 6.27 to 19.1 μg
N m−2
h−1
in the wet and dry seasons, respectively. The mean of the N2O fluxes was
found to be the highest among the three soils in each treatment of the Tatau peat soil,
ranging from 131 to 523 and 66.1 to 606 μg N m−2
h−1
in the wet and dry seasons,
respectively. The N application rate of coated fertilizer was about half that of
conventional fertilizer and was applied as deep placement. In the Tunggal soil, coated
fertilizer reduced N2O emissions by 31 and 48% in wet and dry seasons, respectively,
compared to the conventional fertilizer, and was similar to unfertilized treatment.
However, N2O emissions increased in Simunjan and Tatau soils during dry seasons.
There was no significant difference between treatments. These results show that N2O
and CO2 fluxes in the tropical oil palm plantations were significantly affected by the
type of soil, but not always by fertilizer treatments.
Key words: N fertilizer, N2O and CO2 fluxes, sandy loam, sandy, peat soil.
Chapter 2
23
2.2 Introduction
Carbon dioxide (CO2) and nitrous oxide (N2O) account for 76 and 6% of the
total anthropogenic greenhouse gas (GHG) emissions, respectively, at different values
of global warming potentials (Rogner et al. 2007; IPCC 2014). Based on limited study,
the largest anthropogenic source N2O emissions was from agriculture which accounts
for 67%. Agriculture contributed direct and indirect emissions. Fertilizer and livestock
manure as direct emissions contributed 42%, and runoff and leaching of fertilizer as
indirect emissions contributed 25% (IPCC 2007). However, agricultural soils besides as
a source, also as a sink for carbon and nitrogen (N) gases (Bouwman et al. 1995).
Oil palm plantations have been reported to release large quantities of N2O into the
atmosphere, which is most likely linked to N fertilizer use. When examining the GHG
emissions among land uses in Jambi, Sumatra Island, Indonesia, Murdiyarso et al.
(2002) found that oil palm plantations released large quantities of N2O into the
atmosphere. N fertilizer, by increasing N availability, plays a significant role in soil
carbon sequestration by increasing crop biomass and by influencing the microbial
decomposition of crop residue (Green et al. 1995; Lal 2004). The emission factor (EF,
i.e., the ratio of N2O-N emission to input of N fertilizer) is often estimated using the
default IPCC value as 1% for mineral soil, but 16% for tropical organic soil (peat soils)
Chapter 2
24
(IPCC 2006). However, there are large variations in EF due to differences in
environment, crops and management.
Although applications of N fertilizer consistently increase crop biomass, its effect
on soil carbon content varies with the type of soil (Alvarez 2005), which affects the flux
of CO2 into the atmosphere. Soils in tropical ecosystems emit far more N2O than soils in
other terrestrial ecosystems (Sanhueza et al. 1990). Because of the variability in soil
types and soil moisture, some tropical soils emit more N2O than others. Puerto Rican
Vertisol has been reported to have an EF of approximately 4%, which is five times what
is reported for unfertilized fields (Mosier and Delgado 1997). Studies on tropical peat
soils have established that emissions of N2O are related to both season and land use
changes (Hadi et al. 2000; Inubushi et al. 2003). However, studies that compare the
effect of soil types with N fertilizer, in relation to N2O and CO2 emission rates, are still
limited. Coated fertilizer is one of fertilizer forms that have been reported to reduce N2O
emission rate by effectively controlling the release of NH4+, which caused a prolonged
production period of NO3– in Japanese Andosol (Hou et al. 2000; Amkha et al. 2009).
In imperfectly drained Gleysol, N release from coated fertilizer matches with plant
demand and N use efficiency increase, and the resulting low NO3– concentration would
be expected to limit denitrification, providing an explanation for the low N2O fluxes
Chapter 2
25
(Akiyama et al. 2009). Coated fertilizer releases an adequate amount of N to meet the
crop’s N requirement at various growth stages and enhance the N uptake by deep-side
placement in clayey and sandy paddy soil (Acquaye and Inubushi 2004).
In this study, over a period of more than a year, the emissions of the greenhouse
gases N2O and CO2 evaluated from oil palm plantation fields in Indonesia and Malaysia,
across three types of soil (sandy loam, sandy and peat soil) in response to treatments of
N fertilizer application.
2.3 Materials and Methods
2.3.1 Site descriptions and treatments
Study sites were located in oil palm plantation areas on tropical land, with one
site in Indonesia and two sites in Malaysia (Fig. 2.1). The first site was located in
Tunggal Plantation, Riau Province, Indonesia (S00°20.731’, E102°17.617’) on sandy
loam soil classified as Ultisols [according to the United States Department of
Agriculture (USDA) Soil Taxonomy]. The Tunggal Plantation site has a sloping
topography with an annual rainfall of 1387 mm. The second site was located in
Simunjan Plantation, Sarawak, Malaysia (N01°03.958’, E110°51.798’) on sandy soil,
which was also classified as Ultisols. The Simunjan Plantation site is characterized by
Chapter 2
26
sloping topography with an annual rainfall of 4095 mm. The third site was located in
Tatau Plantation, Sarawak, Malaysia (N02°57.924’, E112°45.851’) on peat soil,
classified as Histosols. The Tatau Plantation site is characterized with a flat topography,
located along the coast, with an annual rainfall of 2225 mm. Three replications of the
following four experimental treatments were conducted:
Treatment B: no nitrogen fertilizer and no tillage.
Treatment B2: no nitrogen fertilizer, with tillage only in the soil (0–15 cm).
Treatment C: conventional fertilizer (non-coated) surface application on four spots
approximately 140 cm away from palm trees, with no tillage.
Treatment M: coated fertilizer in granular form was applied by the deep placemen
method: namely, after digging soil to 0–15 cm depth at four different
spots, approximately 140 cm away from palm trees, fertilizer was
incorporated and covered with soil.
Except for B and B2 treatments, the annual rates (kg N ha−1
) of application for the
conventional fertilizer were 151 as NPK (Nitrogen-Phosphorous-Potassium) (16-4-25),
107 in the first year and 121 in the second year as NK1 (1:1 mixture of ammonium
sulphate and MOP (Muriate of Potash)), and 69 as urea in Tunggal, Simunjan and Tatau,
respectively. The rate of conventional fertilizer application followed each plantation’s
Chapter 2
27
guidelines. It was considered that the coated fertilizers are more efficient due to a lower
loss rate of N (Shoji and Kanno 1994). Hence, the rates of application for the coated
fertilizer were about half the rate of the conventional fertilizers, namely 76, 62 and 46
kg N ha−1
in Tunggal, Simunjan and Tatau, respectively. As indicated in Fig. 2.2–2.4,
solid arrows and dashed arrows indicate conventional and coated fertilization times,
respectively. In Tunggal, fertilizers were applied once each in the wet season and dry
season for both conventional and coated fertilizer. In Simunjan, fertilizers were applied
twice for conventional fertilizer and once for coated fertilizer in the first wet season,
once for both conventional and coated fertilizer in the dry season, and once for both
conventional and coated fertilizer in the second wet season. In Tatau, fertilizers were
applied twice for conventional fertilizer and once for coated fertilizer in the first wet
season, once for both conventional and coated fertilizer in the dry season, and once for
coated fertilizer in the second wet season.
Physicochemical analysis of the soil samples both undisturbed soil cores and
composite soil samples were collected from the three replications from the 0–10 cm soil
depth. The soil samples were analyzed for their physical and chemical properties. Prior
to analysis, the soil samples were maintained at 4°C. The undisturbed soil cores were
measured for soil volume using a three-phase meter (DIK-1130, Daiki Rika Kogyo Co.
Chapter 2
28
Ltd). The core samples were weighed and oven dried at 105°C for 48 h. After drying,
the core samples were reweighed to calculate soil moisture content, bulk density (BD)
and water-filled pore space (WFPS). Soil particle size distribution was determined by
the Bouyoucos hydrometer method (Kroetsch and Wang 2008). Soil samples were air
dried and passed through a 2-mm sieve, and the sieved soil was extracted with
potassium chloride (KCl) solution at a 1:2.5 soil-to-solution ratio. The resulting soil
suspension was shaken for approximately 1 h before filtration through filter paper. The
soil pH was measured with a glass electrode pH meter (D-52, Horiba Co., Ltd). Total
carbon and nitrogen contents were determined using a Carbon and Nitrogen Analyzer
(CN corder; MT-700 Yanaco Analytical Industry Co., Ltd). The inorganic N contents of
NH4+ and NO3
– were determined by sieving fresh soil through a 2-mm sieve, extracting
it in 1 M KCl, and using the nitroprusside method (Anderson and Ingram 1989) and
hydrazine reduction method (Hayashi et al. 1997), respectively. To investigate the effect
of soil water on N2O and CO2 productions, soil moisture was monitored and recorded
using a Watermark and Sensor TR-0306 (equipped with a stainless steel protective tube)
connected to a Thermo Recorder (TR-71Ui; T&D Corporation). The device measures
the soil moisture tension (pF unit) to indicate soil moisture level. The lower the reading
the higher soil moisture content, and conversely, the higher the reading the lower the
Chapter 2
29
moisture content (Tan 1996). Soil temperature was measured and recorded using a
thermo sensor (203AT; T&D Corporation) with a thermo recorder at 10 cm soil depth.
Every 3 months, the recorded data were downloaded to a computer. The precipitation
data were collected by oil palm plantation staff members using rain gauges located
within the oil palm plantation areas.
2.3.2 Measurement of N2O and CO2 fluxes
Measurement of N2O and CO2 fluxes was conducted at 2-week intervals over a
period of 15 months from December 2010 to February 2012 at Simunjan and Tatau
Plantations and over a period of 16 months from March 2011 to June 2012 at Tunggal
Plantation. Gas sampling was consistently conducted at mid-morning. N2O and CO2
fluxes were determined by placing a 20.8 cm diameter and 14.2 cm height PVC pipe
chamber driven to a depth of 5 cm into the soil at approximately 1 m distance from the
palm tree’s trunk (Handayani et al. 2010) in the area under the shade of the palm tree
canopy. The chamber was replicated at three different places at least 10 m apart at each
treatment site, and included the fertilized spot. Gas samples were taken from each
chamber, after stabilizing the chamber for 5 min, using a 30-mL gas syringe with tubes
connecting to the chamber. Gas samples were collected at 0-, 10- and 20-min intervals
Chapter 2
30
and were injected into glass vials that had been evacuated and closed tightly with a
butyl rubber seals. The filled vials were transported to the laboratory, where N2O and
CO2 fluxes were measured by a gas chromatograph (GC-14B, Shimadzu, Japan)
equipped with an electron capture detector (ECD) and thermal conductivity detector
(TCD), respectively. The emission factor (EF) was calculated using cumulative N2O
fluxes to determine the percentage of N2O-N emitted for each fertilizer treatment
(Dobbie and Smith 2003a; Jumadi et al. 2008). The emission factor (EF) was calculated
using the following formula:
EF (%) = (M-B2)/N x 100 or (C-B)/N x 100 (1)
where M and C are the cumulative N2O fluxes emitted from coated fertilizer and
conventional fertilizer treatment (kg N2O-N ha−1
period−1
), respectively; B2 and B are
the cumulative N2O fluxes (kg N2O-N ha−1
period−1
) emitted from non-N fertilizer
treatment with and without tillage, respectively.
2.3.4 Statistical analysis
The significance of the cumulative N2O and CO2 fluxes for each treatment and
study site were analysed using a two-way analysis of variance (ANOVA) test. The
relationship between N2O and CO2 emissions were analysed using linear regression.
Chapter 2
31
Means of N2O and CO2 fluxes for each treatment and study site during wet and dry
seasons were analysed using a three-way ANOVA test. Correlations between gas
emission and soil physicochemical properties among the study sites were analysed using
Pearson’s correlation. Statistical considerations were based on p < 0.05 and p < 0.001
significance levels. Statistical analyses were conducted using IBM SPSS Statistics 21.
2.4 Results
2.4.1 Physicochemical soil properties of study sites
The physicochemical properties of the three soil types were varied (Table 2.1).
In Tunggal and Simunjan, both were mineral soils with different particle size
distributions. Sand content was higher in Simunjan than in Tunggal, while clay and silt
contents were higher in Tunggal than in Simunjan. Other soil parameters such as NO3–,
NH4+, total N, total carbon and WFPS were higher in Tatau peat soil than the other two
mineral soils. Soil pH and BD were lower in the Tatau peat soil than in the other two
mineral soils. Soil N2O emission for Tunggal, Simunjan and Tatau are shown in Fig. 2.2,
2.3 and 2.4, respectively. In Tunggal sandy loam soil, it was observed that there were
high N2O fluxes (279–581 μg N m−2
h−1
) during the wet season, especially after the first
fertilization, and high precipitation, which gradually declined thereafter. The peak of
N2O fluxes appeared again after a heavy precipitation in the second wet season (Fig.
Chapter 2
32
2.2). In the Simunjan sandy soil, N2O fluxes were lower (up to 52.5 μg N m−2
h−1
) than
in the Tunggal sandy loam soil, but peaks were observed after heavy rains not only in
the wet season, but also in the dry season (Fig. 2.3). N2O fluxes in the Tatau peat soil
were higher and more variable (up to 1022 μg N m−2
h−1
) than the fluxes in the two
mineral soils during the study period, and only in treatment M, N2O fluxes were highest
in the dry season, but the N2O fluxes in the other treatments were higher in the wet
seasons (Fig. 2.4).
During the study period, N2O fluxes varied across all study sites and treatments
(Table 2.2). Across all the study sites, the mean of N2O fluxes in the Simunjan sandy
soil was lowest, ranging from 0.80 to 3.81 and 1.63 to 5.34 μg N m−2
h−1
in the wet and
dry seasons, respectively. The mean of N2O fluxes in the Tunggal sandy loam soil
ranged from 27.4 to 89.7 and 6.27 to 19.1 μg N m−2
h−1
in the wet and dry seasons,
respectively. The mean of N2O fluxes was highest in the Tatau peat soil among the three
soils, ranging from 131 to 523 and 66.1 to 606 μg N m−2
h−1
in the wet and dry seasons,
respectively. Coated fertilizer reduced N2O emission by 31 and 48% in wet and dry
seasons, respectively, compared to conventional fertilizer, and almost equaled the
unfertilized treatment only in the Tunggal soil, but increased in Simunjan and Tatau
soils in dry season. Three-way ANOVA for each treatment and study site during wet
Chapter 2
33
and dry seasons determined that there were statistically significant differences in means
of N2O fluxes among the study sites (p = 0.000), sites and treatments (p = 0.038),
treatments and seasons (p = 0.053) and combination factor of sites, treatments and
seasons (p = 0.020) (Table 2.2). The cumulative N2O fluxes are summarized in Table
2.3. Cumulative N2O fluxes ranged from 0.59 to 4.09, 0.11 to 0.42 and 11.1 to 42.7 kg
N ha−1
period−1
, in Tunggal sandy loam soil, Simunjan sandy soil and Tatau peat soil,
respectively. Results indicated the highest cumulative N2O fluxes in the Tatau peat soil
and the lowest cumulative N2O fluxes in Simunjan sandy soil. Two-way ANOVA
analysis determined that there were statistically significant differences in cumulative
N2O fluxes among the study sites (p = 0.000), though no significant difference was
found in the treatments within each study site (p = 0.125) (Table 2.3). Among the three
study sites, the N2O emission factors were significantly affected by sites (p = 0.000),
fertilizer treatment, i.e., use of conventional and coated fertilizer (p = 0.038), and
interaction of the sites and fertilizer treatments (p = 0.010) (Table 2.4). EF for the
conventional and coated fertilizer applications showed significantly positive correlation
with the soil parameters such as NO3–, NH4
+, total N, total carbon and WFPS, and has a
significantly negative correlation with the soil pH and BD (Table 2.5).
Chapter 2
34
2.4.2 Soil CO2 emission
CO2 fluxes are presented in Fig. 2.2, 2.3 and 2.4 for Tunggal, Simunjan and
Tatau, respectively. During the study period, CO2 fluxes varied across all the study sites
and treatments (Table 2.6). The mean of the CO2 fluxes in the Tunggal sandy loam soil
ranged from 45.5 to 56.8 and 56.4 to 96.5 mg C m−2
h−1
in wet and dry seasons,
respectively. The mean of the CO2 fluxes in the Simunjan sandy soil ranged from 71.1
to 114 and 104 to 134 mg C m−2
h−1
in wet and dry seasons, respectively. The mean of
the CO2 fluxes was found to be the highest in the Tatau peat soil, ranging from 89.8 to
223 and 92.7 to 208 mg C m−2
h−1
in wet and dry seasons, respectively. Three-way
ANOVA for each treatment and study site during wet and dry seasons determined that
there were statistically significant differences in means of CO2 fluxes by effect of study
sites only (p = 0.000) (Table 2.6). In Tatau peat soil, as the soil temperature decreased,
the soil CO2 fluxes tended to increase. However, these CO2 fluxes included both soil
and root respiration, but these values might be underestimated due to relatively long
closure time, as 20 minutes. Cumulative CO2 fluxes ranged from 5302 to 7971, 7638 to
11431 and 8797 to 16949 kg C ha−1
period−1
, in Tunggal sandy loam soil, Simunjan
sandy soil and Tatau peat soil, respectively (Table 2.7). Among the three study sites, the
cumulative CO2 fluxes were the highest in Tatau peat soil and the lowest in Tunggal
Chapter 2
35
sandy loam soil. For cumulative CO2 fluxes, there was a statistically significant
difference among the study sites (p = 0.000) but no significant difference in the
treatments at each study site (p = 0.064).
Soil N2O and CO2 fluxes showed significantly positive linear relationship and
varied among the study sites (Fig. 2.5). Variability observed in N2O emission explained
by 2.71%, 7.19%, and 38% soil CO2 emission in Tunggal sandy loam soil, Simunjan
sandy soil, and Tatau peat soil, respectively.
2.5 Discussion
2.5.1 N2O fluxes and EF correlated with soil and fertilizer types
In Tunggal sandy loam soil, the highest N2O fluxes were measured in the wet
season, March 2011 (Fig. 2.2). High peaks of N2O flux were observed 1 week after the
first fertilizer application in both conventional fertilizer and coated fertilizer treatments,
and also during high precipitation and soil moisture content at the site. As reported by
Clayton et al. (1994) and Webb et al. (2004), increased N2O fluxes after N fertilization
are not unusual and often show a marked response to precipitation events. The results
also showed that N2O fluxes increased after N fertilization, reached a peak, then
decreased rapidly before levelling off after approximately 1 to 2 weeks. Subsequently,
Chapter 2
36
N2O fluxes gradually decreased before sharply increasing again in December 2011 with
both high precipitation and soil moisture. In Simunjan sandy soil, high N2O fluxes were
shown twice in the wet season and one time in the dry season when precipitation was
high (Fig. 2.3). Increased fluxes during these periods coincided with high precipitation
events for 2–3 weeks in duration. Similar results were reported in Minnesota loamy
sand in which irrigated potato fields fertilized with polymer-coated urea exhibiting
increased fluxes in response to high precipitation events (Hyatt et al. 2010). Changes in
the soil moisture content after the precipitation event presumably influenced soil
porosity, consequently increasing the probability of denitrification and diffusion of N2O
out of the soil (Inubushi et al. 1996). During the study period, there were negative N2O
emissions that may be explained by a decrease in gas diffusivity, leading to increased
microbial consumption of N2O and denitrification before emission (Arah et al. 1991).
Although production rates of N2O are usually larger than consumption rates, stressed
soils that are usually considered as net sources of atmospheric N2O can temporarily
become a sink (Minami 1997; Inubushi et al. 2003). In Tatau peat soil, fluxes of N2O
were higher than those in sandy loam and sandy soils. Although the pattern of N2O
fluxes varied during the study period, the coated fertilizer application remained high
throughout the study period (Fig. 2.4). N2O emissions were particularly high when
Chapter 2
37
fertilizer was applied to wet peat soil. N2O emissions from fertilized tropical
agricultural peat soils are high, sometimes even extremely high, especially under humid
climate and organic carbon-rich soil conditions (Williams et al. 1999). The variation in
N2O fluxes is generally relative to the rates of denitrification affected by moisture
content and the quantities of NO3–, NH4
+ and carbon substrates in soil (Clayton et al.
1994; Couwenberg 2009).
Effect of soil water toward the N2O emission explained by Schindlbacher et al.
(2004), N2O emissions increased with decreasing water tension or increasing
water-filled pore space (WFPS). Soil texture, total precipitation and water removal
through soil drainage and evaporation is affected soil moisture which the most
important factor controlling emissions of N2O and NO (Hatano and Sawamoto 1997;
Akiyama et al. 2000). In Simunjan (4095 mm yr-1
), the annual precipitation was higher
than in Tunggal (1387 mm yr-1
) , however soil texture in Simunjan is sandy soil with
high infiltration, drainage, and subsequent high soil aeration caused lower N2O emission
compared to sandy loam soil in Tunggal. It could be seen clearly as comparison in the
Fig. 2.2 and Fig. 2.3 where the maximum precipitation at 50 mm, soil moisture tension
showed as pF 0.5 and pF 2 in Tunggal and Simunjan, respectively. Thus, it explained
that soil moisture content in Tunggal was higher than in Simunjan, since the lower value
Chapter 2
38
of soil moisture tension means the higher soil moisture content, and conversely, the
higher the value the lower the moisture content (Tan 1996). Moreover, the WFPS was
higher in Tunggal than in Simunjan (Table 2.1), thus the N2O emission in Tunggal was
higher compared to Simunjan. Soil water acts as transport medium for NO3- and NH4
+,
and control oxygen transport to soil and affect N gases out from the soil (McTaggart et
al. 2002) and by that it controls whether process of nitrification or denitrification
dominate inside the soil (Pilegaard 2013). Under soil with better aeration such as sandy
soil, the aerobic process of nitrification was feasible to be the main source of N2O
emission, and therefore emission of NO may be more significant (Parton et al. 1988;
Akiyama et al. 2000). After precipitation, the effect of soil texture in determining
aeration and gas diffusion in soil was demonstrated important. Thus, soil water mainly
regulating soil aeration condition as the significant factor for N2O emissions in the
tropical soil (Davidson 1991; Werner et al. 2007b), whereas by cause of complexity of
interacting environmental control, it is difficult to capture the only one factor which the
most predictive value affecting the N2O emissions (Andersson et al. 2003).
In this study, patterns of N2O emissions were affected by types of soil,
precipitation and soil moisture. Considering types of soil, peat soil is known as organic
soil has greater at least 12% organic contents on dry weight basis and more than 50 cm
Chapter 2
39
in depth (Inubushi 2015) compare to the mineral soil. The peat soil form where
prolonged saturation with water results in a deficiency of oxygen, so that soil
environment became anaerobic. In turn, decomposition of organic matter such as plant
debris becomes slow, as the results promote the accumulation high amount of organic
matter in the soil, sometime 50% in volume (Inubushi 2015). Peat soil such waterlogged
areas are more generally present in wetlands and 10% of the global peatlands occurs in
tropical lowlands (Hillel and Rosenzweig 2011). Soil organic matter is also a major
source of N. Soils contain approximately 907 kg N in organic forms for each percent of
organic matter. Decomposition of this portion of organic matter proceeds at a rather
slow rate and releases about 22.4 kg N ha-1
yr-1
for each percent of organic matter. Then
organic N that is present in soil organic matter and crop residues is converted to
inorganic N through the process of mineralization (Lamb et al. 2014).
Freshly wetted soils have the high carbon and N availability that is linked to
high denitrification rates (Peterjohn and Schlesinger 1991). The occurrence of rainfall
events stimulates soil N mineralization (Jantalia et al. 2008). Tropical peat land could
be a potential source of GHG emissions because peat soil contains large amounts of soil
carbon and N (Ismunadji and Soepardi 1984; Melling et al. 2005). However,
management practices via physical compaction could increase BD, resulting in higher
Chapter 2
40
capillary rise and high moisture content that could decrease the soil CO2 flux (Melling et
al. 2005). High N2O fluxes in peat soils are further correlated significantly with
denitrification activity where a high content of NO3–, NH4
+ and WFPS are present in the
soil (Ismunadji and Soepardi 1984). Large amounts of NH4+
and NO3– accumulate when
organic matter in peat soil undergoes either aerobic or anaerobic decomposition
(Ismunadji and Soepardi 1984). This could pose a great threat to the environment by
emitting N2O. Soil pH has a marked effect on the products of denitrification.
Denitrification rates would be slower under the strong acid conditions in Tatau peat than
under the slightly less acid conditions in the other two soils. This is commonly
attributed to the sensitivity of N2O reductase to proton activity, and it is also likely that
all denitrifying enzymes are susceptible at low soil pH and produce N2O from other
intermediate products (Nägele and Conrad 1990).
In this study, coated fertilizer reduced N2O emission in Tunggal sandy loam
soil. However, coated fertilizer exhibited higher N2O emission compared to
conventional fertilizer in Simunjan sandy soil and Tatau peat soil. Delgado and Mosier
(1996) observed similar results in which N2O emissions from polyolefin-coated urea
remained higher than non-coated urea through the growing season in a barley (Hordeum
vulgare L.) field on sandy soil. Coated N fertilizer exhibits an intermediate rate of
Chapter 2
41
emissions that continue for a relatively long period. The effectiveness of coated
fertilizers for N2O emission mitigation depends on increases in the nitrification derived
N2O emissions after fertilizer application and on N substrate availability in Andosol and
Fluvisol (Uchida et al. 2013). Application of conventional fertilizer often causes a sharp
peak immediately after applying the fertilizer, while coated urea shows a broader peak
(Akiyama et al. 2000). Additional results show that the effectiveness of coated fertilizer
for N2O mitigation was dependent on soil and land-use type, where coated fertilizer was
significantly effective for imperfectly drained Gleysol grassland but not effective for
well-drained Andosol upland fields (Akiyama et al. 2009).
Impact of fertilizer designed to reduce N2O emission seems are inconsistent
because of interact with weather factor which directly affect the process to lead to
gaseous N losses and NO3- leaching and plant uptake factor which indirectly affect these
N process in the soil (Ogle et al. 2014). Concerning with effectiveness of coated
fertilizer to decrease N2O emission on sandy loam soil than peat soil, it may be related
with plant uptake by oil palm plantation which is affected by ages of oil palm. Coated
fertilizer release N through coating and it has potential to reduce N2O emission if the
release of N from coated fertilizer is well synchronized with plant uptake (Shaviv 2001).
However, when N release from coated fertilizer is not match with ability plant uptake,
Chapter 2
42
the efficiency coated fertilizer can be decline. It reported by Akhir et al. (2015) that N2O
emission influenced by ages of palm plantation. It found that N2O emission was highest
for oil palm aged < 5 years (immature) compared to mature palm in aged 5 – 20 and 21
– 30 years in Kempas, Malaysia. Furthermore, Basuki et al. (2014) explained that by
increasing of oil palm age from > 3 to 16 years old, it decreasing gradually the total N
content. It is indicated that by increasing the age of oil palm is related to greater N
absorption by plant and consequently will decrease total N in the soil. Oil palm
plantation as perennial crop, usually in mature palms are able to take complete nutrient
for growth because of its complete root system compared to the young palm. As
explained by Corley and Tinker (2003) stated that on the structure of oil palm roots in
relation to nutrient acquisition, thus less of nutrient will be taken up by the roots when
fertilizer applied at condition where the amount of roots at its minimum (Kheong et al.
2010). Therefore, maximum uptake of N fertilizer can occur at mature palms compared
to immature palms. In mature palm has systematic and well established palm canopy
cover and ground cover than can also reduce the nutrient leaching loss (Akhir et al.
2015).
In Tunggal sandy loam soil, oil palm age was 7 years old (mature) while in
Tatau peat soil, age of oil palm was 4 years old (immature). It could be explained that
Chapter 2
43
possible reason coated fertilizer in Tunggal sandy loam soil was more effective because
it have high plant uptake, so when the N release from coated fertilizer the root can be
absorb N from the soil sufficiently due to complete root system. Hence, it will increase
suitability of N for plant, and the amount of N2O from nitrification will reduced. In
contrast, in Tatau peat soil, one of the most difficult problems to counteract is the poor
root anchorage provided by the soft peat (Dolmat et al. 1982). It may be difficult to
reduce N2O emission by coated fertilizer, when N uptake by plant occurs slower due to
incomplete root system to absorb N from the soil inadequately. Consequently, on peat
soil, denitrification is considered the main path of N2O production with high
decomposition of peat. High level of organic matter and application of N fertilizer on
peat soil may induce higher N2O emission (Bouwman 1996; Bremner 1997).
The emission factors are the highest for Tatau peat soil compared with Tunggal
sandy loam and Simunjan sandy soil. These results are similar to the reported values in
the Netherlands which indicated that the EF of synthetic fertilizer with nitrate was the
highest in peat soil (3.68%), followed by clay soil (1.38%) and sandy soil (0.57%)
(Kuikman et al. 2006). In well-drained Alluvial soil in Indonesia, the EF of urea and the
controlled release factor (CRF-LP30) were 1.61% and 1.42%, respectively (Jumadi et al.
Chapter 2
44
2008b). Therefore, these EF values are mostly dependent on management practices,
fertilizer types, climates and soil types.
2.5.2 CO2 fluxes correlated with soil types
Soil CO2 flux is generally positively correlated with soil temperature (Lloyd
and Taylor 1994; Davidson et al. 1998; Nagano et al. 2012) and the rates of soil CO2
flux vary by ecosystem (Raich and Schlesinger 1992; Melling et al. 2005). In this study,
the soil CO2 fluxes were not directly influenced by soil temperature. In the Tatau peat
soil, as the soil temperature decreased, the soil CO2 fluxes tended to increase. This may
be confounded with the increase in oil palm growth, where higher root biomass would
result in higher root respiration. The root biomass could have also stimulated the soil
microbial activity, which enhanced the soil CO2 fluxes. In the other two mineral soils,
the CO2 fluxes tended to be higher in the Simunjan sandy soil than in the Tunggal sandy
loam soil. In the Tatau peat soil, CO2 fluxes were the highest among three soils
examined which may be due to higher soil carbon content. The relationship between
quantity of soil carbon, soil CO2 flux and litter respiration remains a serious concern
(Gu et al. 2004). The rate of CO2 transmission from soils to the atmosphere is
determined by microbial respiration, root respiration and bulk soil respiration and is
Chapter 2
45
predominately regulated by soil microorganisms found within the soil organic matter
(Raich and Schlesinger 1992).
In this study the N2O and CO2 correlations revealed the linear regression varied
depending on the study site. Linear regression between N2O and CO2 found higher in
Tatau peat soil than in Tunggal sandy loam and in Simunjan sandy soil (Fig. 2.5). The
variation may reflect the differences in soil carbon and nitrogen composition and the
effect on climate and soil environmental conditions (Xing et al. 2002). Garcia-Montiel
et al. (2002) explained the positive correlations between N2O and CO2 as the result of
O2 availability in soil microsites. A higher soil CO2 emission rate indicates greater
decomposition, which consumes oxygen, and creates the anaerobic conditions that are
favourable for N2O production via denitrification. The linear relationship between N2O
and CO2 fluxes was also found across several types of ecosystems, such as rice paddy,
dry cropland, bogs and fens, and subtropical and tropical moist forest (Xu et al. 2008).
Chapter 2
46
2.6 Conclusion
The effect of soil types on N2O and CO2 fluxes in the studied tropical oil palm
plantation was highly significant, but no consistent tendency was observed using
different N fertilizers. N2O and CO2 fluxes showed high variation with soil types, N
fertilizer and seasons. N2O fluxes were the highest in the Tatau peat soil, followed by
the Tunggal sandy loam soil and the Simunjan sandy soil, respectively. There was a
significantly positive linear correlation between fluxes of N2O and CO2. Applications of
fertilizer have to be considered with the suitability of the soil type to mitigate the gas
emission to the atmosphere. Further detailed study is needed to assess a more accurate
interpretation of the mechanism of N2O and CO2 fluxes in oil palm plantations.
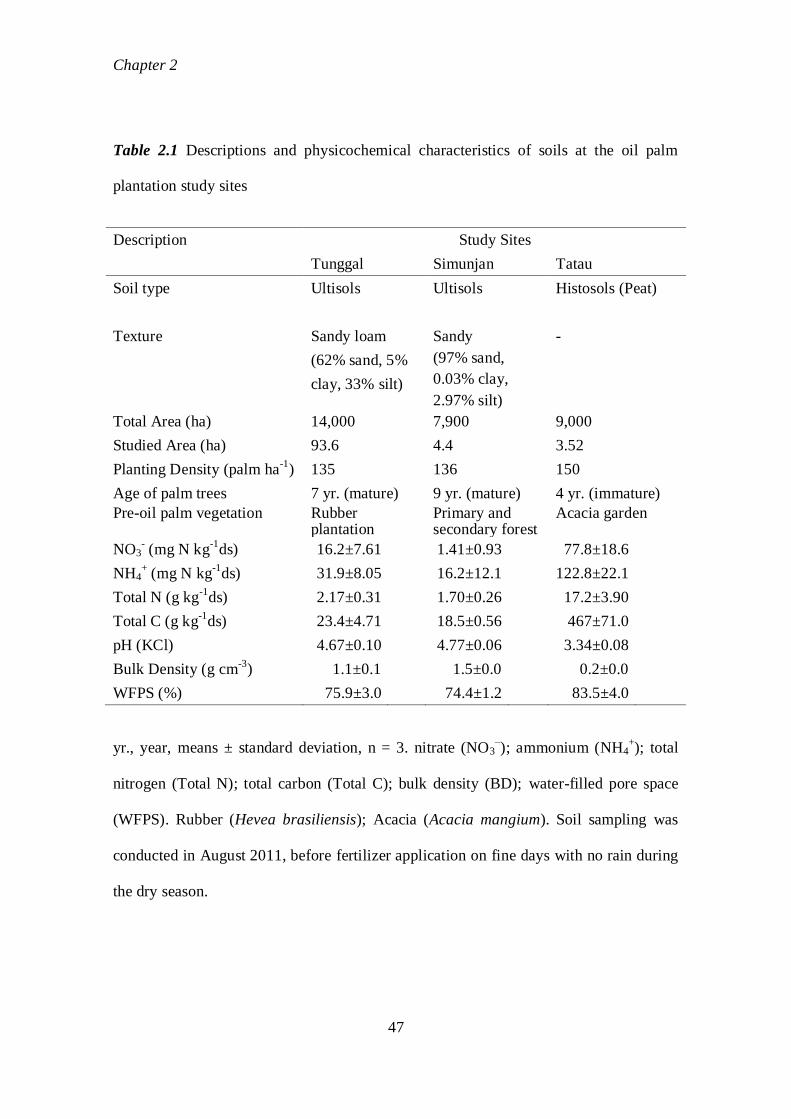
Chapter 2
47
Table 2.1 Descriptions and physicochemical characteristics of soils at the oil palm
plantation study sites
Description Study Sites
Tunggal Simunjan Tatau
Soil type
Ultisols Ultisols Histosols (Peat)
Texture Sandy loam
(62% sand, 5%
clay, 33% silt)
Sandy
(97% sand,
0.03% clay,
2.97% silt)
-
Total Area (ha) 14,000 7,900 9,000
Studied Area (ha) 93.6 4.4 3.52
Planting Density (palm ha-1
) 135 136 150
Age of palm trees 7 yr. (mature) 9 yr. (mature) 4 yr. (immature)
Pre-oil palm vegetation Rubber plantation
Primary and secondary forest
Acacia garden
NO3- (mg N kg
-1ds) 16.2±7.61 1.41±0.93 77.8±18.6
NH4+ (mg N kg
-1ds) 31.9±8.05 16.2±12.1 122.8±22.1
Total N (g kg-1
ds) 2.17±0.31 1.70±0.26 17.2±3.90
Total C (g kg-1
ds) 23.4±4.71 18.5±0.56 467±71.0
pH (KCl) 4.67±0.10 4.77±0.06 3.34±0.08
Bulk Density (g cm-3
) 1.1±0.1 1.5±0.0 0.2±0.0
WFPS (%) 75.9±3.0 74.4±1.2 83.5±4.0
yr., year, means ± standard deviation, n = 3. nitrate (NO3–); ammonium (NH4
+); total
nitrogen (Total N); total carbon (Total C); bulk density (BD); water-filled pore space
(WFPS). Rubber (Hevea brasiliensis); Acacia (Acacia mangium). Soil sampling was
conducted in August 2011, before fertilizer application on fine days with no rain during
the dry season.
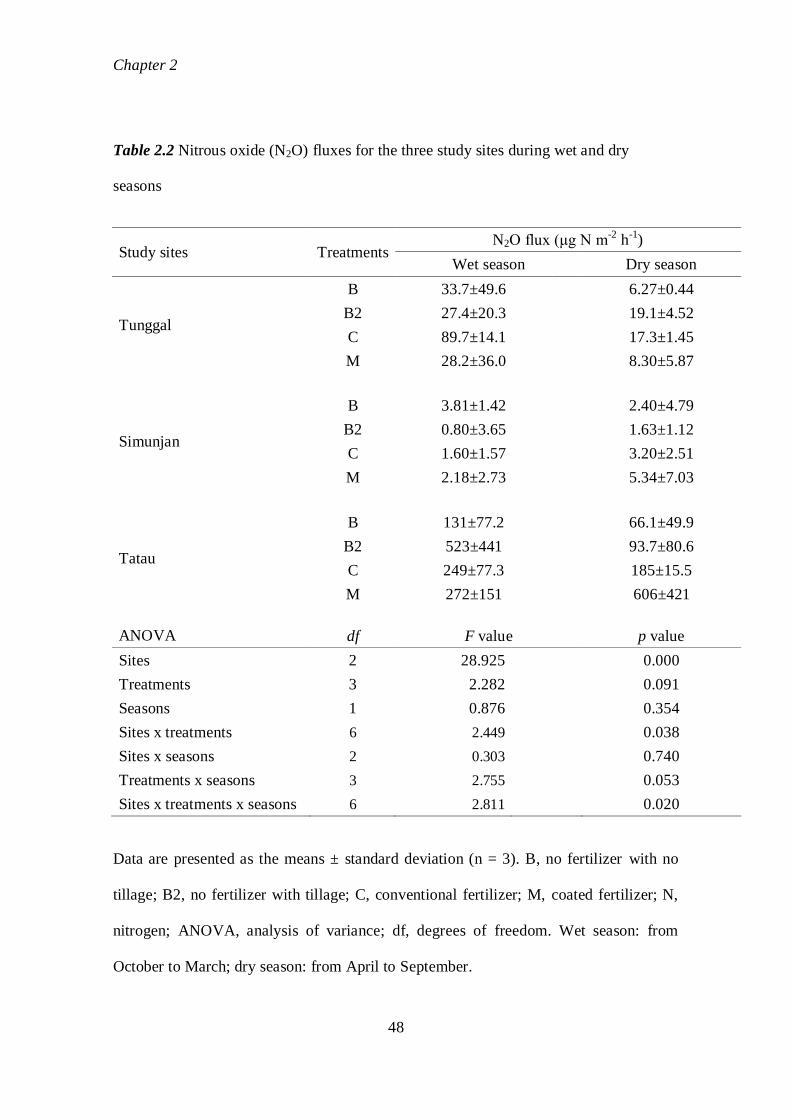
Chapter 2
48
Table 2.2 Nitrous oxide (N2O) fluxes for the three study sites during wet and dry
seasons
Study sites Treatments N2O flux (μg N m
-2 h
-1)
Wet season Dry season
Tunggal
B 33.7±49.6
6.27±0.44
B2 27.4±20.3
19.1±4.52
C 89.7±14.1
17.3±1.45
M 28.2±36.0
8.30±5.87
Simunjan
B 3.81±1.42
2.40±4.79
B2 0.80±3.65
1.63±1.12
C 1.60±1.57
3.20±2.51
M 2.18±2.73
5.34±7.03
Tatau
B 131±77.2
66.1±49.9
B2 523±441
93.7±80.6
C 249±77.3
185±15.5
M 272±151
606±421
ANOVA df F value p value
Sites 2 28.925 0.000
Treatments 3 2.282
0.091
Seasons 1 0.876
0.354
Sites x treatments 6 2.449
0.038
Sites x seasons 2 0.303
0.740
Treatments x seasons 3 2.755
0.053
Sites x treatments x seasons 6 2.811 0.020
Data are presented as the means ± standard deviation (n = 3). B, no fertilizer with no
tillage; B2, no fertilizer with tillage; C, conventional fertilizer; M, coated fertilizer; N,
nitrogen; ANOVA, analysis of variance; df, degrees of freedom. Wet season: from
October to March; dry season: from April to September.
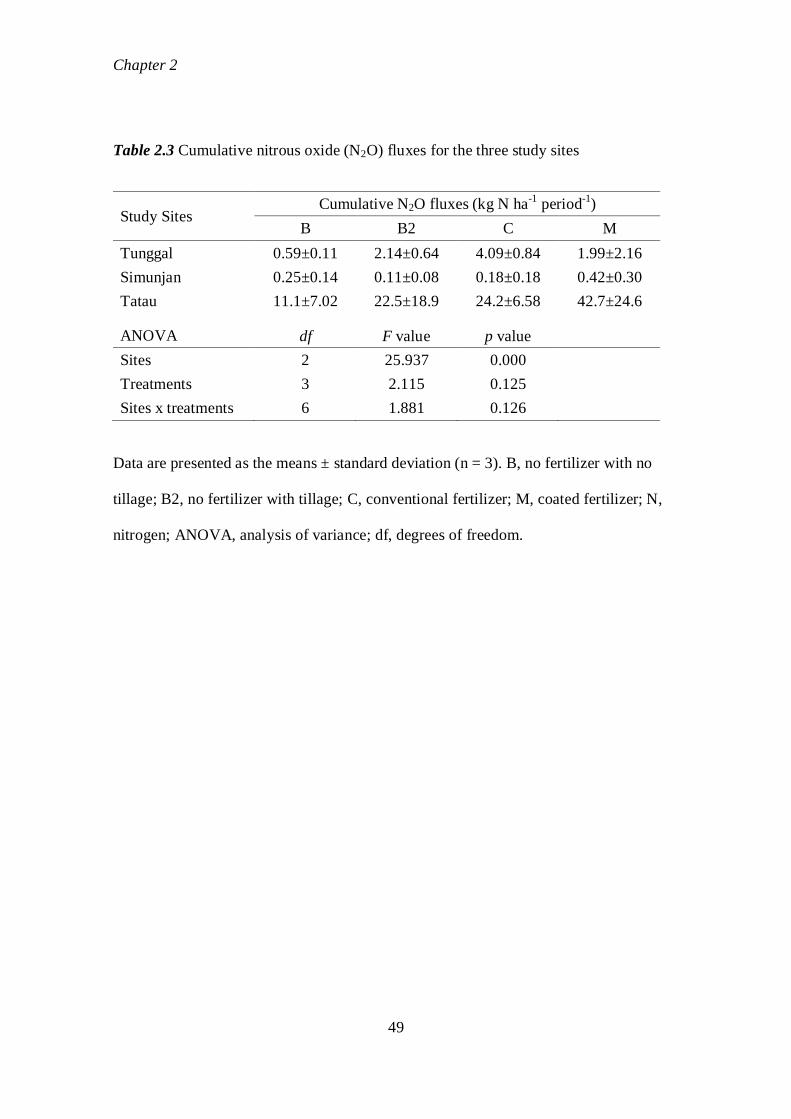
Chapter 2
49
Table 2.3 Cumulative nitrous oxide (N2O) fluxes for the three study sites
Study Sites Cumulative N2O fluxes (kg N ha
-1 period
-1)
B B2 C M
Tunggal 0.59±0.11 2.14±0.64 4.09±0.84 1.99±2.16
Simunjan 0.25±0.14 0.11±0.08 0.18±0.18 0.42±0.30
Tatau 11.1±7.02 22.5±18.9 24.2±6.58 42.7±24.6
ANOVA df F value p value
Sites 2 25.937 0.000
Treatments 3 2.115 0.125
Sites x treatments 6 1.881 0.126
Data are presented as the means ± standard deviation (n = 3). B, no fertilizer with no
tillage; B2, no fertilizer with tillage; C, conventional fertilizer; M, coated fertilizer; N,
nitrogen; ANOVA, analysis of variance; df, degrees of freedom.
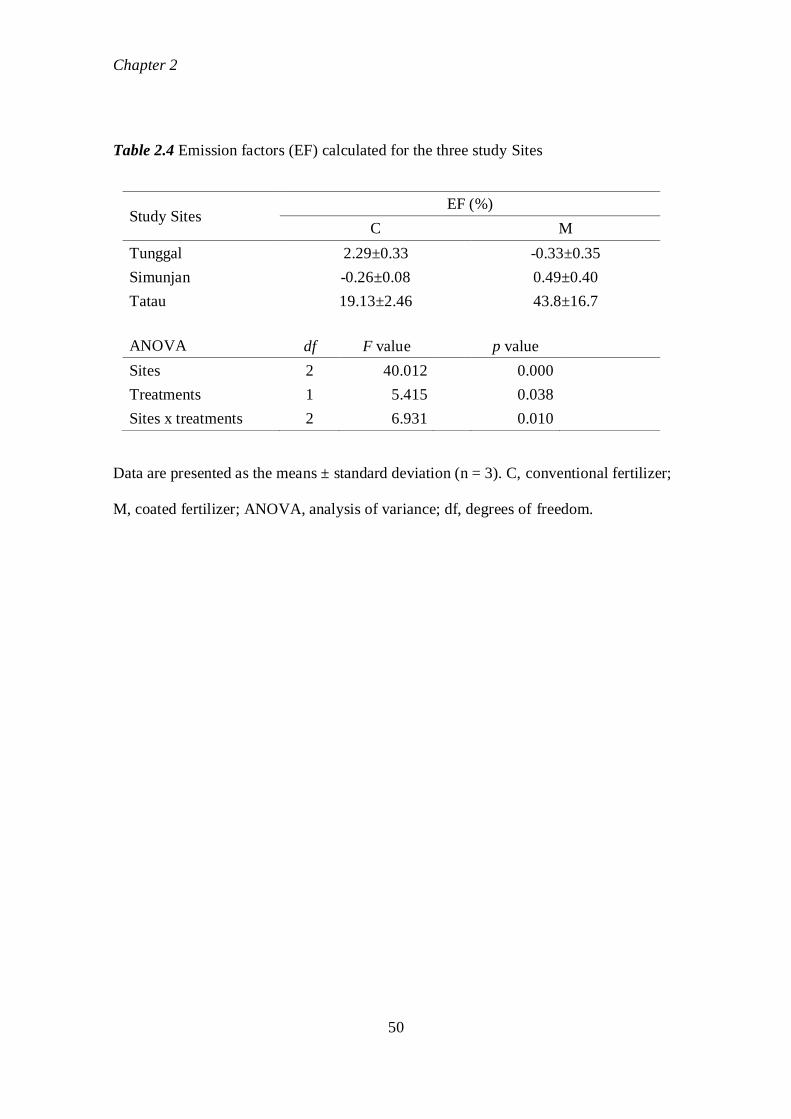
Chapter 2
50
Table 2.4 Emission factors (EF) calculated for the three study Sites
Study Sites EF (%)
C M
Tunggal 2.29±0.33 -0.33±0.35
Simunjan -0.26±0.08 0.49±0.40
Tatau 19.13±2.46 43.8±16.7
ANOVA df F value p value
Sites 2 40.012
0.000
Treatments 1 5.415
0.038
Sites x treatments 2 6.931 0.010
Data are presented as the means ± standard deviation (n = 3). C, conventional fertilizer;
M, coated fertilizer; ANOVA, analysis of variance; df, degrees of freedom.
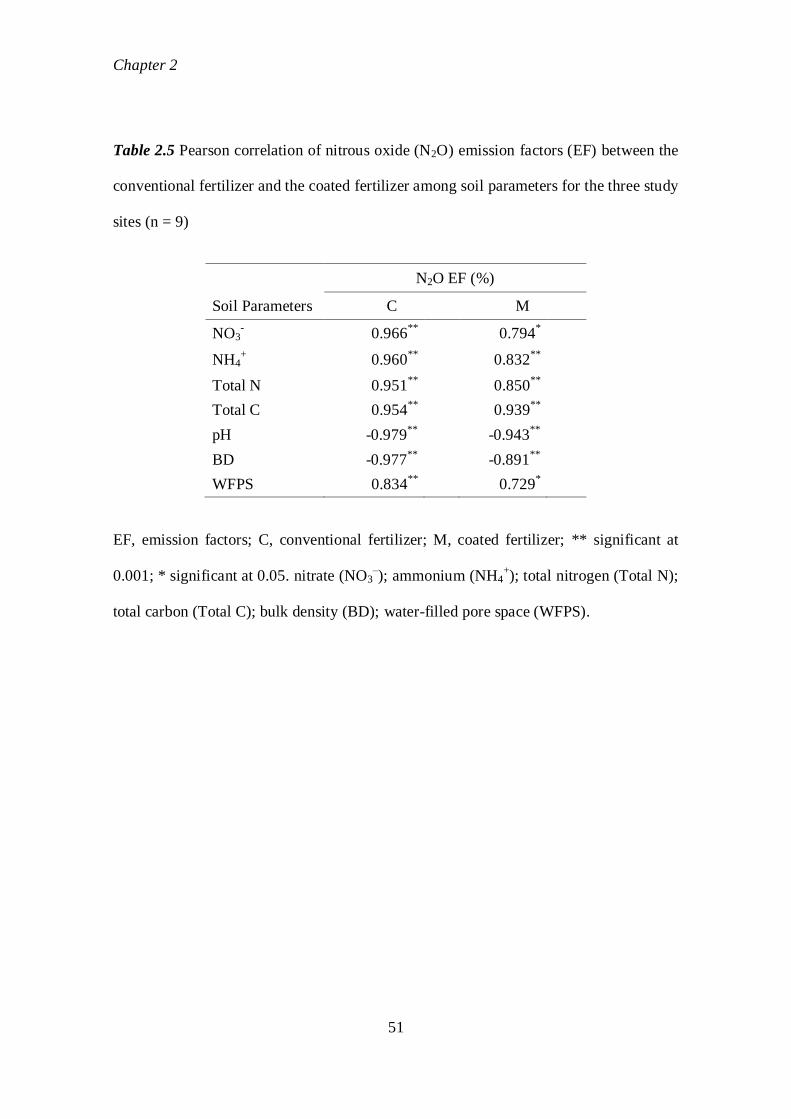
Chapter 2
51
Table 2.5 Pearson correlation of nitrous oxide (N2O) emission factors (EF) between the
conventional fertilizer and the coated fertilizer among soil parameters for the three study
sites (n = 9)
N2O EF (%)
Soil Parameters C M
NO3- 0.966
** 0.794
*
NH4+ 0.960
** 0.832
**
Total N 0.951**
0.850**
Total C 0.954**
0.939**
pH -0.979**
-0.943**
BD -0.977**
-0.891**
WFPS 0.834**
0.729*
EF, emission factors; C, conventional fertilizer; M, coated fertilizer; ** significant at
0.001; * significant at 0.05. nitrate (NO3–); ammonium (NH4
+); total nitrogen (Total N);
total carbon (Total C); bulk density (BD); water-filled pore space (WFPS).
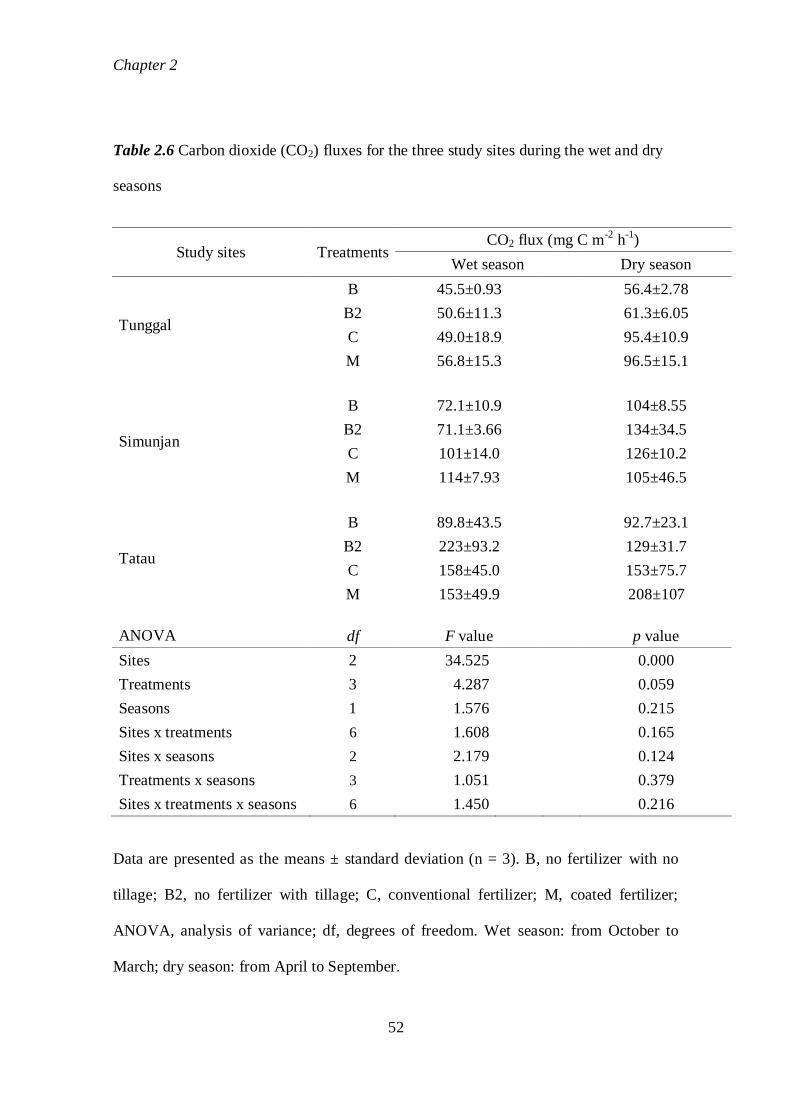
Chapter 2
52
Table 2.6 Carbon dioxide (CO2) fluxes for the three study sites during the wet and dry
seasons
Study sites Treatments CO2 flux (mg C m
-2 h
-1)
Wet season Dry season
Tunggal
B 45.5±0.93
56.4±2.78
B2 50.6±11.3
61.3±6.05
C 49.0±18.9
95.4±10.9
M 56.8±15.3
96.5±15.1
Simunjan
B 72.1±10.9
104±8.55
B2 71.1±3.66
134±34.5
C 101±14.0
126±10.2
M 114±7.93
105±46.5
Tatau
B 89.8±43.5
92.7±23.1
B2 223±93.2
129±31.7
C 158±45.0
153±75.7
M 153±49.9
208±107
ANOVA df F value p value
Sites 2 34.525
0.000
Treatments 3 4.287
0.059
Seasons 1 1.576
0.215
Sites x treatments 6 1.608
0.165
Sites x seasons 2 2.179
0.124
Treatments x seasons 3 1.051
0.379
Sites x treatments x seasons 6 1.450 0.216
Data are presented as the means ± standard deviation (n = 3). B, no fertilizer with no
tillage; B2, no fertilizer with tillage; C, conventional fertilizer; M, coated fertilizer;
ANOVA, analysis of variance; df, degrees of freedom. Wet season: from October to
March; dry season: from April to September.
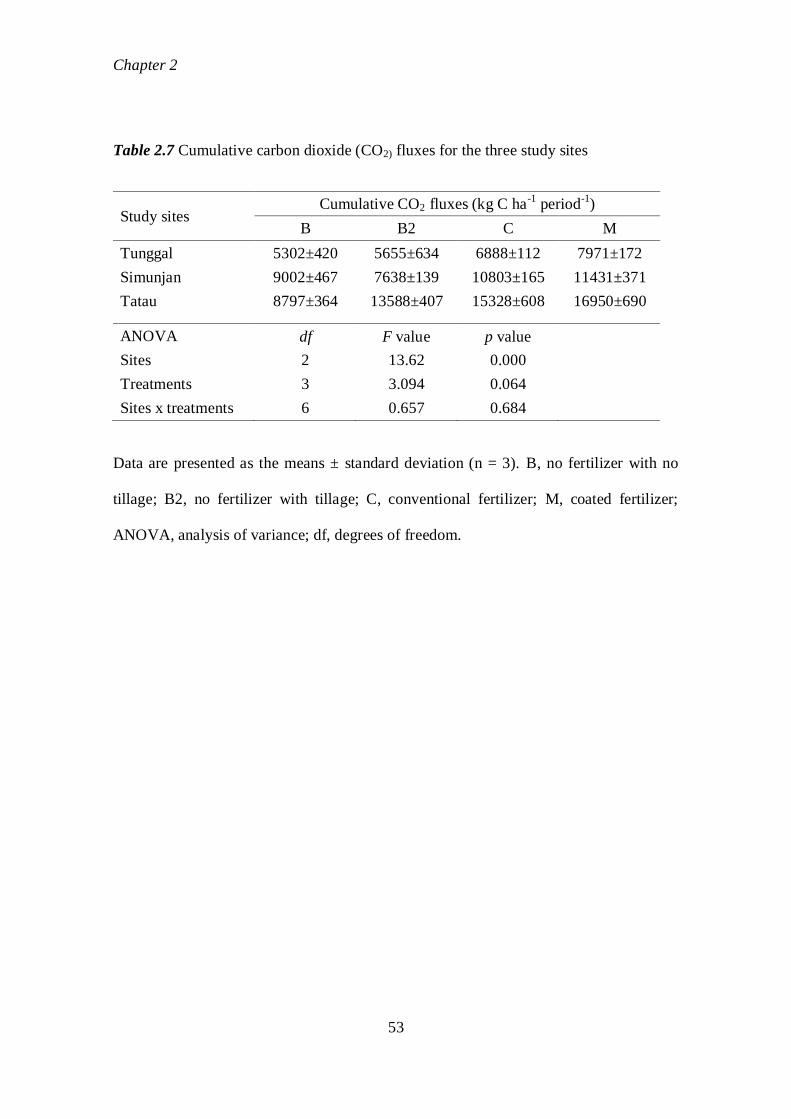
Chapter 2
53
Table 2.7 Cumulative carbon dioxide (CO2) fluxes for the three study sites
Study sites Cumulative CO2 fluxes (kg C ha
-1 period
-1)
B B2 C M
Tunggal 5302±420 5655±634 6888±112 7971±172
Simunjan 9002±467 7638±139 10803±165 11431±371
Tatau 8797±364 13588±407 15328±608 16950±690
ANOVA df F value p value
Sites 2 13.62 0.000
Treatments 3 3.094 0.064
Sites x treatments 6 0.657 0.684
Data are presented as the means ± standard deviation (n = 3). B, no fertilizer with no
tillage; B2, no fertilizer with tillage; C, conventional fertilizer; M, coated fertilizer;
ANOVA, analysis of variance; df, degrees of freedom.
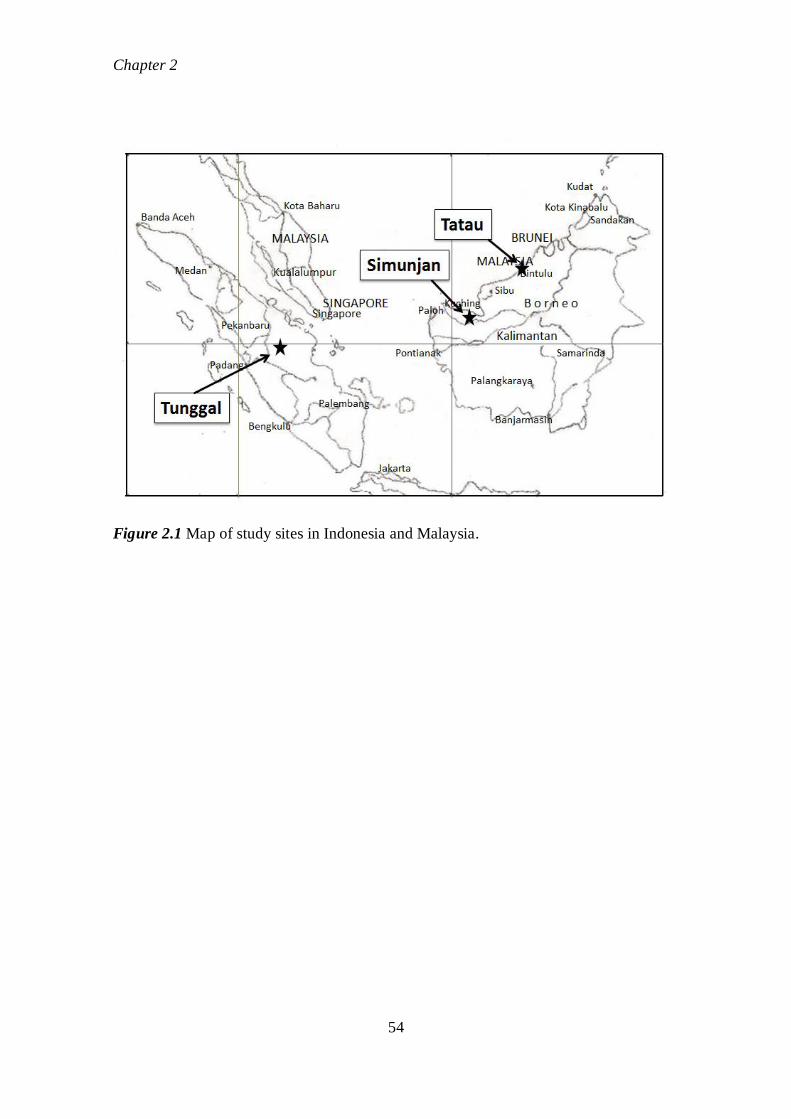
Chapter 2
54
Figure 2.1 Map of study sites in Indonesia and Malaysia.
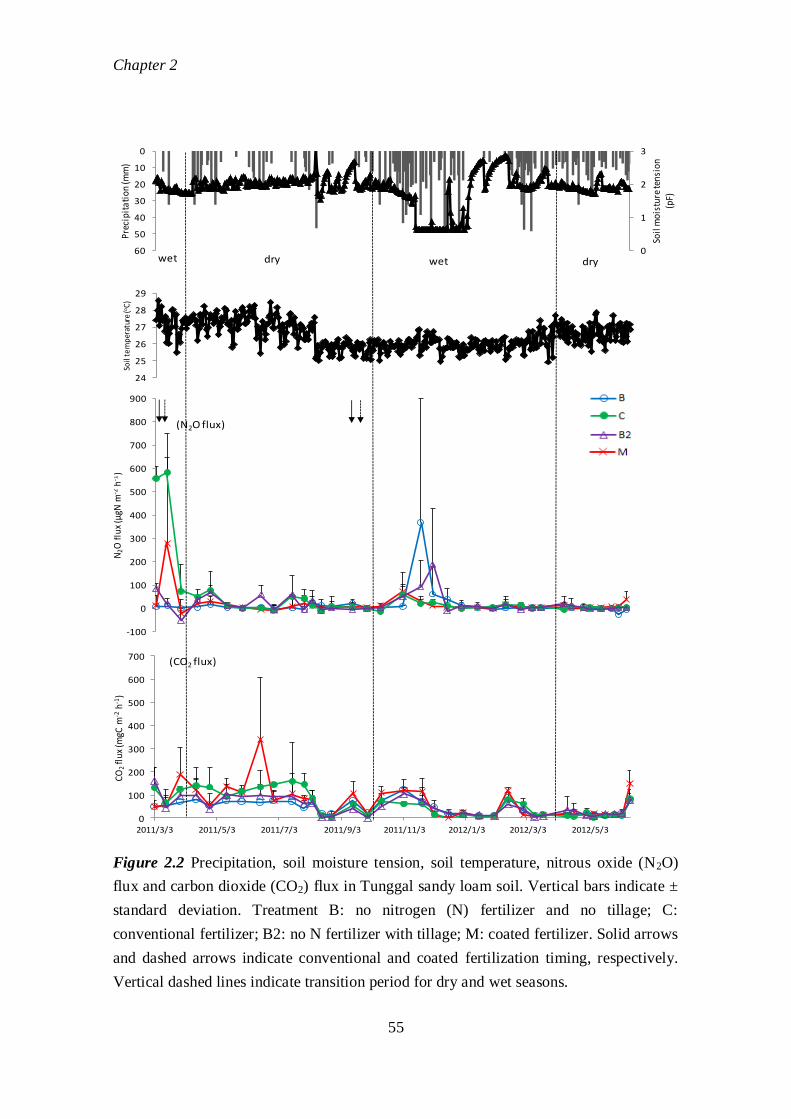
Chapter 2
55
Figure 2.2 Precipitation, soil moisture tension, soil temperature, nitrous oxide (N2O)
flux and carbon dioxide (CO2) flux in Tunggal sandy loam soil. Vertical bars indicate ±
standard deviation. Treatment B: no nitrogen (N) fertilizer and no tillage; C:
conventional fertilizer; B2: no N fertilizer with tillage; M: coated fertilizer. Solid arrows
and dashed arrows indicate conventional and coated fertilization timing, respectively.
Vertical dashed lines indicate transition period for dry and wet seasons.
24
25
26
27
28
29
Soil
tem
pera
ture
(oC
)
-100
0
100
200
300
400
500
600
700
800
900
N2O
flux
(μgN
m-2
h-1)
(N2O flux)
0
100
200
300
400
500
600
700
2011/3/3 2011/5/3 2011/7/3 2011/9/3 2011/11/3 2012/1/3 2012/3/3 2012/5/3
CO2
flux
(mgC
m-2
h-1)
(CO2 flux)
0
1
2
30
10
20
30
40
50
60
Soil
moi
stur
e te
nsio
n(p
F)
Prec
ipit
atio
n (m
m)
wet dry wet dry
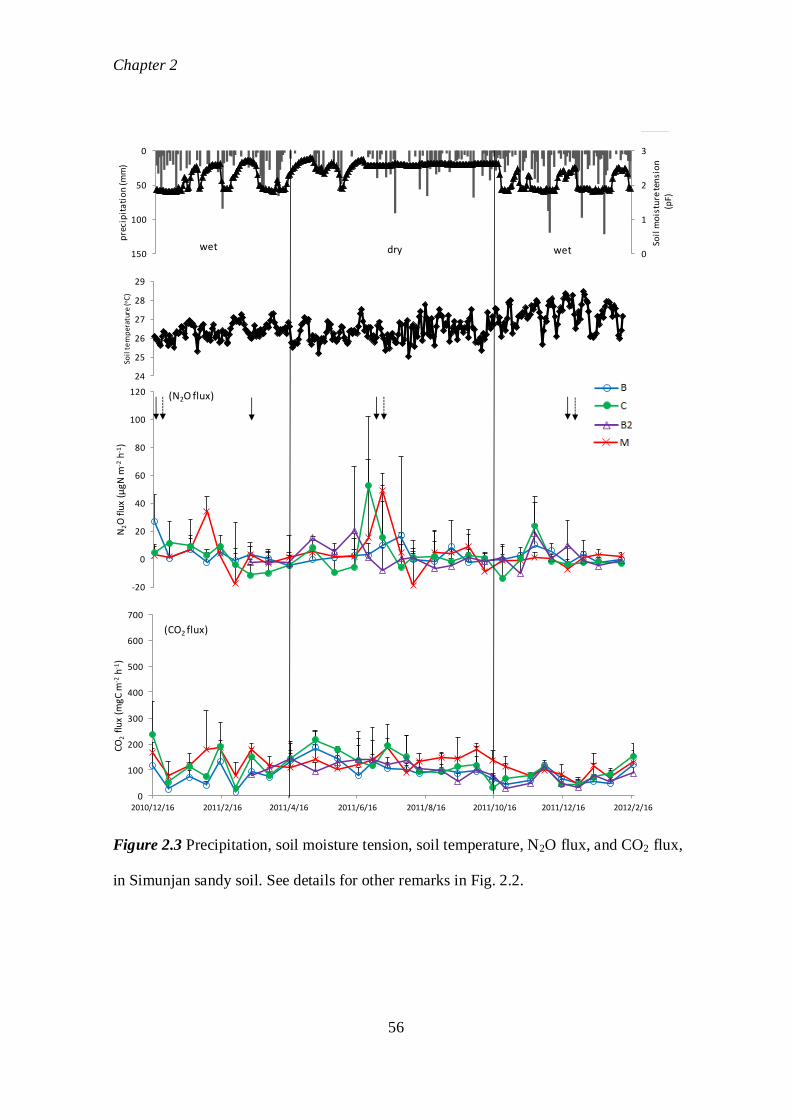
Chapter 2
56
Figure 2.3 Precipitation, soil moisture tension, soil temperature, N2O flux, and CO2 flux,
in Simunjan sandy soil. See details for other remarks in Fig. 2.2.
-20
0
20
40
60
80
100
120
N2O
flu
x (μ
gN m
-2h
-1)
(N2O flux)
24
25
26
27
28
29
Soil
te
mp
erat
ure
(oC
)
0
100
200
300
400
500
600
700
2010/12/16 2011/2/16 2011/4/16 2011/6/16 2011/8/16 2011/10/16 2011/12/16 2012/2/16
CO
2fl
ux
(mgC
m-2
h-1
)
(CO2 flux)
0
1
2
30
50
100
150
Soil
mo
istu
re te
nsi
on
(p
F)
pre
cip
ita
tio
n (m
m)
wet dry wet
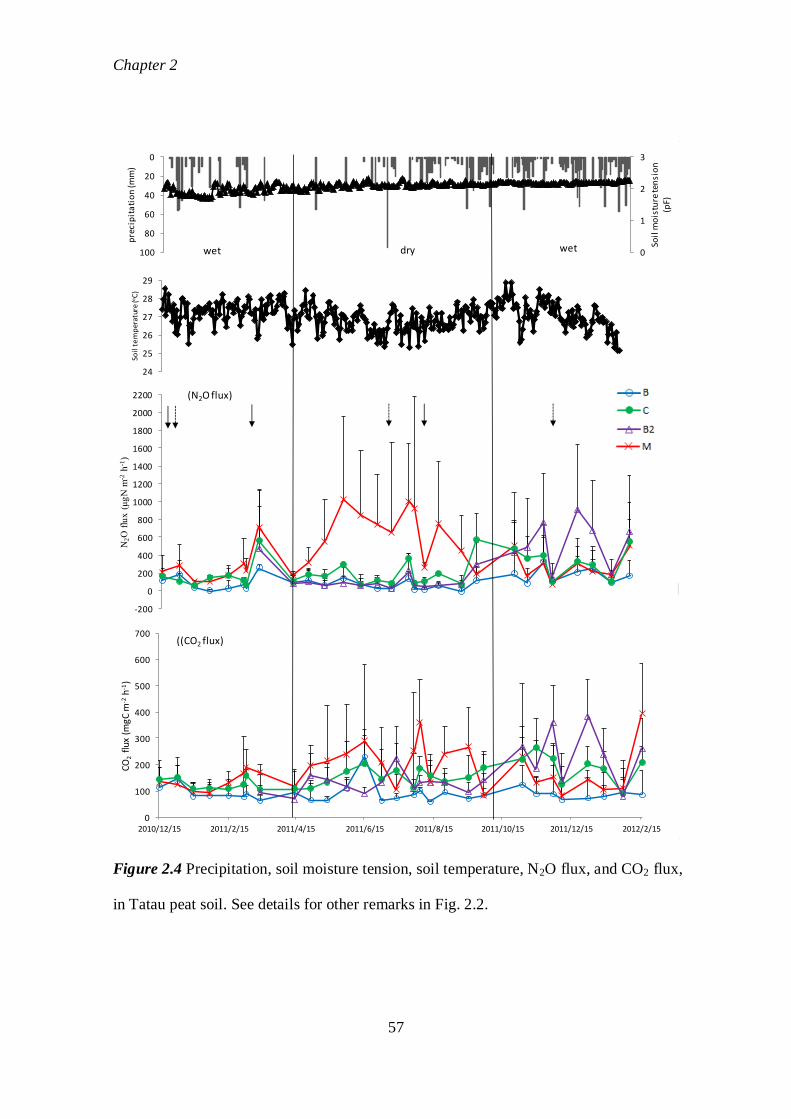
Chapter 2
57
Figure 2.4 Precipitation, soil moisture tension, soil temperature, N2O flux, and CO2 flux,
in Tatau peat soil. See details for other remarks in Fig. 2.2.
-200
0
200
400
600
800
1000
1200
1400
1600
1800
2000
2200
N2O
flu
x (μ
gN
m-2
h-1
)
(N2O flux)
24
25
26
27
28
29
Soil
te
mp
erat
ure
(oC
)
0
100
200
300
400
500
600
700
2010/12/15 2011/2/15 2011/4/15 2011/6/15 2011/8/15 2011/10/15 2011/12/15 2012/2/15
CO
2fl
ux
(mgC
m-2
h-1
)
((CO2 flux)
0
1
2
30
20
40
60
80
100
Soil
mo
istu
re te
nsi
on
(pF)
pre
cip
ita
tio
n (m
m)
wet dry wet
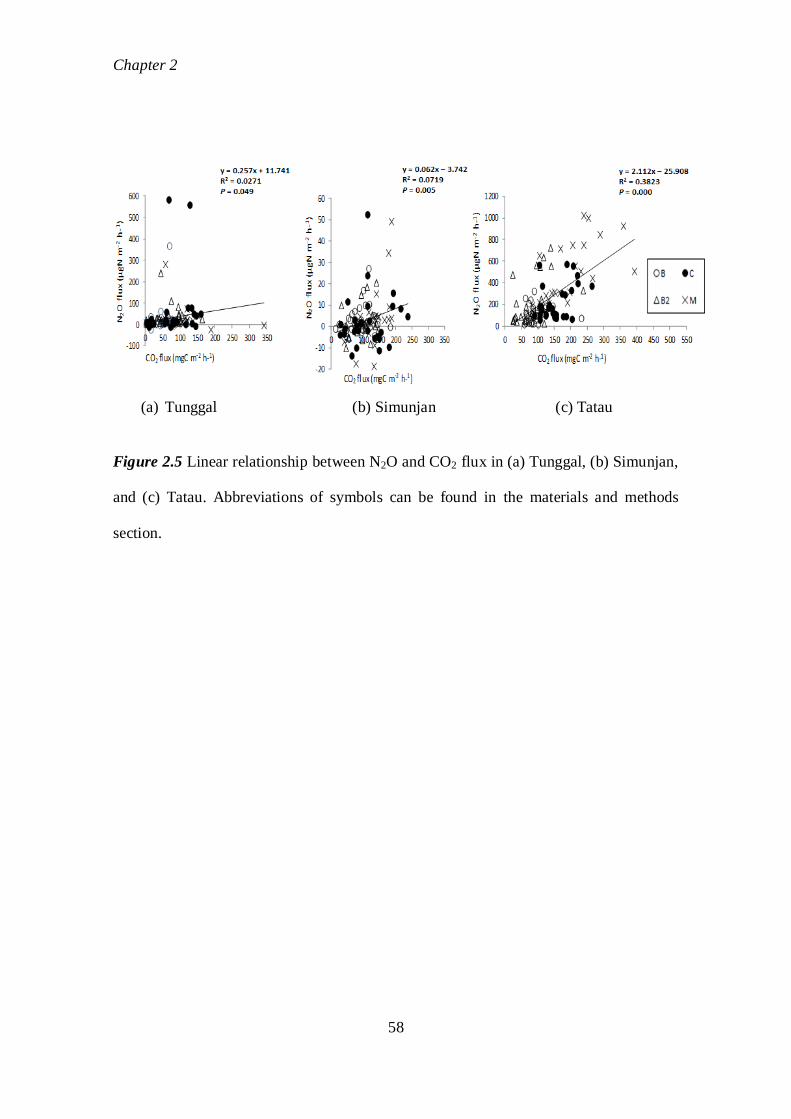
Chapter 2
58
(a) Tunggal (b) Simunjan (c) Tatau
Figure 2.5 Linear relationship between N2O and CO2 flux in (a) Tunggal, (b) Simunjan,
and (c) Tatau. Abbreviations of symbols can be found in the materials and methods
section.
Chapter 3
59
Chapter 3
Effect of topography on N2O and CO2 emissions and dissolved N2O in oil palm
plantation in Riau, Indonesia
3.1 Abstract
The oil palm plantations have been expanding into the different slope positions.
However the interactions of soil properties and topography influencing greenhouse gas
fluxes are still poorly understood. Topography affects the movement of surface and
subsurface water and causes the variability of soil processes, which makes the accurate
estimation of greenhouse gas fluxes more difficult. This study aimed to assess N2O and
CO2 emissions, measured by closed chamber method in upper, middle, and lower slope
positions for a whole year from June 2012 to May 2013 in Tunggal sandy loam soil,
Indonesia and to assess the dissolved N2O concentration as source of indirect emission
from oil palm plantation to the atmosphere, measured by headspace method in puddle,
drains, and wells. N2O and CO2 fluxes showed variability with seasons and slope
positions. Cumulative N2O fluxes were significantly higher in the lower position than
upper and middle position, while cumulative CO2 fluxes showed no significant
difference among the slope positions. Dissolved N2O concentrations varied by water
Chapter 3
60
sources and sampling time, sometimes supersaturated than ambient equilibrated
concentration. These results show that topography even in a short slope affected the
spatial variability of N2O and CO2 emission, which may need to be taken into account in
field measurements and estimating the whole emissions of these gases including the
indirect emissions.
Key words: N2O flux, CO2 flux, dissolved N2O, indirect emission, topography
3.2 Introduction
Nitrous oxide (N2O) is potent greenhouse gases with much greater global
warming potential than carbon dioxide (CO2). N2O emissions have been shown to vary
across agricultural landscapes in response to variations in several factors such as
topography, soil, crop types and managements (Izaurralde et al. 2004; Vilain et al.
2010). Topography is well documented to cause variability of environmental factors
such soil temperature and moisture, and other properties have to be identified in relation
to the soil carbon (C) and nitrogen (N) cycling processes (Luizao et al. 2004). Soil
factors related to topography may also influence nitrifier and denitrifier’s communities
with respect to N2O turnover and interact with soil respiration (Zhu et al. 2013;
Philippot et al. 2009; Banerjee and Siciliano 2012). Soil respiration is one of the main
Chapter 3
61
components of ecosystem respiration (Granier et al. 2000; Janssens et al. 2001). CO2
release from soil, commonly referred as soil respiration, and even small changes in soil
respiration may strongly affect soil carbon sequestration in long-term (Raich and
Schlesinger 1992). Due to increased global demand of palm oil, plantation area of oil
palm has been expanding to the hilly area. Annual exchange of CO2 from tropical
ecosystem has also potential significance for the global carbon cycle and climatic
change (Sorensen 1993).
In general, it has been observed that N2O emissions were higher in lower slope
position than in upper slope positions because the lower slope position have greater soil
moisture, plant biomass, and soil C content (Hook and Burke 2000). Effects of soil
temperature and soil water content on CO2 emission was observed in managed forests in
Canada (Peng and Thomas 2006). Tropical rainforest showed that the temporal
variability of soil CO2 efflux was depended mainly on soil water content (Kosugi et al.
2007).
Indirect N2O emissions are recognized as a quantitatively significant
component of the total N2O emission budget from agricultural activities (Reay et al.
2009). The proportion of leached N that is emitted as N2O is termed an emission factor
(EF), and for aquatic ecosystems, this is referred to as EF5. The EF5 consists of
Chapter 3
62
emission factors for groundwater and surface drainage (EF5-g), rivers (EF5-r), and
estuaries (EF5-e) (IPCC 2006). EF5-g is derived from the ratio of dissolved N2O to
NO3- concentrations (Mosier et al. 1998). It is thought that N2O emissions through
groundwater comprise a significant fraction of total agricultural N2O emissions and
default value of EF5-g (N2O-N / NO3--N) is 0.0025 (IPCC 2006).
In Indonesia, N2O and CO2 emission from oil palm plantation have reported as
affected by converted land (Dewi et al. 2009), linked to fertilizer use (Murdiyarso et al.
2002), related to land use change (Hadi et al. 2012), and affected by the soil types
(Sakata et al. 2015). However, the interactions of soil properties and topography
influencing soil N2O and CO2 emissions, and dissolved N2O are still poorly understood.
Oil palm plantation is located in the different slope variation. Therefore it is necessary
to conduct study to assess the N2O and CO2 emissions as affected by topography and to
identify the controlling factors of spatial variations in N2O and CO2 emissions at the
landscape scale, and to assess the dissolved N2O concentration as source of indirect
emission.
Chapter 3
63
3.3 Materials and methods
3.3.1 Site descriptions
The study site was located in Tunggal Plantation, 200 km southeast of
Pekanbaru City, Airmolek District, Riau Province, Indonesia (S00°20.731′
E102°17.617′) on sandy loam soil classified as Ultisols (the United States Department
of Agriculture (USDA) soil taxonomy) (Fig.3.1). Geographical feature of Tunggal
Plantation is categorized as hilly slope area, with annual rainfall and mean temperature
was 1387 mm and 28°C, respectively. Oil palms (Elaeis guineensis Jacq.) in study area
were planted at a density of 135 palms per hectare. Total study area was 93.6 ha and the
age of plantation was 7 years (mature palm). Annual rates fertilizer application was 151
kg N ha-1
as NPK (16-4-25) as split applications twice with equal amounts in June and
September. The precipitation data were collected by oil palm plantation staff members
from rain gauges located within the oil palm plantations.
3.3.2 Physicochemical analysis of the soil samples
Along the sloping from 1.3 to 2.2% (Fig. 3.1), undisturbed soil core with three
replicates and composite soil samples were collected at 0-10 cm depth at upper, middle,
and lower slope position. The soil sample was collected three times, on 12 June 2012, 2
Chapter 3
64
October 2012, and 31 January 2013. The soil samples were analysed for their physical
and chemical properties. Prior to analysis, the soil samples were maintained at 4°C. The
undisturbed soil cores were used for soil volume measurements using a three-phase
meter (DIK-1130, Daiki Rika Kogyo Co. Ltd). The core samples were weighed and then
oven dried at 105°C for 48 h. After drying, the core samples were reweighed to
calculate soil moisture content, bulk density (BD), and water-filled pore space (WFPS).
Soil particle size distribution was determined by the Bouyoucos hydrometer method
(Kroetsch and Wang 2008). The soil pH was measured by pH meter (D-52, Horiba Co.,
Ltd) with a glass electrode. Part of the soil samples were air-dried and passed through a
0.5 mm sieve, and the sieved soil was used to determine total carbon and nitrogen
contents using a Carbon and Nitrogen Analyzer (CN corder; MT-700 Yanaco Analytical
Industry Co., Ltd). The inorganic N contents of NH4+ and NO3
- were determined by
sieving fresh soil through a 2 mm sieve, extracting it in 1 M KCl of 1:2.5 ratio, and
using the nitroprusside method (Anderson and Ingram 1989) and hydrazine reduction
method (Hayashi et al. 1997), respectively.
Chapter 3
65
3.3.3 Measurement of N2O and CO2 fluxes
Measurement of N2O and CO2 fluxes was conducted at 2-weeks interval from
June 2012 to May 2013 at each slope positions. Gas sampling was consistently
conducted by closed chamber method at mid-morning with 3 replications, based on
previous study on oil palm plantation (Sakata et al. 2015). N2O and CO2 fluxes were
measured by a gas chromatograph (GC-14B, Shimadzu, Japan) equipped with an
electron capture detector and thermal conductivity detector, respectively.
3.3.4 Chemical analysis for the water samples and measurement of dissolved N2O
concentrations
Water samples were collected at puddle in lower slope, drains and wells (Fig.
3.1). It was conducted 3 times, on 2 June 2012, 12 October 2012, and 31 January 2013.
Each water samples was collected in 50 ml plastic bottle for NH4+ and NO3
-
concentration measurement, and 22 ml vacuum vial for dissolved N2O concentration
measurement, respectively, and then brought back to the laboratory. The water samples
were stored in a refrigerator and analysed within one week. NH4+ and NO3
- were
determined by filtering the water samples through filter paper (Advantec 131, 150 mm,
Toyo Roshi Kaisha Ltd., Japan) and analysed using the nitroprusside method (Anderson
Chapter 3
66
and Ingram 1989) and hydrazine reduction method (Hayashi et al. 1997), respectively.
For measurement of dissolved N2O concentrations, 5 ml of each water samples was
transferred into another vacuum vial, and filling with 17 ml helium gas, and shake
properly. The N2O gas in the headspace was measured by gas chromatography with 3
replicates. Dissolved N2O concentration was calculated based on Sawamoto et al.
(2002).
3.3.5 Statistical analysis
Statistical analyses were conducted using IBM SPSS Statistics 21. Means of
N2O and CO2 fluxes for each slope positions during wet and dry seasons were analysed
using a two-way ANOVA test. While, the significance of the cumulative N2O and CO2
fluxes for each slope positions were analysed using a one-way ANOVA test.
Correlations between seasonal mean gas emissions (dry season in 2012, wet and dry
seasons in 2013) and soil physiochemical properties among the slope positions in June
and October 2012 and January 2013 were analysed using Pearson’s correlation,
respectively. Statistical considerations were based on p < 0.05 significance level.
Correlation between NO3- and dissolved N2O concentration were analysed using simple
linear regression.
Chapter 3
67
3.4 Results
3.4.1 Physicochemical soil properties by slope positions
Physicochemical properties of soil varied widely by slope positions (Table 3.1).
NO3-, NH4
+, and WFPS showed higher tendency in lower slope than in upper and
middle slope positions, although other soil parameter such as total C, total N contents,
pH, and bulk density did not show the same tendency.
3.4.2 Soil N2O emission
N2O fluxes in the upper, middle, and lower slope positions varied by seasonal
(Fig. 3.2). N2O fluxes were in the range from 0.34 to 36.3, -4.28 to 34.9 and 1.59 to
61.2 μg N m-2
h-1
in the upper, middle, and lower slope positions, respectively. High
peak of N2O fluxes (31.6 – 59.4 μg N m-2
h-1
) were observed after second fertilization
followed with precipitation, and again reached high peak of N2O (32.6 – 61.2 μg N m-2
h-1
) during wet season with high precipitation. The highest peak of N2O was observed in
the lower slope position. The temperature showed no correlation with variation of N2O
flux in different slope positions. During the study period, N2O fluxes were higher in wet
season than in dry season (Table 3.2). During the wet season, N2O fluxes were highest
in the lower slope than upper and middle slope. During the dry season, effect of slope
Chapter 3
68
positions was no observed in N2O fluxes. Two-way ANOVA analysis showed
significant interaction between seasons and slope positions (p = 0.027) (Table 3.2). The
cumulative N2O fluxes were 460, 560, and 697 g N ha-1
y-1
in the upper, middle, and
lower slope positions, respectively. Cumulative N2O fluxes were significantly higher in
the lower slope, while upper and middle slope positions showed no significant
difference (Fig. 3.3). Effect of slope positions related with cumulative N2O emissions
showed positive correlation with the NO3- and WFPS (Table 3.4).
3.4.3 Soil CO2 emission
CO2 fluxes in the upper, middle, and lower slope positions varied seasonally
(Fig. 3.2). CO2 fluxes were ranged from 15.2 to 166, 10.1 to 128, and 0.72 to 187 mg C
m-2
h-1
in the upper, middle, and lower slope positions, respectively. The precipitation
and temperature showed no correlation with variation of CO2 flux in different slope
positions.
During the study period, CO2 fluxes were higher in dry season than in wet
season. CO2 fluxes were significantly different among the seasons (p < 0.001). However,
effect of slope positions on CO2 fluxes showed no significant difference in both wet and
dry seasons (Table 3.3). The cumulative CO2 fluxes were about 6270, 7370, and 7600
Chapter 3
69
kg C ha-1
y-1
in the upper, middle, and lower slope positions, respectively. Cumulative
CO2 fluxes were not significantly different among the slope positions (Fig. 3.3).
Cumulative CO2 emissions showed significantly positive correlation with the WFPS
(Table 3.4).
3.4.4 NH4+, NO3
-, pH, dissolved N2O and CO2 concentrations in water samples and
emission factors
NH4+, NO3
-, pH and dissolved N2O and CO2 concentrations varied among the
source of water. NH4+ concentrations were lower than 1 mg N L
-1, except in the puddle
sample taken in June. NO3- concentrations were also lower than 1 mg N L
-1, except in
the puddle samples, increasing from June 2012 to January 2013 (Fig. 3.4). The pH value
in all water samples were range from 5.8 to 6.7 during the measurement. Higher pH
value showed in all samples taken in June 2012 and pH value slightly decreased in
October 2012 and January 2013 (Fig. 3.5). Dissolved CO2 concentration showed the
opposite with pH value. Dissolved CO2 concentrations range from 0.004 to 0.248
mg L-1
. High concentration of dissolved CO2 from all water samples observed in
January 2013 during the wet season (Fig. 3.5).
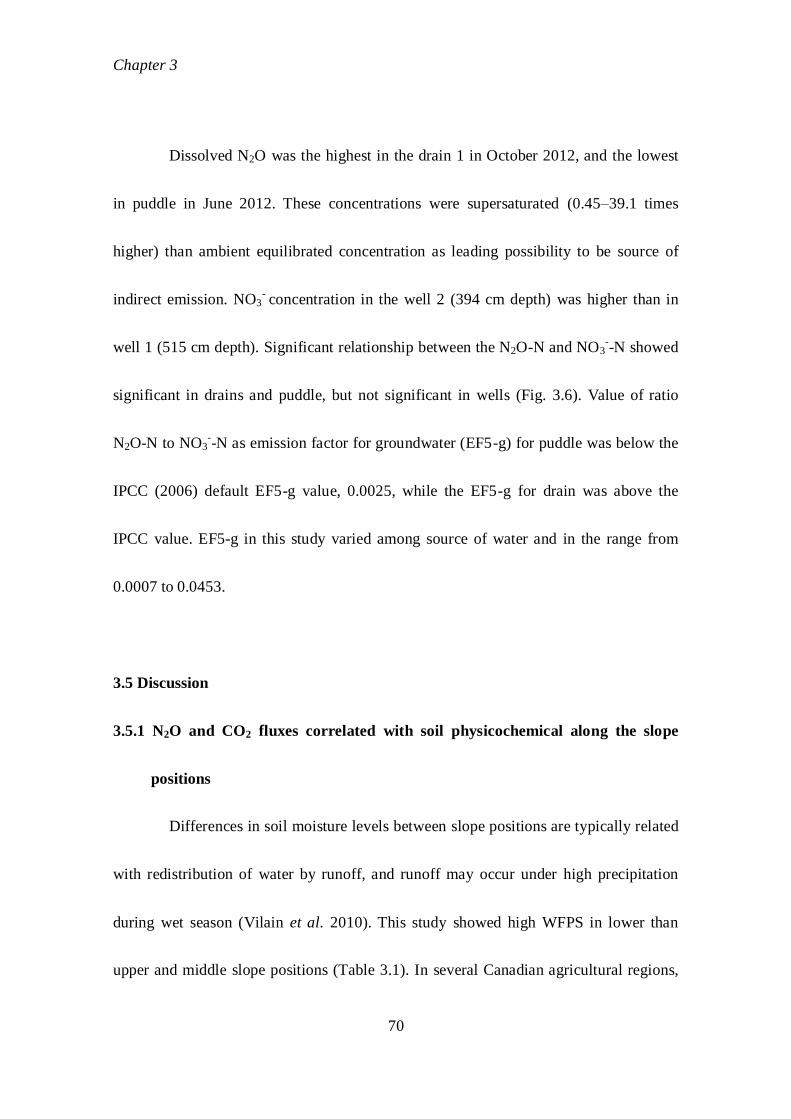
Chapter 3
70
Dissolved N2O was the highest in the drain 1 in October 2012, and the lowest
in puddle in June 2012. These concentrations were supersaturated (0.45–39.1 times
higher) than ambient equilibrated concentration as leading possibility to be source of
indirect emission. NO3- concentration in the well 2 (394 cm depth) was higher than in
well 1 (515 cm depth). Significant relationship between the N2O-N and NO3--N showed
significant in drains and puddle, but not significant in wells (Fig. 3.6). Value of ratio
N2O-N to NO3--N as emission factor for groundwater (EF5-g) for puddle was below the
IPCC (2006) default EF5-g value, 0.0025, while the EF5-g for drain was above the
IPCC value. EF5-g in this study varied among source of water and in the range from
0.0007 to 0.0453.
3.5 Discussion
3.5.1 N2O and CO2 fluxes correlated with soil physicochemical along the slope
positions
Differences in soil moisture levels between slope positions are typically related
with redistribution of water by runoff, and runoff may occur under high precipitation
during wet season (Vilain et al. 2010). This study showed high WFPS in lower than
upper and middle slope positions (Table 3.1). In several Canadian agricultural regions,
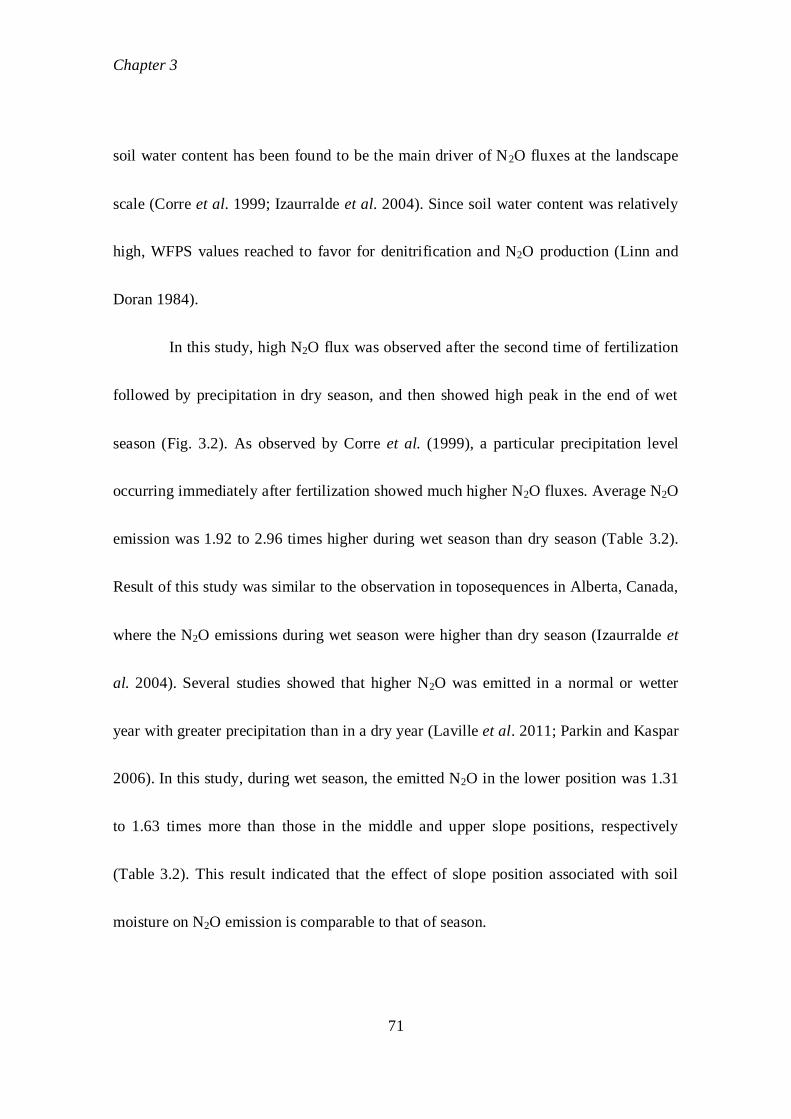
Chapter 3
71
soil water content has been found to be the main driver of N2O fluxes at the landscape
scale (Corre et al. 1999; Izaurralde et al. 2004). Since soil water content was relatively
high, WFPS values reached to favor for denitrification and N2O production (Linn and
Doran 1984).
In this study, high N2O flux was observed after the second time of fertilization
followed by precipitation in dry season, and then showed high peak in the end of wet
season (Fig. 3.2). As observed by Corre et al. (1999), a particular precipitation level
occurring immediately after fertilization showed much higher N2O fluxes. Average N2O
emission was 1.92 to 2.96 times higher during wet season than dry season (Table 3.2).
Result of this study was similar to the observation in toposequences in Alberta, Canada,
where the N2O emissions during wet season were higher than dry season (Izaurralde et
al. 2004). Several studies showed that higher N2O was emitted in a normal or wetter
year with greater precipitation than in a dry year (Laville et al. 2011; Parkin and Kaspar
2006). In this study, during wet season, the emitted N2O in the lower position was 1.31
to 1.63 times more than those in the middle and upper slope positions, respectively
(Table 3.2). This result indicated that the effect of slope position associated with soil
moisture on N2O emission is comparable to that of season.
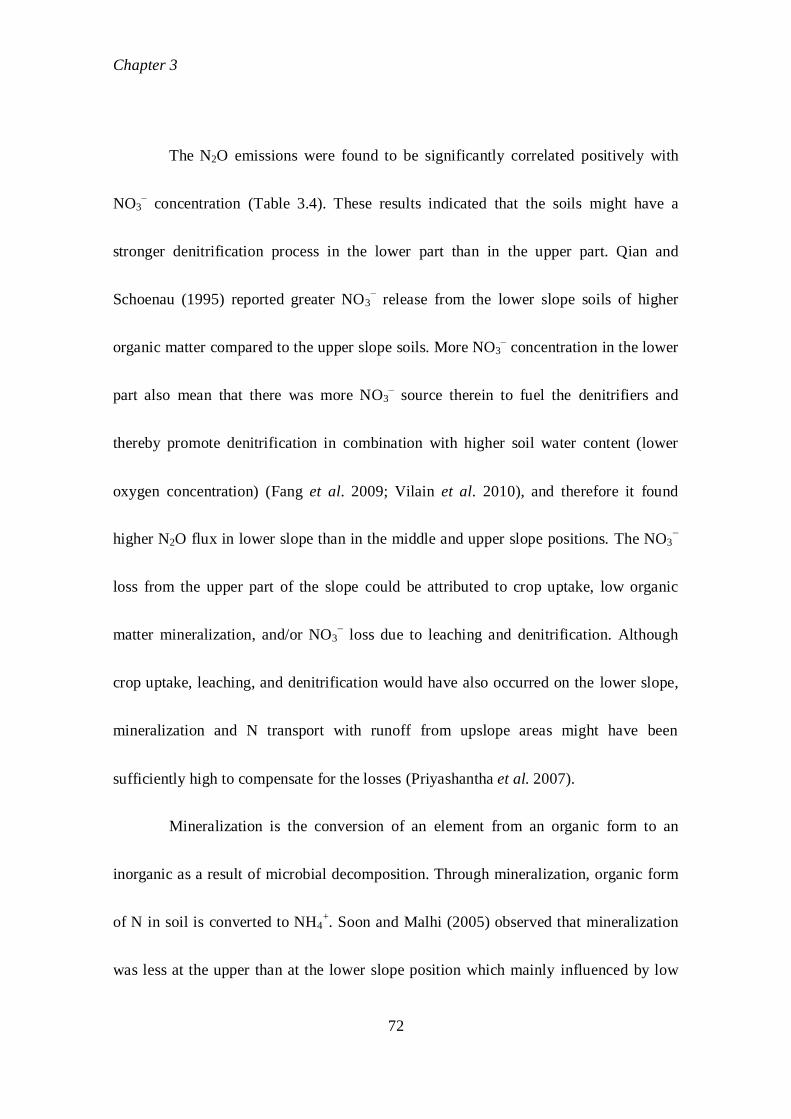
Chapter 3
72
The N2O emissions were found to be significantly correlated positively with
NO3– concentration (Table 3.4). These results indicated that the soils might have a
stronger denitrification process in the lower part than in the upper part. Qian and
Schoenau (1995) reported greater NO3− release from the lower slope soils of higher
organic matter compared to the upper slope soils. More NO3– concentration in the lower
part also mean that there was more NO3– source therein to fuel the denitrifiers and
thereby promote denitrification in combination with higher soil water content (lower
oxygen concentration) (Fang et al. 2009; Vilain et al. 2010), and therefore it found
higher N2O flux in lower slope than in the middle and upper slope positions. The NO3−
loss from the upper part of the slope could be attributed to crop uptake, low organic
matter mineralization, and/or NO3− loss due to leaching and denitrification. Although
crop uptake, leaching, and denitrification would have also occurred on the lower slope,
mineralization and N transport with runoff from upslope areas might have been
sufficiently high to compensate for the losses (Priyashantha et al. 2007).
Mineralization is the conversion of an element from an organic form to an
inorganic as a result of microbial decomposition. Through mineralization, organic form
of N in soil is converted to NH4+. Soon and Malhi (2005) observed that mineralization
was less at the upper than at the lower slope position which mainly influenced by low
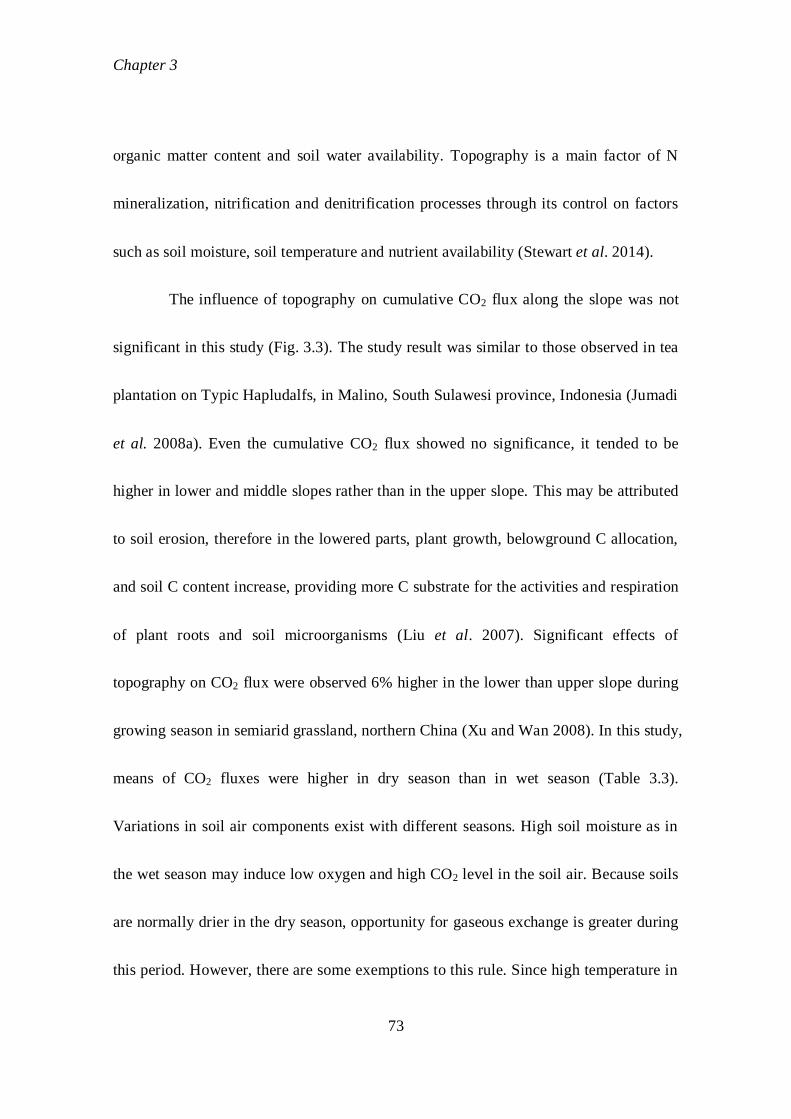
Chapter 3
73
organic matter content and soil water availability. Topography is a main factor of N
mineralization, nitrification and denitrification processes through its control on factors
such as soil moisture, soil temperature and nutrient availability (Stewart et al. 2014).
The influence of topography on cumulative CO2 flux along the slope was not
significant in this study (Fig. 3.3). The study result was similar to those observed in tea
plantation on Typic Hapludalfs, in Malino, South Sulawesi province, Indonesia (Jumadi
et al. 2008a). Even the cumulative CO2 flux showed no significance, it tended to be
higher in lower and middle slopes rather than in the upper slope. This may be attributed
to soil erosion, therefore in the lowered parts, plant growth, belowground C allocation,
and soil C content increase, providing more C substrate for the activities and respiration
of plant roots and soil microorganisms (Liu et al. 2007). Significant effects of
topography on CO2 flux were observed 6% higher in the lower than upper slope during
growing season in semiarid grassland, northern China (Xu and Wan 2008). In this study,
means of CO2 fluxes were higher in dry season than in wet season (Table 3.3).
Variations in soil air components exist with different seasons. High soil moisture as in
the wet season may induce low oxygen and high CO2 level in the soil air. Because soils
are normally drier in the dry season, opportunity for gaseous exchange is greater during
this period. However, there are some exemptions to this rule. Since high temperature in
Chapter 3
74
the dry season may also encourage rapid microbiological release of CO2, a given soil
containing easily decomposable organic matter may have higher CO2 level than in the
wet reason (Yerima and Ranst 2005).
In perennial crops, variation in soil properties over the topography position
showed that concentration of soil chemical properties was higher on lower slope that on
eroded upper slope (Steinwald et al.1996). Apart from soil properties, as function of
slope position also has been revealed vary on crop yields (Mahli et al. 1993). Due to
increasing nutrient accumulation toward the lower slope as effect of nutrient movement
to the bottom part (Tan et al. 2014), therefore at lower slope positions allocated greatest
potential yield (Nolan et al. 1995).
In Indonesia, some of the oil palm plantations are located in hilly area.
Balasundram et al. (2006) observed that the highest yield occurring at the lower slope
and the lowest yield from the upper slope in oil palm plantation, in South Sumatera,
Indonesia. It is clearly explained that topography affected soil fertility and oil palm
yield with 4-12% degree of slope. In Addition, in Malaysia estimation of potential yield
from different region which located in sloping area reported that degree of steep
influences yield of oil palm. In wet region on 7 years of harvesting showed the fresh
fruit bunch (FFB) yield as 31-32, 29-30, 24-25 ton ha-1
at undulating area (0-12%),
Chapter 3
75
rolling area (12-24%), and hilly or steep area (24-50%), respectively. While in dry
region, it showed FFB yield as 20-22, 18-19, 16-17 ton ha-1
at undulating area (0-12%),
rolling area (12-24%), and hilly or steep area (24-50%), respectively (Paramananthan
2013). Generally, the yield trend is attributable to topographic difference. It can be
explain that topography affect the movement of water nutrient which is affected by
precipitation pattern of plantation areas.
Fertilizer management on sloping or hilly area which used for oil palm
plantation is very essential to be taken. It is related to maintain fertility of the soil and to
minimize soil erosion and nutrient loss from the area of plantation. Decreasing of
nutrients through leaching and runoff reduces both crop productivity and economic
gains. It recommended that frequence of fertilizer application at low rates is preferred
on sloping land where the risk of nutrient losses through runoff or drainage is great
(Goh and Chew 1995). The optimal frequency of fertilizer application depends on crop
requirements, tree age, ground conditions, type of fertilizer available and precipitation.
To diminish soil erosion and to sustain the soil moisture, frond heap as a plant residues
added to ground surface of oil palm area (Redshaw 2003) and the threshed fronds are
normally placed between palm trees as sources of nutrients (Kee and Chew 1997) as
well. Besides as erosion control, frond heaps can supply organic matter and nutrients to
Chapter 3
76
soil through decomposition and influence nutrient cycling between the plant and soil
systems (Yusuyin et al. 2015). On the steep areas where are prone to soil erosion,
comprise the buffer strip, platform or terrace on each different of slope positions to
improve the fertilizer use efficiency and yield harvesting is suggested (Gillbank 2003).
3.5.2 Dissolved N2O concentration and emission factor for ground water
In this study, change of dissolved N2O concentrations in the puddle may
indicate that the relative importance of N2O formation by nitrification of NH4+ (Fig. 3.4).
It demonstrated that seasonal changes of NH4+ and NO3
− in the puddle were different.
NH4+ sharply decreased from 2.08 to 0.47 mg N L
-1 from June to October and then
stayed constant, while NO3− increased constantly from 0.38 to 5.62 mg N L
-1 in the
experimental period. As NH4+ was nitrified to NO3
− then transported entering to
groundwater, thus potentially contributing NO3− to N2O production (Hinshaw and
Dahlgren 2013). Aquatic ecosystems can be a significant source of N2O emissions by
both nitrification and denitrification to be considered as the two main processes
producing N2O. Nitrification, an aerobic microbial process, oxidizes NH4+ to NO3
-, in
which N2O is formed as a byproduct (Knowles 1982). Denitrification is an anaerobic
respiration process that reduces NO3- to dinitrogen gas (N2), with N2O as the
Chapter 3
77
intermediate gas product (Seitzinger et al. 2000). As a result of NO3− consumption in
denitrifying in the aquifers, NO3− concentration in deeper groundwater is lower
(Weymann et al. 2008). In this study, it was observed that NO3− concentration in the
well 2 (in 394 cm depth) was higher than in well 1 (in 515 cm depth), while the
dissolved N2O tended to be higher in the well 1 than in the well 2 in October when
decreasing NH4+ concentration became stable. The other possibility to explain the
difference between two wells is that the diffusion of N2O from water and air inside the
well to the open ambient atmosphere. It may be possible that the deeper the well, more
time need to diffuse N2O to the atmosphere. These could explain that both processes of
denitrification and diffusion might be more effective in the well 1 than the well 2 and
far more in the puddle.
In the drain, high dissolved N2O concentration observed was probably also due
to increasing the denitrification process. As explained by Sawamoto et al. (2003), in
cultivation onion area in central Hokkaido, the dissolved N2O concentration was
increased due to the denitrification process in the subsoil during and after nitrate
leaching in the subsurface-drainage. NO3- concentrations in groundwater decrease as a
result of increased denitrification in the riparian (Watts and Seitzinger 2000), and the
increased denitrification by trading a decrease in NO3- transport to surface water for
Chapter 3
78
increased N2O emissions (Groffman et al. 2000). Concentration of N2O in the surface
water of the drainage tended to be higher than in the well and puddle in the same level
of NO3- concentration (Fig. 3.5), so it could be explained that the N2O dissolved in
water was evolved to the ambient air during water flow to downstream as reported by
Minami and Fukushi (1984). It may also be explained by the location of sampling sites
(Fig. 3.1) as drain 1(D1 (in 100 cm depth)) and well 1(W1) may be more close to the
source of N2O and fertilized area than drain 2 (D2 (in 200 cm depth)) and well 2 (W2),
although more detail examination is needed in the sites.
N2O emission factor from aquifers and agricultural drainage water (EF5-g) was
corrected downward from 0.015 to 0.0025 by IPCC in 2006, based on the data of Reay
et al. (2005) and Sawamoto et al. (2005). In this study, the EF5-g was determined lower
in puddle than the IPCC (2006) default value, while it were higher in drains and in wells
compared with the range of the IPCC default value. Dissolved N2O concentration in
drains observed higher than puddle and wells, as affected by water movement inside the
drain. N2O produced in flowing waters is rapidly emitted to the atmosphere due to high
gas exchange rates and turbulent flows, whereas N2O produced in reservoirs such as
puddle and wells are likely to reside in the water body for a longer period of time where
it may be further reduced to N2. N2O production in reservoirs is determined over longer
Chapter 3
79
time scales than in flowing waters (Beaulieu et al. 2014). And inside the drain, there is a
number of processes remove N from the water column, including assimilation into
microbial and plant biomass, sorption to sediments, and burial of particulate N
(Wollheim et al. 2008).
The observed relationships between dissolved N2O and NO3- suggest that
emission factors were different in each location due to relation with denitrification rate,
groundwater residence time, sampling depth, and water movement. It has been
explained that denitrification rates and N2O fluxes should be more closely examined in
relation to drain geomorphology (depth, residence time), hydrology (residence time and
flow), and the dynamics of the nitrate load over distance and time. A study by Reay et al.
(2003) demonstrated how rapidly N2O degassing from drainage waters can occur,
indicating that degassing of N2O already present in the groundwater (Clough et al.
2006). Principally, the vertical diffusive fluxes from the aquifer surface should be added
to the potential total groundwater-derived emission (Deurer et al. 2008). Solid estimates
of diffusive fluxes are thus needed in order to check if the inclusion of this path leads to
higher emission factors as suggested by Weymann et al. (2009). Perhaps the most
important criticism of the EF5-g value is in its application to open systems. This EF was
adopted to help account for degassing of groundwater and water from drains, which can
Chapter 3
80
have very high concentrations of N2O. However, because surface drainages, like puddle
in this study, are open to gas exchange, rapid degassing of excess N2O may occur and
the ratio of N2O-N / NO3–-N may change over very short distances (Reay et al. 2003;
Baulch et al. 2012). This study observed dissolved N2O concentration tended to be
higher in drains than that in puddle and wells. It could be explained that different values
of EF5-g may related with feature of topography, since the sources of water was
sampled in the different locations along the slope (Fig. 3.1).
Due to measurement in short time period in this study, there might be still
uncertainties in the estimation of EF5-g. It is known that NO3− and dissolved N2O are
subject to interacting during subsurface transport in the water (Dobbie and Smith
2003b). Furthermore, determination of N2O in the aquifers as an intermediate product
from denitrification is permanently influenced by different enzyme kinetics of various
denitrifying communities. Groundwater N2O concentration is the net result of
simultaneous production and reduction reactions (Well et al. 2005). So it is needed to
conduct observation in long-time period for accurate and detail estimation of N2O
concentration in the aquatic ecosystem.
Chapter 3
81
3.5.3 pH, dissolved CO2 concentration and water quality
Value of pH from all water samples during the measurement were almost the
same (Fig. 3.5). pH value varied seasonally, in June 2012 measurement during dry
season showed a slightly higher of pH value in all water samples, while in October 2012
and January 2013 during wet season, the pH value decreased. Higher precipitation
during wet season may initiate to attribute acidic condition in water source by
decreasing pH value (Shabalala et al. 2013). The seasonal variation of pH values
observed in this study was similar with result reported by Abowei (2010) in Nkoro river,
Nigeria. The highest pH value showed in the dry season and lower pH value in the wet
season. It was explained that seasonality of the pH water may be due to the influx and
decay of debris in area and imbalance level of H+ ions input from surface runoff during
the precipitation. Precipitation is naturally acidic because of exposure to atmospheric
carbon dioxide. As precipitation occurred, rainwater combines with carbon dioxide can
influence the water toward acidity and pH is lowered (Wurts and Durborow 1992).
Value of pH may change due to changes in photosynthesis and other chemical reactions.
Photosynthesis uses up dissolved carbon dioxide, which acts like carbonic acid (H2CO3)
in water. CO2 removal, in effect, reduces the acidity of the water and so pH increases. In
Chapter 3
82
contrast, respiration of organic matter produces CO2, which dissolves in water as
carbonic acid, thereby lowering the pH (Michaud 1991).
Carbon dioxide is dissolved in groundwater and determination of dissolved
CO2 could be measured by indirectly method by monitoring in changing in pH where
the CO2 is dependent on shift pH value (Macpherson 2009). In this study (Fig. 3.5),
dissolved CO2 concentrations in all water sources were very low from the normal value
in the natural reservoir (5 to 10 mg L-1
) (Wurts and Durborow 1992). The dissolved CO2
concentrations were estimated by using indirectly calculation method by change of pH
value (Lower 1996) which explained that the concentrations of dissolved CO2 and pH
values influence each other. Therefore it is complicated to explain which factors
affecting in the different of dissolved CO2 concentrations among the water sources
sample, except by the pH value. Generally, groundwater has high CO2 concentration,
and low pH and oxygen concentration. CO2 is high in groundwater because of bacterial
process in the soils and various reactions in the groundwater, particulate mineral
formations through water movement (Wurts and Durborow 1992). In the next future,
directly measurement of dissolved CO2 concentration by using a chemical test
procedure from water sources is preferred, thus it can explain more detail factors
affecting the dissolved CO2 concentration accurately.
Chapter 3
83
Concerning with water quality in this study, it described below by criteria of
level of pH, NO3- and NH4
+ concentrations in the water samples of the oil palm
plantation area. The pH balance of a water supply describes how acidic or alkaline it is.
The acidity or alkalinity of a water supply can affect plant growth, irrigation equipment,
and drinking water suitability. Most natural waters are range from 5 to 8. The generally
acceptable range of pH for irrigation water is between 5.5 and 8.5. While pH water
quality standard for drinking water requiring disinfection only is 6.5 to 8.5 (Colin and
McKean 1991). Based on pH standard criteria, the water sources in the oil palm
plantation was slightly lower than which proposed by WHO (2008). The pH of drinking
water is not health matters. However the acidic water or low pH is possible to leach
metals from plumbing systems, which have potential to cause health problems (EPA
2001).
Chemical fertilizer application as anthropogenic sources of nitrogen
contamination in groundwater from agricultural activities are significantly influence the
water sources (Kumazawa 2002). In the most countries, nitrate levels in drinking water
derived from surface water do not exceed 10 mg L-1
, although nitrate levels in
well-water often exceed 50 mg L-1
. A high nitrate concentration in drinking water can
cause methemoglobinemia in infants and in the stomach in adults (Gatseva and Argirova
Chapter 3
84
2008). Ammonia in drinking water is not of immediate health relevance, and thus no
health-based guideline value is suggested. Ammonia is, however, an indicator of
possible bacterial, sewage, and animal waste pollution (WHO 2008). A high ammonia
concentration has the potential to increase the nitrate concentration through nitrification.
Generally, ammonia in the groundwater is below 0.2 mg L-1
, but anaerobic groundwater
may contain ammonia up to 3 mg L-1
. The threshold odor concentration of ammonia at
alkaline pH is approximately 1.5 mg L-1
, and a taste threshold of 35 mg L-1
has been
proposed for the ammonium cation (WHO 2003).
Result of this study observed that from all water sources the mean of
concentration of NH4+ and NO3
- were 0.32 to 1.06, and 0.11 to 2.79 mg L
-1, respectively.
Therefore, it could be stated that water quality in the area of plantation is in the range of
standard based on criteria for drinking-water.
Chapter 3
85
3.6 Conclusion
Topography affected spatial and temporal variation of N2O and CO2 fluxes in
oil palm plantation. Soil properties such as NO3- and WFPS were explained most of
cumulative N2O flux variability, while cumulative CO2 flux influenced by WFPS only.
Topography even in a short slope affected N2O and CO2 emissions, therefore it may
need to be taken into account in field measurements and modelling. Dissolved N2O
concentrations in water sources were supersaturated as leading to possibility to be
source of indirect emissions and varied widely according to the locations and sampling
situations. Agricultural landscape may play an important role in relation to hydrological
process.
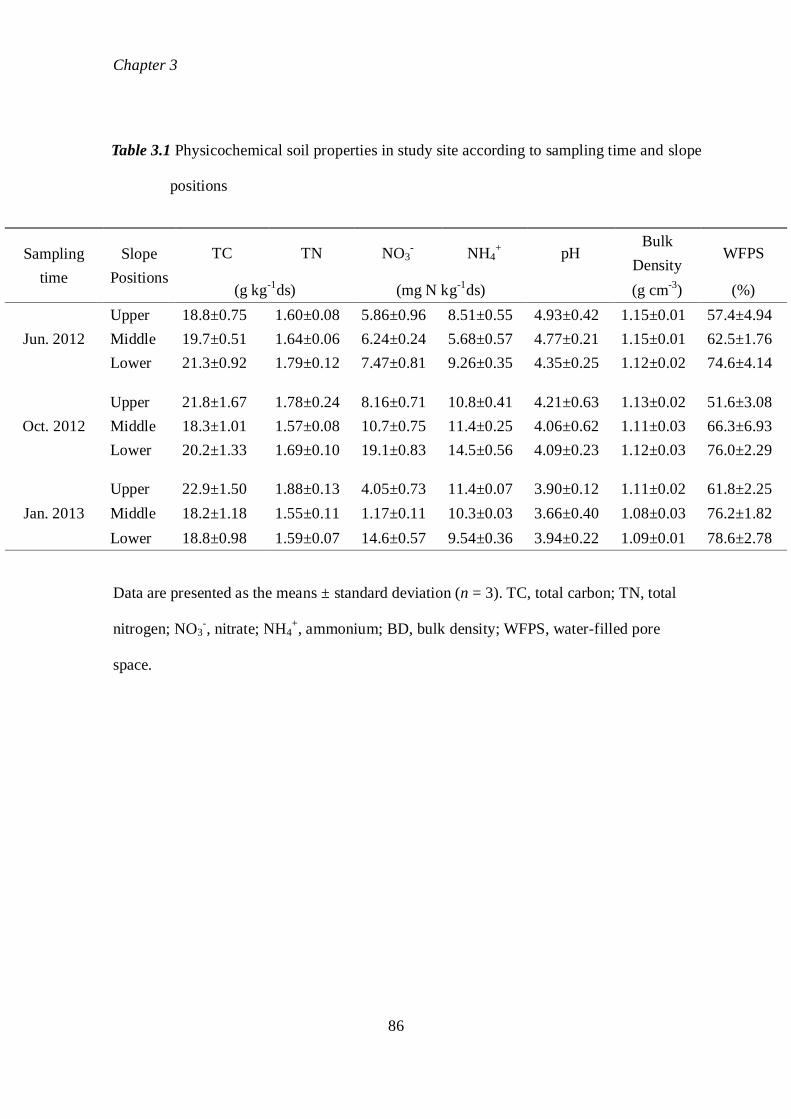
Chapter 3
86
Table 3.1 Physicochemical soil properties in study site according to sampling time and slope
positions
Sampling
time
Slope
Positions
TC TN NO3- NH4
+ pH
Bulk
Density WFPS
(g kg-1
ds) (mg N kg-1
ds) (g cm-3
) (%)
Jun. 2012
Upper 18.8±0.75 1.60±0.08 5.86±0.96 8.51±0.55 4.93±0.42 1.15±0.01 57.4±4.94
Middle 19.7±0.51 1.64±0.06 6.24±0.24 5.68±0.57 4.77±0.21 1.15±0.01 62.5±1.76
Lower 21.3±0.92 1.79±0.12 7.47±0.81 9.26±0.35 4.35±0.25 1.12±0.02 74.6±4.14
Oct. 2012
Upper 21.8±1.67 1.78±0.24 8.16±0.71 10.8±0.41 4.21±0.63 1.13±0.02 51.6±3.08
Middle 18.3±1.01 1.57±0.08 10.7±0.75 11.4±0.25 4.06±0.62 1.11±0.03 66.3±6.93
Lower 20.2±1.33 1.69±0.10 19.1±0.83 14.5±0.56 4.09±0.23 1.12±0.03 76.0±2.29
Jan. 2013
Upper 22.9±1.50 1.88±0.13 4.05±0.73 11.4±0.07 3.90±0.12 1.11±0.02 61.8±2.25
Middle 18.2±1.18 1.55±0.11 1.17±0.11 10.3±0.03 3.66±0.40 1.08±0.03 76.2±1.82
Lower 18.8±0.98 1.59±0.07 14.6±0.57 9.54±0.36 3.94±0.22 1.09±0.01 78.6±2.78
Data are presented as the means ± standard deviation (n = 3). TC, total carbon; TN, total
nitrogen; NO3-, nitrate; NH4
+, ammonium; BD, bulk density; WFPS, water-filled pore
space.
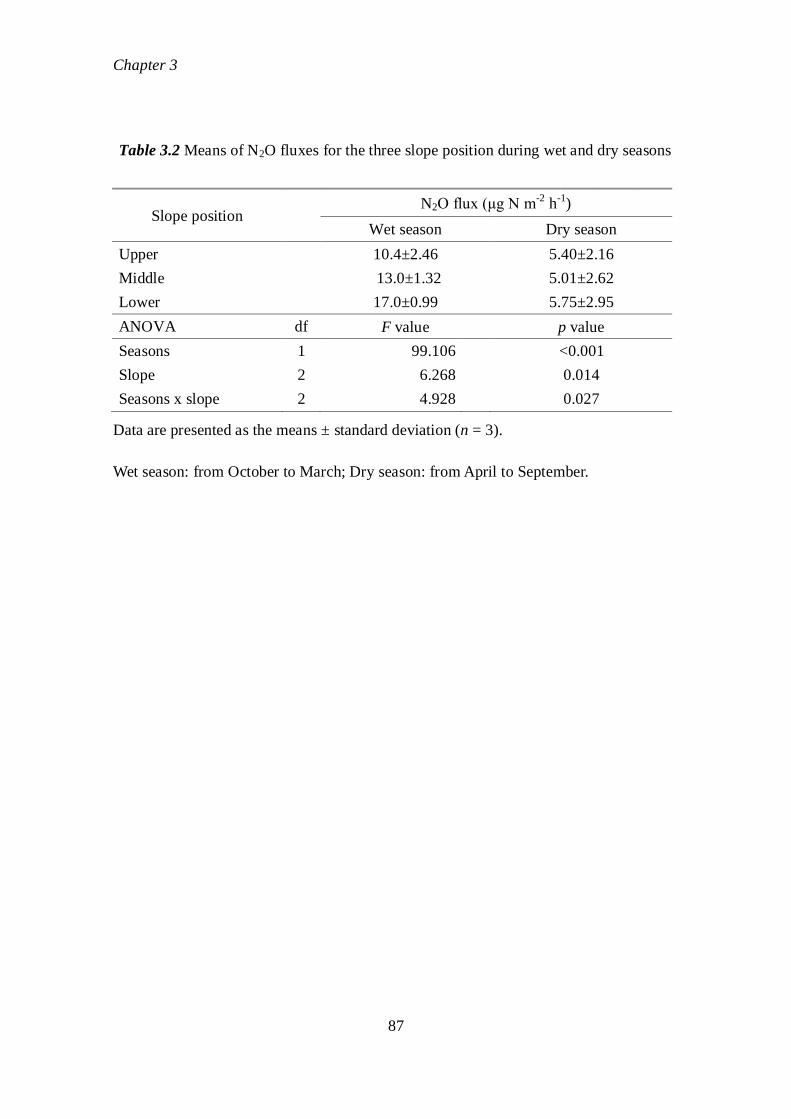
Chapter 3
87
Table 3.2 Means of N2O fluxes for the three slope position during wet and dry seasons
Slope position N2O flux (μg N m
-2 h
-1)
Wet season Dry season
Upper
10.4±2.46 5.40±2.16
Middle
13.0±1.32 5.01±2.62
Lower 17.0±0.99 5.75±2.95
ANOVA df F value p value
Seasons 1 99.106
<0.001
Slope 2 6.268
0.014
Seasons x slope 2 4.928 0.027
Data are presented as the means ± standard deviation (n = 3).
Wet season: from October to March; Dry season: from April to September.
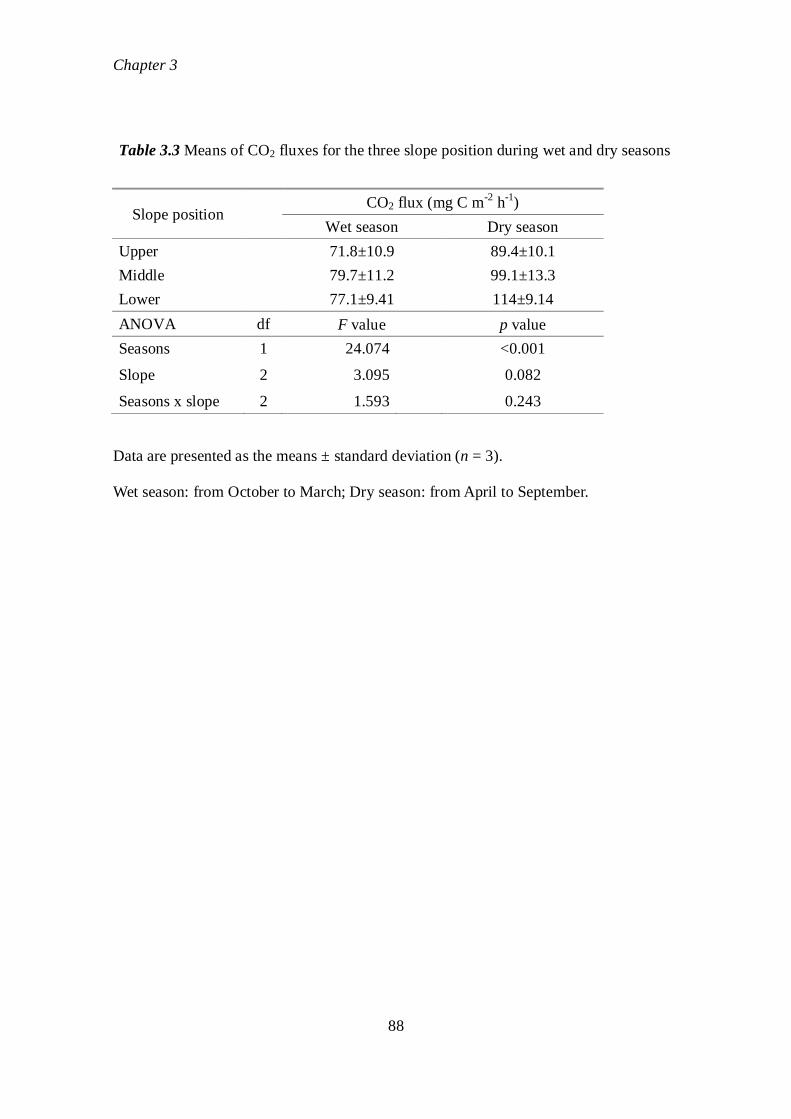
Chapter 3
88
Table 3.3 Means of CO2 fluxes for the three slope position during wet and dry seasons
Slope position CO2 flux (mg C m
-2 h
-1)
Wet season Dry season
Upper
71.8±10.9 89.4±10.1
Middle
79.7±11.2 99.1±13.3
Lower 77.1±9.41 114±9.14
ANOVA df F value p value
Seasons 1 24.074
<0.001
Slope 2 3.095
0.082
Seasons x slope 2 1.593 0.243
Data are presented as the means ± standard deviation (n = 3).
Wet season: from October to March; Dry season: from April to September.
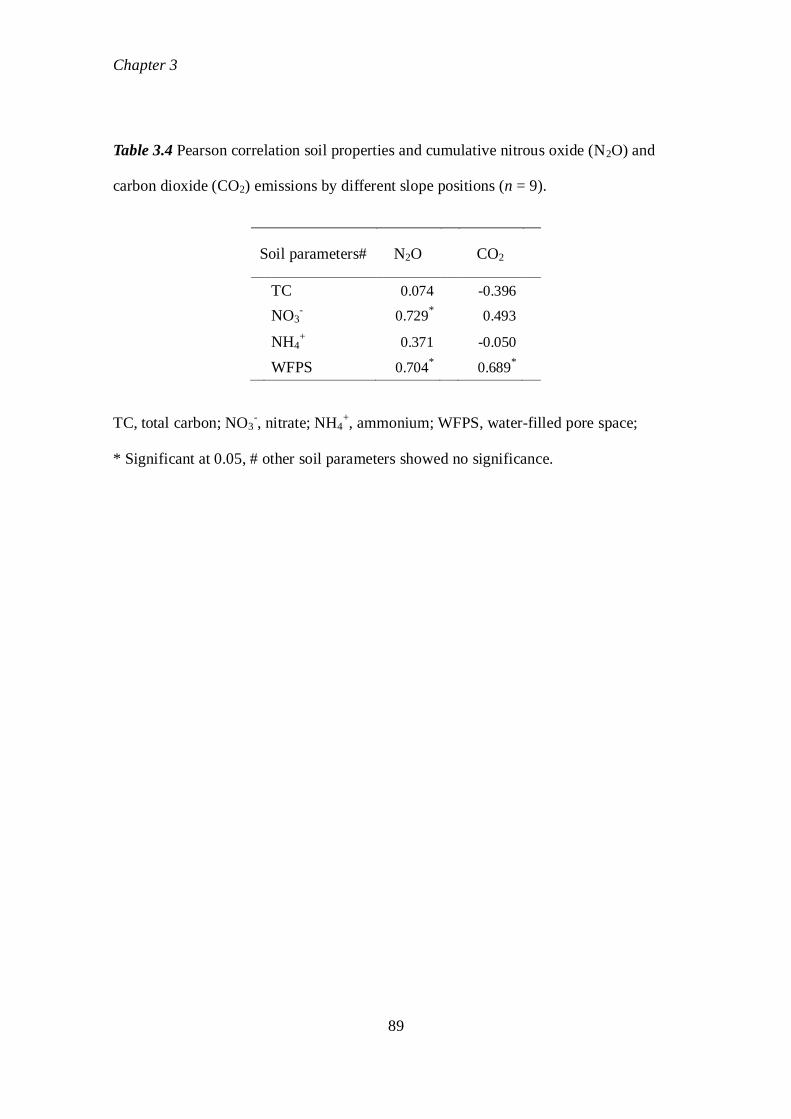
Chapter 3
89
Table 3.4 Pearson correlation soil properties and cumulative nitrous oxide (N2O) and
carbon dioxide (CO2) emissions by different slope positions (n = 9).
Soil parameters# N2O
CO2
TC 0.074
-0.396
NO3- 0.729
*
0.493
NH4+ 0.371
-0.050
WFPS 0.704*
0.689
*
TC, total carbon; NO3-, nitrate; NH4
+, ammonium; WFPS, water-filled pore space;
* Significant at 0.05, # other soil parameters showed no significance.
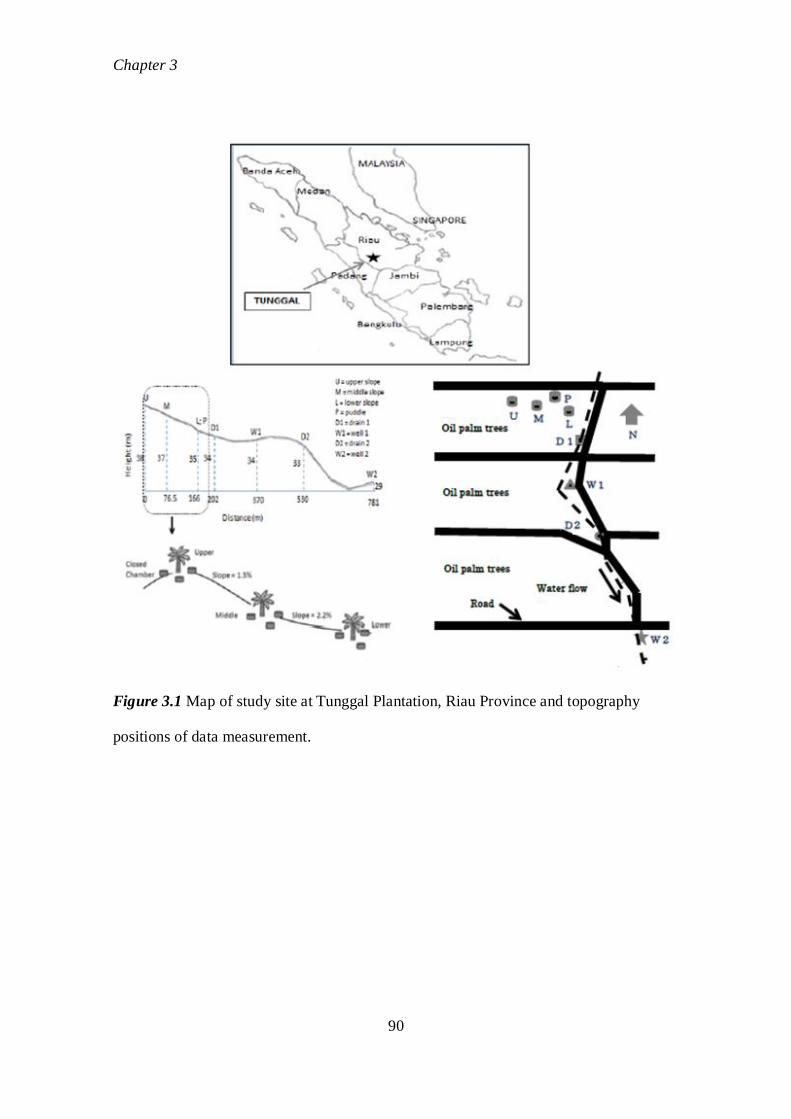
Chapter 3
90
Figure 3.1 Map of study site at Tunggal Plantation, Riau Province and topography
positions of data measurement.
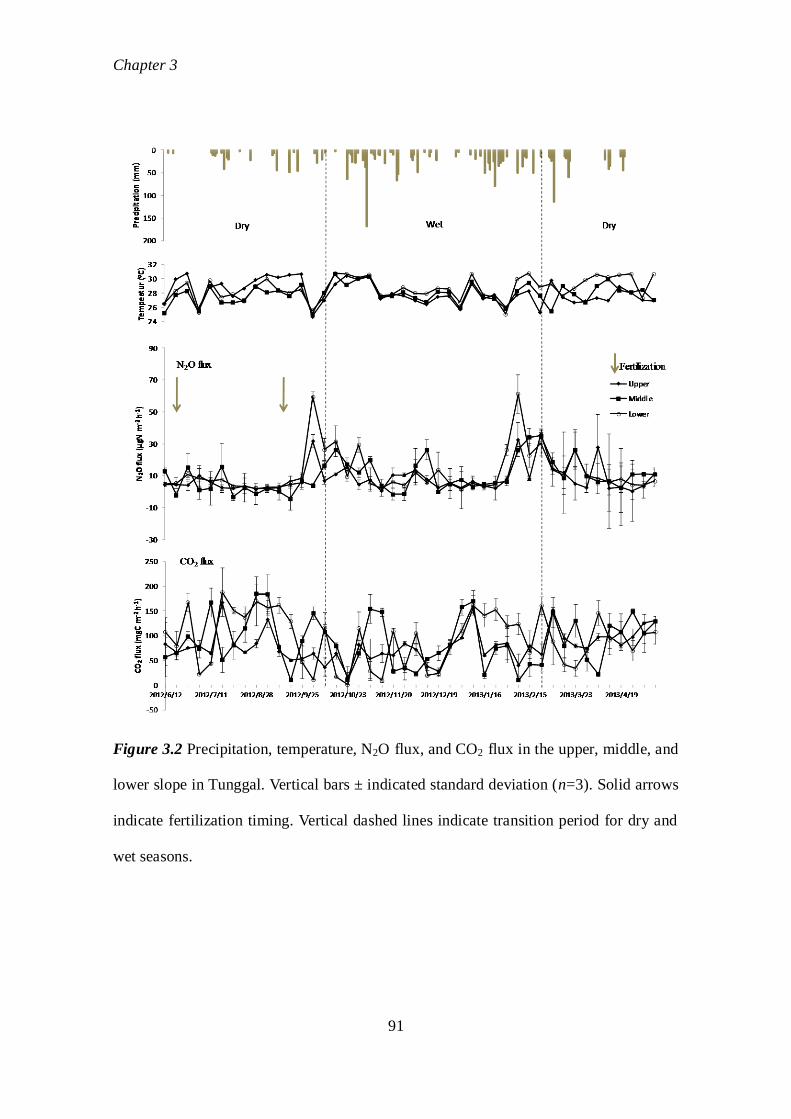
Chapter 3
91
Figure 3.2 Precipitation, temperature, N2O flux, and CO2 flux in the upper, middle, and
lower slope in Tunggal. Vertical bars ± indicated standard deviation (n=3). Solid arrows
indicate fertilization timing. Vertical dashed lines indicate transition period for dry and
wet seasons.
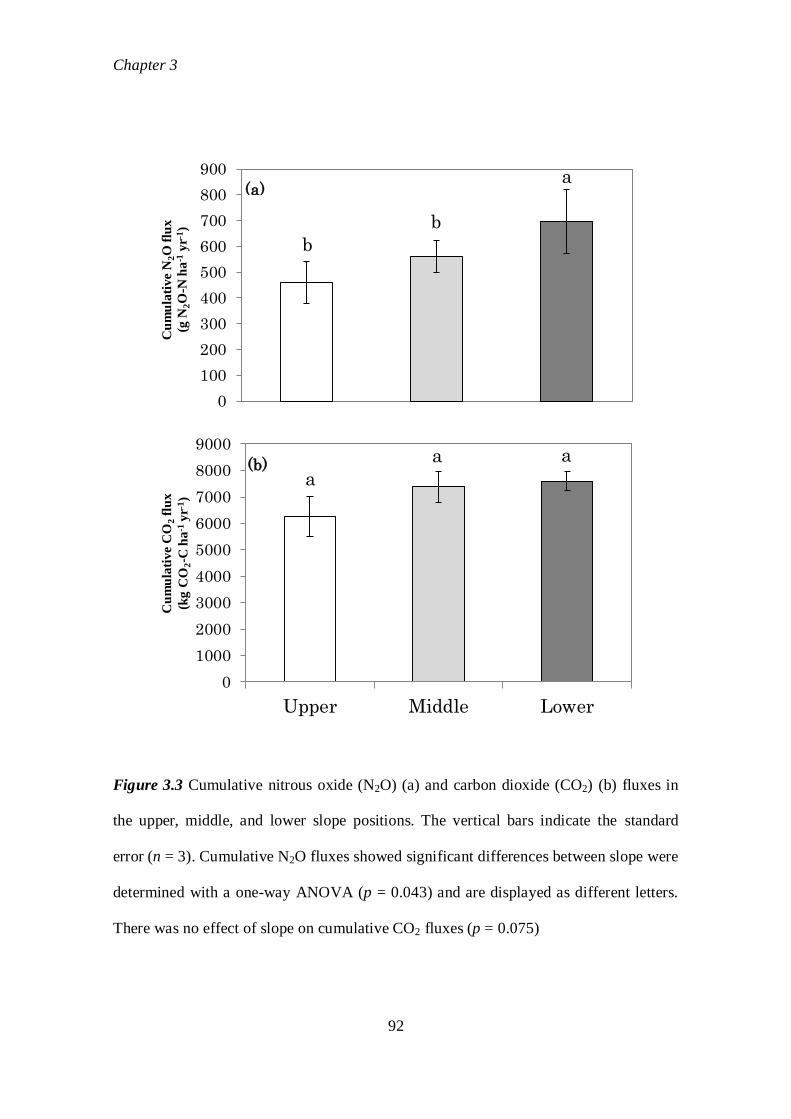
Chapter 3
92
Figure 3.3 Cumulative nitrous oxide (N2O) (a) and carbon dioxide (CO2) (b) fluxes in
the upper, middle, and lower slope positions. The vertical bars indicate the standard
error (n = 3). Cumulative N2O fluxes showed significant differences between slope were
determined with a one-way ANOVA (p = 0.043) and are displayed as different letters.
There was no effect of slope on cumulative CO2 fluxes (p = 0.075)
0
100
200
300
400
500
600
700
800
900C
um
ula
tive
N2O
flu
x
(g N
2O
-N h
a-1
yr-1
)
b
b
a (a)
0
1000
2000
3000
4000
5000
6000
7000
8000
9000
Upper Middle Lower
Cu
mu
lati
ve
CO
2 f
lux
(kg
CO
2-C
ha
-1 y
r-1)
a
a a (b)
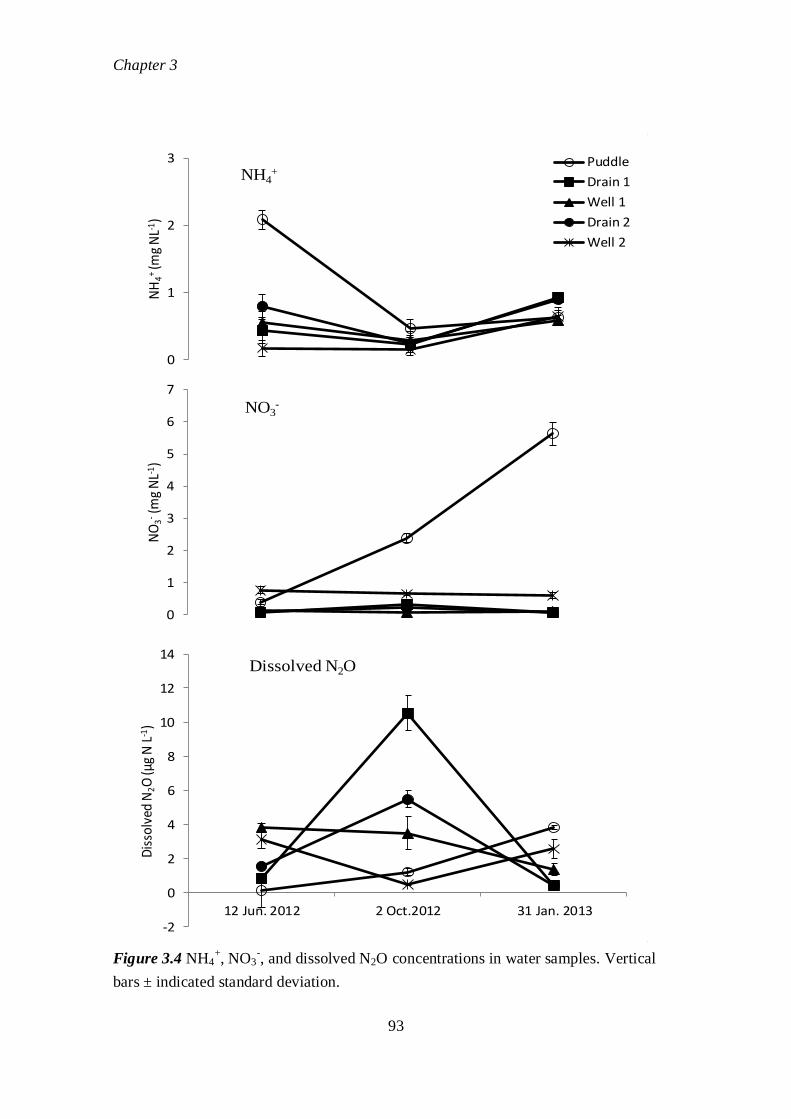
Chapter 3
93
Figure 3.4 NH4+, NO3
-, and dissolved N2O concentrations in water samples. Vertical
bars ± indicated standard deviation.
0
1
2
3N
H4
+(m
g N
L-1)
Puddle
Drain 1
Well 1
Drain 2
Well 2
0
1
2
3
4
5
6
7
NO
3-(m
g N
L-1)
NO3-
-2
0
2
4
6
8
10
12
14
12 Jun. 2012 2 Oct.2012 31 Jan. 2013
Dis
solv
ed N
2O
(μg
N L
-1)
Dissolved N2O
NH4+
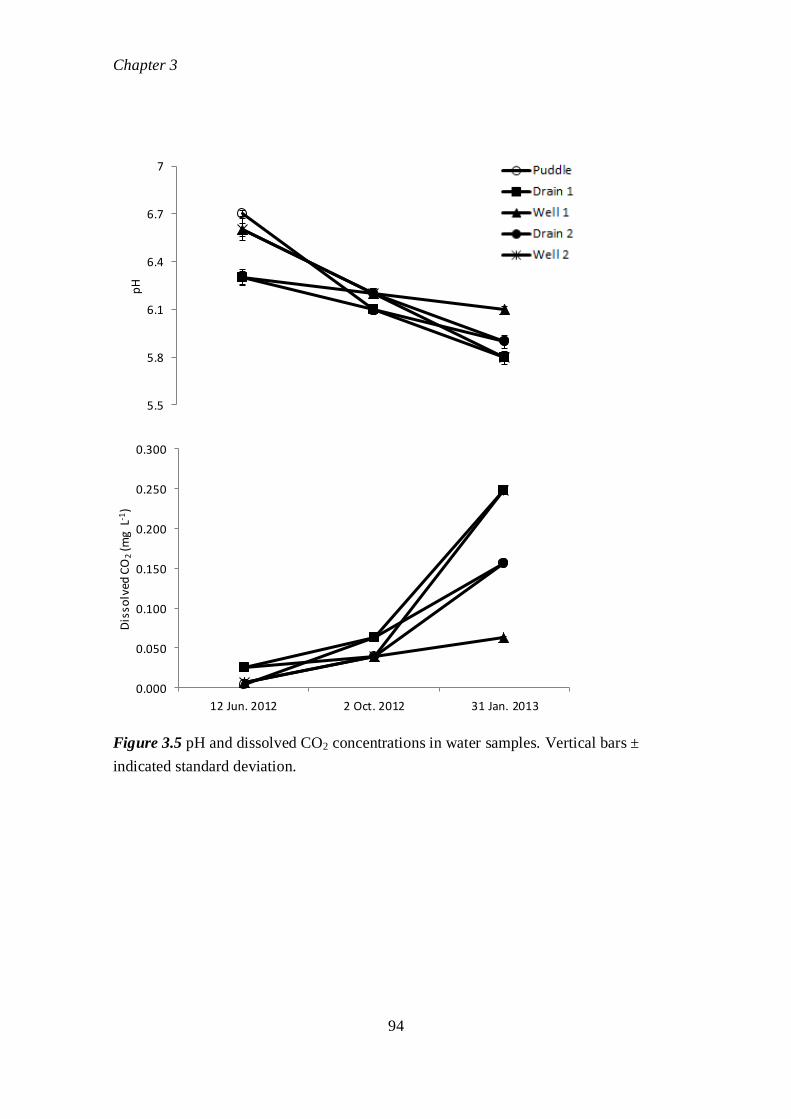
Chapter 3
94
Figure 3.5 pH and dissolved CO2 concentrations in water samples. Vertical bars ±
indicated standard deviation.
5.5
5.8
6.1
6.4
6.7
7
pH
0.000
0.050
0.100
0.150
0.200
0.250
0.300
12 Jun. 2012 2 Oct. 2012 31 Jan. 2013
Dis
solv
ed C
O2
(mg
L-1
)
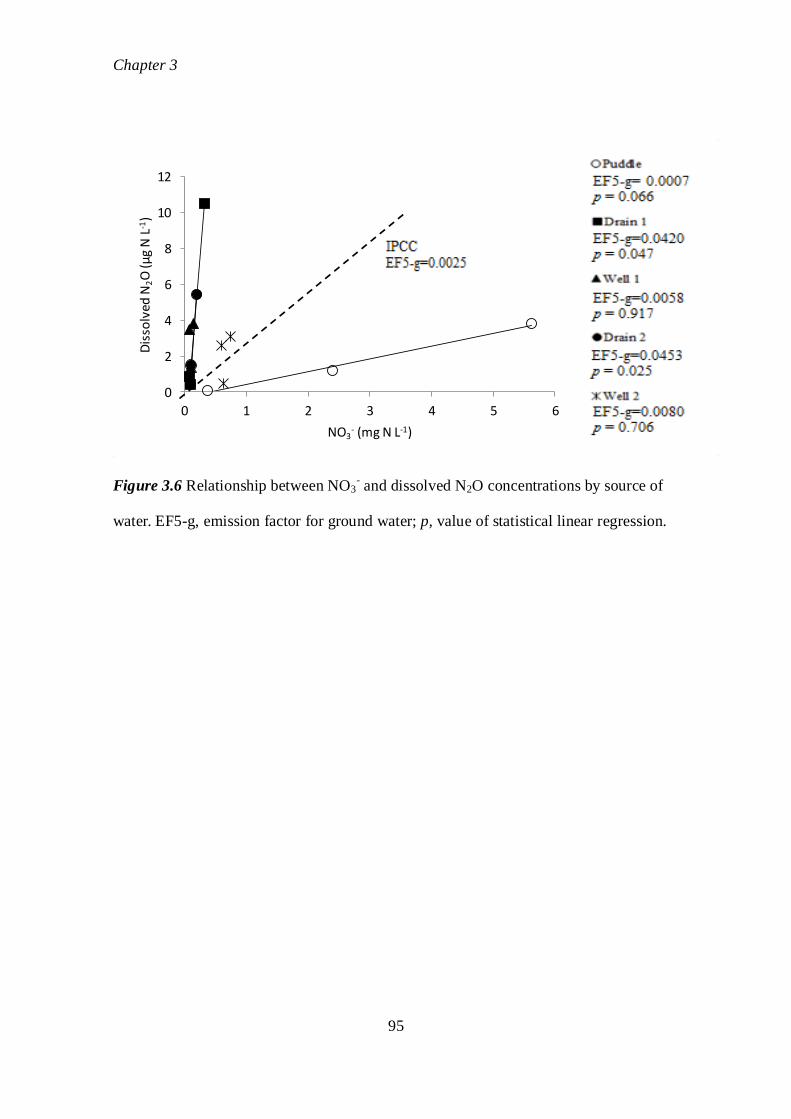
Chapter 3
95
Figure 3.6 Relationship between NO3- and dissolved N2O concentrations by source of
water. EF5-g, emission factor for ground water; p, value of statistical linear regression.
0
2
4
6
8
10
12
0 1 2 3 4 5 6
Dis
solv
ed N
2O
(μg
N L
-1)
NO3- (mg N L-1)
Chapter 4
96
Chapter 4
Effect of soil types and nitrogen fertilizer on yield in oil palm plantations
4.1 Abstract
In the oil palm plantation, one of the most important targets to be achieved is
Fresh Fruit Bunches (FFB) yield. Oil palm depends on many interrelated factors which
vary from one environment to another. Soils and fertilizers are essential factors on the
growth and production of oil palm. This study aimed to determine effect of soil types
and nitrogen fertilizers on FFB yield on mineral soil in Tunggal, Indonesia and in
Simunjan, Malaysia, and also on peat soil in Tatau, Malaysia, from 2011 to 2012.
Within each site, the N fertilizer applied with conventional and coated fertilizers.
Dosage of coated fertilizer application was half and quarter of dosage from conventional
fertilizer. FFB yields were recorded and summarized on an annual basis based on data
collection. Results showed that by different dosage of conventional fertilizer and coated
fertilizer had no different on FFB yields in each study area. Application of coated
fertilizer with half dosage from dosage of conventional fertilizer were more effective on
Partial Factor Productivity (PFP) as 53.2%, 45.4%, 49.1% and 57.1% in Tunggal,
Simunjan, Tatau (immature), Tatau (mature), respectively. Application with quarter
Chapter 4
97
dosage of coated fertilizer from dosage of conventional fertilizer showed that PFP by
coated fertilizer was 72.9% more effective in Tunggal. Therefore, reducing the dosage
of coated fertilizer in each soils type showed that coated fertilizer is more productive on
FFB yields.
Key words: mineral soil, peat soil, fertilizers, FFB yields, PFP (see page 101).
4.2 Introduction
The oil palm is the most productive oil crop in the world. Despite the absence
of mineral elements in the oil produced, large quantities of nutrients are used by the
plant for its vegetative growth and its yields. Fresh Fruit Bunch (FFB) yield of oil palm
plantation is the most important indicator in measuring the efficiency and effectiveness
of the plantation. Yield of the oil palm plantation achieved at the same time can also be
a measure whether the cultivated plantation industry is economically viable (Anwar et
al. 2014).
Oil palms mature rapidly and fruit can be harvested as soon as 2-3 years after
planting (Basiron 2007), although trees aged 9-15 years are the most productive
(BisInfocus 2006). The FFB typically are 52% dry weight and have an extractable oil
content of 15-25% depending on ripeness at harvesting time. Under optimal condition
Chapter 4
98
yields may reach 25-30 t FFB ha-1
yr -1
, and with an average extraction rate of 21-23%
this corresponds with an approximate 6 t oil ha-1
(Verheye 2010). Harvesting rounds
should be made as frequent as possible to avoid over ripening of bunches. Harvesting
rounds of 7-14 days are generally practiced. Under well-managed conditions, 10-15
bunches can be harvested per palm per year, weighing 15-20 kg each, total yields are
13-30 ha-1
yr -1
. The typical commercial lifespan of an oil palm is approximately 25 years.
After 25-30 years trees become too tall to harvest and are replaced (Basiron 2007).
Regarding to the soil type, oil palm have a reasonably high tolerance and can
grow at the diverse soil characteristics soil with a fairly wide interval on various soil
types ranging from organic soil of Histosols to mineral soils of Andisols, Oxisols,
Entisols, Inceptisols and Ultisols. Histosols are known by various other names in other
countries, such as peat or muck (Anwar et al. 2014), as long as it is well watered
(NewCROP 1996). In Indonesia and Malaysia, the oil palm is mainly planted on highly
weathered soils which belong to the orders Ultisols and Oxisols (Shamshuddin et al.
2015). These soils exits under tropical environment which are subjected to high rainfall
and temperature throughout the year, therefore the soils are predominantly acidic and
deficient of macronutrients or low in fertility (Shamshuddin and Anda 2012).
Consequently fertilizer input is very necessary applied regularly at the appropriate rate.
Chapter 4
99
Oil palm needs humid equatorial conditions to thrive, and soil and climatic conditions
play roles in the growth of oil palm, hence conditions in Indonesia and Malaysia are
suitable for its uninterrupted growth (Basiron 2007).
Fertilizers are crucial in oil palm production, accounting for 50–70% of field
operational costs and about 25% of the total cost of production (Caliman et al. 2007;
Goh and Hardter 2003). Especially during the fruiting season, oil palms is requiring
high amounts of nutrients which are contain N, P, K, Ca, Mg and S as well as
micronutrients such as boron, copper, zinc, iron and manganese and molybdenum (IPI
1991). Nitrogen is the most important nutrient for oil palm growth and a key input to
food production. Nitrogen is required for the formation of protein (IPI 1991). The
potential needs of the crop at level of growth and yield must be determined in order to
draw up an appropriate and balanced fertilizer use (Foster and Dolmat 1986). In the
management practices, approaches to improve crop nutrient use efficiency and fertilizer
efficiency is very important (Aziz and El-Asry 2009; Prasad 2009). Significant
improvements must be made in N use efficiency to produce enough yields and to avoid
large-scale degradation of ecosystems caused by excess N (Tilman et al. 2001).
To determine the efficiency of applied nutrients, Cassman et al. (1996)
introduced the term Partial Factor Productivity (PFP). The advantage of this index is to
Chapter 4
100
quantify total economic output from any particular factor or nutrient, relative to its
utilization from all resources in the system, including indigenous soil nutrients and
nutrients from applied inputs. The PFP for N over the years can be used to indicate the
sustainability of the oil palm production system. Therefore, the objective of this study
was to determine the effect and efficiency of reducing fertilizer rate of coated fertilizers
compare to conventional fertilizer on FFB yield in different soil types.
4.3 Materials and Methods
Study sites were located in oil palm plantation areas on tropical land, in
Indonesia and in Malaysia from 2011 to 2012. The one site was located in Tunggal on
sandy loam soil, and other 2 sites were located in Simunjan on sandy soil and in Tatau
on peat soil, respectively. The annual rainfall is about 1387, 4095, and 2225 mm in
Tunggal, Simunjan, and Tatau, respectively. Physicochemical properties of the soils
were described in chapter 2. Growth of oil palm plantation was monitored by measuring
the production of FFB according to age of oil palm in each study sites. The N fertilizer
rates applied were as conventional rate as plantation practices (C), coated fertilizer with
half (M1) and quarter (M2) dosages of conventional fertilizer (Table 4.1). The
conventional fertilizer was applied by surface-placed on the ring under the canopy of
Chapter 4
101
palm, while the coated fertilizer applied in the 4 holes (in 10 cm depth) under the
canopy of palm. Area studied are consisted with 525 palms (mature, 7 years) in 3.9 ha in
Tunggal, 50 palms (mature, 9 years) in 0.37 ha in Simunjan, 40 palms (immature, 4
years) in 0.27 ha, and 48 palms (mature, 5 years) at 0.32 ha in Tatau (Figure 4.1). FFB
yields were recorded and summarized on an annual basis based on data collection. To
compare the efficiency of N applications, the PFP was analyzed for each fertilizer
treatments in each study site.
Partial Factor Productivity (PFP) is determined the efficiency of applied
nutrient (Goh et al. 2003) and it was calculated as below by Cassman et al. (1996):
PFP = Y/Na
Where Y is FFB yield (kg ha-1
), (Na) is N applied (kg ha-1
)
4.4 Results
As described in Chapter 2 already, soils of each site have different in
physicochemical characteristics. Based classification of soil nutrient content for oil
palm, soil condition in each site is described in Table 4.2. Soil pH, total C and total N
on mineral soil both in Tunggal and Simunjan was categorized as “high”. On peat soil,
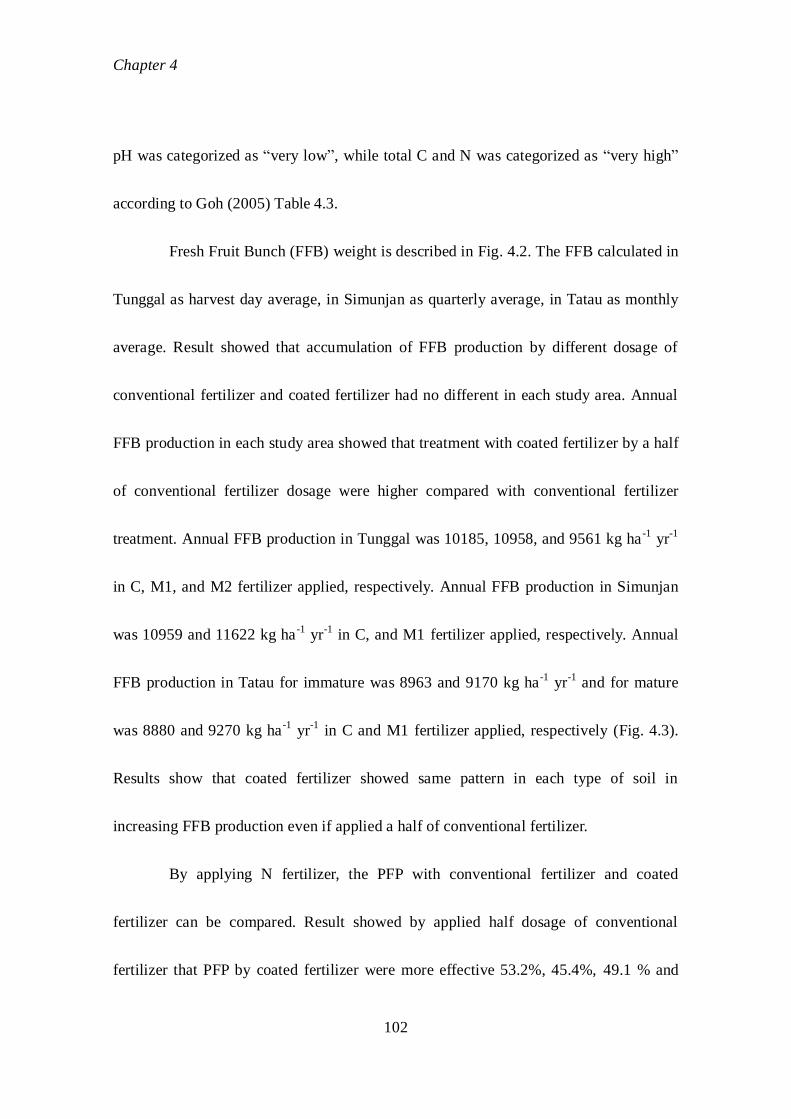
Chapter 4
102
pH was categorized as “very low”, while total C and N was categorized as “very high”
according to Goh (2005) Table 4.3.
Fresh Fruit Bunch (FFB) weight is described in Fig. 4.2. The FFB calculated in
Tunggal as harvest day average, in Simunjan as quarterly average, in Tatau as monthly
average. Result showed that accumulation of FFB production by different dosage of
conventional fertilizer and coated fertilizer had no different in each study area. Annual
FFB production in each study area showed that treatment with coated fertilizer by a half
of conventional fertilizer dosage were higher compared with conventional fertilizer
treatment. Annual FFB production in Tunggal was 10185, 10958, and 9561 kg ha-1
yr-1
in C, M1, and M2 fertilizer applied, respectively. Annual FFB production in Simunjan
was 10959 and 11622 kg ha-1
yr-1
in C, and M1 fertilizer applied, respectively. Annual
FFB production in Tatau for immature was 8963 and 9170 kg ha-1
yr-1
and for mature
was 8880 and 9270 kg ha-1
yr-1
in C and M1 fertilizer applied, respectively (Fig. 4.3).
Results show that coated fertilizer showed same pattern in each type of soil in
increasing FFB production even if applied a half of conventional fertilizer.
By applying N fertilizer, the PFP with conventional fertilizer and coated
fertilizer can be compared. Result showed by applied half dosage of conventional
fertilizer that PFP by coated fertilizer were more effective 53.2%, 45.4%, 49.1 % and
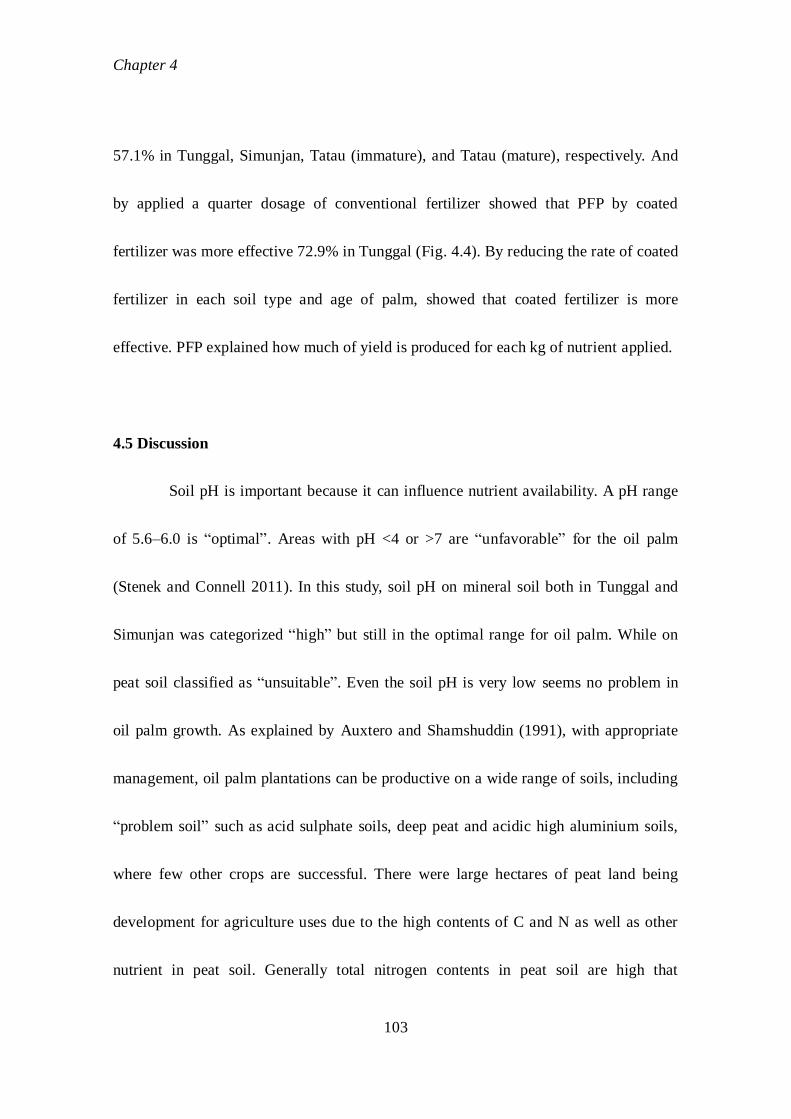
Chapter 4
103
57.1% in Tunggal, Simunjan, Tatau (immature), and Tatau (mature), respectively. And
by applied a quarter dosage of conventional fertilizer showed that PFP by coated
fertilizer was more effective 72.9% in Tunggal (Fig. 4.4). By reducing the rate of coated
fertilizer in each soil type and age of palm, showed that coated fertilizer is more
effective. PFP explained how much of yield is produced for each kg of nutrient applied.
4.5 Discussion
Soil pH is important because it can influence nutrient availability. A pH range
of 5.6–6.0 is “optimal”. Areas with pH <4 or >7 are “unfavorable” for the oil palm
(Stenek and Connell 2011). In this study, soil pH on mineral soil both in Tunggal and
Simunjan was categorized “high” but still in the optimal range for oil palm. While on
peat soil classified as “unsuitable”. Even the soil pH is very low seems no problem in
oil palm growth. As explained by Auxtero and Shamshuddin (1991), with appropriate
management, oil palm plantations can be productive on a wide range of soils, including
“problem soil” such as acid sulphate soils, deep peat and acidic high aluminium soils,
where few other crops are successful. There were large hectares of peat land being
development for agriculture uses due to the high contents of C and N as well as other
nutrient in peat soil. Generally total nitrogen contents in peat soil are high that
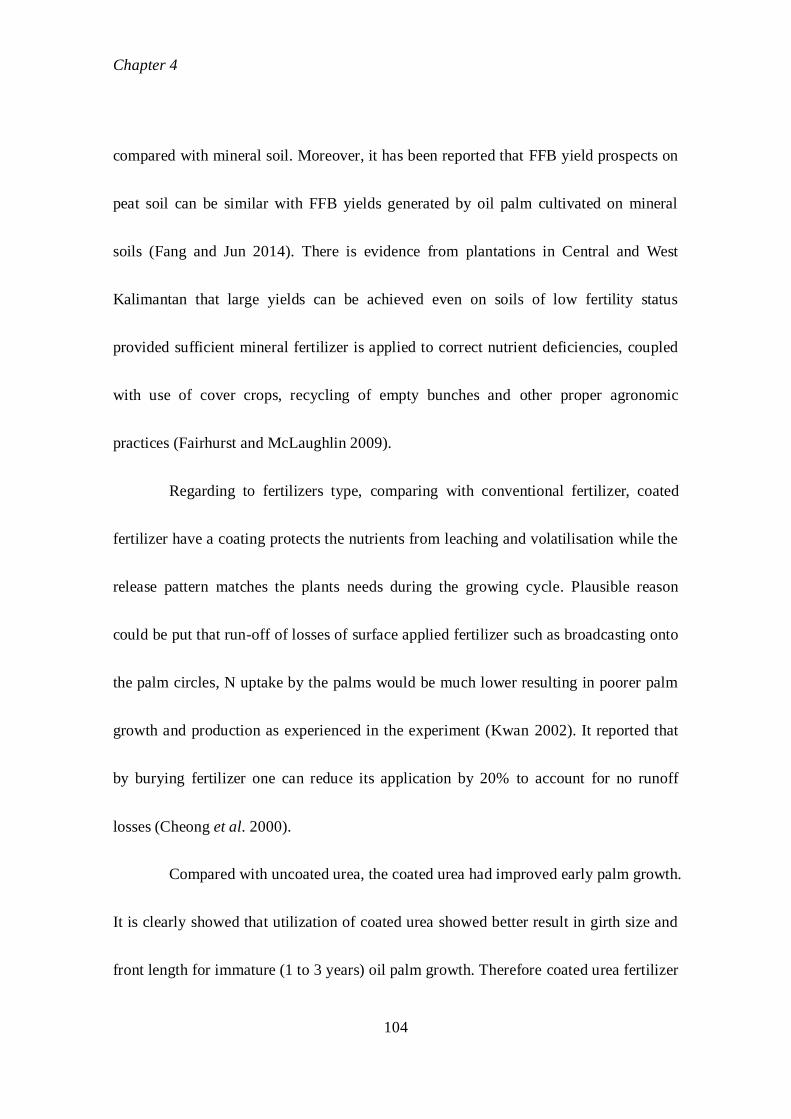
Chapter 4
104
compared with mineral soil. Moreover, it has been reported that FFB yield prospects on
peat soil can be similar with FFB yields generated by oil palm cultivated on mineral
soils (Fang and Jun 2014). There is evidence from plantations in Central and West
Kalimantan that large yields can be achieved even on soils of low fertility status
provided sufficient mineral fertilizer is applied to correct nutrient deficiencies, coupled
with use of cover crops, recycling of empty bunches and other proper agronomic
practices (Fairhurst and McLaughlin 2009).
Regarding to fertilizers type, comparing with conventional fertilizer, coated
fertilizer have a coating protects the nutrients from leaching and volatilisation while the
release pattern matches the plants needs during the growing cycle. Plausible reason
could be put that run-off of losses of surface applied fertilizer such as broadcasting onto
the palm circles, N uptake by the palms would be much lower resulting in poorer palm
growth and production as experienced in the experiment (Kwan 2002). It reported that
by burying fertilizer one can reduce its application by 20% to account for no runoff
losses (Cheong et al. 2000).
Compared with uncoated urea, the coated urea had improved early palm growth.
It is clearly showed that utilization of coated urea showed better result in girth size and
front length for immature (1 to 3 years) oil palm growth. Therefore coated urea fertilizer
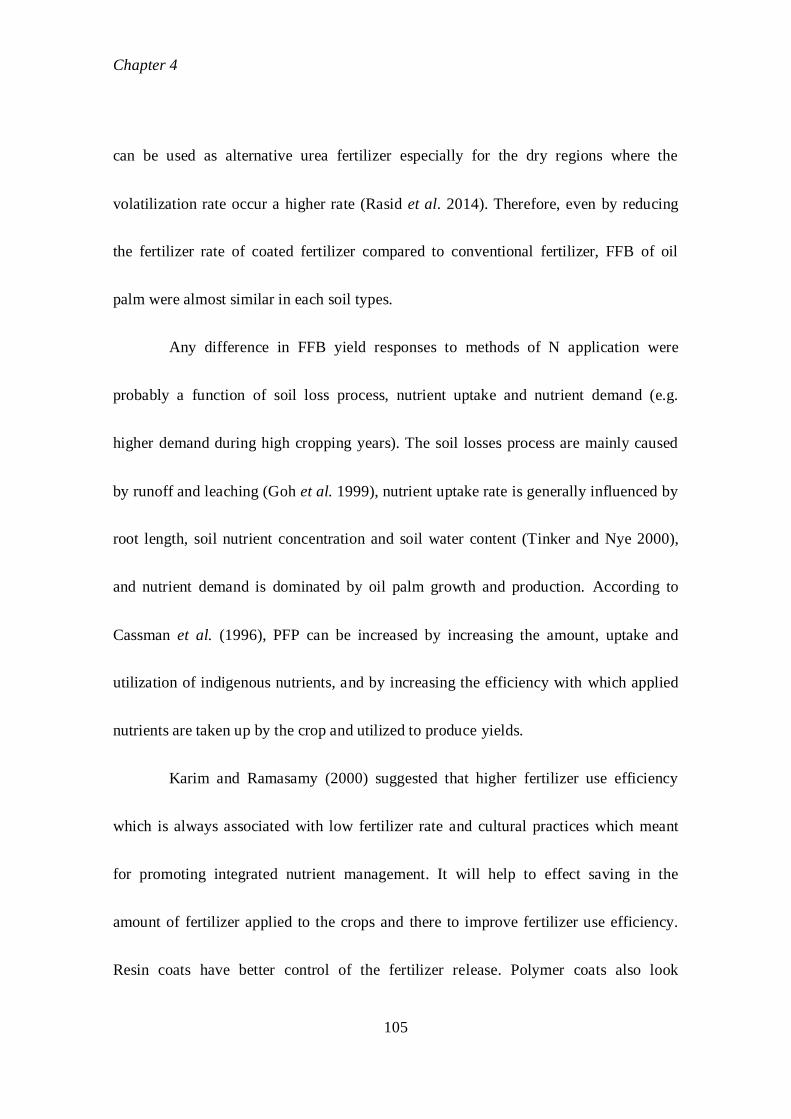
Chapter 4
105
can be used as alternative urea fertilizer especially for the dry regions where the
volatilization rate occur a higher rate (Rasid et al. 2014). Therefore, even by reducing
the fertilizer rate of coated fertilizer compared to conventional fertilizer, FFB of oil
palm were almost similar in each soil types.
Any difference in FFB yield responses to methods of N application were
probably a function of soil loss process, nutrient uptake and nutrient demand (e.g.
higher demand during high cropping years). The soil losses process are mainly caused
by runoff and leaching (Goh et al. 1999), nutrient uptake rate is generally influenced by
root length, soil nutrient concentration and soil water content (Tinker and Nye 2000),
and nutrient demand is dominated by oil palm growth and production. According to
Cassman et al. (1996), PFP can be increased by increasing the amount, uptake and
utilization of indigenous nutrients, and by increasing the efficiency with which applied
nutrients are taken up by the crop and utilized to produce yields.
Karim and Ramasamy (2000) suggested that higher fertilizer use efficiency
which is always associated with low fertilizer rate and cultural practices which meant
for promoting integrated nutrient management. It will help to effect saving in the
amount of fertilizer applied to the crops and there to improve fertilizer use efficiency.
Resin coats have better control of the fertilizer release. Polymer coats also look
Chapter 4
106
promising for widespread use in agriculture because it can be designed to release
nutrients in a more controlled manner by manipulating properties of polymer coating. It
is hypothesized that the volatilization rate and nutrient leaching of urea fertilizer can be
minimized and improved fertilizer efficiency can be achieved as compared to
conventional urea fertilizer. Concerning with N2O emission, coated fertilizer was
effective to reduce N2O emissions by 31 and 48% in wet and dry seasons, respectively,
compared to the conventional fertilizer in Tunggal plantation on mineral soil. However,
the effectivity on reducing N2O and CO2 fluxes in tropical oil palm plantation not
always by fertilizer treatment, but it more significantly affected by the types of soil as
explained in the Chapter 2.
Fertilizers are usually the largest variable cost item in oil palm production and
therefore, it should be used at the highest possible recovery efficiency by minimizing
soil nutrient losses. Every effort and input in the plantations should be geared towards
producing the optimum or maximum yields. Including fertilizer, yield depends on a
variety of factors, such as soil and climatic conditions, age, seed quality, and quality of
plantation management.
Chapter 4
107
4.6 Conclusion
Due to adaptability of oil palm to cultivate in wide range of soils types, oil
palm can be grown and produce yield of FFB on mineral and peat soil. The yield
supported by high content of nitrogen, carbon, and others nutrient in the soil.
Considering to the growth of oil palm, applying coated fertilizer even with almost half
rate and quarter rate in Tunggal, were effective to support yield of FFB of oil palm
plantations. Coated fertilizer was effective to produce FFB on mineral and peat soils.
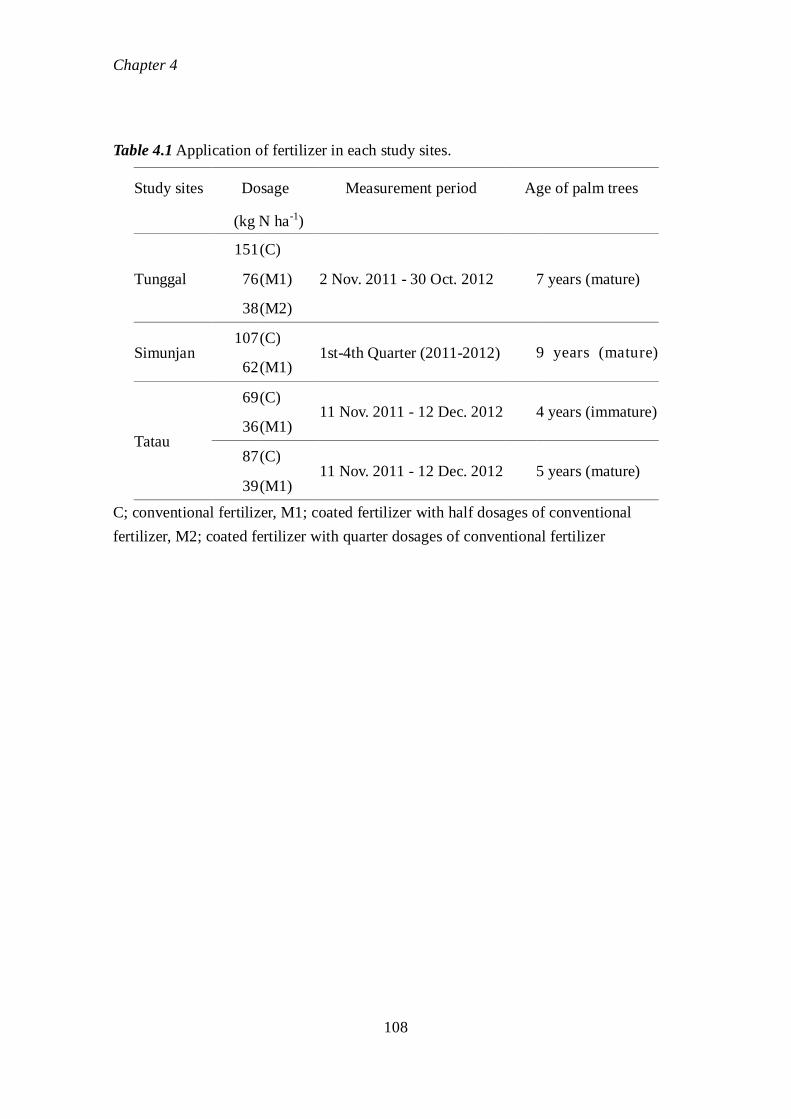
Chapter 4
108
Table 4.1 Application of fertilizer in each study sites.
Study sites Dosage Measurement period Age of palm trees
(kg N ha-1)
Tunggal
151 (C)
2 Nov. 2011 - 30 Oct. 2012
7 years (mature) 76 (M1)
38 (M2)
Simunjan 107 (C)
1st-4th Quarter (2011-2012)
9 years (mature) 62 (M1)
Tatau
69 (C) 11 Nov. 2011 - 12 Dec. 2012
4 years (immature)
36 (M1)
87 (C) 11 Nov. 2011 - 12 Dec. 2012
5 years (mature)
39 (M1)
C; conventional fertilizer, M1; coated fertilizer with half dosages of conventional
fertilizer, M2; coated fertilizer with quarter dosages of conventional fertilizer
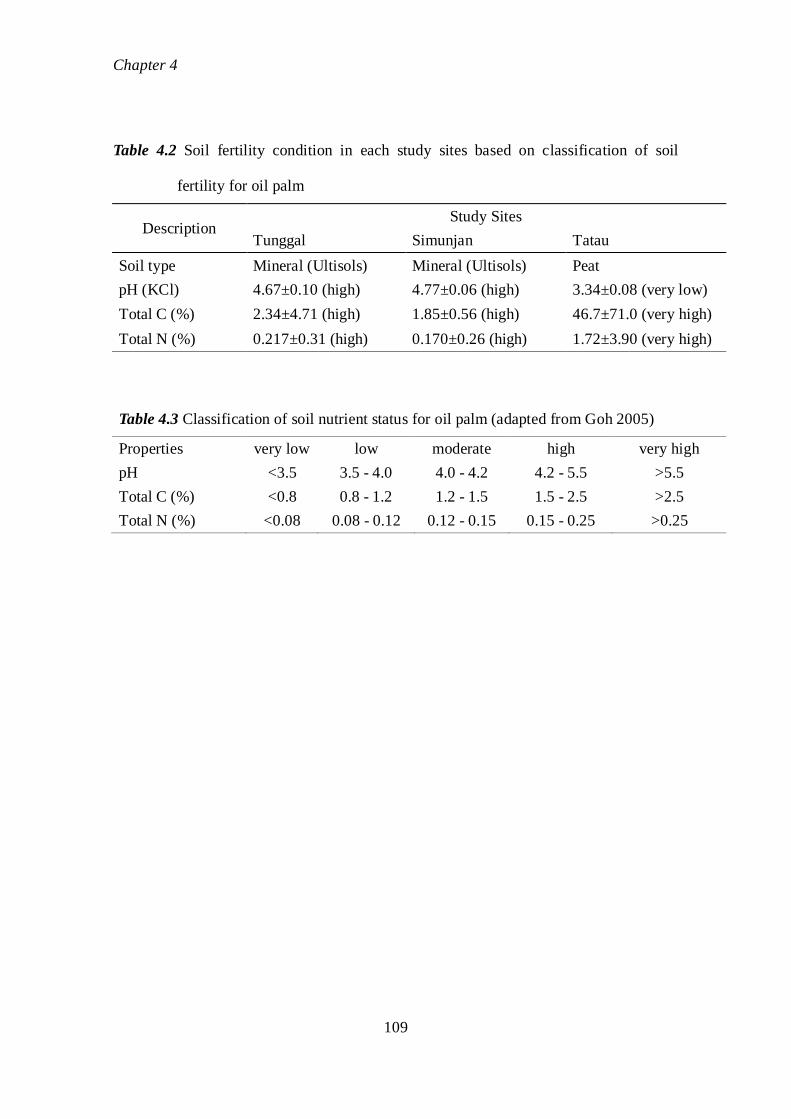
Chapter 4
109
Table 4.2 Soil fertility condition in each study sites based on classification of soil
fertility for oil palm
Description Study Sites
Tunggal Simunjan Tatau
Soil type Mineral (Ultisols) Mineral (Ultisols) Peat
pH (KCl) 4.67±0.10 (high) 4.77±0.06 (high) 3.34±0.08 (very low)
Total C (%) 2.34±4.71 (high) 1.85±0.56 (high) 46.7±71.0 (very high)
Total N (%) 0.217±0.31 (high) 0.170±0.26 (high) 1.72±3.90 (very high)
Table 4.3 Classification of soil nutrient status for oil palm (adapted from Goh 2005)
Properties very low low moderate high very high
pH <3.5 3.5 - 4.0 4.0 - 4.2 4.2 - 5.5 >5.5
Total C (%) <0.8 0.8 - 1.2 1.2 - 1.5 1.5 - 2.5 >2.5
Total N (%) <0.08 0.08 - 0.12 0.12 - 0.15 0.15 - 0.25 >0.25
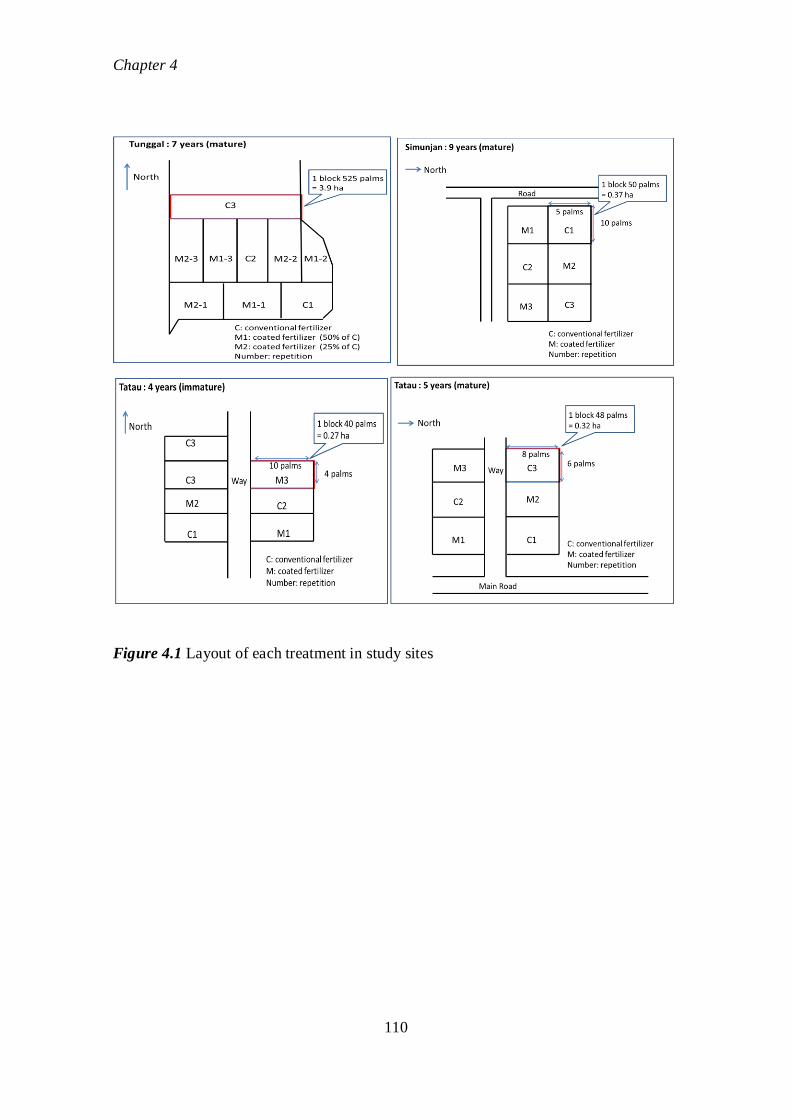
Chapter 4
110
Figure 4.1 Layout of each treatment in study sites
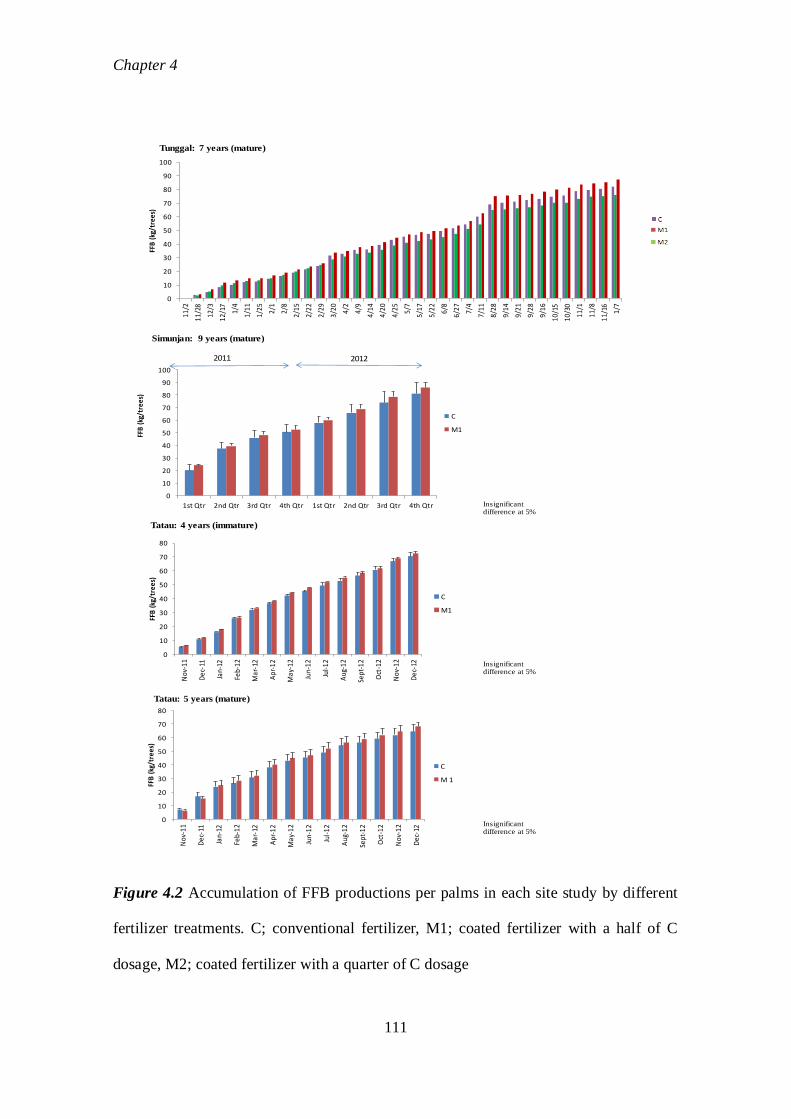
Chapter 4
111
Figure 4.2 Accumulation of FFB productions per palms in each site study by different
fertilizer treatments. C; conventional fertilizer, M1; coated fertilizer with a half of C
dosage, M2; coated fertilizer with a quarter of C dosage
0
10
20
30
40
50
60
70
80
90
100
11/2
11/2
8
12/3
12/1
7
1/4
1/11
1/25 2/
1
2/8
2/15
2/22
2/29
3/20 4/
2
4/9
4/14
4/20
4/25 5/
7
5/17
5/22 6/
8
6/27 7/
4
7/11
8/28
9/14
9/21
9/28
9/16
10/1
5
10/3
0
11/1
11/8
11/1
6
1/7
FFB
(kg/
tree
s)Tunggal: 7 years (mature)
C
M2
M1
0
10
20
30
40
50
60
70
80
90
100
1st Qtr 2nd Qtr 3rd Qtr 4th Qtr 1st Qtr 2nd Qtr 3rd Qtr 4th Qtr
FFB
(kg/
tree
s)
Simunjan: 9 years (mature)
C
M1
2011 2012
0
10
20
30
40
50
60
70
80
Nov
-11
Dec
-11
Jan-
12
Feb-
12
Mar
-12
Apr
-12
May
-12
Jun-
12
Jul-1
2
Aug
-12
Sept
-12
Oct
-12
Nov
-12
Dec
-12
FFB
(kg/
tree
s)
Tatau: 4 years (immature)
C
M1
0
10
20
30
40
50
60
70
80
Nov
-11
Dec
-11
Jan-
12
Feb-
12
Mar
-12
Apr
-12
May
-12
Jun-
12
Jul-1
2
Aug
-12
Sept
-12
Oct
-12
Nov
-12
Dec
-12
FFB
(kg/
tree
s)
Tatau: 5 years (mature)
C
M 1
Insignificant difference at 5%
Insignificant difference at 5%
Insignificant difference at 5%
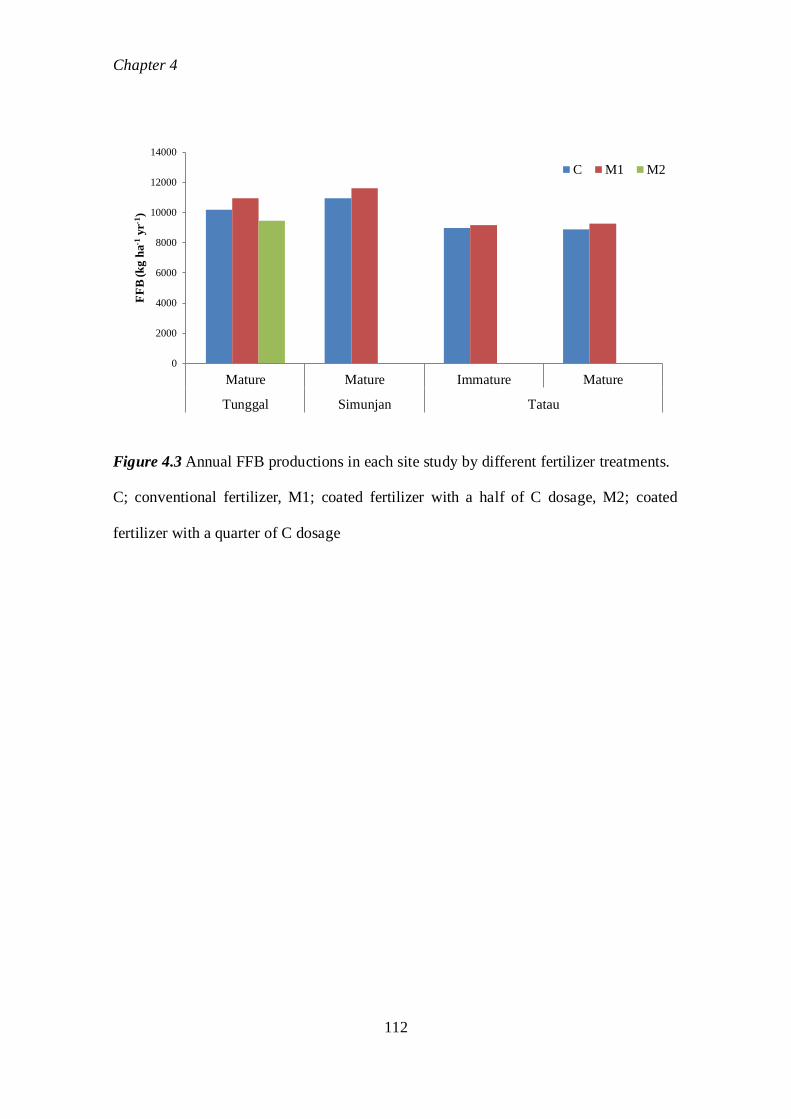
Chapter 4
112
Figure 4.3 Annual FFB productions in each site study by different fertilizer treatments.
C; conventional fertilizer, M1; coated fertilizer with a half of C dosage, M2; coated
fertilizer with a quarter of C dosage
0
2000
4000
6000
8000
10000
12000
14000
Mature Mature Immature Mature
Tunggal Simunjan Tatau
FF
B (k
g h
a-1
yr-1
)
C M1 M2
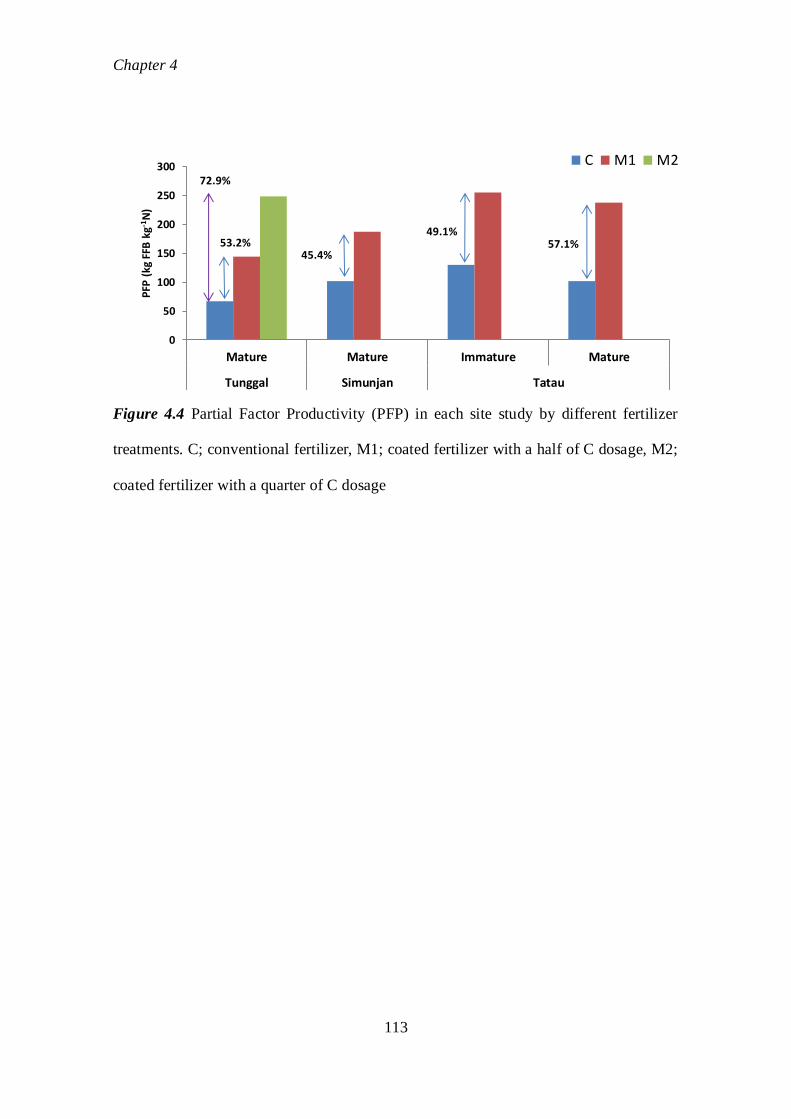
Chapter 4
113
Figure 4.4 Partial Factor Productivity (PFP) in each site study by different fertilizer
treatments. C; conventional fertilizer, M1; coated fertilizer with a half of C dosage, M2;
coated fertilizer with a quarter of C dosage
0
50
100
150
200
250
300
Mature Mature Immature Mature
Tunggal Simunjan Tatau
PFP
(kg
FFB
kg-1
N)
C M1 M2
49.1% 57.1% 53.2%
72.9%
45.4%
Chapter 5
114
Chapter 5
General Discussion and Conclusions
5.1 General Discussion
Climate change have been became an important environmental topics which
related the agricultural sector. It well known that anthropogenic activities in the
agricultural sector is considered as the sources of GHGs emissions. On agricultural
sector, oil palm plantation has been increased as the sources of GHGs emissions
through land use change and agricultural practices as introduced in the chapter 1 of this
study. Whereby, agriculture sectors contribute 60% from anthropogenic N2O sources
(IPCC 2007; Schmidt 2010). In Indonesia and Malaysia, expanding large area of oil
palm plantation has been increased critics concern due to its potential impact to induce
GHG emissions. Among those sources, land use change and land preparation by
burning method are serious problem and became the most important factor define level
of GHG emission. Especially, when oil palm plantations are developed on peat soil, the
carbon is lost as CO2 because of oxidation of the peat soil due to drainage, fires and loss
from biomass due to clearing vegetation (Arina et al. 2013). In Indonesia the largest
land use change was from forest to oil palm, while in Malaysia oil palm development
Chapter 5
115
has been mainly at the expense of other permanent crops, rather than directly from
deforestation (Wicke et al. 2008b).
Another source of GHGs emissions related to the expanding oil palm
plantations practice is the application of N fertilizers (Yew et al. 2012). The application
of N fertilizers in oil palm plantation may result in high acceleration release of N2O
emission into the atmosphere, and eventually leading to significant global warming.
N2O is an important greenhouse gas, due to its high global warming potential (298 times
higher than CO2). The use of N-fertilizer is important to provide that plants reach a
desirable yield, on the other hand, a portion of this added N can be lost to the
atmosphere as N2O, enhancing the greenhouse effect. The increase in available mineral
N in soil may enhance the formation of N2O through the process of nitrification and
denitrification (Hewitta et al. 2009). According to Treseder (2008), fertilization has
strong effect not only N2O emission but also on CO2 emissions. Due to N-fertilizer is
also applied to enhance the root respiration for rapid plant growth and generally will
lead to the increasing of total CO2 emission in the atmosphere. Soil CO2 emissions are
usually larger in the growing season because of higher carbon inputs from plant
photosynthesis and more suitable microclimatic environment in soils for microbial
decomposition. Soil CO2 emission is basically controlled by two processes: CO2
Chapter 5
116
production within the soil and its transport from the soil into the atmosphere (Fang and
Moncrieff 1999). Microbial activity and root respiration are the major sources of CO2
production, and the transport of the gas is controlled by diffusion.
In fact, the amounts of N2O emitted from soils depend on complex interactions
between soil properties, climatic factors, topography and agricultural practices. The
proportion of N2O gases emitted from soils is influenced by soil type. On mineral soil,
clayey soils tend to show greater N2O emissions than sandy soils. N2O emission
increases with higher clay content of the soil, because the chance on anaerobic
conditions increases (Velthof and Oenema 1995). It reported that under maize land, it
found much higher N2O emissions on clay soil compared to sandy soil (Van Groenigen
et al. 2004). Peat soils have higher N2O emissions than clay and sandy soils because of
the higher organic matter content with related higher denitrification potential (Velthof et
al. 1996). In the chapter 2 of this study, N2O emission more affected by soils type rather
than by fertilizers type. The highest mean of N2O fluxes on peat soil in Tatau plantation,
Malaysia, followed by sandy loam soil (5% content of clay) in Tunggal plantation,
Indonesia and sandy soil (0.03% content of clay) in Simunjan plantation, Malaysia. N2O
emissions were not always affected by application of fertilizers whether by conventional
fertilizer or coated fertilizer. However, on sandy loam soil in Tunggal plantation,
Chapter 5
117
Indonesia, application of coated fertilizer reduced N2O emissions during wet and dry
seasons. Concerning with CO2 fluxes, it tended to increase with the increase in oil palm
growth, higher root biomass would release in higher root respiration. On the climatic
factor, precipitation is an important indicator for the risk of anaerobic conditions in soils.
Many studies found significantly positive correlations N2O emissions with precipitation
and soil moisture (Smith et al. 1998; Zhang and Han 2008). In this study, high of N2O
fluxes appeared after a heavy precipitation. During the wet season, diffusion is no
longer restricted and the accumulated inorganic N becomes available for microbial
activity throughout the soil, which rapidly exploits the N pools and emits N2O into the
atmosphere (Melling et al. 2007).
Topography is one of the factors which effect of N2O and CO2 emissions. The
highest N2O emission is observed in the lower slope position where optimal water-filled
pore space (WFPS) is encountered. Related with WFPS, high N2O emission at the lower
slope position may be driven by the denitrification pathways (Pennock et al. 1992;
Izaurralde et al. 2004). Besides the N2O emission into the atmosphere as direct emission,
the important of N2O emission from farmland drainage water as indirect emission is
poorly understood. Indirect N2O emissions account for one third of the total global
agricultural N2O source and approximately two thirds of the uncertainty in the total
Chapter 5
118
source (Mosier et al. 1998). It reported that on the drain water, the dissolved N2O was
very quickly lost to the atmosphere. Supersaturated concentrations of N2O in
groundwater and in surface water draining agricultural lands may occur due to leaching
of NO3- from the soil towards drainage and groundwater, or production during
nitrification and denitrification of fertilizer N in the groundwater or drainage. In the
chapter 3 of this study, it explained that topography was correlated with N2O emission.
It observed that higher N2O flux in the lower slope compared to upper and middle slope
position. Concerning with concentration of dissolved N2O in water resources, it
observed in the supersaturated concentration as leading to possibility to be source of
indirect emission.
Regarding with fertilization, it have to be considered the best practice for oil
palm development to involve investigation on the soil, through a study to assess the
potential affecting the GHGs emissions and increasing the efficiency of fertilizer N on
FFB yield. High FFB yields are sustained in soil with high and balanced nutrient status
(Goh 2005). In the Chapter 4 of this study, regarding with the fertilizers types in
effectivity to produce high FFB, it described that application of coated fertilizer was
more productive on FFB yield compared to conventional fertilizer on each soil types.
Considering both of effect of fertilizer toward environment and growth of oil palm, it
Chapter 5
119
was explained that by applying coated fertilizer were effective to support production the
FFB of oil palm plantation. However to mitigate the gas emission to the atmosphere, it
is still needed careful attention with the suitability of soil types.
Since oil palm sector has been increased and created new jobs as well reduced
poverty both in Indonesia and Malaysia, it seems that expanding oil palm plantations
are still increasing in the future. As the oil palm is a perennial crop, it is important to
understand how to improve intensive cultivation and to decrease the negative effect in
the environment. On sandy loam soil based on the result in improve fertilizer efficiency
and reduce N2O emission, as compared to conventional fertilizers, the use of coated
seems to be promising to utilize in oil palm plantation. However on peat soil, due to
large amounts of N content, the application rate of N fertilizers should be considered
carefully. With high organic carbon content and high ratio of C/N, affecting N
mineralization on peat (Lim et al. 2012), as the result peat soils may release high
amount of N from the second year after planting onwards, therefore the N application
rate should be reduced (Corley and Tinker 2003). Application rate of N fertilizer on peat
soil consider to be lower compare to mineral soil, as recommended by Ng (2002), N
application rate for Ultisols and Histosols (peat soil) as 0.8-1.0 and 0.6-0.8 kg palm-1
yr-1
, respectively. By carefully management of oil palm, the FFB yield obtainable to
Chapter 5
120
harvest for about 25 years once planted in the plantations. Due to old age, when the oil
palm had reached the time for no longer valuable, the palms need to be replanted. The
zero burning is recommended during the process of replanting to decrease the negative
impact to the environment. In the practice of zero burning, Bakar et al. (2011) suggested
utilization of the trunk, leaves, and empty fruit bunch (EFB) to be buried in the ground
in the oil palm area. That technique will accumulate biomass and increase organic
matter, so it could improve and maintain soil fertility.
By improving agriculture management, oil palm plantation on mineral and peat
soil can be carried out sustainably on properly by long term observation. Further
detailed study to asses a more accurate interpretation of the mechanism of N2O and CO2
fluxes in oil palm plantation and FFB yield is needed.
5.2 Conclusions
Based on situation of oil palm expansion and increasing GHGs (Chapter 1), it could be
concluded as follows (Fig. 5.1):
- Soil types are affecting N2O and CO2 emissions comparing to the fertilizer types.
However, depend on soil types, coated fertilizer have potential to reduce N2O
emission. (Chapter 2)
Chapter 5
121
- N2O emission is affected by topography, and ground water on the agriculture land
have to considered carefully in calculating dissolved N2O concentration as a source
of indirect emission. (Chapter 3)
- The effectiveness fertilizer type to produce high FFB yield on various soil types
both on mineral and peat soil showed that coated fertilizer is more effective than the
conventional fertilizer. (Chapter 4)
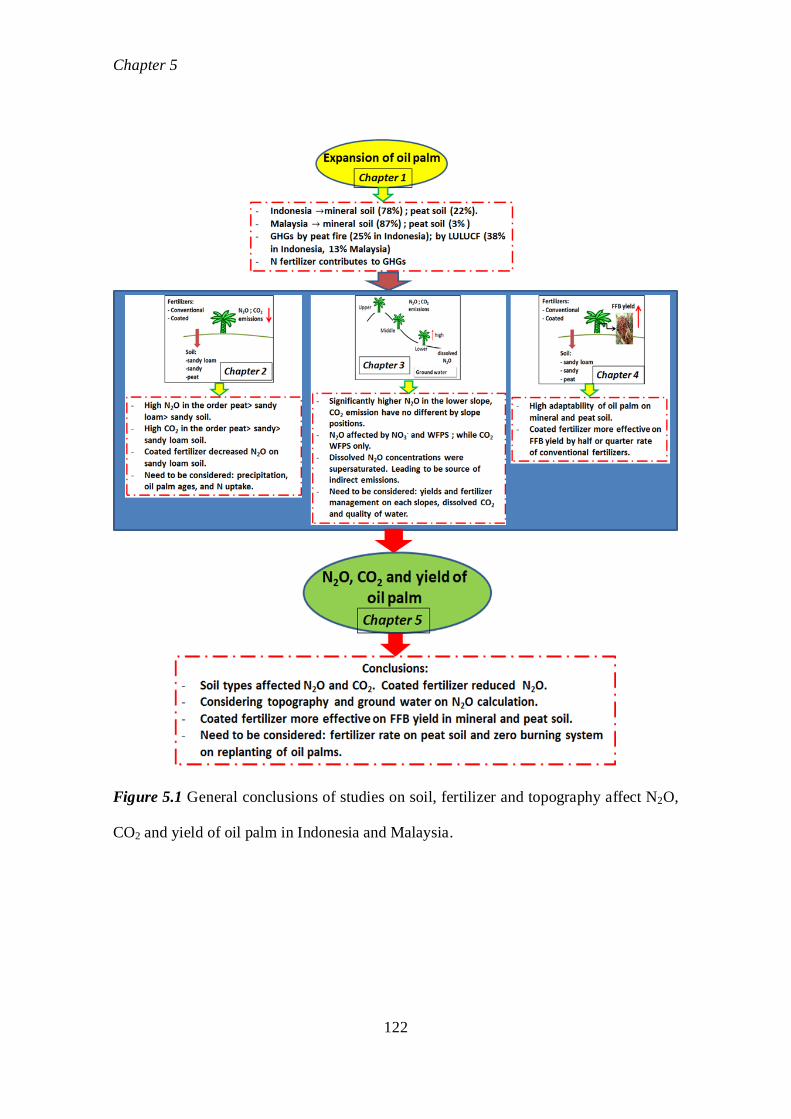
Chapter 5
122
Figure 5.1 General conclusions of studies on soil, fertilizer and topography affect N2O,
CO2 and yield of oil palm in Indonesia and Malaysia.
References
123
References
Abowei JFN 2010: Salinity, dissolved oxygen, pH and surface water temperature
condition in Nkoro River, Niger Delta, Nigeria. Adv. J. Food Sci. Technol., 2, 26–40.
Acquaye S, Inubushi K 2004: Comparative effects of app1ication of coated and
non-coated urea in clayey and sandy paddy soi1 microcosms examined by the 15N
tracer technique. Soil Sci. Plant Nutr., 50, 205–213.
Agus F, Gunarso P, Sahardjo BH, Harris N, van Noordwijk M, Killee TJ 2013:
Historical CO2 emissions from land use and land cover change from the oil palm
industry in Indonesia, Malaysia, and Papua New Guinea. In Reports from the
Technical Panels of the Second RSPO GHG Working Group, Ed. Killen TJ, Goon J,
Roundtable for Sustainable Palm Oil – RSPO, Kuala Lumpur.
Agus F, Runtunuwu E, June T, Susanti E, Komara H, Syahbuddin H, Las I, van
Noordwijk M 2009: Carbon budget in land use transition to plantation. Jurnal
Penelitian dan Pengembangan Pertanian, 29, 119 – 126.
Ahmad N 2000: Fertilizer Scenario in Pakistan Policies and Development. In
proceedings of the conference: Agriculture and Fertilizer Use. Planning and
Development Division, Government of Pakistan, February 15-16, 1999, NFDC,
Islamabad, Pakistan.
Akhir NIM, Kusin FM, Yusuff FM, Awang M, Ash’aari ZH 2015: Impact of nitrogen
fertilizer application on nitrous oxide emission in oil palm plantation. Procedia
Environ. Sci., 30, 315–319.
Akiyama H, Tsuruta H, Watanabe T 2000: N2O and NO emissions from soils after the
application of different chemical fertilizers. Chemos. Global Change Sci., 2,
References
124
313–320.
Akiyama H, Yan X, Yagi K 2009: Evaluation of effectiveness of enhanced-efficiency
fertilizers as mitigation options for N2O and NO emissions from agricultural soils:
meta-analysis. Glob. Chang. Biol., 16, 1837–1846.
Alvarez R 2005: A review of nitrogen fertilizer and conservation tillage effects on soil
organic carbon storage. Soil Use Manage., 21, 38–52.
Amkha S, Sakamoto A, Tachibana M, Inubushi K 2009: Controlled mineralizing
acetaldehyde condensation urea (CM-CDU) fertilizer can reduce nitrate leaching and
N2O emission from an Andisol with continuous cropped komatsuna (Brassica napa
L.). Soil Sci. Plant Nutr., 55, 772–777.
Anderson JM, Ingram JSI 1989: Colorimetric determination of ammonium. In Tropical
Soil Biology and Fertility, Ed. Anderson JM, Ingram JSI, pp. 42–43. ISSS, CAB
International, Wallingford.
Andersson M, Kjøller A, Struwe S 2003: Soil emissions of nitrous oxide in fire-prone
Africa savannas. J. Geophys. Res. Atmos., 108, 4630.
Anwar R, Sitorus SRP, Fauzi AM, Widiatmaka, Machfud 2014: Technical culture and
productivity of oil palm in several plantations in East Kalimantan. IJLRST, 3, 19–24.
Arah J, Smith KA, Crighton I, Li HS 1991: Nitrous oxide production and denitrification
in Scottish arable soils. J. Soil Sci., 42, 351–367.
Arina P. Schrier-Uijl, Silvius M, Parish F, Lim KH, Rosediana S, Anshari G 2013:
Environmental and social impacts of oil palm cultivation on tropical peat – a
scientific review. Reports from the Technical Panels of the 2nd Greenhouse Gas
Working Group of the Roundtable on Sustainable Palm Oil (RSPO).
Auxtero EA, Shamshuddin J 1991: Growth of oil palm (Elaeis-guineensis) seedling on
References
125
acid sulfate soils as affected by water regime and aluminum. Plant Soil, 137,
243–257.
Aziz EE, El-Asry SM 2009: Efficiency of slow release urea fertilizer on herb yield and
essential oil production of lemon balm (Melissa officinalis L.) plant. Am Eurasian J
Agric. Environ. Sci. 5, 141–147.
Bakar RA, Darus SZ, Kulaseharan S. Jamaluddin N 2011: Effect of ten years
application of empty fruit bunches in an oil palm plantation on soil chemical
properties. Nutr. Cycl. Agroecosyst., 89, 341–349.
Balasundram SK, Robert PC, Mulla DJ, Allan DL 2006: Relationship between oil palm
yield and soil fertility as affected by topography in an Indonesian plantation.
Commun Soil Sci Plant Anal., 37, 1321–1337.
Banerjee S, Siciliano SD 2012: Factors driving potential ammonia oxidation in
Canadian arctic ecosystems: does spatial scale matter?. Appl. Environ. Microbiol.,
78, 346–353.
Basiron Y 2007: Palm oil production through sustainable plantations. Eur. J. Lipid Sci.
Tech., 109, 289–295.
Basuki, Priatmadi BJ, Yanuwiadi B, Soemarno 2014: Plant age influence on soil
chemical properties of oil palm plantation in East Kotawaringin, Central Borneo.
Academic Research International, 5, 64–73.
Baulch HM, Schiff SL, Maranger R, Dillon PJ 2012: Testing models of aquatic N2O
flux for inland waters, Canadian J. Fisheries Aquatic Sci., 69, 145–160.
Beaulieu JJ, Smolenski RL, Nietch CT, Small AT, Elovitz MS, Joseph PSB 2014:
Denitrification alternates between a source and sink of nitrous oxide in the
hypolimnion of a thermally stratified reservoir. Limnol. Oceanogr., 59, 495–506.
References
126
BisInfocus 2006: Prospek perkebunan and industri minyak sawit di Indonesia
2006-2020. PT Bisinfocus Data Pratama, Jakarta.
Bouwman A, Van der Hoek KW, Olivier JGJ 1995: Uncertainties in the global source
distribution of nitrous oxide. J. Geophys. Res., 100, 2785–2800.
Bouwman AF 1990: Exchange of greenhouse gases between terrestrial ecosystems and
the atmosphere. In Soils and the Greenhouse Effect, Ed. Bouwman AF, pp. 61–148.
John Wiley and Sons Inc., New York, USA.
Bouwman AF 1996: Direct emission of nitrous oxide from agricultural soils. Nutr.
Cycling Agroecosys., 46, 53–70.
Bouwman AF 1998: Environmental science: nitrogen oxides and tropical agriculture.
Nature, 392, 866–867.
Bremner JM 1997: Sources of nitrous oxide in soils. Nutr. Cycling Agroecosys., 49,
7–16.
Brito LF, Junior JM, Pereira GT, Souza ZM, Junior NLS 2009: Soil CO2 emission of
sugarcane fields as affected by topography. Sci. Agric. (Piracicaba, Braz.), 66,
77–83.
Caliman JP, Carcasses R, Perel N 2007: Agri-environmental indicators for sustainable
palm oil production. Palmas, 28, 434–445.
Cassman KG, Gines GC, Dizon MA, Samson MI, Alcantar JM 1996: Nitrogen use
efficiency in tropical lowland rice systems: contribution from indigenous and applied
nitrogen. Field Crop Res., 47, 1–12.
Cheong SP, Pilus MZ, Khairul LL 2000: Austral Enterprises Berhad’s experience on the
conservation subsoil placement techniques of fertilizer application in oil palm.
Presented at RISDA/ESPEK Managers’ Seminar, Kuala Lumpur.
References
127
Clayton H, Arah JRM, Smith KA 1994: Measurement of nitrous oxide emission from
fertilized grassland using closed chambers. J. Geophys. Res., 99, 599–607.
Clough T, Bertram JE, Sherlock RR, Leonard RL, Nowicki BL 2006: Comparison of
measured and EF5-r-derived N2O fluxes from a spring-fed river. Global Change Biol.,
12, 352–363.
Colin JP, McKean 1991: Ambient water quality criteria for pH technical appendix.
Minister of Environment Province of British Columbia, Water Quality Branch, Water
Management Division, Victoria, BC. pp 81–82.
Comte I, Colin F, Whalen JK, Grünberger O, Caliman JP 2012: Agricultural practices in
oil palm plantations and their impact on hydrological changes, nutrient fluxes and
water quality in Indonesia. A review,” Advances in Agronomy, vol. 116, pp. 71–124.
Conrad R 2002: Microbiological and biochemical background of production and
consumption of NO and N2O in soil. In Trace Gas Exchange in Forest Ecosystems,
Ed. Gasche R, Papen H, Rennenberg H, pp. 3–33. Kluwer Academic Publisher,
Dordrecht, Netherlands.
Corley RHV, Tinker PB 2003: Trade and use of oil palm products. In The Oil Palm, 4th
Edition Ed. Corley RHV, Tinker PB, pp. 24–25. Blackwell Science Ltd Publisher,
United Kingdom.
Corre MD, Pennock DJ, von Kessel C, Elliott DK 1999: Estimation of annual nitrous
oxide emissions from a transitional grassland forest region in Saskatchewan, Canada.
Biogeochemistry, 44, 29–49.
Corre MD, Van Kessel KC, Pennock DJ, Solohub MP 1995: Ambient nitrous oxide
emissions from different landform complexes as affected by simulated rain‐fall.
Commun. Soil Sci. Plant Anal., 26, 2279–2293.
References
128
Couwenberg J 2009: Emission factors for managed peat soils (organic soils, histosols)
an analysis of IPCC default values. Greifswald University Wetlands International,
Ede, 2009, www.wetlands.org, UN-FCCC meeting, Bonn.
DEQ (Department of Environmental Quality) 2015. Fact sheet – Nitrate in drinking
water. Water Quality Division Drinking Water Protection Program, DEQ, State of
Oregon.
Davidson EA 1991: Fluxes of nitrous oxide and nitric oxide from terrestrial ecosystems.
In Microbial Production and Consumption of Greenhouse Gases: Methane, Nitrogen
Oxide, and Halomethanes, Ed. Rogers JE, Whitman WB, pp 219–235. American
Society for Microbiology, Washington.
Davidson EA, Belk E, Boone RD 1998: Soil water content and temperature as
independent or confounded factors controlling soil respiration in a temperate mixed
hardwood forest. Glob. Chang. Biol., 4, 217–227.
Delgado JH, Mosier AR 1996: Mitigation alternatives to decrease nitrous oxides
emissions and urea-nitrogen loss and their effect on methane flux. J. Environ. Qual.,
25, 1105–1111.
Deurer M, Heide C von der, Bottcher J, Duijnisveld WHM, Weymann D, Well R 2008:
The dynamics of N2O in the surface groundwater and its transfer into the
unsaturated zone: a case study from a sandy aquifer in Germany. Catena, 72,
362–373.
Dewi S, Khasanah N, Rahayu S, Ekadinata A, Van NM 2009: Carbon Footprint of
Indonesian Palm Oil Production: a Pilot Study. Bogor, Indonesia. World
Agroforestry Centre - ICRAF, SEA Regional Office.
Di HJ, Cameron KC 2006: Nitrous oxide emissions from two dairy pasture soils as
References
129
affected by different rates of a fine particle suspension nitrification inhibitor,
dicyandiamide. Biol. Fertil. Soils, 42, 472–480.
Dobbie KE, Smith KA 2003a: Impact of different form of N fertilizer on N2O emissions
from intensive grassland. Nutr. Cycl. Agroecosys., 67, 37–46.
Dobbie KE, Smith KA 2003b: Nitrous oxide emission factors for agricultural soils in
Great Britain: the impact of soil water-filled pore space and other controlling
variables. Global Change Biol., 9, 204–218.
Dolmat MT, Hassan AH, Zakaria ZZ 1982: Development of peat soil for oil palm
planting in Malaysia - Johor Barat Agricultural Project as a case study. Palm Oil
Research Institute of Malaysia Bulletin, 5, 1–17.
EPA (Environmental Protection Agency) 2001: Parameters of water quality,
interpretation and standard. Environmental Protection Agency, Ireland. ISBN
1-84096-015-3. https://www.epa.ie/pubs/advice/water/quality/Water_Quality.pdf.
FAO (Food and Agriculture Organization of the United Nations) 2005: Fertilizer use by
crop in Indonesia, FAO, Natural Resources Management and Environment.
http://www.fao.org/docrep/008/y7063e/y706e00.htm
FAO (Food and Agriculture Organization of the United Nation) 2014: FAOSTAT
Database. Rome, Italy: FAO. Retrieved May 2, 2016. http://faostat3.fao.org/home/E.
Fairhurst T, McLaughlin D 2009: Sustainable oil palm development on degraded land in
Kalimantan. Washington, DC. World Wide Fund for Nature (United States).
Fang C, Moncrieff JB 1999: A model for soil CO2 production and transport. 1. Model
development. Agr. Forest Meteorol., 95, 225–236.
Fang INL, Jun SX 2014: Sarawak planter’s perspective. Commerce International
Merchant Bankers (CIMB), Malaysia.
References
130
Fang Y, Gundersen P, Zhang W, Zhou G, Christiansen JR, Dong S, Zhang T 2009:
Soil-atmosphere exchange of N2O, CO2, and CH4 along a slope of an evergreen
broad-leaved forest in southern China. Plant Soil, 319, 37–48.
Firestone MK, Davidson EA 1989: Microbiological basis of NO and N2O production
and consumption in soil. In Exchange of Trace Gases between Terrestrial Ecosystems
and the Atmosphere, Ed. Andreae MO, Schimel DS, pp 7–21. John Wiley and Sons
Ltd., Chichester.
Foster HL, Dolmat MT 1986: The effect of different methods of placement and
frequency of application of fertilizer to oil palm on an inland soil in Peninsula
Malaysia. PORIM Bulletin, 12, 1–11.
Garcia-Montiel D, Melillo J, Steudler P, Neill C, Feigl B, Cerri C 2002: Relationship
between N2O and CO2 emissions from the Amazon Basin. Geophys. Res. Lett., 29,
GB3012.
Gatseva PD, Argirova MD 2008: High-nitrate levels in drinking water may be a risk
factor for thyroid dysfunction in children and pregnant women living in rural
Bulgarian areas. Int. J. Hyg. Environ. Health, 211, 555–559.
Gerendas J, Heng A 2010: Oil palm fertilization – Sharing some perspective. ISP
Selangor Seminar (8 June 2010)” Plantation industry competitive strategies in
achieving a sustainable future”, 2–7.
Germer J, Sauerbon J 2008: Estimation of the impact of oil palm plantation
establishment of greenhouse gas balance. Environ. Dev Sustain., 10: 697 – 716
Gillbank RA 2003: Standard agronomic and practices. In The oil palm – management
for large and sustainable yields. Ed. Fairhurst T, Hardter R, pp. 115–150. Potash &
Phosphate Institute of Canada, Potash & Phosphate Institute, International Potash
References
131
Institute, Singapore.
Goh KJ 2005: Fertilizer recommendation system for oil palm: estimating the fertilizer
rates. In Proceedings of MOSTA Best Practices Workshops: Agronomy and Crop
Management, Ed. Soon CP, Pau TY, pp 235–268. Petaling Jaya, Malaysia:
Malaysian Oil Scientists and Technologists Association.
Goh KJ, Chew PS 1995: Managing soils for plantation tree crops. 1. General soil
management. In Course on soil survey and managing tropical soils, Ed.
Paramanathan S, pp. 228–245. MSSS and PASS, Kuala Lumpur.
Goh KJ, Hardter R 2003: General oil palm nutrition. In Oil Palm:Management for Large
and Sustainable Yields. Ed. Fairhurst T, Hardter R. pp. 191–230, Potash and
Phospate Institute (PPI), Potash and Phosphate Institute Canada (PPIC), and Int.
Potash Inst.(IPI), Singapore.
Goh KJ, Teo CB 1997: Yield potentials and agronomic limitations of oil palm in
Tawau-Semporna region, Sabah, Malaysia. In MSSS Soil Familiarisation Tour 2/97,
pp. 16. Tawau-Semporna, Sabah, MSSS. Kuala Lumpur.
Goh KJ, Teo CB, Chew PS, Chiu SB 1999: Fertiliser management in oil palm:
Agronomic principles and field practices. In Fertiliser Management for Oil Palm
Plantations, p. 44. ISP North-east Branch, Sandakan, Malaysia.
Granier A, Ceschia E, Damesin C, Dufrene E, Epron D, Gross P, Lebaube S, Dantec
VLe, Goff NLe, Lemoine D, Lucot E, Ottorini JM, Pontailler JY, Saugier B 2000:
The carbon balance of a young beech forest. Functional Ecol., 14, 312–325.
Granli T, Bøckman OC 1994: Nitrous oxide from agriculture. Nor. J. Agric. Sci., 12,
7–128.
Green CJ, Blackmer AM, Horton R 1995: Nitrogen effects on conservation of carbon
References
132
during corn residue decomposition in soil. Soil Sci. Soc. Am. J., 59, 453–459.
Groffman PM, Gold AJ, Addy K 2000: Nitrous oxide production in riparian zones and
its importance to national emission inventories. Chemos. Global Change Sci, 2,
291–299.
Gu L, Post WM, King AW 2004: Fast labile carbon turnover obscures sensitivity of
heterotrophic respiration from soil to temperature: a model analysis. Global
Biogeochem. Cy., 18, GB1022.
Gunarso P, Hartoyo ME, Agus F, Killeen TJ 2013: Oil palm and land use change in
Indonesia, Malaysia and Papua New Guinea. Report from the technical panels of the
2nd Greenhouse Gas. Working Group of Roundtable on Sustainable Palm oil (RSPO),
www.rspo.org. p 29–64.
Hadi A, Fatah L, Syaifuddin, Abdullah, Affandi DN, Abu Bakar R, Inubushi K 2012:
Greenhouse gas emissions from peat soils cultivated to rice field, oil palm and
vegetable. J. Trop. Soils, 17, 105–114.
Hadi A, Inubushi K, Purnomo E, Razie F, Yamakawa K, Tsuruta H 2000: Effect of
land-use changes on nitrous oxide (N2O) emission from tropical peatlands. Chemos.
Global Change Sci., 2, 347–358.
Hairston AB, Grigal DF 1994: Topographic variation in soil water and nitrogen for two
forested landforms in Minnesota, USA. Geoderma, 64, 125–138.
Handayani EP, Noordwijk MV, Idris K, Sabiham S, Djiniwati S 2010: The effect of
various water table depths on CO2 Emission at Oil Palm Plantation on West Aceh
Peat. J. Trop. Soils., 15, 255–260.
Hatano R, Sawamoto T 1997: Emission of N2O from a clayey aquic soil cultivated with
onion plants. In Plant Nutrition – For Sustainable Food Production and the
References
133
Environment, Ed. Ando T, Fujita K, Mae T, Matsumoto H, Mori S, Sekija J, pp 555–
556. Kluwer Academic Publishers, Japan.
Hayashi A, Sakamoto K, Yoshida T 1997: A rapid method for determination of nitrate
in soil by hydrazine reduction procedure. Jpn. J. Soil Sci. Plant Nutr., 68, 322–326.
(In Japanese with English summary).
Henderson J, Osborne DJ 2000: The oil palm in all our lives: how this came about.
Endeavour, 24, 63–68.
Hewitta CN, MacKenziea AR, Di Carlob P, Di Marco C F, Dorseyd JR, Evanse M,
Fowlerc D, Gallagherd MW, Hopkins JR, Jones CE, Langforda B, Leef J. D, Lewis A
C, Limg SF, McQuaide J, Misztalc P, Mollerf SJ, Monksh PS, Nemitzc E, Orami DE,
Owenc SM, Phillipsc GJ, Pugha TAM, Pylej JA, Reevesi CE, Ryderc J, Siongc J,
Skibac U, Stewarti J 2009: Nitrogen management is essential to prevent tropical oil
palm plantations from causing ground level ozone pollution. Sustain. Sci., 106,
18447–18451.
Hillel D, Rosenzweig C 2011: ICP series on climate change impacts, adaptation, and
mitigation-vol.1. Handbook of climate change and agroecosystems. Impacts,
adaptation, and mitigation. London, Imperial College Press, pp. 9–14.
Hinshaw SE, Dahlgren RA 2013: Dissolved nitrous oxide concentrations and fluxes
from the eutrophic San Joaquin River, California. Environ. Sci. Technol., 47,
1313−1322.
Hirobe M, Tokuchi N, Iwatsubo G 1998: Spatial variability of soil nitrogen
transformation patterns along a forest slope in a Cryptomeria japonica D. Don
plantation. Eur. J. Soil Biol., 34, 123–131.
Hook PB, Burke IC 2000: Biogeochemistry in a shortgrass steppe landscape: Control by
References
134
topography, soil texture, and microclimate. Ecology, 81, 2686−2703.
Hou A, Akiyama H, Nakajima Y, Sudo S, Tsuruta H 2000: Effects of urea form and soil
moisture on N2O and NO emissions from Japanese Andosols. Chemos. Global
Change Sci., 2, 321–327.
Hyatt CR, Venterea RN, Rosen CJ, Nearney MM, Wilson ML, Dolan MS 2010:
Polymer-coated urea maintains potato yields and reduces nitrous oxide emissions in a
minnesota loamy sand. Soil Sci. Soc. Am. J., 74, 419–428.
IBSRAM (International Board for Soil Research and Management) 1985:
Agro-ecological zones in Report of FAO Corporate Document Repository
http://www.fao.org/docrep/007/y5797e/y5797e05.htm
IMA (Indonesian Ministry of Agriculture) 2012: Area and Production by Category of
Producers: Palm Oil, Direktorat Jenderal Perkebunan, Kementerian Pertanian.
http://ditjenbun.deptan.go.id/index.php/direktori/3-isi/4-kelapa-sawit.html
IMA (Indonesian Ministry of Agriculture) 2014: Pertumbuhan Areal Kelapa Sawit
Meningkat. Direktorat Jenderal Perkebunan, Kementerian Pertanian.
http://ditjenbun.pertanian.go.id/setditjenbun/berita-238-pertumbuhan-areal-kelapa-
sawit-meningkat.html
IPCC (Intergovernmental Panel on Climate Change) 2006: In IPCC Guidelines for
National Greenhouse Gas Inventories, Prepared by the National Greenhouse Gas
Inventories Programme, Ed. Eggleston HS, Buendia L, Miwa K, Ngara T, Tanabe K.
IGES, Japan.
IPCC (Intergovernmental Panel on Climate Change) 2007: Climate Change 2007:
Mitigation of Climate Change – Contribution of Working Group III to the Fourth
Assesment Report of the Intergovernmental Panel on Climate Change. Cambridge
References
135
University Press, Cambridge, UK and New York, NY.
IPCC (Intergovernmental Panel on Climate Change) 2014: Climate Change 2014:
Mitigation of Climate Change. Contribution of Working Group III to the Fifth
Assessment Report of the Intergovernmental Panel on Climate Change [Ed.
Edenhofer, O., R. Pichs-Madruga, Y. Sokona, E. Farahani, S. Kadner, K. Seyboth, A.
Adler, I. Baum, S. Brunner, P. Eickemeier, B. Kriemann, J. Savolainen, S. Schlömer,
C. von Stechow, T. Zwickel and J.C. Minx]. Cambridge University Press, Cambridge,
United Kingdom and New York, NY, USA.
IPI (International Potash Institute) 1991: Fertilizer for high yield and quality; the oil
palm. International Potash Institute, Bern, Switzerland.
Inubushi 2015: Soil and wetland (including paddy). In Task force: soil matters solution
under foot. Ed. Nortcliff S, pp. 20–21. GeoEcology Essays, Catena Verlag, Germany.
Inubushi K, Furukawa Y, Hadi A, Purnomo E, Tsuruta H 2003: Seasonal changes of
CO2, CH4 and N2O fluxes in relation to land-use change in tropical peatlands located
in coastal area of South Kalimantan. Chemosphere, 52, 603–608.
Inubushi K, Naganuma H, Kitahara S 1996: Contribution of denitrification and
autotrophic and heterotrophic nitrification to nitrous oxide production in andosol
soils. Biol. Fertil. Soil., 23, 292–298.
Ismunadji M, Soepardi G 1984: Peat soil: problems and crop production. In Organic
Matter and Rice, Ed. IRRI, pp. 489–502. Los Banos, Philippines.
Izaurralde RC, Lemke RL, Goddard TW, McConkey B, Zhang Z 2004: Nitrous oxide
emissions from agricultural toposequences in Alberta and Saskatchewan. Soil Sci.
Soc. Am. J., 68, 1285–1295.
Janssens IA, Lankreijer H, Metteucci G, Kowalski AS, Buchmann N, Epron D,
References
136
Pilegaard K, Kutsch W, Longdoz B, Grunwald T, Montagnani L, Dore S,
Rebmann C, Moors EJ, Grelle A, Rannik U, Morgenstern K, Oltchev S, Clement R,
Gudmundsson J, Minerbi S, Berbigier P, Ibrom A, Moncrieff J, Aubinet M,
Bernhofer C, Jensen NO, Vesala T, Granier A, Schulze ED, Lindroth A, Dolman
AJ, Jarvis PG, Ceulemans R, Valentini R 2001: Productivity overshadows
temperature in determining soil and ecosystem respiration across European forests.
Global Change Biol., 7, 269–278.
Jantalia CP, Dos Santos HP, Urquiaga S, Boddey RM, Alves BJR 2008: Fluxes of
nitrous oxide from soil under different crop rotations and tillage systems in the South
of Brazil. Nutr. Cycl. Agroecosyst., 82, 161–173.
Jumadi O, Hala Y, Anas I, Ali A, Sakamoto K, Saigusa H, Yagi K, Inubushi K 2008a:
Community structure of ammonia oxidizing bacteria and their potential to produce
nitrous oxide and carbon dioxide in acid tea soils. Geomicrobiol. J., 25, 381−389.
Jumadi O, Hala Y, Muis A, Ali A, Palennari M, Yagi K, Inubushi K 2008b: Influences
of chemical fertilizers and a nitrification inhibitor on greenhouse gas fluxes in a
corn (Zea mays L.) field in Indonesia. Microbes Environ., 23, 29–34.
Karim AA, Ramasamy C 2000: Expanding frontiers of agriculture: contemporary issues.
Kalyani Publishers, Ludhiana, India.
Kee KK, Chew PS 1997: Nutrient recycled from pruned fronds in mature oil palm
(Elaeis guineensis Jacq.). In Plant nutrition for sustainable food production and
environment, pp. 601–602. Springer, Netherlands.
Khasanah N, Van Noordwijik M, Ekadinata A, Dewi S, Rahayu S, Ningsih H, Setiawan
A, Dwiyanti E, Octaviani R 2012: The carbon footprint of Indonesia palm oil
production. Technical Brief No 25 – Palm oil series. World Agroforestry Center
References
137
(ICRAF), Bogor.
Kheong LV, Rahman ZA, Musa MH, Hussein A 2010: Empty fruit bunch application
and oil palm root proliferation. J. Oil Palm Res., 22, 750−757.
Knowles R 1982: Denitrification. Microbiol. Rev., 46, 43−70.
Kosugi Y, Mitani T, Itoh M, Noguschi S, Tani M, Matsuo N, Takanashi S, Ohkubo S,
Nik AR 2007: Spatial and temporal variation in soil respiration in a Southeast Asian
tropical rainforest. Agric. For. Meteorol., 147, 5–47.
Kroetsch D, Wang C 2008: Particle size distribution. In Soil Sampling and Methods of
Analysis, Ed. Cartes MR, Gregorich EG, pp. 713–725. CRC Press, Boca Raton.
Kuikman PJ, Van der Hoek KW, Smith A, Zwart K 2006: Update of emission factors
for nitrous oxide from agriculture soils on the basis of measurements in the
Netherlands. Alterra Report 1217. ISSN 1566–7197.
Kumazawa K 2002: Nitrogen fertilization and nitrate pollution in groundwater in Japan:
Present status and measures for sustainable agriculture. Nutr. Cycl. Agroecosys., 63,
129–137.
Kwan BKW 1998: A 3x3x3 NPK factorial fertilizers trial on Paliu series of soil in
mature oil palm of Sabah. In Proc. Soil Sci. Conf. Msia 1988. Ed. Shamshuddin J
and Fauziah I, pp. 232–351. Kuala Lumpur, Malaysian Society of Soil Science.
Kwan BKW 2002: Investigation on sources, methods and rates of nitrogen application
in mature oil palms. Malaysia. J. Soil Science, 6, 13–20.
Lal R 2004: Soil carbon sequestration impacts on global climate change and food
security. Science, 304, 1623–1627.
Lamb JA, Fernandez FG, Kaiser DE 2014: Understanding nitrogen in soils. Nutrient
Management, University of Minnesota, AG-FO-3770-B.
References
138
http://www.extension.umn.edu/agriculture/nutrient-management/nitrogen/understand
ing-nitrogen-in-soils/docs/AG-FO-3770-B.pdf
Laville P, Lehuger S, Chaumartin F, Cellier P 2011: Effect of management, climate and
soil conditions on N2O and NO emissions from an arable crop rotation using high
temporal resolution measurements. Agric. For. Meteorol., 151, 228–240.
Lim KH, Lim SS, Parish F, Suharto R 2012: RSPO manual on Best Management
Practices (BMPs) for existing oil palm cultivation on peat. RSPO, Kuala Lumpur. pp.
22–23.
Linn DM, Doran JW 1984: Aerobic and anaerobic microbial populations in no-till and
plowed soils. Soil Sci. Soc. Am. J., 48, 794–799.
Liu CW, Sung Y, Chen CB, Lai HY 2014: Effect of nitrogen fertilizer on the growth
and nitrate content of lettuce (Lactuce sativa L). Int. J Environ. Res. Public Health,
11, 4427–4440.
Liu W, Xu W, Han Y, Wang C, Wan S 2007: Responses of microbial biomass and
respiration of soil to topography, burning, and nitrogen fertilization in a temperate
steppe. Biol. Fert. Soils, 44, 259–268.
Lloyd J, Taylor JA 1994: On the temperature dependence of soil respiration. Funct.
Ecol., 8, 315–323.
Lower SK 1996: Carbonate equilibria in natural waters in Chemical 1 Environmental
Chemistry, digital textbook chapter. Simon Fraser University, pp 1–26.
http://www.chem1.com/acad/webtext/pdf/c3carb.pdf
Luizao RCC, Luizao FJ, Paiva RQ, Monteiro TF, Sousa LS, Kruijt B 2004: Variation of
carbon and nitrogen cycling processes along a topographic gradient in a central
Amazonian forest. Glob. Change Biol., 10, 592–600.
References
139
McTaggart IP, Akiyama H, Tsuruta H, Ball BC 2002: Influence of soil physical
properties, fertilizer type and moisture tension on N2O and NO emissions from
nearly saturated Japanese upland soils. Nutr. Cycl. Agroecosys., 63, 207–217.
MPOB (Malaysian Palm Oil Board) 2012: Overview of the Malaysian oil palm industry
2012. Economics and industry development division.
http://bepi.mpob.gov.my/images/area/2012/Area_summary.pdf
MPOB (Malaysian Palm Oil Board) 2014: Malaysia, distribution of oil palm planted
area by state and sector 2014.
http://www.data.gov.my/data/en_US/dataset/malaysia-distribution-of-oil-palm-
planted-area-by-state-and-sector-in-2014/
MacKenzie AF, Fan MX, Cadrin F 1998: Nitrous oxide emission in three years as
affected by tillage, corn-soybeanalfalfa rotations and nitrogen fertilization. J.
Environ. Qual., 27, 698–703.
Macpherson GL 2009: CO2 distribution in groundwater and the impact of groundwater
extraction on the global C cycle. Chem. Geol., 264, 328–336.
Mahli SS, Izaurralde RC, Nyborg M, Solberg ED 1993: Influence of topsoil removal on
soil fertility and barley growth. J. Soil Water Conserv., 49, 96–101.
McTaggart IP, Akiyama H, Tsuruta H, Ball BC 2002: Influence of soil physical
properties, fertilizer type and moisture tension on N2O and NO emissions from
nearly saturated Japanese upland soils. Nutr. Cycl. Agroecosys., 63, 207–217.
Melling L, Hatano R, Goh KJ 2005: Soil CO2 flux from three ecosystems in tropical
peatland of Sarawak, Malaysia. Tellus, 57B, 1–11.
Melling L, Hatano R, Goh KJ 2007: Nitrous oxide emission from three ecosystems in
tropical peatland of Sarawak, Malaysia. Soil Sci. Plant Nutr., 53, 792–805.
References
140
Michaud JP 1991: A Citizen's Guide to Understanding and Monitoring Lake and
Streams, Washington State Department of Ecology, Publications Office, Olympia,
WA, USA, 360, 407–472.
Minami K 1997: Atmospheric methane and nitrous oxide: sources, sinks and strategies
for reducing agricultural emissions. Nutr. Cycl. Agroecosys., 49, 203–211.
Minami K, Fukushi S 1984: Methods for measuring the N2O flux from water surface
and N2O dissolved in water from agricultural land. Soil Sci. Plant Nutr., 30,
495–502.
MoE (Ministry of Environment) Indonesia 2010: Indonesia second national
communication under the United Nations framework convention of climate change.
Ministry of Environment, Republic of Indonesia.
MoNRE (Ministry of Natural Resources and Environment) Malaysia 2010. Malaysia
second national communication to the United Nations Framework Convention on
Climate Change. Ministry of Natural Resources and Environment, Malaysia.
Mosier A, Kroeze C, Nevison C, Oenema O, Seitzinger S, Van Cleemput O 1998:
Closing the global N2O budget: Nitrous oxide emissions through the agricultural
nitrogen cycle. OECD/IPCC/IEA Phase II: development of IPCC guidelines for
national greenhouse gas inventory methodology: Nutr. Cycl. Agroecosys., 52,
225–248.
Mosier AR, Delgado JA 1997: Methane and nitrous oxide fluxes in grasslands in
western Puerto Rico. Chemosphere, 35, 2059–2082.
Murdiyarso D, Van Noordwijk M, Wasrin U, Tomich T, Gillison A 2002:
Environmental benefits and sustainable land use options in the Jambi transect,
Sumatra, Indonesia. J. Veg. Sci., 13, 429–438.
References
141
Nagano H, Kato S, Ohkubo S, Inubushi K 2012: Emissions of carbon dioxide, methane,
and nitrous oxide from shortand long-term organic farming Andosols in central Japan.
Soil Sci. Plant Nutr., 58, 793–801.
Nelson DW, Huber D 2001. Nitrification Inhibitors for corn production. National Corn
Handbook, Crop Fertilization, NCH-55.
NewCROP 1996: Elaeis guineensis Jacq. Center for New Crops and Plant Products,
Purdue University, West Lafayette, IN.
http://www.hort.purdue.edu/newcrop/duke_energy/Elaeis_guineensis.html.
Ng SK 2002: Nutrition and nutrient management of oil palm – New thrust for the future
perspective. In Potassium for sustainable crop production in India New Delhi. Ed.
Pasricha NS, Bansal SK, 415–429. International Potash Institute, Basel, Switzerland
and Potash Research Institute of India, Guregaon, Haryana, India..
Nolan SC, Goddard TW, Heaney DJ, Penney DC, McKenzie RC 1995: Effect of
fertilizer on yield at different soil landscape positions. In Proceedings of 2nd
International Precision Agriculture Conference, Ed. Robert PC, Rust RH, Larson WE,
ASA-CSSA-SSSA. Madison, Wisconsin.
Nägele W, Conrad R 1990: Influence of soil-pH on the nitrate-reducing microbial
populations and their potential to reduce nitrate to NO and N2O. FEMS Microbiol.
Lett., 74, 49–57.
Ogle SM, Adler PR, Breidt FJ, Del Grosso S, Derner J, Franzluebbers A, Liebig M,
Linquist B, Robertson GP, Schoeneberger M, Six J, van Kessel C, Venterea R, West
T 2014: Chapter 3, Quantifying greenhouse gas sources and sink in cropland and
grazing land systems. In Quantifying greenhouse gas fluxes in agriculture and
forestry: Methods for entity-scale inventory, Ed. Eve M, Pape D, Flugge M, Steele R,
References
142
Man D, Riley-Gilber M, Biggar S, Technical Bulletin Number 1939. Office of the
chief economist, U.S. Department of Agriculture, Washington, DC. 606 pages. July
2014.
Paramananthan S 2013: Managing marginal soils for sustainable growth of oil palms in
the tropics. Journal of Oil Palm & the Environment, 4, 1–16.
Parkin TB, Kaspar TC 2006: Nitrous oxide emission from cornesoybean systems in the
Midwest. J. Environ. Qual., 35, 1496–1506.
Parton WJ, Mosier AR, Schimel DS 1988: Rates and pathways of nitrous oxide
production in a shortgrass steppe. Biogeochemistry. 6, 45–58.
Peng Y, Thomas SC 2006: Soil CO2 efflux in uneven-aged managed forests: temporal
patterns following harvest and effects of edaphic Heterogeneity. Plant Soil, 289,
253–264.
Pennock DJ, Van Kessel C, Farrell RE, Sutherland RA 1992: Landscape-scale
variations in denitrification. Soil Sci. Soc. Am. J., 56, 770–776.
Peterjohn WT, Schlesinger WH 1991: Factors controlling denitrification in a
Chihuahuan Desert ecosystem. Soil Sci. Soc. Am. J., 55, 1694–1701.
Philippot L, Cuhel J, Saby NPA, Cheneby D, Chronakova A, Bru D, Arrouays D,
Martin-Laurent F, Simek M 2009: Mapping field-scale spatial patterns of size and
activity of the denitrifier community. Environ. Microbiol., 11, 1518–1526.
Pilegaard K 2013: Processes regulating nitric oxide emissions from soils. Phil Trans R
Soc B., 368, 20130126.
Poku K 2002: Small-scale palm oil processing in Africa. FAO Agricultural Services
Bulletin 148. FAO, Rome. http://www.fao.org/docrep/005/y4355e/y4355e00.HTM
Prasad R 2009: Efficient fertilizer use: the key to food security and better environment.
References
143
J. Trop. Agr., 47, 1−7.
Priyashantha KRS, Maulé CP, Elliott JA 2007: Influence of slope position and hog
manure injection on fall soil P and N distribution in an undulating landscape. ASABE,
50, 45−52.
Product Board MVO 2010: Fact sheet palm oil 2010. Rijswijk. Product Board for
Margarine, Fats and Oils (MVO)
Puslittanak (Pusat Penelitian Tanah dan Agroklimat) 2000: Atlas sumberdaya tanah
eksplorasi Indonesia skala 1:1.000.000. Pusat Penelitian Tanah dan Agroklimat,
Bogor.
Qian P, Schoenau JJ 1995: Assessing nitrogen mineralization from soil organic matter
using anion exchange membranes. Fert. Res., 40, 143–148.
Raich JW, Schlesinger WH 1992: The global carbon dioxide flux in soil respiration and
its relationship to vegetation and climate. Tellus, 44B, 81–99.
Rasid MNA, Check TC, Redzuan AF 2014: Effectiveness of urea-coated fertilizer on
young immature oil palm growth. J. Advanc. Agri. Tech., 1, 56–59.
Reay DS, Edwards AC, Smith KA 2009: Importance of indirect nitrous oxide emissions
at the field, farm and catchment scales. Agric. Ecosysts. Environ., 133, 163–169.
Reay DS, Smith KA, Edwards AC 2003: Nitrous oxide emission from agricultural
drainage waters. Glob. Change Biol., 9, 195–203.
Reay DS, Smith KA, Edwards AC, Hiscock KM, Dong LF, Nedwell DB 2005: Indirect
nitrous oxide emissions: revised emission factors. Environ. Sci., 2, 153–158.
Redshaw M 2003: Utilization of field residues and mill by-products. In Oil palm:
management for large and sustainable yields. PPI/PPIC-IPI (Singapore) pp. 307–
320.
References
144
Rogner HH, Zhou D, Bradley R, Crabbe P, Edenhofer O, Hare B, Kuijpers L,
Yamaguchi M 2007: Introduction. In Climate Change 2007: Mitigation. Contribution
of Working Group III to the Fourth Assessment Report of the Intergovernmental
Panel on Climate Change, Eds. Metz B, Davidson OR, Bosch PR, Dave R, Meyer
LA, Cambridge University Press, Cambridge, UK.
Sakamoto A 2012: Quality analysis methods of polyolefin coated fertilizer and slow
release fertilizer in JCAM AGRI. IFA Tokyo Method Harmonization Meeting.
Sakata R, Shimada S, Arai H, Yoshioka N, Yoshioka R, Aoki H, Kimoto N, Sakamoto
A, Melling L, Inubushi K 2015: Effect of soil types and nitrogen fertilizer on
nitrous oxide and carbon dioxide emissions in oil palm plantations. Soil Sci. Plant
Nutr., 61, 48–60.
Sakata R, Shimada S, Yoshioka N, Yoshioka R, Aoki H, Kimoto N, Sakamoto A,
Inubushi K 2016: Effect of topography on N2O and CO2 emissions and dissolved
N2O in oil palm plantation in Riau, Indonesia. Trop. Agr. Develop., 60, 226–235.
Sanhueza E, Hao WM., Scharffe MD, Donoso L, Crutzen PJ 1990: N2O and NO
emissions from soils of the Northern part of The Guayana shield, Venezuela. J.
Geophysical. Res., 95, 22481–22488.
Sarwani M, Anda M, Shofiyati R 2012: Policy and development of agricultural land
resource mapping in Indonesia, Experiences, Achievements and impacts. Indonesian
Center for Agricultural Land and Resources Research and Development Agency for
Agricultural Research and Development. Ministry of Agriculture, Government of
Indonesia.
Sawamoto T, Kusa K, Hu R, Hatano R 2002: Dissolved N2O, CH4, and CO2 in pipe
drainage, seepage, and stream water in a livestock farm in Hokkaido, Japan. Soil
References
145
Sci. Plant Nutr., 48, 433–439.
Sawamoto T, Kusa K, Hu R, Hatano R 2003: Dissolved N2O, CH4, and CO2 emissions
from subsurface-drainage in a structured clay soil cultivated with onion in Central
Hokkaido, Japan. Soil Sci. Plant Nutr., 49, 31–38.
Sawamoto T, Nakajima Y, Kasuya M, Tsuruta H, Yagi K 2005: Evaluation of emission
factors for indirect N2O emission due to nitrogen leaching in agro-ecosystems.
Geophys. Res. Let., 32, L03403.
Schmidt JH 2010: Comparative life cycle assessment of rapeseed oil and palm oil. Int. J
Life Cycle Assess., 15, 183–197.
Schindlbacher A, Boltenstern SZ, Bahl KB 2004: Effects of soil moisture and
temperature on NO, NO2, and N2O emissions from European forest soils. J. Geophys.
Res., 109, D17302.
Seitzinger SP, Kroeze C, Styles RV 2000: Global distribution of N2O emission from
aquatic systems: Natural emission and anthropogenic effects. Chemos. Global
Change Sci., 2, 267−279.
Seymour F 2014: Reducing emissions from oil palm cultivation in Indonesia. A strategy
for the David and Lucile Packard foundation and the climate land and land use
alliance. http://www.climateandlandusealliance.org/initiatives-en/
Shabalala AN, Combrinck L, McCrindle R 2013: Effect of farming activities on
seasonal variation of water quality of Bonsma Dam, KwaZulu-Natal. S. Afr. J. Sci.,
109, 1–7.
Shamshuddin J, Anda M 2012: Enhancing the productivity of ultisols and oxisols in
Malaysia using basalt and/or compost. Pedologist, 55, 382–391.
Shamsuddin J, Daud WNW, Ismail R, Ishak CF, Panhwar QA 2015: Ulitisols and
References
146
Oxisols enhancing their productivity for oil palm, rubber and cocoa cultivation.
Serdang, Universiti Putra Malaysia Press, pp. 8–17.
Shaviv A 2001: Advances in controlled-release fertilizers. Adv. Agron., 71, 1–49.
Shoji S, Gandeza AT 1992: Controlled release fertilizer with polyolefin resin coating,
development, properties and utilization. Konno Printing Co., Sendai, Japan.
pp. 63–75.
Shoji S, Kanno H 1994: Use of polyolefin-coated fertilizers for increasing fertilizer
efficiency and reducing nitrate leaching and nitrous oxide emissions. Fertil. Res., 39,
147–152.
Singh M, Bhagwat SA 2013: Tropical agricultural production, conservation and carbon
sequesteration conflicts: oil palm expansion in South East Asia. In Biofuels -
Economy, Environment and Sustainability. Ed. Fang, Zhen, pp. 39–71. Rijeka,
Croatia: Intech.
Smith KA, McTaggart IP, Tsuruta H 1997: Emissions of N2O and NO associated with
nitrogen fertilization for intensive agriculture, and the potential for mitigation. Soil
Use Man., 13, 296−304.
Smith KA, Thomson PE, Clayton H, McTaggart IP, Conen F 1998: Effects of
temperature, water content and nitrogen fertilization on emissions of nitrous oxide by
soils. Atmos. Environ., 32, 3301−3309.
Soon YK, Malhi SS 2005: Soil nitrogen dynamics as affected by landscape position and
nitrogen fertilizer. Can. J. Soil. Sci., 85, 579−587.
Sorensen KW 1993: Indonesian peat swamp forests and their role as a carbon sink.
Chemosphere, 27, 1065– 1082.
Steinwald AL, Karlen DL, Fenton TE 1996: An evaluation of soil survey crop yield
References
147
interpretations for two central Iowa farms. J. Soil Water Conserv., 51, 66–71.
Stenek V, Connell R 2011: Climate risk and business agribusiness. Ghana oil palm
development company full report. International Finance Corporation, World Bank
Group.
Stewart JK, Grogan P, Coxson DS, Siciliano SD 2014: Topography as a key factor
driving tmospheric nitrogen exchanges in arctic terrestrial ecosystems. Soil Biol.
Biochem., 70, 96–112.
Syväsalo E, Regina K, Pihlatie M, Esala M 2004: Emissions of nitrous oxide from
boreal agricultural clay and loamy sand soils. Nutr. Cycl. Agroecosyst., 69, 155–165.
Tan KH 1996: Determination of soil water. In Soil sampling preparation and analisis.
Marcel Dekker Inc., New York, USA, pp. 56–58.
Tan KT, Lee KT, Mohamed AR, Bhatia S 2009: Palm oil: addressing issues and toward
sustainable development. Renew. Sust. Energ. Rev., 13, 420–427.
Tan NP, Wong MK, Yusuyin Y, Abdu AF, Iwasaki K, Tanaka S 2014: Soil characteristics
in an oil palm field, Central Pahang, Malaysia with special reference to micro sites
under different managements and slope positions. Trop. Agr. Develop., 54, 146–154.
Tilman D, Fargione J, Wolff B, D'Antonio C, Dobson A, Howarth R, Schindler D,
Schlesinger WH, Simberloff D, Swackhamer D 2001: Forecasting agriculturally
driven global environment change. Science. 292, 281–284.
Tinker PB, Nye PH 2000: Solute movement in the rhizosphere. Oxford University
Press.
Trenkel ME 1997: Controlled-released and stabilized fertilizers on agriculture.
International Fertilizer Industry Association, Paris.
Treseder KK 2008: Nitrogen additions and microbial biomass: A meta-analysis of
References
148
ecosystem studies. Ecol. Lett., 11, 1111–1120.
Uchida Y, von Rein I, Akiyama H, Yagi K 2013: Contribution of nitrification and
denitrification to nitrous oxide emissions in Andosol and from Fluvisol after coated
urea application. Soil Sci. Plant Nutr., 59, 46–55.
Union of Concerned Scientist 2013: Palm oil and global warming. Retrieved May 20,
2016.
http://www.ucsusa.org/sites/default/files/legacy/assets/documents/global_warming/pal
m-oil-and-global-warming.pdf
Van Groenigen JW, Kasper GJ, Velthof GL, Van den Pol-van Dasselaar A, Kuikman PJ
2004: Nitrous oxide emissions from silage maize fields under different mineral
nitrogen fertilizer and slurry applications. Plant Soil, 263, 101–111.
Velthof GL, Brader AB, Oenema O 1996: Seasonal variations in nitrous oxide losses
from managed grasslands in The Netherlands. Plant Soil, 181, 263–274.
Velthof GL, Oenema O 1995: Nitrous oxide fluxes from grassland in the Netherlands: II.
Effects of soil type, nitrogen fertilizer application and grazing. Eur. J. Soil Sci., 46,
541-549.
Verheye W 2010: Growth and Production of Oil Palm. In Land Use, Land Cover and
Soil Sciences. Ed. Verheye W. Encyclopedia of Life Support Systems (EOLSS),
UNESCO-EOLSS Publishers, Oxford, UK. http://www.eolss.net
Vilain G, Garnier J, Tallec G, Cellier P 2010: Effect of slope position and landuse on
nitrous oxide (N2O) emissions (Seine Basin, France). Agr. Forest Meteorol., 150,
1192–1202.
Von Uexkull HR, Fairhurst TH 1991: Fertilizing for high yield and quality. The Oil
Palm. IPI Bulletin No. 12. International Potash Institute, Bern, Switzerland.
WHO (World Health Organization) 2003: Ammonia in drinking-water. Background
References
149
document for preparation of WHO guideline for drinking-water quality. Geneva,
(WHO/SDE/WSH/03.04/1).
WHO (World Health Organization) 2008: Guideline for drinking-water quality. Second
addendum to third edition. Geneva, Switzerland. ISBN 978 92 4 154760 4.
WHO (World Health Organization) 2011: Guideline for drinking water quality-4th ed.
Geneva, Switzerland. ISBN 978 92 4 154815 1.
Watts SH, Seitzinger SP 2000: Denitrification rates in organic and mineral soils from
riparian sites: A comparison of N2 flux and acetylene inhibition methods. Soil Biol.
Biochem., 32, 1383–1392.
Webb J, Ellis S, Harrison R, Thorman R 2004: Measurement of N fluxes and soil N in
two arable soils in the UK. Plant Soil, 260, 253–282.
Well R, Flessa H, Jaradat F, Toyoda S, Yoshida N 2005: Measurement of isotopomer
signatures of N2O in groundwater. J. Geophys. Res. Bio., 110, G02006.
Werner C, Butterbach BK, Haas E, Hickler T, Kiese R 2007a: A global inventory of
N2O emissions from tropical rainforest soils using a detailed biogeochemical model.
Global Biogeochem. Cy., 21, 1–18.
Werner C, Kiese R, Butterbach-Ball K 2007b: Soil-atmosphere exchange of N2O, CH4,
and CO2 and controlling environmental factors for tropical rain forest sites in western
Kenya. J. Geophys. Res., 112, DO3308.
Weymann D, Well R, Flessa H, Heide C von der, Deurer M, Meyer K, Konrad C,
Walther W 2008: Groundwater N2O emission factors of nitrate-contaminated
aquifers as derived from denitrification progress and N2O accumulation.
Biogeosciences, 5, 1215–1226.
Weymann D, Well R, Heide C von der, Böttcher J, Flessa H, Duijnisveld WHM 2009:
References
150
Recovery of groundwater N2O at the soil surface and its contribution to total N2O
emission. Nutr. Cycl. Agroecosyst., 85, 299–312.
Wicke B, Dornburg V, Junginger J, Faaij A. 2008a: Different palm oil production
systems for energy purposes and their greenhouse gas implications. Biomass
Bioenerg., 32, 1322–1337.
Wicke B, Sikkema R, Domburg V, Junginger M, Faaij A 2008b: Drivers of land use
change and the role of palm oil production in Indonesia and Malaysia. Final Report
of Overview of past developments and future projections. Science, Technology and
Society, Copernicus Institute for Sustainable Development and Innovation. Utrecht
University, the Nethererland. NWS-E-2008-58.
Williams DL, Ineson P, Coward PA 1999: Temporal variations in nitrous oxide fluxes
from urine-affected grassland. Soil Biol. Biochem., 31, 779–788.
Wollheim WM, Vorosmarty CJ, Bouwman AF, Green P, Harrison J, Linder E, Peterson
BJ, Seitzinger SP 2008: Global N removal by freshwater aquatic systems using a
spatially distributed, within-basin approach. Global Biogeochem. Cy., 22, GB2026.
World Growth 2011: The economic benefit of palm oil to Indonesia (World Growth
Report). Arlington VA, USA.
Wurts WA, Durborow RM 1992: Interactions of pH, carbon dioxide, alkalinity and
hardness in fish ponds. SRAC publication No. 464, Southern Regional Aquaculture
Center, Kentucky State University.
Xing G, Cao Y, Shi S, Sun G, Du L, Zhu J 2002: Denitrification in underground
saturated soil in a rice paddy region. Soil Biol Biochem., 34, 1593–1598.
Xu W, Wan S 2008: Water and plant mediated responses of soil respiration to
topography, fire, and nitrogen fertilization in a semiarid grassland in northern China.
References
151
Soil Biol. Biochem., 40, 679–687.
Xu X, An HT, Hui D 2008: Convergence in the relationship of CO2 and N2O exchanges
between soil and atmosphere within terrestrial ecosystem. Globe Change Biol., 14,
1651–1660.
Yerima BPK, Van Ranst E 2005: Introduction to soil science, soil of the tropics.
TRAFFORD Publishers,Victoria. pp. 130– 48.
Yew, Ai Tan, Muhamad H, Hashim Z, Subramaniam V, Wei PC, May CY 2012:
GHG Emission inventories and mitigation strategies in the palm oil sector. 3rd
ICOPE, Bali.22-24 February 2012.
Yusuyin Y, Tan NP, Wong MK, Abdu AB, Iwazaki Kozo, Tanaka S 2015: Nutrient
status of frond heaps and the underlying soils at an 18-years-old oil palm field in
Central Pahang, Malaysia. Trop. Agr. Develop., 59, 212–220.
Zakaria ZZ, Tarmizi AM 2007: Efficient use of urea as nitrogen fertilizer for mature oil
palm in Malaysia. MPOB Information Series. ISSN, 1511–7871.
Zhang J, Han X 2008: N2O emission from the semi-arid ecosystem under mineral
fertilizer (urea and superphosphate) and increased precipitation in northern China.
Atmos. Environ., 42, 291–N302.
Zhu J, Mulder J, LP Wu, Meng XX, Wang YH, Dörsch P 2013: Spatial and temporal
variability of N2O emissions in a subtropical forest catchment in China,
Biogeosciences, 10, 1309–1321.