Embed Size (px)
Citation preview
oangeles_Sept2010
N-fertilizer and straw management effects on grain yield and yield components of rice
grown with AWD irrigation
Olivyn Angeles, To Phuc Tuong, Yasukazu Hosen, Sarah Johnson, Romeo Cabangon, Lizzida Llorca, Reynaldo Rodriguez, and Ruth Agbisit
International Rice Research Institute (IRRI)
*Alternate wetting and drying

oangeles_Sept2010
Why AWD?
oangeles_Sept2010
• World population is projected to grow from6.1 billion in 2000 to 8.9 billion in 2050, increasing by 47 per cent
• Half of humankind relies on rice for 60-80% of their dietary needs
• The worldwide productive land is estimated to decrease by one hectare every 7.67 secondsNeed to increase and sustain rice productivity
• Growing global water scarcity
Current situation and need

oangeles_Sept2010
Grain yield can potentially keep up with the demandPotentially significant water savings
Source: Bouman BAM, Lampayan RM, Tuong TP. 2007

oangeles_Sept2010
Transplanting
The rice plant physiological timeline & AWD irrigation management
Target: No significant yield penalty
Soil depth: 15 cm
Soil moisture potential: < -10 kPa
Tools: Tensiometers or Perched tube
panicle
tiller
How is AWD done?

oangeles_Sept2010
The experiment
Location: Blocks J9-10, IRRI, Los Banos, Philippines (14.26N,121.16E)
Soil: Clayey loamDesign: Split-split PlotPlot size: 10 x 5 m2
Main-plot: 3 levels of water management1. W0 or continuous flooding (CF)2. W1 or AWD–203. W2 or AWD–70
Sub-plot factor: 6 levels with 3 nitrogen levels and 2 residue levels 1. N0S0 4. N0S12. N1S0 5. N1S13. N2S0 6. N2S1
Sub-plot factor: 2 levels timing of tillage1. Early tillage (45-48 DBT) 2. Late tillage (25-28 DBT)
Where: N0 = Zero N controlN1 = Recommended N rate with fixed splitsN2 = Leaf color chart (LCC)-based N fertilizer S0 = Zero straw controlS1 = Straw incorporated at 4 t dry straw ha-1
oangeles_Sept2010
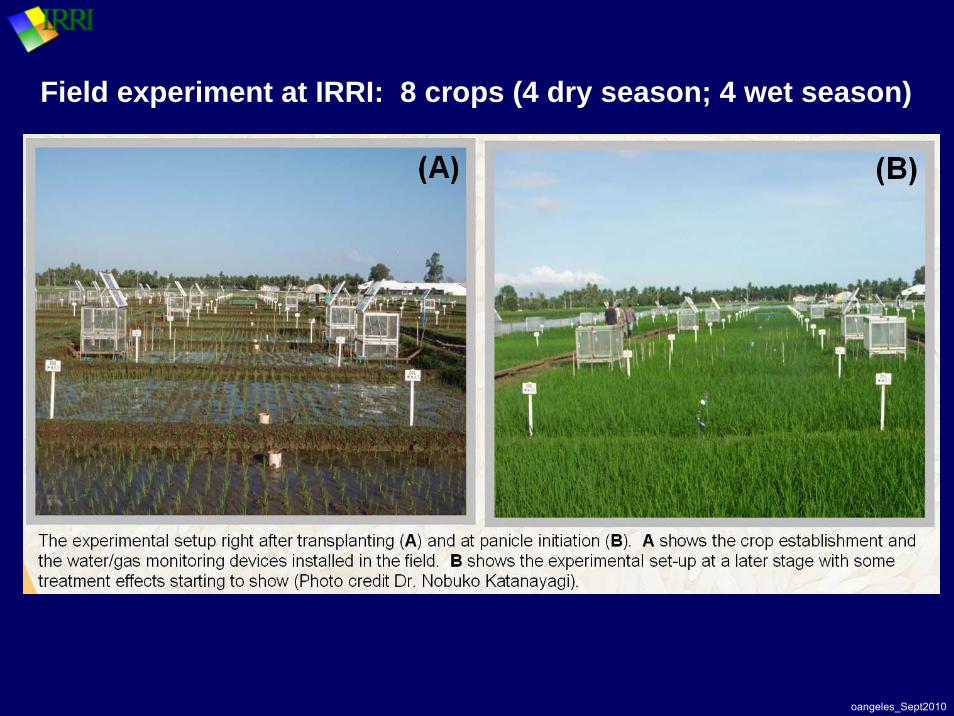
Field experiment at IRRI: 8 crops (4 dry season; 4 wet season)
oangeles_Sept2010
W0=CF W1=AWD-20W2=AWD-70
2006 2007 2008 2009W0 W1 W2 W0 W1 W2 W0 W1 W2 W0 W1 W2
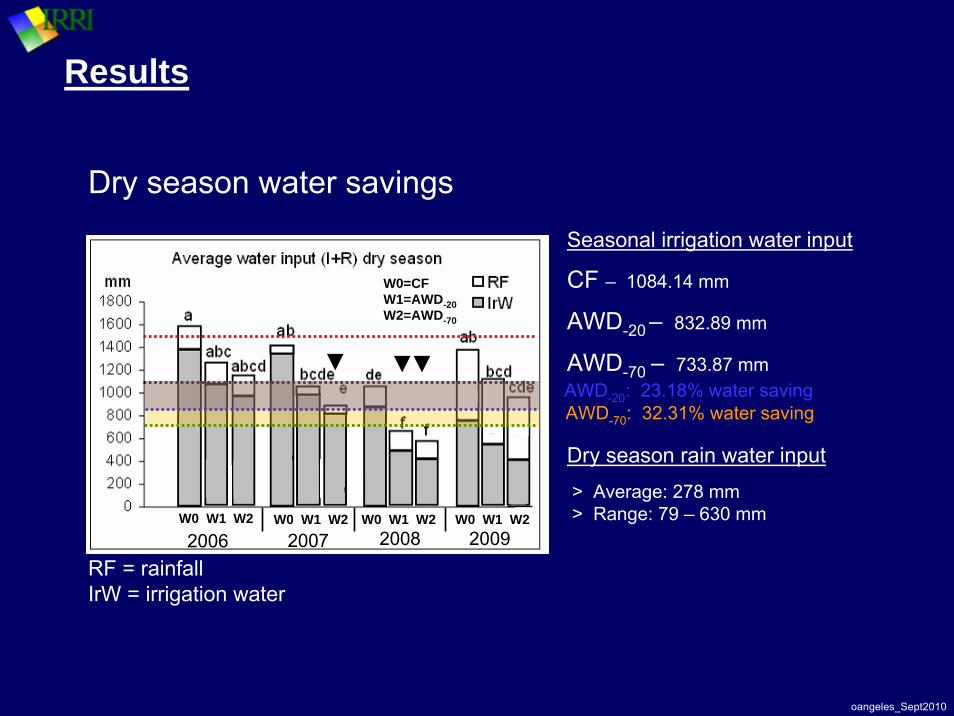
Seasonal irrigation water input
CF – 1084.14 mm
AWD-20 – 832.89 mm
AWD-70 – 733.87 mmAWD-20: 23.18% water saving
Dry season rain water input
> Average: 278 mm> Range: 79 – 630 mm
Dry season water savings
AWD-70: 32.31% water saving
▼ ▼▼
Results
RF = rainfallIrW = irrigation water
oangeles_Sept2010
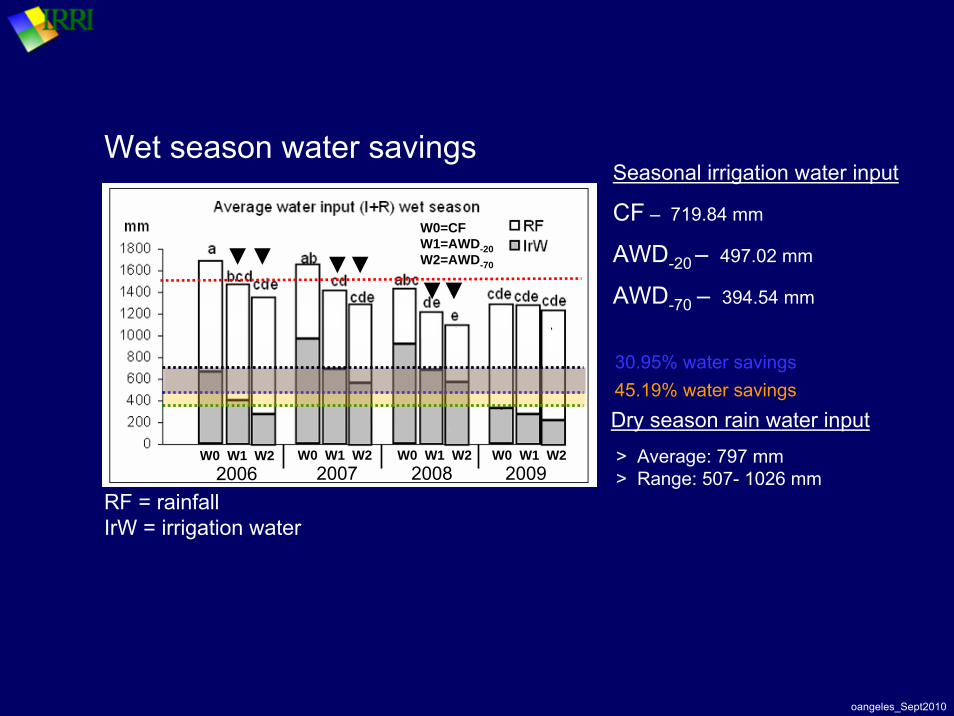
2006 2007 2008 2009W0 W1 W2 W0 W1 W2 W0 W1 W2 W0 W1 W2
W0=CF W1=AWD-20W2=AWD-70
Wet season water savingsSeasonal irrigation water input
CF – 719.84 mm
AWD-20 – 497.02 mm
AWD-70 – 394.54 mm
Dry season rain water input
> Average: 797 mm> Range: 507- 1026 mm
30.95% water savings45.19% water savings
▼▼ ▼▼▼▼
RF = rainfallIrW = irrigation water
oangeles_Sept2010
Experimental factors
1. Water management
2. N-fertilizer management
3. Straw management
4. Tillage timing
oangeles_Sept2010
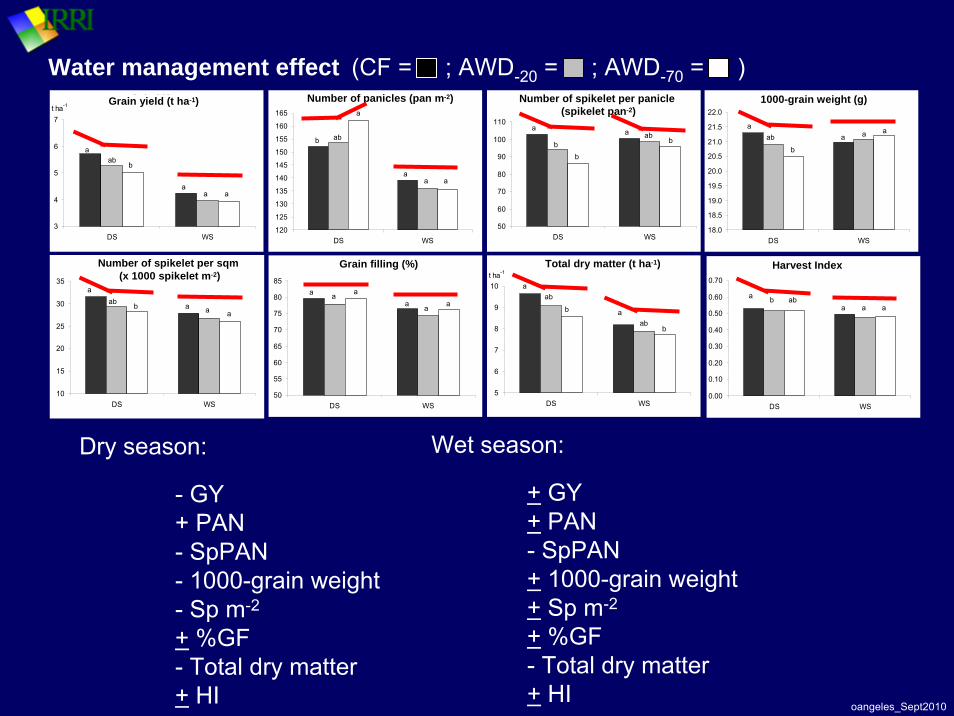
Dry season:
- GY+ PAN- SpPAN- 1000-grain weight- Sp m-2
+ %GF- Total dry matter+ HI
Wet season:
+ GY+ PAN- SpPAN+ 1000-grain weight+ Sp m-2
+ %GF- Total dry matter+ HI
Water management effectGrain yield
3
4
5
6
7
DS WS
t ha-1
a
bab
aaa
Grain yield (t ha-1) Number of panicles
120
125
130
135
140
145
150
155
160
165
DS WS
a
abb
aaa
Number of panicles (pan m-2) Number of spikelets per panicle
50
60
70
80
90
100
110
DS WS
bb
a
baba
Number of spikelet per panicle (spikelet pan-2)
% Grain filling
50
55
60
65
70
75
80
85
DS WS
aaaaaa
Grain filling (%)
1000-grain weight (g)
18.0
18.5
19.0
19.5
20.0
20.5
21.0
21.5
22.0
DS WS
b
aba aaa
1000-grain weight (g)
Number (x1000) of spikelets per square meter
10
15
20
25
30
35
DS WS
baba
aaa
Number of spikelet per sqm(x 1000 spikelet m-2)
Total dry matter
5
6
7
8
9
10
DS WS
t ha-1
a
b
ab
a
bab
Harvest index
0.00
0.10
0.20
0.30
0.40
0.50
0.60
0.70
DS WS
a b abaaa
Total dry matter (t ha-1) Harvest Index
(CF = ; AWD-20 = ; AWD-70 = )
oangeles_Sept2010
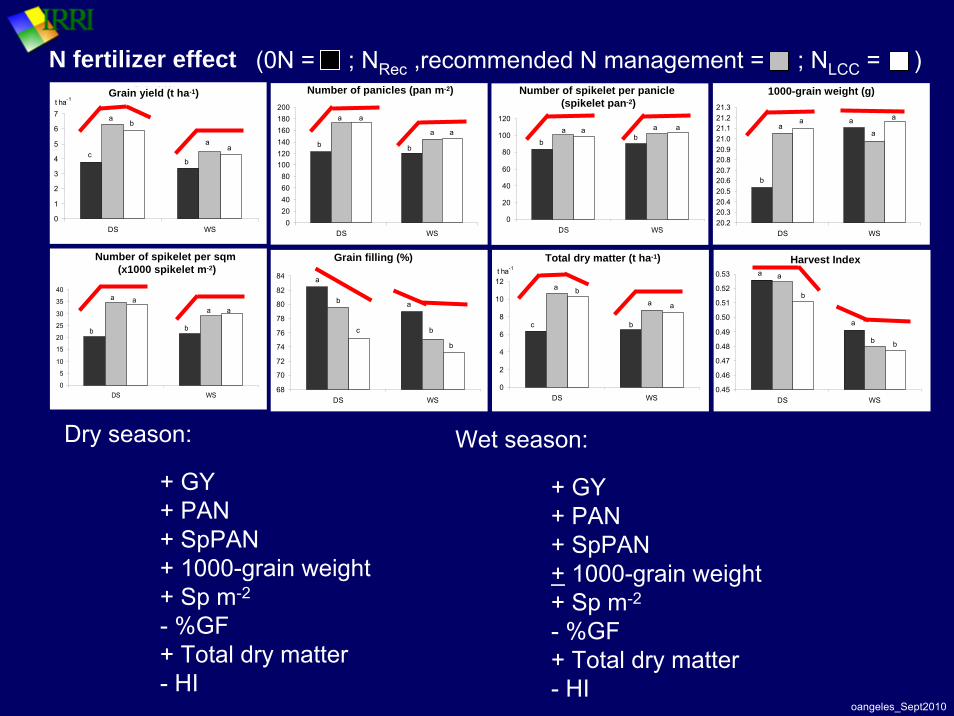
Dry season:
+ GY+ PAN+ SpPAN+ 1000-grain weight+ Sp m-2
- %GF+ Total dry matter- HI
N fertilizer effect
Wet season:
+ GY+ PAN+ SpPAN+ 1000-grain weight+ Sp m-2
- %GF+ Total dry matter- HI
Grain yield
0
1
2
3
4
5
6
7
DS WS
t ha-1
a
a
b
b
ca
Grain yield (t ha-1) Number of panicles
020406080
100120140160180200
DS WS
aa
aa
bb
Number of panicles (pan m-2) Number of spikelets per panicle
0
20
40
60
80
100
120
DS WS
aab
aab
Number of spikelet per panicle (spikelet pan-2)
% Grain filling
68
70
72
74
76
78
80
82
84
DS WS
b
b
a
c
b
a
Grain filling (%)
1000-grain weight (g)
20.220.320.420.520.620.720.820.921.021.121.221.3
DS WS
aa
b
a
a
a
1000-grain weight (g)
Number (x1000) of spikelets per square meter
0
5
10
15
20
25
30
35
40
DS WS
aa
b
aa
b
Number of spikelet per sqm(x1000 spikelet m-2)
Total dry matter
0
2
4
6
8
10
12
DS WS
t ha-1
aa
bc
ba
Total dry matter (t ha-1) Harvest index
0.45
0.46
0.47
0.48
0.49
0.50
0.51
0.52
0.53
DS WS
bb
a
b
aa
Harvest Index
(0N = ; NRec ,recommended N management = ; NLCC = )
oangeles_Sept2010
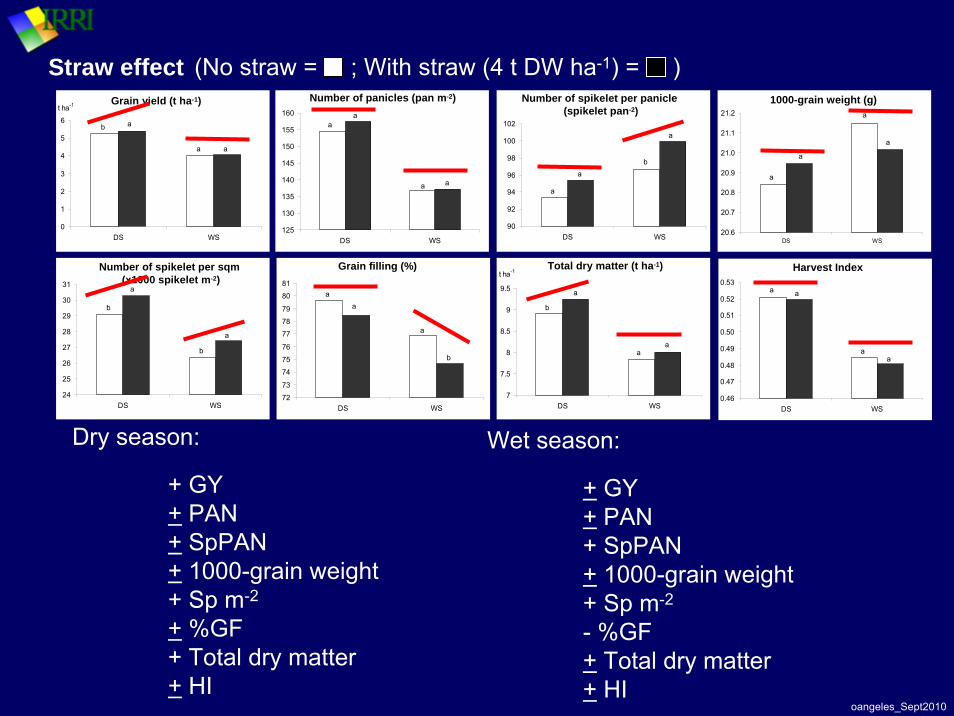
Dry season:
+ GY+ PAN+ SpPAN+ 1000-grain weight+ Sp m-2
+ %GF+ Total dry matter+ HI
Wet season:
+ GY+ PAN+ SpPAN+ 1000-grain weight+ Sp m-2
- %GF+ Total dry matter+ HI
Straw effectGrain yield
0
1
2
3
4
5
6
DS WS
t ha-1
a a
ab
Grain yield (t ha-1) Number of panicles
125
130
135
140
145
150
155
160
DS WS
aa
aa
Number of panicles (pan m-2) Number of spikelets per panicle
90
92
94
96
98
100
102
DS WS
a
ba
a
Number of spikelet per panicle (spikelet pan-2)
% Grain filling
72
73
74
75
76
77
78
79
80
81
DS WS
b
a
aa
Grain filling (%)
1000-grain weight (g)
20.6
20.7
20.8
20.9
21.0
21.1
21.2
DS WS
a
a
a
a
1000-grain weight (g)
Number (x1000) of spikelets per square meter
24
25
26
27
28
29
30
31
DS WS
b
b
a
a
Number of spikelet per sqm(x1000 spikelet m-2)
Total dry matter
7
7.5
8
8.5
9
9.5
DS WS
t ha-1
aa
a
b
Total dry matter (t ha-1) Harvest index
0.46
0.47
0.48
0.49
0.50
0.51
0.52
0.53
DS WS
aa
aa
Harvest Index
(No straw = ; With straw (4 t DW ha-1) = )

oangeles_Sept2010
Dry season grain yield
0
1
2
3
4
5
6
7
8
Water management
t ha-1 0 N Rec_N LCC
Continuously flooded AWD-20 AWD-70
c
bbab
bab
a
cc
▼
Wet season grain yield
0
1
2
3
4
5
6
7
8
Water management
t ha-1
0 N Rec_N LCC
Continuously flooded AWD-20 AWD-70
b
aaa aaa
bb
Combined effect of water and N-management on GY
DSMean grain yield (t/ha)0 N - 3.78 Rec_N - 6.27 LCC - 5.92
WSMean grain yield (t/ha)0 N - 3.39 Rec_N - 4.45 LCC – 4.30
oangeles_Sept2010
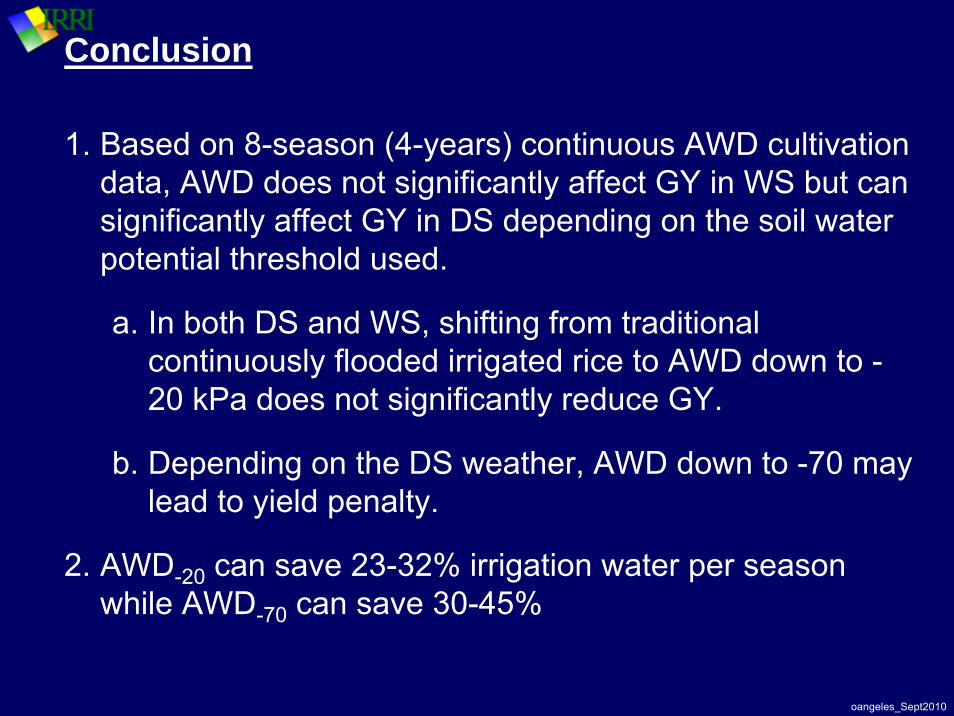
Conclusion
1. Based on 8-season (4-years) continuous AWD cultivation data, AWD does not significantly affect GY in WS but can significantly affect GY in DS depending on the soil water potential threshold used.
a. In both DS and WS, shifting from traditional continuously flooded irrigated rice to AWD down to -20 kPa does not significantly reduce GY.
b. Depending on the DS weather, AWD down to -70 may lead to yield penalty.
2. AWD-20 can save 23-32% irrigation water per season while AWD-70 can save 30-45%

oangeles_Sept2010
3. AWD can maximize use of rainfall, increase productivity of irrigation water input, and offer opportunities to conserve water resource for future use.
4. The timing of tillage (45-48 DBT or 25-28 DBT) does not affect GY.
5. GY with straw incorporation was generally higher than without straw.
6. Recommended N (fixed dose and timing of application) and LCC-base N management are both achievable and effective in increasing grain yields with AWD.
7. Apparently, no tillage, straw, and N-management change is necessary when shifting from continuously flooded to AWD irrigation management.
oangeles_Sept2010
I R R I
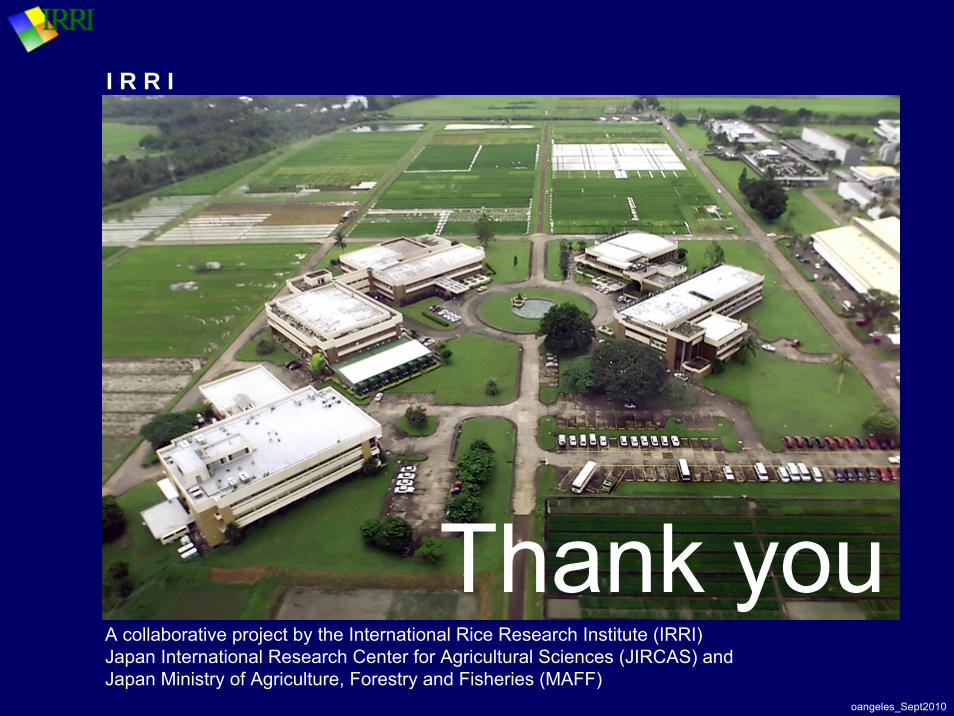
Thank youA collaborative project by the International Rice Research Institute (IRRI)Japan International Research Center for Agricultural Sciences (JIRCAS) and Japan Ministry of Agriculture, Forestry and Fisheries (MAFF)

oangeles_Sept2010

oangeles_Sept2010
oangeles_Sept2010
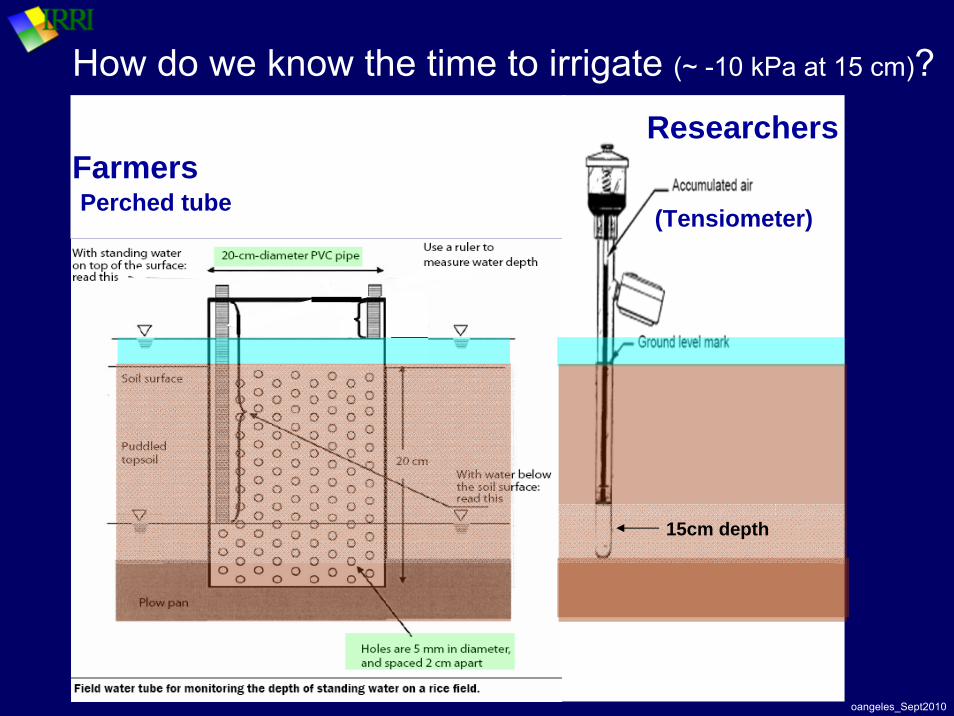
FarmersPerched tube (Tensiometer)
Researchers
15cm depth
How do we know the time to irrigate (~ -10 kPa at 15 cm)?
oangeles_Sept2010
▼▼▼
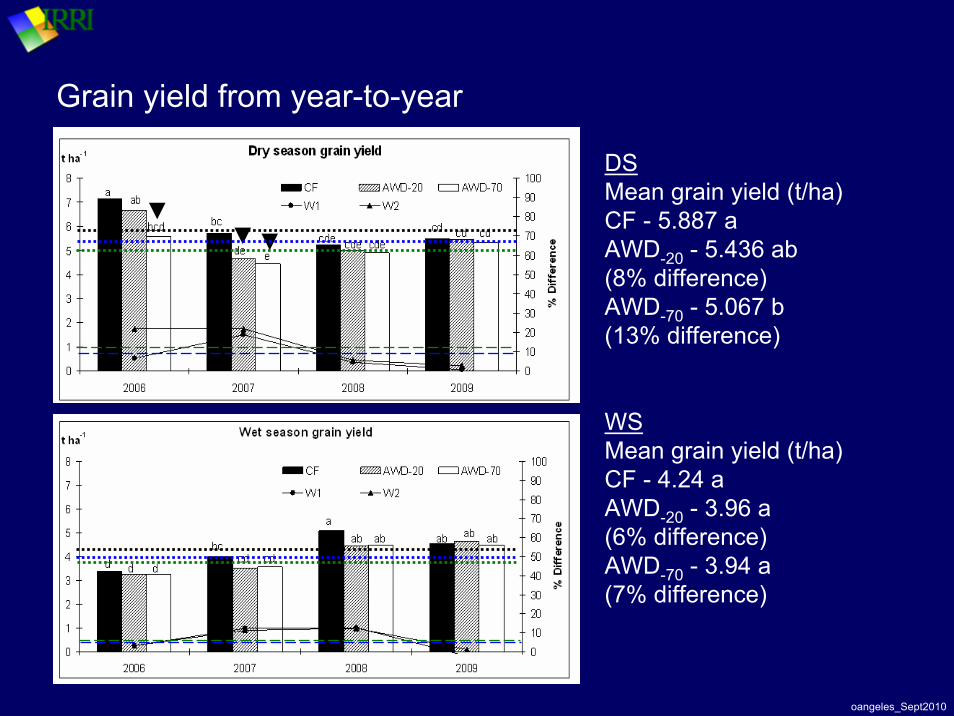
Grain yield from year-to-year
DSMean grain yield (t/ha)CF - 5.887 aAWD-20 - 5.436 ab(8% difference)AWD-70 - 5.067 b(13% difference)
WSMean grain yield (t/ha)CF - 4.24 aAWD-20 - 3.96 a(6% difference)AWD-70 - 3.94 a (7% difference)
oangeles_Sept2010
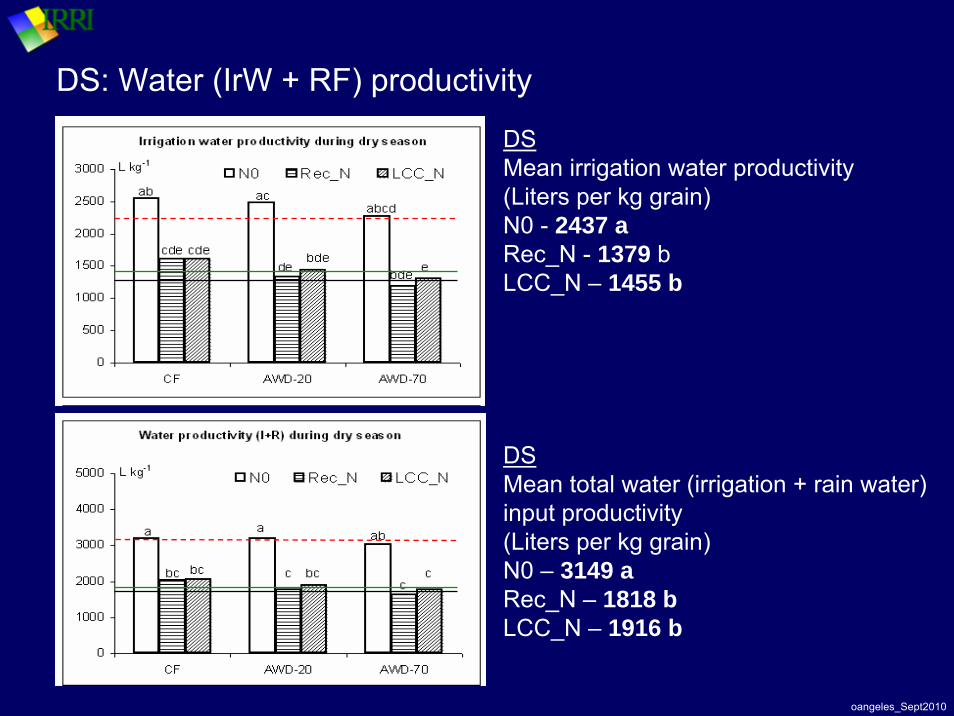
DS: Water (IrW + RF) productivity
DSMean irrigation water productivity (Liters per kg grain)N0 - 2437 aRec_N - 1379 bLCC_N – 1455 b
DSMean total water (irrigation + rain water)input productivity (Liters per kg grain)N0 – 3149 aRec_N – 1818 bLCC_N – 1916 b

oangeles_Sept2010
WS: Water (IrW + RF) productivity
WSMean irrigation water productivity (Liters per kg grain)N0 - 1599 aRec_N - 1278 bLCC_N – 1270 b
WSMean total water (irrigation + rain water)input productivity (Liters per kg grain)N0 – 4105 aRec_N - 3155 bLCC_N – 3229 b
oangeles_Sept2010
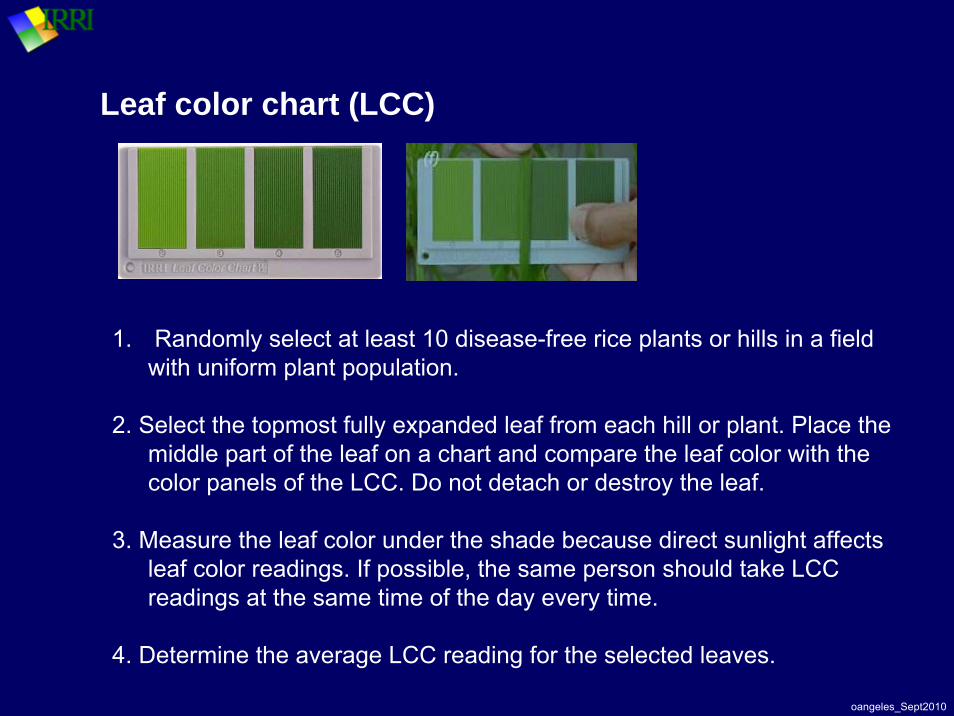
Leaf color chart (LCC)
1. Randomly select at least 10 disease-free rice plants or hills in a field with uniform plant population.
2. Select the topmost fully expanded leaf from each hill or plant. Place the middle part of the leaf on a chart and compare the leaf color with the color panels of the LCC. Do not detach or destroy the leaf.
3. Measure the leaf color under the shade because direct sunlight affects leaf color readings. If possible, the same person should take LCC readings at the same time of the day every time.
4. Determine the average LCC reading for the selected leaves.
oangeles_Sept2010
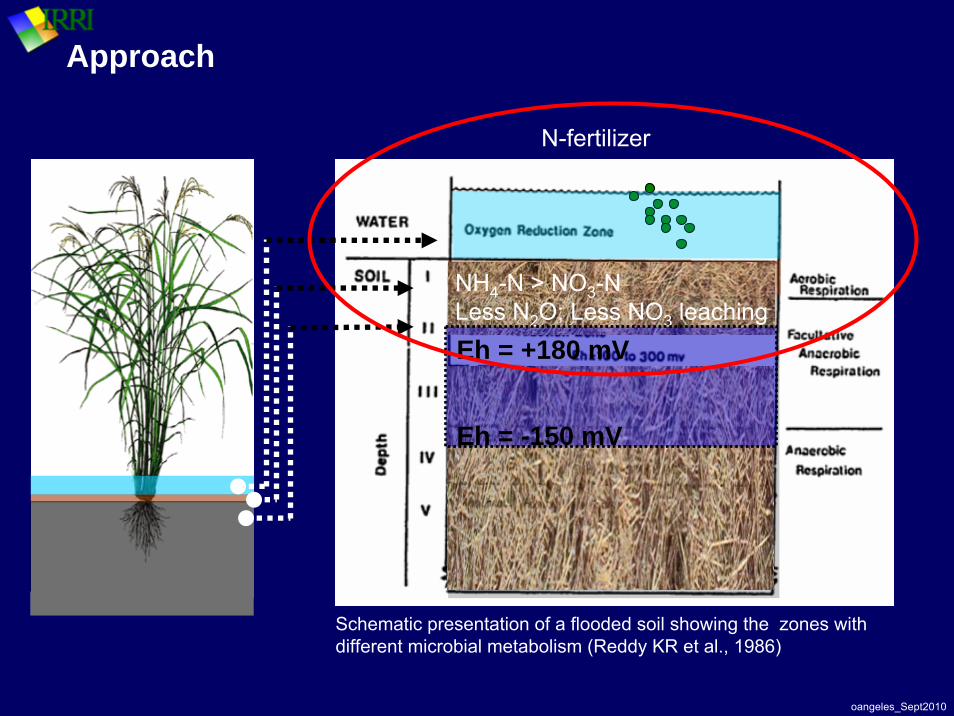
Schematic presentation of a flooded soil showing the zones withdifferent microbial metabolism (Reddy KR et al., 1986)
NH4-N > NO3-NLess N2O; Less NO3 leaching
N-fertilizer
Eh = +180 mV
Eh = -150 mV
Approach

oangeles_Sept2010
Source: Increasing adoption of AWD (Lampayan et al., 2004; Li et al., 2003)
PI to completeflowering
grain filling
MaturityLate tillering
Earlytillering
Transprecovery
Field water depth (mm)
0
10
20
30
40
50
60
-20
-10
0 10 20 30 40 50 60 70 80 90 100 110
CF
AWD
soil surface
Days after transplanting
Concept of AWD

oangeles_Sept2010Source: Dobermann, A. and Fairhurst T., 2000
N-transformations in irrigated rice soils
oangeles_Sept2010
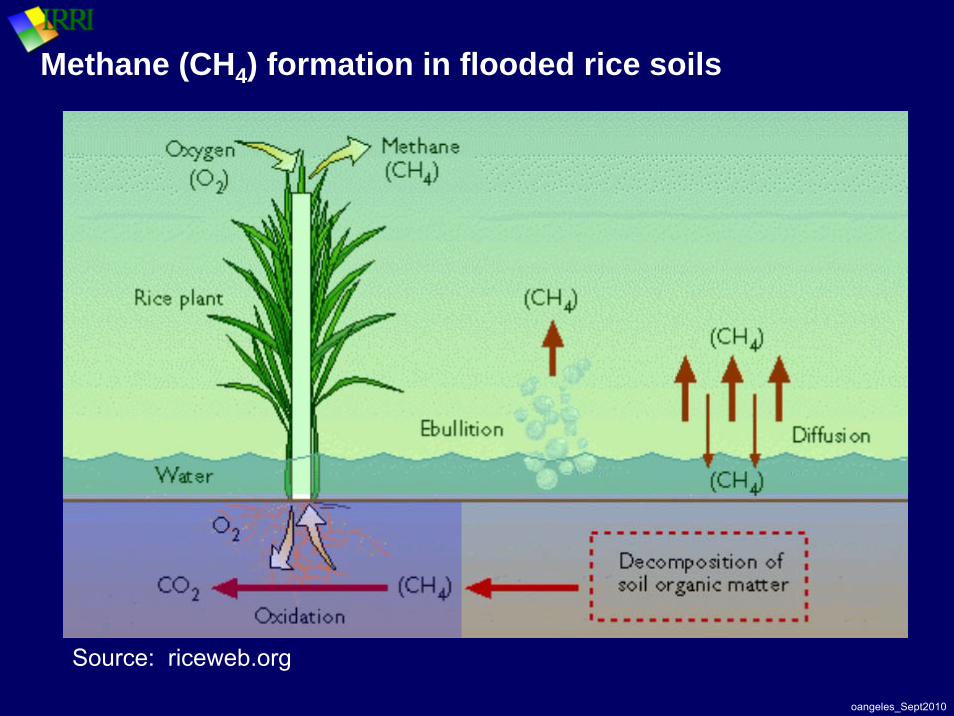
Methane (CH4) formation in flooded rice soils
Source: riceweb.org
oangeles_Sept2010
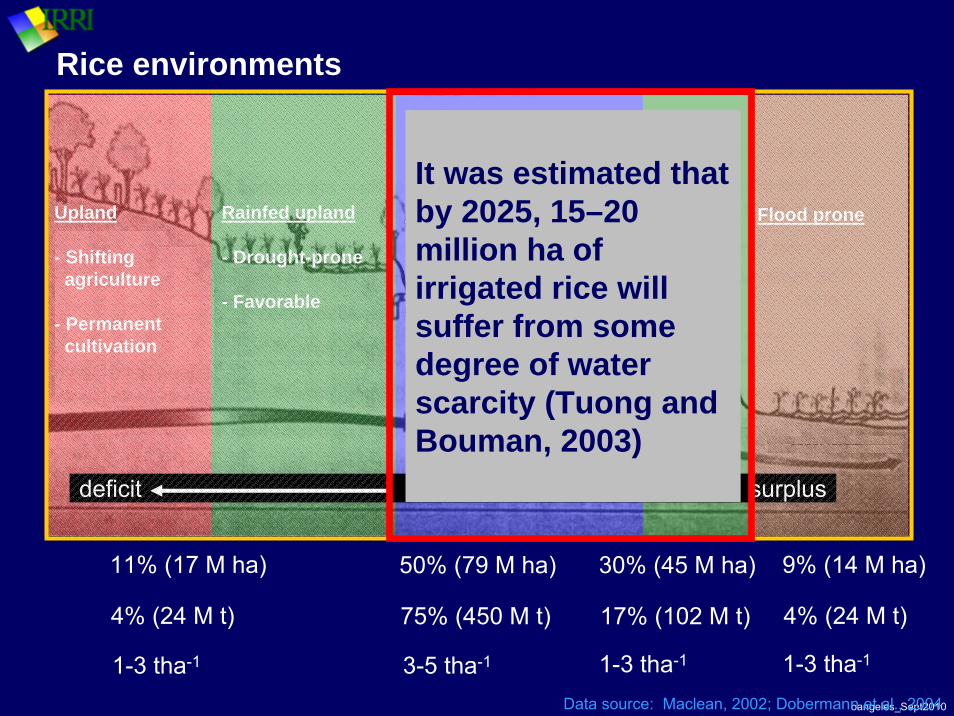
Rice environments
Rainfed upland
- Drought-prone
- Favorable
Irrigated lowland Rainfed lowland
- Drought prone
- Submer-gence prone
Upland
- Shiftingagriculture
- Permanentcultivation
Flood prone
deficit WATER surplus
50% (79 M ha) 30% (45 M ha) 11% (17 M ha) 9% (14 M ha)
75% (450 M t) 17% (102 M t) 4% (24 M t) 4% (24 M t)
1-3 tha-1 1-3 tha-11-3 tha-13-5 tha-1
Data source: Maclean, 2002; Dobermann et al., 2004
It was estimated that by 2025, 15–20 million ha of irrigated rice will suffer from some degree of water scarcity (Tuong and Bouman, 2003)
oangeles_Sept2010
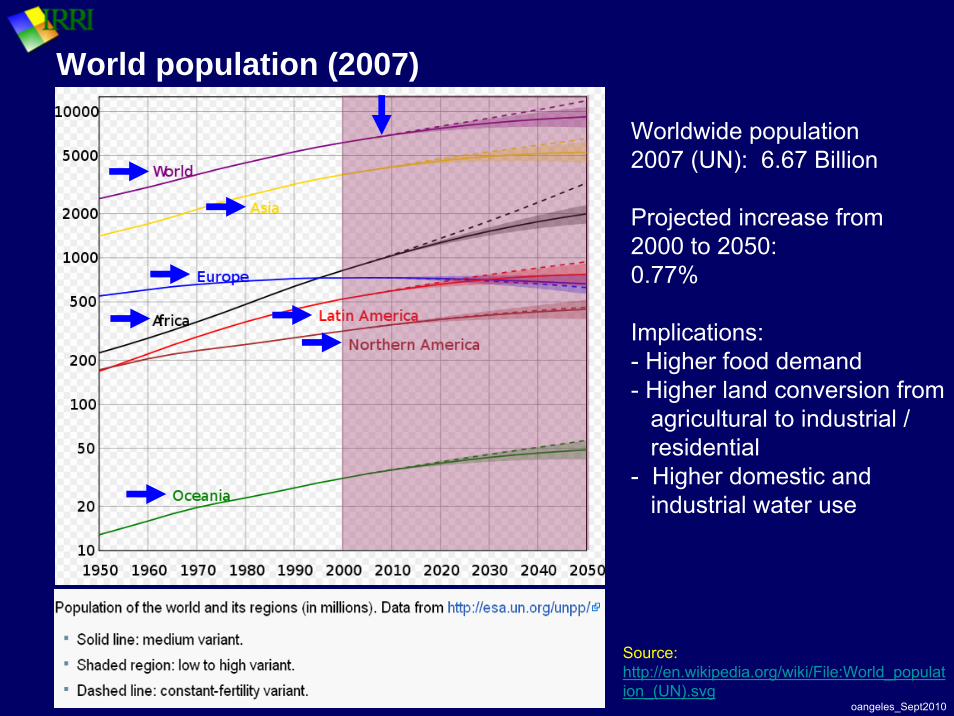
World population (2007)
Source: http://en.wikipedia.org/wiki/File:World_population_(UN).svg
Worldwide population2007 (UN): 6.67 Billion
Projected increase from 2000 to 2050:0.77%
Implications:- Higher food demand- Higher land conversion from
agricultural to industrial / residential
- Higher domestic and industrial water use
oangeles_Sept2010
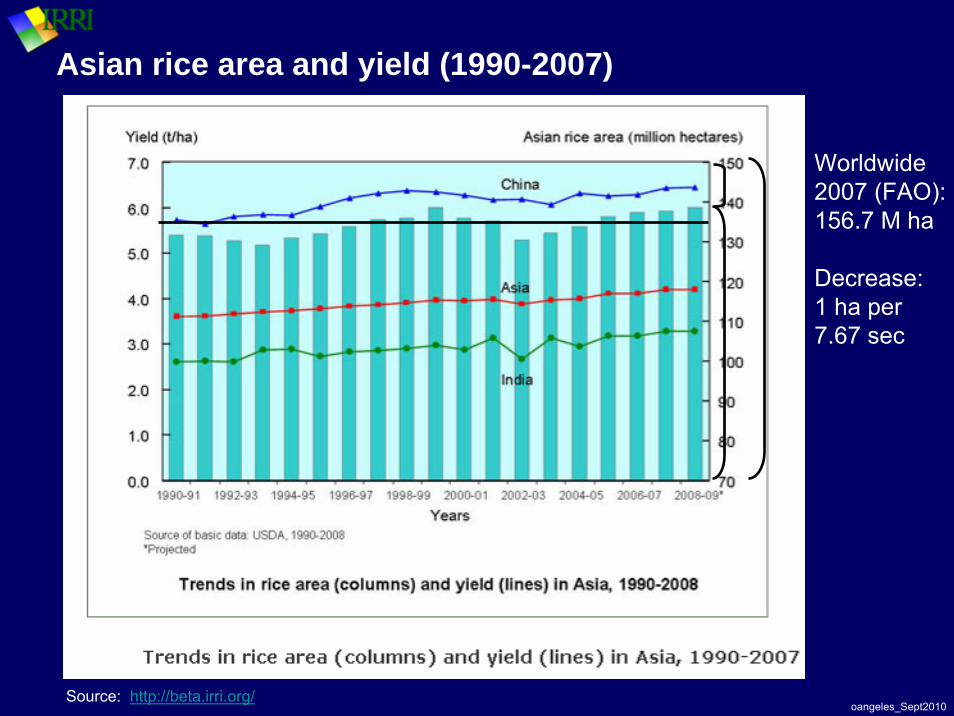
Asian rice area and yield (1990-2007)
Source: http://beta.irri.org/
Worldwide2007 (FAO): 156.7 M ha
Decrease:1 ha per 7.67 sec

oangeles_Sept2010- Source: WaterGAP 2.0 - December 1999 (http://www.worldwatercouncil.org/index.php?id=25)
Growing global water scarcity
The water stress indicator measures the proportion of water withdrawal with respect to total renewable resources.
oangeles_Sept2010
References
Bouman BAM, Lampayan RM, Tuong TP. 2007. Water management inirrigated rice: coping with water scarcity. Los Baños (Philippines): International Rice Research Institute. 54 p.
Dobermann, A. and Fairhurst T., 2000. Rice : Nutrient disorders and nutrient management. Singapore: Potash & Phosphate Institute; Laguna, Philippines: IRRI.
FAOSTAT Database, 2008. FAO, Rome
United Nations, Department of Economic and Social Affairs, Population Division, 2007. World Population Prospects: The 2006 Revision, vol. I, Comprehensive Tables (United Nations publication, Sales No. E.07.XIII.2)
Maclean JL, Dawe D, Hardy B, Hettel GP, editors. 2002. Rice almanac. Los Baños(Philippines): International Rice Research Institute. 253 pp.
Neue, H. 1993. Methane emission from rice fields: Wetland rice fields may make a major contribution to global warming. BioScience 43 (7): 466-73.
Tuong TP, Bouman BAM. 2003. Rice production in water scarce environments. In: Kijne JW, Barker R, Molden D, editors. Water productivity in agriculture: limits and opportunities for improvement. Wallingford (UK): CABI Publishing. p 53-67.
Wassmann Reiner, Yasukazu Hosen, and Kay Sumfleth, 2009. Reducing Methane Emissions from Irrigated Rice. International Food Policy Research Institute, Focus 16: Brief 3, May 2009
oangeles_Sept2010
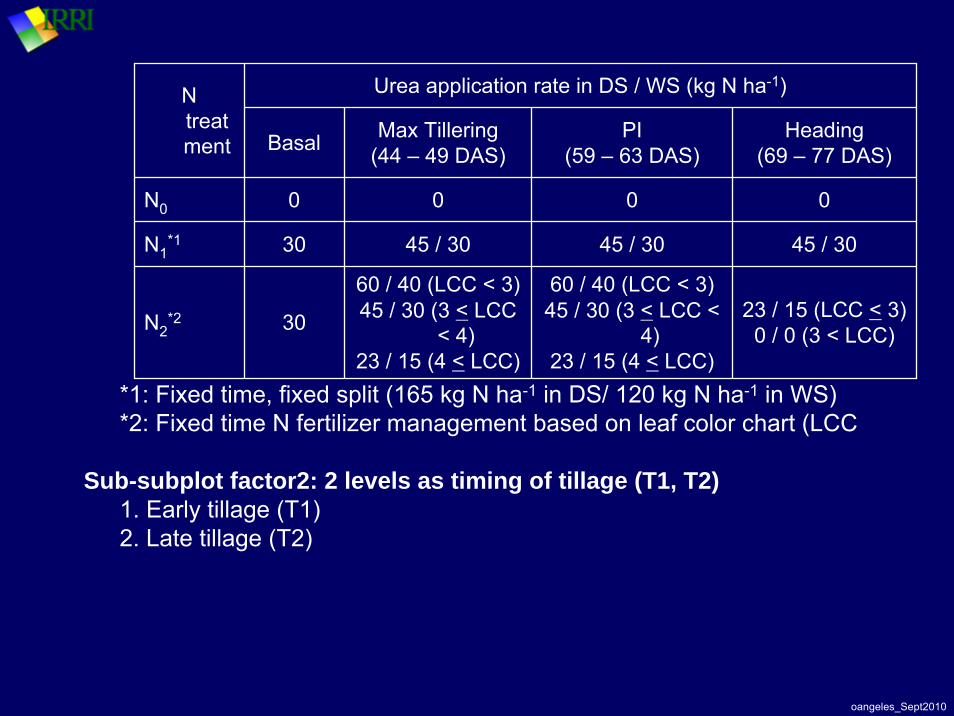
*1: Fixed time, fixed split (165 kg N ha-1 in DS/ 120 kg N ha-1 in WS)*2: Fixed time N fertilizer management based on leaf color chart (LCC
Sub-subplot factor2: 2 levels as timing of tillage (T1, T2)1. Early tillage (T1)2. Late tillage (T2)
Urea application rate in DS / WS (kg N ha-1)N treatment Basal Max Tillering
(44 – 49 DAS)PI
(59 – 63 DAS)Heading
(69 – 77 DAS)
N0 0 0 0 0
N1*1 30 45 / 30 45 / 30 45 / 30
N2*2 30
60 / 40 (LCC < 3)45 / 30 (3 < LCC
< 4)23 / 15 (4 < LCC)
60 / 40 (LCC < 3)45 / 30 (3 < LCC <
4)23 / 15 (4 < LCC)
23 / 15 (LCC < 3)0 / 0 (3 < LCC)


![[Luật chơi] Straw](https://img.pdfslide.tips/doc/110x75/58ed73701a28ab29078b45e1/luat-choi-straw.jpg)