Embed Size (px)
DESCRIPTION
Solar sound speed inversion using a nonlocal convection model. Chunguang Zhang National Astronomical Observatories, CAS. Outline. Nonlocal convection theory Our solar model Sound speed inversion Discussion. Stellar convection. Energy transpotation & Material mixing Nonlocal phenomenon - PowerPoint PPT Presentation
Citation preview
Solar sound speed inversion using a nonlocal convection model
Chunguang Zhang
National Astronomical Observatories, CAS
Outline
• Nonlocal convection theory
• Our solar model
• Sound speed inversion
• Discussion
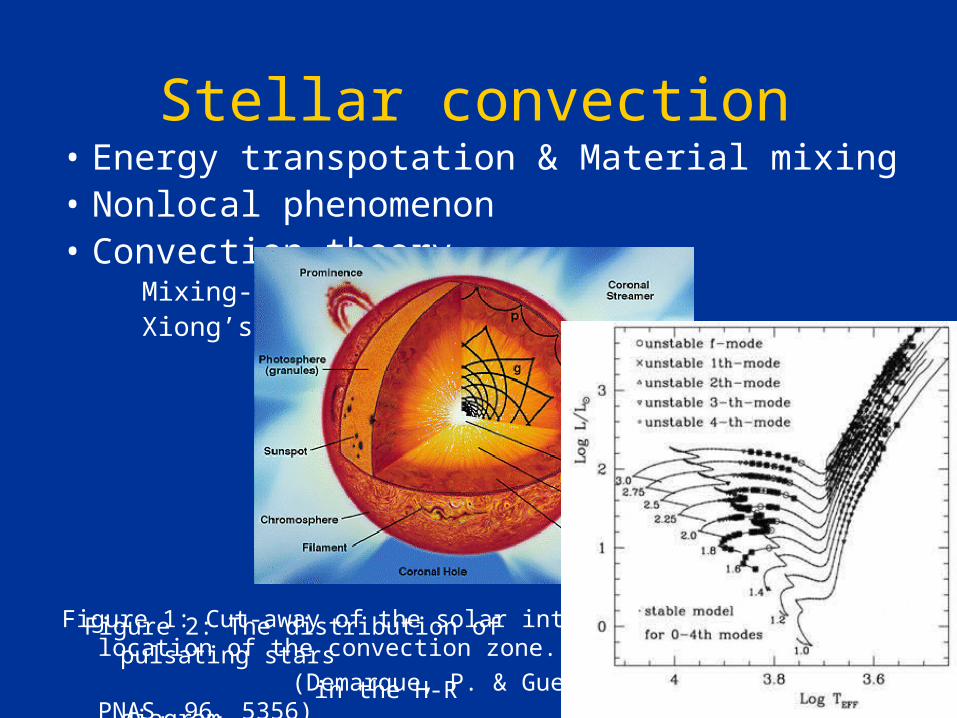
Stellar convection• Energy transpotation & Material mixing• Nonlocal phenomenon• Convection theory Mixing-length theory (MLT) Xiong’s nonlocal convetion theory
Figure 1: Cut-away of the solar interior showing the location of the convection zone.
(Demarque, P. & Guenther, D. B. 1999, PNAS, 96, 5356)Figure 2: The distribution of pulsating stars
in the H-R diagram.
(Xiong, & Deng, 2007, MNRAS, 378,1270)
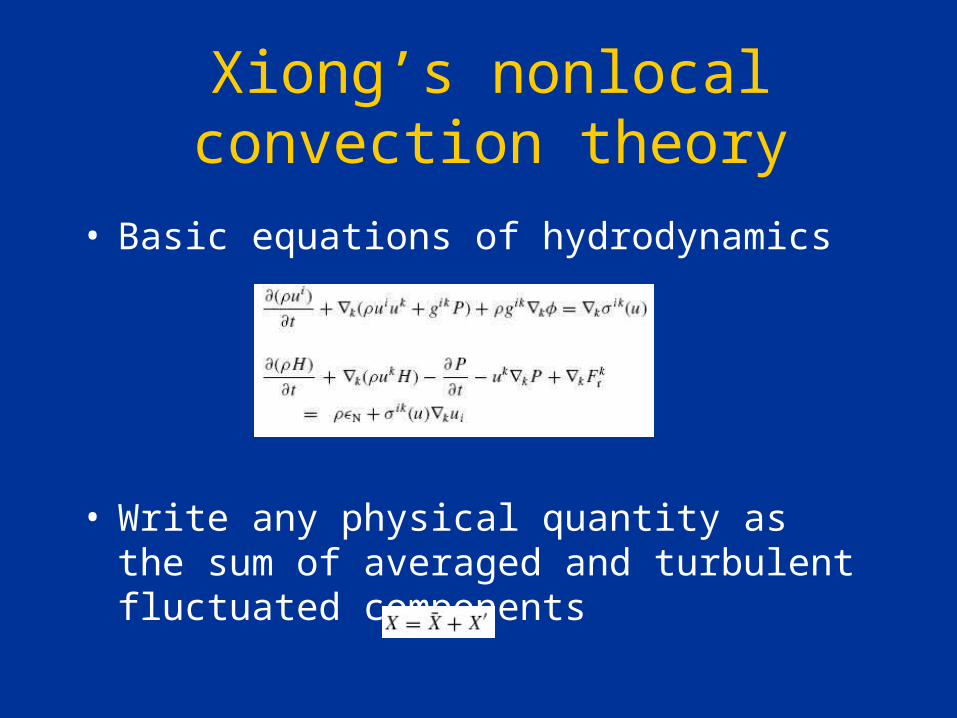
Xiong’s nonlocal convection theory
• Basic equations of hydrodynamics
• Write any physical quantity as the sum of averaged and turbulent fluctuated components
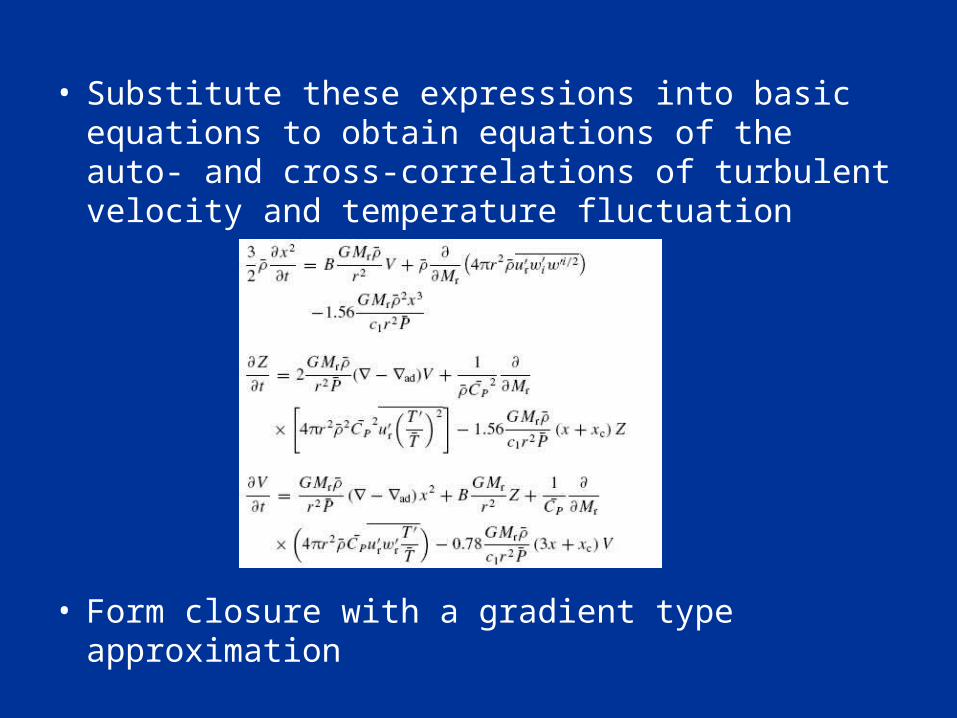
• Substitute these expressions into basic equations to obtain equations of the auto- and cross-correlations of turbulent velocity and temperature fluctuation
• Form closure with a gradient type approximation
Solar envelope model
• Chemical composition GN93 abundance, Grevesse & Noels 1993
• Equation of state OPAL EOS 2005
• Opacity OPAL opacity, Iglesias & Rogers 1996
Low temprature opacity, Ferguson et al. 2005
Comparison with Model S
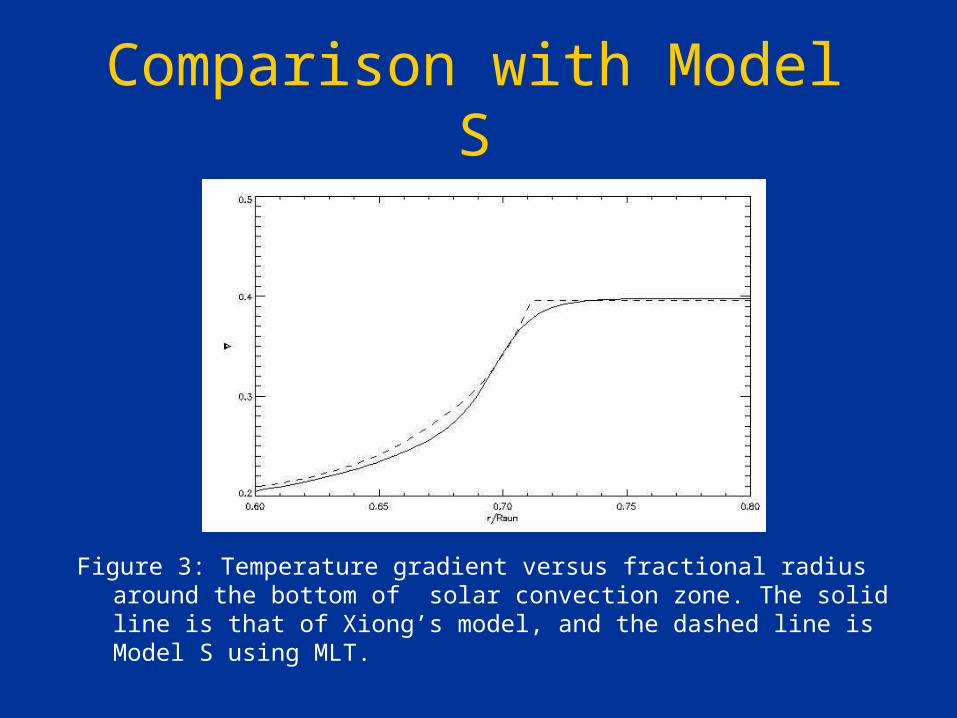
Figure 3: Temperature gradient versus fractional radius around the bottom of solar convection zone. The solid line is that of Xiong’s model, and the dashed line is Model S using MLT.
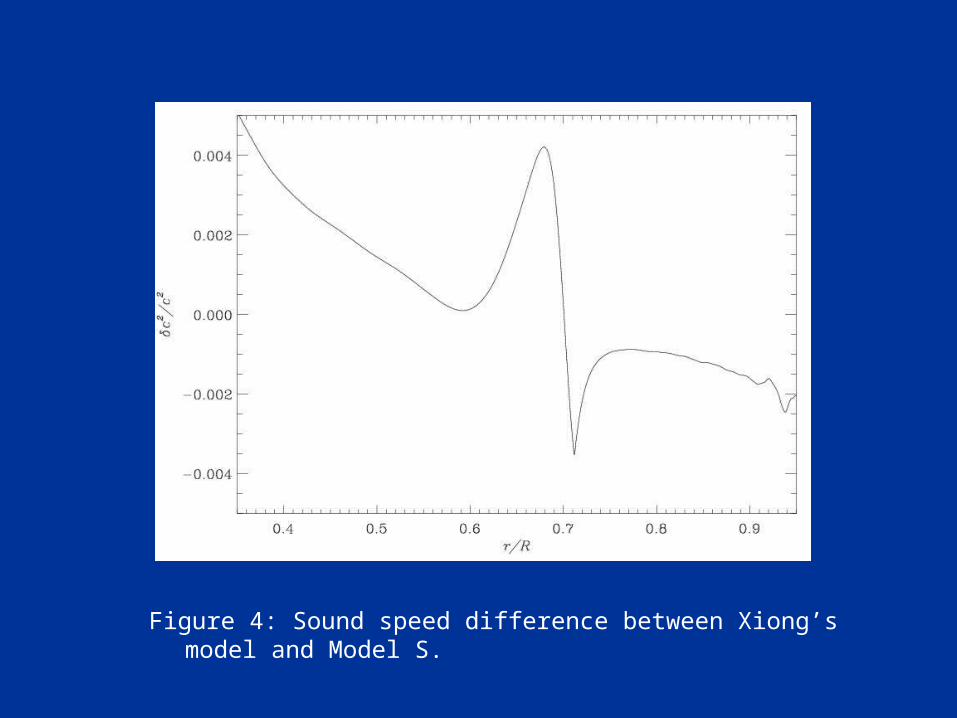
Figure 4: Sound speed difference between Xiong’s model and Model S.
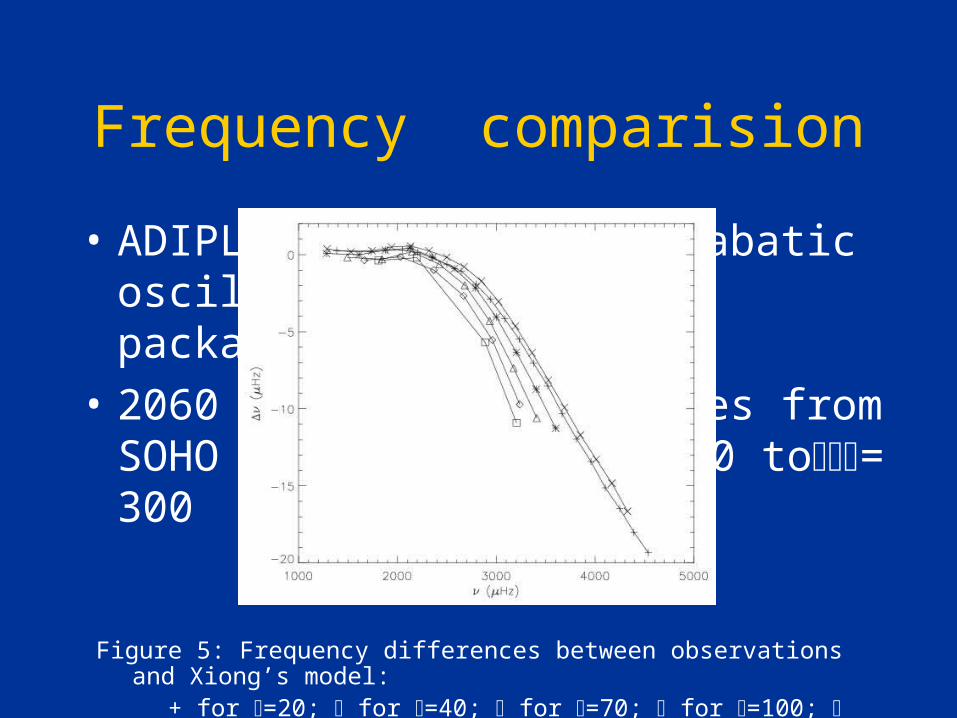
Frequency comparision
• ADIPLS – the Aarhus adiabatic oscillation package
• 2060 observed frequencies from SOHO satellite from = 0 to= 300
Figure 5: Frequency differences between observations and Xiong’s model: + for =20; for =40; for =70; for =100; for =130 ; for =160.
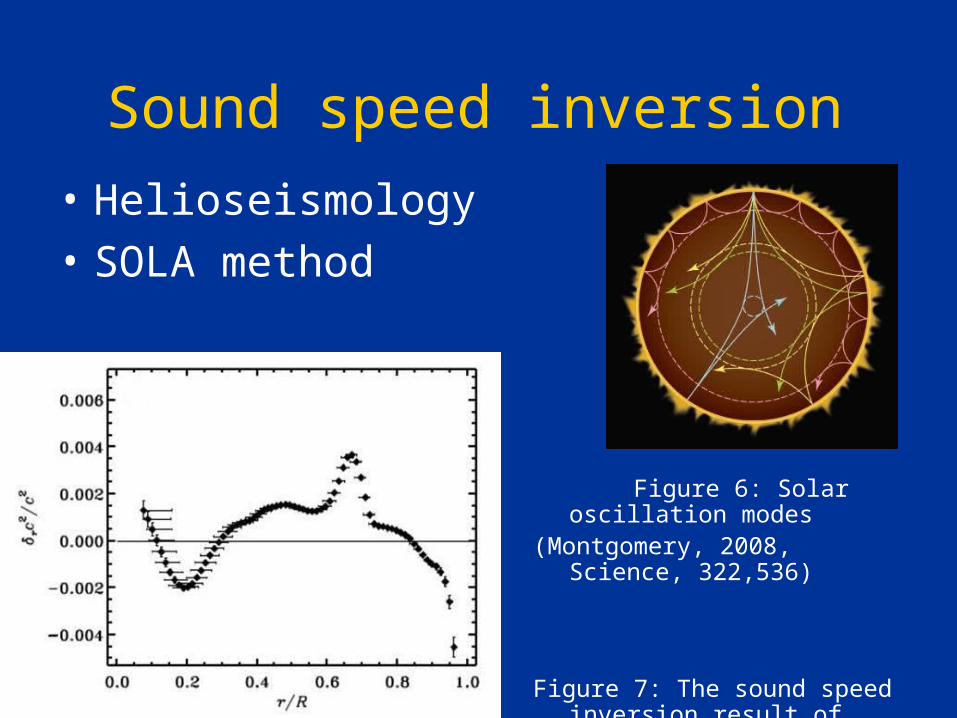
Sound speed inversion
• Helioseismology
• SOLA method
Figure 6: Solar oscillation modes(Montgomery, 2008, Science, 322,536)
Figure 7: The sound speed inversion result of Model S.(Christensen-Dalsgaard, J. 2003)
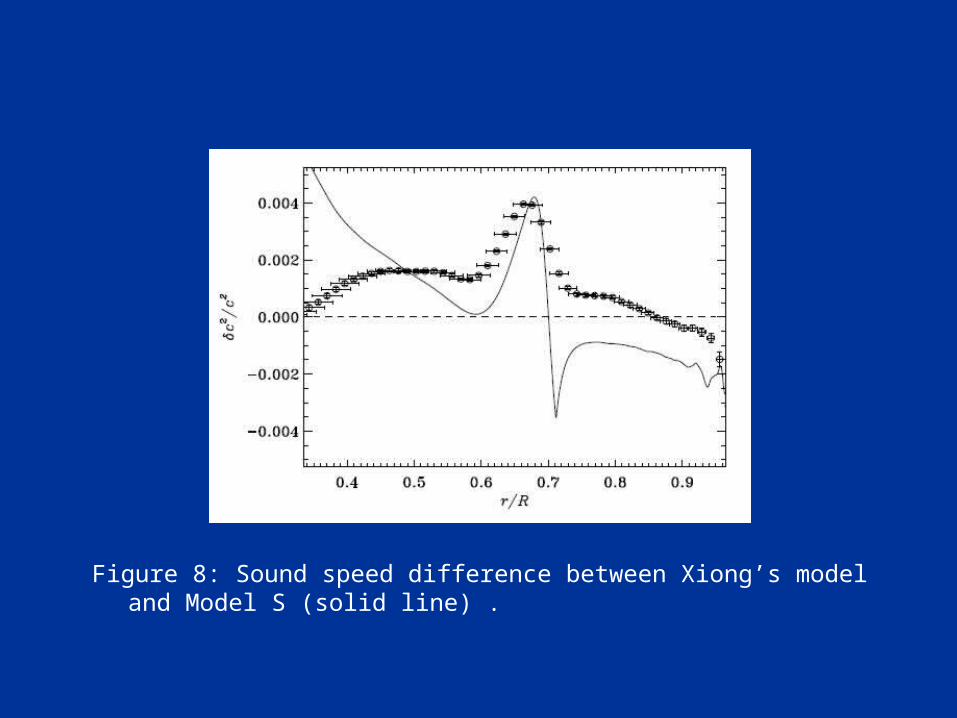
Figure 8: Sound speed difference between Xiong’s model and Model S (solid line) .
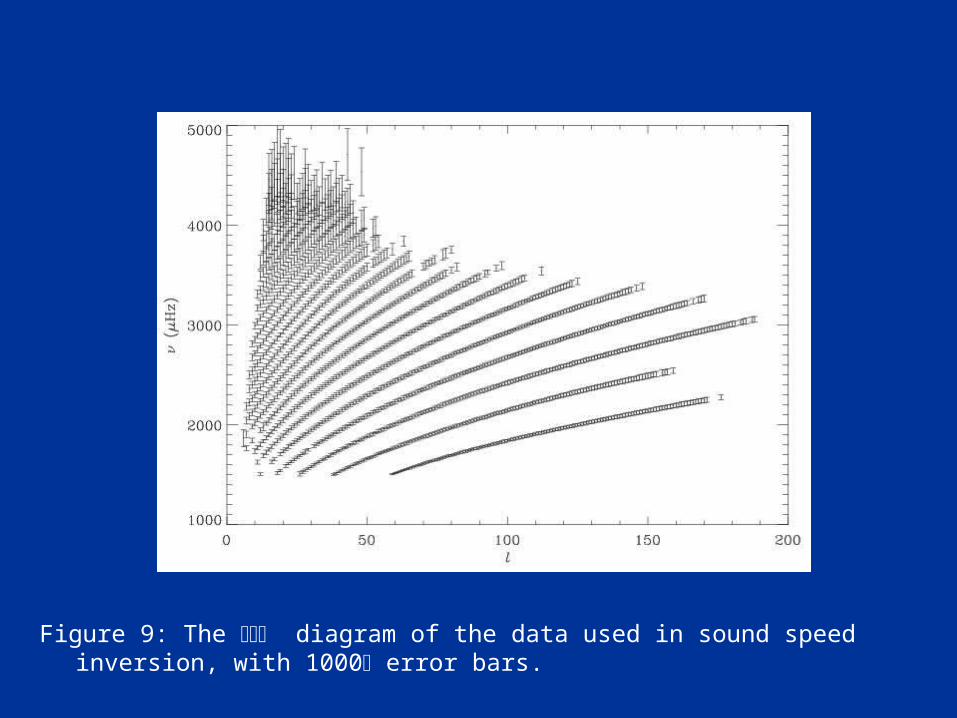
Figure 9: The diagram of the data used in sound speed inversion, with 1000 error bars.
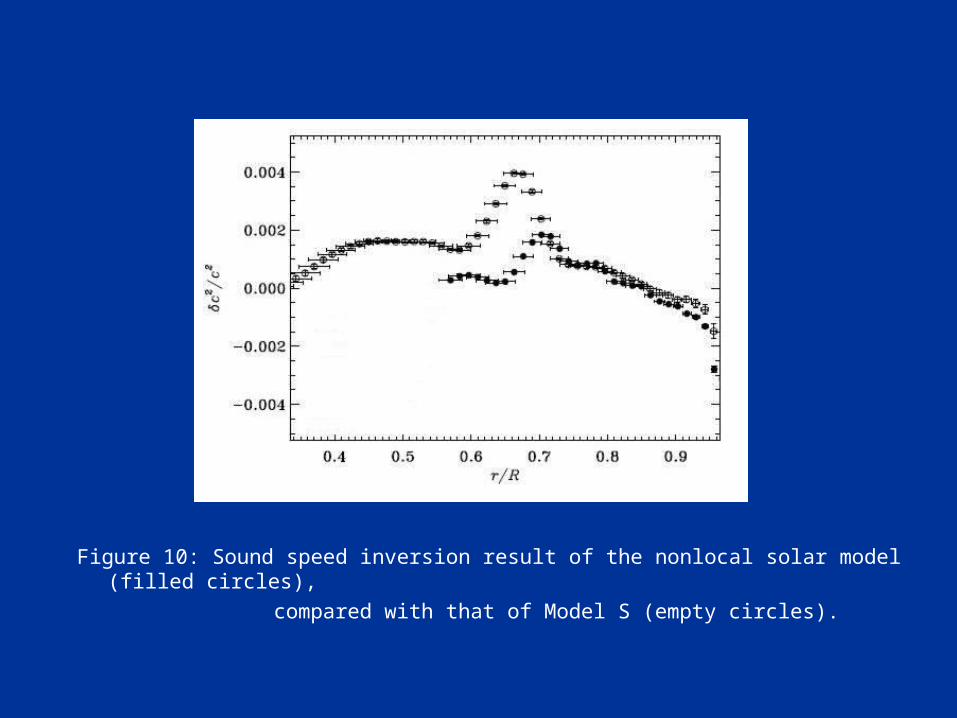
Figure 10: Sound speed inversion result of the nonlocal solar model (filled circles),
compared with that of Model S (empty circles).
Discussion
• About standard solar model
• Further improvements of the model
• New stellar evolution code using nonlocal convection theory
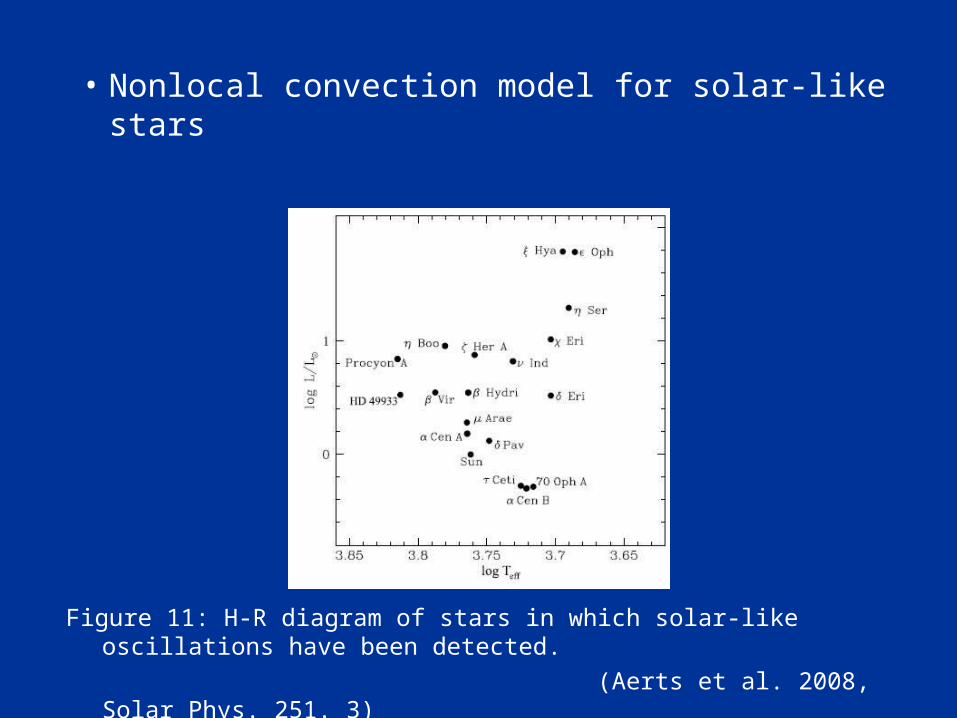
• Nonlocal convection model for solar-like stars
Figure 11: H-R diagram of stars in which solar-like oscillations have been detected.
(Aerts et al. 2008, Solar Phys. 251. 3)

Thank you!