Embed Size (px)
Citation preview
Standard Deviation!
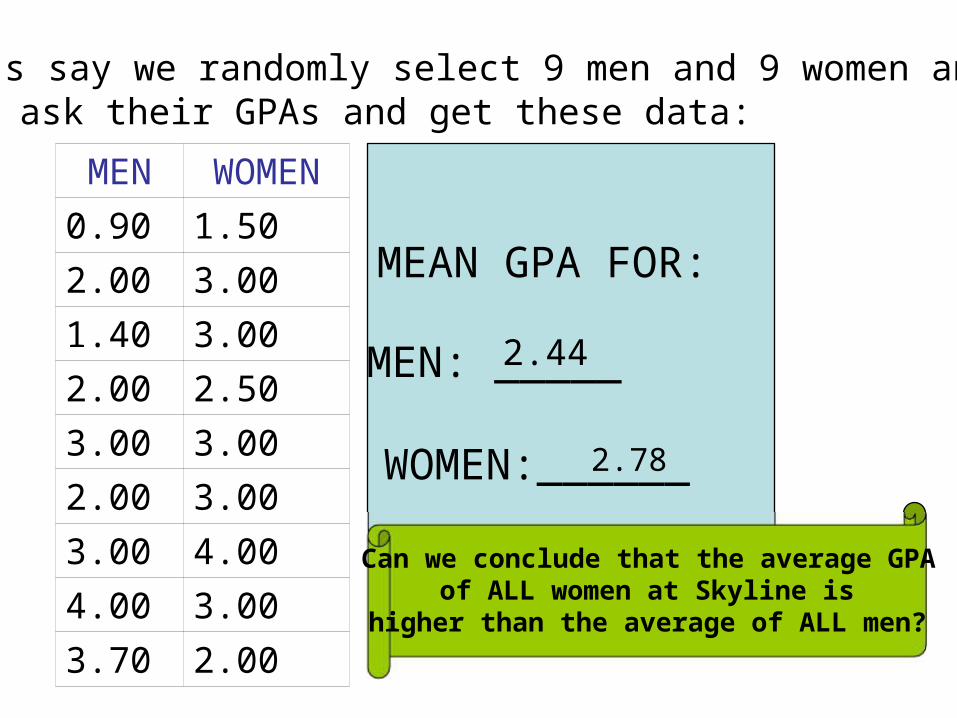
MEN WOMEN
0.90 1.50
2.00 3.00
1.40 3.00
2.00 2.50
3.00 3.00
2.00 3.00
3.00 4.00
4.00 3.00
3.70 2.00
MEN: _____
WOMEN:______
Let's say we randomly select 9 men and 9 women andask their GPAs and get these data:
MEAN GPA FOR:
2.44
2.78
Can we conclude that the average GPAof ALL women at Skyline is
higher than the average of ALL men?
Standard Deviation• The standard deviation is a measure
the degree each data point in the set ofdata points varies (or deviates) fromthe mean
• The wider the spread of scores, thelarger the standard deviation.
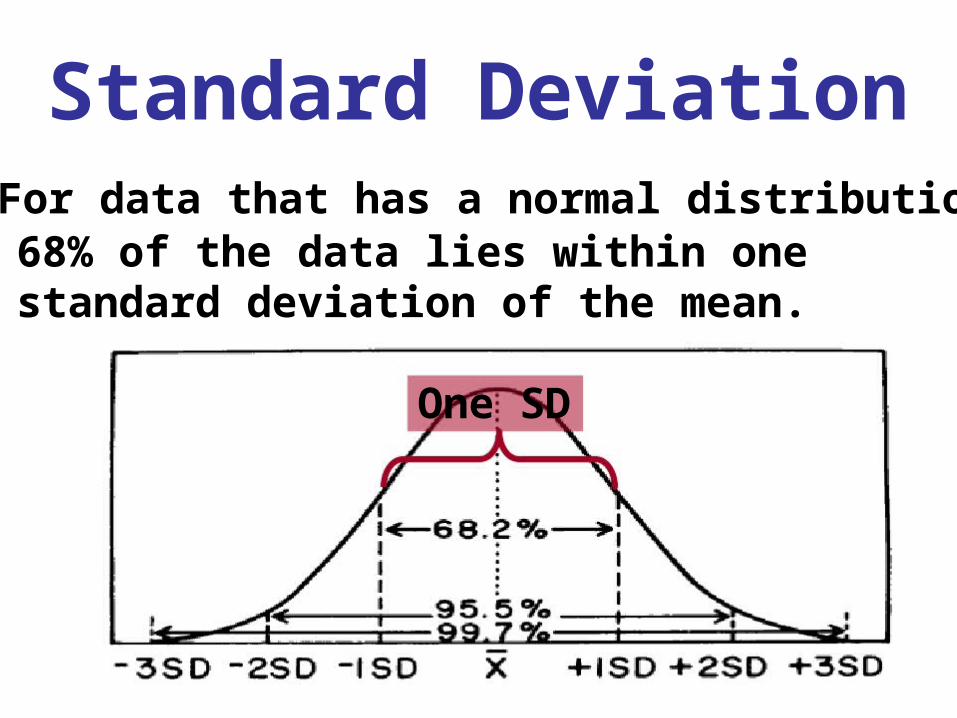
Standard Deviation• For data that has a normal distribution,
68% of the data lies within onestandard deviation of the mean.
One SD
MEN: _____
WOMEN:______
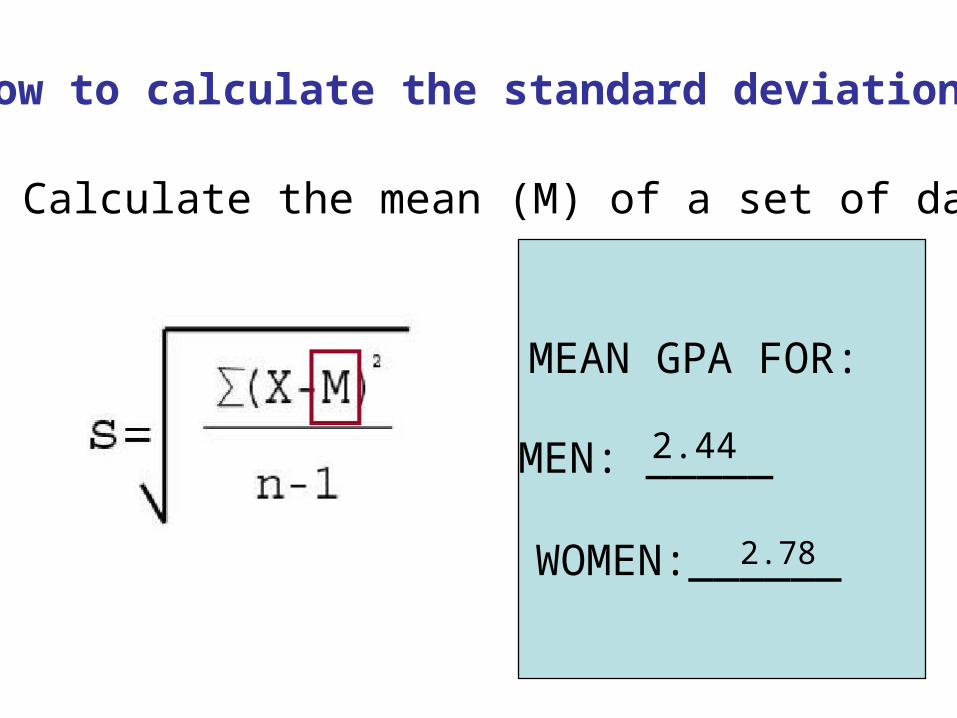
How to calculate the standard deviation:
1. Calculate the mean (M) of a set of data
MEAN GPA FOR:
2.44
2.78
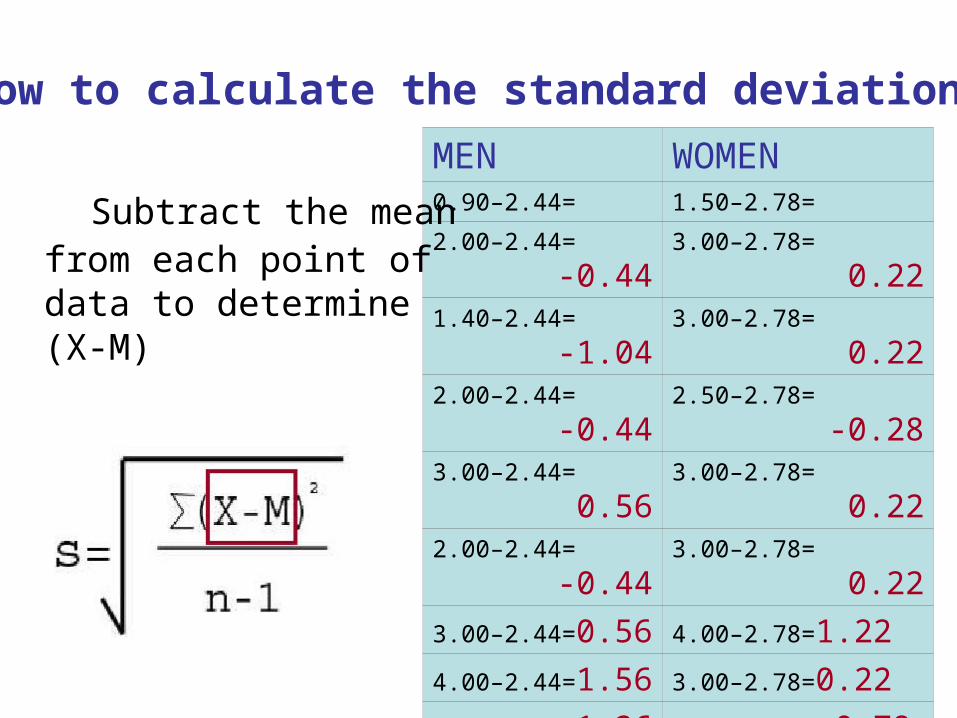
MEN WOMEN0.90–2.44= 1.50–2.78=
2.00–2.44=
-0.443.00–2.78=
0.221.40–2.44=
-1.043.00–2.78=
0.222.00–2.44=
-0.442.50–2.78=
-0.283.00–2.44=
0.563.00–2.78=
0.222.00–2.44=
-0.443.00–2.78=
0.22
3.00–2.44=0.56 4.00–2.78=1.22
4.00–2.44=1.56 3.00–2.78=0.22
3.70–2.44=1.26 2.00–2.78=-0.78
How to calculate the standard deviation:
2. Subtract the meanfrom each point ofdata to determine(X-M)
How to calculate the standard deviation:
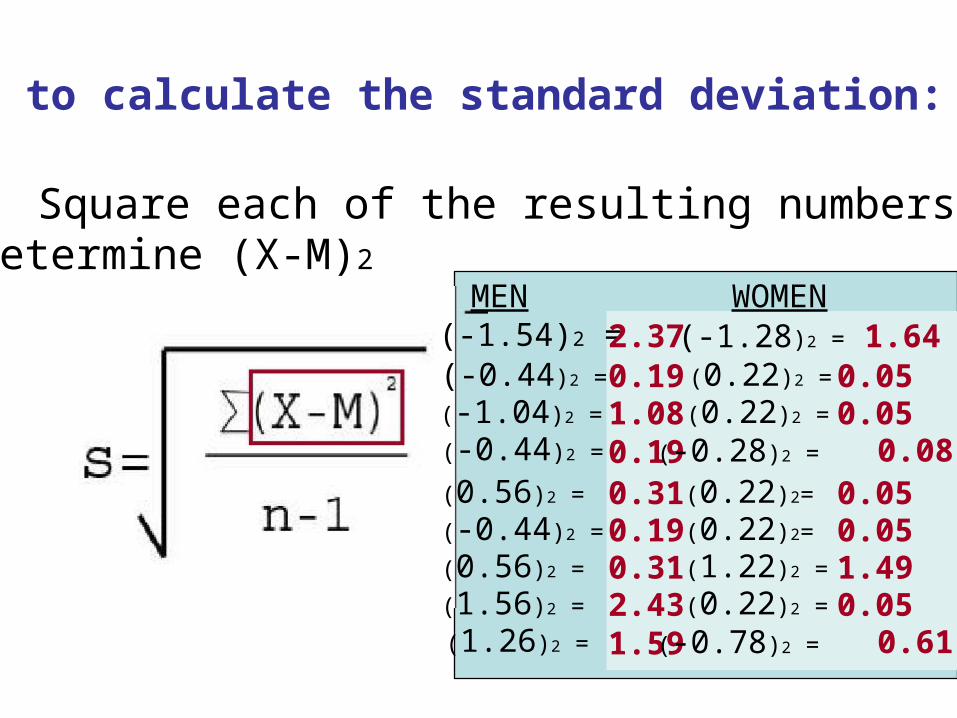
3. Square each of the resulting numbers todetermine (X-M)2
MEN WOMEN(-1.54)2 =(-0.44)2 =
(-1.04)2 =
(0.22)2 =
(0.22)2 =
(-0.44)2 =
(0.56)2 =
(-0.44)2 =
(0.56)2 =
(1.56)2 =
(0.22)2=
(0.22)2=
(1.22)2 =
(0.22)2 =
(1.26)2 =
2.37 (-1.28)2 = 1.640.191.08
0.050.05
0.19 (-0.28)2 = 0.080.310.190.312.43
0.050.051.490.05
1.59 (-0.78)2 = 0.61
How to calculate the standard deviation:
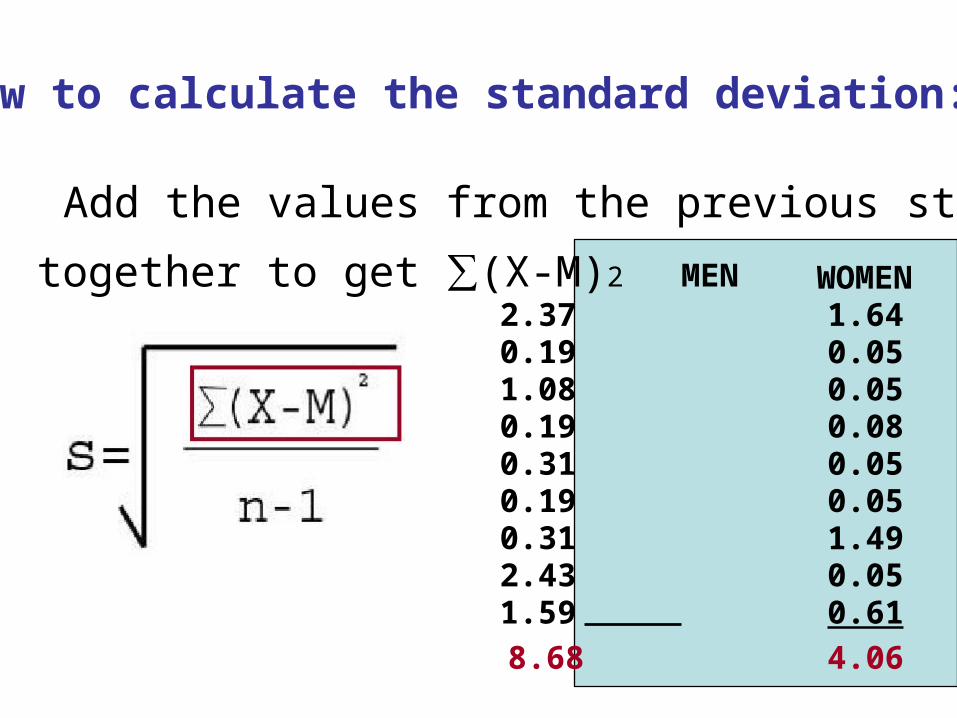
4. Add the values from the previous step
together to get ∑(X-M)2 MEN2.370.191.080.190.310.190.312.431.59
8.68
WOMEN1.640.050.050.080.050.051.490.050.61
4.06
How to calculate the standard deviation:
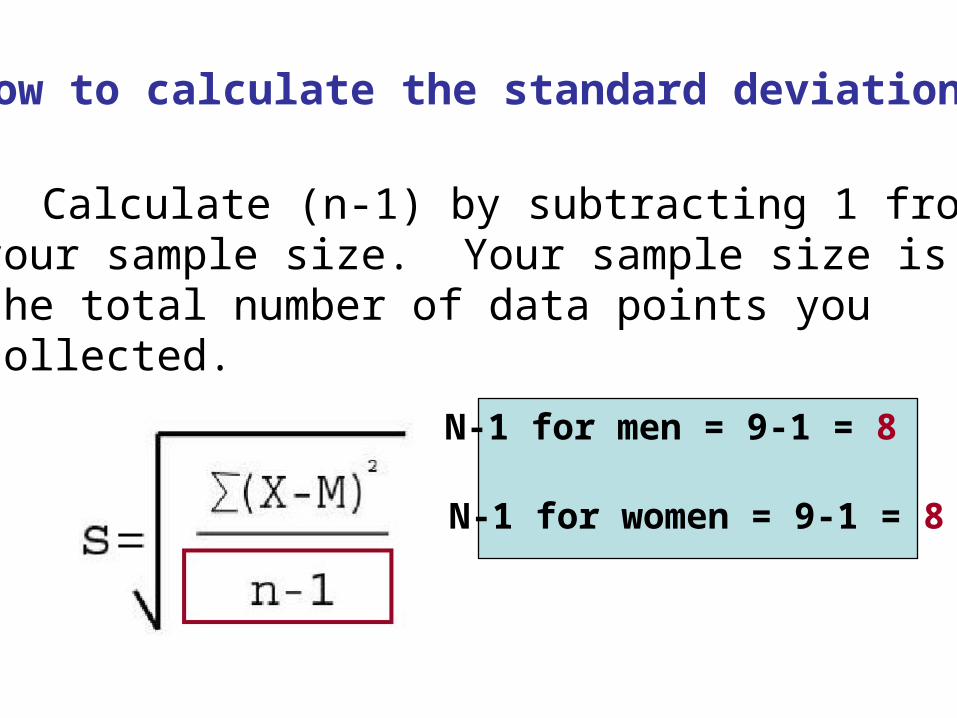
5. Calculate (n-1) by subtracting 1 fromyour sample size. Your sample size isthe total number of data points youcollected.
N-1 for men = 9-1 = 8
N-1 for women = 9-1 = 8
How to calculate the standard deviation:
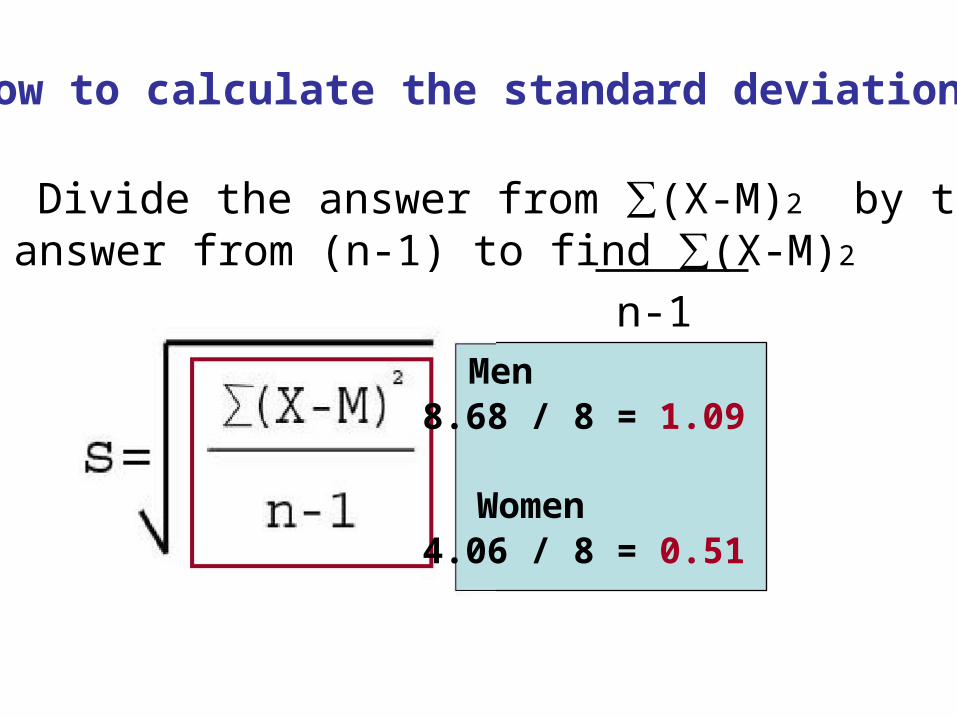
6. Divide the answer from ∑(X-M)2 by theanswer from (n-1) to find ∑(X-M)2
n-1Men
Women
8.68 / 8 = 1.09
4.06 / 8 = 0.51
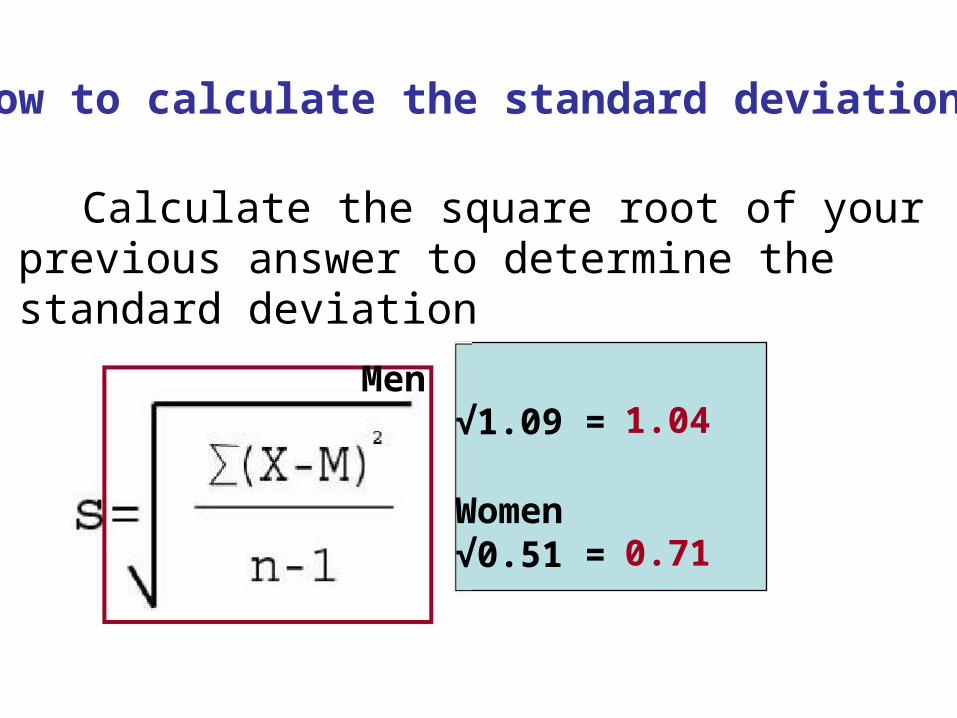
How to calculate the standard deviation:
7. Calculate the square root of yourprevious answer to determine thestandard deviation
Men√1.09 =
Women√0.51 =
1.04
0.71
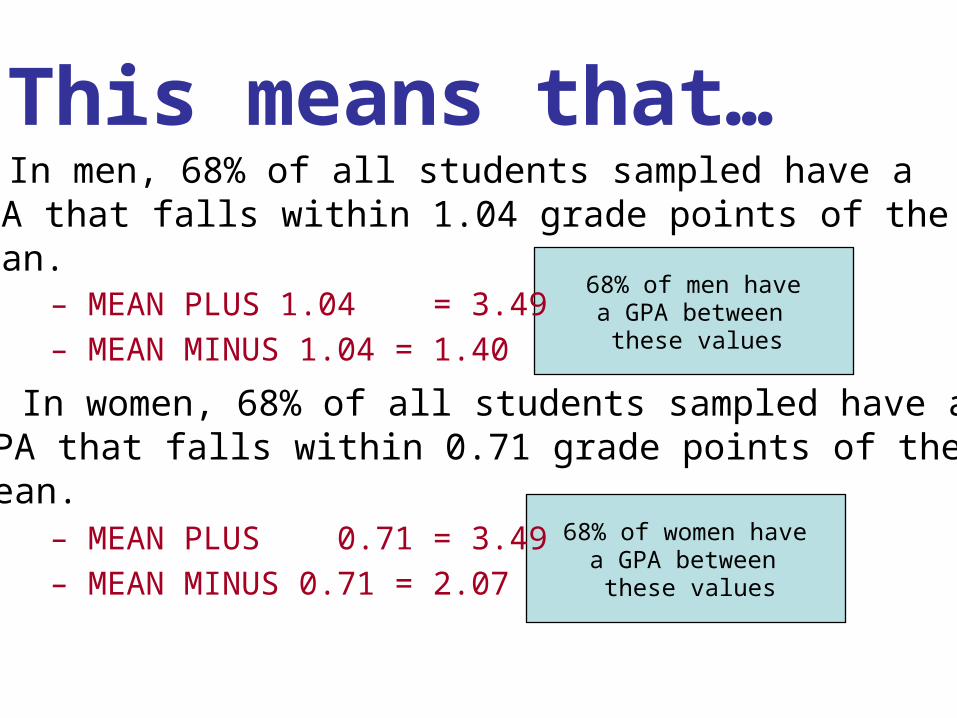
This means that…• In men, 68% of all students sampled have a
GPA that falls within 1.04 grade points of themean.
– MEAN PLUS 1.04 = 3.49
– MEAN MINUS 1.04 = 1.40
• In women, 68% of all students sampled have aGPA that falls within 0.71 grade points of themean.
– MEAN PLUS 0.71 = 3.49
– MEAN MINUS 0.71 = 2.07
68% of men havea GPA between
these values
68% of women havea GPA between
these values

GPA
3.002.502.001.501.000.500.00
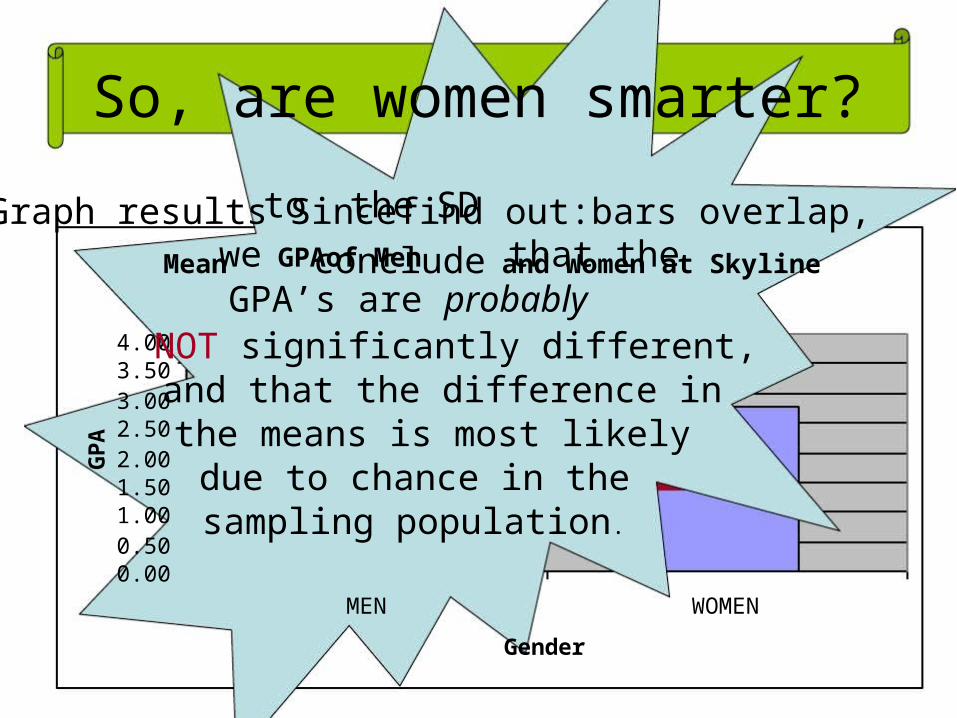
So, are women smarter?
Graph results to find out:
Mean GPAof Men and Women at Skyline
4.003.50
MEN WOMEN
+ / - 1 SD
MEAN GPA
Gender
GPA
4.003.503.002.502.001.501.000.500.00
MEN WOMEN
Gender
to the SDwe GPAof Men that the
So, are women smarter?
Graph results Sincefind out:bars overlap,Mean conclude and Women at Skyline
GPA’s are probablyNOT significantly different,and that the difference inthe means is most likely
due to chance in thesampling population.
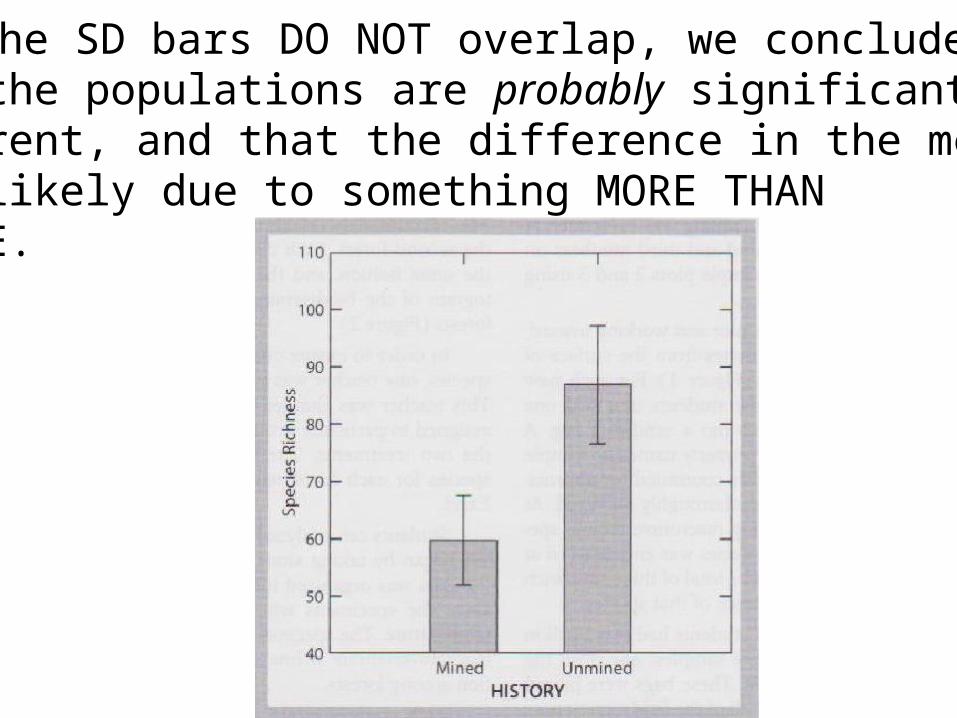
Since the SD bars DO NOT overlap, we concludethat the populations are probably significantlydifferent, and that the difference in the means ismost likely due to something MORE THANCHANCE.
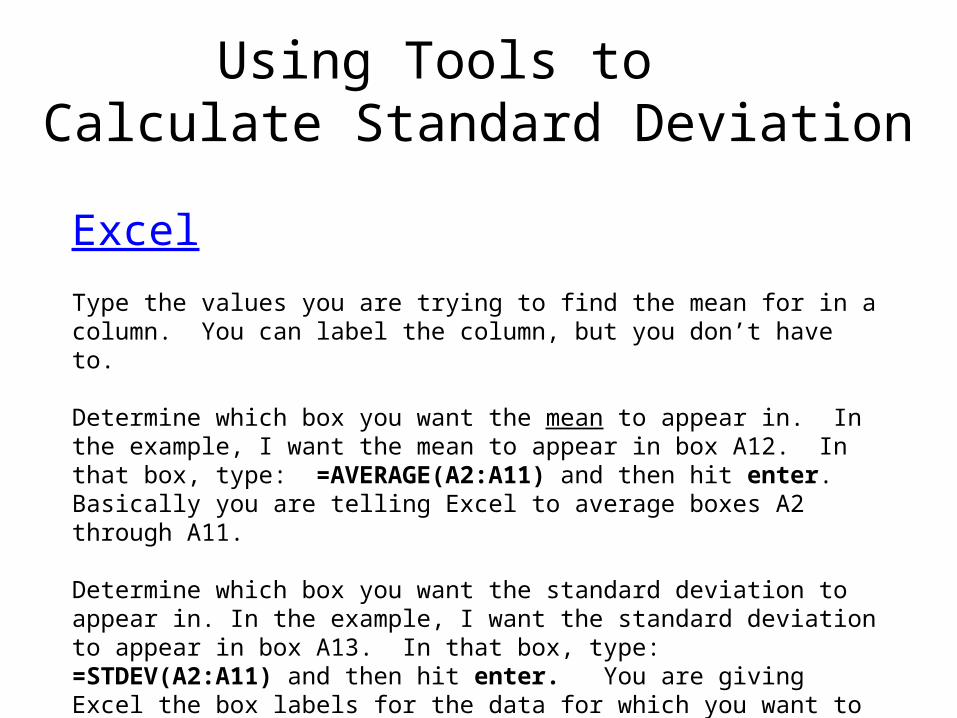
Using Tools toCalculate Standard Deviation
Excel
Type the values you are trying to find the mean for in a column. You can label the column, but you don’t have to. Determine which box you want the mean to appear in. In the example, I want the mean to appear in box A12. In that box, type: =AVERAGE(A2:A11) and then hit enter. Basically you are telling Excel to average boxes A2 through A11. Determine which box you want the standard deviation to appear in. In the example, I want the standard deviation to appear in box A13. In that box, type: =STDEV(A2:A11) and then hit enter. You are giving Excel the box labels for the data for which you want to find the standard deviation.
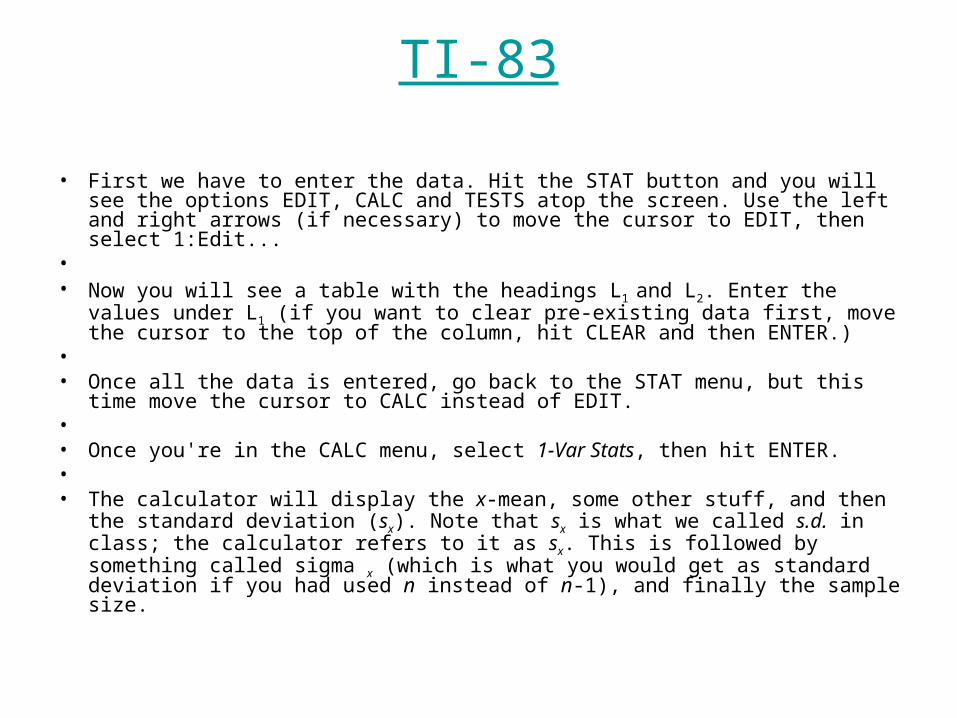
TI-83
• First we have to enter the data. Hit the STAT button and you will see the options EDIT, CALC and TESTS atop the screen. Use the left and right arrows (if necessary) to move the cursor to EDIT, then select 1:Edit...
• • Now you will see a table with the headings L1 and L2. Enter the values under L1 (if
you want to clear pre-existing data first, move the cursor to the top of the column, hit CLEAR and then ENTER.)
• • Once all the data is entered, go back to the STAT menu, but this time move the
cursor to CALC instead of EDIT. • • Once you're in the CALC menu, select 1-Var Stats, then hit ENTER. • • The calculator will display the x-mean, some other stuff, and then the standard
deviation (sx). Note that sx is what we called s.d. in class; the calculator refers to it as sx. This is followed by something called sigma x (which is what you would get as standard deviation if you had used n instead of n-1), and finally the sample size.