Embed Size (px)
Citation preview
LOGISTICS STRATEGY, ORGANIZATIONAL DESIGN, ANDPERFORMANCE IN A CROSS-BORDER ENVIRONMENT
THEODORE P. STANKDepartment of Marketing and Supply Chain Management, Michigan State University, N370 North Business Complex,
East Lansing, MI 48824, U.S.A.
and
PATRICK A. TRAICHALThe University of Texas at El Paso, TX, U.S.A.
(Received 11 September 1996; in revised form 26 August 1997; accepted 30 November 1997)
AbstractÐThe research presents an empirical test of a conceptual framework regarding the relationshipsbetween a ®rm's logistics strategy, the organizational design dimensions used to implement the strategy, andthe performance outcome experienced as a result of managers for manufacturing ®rms con®rms a relationshipbetween organizational design and performance. Additionally, the intermediary e�ects of integration on thisrelationship are con®rmed. The hypothesized relationship between strategic choice and organizational designwas not con®rmed. # 1998 Elsevier Science Ltd. All rights reserved
Keywords: logistics strategy, organizational design, logistics performance.
1. INTRODUCTION
The competitive pressures and resource constraints typical of today's business operating environ-ment have elevated logistics management to a strategic level within many ®rms. Logistical com-petencies that enhance customer service and decrease bottom-line costs are increasingly viewed byworld-class ®rms as cornerstones of business strategies aimed at achieving a sustainable advantageover competitors (Henko�, 1994; The Global Logistics Research Team at Michigan State Uni-versity, 1995; Harrington, 1996). Practitioners and academics, however, continue to search fora greater understanding of the logistics organizational dimensions that contribute to improvedperformance (Chow et al., 1995).
Research focusing on the relationships between logistics capabilities and performance assertsthat the design of a logistics organization must be consistent with a ®rm's logistics strategy toachieve performance goals. Organizational variables commonly associated with performanceinclude structural dimensions such as centralization, span of control, scope or specialization, for-malization, and integration, as well as contextual issues like ®rm size and the number of di�erentitems marketed by the organization (Chow et al., 1995; Daugherty et al., 1995).
The purpose of this research is to empirically test the relationships between a ®rm's logisticsstrategy, the organizational design dimensions used to implement the strategy, and the perfor-mance outcome experienced as a result of strategy and design. The model will be tested in aninternational setting using the population of twin-plant manufacturing ®rms, or maquiladoras, inCiudad (Cd.) Juarez, Mexico.
2. BACKGROUND
Both corporate executives and academicians have recognized the strategic value of logistics asone way to di�erentiate ®rms and establish sustainable competitive advantage by serving custo-mers better than competitors or at a lower price for the same service level (Henko�, 1994; The
Transpn Res.-E (Logistics and Transpn Rev.), Vol. 34, No. 1, pp. 75±86, 1998# 1998 Elsevier Science Ltd. All rights reserved
Pergamon Printed in Great Britain
PII: S1366-5545(97)00040-9
1366-5545/98 $19.00+0.00
75
Global Logistics Research Team at Michigan State University, 1995; Harrington, 1996). In com-petitive market environments, logistics functions emerge as critical elements in strategies designedto impact purchase/repurchase intentions. The ability to retain current customers and to recruitnew ones through logistics-provided service dimensions such as delivery reliability, timeliness,order accuracy, advance shipment noti®cation, and ¯exibility in responding to operational ordemand ¯uctuations has been linked to a ®rm's market share, ROI, and pro®tability (Innis and LaLonde, 1994; Morash et al., 1996; Langley et al., 1995).
Research has explored how logistics is used to achieve sustainable superiority over competitorsby consistently meeting customer expectations (Bowersox et al., 1989, 1992; The Global LogisticsResearch Team at Michigan State University, 1995; Morash et al., 1996). Critical logisticsfunctions that could translate into marketing and ®nancial leadership have been identi®ed. Char-acterizations of strategic logistics capabilities include demand-oriented functions such as pre- andpost-sale customer service, delivery speed, delivery reliability, and responsiveness to targetmarkets; as well as supply-oriented capabilities such as distribution coverage and cost (Morash etal., 1996). Competencies that comprise `world-class' logistics include positioning, the selection ofstrategic and structural approaches to guide logistical operations; integration, concerned withtechniques used in achieving internal logistical operating excellence and development of externalsupply chain relationships; agility, a measure of a ®rm's ability to determine and quickly respondto changing requirements; and measurement, the degree to which a ®rm monitors internal andexternal operations (The Global Logistics Research Team at Michigan State University, 1995).
While the link between logistics-based strategies and performance has been established, thecontinuously changing environment in which operations are conducted has led to uncertaintiesregarding the appropriate organizational design and structures to support such logistics e�orts.Firms emphasizing logistics periodically reorganize their logistics functions as they attempt to ®ndor maintain the best design in the rapidly changing business environment (Chow et al., 1995).Although organizational design is generally believed to be associated with performance, the pre-cise nature of the relationship remains unclear (Stank et al., 1994).
One approach to the logistics strategy±performance linkage considers logistical competenciesto be part of an organization's design (Chow et al., 1995; Daugherty et al., 1995; Stank et al.,1994). Of the four primary logistics competencies identi®ed in the World Class Logistics research,twoÐpositioning and integrationÐstrongly resemble structural components as identi®ed in theorganizational sciences literature. Research has also linked organizational dimensions such ascentralization, formalization, and specialization to performance in EDI technology adoption,logistics information system performance, third party warehouse performance, and logistics costs(Daugherty et al., 1992, 1995; Stank et al., 1994).
Among the logistics strategies pursued by managers to di�erentiate their ®rms from the com-petition, ¯exibility has proven to be particularly e�ective (Bowersox et al., 1992; Rayport andSviokla, 1995). While logistics value enhancements may be measured in many ways, e.g.improvements in lead-time or increased inventory turns, the desire to improve customer servicewhile decreasing costs often demands that ®rms seek ¯exibility in handling operational change andvolatile customer demand (Byrne and Javad, 1992; Mentzer and Firman, 1994). Strategic ¯ex-ibility entails the capability to encounter, resolve, and exploit emergent conditions that confrontoperations thus allowing managers to identify opportunities and to respond to them (Fisher et al.,1994; The Global Logistics Research Team at Michigan State University, 1995).
The ability to ¯exibly respond to emergent conditions may generate greater sustainable perfor-mance advantages than static planning dependent upon long-range forecasting (La Londe andMasters, 1994; Perry, 1991). As a result, initiatives developed to improve ¯exibility such as just-in-time (JIT), quick response, and e�cient consumer response have been found to increase customerloyalty and the prices customers are willing to pay (The Global Logistics Research Team atMichigan State University, 1995).
2.1. Logistics strategy on the U.S./Mexico borderThe issue of ¯exibility is particularly relevant to the manufacturing facilities established on the
northern borders of Mexico. Beginning in the 1960s, U.S. companies moved low value-added,labor intensive steps of their production processes to Mexican border cities to compete withEuropean and Japanese ®rms enjoying growth spurred by low production labor costs. Today, over
76 Theodore P. Stank and Patrick A. Traichal
2000 facilities, predominantly U.S. owned but increasingly international, operate along theMexico±U.S. border, employing nearly 550,000 workers. In 1992, the industry added nearly $5 billion invalue to product exported to U.S. markets (Cohen, 1994; Fawcett and Smith, 1995).
Early maquiladora facilities imported sub-components for assembly and shipment to U.S.domestic markets. Today, activities such as integrated manufacturing operations that combineassembly with design and fabrication are conducted at many facilities. They exist to take advan-tage of cheap labor, a favorable Mexican tax environment, and proximity to the U.S. (Cohen,1994). Gains from labor savings, however, are often obviated by increases in logistics costs asso-ciated with moving goods to, and across, the Mexican border (Davis, 1992). Thus, to compete withestablished U.S. facilities and other foreign manufacturing locations, maquiladoras must di�er-entiate themselves on other dimensions.
Many maquiladora ®rms have adopted JIT production scheduling to provide one such area ofdi�erentiation. Savings from shorter replenishment times and lower inventory levels associatedwith JIT allow maquiladora ®rms to compensate for the higher costs incurred by transportinggoods over the large distances between themselves and suppliers and customers, most of whom arelocated in the eastern and mid-western U.S. Such operations require a logistics infrastructure thatcan rapidly respond to the many challenges associated with operating across the Mexican border.Flexibility, therefore, emerges as a critical strategic initiative.
3. RESEARCH HYPOTHESES
Chow et al. (1995) review research centering on the relationships among strategy, design, andperformance, both in the organizational science literature as well as in logistics. They highlight®ndings in organizational science which maintain that performance depends on the extent of ®t oralignment between organizational design and strategic choice (Dalton et al., 1980; Galunic andEisenhardt, 1994; Miller, 1987). In logistics, much has been said about the nature and importanceof organizational features. Most research, however, has identi®ed the organizational design of®rms with top performance in various logistical areas, with little focus on the relationship betweenstrategic choice and organizational design (Bowersox et al., 1989; Daugherty et al., 1992, 1995;Stank et al., 1994).
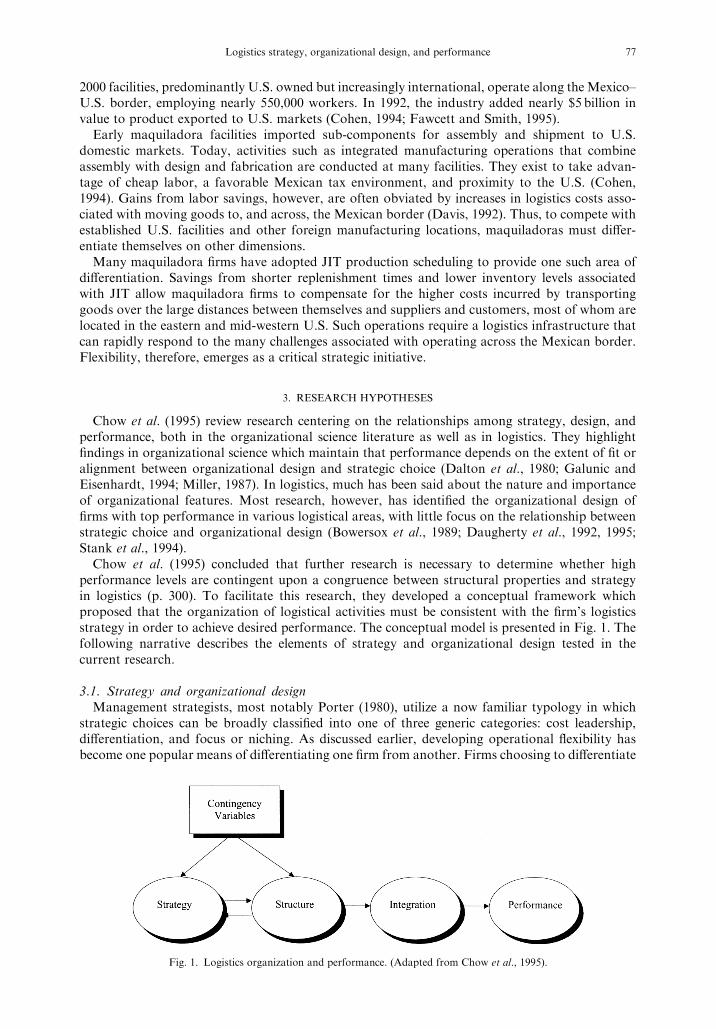
Chow et al. (1995) concluded that further research is necessary to determine whether highperformance levels are contingent upon a congruence between structural properties and strategyin logistics (p. 300). To facilitate this research, they developed a conceptual framework whichproposed that the organization of logistical activities must be consistent with the ®rm's logisticsstrategy in order to achieve desired performance. The conceptual model is presented in Fig. 1. Thefollowing narrative describes the elements of strategy and organizational design tested in thecurrent research.
3.1. Strategy and organizational designManagement strategists, most notably Porter (1980), utilize a now familiar typology in which
strategic choices can be broadly classi®ed into one of three generic categories: cost leadership,di�erentiation, and focus or niching. As discussed earlier, developing operational ¯exibility hasbecome one popular means of di�erentiating one ®rm from another. Firms choosing to di�erentiate
Fig. 1. Logistics organization and performance. (Adapted from Chow et al., 1995).
Logistics strategy, organizational design, and performance 77
using strategic ¯exibility develop the capability to rapidly encounter, resolve, and exploit emergentconditions rather than depend upon static, long-range forecasting (Perry, 1991; La Londe andMasters, 1994).
Three primary variables from the organizational theory literature have commonly been includedin logistics research investigating the relationship between organizational design and performance(Daugherty et al., 1992, 1995; Stank et al., 1994). These studies refer to design as an organization'sinternal pattern of relationships, authority, and communication (Frederickson, 1986; Daugherty etal., 1995). The variables often considered include (Daugherty et al., 1995):
CentralizationÐthe degree to which decision-making authority is delegated within the organi-zation (Dalton et al., 1980, p. 57).
FormalizationÐthe degree to which decisions and working relationships are governed by formalrules and standard policies and procedures (Walker and Ruekert, 1987, p. 27).
SpecializationÐthe division of tasks and activities across positions within the organization(Walker and Ruekert, 1987, p. 27).
Centralization of authority can result in better coordination between functional areas and gen-erally more proactive, opportunity-seeking behavior (Dalton et al., 1980; Frederickson, 1986).Centralization can help to ensure that strategic decisions are integrated and that organizationale�orts are focused in a common direction (Bowersox and Daugherty, 1995). Formalization pro-vides rules and procedures which routinize repetitive activities, clarify priorities, and eliminateambiguity (Pugh et al., 1968; Walker and Ruekert, 1987). Formalization allows managers to avoidcontinuously operating in a crisis mode, placing the organization in a better position to react tospecial requests in a highly ¯exible manner (Bowersox et al., 1992). Specialization encouragese�ciency and productivity, allowing employees to understand new ideas and tasks more easily.Specialization, however, mandates increased coordination of work ¯ow and activities, making itmore di�cult to respond to operational changes and contingencies (Hrebiniak, 1978).
Another type of characteristic considered important to the relationships among strategy,organizational design, and performance is organizational context (Daugherty et al., 1995; Inksonet al., 1970). Two types of contextual dimensions commonly examined are ®rm size and selling/production complexityÐthe number of di�erent items marketed by a ®rm. Size has been identi®edas an important element of an organization's context. Larger organizations bene®t from eco-nomies of scale. Increased size, however, accentuates problems associated with coordination andcommunication among di�erent functional areas or subunits, making it more di�cult for larger®rms to react and respond to emergent conditions.
Expanding product lines allows the ®rm to compete in additional market segments or to di�er-entiate by providing a greater range of choices to existing customers. Increasing selling/productioncomplexity, however, makes the task of coordinating and communicating among subunits moredi�cult. As complexity increases, the ability to ¯exibly respond to emergent conditions becomesremote (Hrebiniak, 1978).
The preceding discussion suggests the following hypotheses regarding the impact of strategicchoice on organizational design:
H1: Firm strategy impacts organizational design. Speci®cally:H1a: Strategic ¯exibility is positively related to centralization and formalization;H1b: Strategic ¯exibility is negatively related to specialization, ®rm size, and complexity.
3.2. Organizational design and performanceThe level of performance achieved in a particular area is posited to be the result of developing
an organizational design consistent with strategic goals. For ®rms pursuing strategic ¯exibility,performance should re¯ect the ability to routinely respond to change without incurring signi®cantcosts. In the logistics environment, this corresponds to reduction of overall inventory and indivi-dual SKUs, less warehouse storage space, information automation, lower volume coupled withmore frequent inbound and outbound deliveries, greater reliability, and reduced cycle and replen-ishment times. Based upon the previous discussion, the following re¯ect the hypothesized rela-tionship between organizational design characteristics and performance of a ¯exible system:
78 Theodore P. Stank and Patrick A. Traichal
H2: Organizational design impacts ®rm performance. Speci®cally:H2a: Centralization and formalization are positively related to ¯exibility;H2b: Specialization, ®rm size, and complexity are negatively related to ¯exibility.
3.3. Functional integrationOne key approach of logistics strategy has been to view operations as a system rather than a
series of loosely related activities. Integrating logistics by coordinating activities and improvingcommunications among managers allows a ®rm to minimize total distribution expenditures whileachieving target customer service levels (Novack et al., 1992; Chow et al., 1995; Gustin et al.,1995). Coordination and communication among di�erent functional units of a ®rm enhances theability of the organization to ¯exibly respond to change (Daugherty et al., 1995). Integrationinvolves interfaces between purchasing and procurement, materials management, production,transportation, distribution, sales, and marketing (Staude, 1987).
In the framework proposed by Chow et al. (1995), integration is treated as a product of, asopposed to a property of, organizational design. The ®t of the organizational design to the stra-tegic choice is enhanced by integration, enabling the ®rm to perform at higher levels. Integration,then, moderates the relationship between the other organizational design and ®rm performance.
H3: Functional integration moderates the relationship between organizational design andperformance.
4. METHOD
This section provides details regarding the choice of the sampling frame, survey design andadministration, measure development and puri®cation, and data analysis for hypothesis testing.
4.1. Sample designInterviews of managers from several functional departments of a large electronics ®rm in Cd.
Juarez, Mexico were conducted to enable the researchers to develop a better understanding ofmaquiladora logistics issues. These interviews, combined with the researchers' expertise accumu-lated from close work with other maquiladora ®rms, provided the basis for selection of relevant¯exibility measures from previous research on world class logistics (Bowersox et al., 1989, 1992;Wight,1993; Lambert and Stock, 1993; The Global Logistics Research Team at Michigan State University).
The ®nal questionnaire covered managers' perceptions of their ®rm's expertise in various pro-cesses and key demographic variables as well as performance information. Questionnaires weresent to materials managers at each of the 263 maquiladora facilities in Cd. Juarez (The CompleteTwin Plant Guide, 1995). Experience and the interviews suggested that materials managerspossessed the broadest knowledge of logistics issues ranging from procurement and delivery ofsubcomponents and raw materials to ®nished goods distribution.
Questionnaires were hand delivered and re-collected by a Mexican citizen employed by theresearchers. This method was chosen because knowledge of the Mexican culture and Spanish lan-guage is considered necessary to gain access to the maquiladora facilities and executives. Deliverywas not possible at 22 facilities. Fifty-one completed questionnaires were collected from theremaining 241 facilities, representing an overall response rate of 21 per cent.
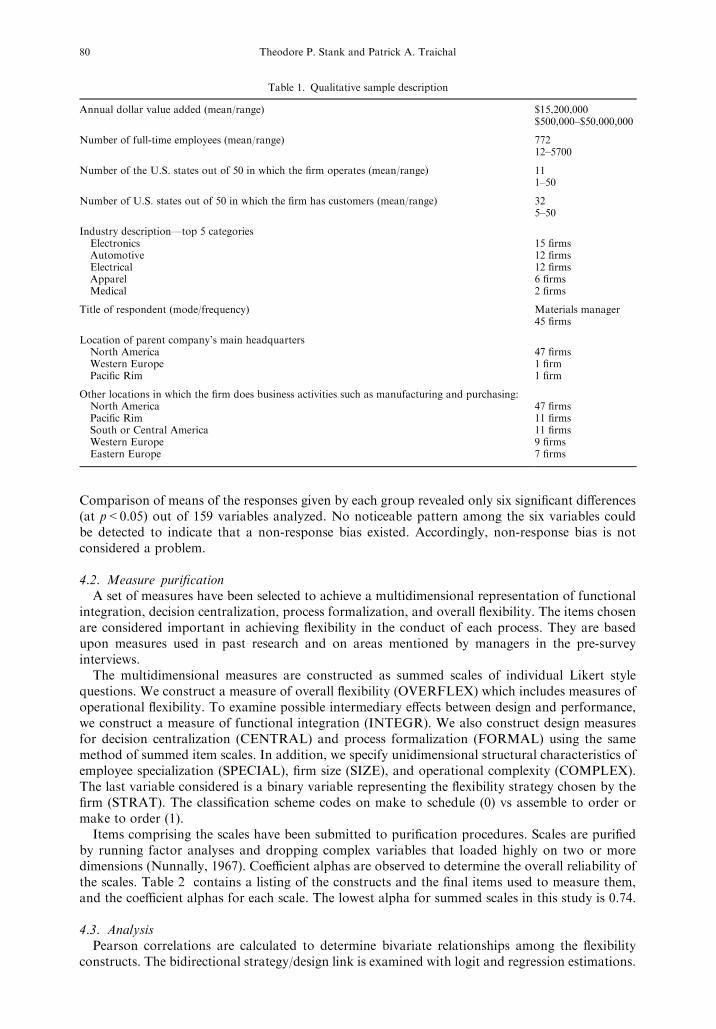
An examination of demographic variables reveals that managers employed by a diverse range ofcompanies completed the questionnaire. The size and industry distribution of the responding ®rmsprovide a close approximation of the population of maquiladoras operating in Cd. Juarez as wellas the maquiladora population in general (The Complete Twin Plant Guide, 1995). A signi®cantvariance in response to demographic variables, as well as to variables comprising the measurementscales for the constructs of interest, was observed. Accordingly, the sample is consideredrepresentative of the total population of maquiladoras. A summary of respondent characteristics ispresented in Table 1.
Non-response bias was estimated using procedures recommended by Armstrong and Overton(1977) and Lambert and Harrington (1990). The last quartile of respondents was assumed to be mostsimilar to non-respondents since their replies took the longest time and most e�ort to obtain. Theresponses given by the last quartile were compared with those provided by the ®rst three quartiles.
Logistics strategy, organizational design, and performance 79
Comparison of means of the responses given by each group revealed only six signi®cant di�erences(at p<0.05) out of 159 variables analyzed. No noticeable pattern among the six variables couldbe detected to indicate that a non-response bias existed. Accordingly, non-response bias is notconsidered a problem.
4.2. Measure puri®cationA set of measures have been selected to achieve a multidimensional representation of functional
integration, decision centralization, process formalization, and overall ¯exibility. The items chosenare considered important in achieving ¯exibility in the conduct of each process. They are basedupon measures used in past research and on areas mentioned by managers in the pre-surveyinterviews.
The multidimensional measures are constructed as summed scales of individual Likert stylequestions. We construct a measure of overall ¯exibility (OVERFLEX) which includes measures ofoperational ¯exibility. To examine possible intermediary e�ects between design and performance,we construct a measure of functional integration (INTEGR). We also construct design measuresfor decision centralization (CENTRAL) and process formalization (FORMAL) using the samemethod of summed item scales. In addition, we specify unidimensional structural characteristics ofemployee specialization (SPECIAL), ®rm size (SIZE), and operational complexity (COMPLEX).The last variable considered is a binary variable representing the ¯exibility strategy chosen by the®rm (STRAT). The classi®cation scheme codes on make to schedule (0) vs assemble to order ormake to order (1).
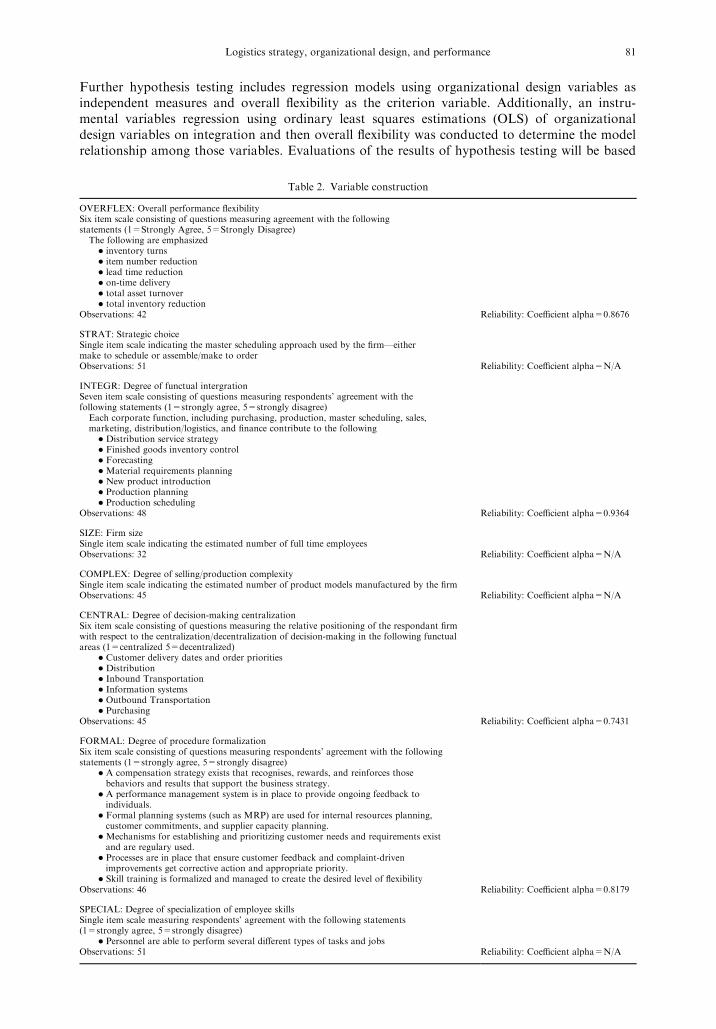
Items comprising the scales have been submitted to puri®cation procedures. Scales are puri®edby running factor analyses and dropping complex variables that loaded highly on two or moredimensions (Nunnally, 1967). Coe�cient alphas are observed to determine the overall reliability ofthe scales. Table 2 contains a listing of the constructs and the ®nal items used to measure them,and the coe�cient alphas for each scale. The lowest alpha for summed scales in this study is 0.74.
4.3. AnalysisPearson correlations are calculated to determine bivariate relationships among the ¯exibility
constructs. The bidirectional strategy/design link is examined with logit and regression estimations.
Table 1. Qualitative sample description
Annual dollar value added (mean/range) $15,200,000$500,000±$50,000,000
Number of full-time employees (mean/range) 77212±5700
Number of the U.S. states out of 50 in which the ®rm operates (mean/range) 111±50
Number of U.S. states out of 50 in which the ®rm has customers (mean/range) 325±50
Industry descriptionÐtop 5 categoriesElectronics 15 ®rmsAutomotive 12 ®rmsElectrical 12 ®rmsApparel 6 ®rmsMedical 2 ®rms
Title of respondent (mode/frequency) Materials manager45 ®rms
Location of parent company's main headquartersNorth America 47 ®rmsWestern Europe 1 ®rmPaci®c Rim 1 ®rm
Other locations in which the ®rm does business activities such as manufacturing and purchasing:North America 47 ®rmsPaci®c Rim 11 ®rmsSouth or Central America 11 ®rmsWestern Europe 9 ®rmsEastern Europe 7 ®rms
80 Theodore P. Stank and Patrick A. Traichal
Further hypothesis testing includes regression models using organizational design variables asindependent measures and overall ¯exibility as the criterion variable. Additionally, an instru-mental variables regression using ordinary least squares estimations (OLS) of organizationaldesign variables on integration and then overall ¯exibility was conducted to determine the modelrelationship among those variables. Evaluations of the results of hypothesis testing will be based
Table 2. Variable construction
OVERFLEX: Overall performance ¯exibilitySix item scale consisting of questions measuring agreement with the followingstatements (1=Strongly Agree, 5=Strongly Disagree)
The following are emphasized* inventory turns* item number reduction* lead time reduction* on-time delivery* total asset turnover* total inventory reduction
Observations: 42 Reliability: Coe�cient alpha=0.8676
STRAT: Strategic choiceSingle item scale indicating the master scheduling approach used by the ®rmÐeithermake to schedule or assemble/make to orderObservations: 51 Reliability: Coe�cient alpha=N/A
INTEGR: Degree of functual intergrationSeven item scale consisting of questions measuring respondents' agreement with thefollowing statements (1=strongly agree, 5=strongly disagree)
Each corporate function, including purchasing, production, master scheduling, sales,marketing, distribution/logistics, and ®nance contribute to the following
* Distribution service strategy* Finished goods inventory control* Forecasting* Material requirements planning* New product introduction* Production planning* Production scheduling
Observations: 48 Reliability: Coe�cient alpha=0.9364
SIZE: Firm sizeSingle item scale indicating the estimated number of full time employeesObservations: 32 Reliability: Coe�cient alpha=N/A
COMPLEX: Degree of selling/production complexitySingle item scale indicating the estimated number of product models manufactured by the ®rmObservations: 45 Reliability: Coe�cient alpha=N/A
CENTRAL: Degree of decision-making centralizationSix item scale consisting of questions measuring the relative positioning of the respondant ®rmwith respect to the centralization/decentralization of decision-making in the following functualareas (1=centralized 5=decentralized)
* Customer delivery dates and order priorities* Distribution* Inbound Transportation* Information systems* Outbound Transportation* Purchasing
Observations: 45 Reliability: Coe�cient alpha=0.7431
FORMAL: Degree of procedure formalizationSix item scale consisting of questions measuring respondents' agreement with the followingstatements (1=strongly agree, 5=strongly disagree)
* A compensation strategy exists that recognises, rewards, and reinforces thosebehaviors and results that support the business strategy.
* A performance management system is in place to provide ongoing feedback toindividuals.
* Formal planning systems (such as MRP) are used for internal resources planning,customer commitments, and supplier capacity planning.
* Mechanisms for establishing and prioritizing customer needs and requirements existand are regulary used.
* Processes are in place that ensure customer feedback and complaint-drivenimprovements get corrective action and appropriate priority.
* Skill training is formalized and managed to create the desired level of ¯exibilityObservations: 46 Reliability: Coe�cient alpha=0.8179
SPECIAL: Degree of specialization of employee skillsSingle item scale measuring respondents' agreement with the following statements(1=strongly agree, 5=strongly disagree)
* Personnel are able to perform several di�erent types of tasks and jobsObservations: 51 Reliability: Coe�cient alpha=N/A
Logistics strategy, organizational design, and performance 81
upon the overall robustness and ®t of the regressions models and the signi®cance of individualparameters.
5. RESULTS
Analysis provided strong support for three of the seven hypothesized links in the total model.Regression results provided partial evidence for the hypothesized relationships between organiza-tional design and performance (H2 and H2a). We also ®nd, based on an instrumental variablesapproach, that integration moderates organizational design and ®rm performance rather thanacting as a variable included in the set of organizational design variables (H3). The hypothesizedbidirectional relationship between ®rm strategy and organizational design variables was not sup-ported (H1, H1a, and H1b). The following narrative reviews the results of tests for all hypothe-sized relationships.
None of the respondents completed all items on the instrument. The lowest response rate for asingle item used in this study was about 63 per cent (32/51 on variable SIZE). Deleting obser-vations with missing values severely restricts the sample size and thus the power of statistical tests.We choose to replace missing values with the sample mean of nonmissing values to preserve thelargest sample available. Implicit in this choice is the assumption that the missing observationvalue resembles the remainder of the sample. As discussed previously, we did not ®nd evidence of anonresponse bias. The replacement of missing values with the mean introduces no bias in theestimation procedures while allowing the information in the rest of the observation to be used(however, this can a�ect the signi®cance test; this checked for later).
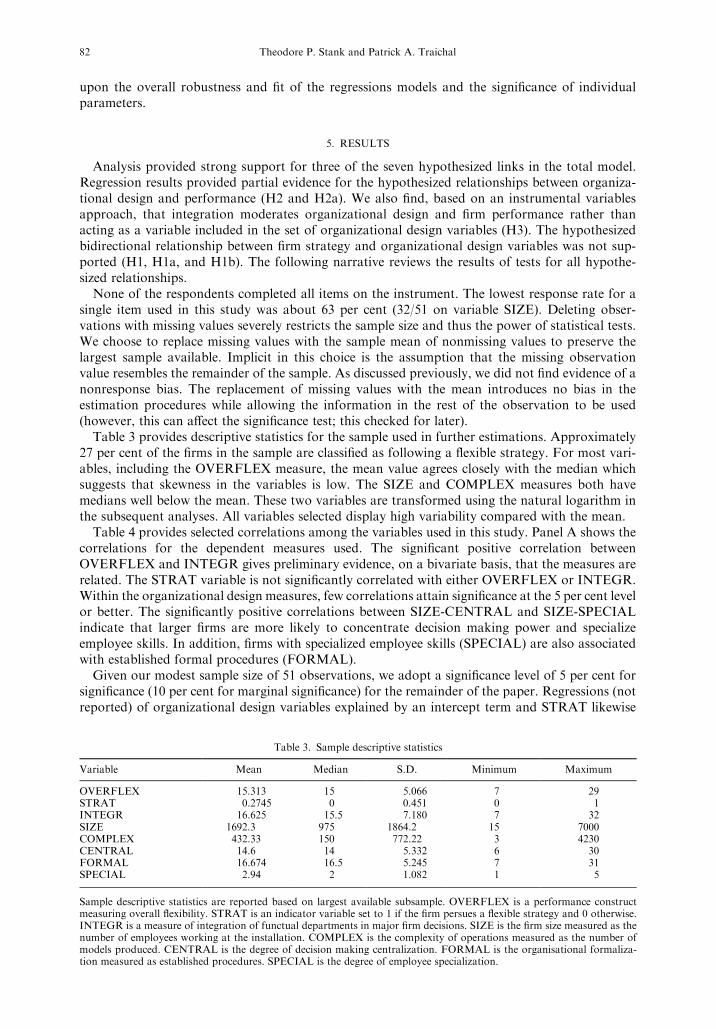
Table 3 provides descriptive statistics for the sample used in further estimations. Approximately27 per cent of the ®rms in the sample are classi®ed as following a ¯exible strategy. For most vari-ables, including the OVERFLEX measure, the mean value agrees closely with the median whichsuggests that skewness in the variables is low. The SIZE and COMPLEX measures both havemedians well below the mean. These two variables are transformed using the natural logarithm inthe subsequent analyses. All variables selected display high variability compared with the mean.
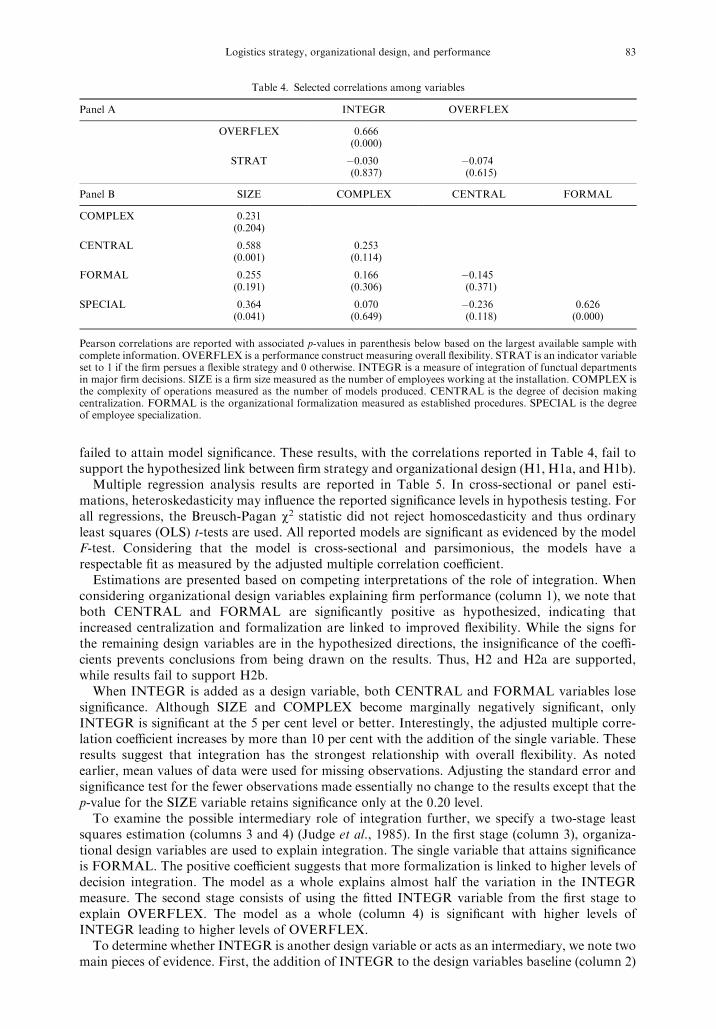
Table 4 provides selected correlations among the variables used in this study. Panel A shows thecorrelations for the dependent measures used. The signi®cant positive correlation betweenOVERFLEX and INTEGR gives preliminary evidence, on a bivariate basis, that the measures arerelated. The STRAT variable is not signi®cantly correlated with either OVERFLEX or INTEGR.Within the organizational design measures, few correlations attain signi®cance at the 5 per cent levelor better. The signi®cantly positive correlations between SIZE-CENTRAL and SIZE-SPECIALindicate that larger ®rms are more likely to concentrate decision making power and specializeemployee skills. In addition, ®rms with specialized employee skills (SPECIAL) are also associatedwith established formal procedures (FORMAL).
Given our modest sample size of 51 observations, we adopt a signi®cance level of 5 per cent forsigni®cance (10 per cent for marginal signi®cance) for the remainder of the paper. Regressions (notreported) of organizational design variables explained by an intercept term and STRAT likewise
Table 3. Sample descriptive statistics
Variable Mean Median S.D. Minimum Maximum
OVERFLEX 15.313 15 5.066 7 29STRAT 0.2745 0 0.451 0 1INTEGR 16.625 15.5 7.180 7 32SIZE 1692.3 975 1864.2 15 7000COMPLEX 432.33 150 772.22 3 4230CENTRAL 14.6 14 5.332 6 30FORMAL 16.674 16.5 5.245 7 31SPECIAL 2.94 2 1.082 1 5
Sample descriptive statistics are reported based on largest available subsample. OVERFLEX is a performance constructmeasuring overall ¯exibility. STRAT is an indicator variable set to 1 if the ®rm persues a ¯exible strategy and 0 otherwise.INTEGR is a measure of integration of functual departments in major ®rm decisions. SIZE is the ®rm size measured as thenumber of employees working at the installation. COMPLEX is the complexity of operations measured as the number ofmodels produced. CENTRAL is the degree of decision making centralization. FORMAL is the organisational formaliza-tion measured as established procedures. SPECIAL is the degree of employee specialization.
82 Theodore P. Stank and Patrick A. Traichal
failed to attain model signi®cance. These results, with the correlations reported in Table 4, fail tosupport the hypothesized link between ®rm strategy and organizational design (H1, H1a, and H1b).
Multiple regression analysis results are reported in Table 5. In cross-sectional or panel esti-mations, heteroskedasticity may in¯uence the reported signi®cance levels in hypothesis testing. Forall regressions, the Breusch-Pagan w2 statistic did not reject homoscedasticity and thus ordinaryleast squares (OLS) t-tests are used. All reported models are signi®cant as evidenced by the modelF-test. Considering that the model is cross-sectional and parsimonious, the models have arespectable ®t as measured by the adjusted multiple correlation coe�cient.
Estimations are presented based on competing interpretations of the role of integration. Whenconsidering organizational design variables explaining ®rm performance (column 1), we note thatboth CENTRAL and FORMAL are signi®cantly positive as hypothesized, indicating thatincreased centralization and formalization are linked to improved ¯exibility. While the signs forthe remaining design variables are in the hypothesized directions, the insigni®cance of the coe�-cients prevents conclusions from being drawn on the results. Thus, H2 and H2a are supported,while results fail to support H2b.
When INTEGR is added as a design variable, both CENTRAL and FORMAL variables losesigni®cance. Although SIZE and COMPLEX become marginally negatively signi®cant, onlyINTEGR is signi®cant at the 5 per cent level or better. Interestingly, the adjusted multiple corre-lation coe�cient increases by more than 10 per cent with the addition of the single variable. Theseresults suggest that integration has the strongest relationship with overall ¯exibility. As notedearlier, mean values of data were used for missing observations. Adjusting the standard error andsigni®cance test for the fewer observations made essentially no change to the results except that thep-value for the SIZE variable retains signi®cance only at the 0.20 level.
To examine the possible intermediary role of integration further, we specify a two-stage leastsquares estimation (columns 3 and 4) (Judge et al., 1985). In the ®rst stage (column 3), organiza-tional design variables are used to explain integration. The single variable that attains signi®canceis FORMAL. The positive coe�cient suggests that more formalization is linked to higher levels ofdecision integration. The model as a whole explains almost half the variation in the INTEGRmeasure. The second stage consists of using the ®tted INTEGR variable from the ®rst stage toexplain OVERFLEX. The model as a whole (column 4) is signi®cant with higher levels ofINTEGR leading to higher levels of OVERFLEX.
To determine whether INTEGR is another design variable or acts as an intermediary, we note twomain pieces of evidence. First, the addition of INTEGR to the design variables baseline (column 2)
Table 4. Selected correlations among variables
Panel A INTEGR OVERFLEX
OVERFLEX 0.666(0.000)
STRAT ÿ0.030 ÿ0.074(0.837) (0.615)
Panel B SIZE COMPLEX CENTRAL FORMAL
COMPLEX 0.231(0.204)
CENTRAL 0.588 0.253(0.001) (0.114)
FORMAL 0.255 0.166 ÿ0.145(0.191) (0.306) (0.371)
SPECIAL 0.364 0.070 ÿ0.236 0.626(0.041) (0.649) (0.118) (0.000)
Pearson correlations are reported with associated p-values in parenthesis below based on the largest available sample withcomplete information. OVERFLEX is a performance construct measuring overall ¯exibility. STRAT is an indicator variableset to 1 if the ®rm persues a ¯exible strategy and 0 otherwise. INTEGR is a measure of integration of functual departmentsin major ®rm decisions. SIZE is a ®rm size measured as the number of employees working at the installation. COMPLEX isthe complexity of operations measured as the number of models produced. CENTRAL is the degree of decision makingcentralization. FORMAL is the organizational formalization measured as established procedures. SPECIAL is the degreeof employee specialization.
Logistics strategy, organizational design, and performance 83
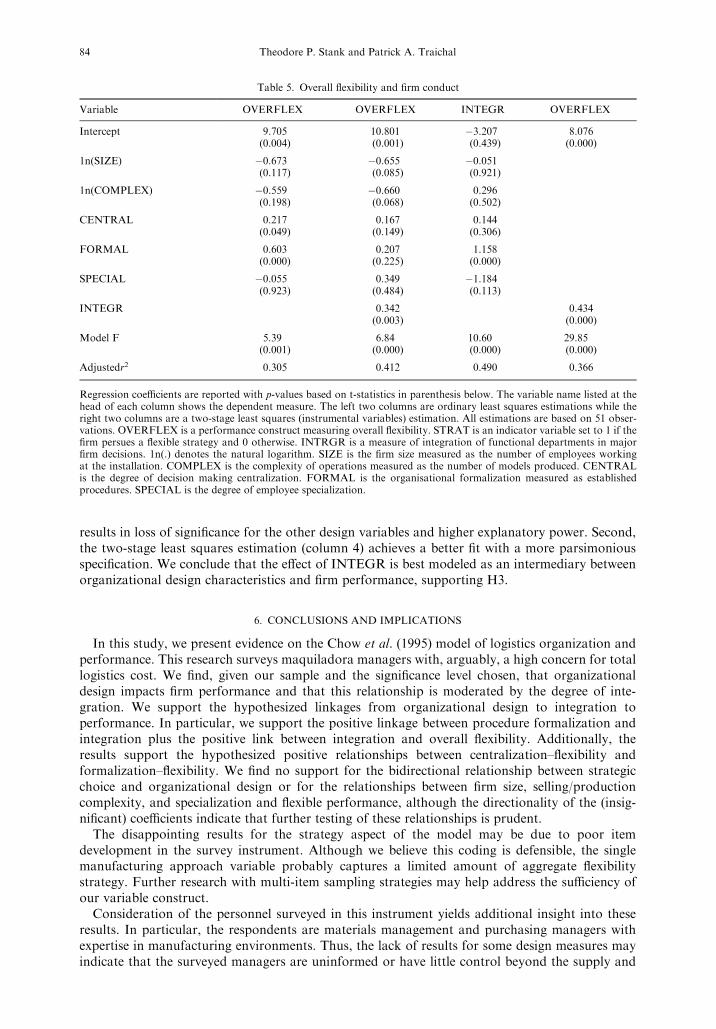
results in loss of signi®cance for the other design variables and higher explanatory power. Second,the two-stage least squares estimation (column 4) achieves a better ®t with a more parsimoniousspeci®cation. We conclude that the e�ect of INTEGR is best modeled as an intermediary betweenorganizational design characteristics and ®rm performance, supporting H3.
6. CONCLUSIONS AND IMPLICATIONS
In this study, we present evidence on the Chow et al. (1995) model of logistics organization andperformance. This research surveys maquiladora managers with, arguably, a high concern for totallogistics cost. We ®nd, given our sample and the signi®cance level chosen, that organizationaldesign impacts ®rm performance and that this relationship is moderated by the degree of inte-gration. We support the hypothesized linkages from organizational design to integration toperformance. In particular, we support the positive linkage between procedure formalization andintegration plus the positive link between integration and overall ¯exibility. Additionally, theresults support the hypothesized positive relationships between centralization±¯exibility andformalization±¯exibility. We ®nd no support for the bidirectional relationship between strategicchoice and organizational design or for the relationships between ®rm size, selling/productioncomplexity, and specialization and ¯exible performance, although the directionality of the (insig-ni®cant) coe�cients indicate that further testing of these relationships is prudent.
The disappointing results for the strategy aspect of the model may be due to poor itemdevelopment in the survey instrument. Although we believe this coding is defensible, the singlemanufacturing approach variable probably captures a limited amount of aggregate ¯exibilitystrategy. Further research with multi-item sampling strategies may help address the su�ciency ofour variable construct.
Consideration of the personnel surveyed in this instrument yields additional insight into theseresults. In particular, the respondents are materials management and purchasing managers withexpertise in manufacturing environments. Thus, the lack of results for some design measures mayindicate that the surveyed managers are uninformed or have little control beyond the supply and
Table 5. Overall ¯exibility and ®rm conduct
Variable OVERFLEX OVERFLEX INTEGR OVERFLEX
Intercept 9.705 10.801 ÿ3.207 8.076(0.004) (0.001) (0.439) (0.000)
1n(SIZE) ÿ0.673 ÿ0.655 ÿ0.051(0.117) (0.085) (0.921)
1n(COMPLEX) ÿ0.559 ÿ0.660 0.296(0.198) (0.068) (0.502)
CENTRAL 0.217 0.167 0.144(0.049) (0.149) (0.306)
FORMAL 0.603 0.207 1.158(0.000) (0.225) (0.000)
SPECIAL ÿ0.055 0.349 ÿ1.184(0.923) (0.484) (0.113)
INTEGR 0.342 0.434(0.003) (0.000)
Model F 5.39 6.84 10.60 29.85(0.001) (0.000) (0.000) (0.000)
Adjustedr2 0.305 0.412 0.490 0.366
Regression coe�cients are reported with p-values based on t-statistics in parenthesis below. The variable name listed at thehead of each column shows the dependent measure. The left two columns are ordinary least squares estimations while theright two columns are a two-stage least squares (instrumental variables) estimation. All estimations are based on 51 obser-vations. OVERFLEX is a performance construct measuring overall ¯exibility. STRAT is an indicator variable set to 1 if the®rm persues a ¯exible strategy and 0 otherwise. INTRGR is a measure of integration of functional departments in major®rm decisions. 1n(.) denotes the natural logarithm. SIZE is the ®rm size measured as the number of employees workingat the installation. COMPLEX is the complexity of operations measured as the number of models produced. CENTRALis the degree of decision making centralization. FORMAL is the organisational formalization measured as establishedprocedures. SPECIAL is the degree of employee specialization.
84 Theodore P. Stank and Patrick A. Traichal
manufacturing area, i.e. the outbound side of the supply chain. However, this interpretation alsosuggests that materials managers may need to become more involved with the marketing functionto achieve total supply chain integration.
Several important implications may be drawn from the research. First, and perhaps most sig-ni®cantly, the research supports the Chow et al. (1995) conceptual framework. This research takesan important further step down the path toward theory-building in logistics. In an internationalcontext where ¯exibility is a popular means of building competitive di�erentiation, the resultsshow that organizational design has a positive impact on performance. Further, integration isshown to behave as an intermediary to the organizational design±performance relationship ratherthan as a design element.
While the results have strong implications for managers of maquiladora ®rms, the relationshipsamong the variables included in the study are generalizable to any ®rm seeking to improve com-petitive position through enhanced ¯exibility and responsiveness. From a managerial perspective,the research provides further support for the importance of organizational design elements. Wehave shown that in this particular context, the design of the logistics organization can e�ect per-formance results. This result gains strength when planning and design is integrated across func-tional areas to encourage coordinated decision-making and communications. Top-level businessexecutives, as well as functional logistics and operations managers, may use the results to improvethe implementation of strategic planning decisions and network design. For example, generalmanagers choosing to di�erentiate from competitors through strategic ¯exibility must do morethan institute JIT production scheduling on the shop ¯oor. They must also consider the design ofthe logistics and procurement organization to complement the changes being made in production.
The results show that performance improvements result from broad-based changes initiated attop levels of the ®rm. The infrastructure realignment suggested by the results of this researchrequires a signi®cant commitment of time and ®nancial resources to a�ect performance enhance-ment. Short term `band-aid' ®xes at the individual functional level will not be su�cient to addressthe scope or scale of change required to impact performance. Centralization and formalization ofactivities within any one functional area may reduce costs and/or increase service levels deliveredby that one area, but will probably not yield bene®ts signi®cant enough to impact performance atthe ®rm or divisional level. Change must be more comprehensive in nature, encompassing multiplefunctional areas that are critical to managing and controlling the ¯ow of goods, information, andcash into, through and out of the organization. The results of this research show that centralizeddecision-making and comprehensive procedures governing standard practices must be integratedacross the full range of functional areas and organizational entities involved in procuring, produ-cing, marketing, selling, and distributing a product. In this scenario, the management team ispositioned to `pull together' rather than `pull apart.'
The relaxation of ownership laws in Mexico associated with the passage of the NAFTA hasexpanded growth of maquiladora usage, including development in the interior of Mexico. Futureresearch should examine the observed relationships in maquiladoras along the entire Mexican/U.S. border as well as in the interior. Additionally, di�erences among industries represented in themaquiladora population should be investigated.
AcknowledgementsÐThe authors would like to thank Charles W. Lackey, Jr, Associate Professor of OperationsManagement and Economics, The University of Texas at Brownsville, for his assistance with data collection.
REFERENCES
Armstrong, J. and Overton, T. S. (1977) Estimating non-response bias in mail surveys. Journal of Marketing Research 14(3),396±402.
Bowersox, D. J. and Daugherty, P. J. (1995) Logistics paradigms: the impact of information technology. Journal of BusinessLogistics 16(1), 65±80.
Bowersox, D. J., Daugherty, P. J., DroÈ ge, C. L., Rogers, D. S. and Wardlow, D. L. (1989) Leading Edge Logistics: Com-petitive Positioning for the 1990's. The Council of Logistics Management, Oak Brook, IL.
Bowersox, D. J., Daugherty, P. J., DroÈ ge, C. L., Germain, R. N. and Rogers, D. S. (1992) Logistical Excellence: It's NotBusiness as Usual. Digital Press, Burlington, MA.
Byrne, S. M. and Javad, S. (1992) Integrated logistics information systems (ILIS): competitive advantage or increased cost?Annual Conference Proceedings, pp. 337±355. The Council of Logistics Managment, Oak Brook, IL.
Chow, G., Heaver, T. D. and Henriksson, L. E. (1995) Strategy, structure, and performance: a framework for logisticsresearch. The Logistics and Transportation Review 31(4), 285±308.
Logistics strategy, organizational design, and performance 85
Cohen, J. A. (1994) The rise of the maquiladoras. Business Mexico (special issue), 54±58.Dalton, D. R., Todor, W. D., Spendolini, M. J., Fielding, G. J. and Porter, L. W. (1980) Organization structure and per-
formance: a critical review. Academy of Management Review 5(1), 49±64.Daugherty, P. J., Stank, T. P. and Rogers, D. S. (1992) The impact of formalization on warehousing ®rms. The Interna-
tional Journal of Logistics Management 3(2), 49±61.Daugherty, P. J., Germain, R. N. and DroÈ ge, C. L. (1995) Predicting EDI technology adoption in logistics management.
The Logistics and Transportation Review 31(4), 309±324.Davis, E. W. (1992) Global outsourcing: have U.S. managers thrown out the baby with the bath water? Business Horizons
35(4), 58±65.Fawcett, S. E. and Smith, S. R. (1995) Logistics measurement and performance for United States±Mexican operations
under NAFTA. Transportation Journal 34(3), 25±34.Fisher, M. L., Hammond, J. H., Obermeyer, W. R. and Raman, A. (1994) Making supply meet demand in an uncertain
world. Harvard Business Review 72(3), 83±93.Fredrickson, J. W. (1986) The strategic decision process and organizational structure. Academy of Management Review
11(2), 280±297.Galunic, D. C. and Eisenhardt, K. M. (1994) Renewing the strategy±structure±performance paradigm. Research in Orga-
nizational Behavior 16, 215±255.Gustin, C. M., Daugherty, P. J. and Stank, T. P. (1995) The e�ects of information availability on logistics integration.
Journal of Business Logistics 16(1), 1±22.Harrington, L. H. (1996) Logistics for pro®t. Fortune 133(6), 136.Henko�, R. (1994) Delivering the goods. Fortune 130(11), 64±78.Hrebiniak, L. G. (1978) Complex Organizations, West Publishing, St. Paul, MN.Inkson, J. H., Pugh, D. S. and Hickson, D. J. (1970) Organization context and structure: an abbreviated replication.
Administrative Science Quarterly 15, 318±329.Innis, D. E. and La Londe, B. J. (1994) Customer service: the key to customer satisfaction, customer loyalty, and market
share. Journal of Business Logistics 15(1), 1±28.Judge, G., Gri�ths, W., Hill, R., Lutkepohl, H. and Lee, T. (1985) The Theory and Practice of Econometrics, 2nd. edn. John
Wiley and Sons, New York.La Londe, B. J. and Masters, J. M. (1994) Emerging logistics strategies: blueprints for the next century. International
Journal of Physical Distribution and Logistics Management 24(7), 35±48.Lambert, D. M. and Stock, J. R. (1993) Strategic Logistics Management, 3rd edn. Richard D. Irwin, Homewood, IL.Lambert, D. M. and Harrington, T. C. (1990) Measuring nonresponse bias in customer service mail surveys. Journal of
Business Logistics 11(2), 5±25.Langley, C. J., Jr, Novack, R. A. and Rinehart, L. M. (1995) Creating Logistics Value: Themes for the Future. Council of
Logistics Management, Oak Brook, IL.Mentzer, J. T. and Firman, J. (1994) Logistics control systems in the 21st century. Journal of Business Logistics 15(1), 215±
227.Miller, D. (1987) Strategy making and structure: analysis and implications for performance. Academy of Management
Journal 30(1), 7±32.Morash, E. A., DroÈ ge, C. L. M. and Vickery, S. K. (1996) Strategic logistics capabilities for competitive advantage. Journal
of Business Logistics 17(1), 1±22.Novack, R. A., Rinehart, L. M. and Wells, M. V. (1992) Rethinking concept foundations in logistics management. Journal
of Business Logistics 13(2), 233±267.Nunnally, J. C. (1967) Psychometric Theory. McGraw-Hill, New York.Perry, J. H. (1991) Emerging economic and technological futures: implications for design and management of logistics
systems in the 1990's. Journal of Business Logistics 12(2), 1±16.Porter, M. E. (1980) Competitive Strategy: Techniques for Analyzing Industries and Competitors. The Free Press, New York.Pugh, D. S., Hickson, D. J., Hinings, C. R. and Turner, C. (1968) Dimensions of organizational structure. Administrative
Science Quarterly 13, 65±105.Rayport, J. F. and Sviokla, J. J. (1995) Exploiting the virtual value chain. Harvard Business Review 73(6), 75±85.Stank, T. P., Daugherty, P. J. and Gustin, C. M. (1994) Organizational structure: in¯uence on logistics integration, costs,
and information system performance. The International Journal of Logistics Management 5(2), 41±52.Staude, G. E. (1987) The physical distribution concept as a philosophy of business. International Journal of Physical Dis-
tribution and Materials Management 17(6), 32±37.The Complete Twin Plant Guide (1995). Solunet, Inc., El Paso, TX.The Global Logistics Research Team at Michigan State University (1995) World Class Logistics. Council of Logistics
Management, Oak Brook, IL.Walker, O. C., Jr and Ruekert, R. W. (1987) Marketing's role in the implementation of business strategies: a critical review
and conceptual framework. Journal of Marketing 51(3), 15±33.Wight, O. (1993) The Oliver Wight ABCD Checklist for Operational Excellence, 4th edn., Oliver Wight, Essex Junction, VT.
86 Theodore P. Stank and Patrick A. Traichal