Embed Size (px)
Citation preview
Statistics and Data for Marketing
Data Library, Rutherford North 1st FloorChuck Humphrey Data Library October 27, 2008
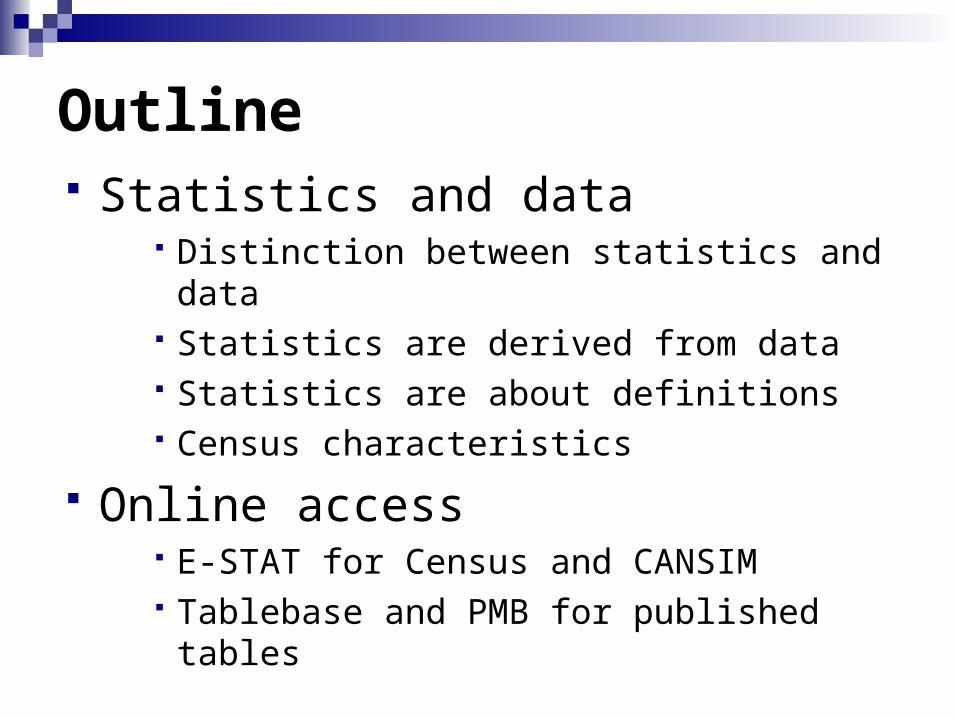
Outline Statistics and data
Distinction between statistics and data Statistics are derived from data Statistics are about definitions Census characteristics
Online access E-STAT for Census and CANSIM Tablebase and PMB for published tables
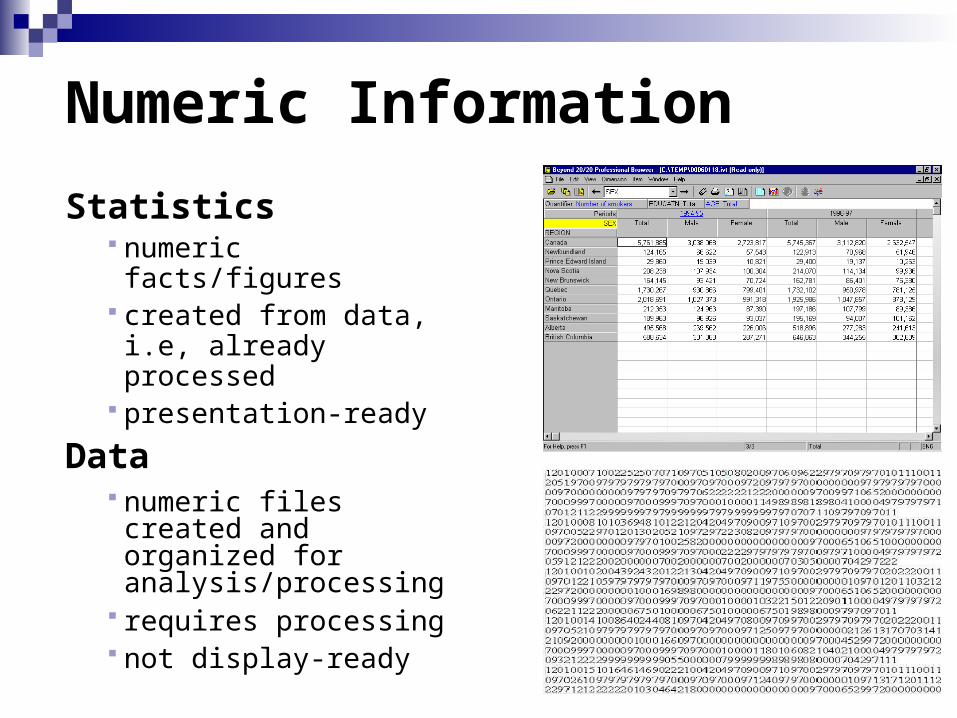
Numeric Information
Statistics numeric facts/figures created from data, i.e,
already processed presentation-ready
Data numeric files created
and organized for analysis/processing
requires processing not display-ready
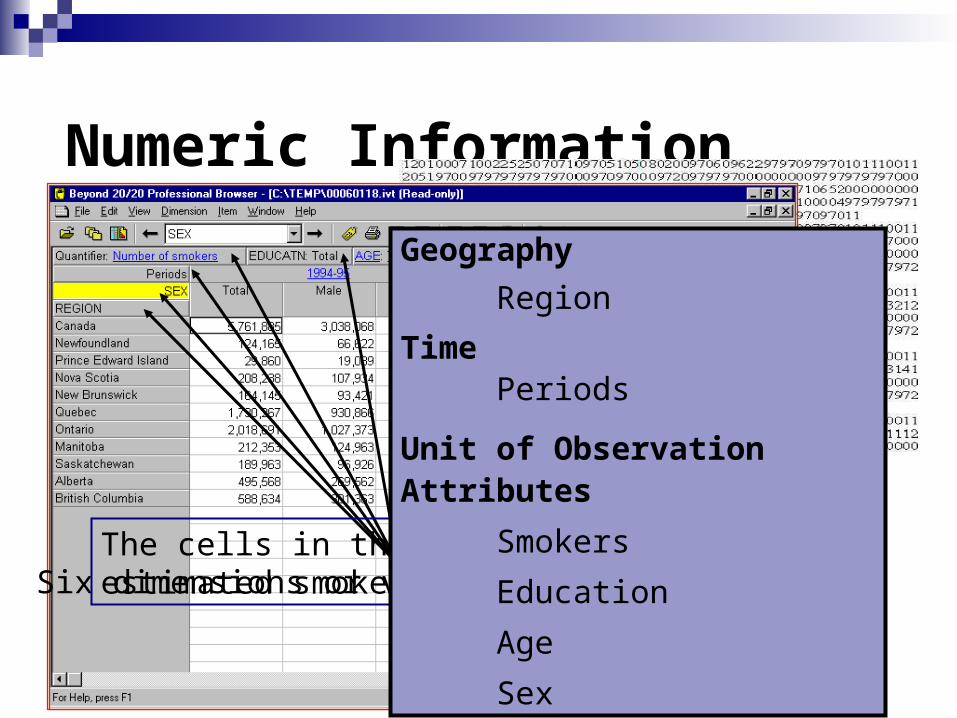
Numeric Information
Six dimensions or variables in this tableThe cells in the table are the number ofestimated smokers.
Geography
Region
TimePeriods
Unit of Observation Attributes
Smokers
Education
Age
Sex
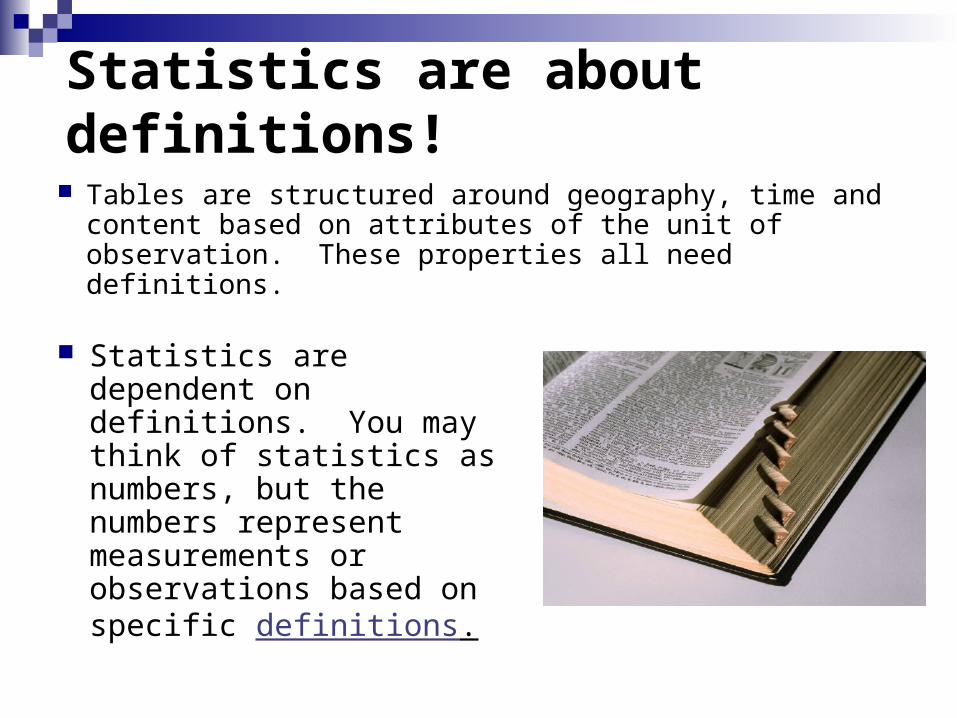
Statistics are about definitions!
Statistics are dependent on definitions. You may think of statistics as numbers, but the numbers represent measurements or observations based on specific definitions.
Tables are structured around geography, time and content based on attributes of the unit of observation. These properties all need definitions.
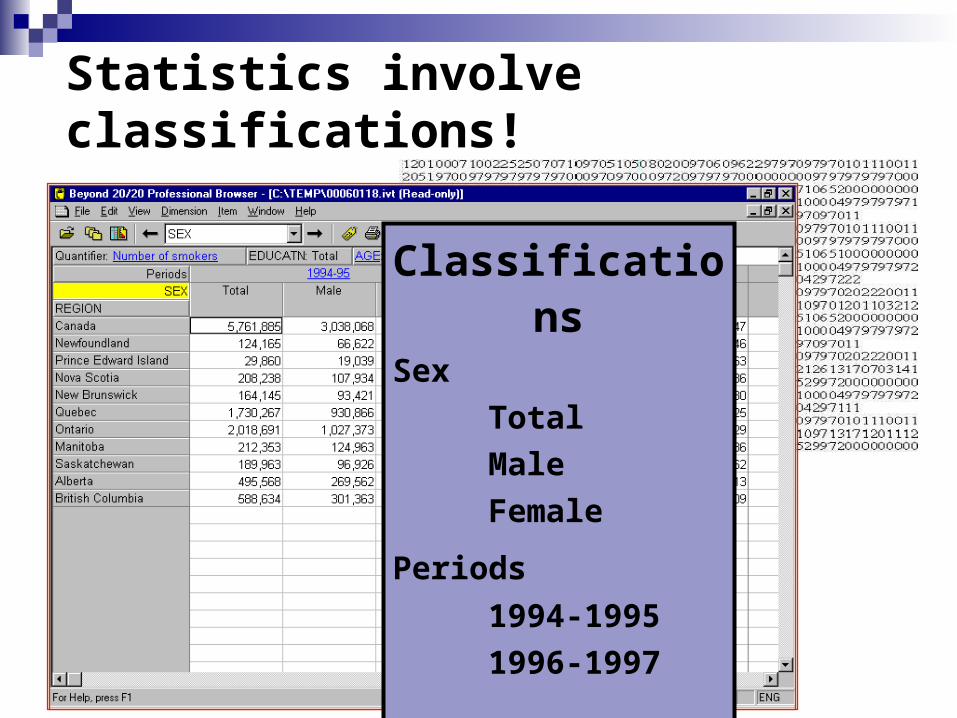
Statistics involve classifications!
ClassificationsSex
Total
Male
Female
Periods
1994-1995
1996-1997
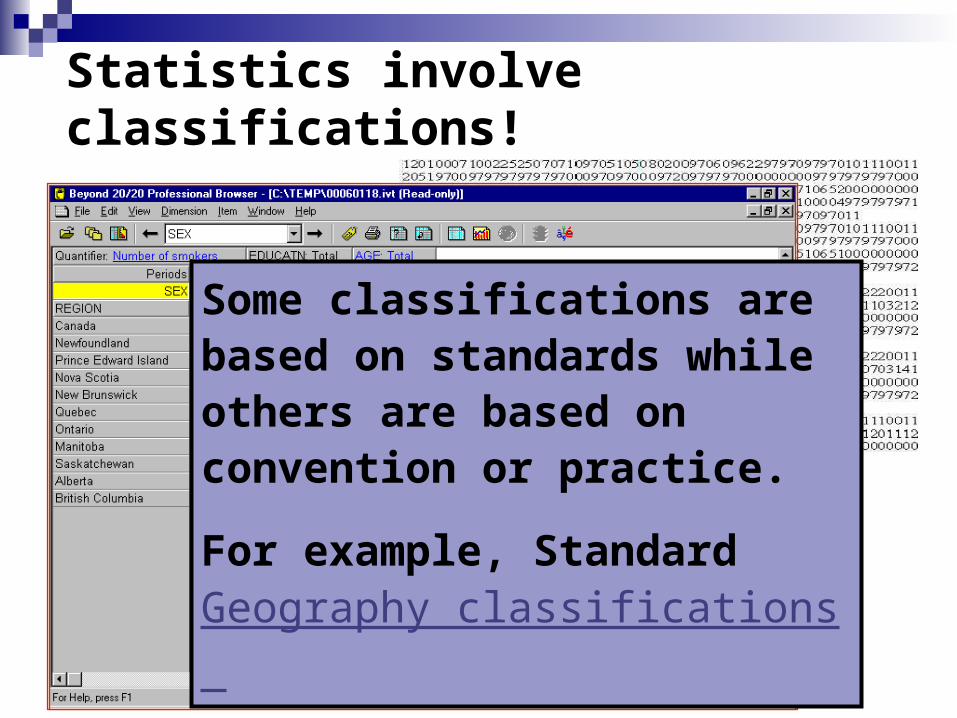
Some classifications are based on standards while others are based on convention or practice.
For example, Standard Geography classifications
Statistics involve classifications!
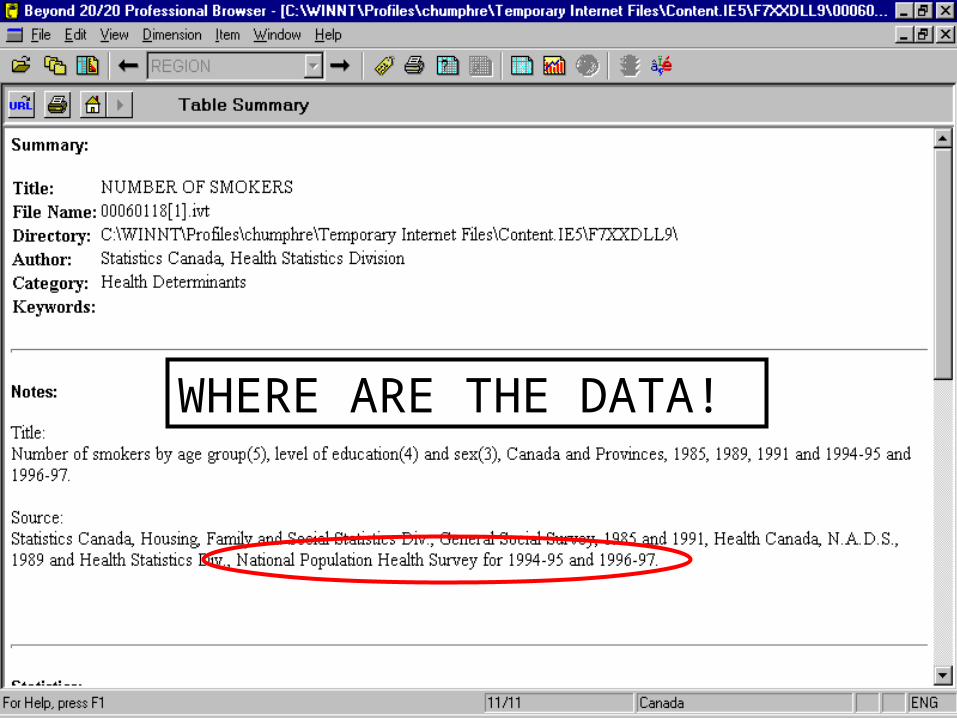
WHERE ARE THE DATA!
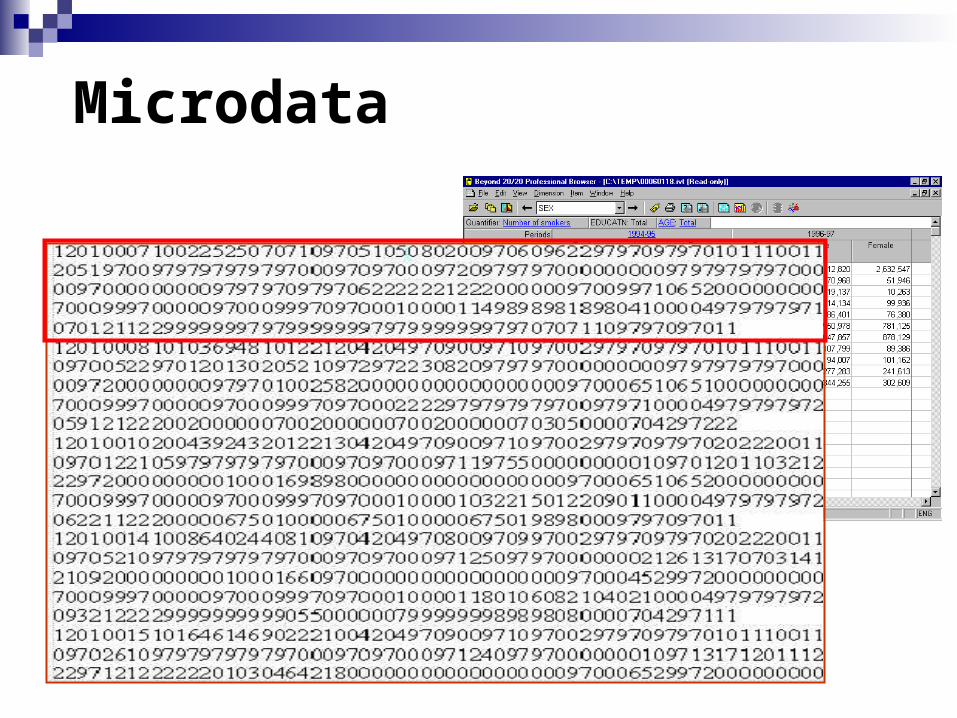
Microdata
Stories are told through statistics
The National Population Survey had over 80,000 respondents in 1996-97 sample and the Canadian Community Health Survey in 2005 had over 130,000 respondents. How do we tell the stories about these people?
We use statistics to create summaries of these life experiences.
Data enable us to construct the tables or analyses to tell these summarized stories.
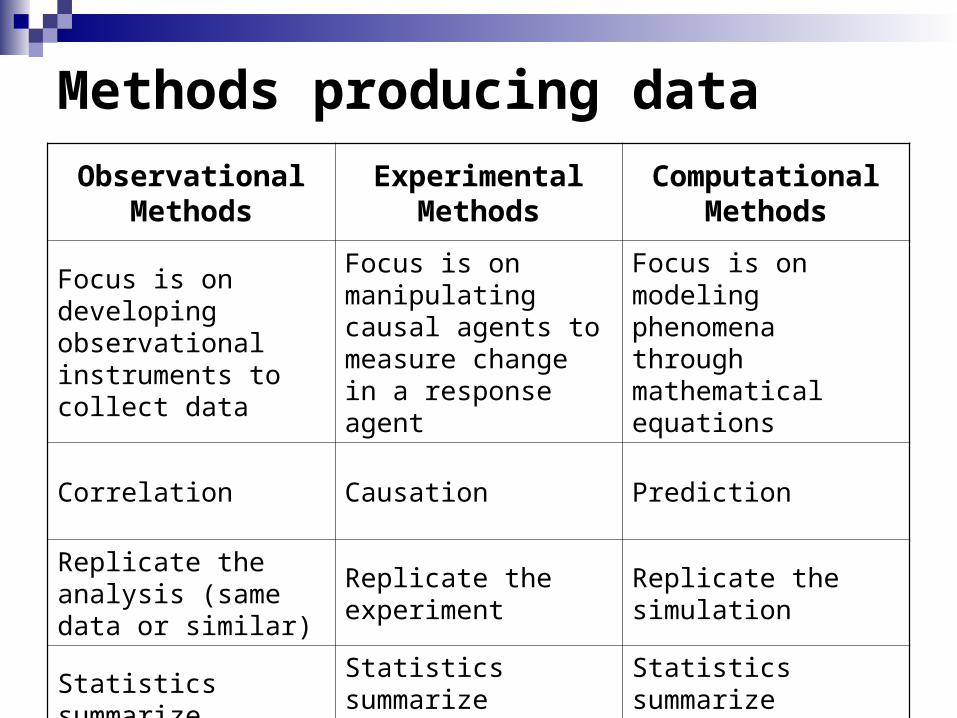
Methods producing data
Observational Methods
Experimental Methods
Computational Methods
Focus is on developing observational instruments to collect data
Focus is on manipulating causal agents to measure change in a response agent
Focus is on modeling phenomena through mathematical equations
Correlation Causation Prediction
Replicate the analysis (same data or similar)
Replicate the experiment
Replicate the simulation
Statistics summarize observations
Statistics summarize experiment results
Statistics summarize simulation results
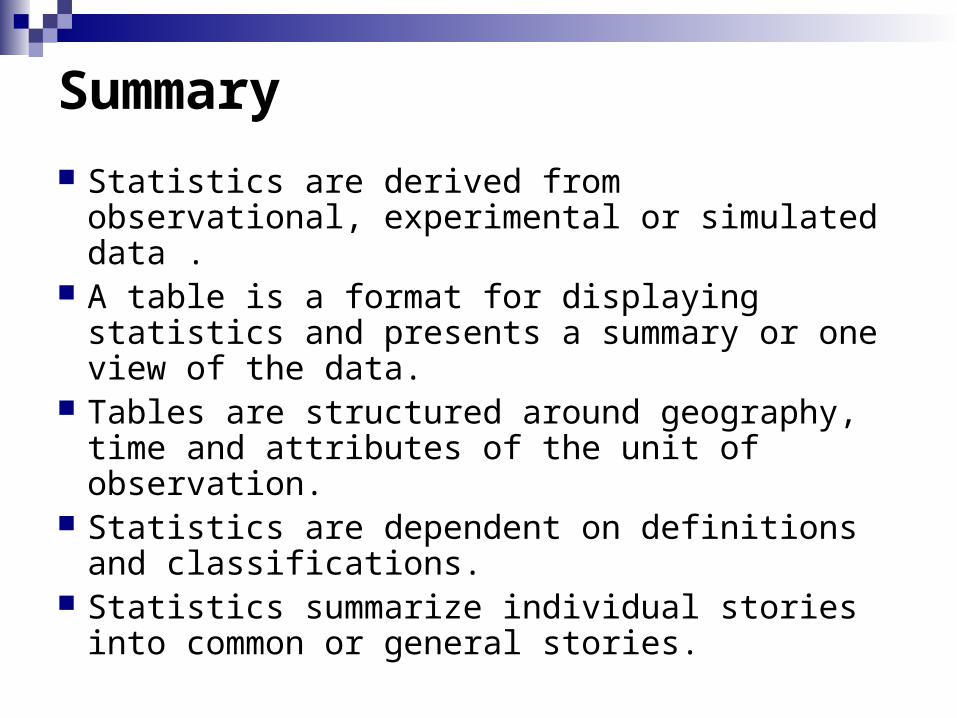
Summary
Statistics are derived from observational, experimental or simulated data .
A table is a format for displaying statistics and presents a summary or one view of the data.
Tables are structured around geography, time and attributes of the unit of observation.
Statistics are dependent on definitions and classifications.
Statistics summarize individual stories into common or general stories.
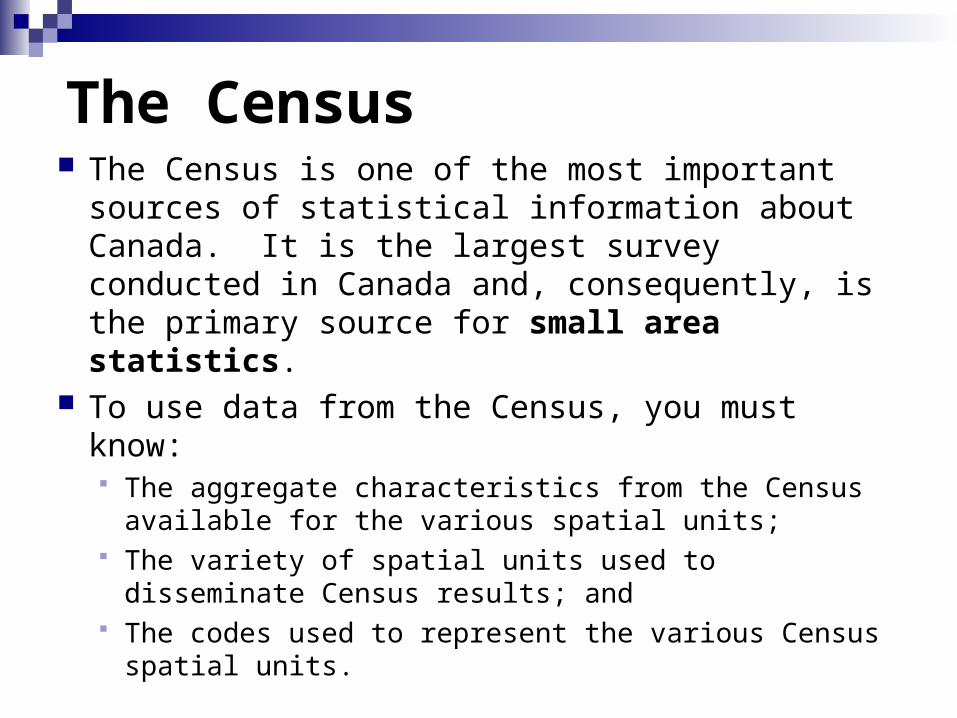
The Census The Census is one of the most important sources
of statistical information about Canada. It is the largest survey conducted in Canada and, consequently, is the primary source for small area statistics.
To use data from the Census, you must know: The aggregate characteristics from the Census
available for the various spatial units; The variety of spatial units used to disseminate
Census results; and The codes used to represent the various Census
spatial units.
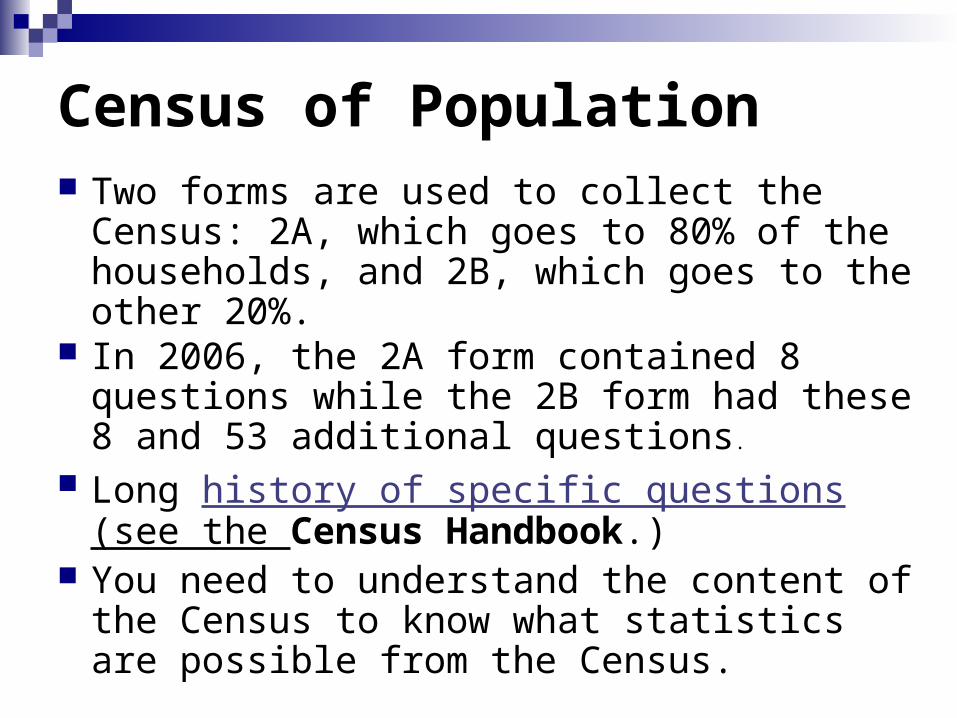
Census of Population Two forms are used to collect the Census: 2A,
which goes to 80% of the households, and 2B, which goes to the other 20%.
In 2006, the 2A form contained 8 questions while the 2B form had these 8 and 53 additional questions.
Long history of specific questions (see the Census Handbook.)
You need to understand the content of the Census to know what statistics are possible from the Census.
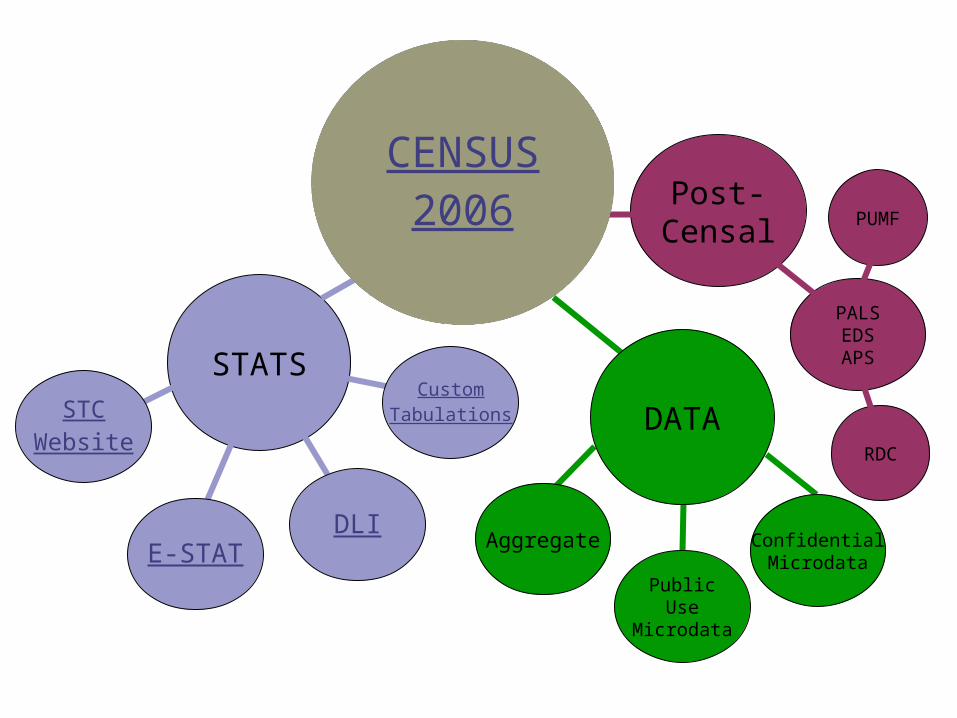
Post-Censal
PALSEDSAPS
PUMF
RDC
STATSSTC
Website
E-STAT
CustomTabulations
DLI
CENSUS2006
DATA
PublicUse
Microdata
Aggregate ConfidentialMicrodata
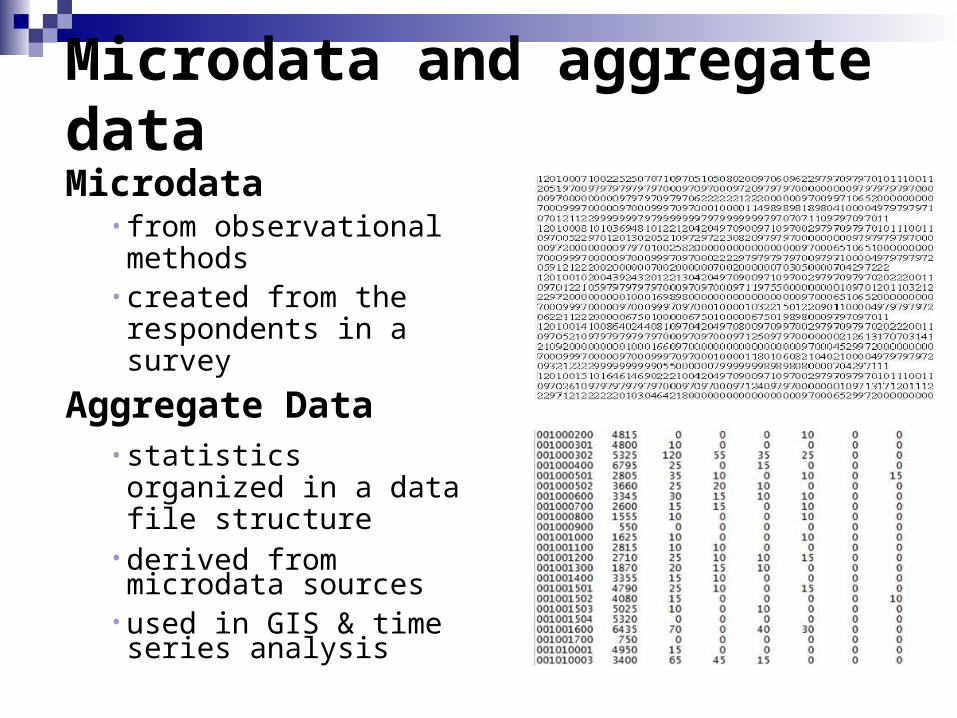
Microdata and aggregate data
Microdata• from observational
methods• created from the
respondents in a survey
Aggregate Data• statistics organized in a
data file structure• derived from microdata
sources• used in GIS & time
series analysis
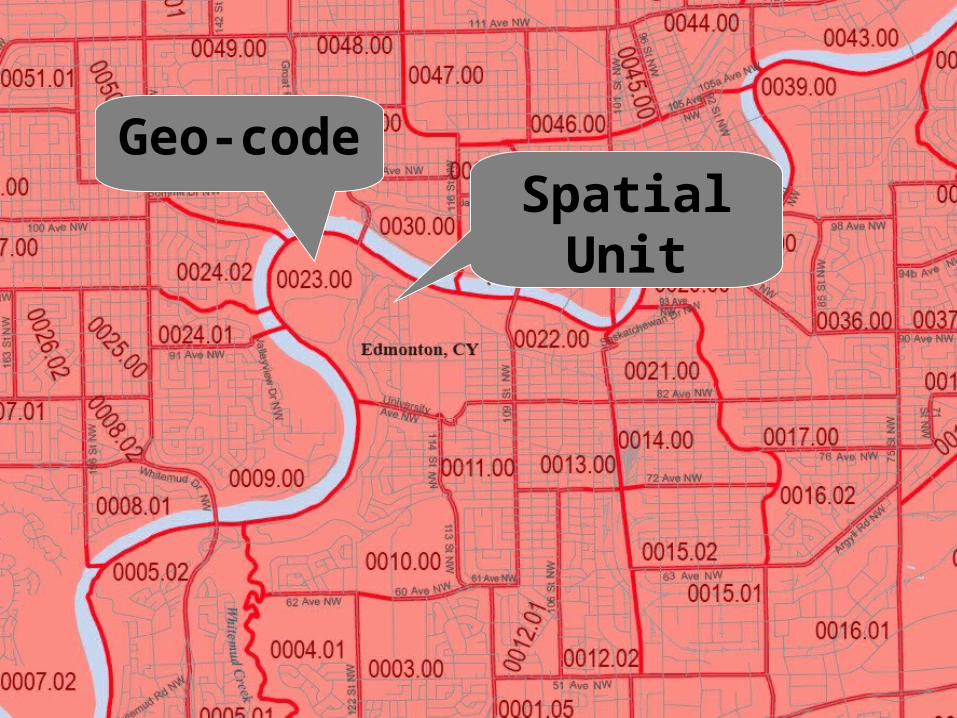
Spatial Unit
Geo-code
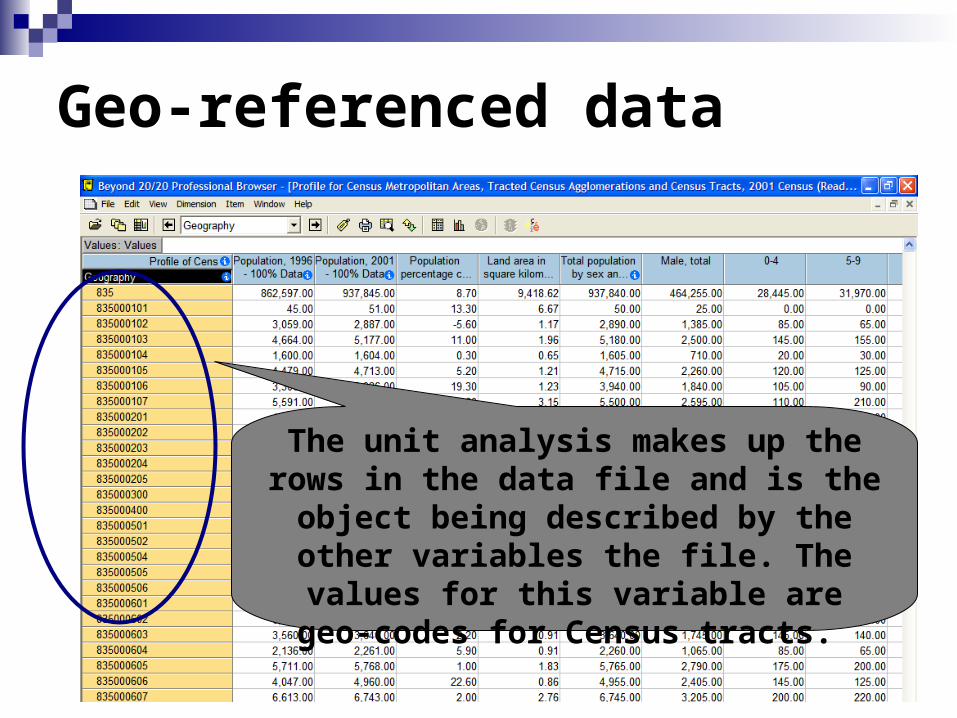
Geo-referenced data
The unit analysis makes up the rows in the data file and is the object being
described by the other variables the file. The values for this variable are geo-
codes for Census tracts.
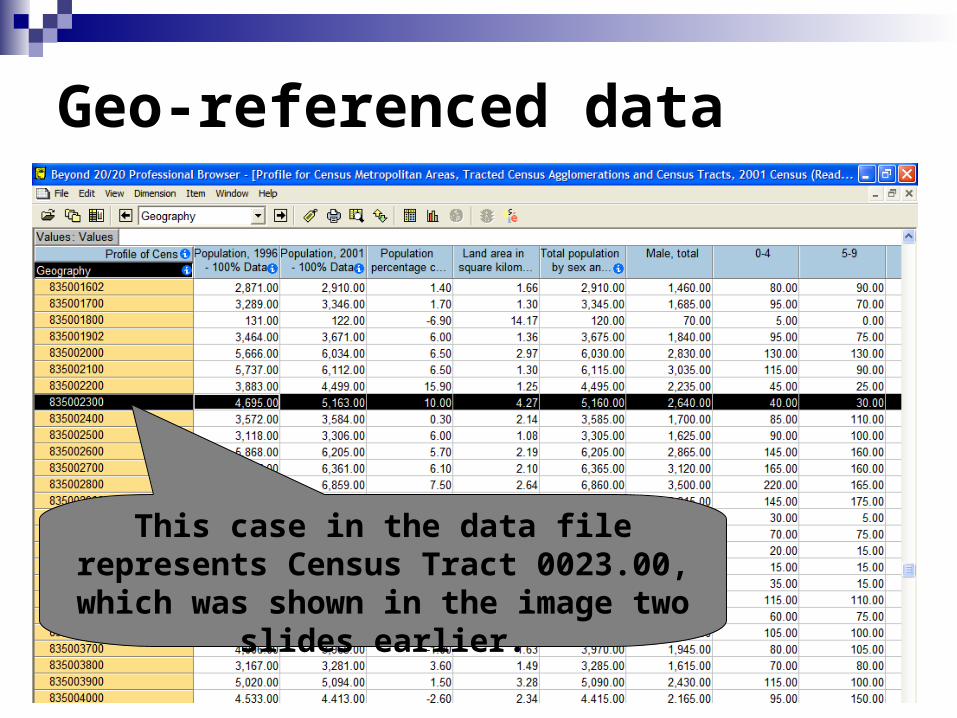
Geo-referenced data
This case in the data file represents Census Tract 0023.00, which was shown
in the image two slides earlier.
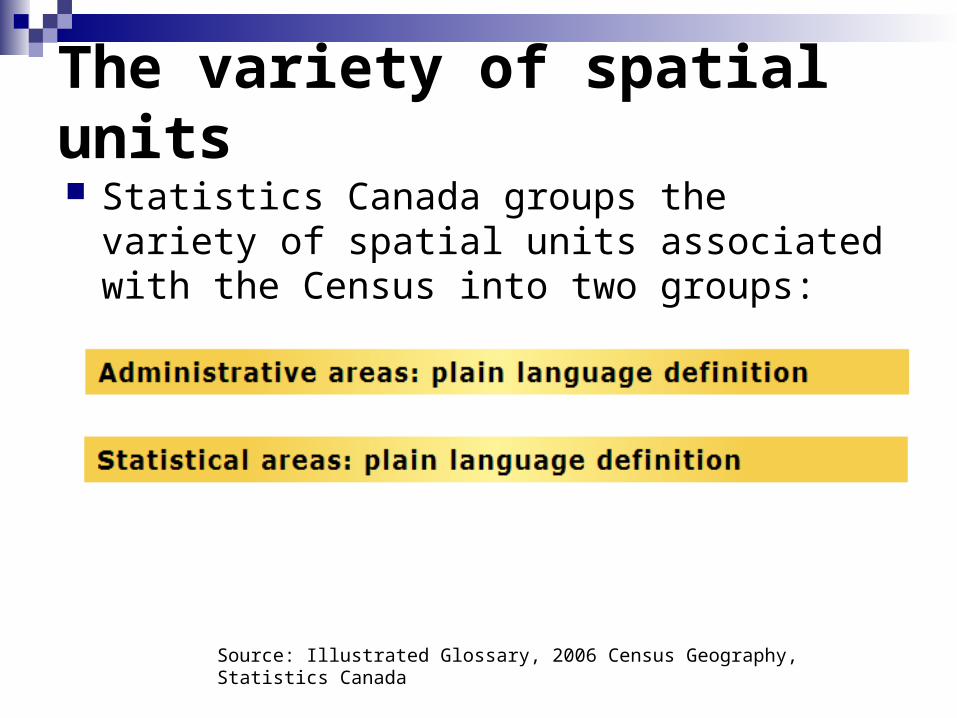
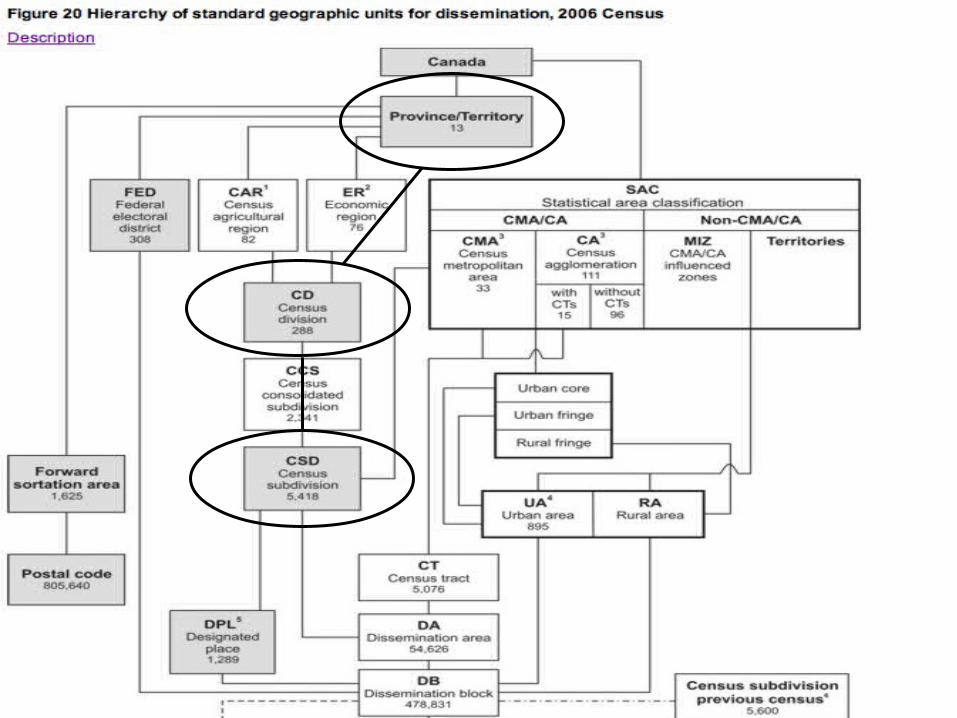
The variety of spatial units Statistics Canada groups the variety of spatial
units associated with the Census into two groups:
Source for the graphics: Illustrated Glossary, 2006 Census Geography, Statistics CanadaSource: Illustrated Glossary, 2006 Census Geography, Statistics Canada
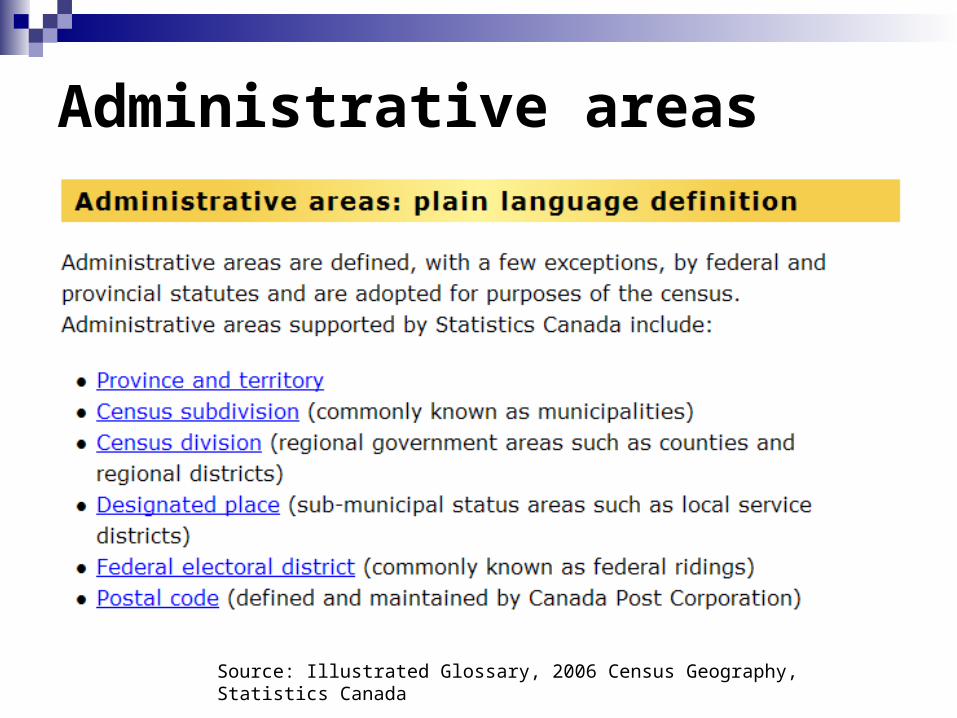
Administrative areas
Source: Illustrated Glossary, 2006 Census Geography, Statistics Canada
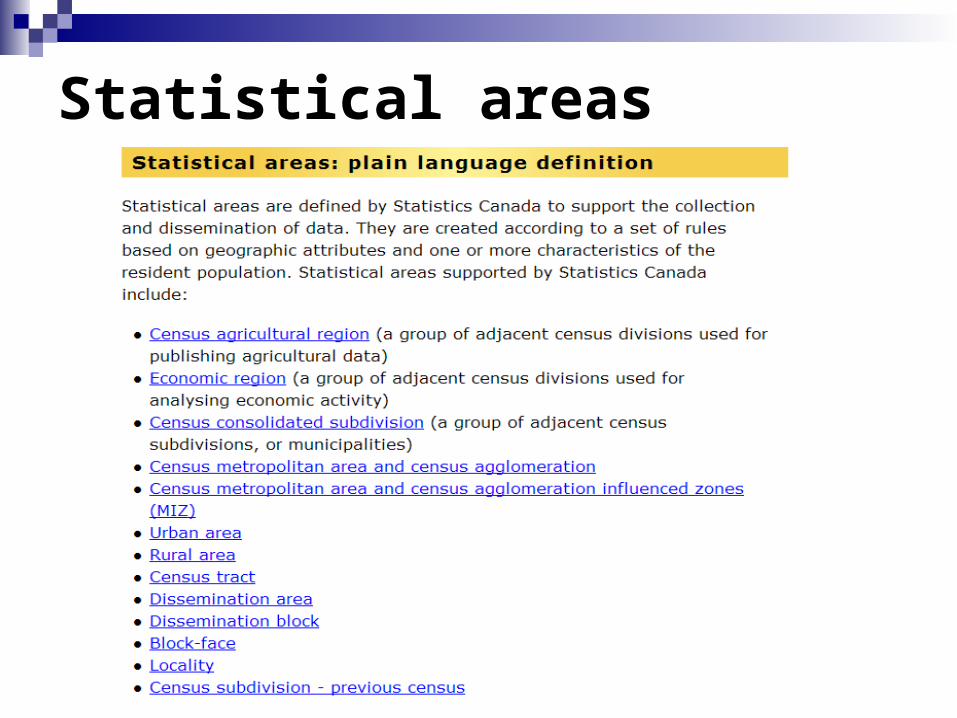
Statistical areas
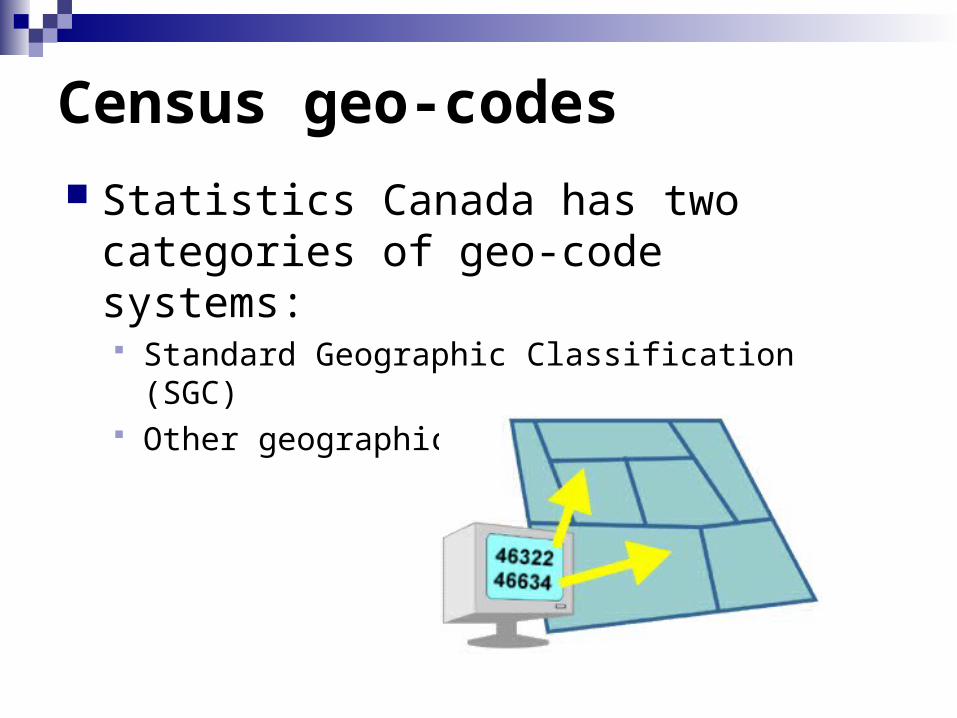
Census geo-codes
Statistics Canada has two categories of geo-code systems: Standard Geographic Classification (SGC) Other geographic entities
Source for the graphic: Illustrated Glossary, 2006 Census Geography, Statistics Canada
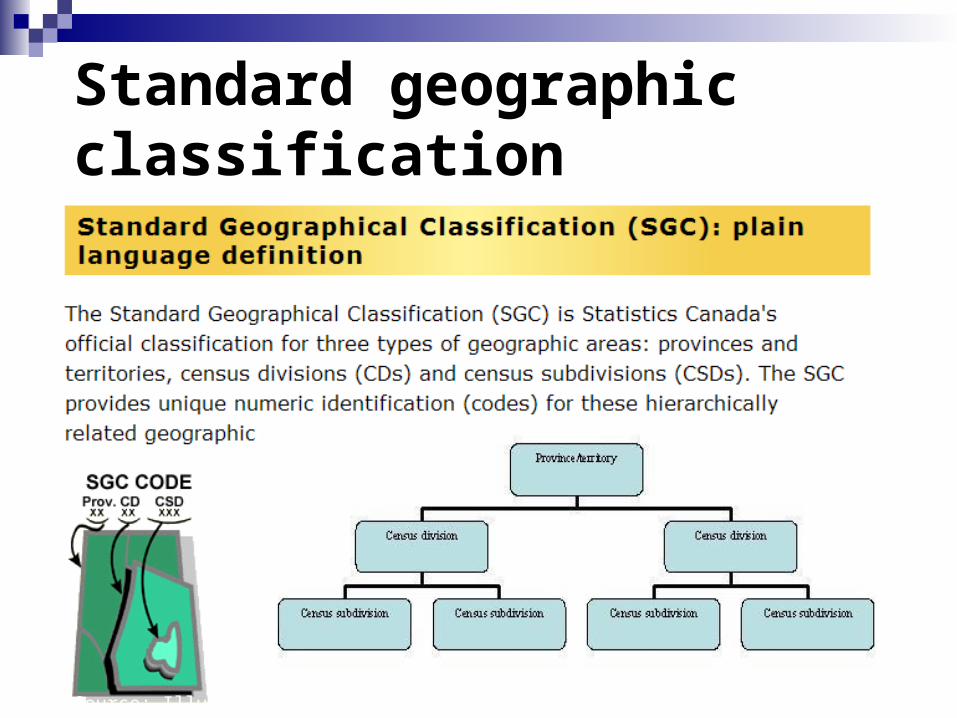
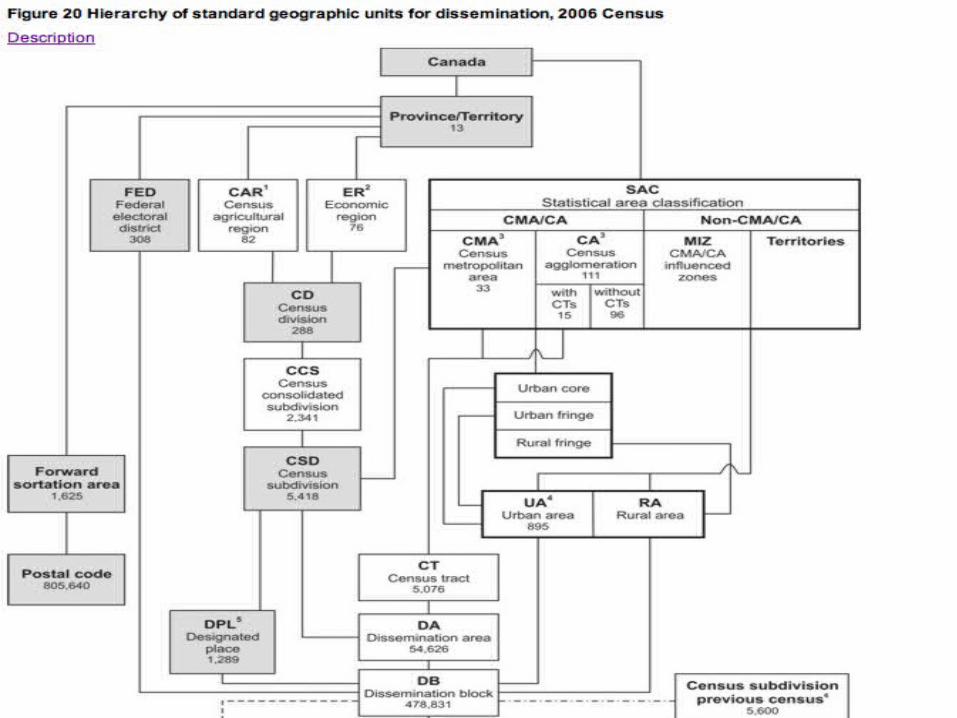
Standard geographic classification
Source: Illustrated Glossary, 2006 Census Geography, Statistics Canada
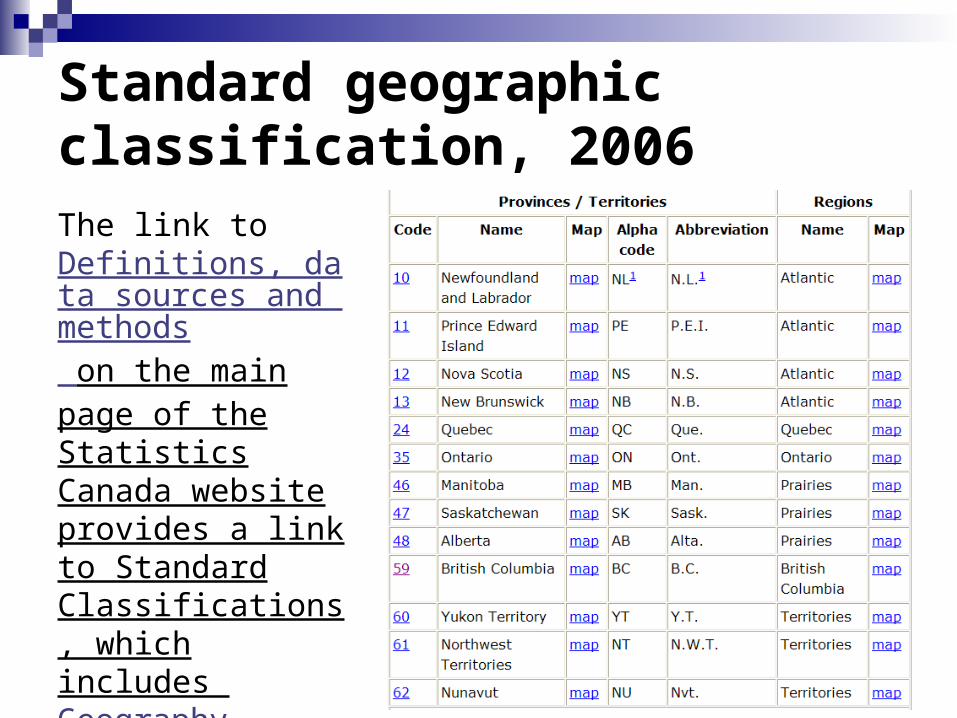
Standard geographic classification, 2006The link to Definitions, data sources and methods on the main page of the Statistics Canada website provides a link to Standard Classifications, which includes Geography.
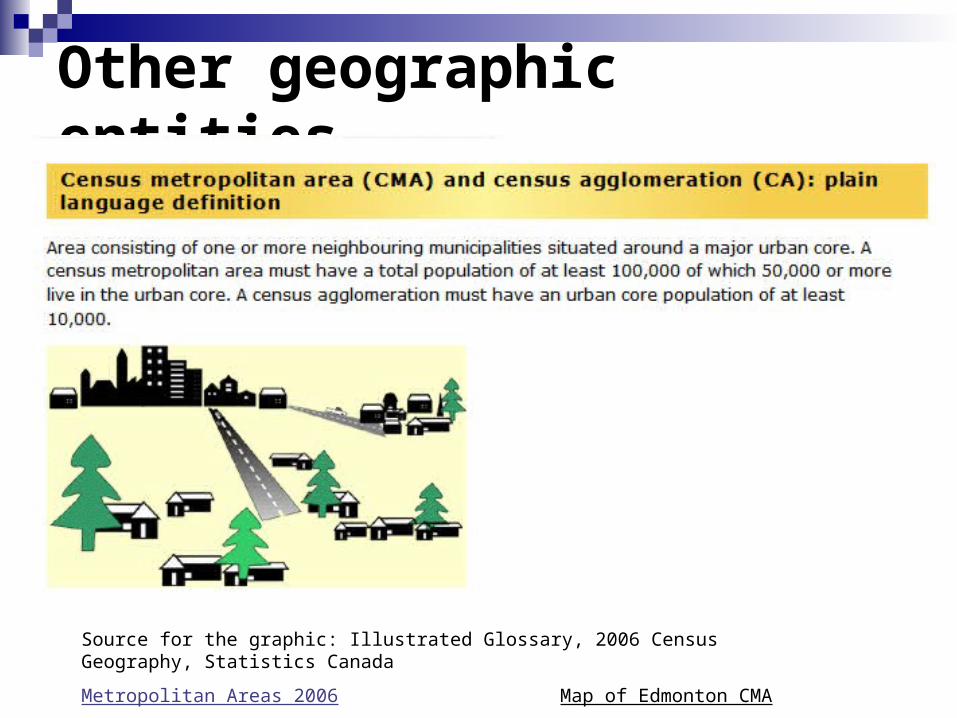
Other geographic entities
Census Metropolitan Areas
Source for the graphic: Illustrated Glossary, 2006 Census Geography, Statistics Canada
Metropolitan Areas 2006 Map of Edmonton CMA
CANSIM CANSIM is a very large database containing
socio-economic statistics for Canada. There are currently over 38 million time series organized in approximately 2,800 tables.
The statistics in CANSIM come from surveys (e.g., the Labour Force Survey), administrative data (e.g., crime and justice) and simulations or
models (e.g., population projections). Geography, content and time are basic to
retrieving time series from CANSIM.
E-STAT E-STAT is a free portal to retrieve Census
results and CANSIM holdings, which is Statistics Canada’s large time series database.
You can access more Census results from the Statistics Canada website, but E-STAT provides a wider variety of output formats for Census data.
You can also access CANSIM from the Statistics Canada website, but you must pay $3.00 per time series.
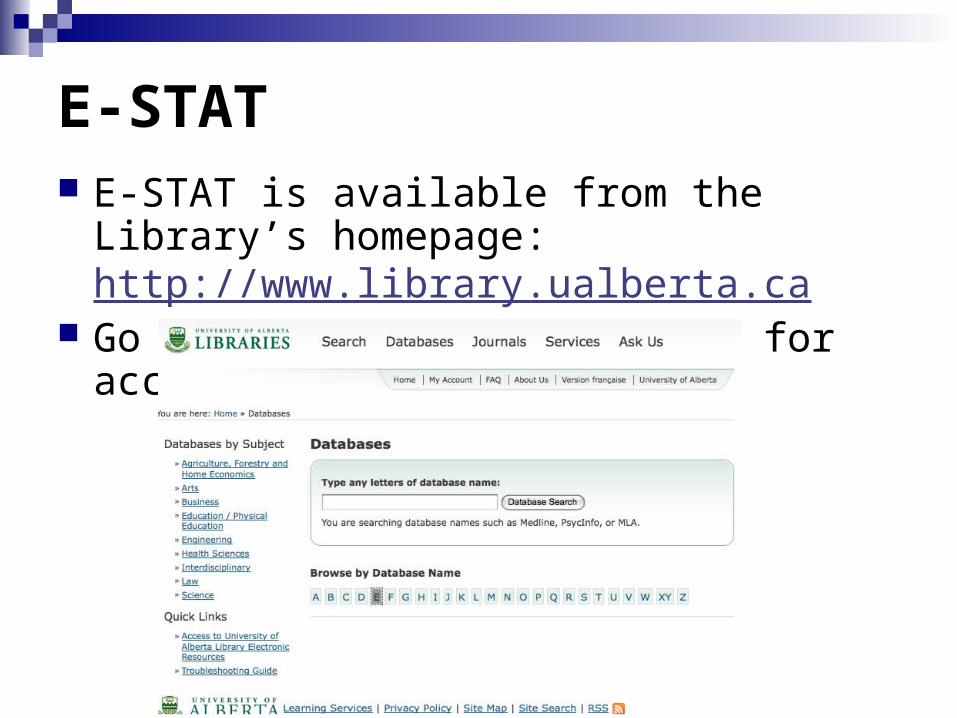
E-STAT E-STAT is available from the Library’s
homepage: http://www.library.ualberta.ca Go to the list of Databases for access
Tablebase
Tablebase contains statistics from the trade literature.
Access is through the Library homepage under Databases.
Use keyword searches to find tables of interest and then conduct new searches employing the index terms assigned to them.
PMB (Print Measurement Bureau)
PMB contains statistics about Canadian consumer demographics for specific product information.
Access is through the Library homepage under Databases.
Select products from a subject list to identify consumer demographics.