Embed Size (px)
Citation preview
M E A S U R E T H E D I F F E R E N C E !
Environmental Survey Report
Hywind Offshore Windfarm
ST13828
Environmental Survey
Peterhead, Scotland
August – September 2013
MMT Doc. No: 101462-STO-MMT-SUR-REP-ENVIRON
Statoil Doc. No: ST13828 Benthic Report
C l i e n t R e v i e w
D e c e m b e r 2 0 1 3
MMT | Sven Källfelts Gata 11 | SE-426 71 Västra Frölunda, Sweden
Phone: +46 (0)31 762 03 00 | Fax: +46 (0)31 762 03 01 | Mail: [email protected] | Web: www.mmt.se

Client: Statoil Environmental Survey Report Statoil Doc. No. ST13828 Benthic Report MMT Doc. No: 101462-STO-MMT-SUR-REP-ENVIRON
3
Environmental Survey Report
ST13828
MMT Doc. No: 101462-STO-MMT-SUR-REP-ENVIRON
Statoil Doc. No: ST13828 Benthic Report
Revision History
Revision Date Comment Check Approval Client Approval
03 2013-12-27 Issued for Client Review ID HS
02 2013-11-29 Issued for Client Review HA HS
01 2013-11-26 Issued for Internal Review ID HA
Document Control
Responsibility Position Name
Content Biologist Iris Duranovic
Content Biologist Andrea Johansson
Content Biologist Tobias Sundkvist
Content Biologist Jon Teleberg
Content Biologist Waldemar Villandt
Check Report Coordinator Emma Lindell
Check Reporting QC Hampus Arvidsson
Approval Project Manager Helena Strömberg
Client: Statoil Environmental Survey Report Statoil Doc. No. ST13828 Benthic Report MMT Doc. No: 101462-STO-MMT-SUR-REP-ENVIRON
4
TABLE OF CONTENTS
1. GENERAL ................................................................................ 11
1.1. Purpose of Document .................................................................... 11 1.2. Scope of Work ............................................................................ 11
1.3. Scope of Work Environmental Survey ................................................. 11 1.4. Survey Area ............................................................................... 12 1.5. Report Structure .......................................................................... 12 1.5.1. Text Report ........................................................................... 12 1.5.2. Reference Documents ............................................................... 12 1.5.3. Chart Index ........................................................................... 13
1.6. Survey Parameters ....................................................................... 13 1.6.1. Vertical Datum ........................................................................ 14
1.6.2. Time Datum ........................................................................... 15
2. METHODOLOGY ....................................................................... 17
2.1. Seabed Video and Photo ................................................................ 17 2.2. Benthic Grab Sampling and Sample Preservation ................................... 18 2.3. Suspended Sediment Sampling ........................................................ 19
2.4. PSA Methodology and Chemistry Sampling .......................................... 19 2.5. Habitat Classification ..................................................................... 20
2.6. Sensitive or Threatened Habitats and Species ....................................... 21 2.7. PRIMER – Multivariate Analyses ....................................................... 23
3. RESULTS ................................................................................ 24
3.1. Export Cable Route ...................................................................... 26 3.2. Turbine Site Area ......................................................................... 35 3.3. Sediment Analyses ....................................................................... 47 3.4. Particle Size Description ................................................................. 47
3.4.1. Export Cable Route .................................................................. 47 3.4.2. Turbine Site Area .................................................................... 49 3.4.3. Suspended Sediment Sampling .................................................... 50 3.5. Chemical Analyses Within the Export Cable Route .................................. 51
3.5.1. Heavy metals and trace metals .................................................... 51 3.5.2. Hydrocarbon Analysis ............................................................... 57
3.5.3. Total Organic Matter and Carbon .................................................. 60 3.6. PRIMER – Multivariate Analyses ....................................................... 60 3.7. Species Diversity Indices ................................................................ 65
4. CONCLUSIONS ......................................................................... 67
5. DISCUSSIONS .......................................................................... 67
6. REFERENCES .......................................................................... 73

Client: Statoil Environmental Survey Report Statoil Doc. No. ST13828 Benthic Report MMT Doc. No: 101462-STO-MMT-SUR-REP-ENVIRON
5
APPENDICES
Appendix A Sample Position List
Appendix B Grab & Transect Field Protocols
Appendix C Grab Identification Protocol
Appendix D Grab & Transect Photo Protocol
Appendix E Particle Size Analysis Results
Appendix F Chemical Analysis Results
Appendix G Bed load Analysis Results
Appendix H Chart Index
Client: Statoil Environmental Survey Report Statoil Doc. No. ST13828 Benthic Report MMT Doc. No: 101462-STO-MMT-SUR-REP-ENVIRON
6
LIST OF FIGURES
Figure 1 Overview of the tide methodology ................................................................. 14 Figure 2 Overview of the survey area with environmental sample sites ...................... 16 Figure 3 Drop down camera system ........................................................................... 17 Figure 4 Scale of photo ............................................................................................... 17 Figure 5 Example photo with red marking for magnification in next photo. .................. 17 Figure 6 Magnification of a part of example photo. Sea star, Henricia spp. ................. 17 Figure 7 Day Grab sampler ......................................................................................... 18 Figure 8 Habitat matrix examples from JNCC ............................................................. 20 Figure 9 Example of side scan sonar image with ripples ............................................. 21 Figure 10 Corresponding bathymetric image with ripples ............................................ 21 Figure 11 Overview of environmental sample sites and habitat classifications within the
Export Cable Route ........................................................................................ 25 Figure 12 Overview of environmental sample sites and habitat classifications within the
Turbine Site Area ........................................................................................... 34 Figure 13 Sorting of sediment fractions according to the Wentworth scale.................. 48 Figure 14 Sorting of sediment fractions according to the Wentworth scale.................. 50 Figure 15 Arsenic (As) concentrations with threshold values within surveyed area ..... 52 Figure 16 Copper (Cu) concentrations with threshold values within surveyed area ..... 52 Figure 17 Chromium (Cr) concentrations with threshold values within surveyed area . 53 Figure 18 Nickel (Ni) concentrations with threshold values within surveyed area ........ 54 Figure 19 Lead (Pb) concentrations with threshold values within surveyed area ......... 54 Figure 20 Aluminium (Al) concentrations within surveyed area. All values are divided
with 1000. ...................................................................................................... 55 Figure 21 Vanadium (V) concentrations within surveyed area .................................... 55 Figure 22 Tin (Sn) concentrations values within surveyed area .................................. 55 Figure 23 Barium (Ba) concentrations with threshold values within surveyed area ..... 56 Figure 24 Mercury (Hg) concentrations with threshold values within surveyed area .... 56 Figure 25 Cadmium (Cd) concentrations with threshold values within surveyed area . 56 Figure 26 Zinc (Zn) concentrations with threshold values within surveyed area .......... 57 Figure 27 Total Hydrocarbon Concentration in Export Cable Route ............................ 58 Figure 28 Total n-alkanes concentration in Export Cable Route .................................. 58 Figure 29 Pristane concentration in Export Cable Route ............................................. 59 Figure 30 Summary of the total organic matter and carbon within the surveyed
areas. ............................................................................................................. 60 Figure 31 Dendrogram for hierarchical clustering of the 22 sites ................................. 61 Figure 32 MDS ordination with the SIMPROF groups indicated with colours. ............. 62 Figure 33 MDS ordination with the depth interval groups indicated with colours. ........ 63 Figure 34 MDS ordination with the sand percentage groups indicated with colours. ... 63 Figure 35 Dendrogram for hierarchical clustering of the 22 sites ................................. 64 Figure 36 Column chart showing the total number of species and individuals in each
grab sample from the sampling sites .............................................................. 66 Figure 37 Column chart showing three different diversity indices for the fauna found in
the grab samples at the sampling sites. ......................................................... 66 Figure 38 Overview of Sabellaria spinulosa in the Turbine Site Area. ......................... 68 Figure 39 Overview of Sabellaria spinulosa in the Export Cable Route ....................... 69 Figure 40 Example of a “Low” reef with 10-20 % coverage ........................................ 70 Figure 41 Example of “Not a reef” with coverage below 10 % ..................................... 70
Client: Statoil Environmental Survey Report Statoil Doc. No. ST13828 Benthic Report MMT Doc. No: 101462-STO-MMT-SUR-REP-ENVIRON
7
LIST OF TABLES
Table 1 Reference documents .................................................................................... 12 Table 2 Chart Index .................................................................................................... 13 Table 3 Geodetic parameters...................................................................................... 13 Table 4 Projection Parameters .................................................................................... 14 Table 5 Grain size fractions analysed ......................................................................... 19 Table 6 Proposed chart for Sabellaria spinulosa reef identification (Gubbay, 2007) .... 22 Table 7 Measures used to categorize ‘reefiness’ for stony reefs (Irving, 2009) ........... 23 Table 8 Summary of threatened species in Export Cable Route ................................. 28 Table 9 Summary of Sabellaria spinulosa in grab samples ......................................... 28 Table 10 Average and standard deviation calculation of sites with S. spinulosa (%) ... 28 Table 11 Average and standard deviation of transect with S. spinulosa ...................... 28 Table 12 Sensitive and threatened habitats found within the Export Cable Route ....... 29 Table 13 Summary of species of special conservation interest in Turbine Site Area ... 37 Table 14 Summary of Sabellaria spinulosa in grab samples ....................................... 37 Table 15 Average and standard deviation calculation of sites with S. spinulosa (%). .. 37 Table 16 Average and standard deviation of transect with S. spinulosa ...................... 38 Table 17 Sensitive habitats and habitats of special conservation interest found within
the Turbine Site Area ..................................................................................... 39 Table 18 Sabellaria spinulosa aggregation findings that did not score as a reef ......... 42 Table 19 Summary of sample sites in the Export Cable Route - Fraction
Percentages ................................................................................................... 47 Table 20 Summary of sample sites in the Export Cable Route - Textural groups. ....... 48 Table 21 Summary of sites in the Turbine Site Area showing textural group and
depth. ............................................................................................................. 49 Table 22 Summary of sites in the Turbine Site Area - Fraction Percentages ............... 49 Table 23 Summary of suspended sediment concentrations within surveyed areas ..... 50 Table 24 Arsenic (As) values above OSPAR, EAC and Canadian, ISQG ................... 51 Table 25 Copper (Cu) values above OSPAR, EAC ..................................................... 52 Table 26 Chromium (Cr) values above OSPAR, EAC ................................................. 53 Table 27 Nickel (Ni) values above OSPAR, EAC ........................................................ 53 Table 28 Lead (Pb) values above OSPAR, EAC ......................................................... 54 Table 29 Summary of polycyclic aromatic hydrocarbons in Export Cable Route ......... 58 Table 30 PAHs within Export Cable Route for which there are no threshold values. ... 59 Table 31 Summary of PAHs within Export Cable Route with threshold values ............ 59 Table 32 Total number of species and individuals per sample along with species
diversity indices .............................................................................................. 65
Client: Statoil Environmental Survey Report Statoil Doc. No. ST13828 Benthic Report MMT Doc. No: 101462-STO-MMT-SUR-REP-ENVIRON
8
ABBREVIATIONS
BAP Biodiversity Action Plan
DDV Drop Down Video
DPR Daily Progress Report
DSLR Digital single-lens reflex
DW Dry Weight
EC European Commission
EPSG European Petroleum Survey Group
EPSG European Petroleum Survey Group
GIS Geographic information system
GNSS Global Navigation Satellite System
GPS Global Positioning System
ITRF International Terrestrial Reference Frame
JNCC Joint Nature Conservation Committee
KP Kilometer Post
LAT Lowest Astronomical Tide (vertical datum)
LED Light-emitting diode
MAG Magnetometer
MBES Multibeam Echo Sounder
MDS Multi-Dimensional Scale
MPA Marine Protected Areas
M/V Motor vessel
NES LBAP The North East Scotland Local Biodiversity Action Plan
OSPAR OSPAR Oslo and Paris Conventions for the protection of the East Atlantic marine environment of the North-East Atlantic
PMF Priority Marine Features
POS MV Position and Orientation System for Marine Vessels
POS Pac Position and Orientation System Package
PPS Pulse Per Second
PRIMER Plymouth Routines in Multivariate Ecological Research
PSA Particle Size Analysis
Client: Statoil Environmental Survey Report Statoil Doc. No. ST13828 Benthic Report MMT Doc. No: 101462-STO-MMT-SUR-REP-ENVIRON
9
QC Quality Control
RMS Root Mean Square
SAC Special Areas of Conservation
SBET Smoothed Best Estimated Trajectory
SIS Seafloor Information System
SNH Scottish Natural Heritage
SOW Scope Of Work
SSS Side Scan Sonar
TPU Total Propagated Uncertainty
UK United Kingdom
UTC Coordinated Universal Time
Client: Statoil Environmental Survey Report Statoil Doc. No. ST13828 Benthic Report MMT Doc. No: 101462-STO-MMT-SUR-REP-ENVIRON
10
EXECUTIVE SUMMARY
This report details the results from the marine environmental survey along the export corridor and within the development site for the Hywind Offshore Windfarm off the coast of east Scotland.
Statoil intends to install the Hywind Offshore Windfarm, with five floating wind turbines anchored to the seafloor together with an export cable to the mainland. The Turbine Site Area is situated 25 km east of Peterhead where the cable route will landfall. The water depth in the surveyed Export Cable Route area reaches between 1 and 98 m LAT and in the Turbine Site Area 97 to 188 m LAT.
MMT was contracted in 2013 to undertake marine geophysical seabed mapping and environmental surveys of the Turbine Site Area and export cable corridor as well as a nearshore survey of the landfall.
The environmental survey objective was to identify and map the extent of existing habitats and describe sensitive habitats and species or habitats and species of special conservation interest within the turbine area and cable corridor.
The survey area is divided in two main parts; the Turbine Site Area with accompanied construction and anchoring areas and the Export Cable Route.
The geophysical data acquisition was performed to determine water depths, seabed features, shallow geology, object detection and cable crossing positions. Instruments used during the geophysical survey were multibeam echo sounder, side scan sonar, sub-bottom profiler and magnetometer.
The environmental data acquisition comprises of sediment sampling, photography and video recording for ground truthing the seabed and to map the existing habitats. The instruments used were grab sampler and drop down video-camera.
The environmental survey started on the 23rd of August 2013 and was completed on the 1st of September.
An area of approximately 60 km2 was covered by the geophysical survey. Within this area 34 sampling sites and 6 video transects were assigned and performed during the environmental survey. In the cable corridor the EC Habitats Directive (The Council of the European Communities, 1992) Annex I “Bedrock reef” and “Stony reefs” were found as well as aggregations of the tube building Ross worm Sabellaria spinulosa.
Sabellaria spinulosa worms build tubes out of sand and when aggregated in large densities they form complex structures that due to their elevation and extension are considered to be biogenic reefs. These S. spinulosa aggregations were identified in approximately 1/3 of the Turbine Site Area as well in the offshore end of the Export Cable Corridor. Most aggregations found in this survey had a low coverage of the seabed, around 1 – 10 % and are not considered as biogenic reefs. Two larger areas in the centre and southeast corner of the Turbine Site Area along with some smaller scattered areas meet the criteria for the score of an “Low graded S. spinulosa reef” (Gubbay, 2007) included under areas of special conservation interest code 1170 Reefs of Annex I, EC Habitats Directive (The Council of the European Communities, 1992).
MMT has performed the Statoil Hywind Windfarm project without any fatality or injury.
Client: Statoil Environmental Survey Report Statoil Doc. No. ST13828 Benthic Report MMT Doc. No: 101462-STO-MMT-SUR-REP-ENVIRON
11
1. GENERAL
1.1. Purpose of Document
This report together with charts and GIS database presents the environmental results from the Hywind Offshore Windfarm survey.
Areas of special interest along the Export Cable Route and within the Turbine Site Area are presented in this report as well as in the habitat charts. All obtained data from the survey is correlated to strengthen the accuracy of the interpretations.
The data delivery will include the following:
Video .mov From transects
Photo .jpg From transects
Photo .jpg From sampling sites
Sample site field protocol
Transect field protocol
Benthic sampling locations
Chemical and biological analyses protocols
1.2. Scope of Work
MMT was contracted by Statoil to undertake a geophysical and benthic survey for the Hywind Offshore Windfarm – Seabed and sub-seabed mapping of development site and export cable corridor.
The scope of work included seabed and sub-seabed survey of the Hywind Offshore Windfarm development site and the export cable corridor. The main aims of the survey were to:
Acquire and interpret high quality seabed and sub-seabed data for project planning and execution, including shallow geology, bathymetry, seabed sediment distribution and detection of seabed features and seabed obstructions.
Detect possible occurrence of benthic habitats and species of known conservation importance.
Improve the geological understanding of the shallow stratigraphy and sediment properties in the Turbine Site Area and Export Cable Route to facilitate the planning and execution of turbine foundation installation and cable routing, installation and protection.
Detection of three cables.
1.3. Scope of Work Environmental Survey
The following summarises the scope of work for the environmental survey:
Planning – The results from the geophysical survey comprising multibeam echo sounder (MBES) i.e. bathymetry and backscatter, and side scan sonar (SSS)
Analyses – Three grab samples were retrieved at each selected site, two for infaunal analysis and one sample for particle size analyses (PSA), organic matter and total organic carbon content. In addition to PSA, metal and hydrocarbon analyses were conducted to describe the seabed sediments further at sites of interest. At some locations bed load sampling was also conducted.
Client: Statoil Environmental Survey Report Statoil Doc. No. ST13828 Benthic Report MMT Doc. No: 101462-STO-MMT-SUR-REP-ENVIRON
12
Ground truthing – SSS and backscatter data interpretations were confirmed with selected drop down video/photo and/or grab samples.
Biotope mapping – following acquisition, processing and interpretation of the bathymetry, SSS and backscatter data sample sites were selected. Information from the grab sampling together with video/ photography analyses was used to classify habitats and produce biotope maps to provide a baseline for any future monitoring.
The environmental surveys objective was also to identify sensitive or habitats of special conservation interest and species that fall under the different regimes of the EC Habitats Directive 92/43, Biodiversity Action plan (BAPs) including those that are listed by the SNH (Scottish Natural Heritage) as Priority Marine Features (PMFs). Habitat classifications are based on Joint Nature Conservation Committee, JNCC classification system and are set in guidance with their descriptions.
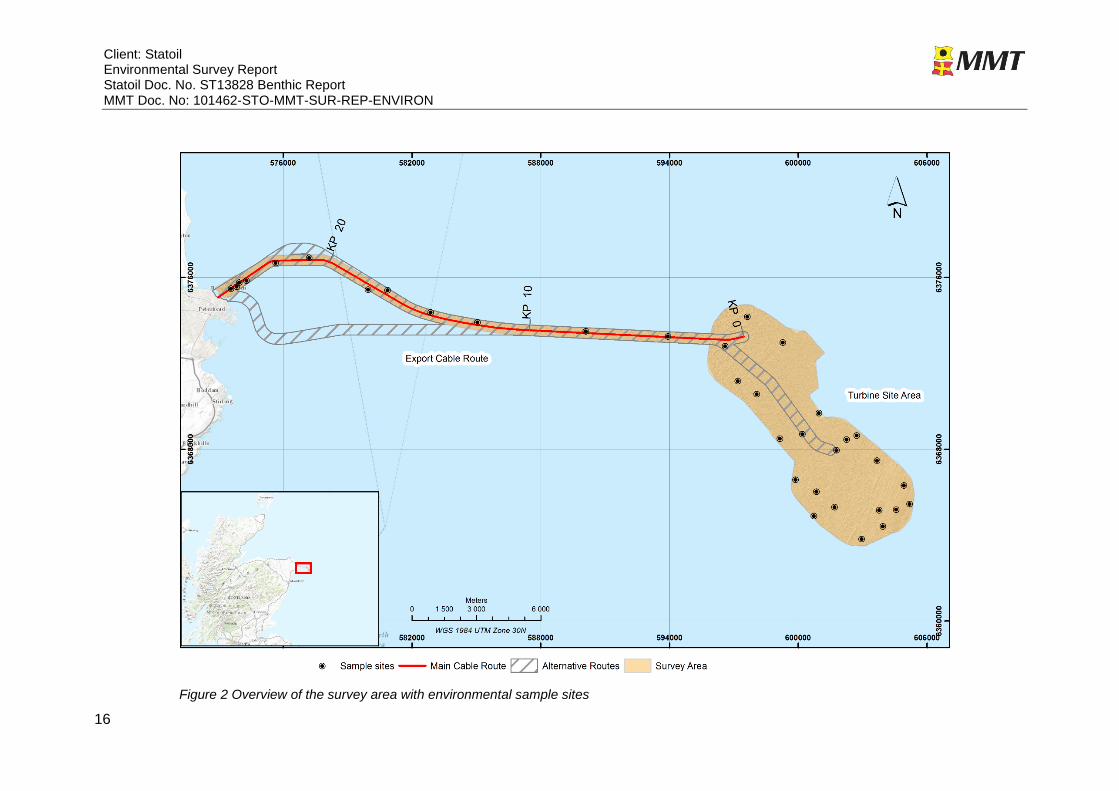
1.4. Survey Area
The Hywind Offshore Windfarm site is located on the east coast of Scotland at the Buchan Deep site, approximately 25 km east of Peterhead (Figure 2). The development will consist of five floating wind turbines, anchored to the seabed each with connection to an export cable.
The survey area is divided in two main parts; the Turbine Site Area with accompanied construction and anchoring areas and the export cable corridor.
The development area is approximately 60 km2 but is limited by the Forties pipeline exclusion zone (2000 m wide) running in a NE-SW direction. The export cable corridor is 25 to 30 km long and 500 m wide, with a planned landfall in the Peterhead area. The Turbine Site Area has water depths in the range of 110 to 130 m.
1.5. Report Structure
1.5.1. Text Report
This text report provides information of the survey performance, instrumentation and processing stages of the work together with the results from the environmental survey. The objective is to provide information with an overview of the environmental conditions within the survey area which are based on the interpretations of obtained data.
1.5.2. Reference Documents
Table 1 Reference documents
MMT Doc No. Statoil Doc No. Title Author
101462-STO-MMT-SUR-REP-ST13828-03
ST13828-Hywind OW Marine Survey Report Geophysical Survey
MMT
Client: Statoil Environmental Survey Report Statoil Doc. No. ST13828 Benthic Report MMT Doc. No: 101462-STO-MMT-SUR-REP-ENVIRON
13
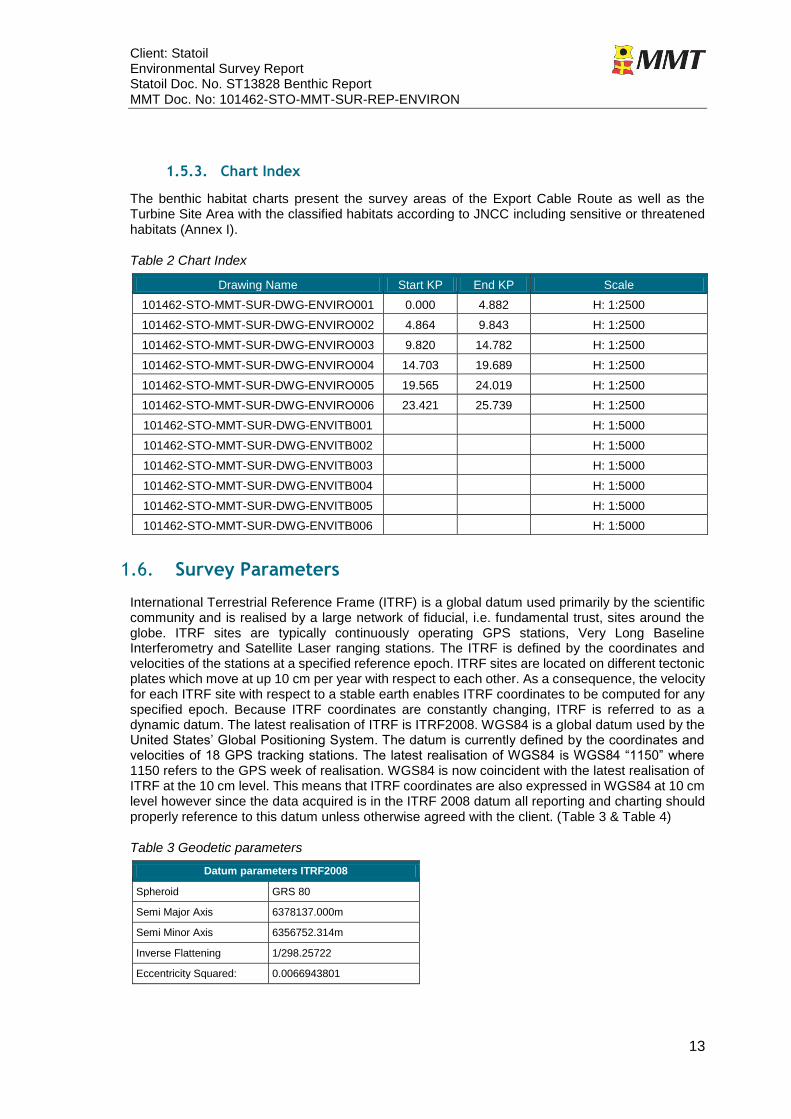
1.5.3. Chart Index
The benthic habitat charts present the survey areas of the Export Cable Route as well as the Turbine Site Area with the classified habitats according to JNCC including sensitive or threatened habitats (Annex I).
Table 2 Chart Index
Drawing Name Start KP End KP Scale
101462-STO-MMT-SUR-DWG-ENVIRO001 0.000 4.882 H: 1:2500
101462-STO-MMT-SUR-DWG-ENVIRO002 4.864 9.843 H: 1:2500
101462-STO-MMT-SUR-DWG-ENVIRO003 9.820 14.782 H: 1:2500
101462-STO-MMT-SUR-DWG-ENVIRO004 14.703 19.689 H: 1:2500
101462-STO-MMT-SUR-DWG-ENVIRO005 19.565 24.019 H: 1:2500
101462-STO-MMT-SUR-DWG-ENVIRO006 23.421 25.739 H: 1:2500
101462-STO-MMT-SUR-DWG-ENVITB001 H: 1:5000
101462-STO-MMT-SUR-DWG-ENVITB002 H: 1:5000
101462-STO-MMT-SUR-DWG-ENVITB003 H: 1:5000
101462-STO-MMT-SUR-DWG-ENVITB004 H: 1:5000
101462-STO-MMT-SUR-DWG-ENVITB005 H: 1:5000
101462-STO-MMT-SUR-DWG-ENVITB006 H: 1:5000
1.6. Survey Parameters
International Terrestrial Reference Frame (ITRF) is a global datum used primarily by the scientific community and is realised by a large network of fiducial, i.e. fundamental trust, sites around the globe. ITRF sites are typically continuously operating GPS stations, Very Long Baseline Interferometry and Satellite Laser ranging stations. The ITRF is defined by the coordinates and velocities of the stations at a specified reference epoch. ITRF sites are located on different tectonic plates which move at up 10 cm per year with respect to each other. As a consequence, the velocity for each ITRF site with respect to a stable earth enables ITRF coordinates to be computed for any specified epoch. Because ITRF coordinates are constantly changing, ITRF is referred to as a dynamic datum. The latest realisation of ITRF is ITRF2008. WGS84 is a global datum used by the United States’ Global Positioning System. The datum is currently defined by the coordinates and velocities of 18 GPS tracking stations. The latest realisation of WGS84 is WGS84 “1150” where 1150 refers to the GPS week of realisation. WGS84 is now coincident with the latest realisation of ITRF at the 10 cm level. This means that ITRF coordinates are also expressed in WGS84 at 10 cm level however since the data acquired is in the ITRF 2008 datum all reporting and charting should properly reference to this datum unless otherwise agreed with the client. (Table 3 & Table 4)
Table 3 Geodetic parameters
Datum parameters ITRF2008
Spheroid GRS 80
Semi Major Axis 6378137.000m
Semi Minor Axis 6356752.314m
Inverse Flattening 1/298.25722
Eccentricity Squared: 0.0066943801
Client: Statoil Environmental Survey Report Statoil Doc. No. ST13828 Benthic Report MMT Doc. No: 101462-STO-MMT-SUR-REP-ENVIRON
14
Table 4 Projection Parameters
Projection Parameters
EPSG Code 32630
Projection WGS84
Zone UTM zone 30N
Central Meridian -3° 00’ 00’’
Latitude origin 0º
False Northing 0 m
False Easting 500 000 m
Central Scale Factor 0.9996
Units Metres
1.6.1. Vertical Datum
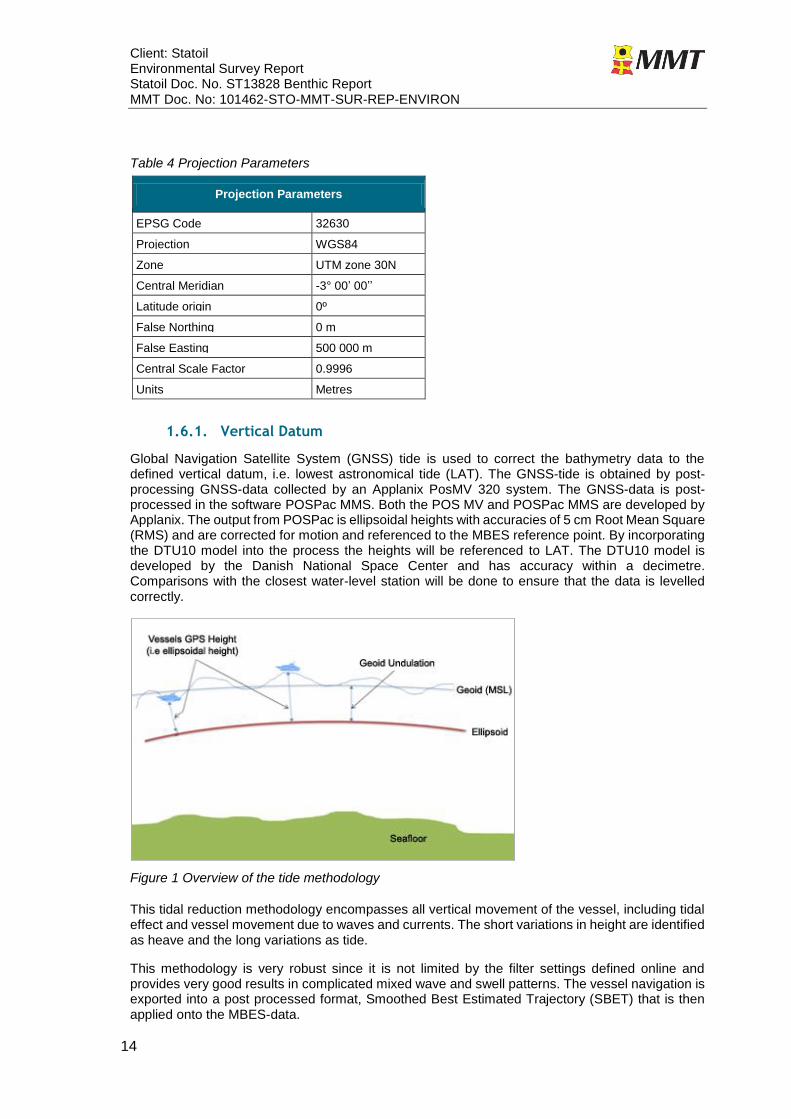
Global Navigation Satellite System (GNSS) tide is used to correct the bathymetry data to the defined vertical datum, i.e. lowest astronomical tide (LAT). The GNSS-tide is obtained by post-processing GNSS-data collected by an Applanix PosMV 320 system. The GNSS-data is post-processed in the software POSPac MMS. Both the POS MV and POSPac MMS are developed by Applanix. The output from POSPac is ellipsoidal heights with accuracies of 5 cm Root Mean Square (RMS) and are corrected for motion and referenced to the MBES reference point. By incorporating the DTU10 model into the process the heights will be referenced to LAT. The DTU10 model is developed by the Danish National Space Center and has accuracy within a decimetre. Comparisons with the closest water-level station will be done to ensure that the data is levelled correctly.
Figure 1 Overview of the tide methodology
This tidal reduction methodology encompasses all vertical movement of the vessel, including tidal effect and vessel movement due to waves and currents. The short variations in height are identified as heave and the long variations as tide.
This methodology is very robust since it is not limited by the filter settings defined online and provides very good results in complicated mixed wave and swell patterns. The vessel navigation is exported into a post processed format, Smoothed Best Estimated Trajectory (SBET) that is then applied onto the MBES-data.
Client: Statoil Environmental Survey Report Statoil Doc. No. ST13828 Benthic Report MMT Doc. No: 101462-STO-MMT-SUR-REP-ENVIRON
15
The methodology has proven to be very accurate as it accounts for any changes in height caused by changes in atmospheric pressure, storm surge, squat, loading or any other effect not accounted for in a tidal prediction.
1.6.2. Time Datum
Coordinated Universal Time (UTC) will be used on all survey systems on board the vessel. The synchronisation of the vessels on board system is governed by the Pulse Per Second (PPS) issued by the primary positioning system. All displays, overlays and logbooks will be annotated in UTC. The Daily Progress Report (DPR) will refer to UTC.
Client: Statoil Environmental Survey Report Statoil Doc. No. ST13828 Benthic Report MMT Doc. No: 101462-STO-MMT-SUR-REP-ENVIRON
16
Figure 2 Overview of the survey area with environmental sample sites
Client: Statoil Environmental Survey Report Statoil Doc. No. ST13828 Benthic Report MMT Doc. No: 101462-STO-MMT-SUR-REP-ENVIRON
17
2. METHODOLOGY
The environmental survey was performed using grab sampling, a drop down video and still camera system. Sample sites were selected using the information provided from the geophysical survey data and in accordance with the requirements of the client. Sites were documented by visual methods, video/still photography and by grab sampling. Where grab sampling was obstructed by hard seabed or coarse substrates only video/still photo was used for sampling.
2.1. Seabed Video and Photo
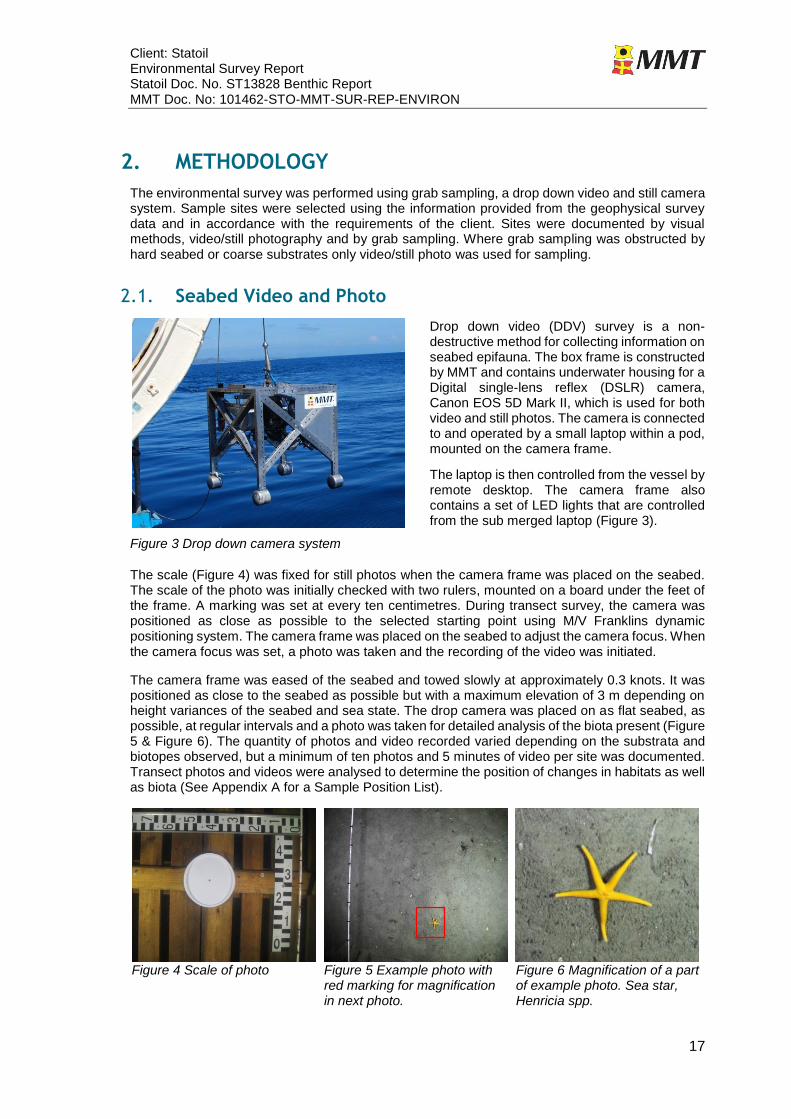
Figure 3 Drop down camera system
Drop down video (DDV) survey is a non-destructive method for collecting information on seabed epifauna. The box frame is constructed by MMT and contains underwater housing for a Digital single-lens reflex (DSLR) camera, Canon EOS 5D Mark II, which is used for both video and still photos. The camera is connected to and operated by a small laptop within a pod, mounted on the camera frame.
The laptop is then controlled from the vessel by remote desktop. The camera frame also contains a set of LED lights that are controlled from the sub merged laptop (Figure 3).
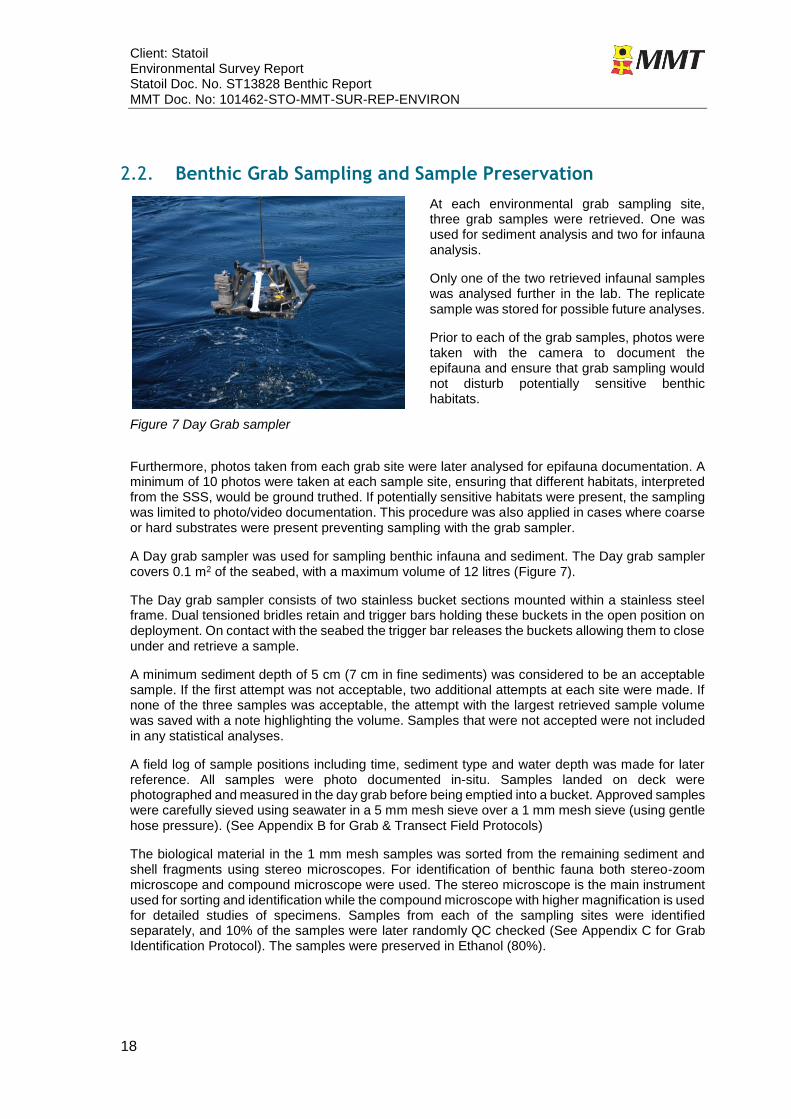
The scale (Figure 4) was fixed for still photos when the camera frame was placed on the seabed. The scale of the photo was initially checked with two rulers, mounted on a board under the feet of the frame. A marking was set at every ten centimetres. During transect survey, the camera was positioned as close as possible to the selected starting point using M/V Franklins dynamic positioning system. The camera frame was placed on the seabed to adjust the camera focus. When the camera focus was set, a photo was taken and the recording of the video was initiated.
The camera frame was eased of the seabed and towed slowly at approximately 0.3 knots. It was positioned as close to the seabed as possible but with a maximum elevation of 3 m depending on height variances of the seabed and sea state. The drop camera was placed on as flat seabed, as possible, at regular intervals and a photo was taken for detailed analysis of the biota present (Figure 5 & Figure 6). The quantity of photos and video recorded varied depending on the substrata and biotopes observed, but a minimum of ten photos and 5 minutes of video per site was documented. Transect photos and videos were analysed to determine the position of changes in habitats as well as biota (See Appendix A for a Sample Position List).
Figure 4 Scale of photo Figure 5 Example photo with
red marking for magnification in next photo.
Figure 6 Magnification of a part of example photo. Sea star, Henricia spp.
Client: Statoil Environmental Survey Report Statoil Doc. No. ST13828 Benthic Report MMT Doc. No: 101462-STO-MMT-SUR-REP-ENVIRON
18
2.2. Benthic Grab Sampling and Sample Preservation
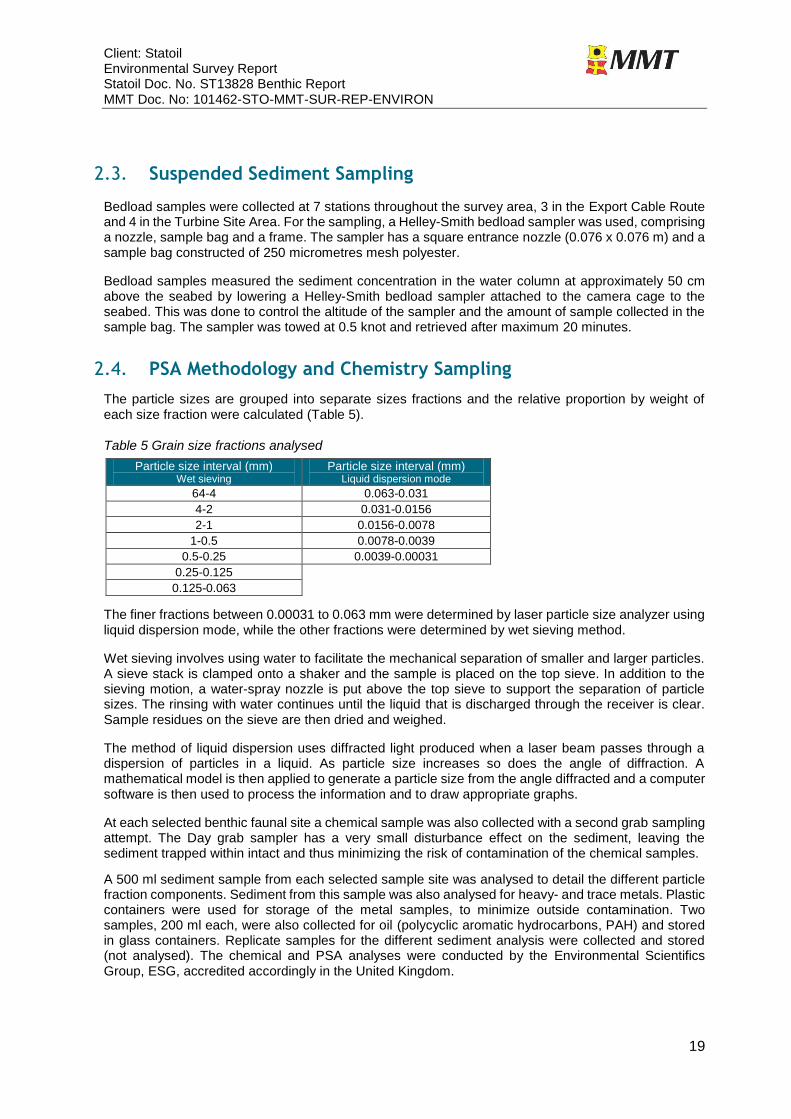
Figure 7 Day Grab sampler
At each environmental grab sampling site, three grab samples were retrieved. One was used for sediment analysis and two for infauna analysis.
Only one of the two retrieved infaunal samples was analysed further in the lab. The replicate sample was stored for possible future analyses.
Prior to each of the grab samples, photos were taken with the camera to document the epifauna and ensure that grab sampling would not disturb potentially sensitive benthic habitats.
Furthermore, photos taken from each grab site were later analysed for epifauna documentation. A minimum of 10 photos were taken at each sample site, ensuring that different habitats, interpreted from the SSS, would be ground truthed. If potentially sensitive habitats were present, the sampling was limited to photo/video documentation. This procedure was also applied in cases where coarse or hard substrates were present preventing sampling with the grab sampler.
A Day grab sampler was used for sampling benthic infauna and sediment. The Day grab sampler covers 0.1 m2 of the seabed, with a maximum volume of 12 litres (Figure 7).
The Day grab sampler consists of two stainless bucket sections mounted within a stainless steel frame. Dual tensioned bridles retain and trigger bars holding these buckets in the open position on deployment. On contact with the seabed the trigger bar releases the buckets allowing them to close under and retrieve a sample.
A minimum sediment depth of 5 cm (7 cm in fine sediments) was considered to be an acceptable sample. If the first attempt was not acceptable, two additional attempts at each site were made. If none of the three samples was acceptable, the attempt with the largest retrieved sample volume was saved with a note highlighting the volume. Samples that were not accepted were not included in any statistical analyses.
A field log of sample positions including time, sediment type and water depth was made for later reference. All samples were photo documented in-situ. Samples landed on deck were photographed and measured in the day grab before being emptied into a bucket. Approved samples were carefully sieved using seawater in a 5 mm mesh sieve over a 1 mm mesh sieve (using gentle hose pressure). (See Appendix B for Grab & Transect Field Protocols)
The biological material in the 1 mm mesh samples was sorted from the remaining sediment and shell fragments using stereo microscopes. For identification of benthic fauna both stereo-zoom microscope and compound microscope were used. The stereo microscope is the main instrument used for sorting and identification while the compound microscope with higher magnification is used for detailed studies of specimens. Samples from each of the sampling sites were identified separately, and 10% of the samples were later randomly QC checked (See Appendix C for Grab Identification Protocol). The samples were preserved in Ethanol (80%).
Client: Statoil Environmental Survey Report Statoil Doc. No. ST13828 Benthic Report MMT Doc. No: 101462-STO-MMT-SUR-REP-ENVIRON
19
2.3. Suspended Sediment Sampling
Bedload samples were collected at 7 stations throughout the survey area, 3 in the Export Cable Route and 4 in the Turbine Site Area. For the sampling, a Helley-Smith bedload sampler was used, comprising a nozzle, sample bag and a frame. The sampler has a square entrance nozzle (0.076 x 0.076 m) and a sample bag constructed of 250 micrometres mesh polyester.
Bedload samples measured the sediment concentration in the water column at approximately 50 cm above the seabed by lowering a Helley-Smith bedload sampler attached to the camera cage to the seabed. This was done to control the altitude of the sampler and the amount of sample collected in the sample bag. The sampler was towed at 0.5 knot and retrieved after maximum 20 minutes.
2.4. PSA Methodology and Chemistry Sampling
The particle sizes are grouped into separate sizes fractions and the relative proportion by weight of each size fraction were calculated (Table 5).
Table 5 Grain size fractions analysed
Particle size interval (mm) Wet sieving
Particle size interval (mm) Liquid dispersion mode
64-4 0.063-0.031
4-2 0.031-0.0156
2-1 0.0156-0.0078
1-0.5 0.0078-0.0039
0.5-0.25 0.0039-0.00031
0.25-0.125
0.125-0.063
The finer fractions between 0.00031 to 0.063 mm were determined by laser particle size analyzer using liquid dispersion mode, while the other fractions were determined by wet sieving method.
Wet sieving involves using water to facilitate the mechanical separation of smaller and larger particles. A sieve stack is clamped onto a shaker and the sample is placed on the top sieve. In addition to the sieving motion, a water-spray nozzle is put above the top sieve to support the separation of particle sizes. The rinsing with water continues until the liquid that is discharged through the receiver is clear. Sample residues on the sieve are then dried and weighed.
The method of liquid dispersion uses diffracted light produced when a laser beam passes through a dispersion of particles in a liquid. As particle size increases so does the angle of diffraction. A mathematical model is then applied to generate a particle size from the angle diffracted and a computer software is then used to process the information and to draw appropriate graphs.
At each selected benthic faunal site a chemical sample was also collected with a second grab sampling attempt. The Day grab sampler has a very small disturbance effect on the sediment, leaving the sediment trapped within intact and thus minimizing the risk of contamination of the chemical samples.
A 500 ml sediment sample from each selected sample site was analysed to detail the different particle fraction components. Sediment from this sample was also analysed for heavy- and trace metals. Plastic containers were used for storage of the metal samples, to minimize outside contamination. Two samples, 200 ml each, were also collected for oil (polycyclic aromatic hydrocarbons, PAH) and stored in glass containers. Replicate samples for the different sediment analysis were collected and stored (not analysed). The chemical and PSA analyses were conducted by the Environmental Scientifics Group, ESG, accredited accordingly in the United Kingdom.
Client: Statoil Environmental Survey Report Statoil Doc. No. ST13828 Benthic Report MMT Doc. No: 101462-STO-MMT-SUR-REP-ENVIRON
20
2.5. Habitat Classification
The classification codes, presented in habitat the maps, are based on the Marine Habitat Classification for Britain & Ireland (v04.05) (Connor et al., 2004). Habitats are classified to the lowest hierarchic level possible and based on interpretations that combine biotope descriptions of species abundance, diversity, depth and seabed features from video and photo acquired at each sample site.
The Marine Habitat Classification of the communities of the different habitat types is based on physical characteristics such as benthic geology, wave exposure, tidal currents, temperature and salinity together with key species for the area.
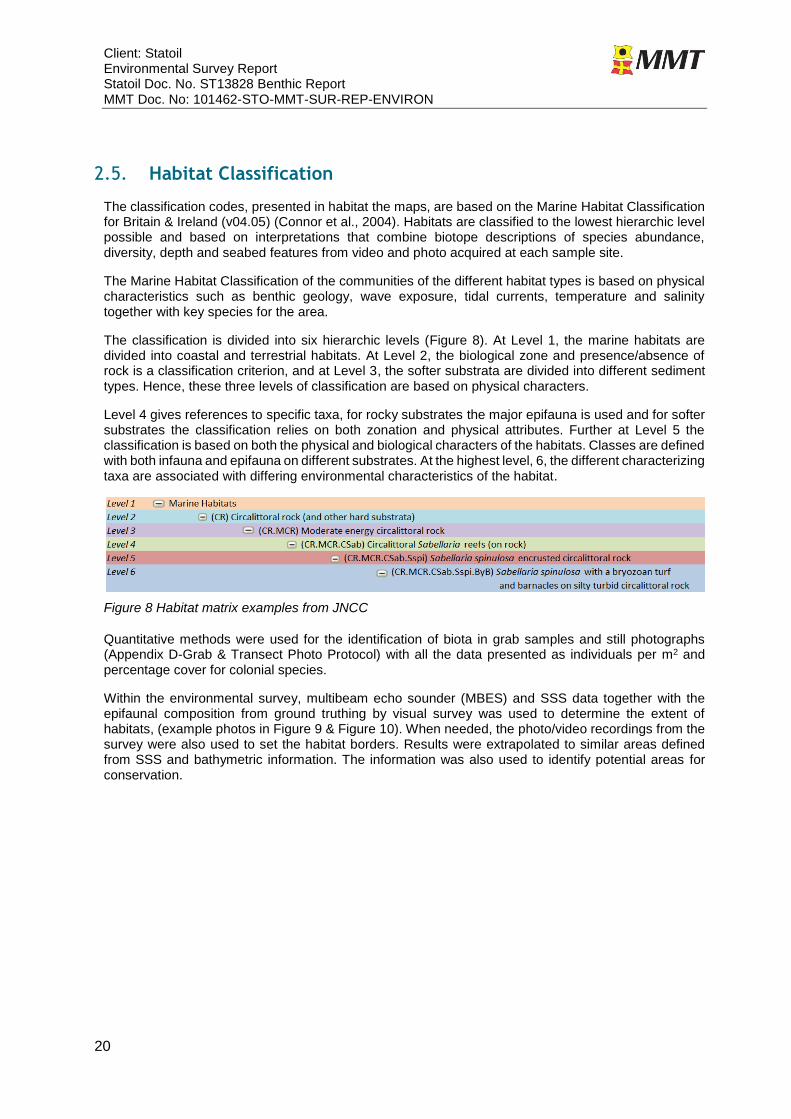
The classification is divided into six hierarchic levels (Figure 8). At Level 1, the marine habitats are divided into coastal and terrestrial habitats. At Level 2, the biological zone and presence/absence of rock is a classification criterion, and at Level 3, the softer substrata are divided into different sediment types. Hence, these three levels of classification are based on physical characters.
Level 4 gives references to specific taxa, for rocky substrates the major epifauna is used and for softer substrates the classification relies on both zonation and physical attributes. Further at Level 5 the classification is based on both the physical and biological characters of the habitats. Classes are defined with both infauna and epifauna on different substrates. At the highest level, 6, the different characterizing taxa are associated with differing environmental characteristics of the habitat.
Figure 8 Habitat matrix examples from JNCC
Quantitative methods were used for the identification of biota in grab samples and still photographs (Appendix D-Grab & Transect Photo Protocol) with all the data presented as individuals per m2 and percentage cover for colonial species.
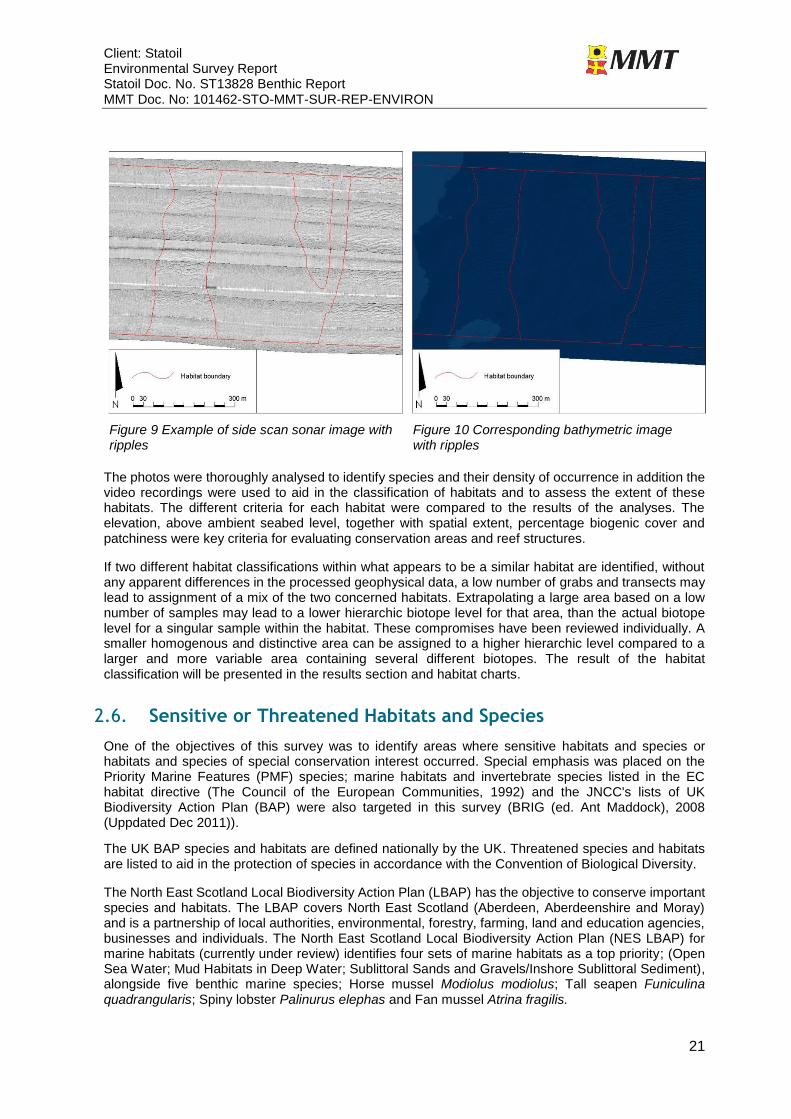
Within the environmental survey, multibeam echo sounder (MBES) and SSS data together with the epifaunal composition from ground truthing by visual survey was used to determine the extent of habitats, (example photos in Figure 9 & Figure 10). When needed, the photo/video recordings from the survey were also used to set the habitat borders. Results were extrapolated to similar areas defined from SSS and bathymetric information. The information was also used to identify potential areas for conservation.
Client: Statoil Environmental Survey Report Statoil Doc. No. ST13828 Benthic Report MMT Doc. No: 101462-STO-MMT-SUR-REP-ENVIRON
21
Figure 9 Example of side scan sonar image with ripples
Figure 10 Corresponding bathymetric image with ripples
The photos were thoroughly analysed to identify species and their density of occurrence in addition the video recordings were used to aid in the classification of habitats and to assess the extent of these habitats. The different criteria for each habitat were compared to the results of the analyses. The elevation, above ambient seabed level, together with spatial extent, percentage biogenic cover and patchiness were key criteria for evaluating conservation areas and reef structures.
If two different habitat classifications within what appears to be a similar habitat are identified, without any apparent differences in the processed geophysical data, a low number of grabs and transects may lead to assignment of a mix of the two concerned habitats. Extrapolating a large area based on a low number of samples may lead to a lower hierarchic biotope level for that area, than the actual biotope level for a singular sample within the habitat. These compromises have been reviewed individually. A smaller homogenous and distinctive area can be assigned to a higher hierarchic level compared to a larger and more variable area containing several different biotopes. The result of the habitat classification will be presented in the results section and habitat charts.
2.6. Sensitive or Threatened Habitats and Species
One of the objectives of this survey was to identify areas where sensitive habitats and species or habitats and species of special conservation interest occurred. Special emphasis was placed on the Priority Marine Features (PMF) species; marine habitats and invertebrate species listed in the EC habitat directive (The Council of the European Communities, 1992) and the JNCC's lists of UK Biodiversity Action Plan (BAP) were also targeted in this survey (BRIG (ed. Ant Maddock), 2008 (Uppdated Dec 2011)).
The UK BAP species and habitats are defined nationally by the UK. Threatened species and habitats are listed to aid in the protection of species in accordance with the Convention of Biological Diversity.
The North East Scotland Local Biodiversity Action Plan (LBAP) has the objective to conserve important species and habitats. The LBAP covers North East Scotland (Aberdeen, Aberdeenshire and Moray) and is a partnership of local authorities, environmental, forestry, farming, land and education agencies, businesses and individuals. The North East Scotland Local Biodiversity Action Plan (NES LBAP) for marine habitats (currently under review) identifies four sets of marine habitats as a top priority; (Open Sea Water; Mud Habitats in Deep Water; Sublittoral Sands and Gravels/Inshore Sublittoral Sediment), alongside five benthic marine species; Horse mussel Modiolus modiolus; Tall seapen Funiculina quadrangularis; Spiny lobster Palinurus elephas and Fan mussel Atrina fragilis.
Client: Statoil Environmental Survey Report Statoil Doc. No. ST13828 Benthic Report MMT Doc. No: 101462-STO-MMT-SUR-REP-ENVIRON
22
Priority Marine Features (PMFs), are listed by the Scottish Natural Heritage (SNH) as a guidance to which species and habitats found in existing conservation mechanisms require conservation action in Scottish territorial waters.
Marine Protected Areas (MPAs), is a term describing areas in the ocean which are protected in part or closed off completely by strict regulations. One example of MPAs is the Special Areas of Conservation, SACs designated under the Annex I and Annex II in the EC Habitats Directive.
The Export Cable Route corridor is passing through the southernmost area of the Southern Trench MPA search location. The Southern Trench MPA search location has been identified for inhabiting burrowed mud seabed habitat alongside other marine mammals and geological features.
The EC Habitat Directive specifies the European nature conservation policy. Species and habitats of special interest for conservation are specified in the different annexes to the directive. Within this survey the focus was on the Annex I (habitats of special conservation interest) and Annex II (species of special conservation interest). Among the habitats specified in Annex I are the “Reefs” (code 1170). Reefs can be of biogenic (e.g. mussel beds or corals) or geogenic origin (e.g. stony areas with epifauna).
The Oslo and Paris Conventions for the protection of the marine environment of the North-East Atlantic (OSPAR), list protected species and habitats and sensitive habitats and species in need of protection in the North-East Atlantic. This serves also as a complement to the EC Habitats Directive.
In the directives interpretation manual (EUR 27, 2007) reefs are explained as follows;
“Reefs can be either biogenic concretions or of geogenic origin. They are hard compact substrata on solid and soft bottoms, which arise from the sea floor in the sublittoral and littoral zone. Reefs may support a zonation of benthic communities of algae and animal species as well as concretions and corallogenic concretions.”
The distinction between what is to be considered a “reef” is not yet precise. This is particularly the case in relation to colonies of the tube-building polychaete, Sabellaria spinulosa and stony reefs. If for
example S. spinulosa or horse mussel (Modiolus modiolus) is found in an area, it does not automatically make the area a potential Annex I habitat. Therefore a scoring system based on a series of physical, biological and spatial characteristic reef features is used to assess the degree of ”reefiness”.
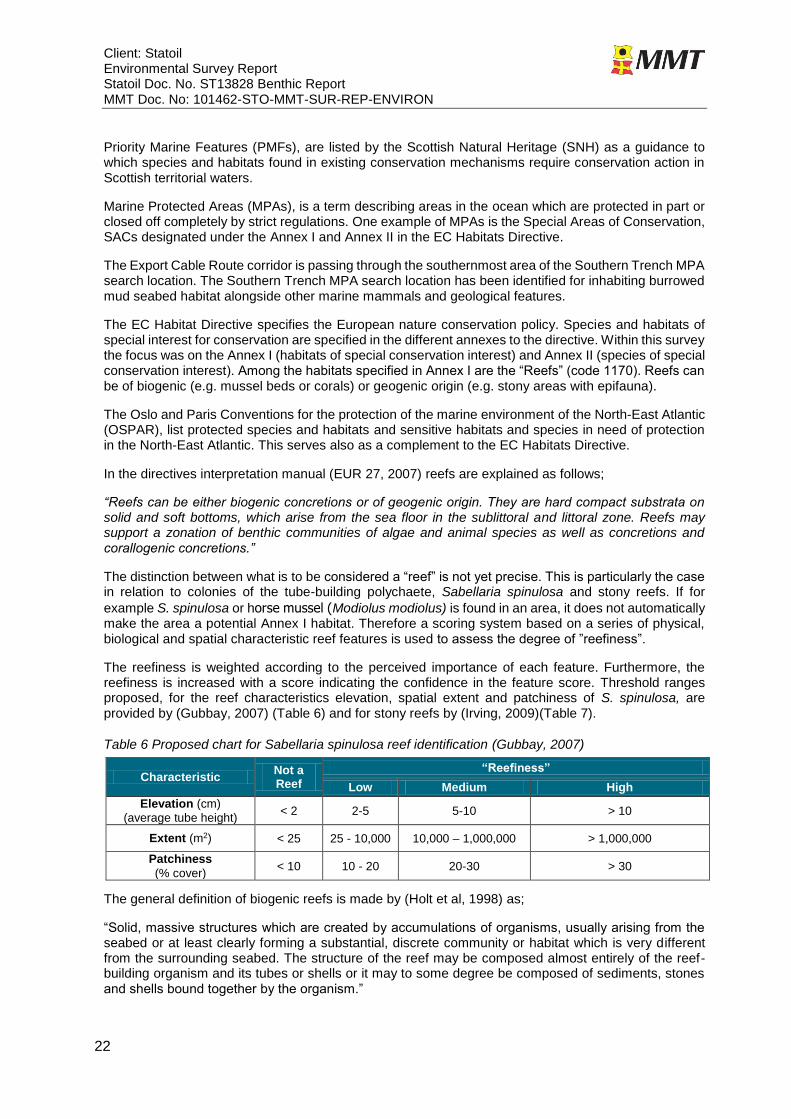
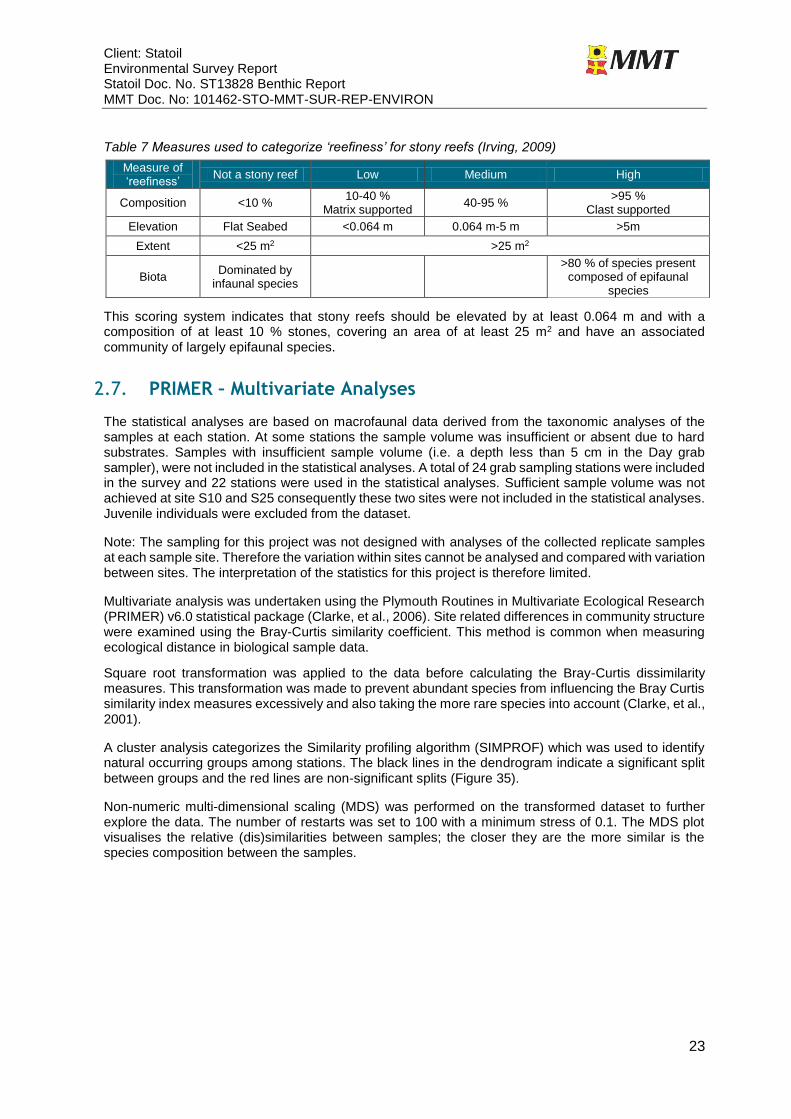
The reefiness is weighted according to the perceived importance of each feature. Furthermore, the reefiness is increased with a score indicating the confidence in the feature score. Threshold ranges proposed, for the reef characteristics elevation, spatial extent and patchiness of S. spinulosa, are provided by (Gubbay, 2007) (Table 6) and for stony reefs by (Irving, 2009)(Table 7).
Table 6 Proposed chart for Sabellaria spinulosa reef identification (Gubbay, 2007)
Characteristic Not a Reef
“Reefiness”
Low Medium High
Elevation (cm)
(average tube height) < 2 2-5 5-10 > 10
Extent (m2) < 25 25 - 10,000 10,000 – 1,000,000 > 1,000,000
Patchiness
(% cover) < 10 10 - 20 20-30 > 30
The general definition of biogenic reefs is made by (Holt et al, 1998) as;
“Solid, massive structures which are created by accumulations of organisms, usually arising from the seabed or at least clearly forming a substantial, discrete community or habitat which is very different from the surrounding seabed. The structure of the reef may be composed almost entirely of the reef-building organism and its tubes or shells or it may to some degree be composed of sediments, stones and shells bound together by the organism.”
Client: Statoil Environmental Survey Report Statoil Doc. No. ST13828 Benthic Report MMT Doc. No: 101462-STO-MMT-SUR-REP-ENVIRON
23
Table 7 Measures used to categorize ‘reefiness’ for stony reefs (Irving, 2009)
Measure of ‘reefiness’
Not a stony reef Low Medium High
Composition <10 % 10-40 %
Matrix supported 40-95 %
>95 % Clast supported
Elevation Flat Seabed <0.064 m 0.064 m-5 m >5m
Extent <25 m2 >25 m2
Biota Dominated by
infaunal species
>80 % of species present composed of epifaunal
species
This scoring system indicates that stony reefs should be elevated by at least 0.064 m and with a composition of at least 10 % stones, covering an area of at least 25 m2 and have an associated community of largely epifaunal species.
2.7. PRIMER – Multivariate Analyses
The statistical analyses are based on macrofaunal data derived from the taxonomic analyses of the samples at each station. At some stations the sample volume was insufficient or absent due to hard substrates. Samples with insufficient sample volume (i.e. a depth less than 5 cm in the Day grab sampler), were not included in the statistical analyses. A total of 24 grab sampling stations were included in the survey and 22 stations were used in the statistical analyses. Sufficient sample volume was not achieved at site S10 and S25 consequently these two sites were not included in the statistical analyses. Juvenile individuals were excluded from the dataset.
Note: The sampling for this project was not designed with analyses of the collected replicate samples at each sample site. Therefore the variation within sites cannot be analysed and compared with variation between sites. The interpretation of the statistics for this project is therefore limited.
Multivariate analysis was undertaken using the Plymouth Routines in Multivariate Ecological Research (PRIMER) v6.0 statistical package (Clarke, et al., 2006). Site related differences in community structure were examined using the Bray-Curtis similarity coefficient. This method is common when measuring ecological distance in biological sample data.
Square root transformation was applied to the data before calculating the Bray-Curtis dissimilarity measures. This transformation was made to prevent abundant species from influencing the Bray Curtis similarity index measures excessively and also taking the more rare species into account (Clarke, et al., 2001).
A cluster analysis categorizes the Similarity profiling algorithm (SIMPROF) which was used to identify natural occurring groups among stations. The black lines in the dendrogram indicate a significant split between groups and the red lines are non-significant splits (Figure 35).
Non-numeric multi-dimensional scaling (MDS) was performed on the transformed dataset to further explore the data. The number of restarts was set to 100 with a minimum stress of 0.1. The MDS plot visualises the relative (dis)similarities between samples; the closer they are the more similar is the species composition between the samples.
Client: Statoil Environmental Survey Report Statoil Doc. No. ST13828 Benthic Report MMT Doc. No: 101462-STO-MMT-SUR-REP-ENVIRON
24
3. RESULTS
The results from the environmental survey are presented in this section with a summary and a detailed description provided for the Export Cable Route and as well as for the Turbine Site Area.
In total 12 sample sites were selected within the Export Cable Route and 20 sample sites were assigned within the Turbine Site Area. Grab samples for infaunal analyses were retrieved at 24 sample sites. At these sites, samples for PSA were also collected, results Section 3.4. Samples for chemical analyses for heavy- and trace metals (for results see Section 3.5.1) as well as hydrocarbon and total carbon, Section 3.5.2 & 3.5.3, were collected at seven sites of interest, on the Export Cable Route. Bedload sampling was performed at seven sites over the entire survey area, for results see Section 3.4.3.
Three additional video transects of interest (bedrock) were assigned in the nearshore areas and three transects were added offshore to better assess the extent and quality of the Ross worm, Sabellaria spinulosa.
Note: Due to the initial route planning, sample site S13 is located on a short section of the Export Cable Route that extends into the Turbine Site Area and sample site S16 is located on the previously alternative route, also within the Turbine Site Area. For the purpose of this report and to easily illustrate their location, they are detailed under the Turbine Site Area Results (Section 3.4.2).
Client: Statoil Environmental Survey Report Statoil Doc. No. ST13828 Benthic Report MMT Doc. No: 101462-STO-MMT-SUR-REP-ENVIRON
25
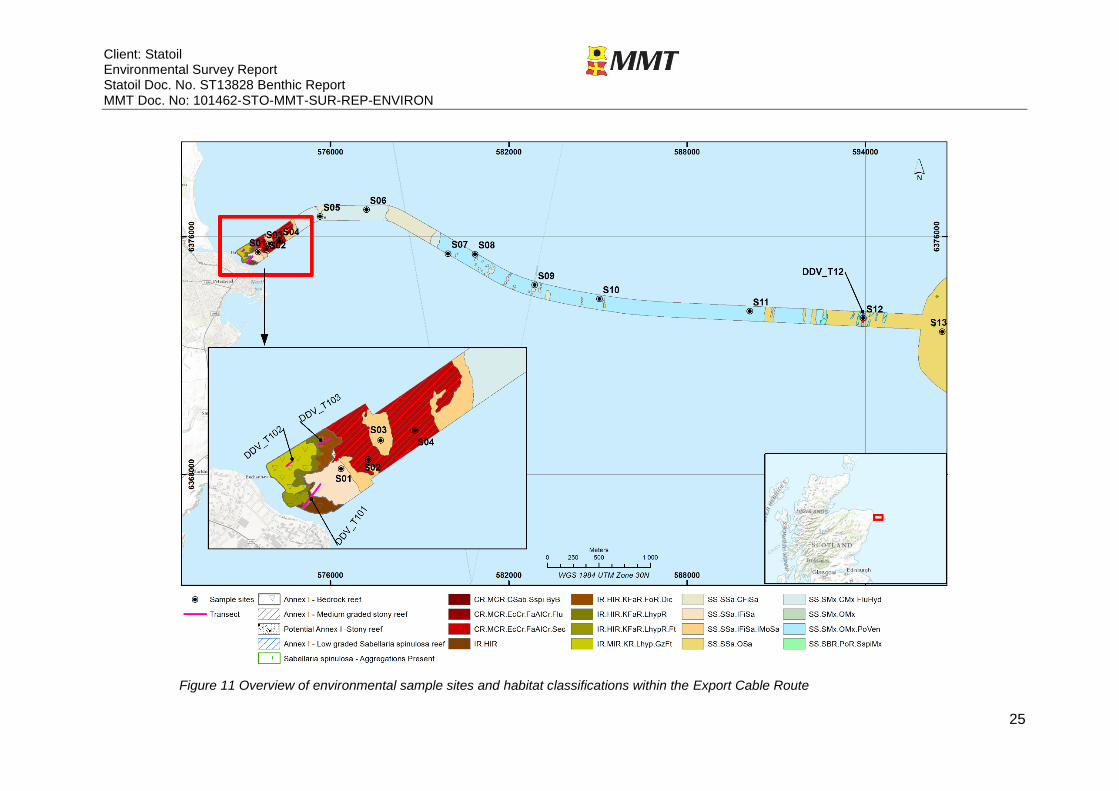
Figure 11 Overview of environmental sample sites and habitat classifications within the Export Cable Route
Client: Statoil Environmental Survey Report Statoil Doc. No. ST13828 Benthic Report MMT Doc. No: 101462-STO-MMT-SUR-REP-ENVIRON
26
3.1. Export Cable Route
The Export Cable Route stretches 25 km from shoreline out to the Turbine Site Area with depths over 100 m. The landfall area is dominated by outcropping bedrock that is affected by strong tidal waves. Aside from an area with till near the cost, Figure 11, the Export Cable Route is otherwise completely dominated by sand and gravel with different seabed features. Boulder field areas are present at locations close to shore but as depth increase, below 50 m, different sizes of ripple formations and trawl marks are the main sediment features.
In the Export Cable Route, 12 sites and four video transects were surveyed. On the sections of the Export Cable Route that extends into the Turbine Site Area another two sites were sampled, the results from these are detailed in Section 3.4.2.
At the landfall, three of these transects were assigned to ground truth the bedrock area. The bedrock was, at the shallower parts, covered with the large kelp (Laminaria hyperborea) and different species of red seaweed. The habitats present were classified as “Laminaria hyperborean with dense foliose red seaweed on exposed infralittoral rock” (IR.HIR.KFaR.LhypR) and “Faunal and algal crusts on exposed to moderately wave-exposed circalittoral rock” (CR.MCR.EcCr.FaAlCr).
At depths greater than 12 m, the kelp declined and the area turned into habitat, “Foliose red seaweed with dense Dictyota dichtoma and/or Dictyopteris membranacea on exposed lower infralittoral rock” (IR.HIR.KFaR.FoR.Dic). All landfall bedrock areas fulfilled the criteria of a “Bedrock reef” and fall under the Annex I of the EC Habitats Directive (The Council of the European Communities, 1992). In addition to the bedrock, patches of sand were sampled at sample sites S01 and S03 and classified as “Infralittoral fine sand” (SS.SSa.IFiSa) habitat. However, since S03 only contained seven different infaunal species, the lowest for all analysed grab samples, the habitat was classified as “Infralittoral mobile clean sand with sparse fauna” (SS.SSa.IFiSa.IMoSa).
The area interpreted as till at sites S02 and S04 comprised of varying sizes of boulders and blocks. Large amounts of the moss animal Securiflustra securifrons and the soft coral Alcyonium digitatum were attached to these hard substrates. Several species of starfish, anemones and squat lobsters were also present. The habitat was classified as “A. digitatum with S. securifrons on tide-swept moderately wave-exposed circalittoral rock” (CR.MCR.EcCr.FaAlCr.Sec). This habitat was scored, in accordance with (Irving, 2009), to a “Medium graded stony reef” which falls under the Annex I of the EC Habitats Directive (The Council of the European Communities, 1992).
Grab sample site S05 was located in a large sand and gravel area with frequent boulder occurrence. Here, despite a depth of approximately 50 m, the tidal currents were exceptionally strong. Sand and shell fragments were whirling fast past the camera. Attached on the boulders were several moss animals, hydrozoans and anthozoans that together formed the habitat “Flustra foliacea and Hydrallmania falcata on tide-swept circalittoral mixed sediment” (SS.SMx.CMx.FluHyd). In this boulder field the sampling site S06 was located showing an area with larger blocks in clast and matrix supported pattern that arose from the seabed. The video recordings revealed blocks rising approximately 2 m off the seabed. The coverage of the moss animals F. foliacea and S. securifrons was abundant on these blocks. A lot of different species of fish, crabs and lobsters were associated with these blocks and boulders. S06 was scored as a “Medium graded stony reef” (Irving, 2009) supporting the habitat “F. foliacea on slightly scoured silty circalittoral rock” (CR.MCR.EcCr.FaAlCr.Flu). In the vicinity of this stony reef there was an area with larger blocks and bedrock that was classified as the same habitat but only considered to be a potential stony reef due to that there was no sampling performed at that location.
Client: Statoil Environmental Survey Report Statoil Doc. No. ST13828 Benthic Report MMT Doc. No: 101462-STO-MMT-SUR-REP-ENVIRON
27
Sites S07, S10 and S11 were all sampled in the same sand and gravel area where trawl marks were frequent. All three samples showed a mixture of sediment substrates that comprised all of the fractions from sand, pebbles, and cobbles to occasional boulders. Video recordings from S07 and S10 showed a sparse epifauna in contrast to the infaunal analyses that detailed a rich diversity in S07 and S11. In S07, 65 different infaunal species were identified, which was the highest number within this survey and S11 had 23 different species of polychaeta worms identified, which was the highest number of polychaetes within the survey. S10 had a lower number of species but also an insufficient sample volume in comparison with samples S07 and S11. The infauna comprised of several worms and mussels but also numerous species of small crustaceans. The worm, Sabellaria spinulosa was present with high abundance in the sediment at S07 but no reef structures could be observed in the photo/video recordings at this site. All three sites were classified as “Polychaete-rich deep Venus community in offshore mixed sediments” (SS.SMx.OMx.PoVen).
Within the same sand and gravel area with trawl marks there were smaller patches of ripple formations where S09 was sampled from. Clean sand with low species diversity was found at this site and is therefore classified as a “Circalittoral fine sand” (SS.SSa.CFiSa) habitat.
A small area of bedrock was also present in the middle of the Export Cable Route. This outcrop was surveyed at site S08 and showed abundant epifauna. Along with soft coral A. digitatum and the star fish Asterias rubens, the bedrock surface was covered by a high density of biogenic gravel made up of S. spinulosa tubes and shell fragments. The tubes from S. spinulosa covered around 85 % of the seabed in photos but the height of the tubes was only a few centimetres and the extent of the bedrock was quite limited. This site was classified as S. spinulosa with a bryozoan turf and barnacles on silty turbid circalittoral rock” (CR.MCR.CSab.Sspi.ByB). In addition, the composition of fauna and substrate meet the criteria for a “Bedrock reef” (Irving, 2009) as well as the criteria for a low graded “S. spinulosa reef” (Gubbay, 2007). Both reef habitats were classified as Annex I
habitats of the EC Habitats Directive (The Council of the European Communities, 1992).
Where the Export Cable Route merges with the Turbine Site Area, sand and gravel with mega ripples were observed and this sediments dominates to the end of the Export Cable Route and dominates also the whole Turbine Site Area. This sediment is sampled at several sites in the Turbine Site Area and is classified as an “Offshore circalittoral sand” (SS.SSa.OSa) habitat.
S12 was sampled in this sand and gravel with mega ripples at the end of the Export Cable Route. At this site, the bathymetric data shows several flat areas with smaller ripple formations across the corridor. The photo record showed muddy sand with ripples and fragments of S. spinulosa. These aggregations were scattered continuously throughout this area and showed relatively high biological activity. Different species of flatfish, ascidians and hydrozoans were present. The elevation of the reef structures varied as did the density. Patches of these aggregations had a high seabed coverage, which can be seen in some photos, reaching almost 50 %. The average of all the sites is around 10 %. No grab sampling was performed to avoid damage to the reef.
Transect T12 was conducted to identify the extent of the reef (Figure 11). At T12, 30 photos were recorded following a straight line crossing the corridor. Patches with S. spinulosa tube aggregations were found throughout the whole transect covering as much as 52 % in one photo. The average coverage was calculated from the photos, and here it was approximately 10 %. The reef consisted of nine smaller areas crossing the cable route corridor. All these meet the criteria for the classification of a “Low graded S. spinulosa reef” with the habitat “Sabellaria spinulosa on stable circalittoral mixed sediment” (SS.SBR.PoR.SspiMx) (Gubbay, 2007).
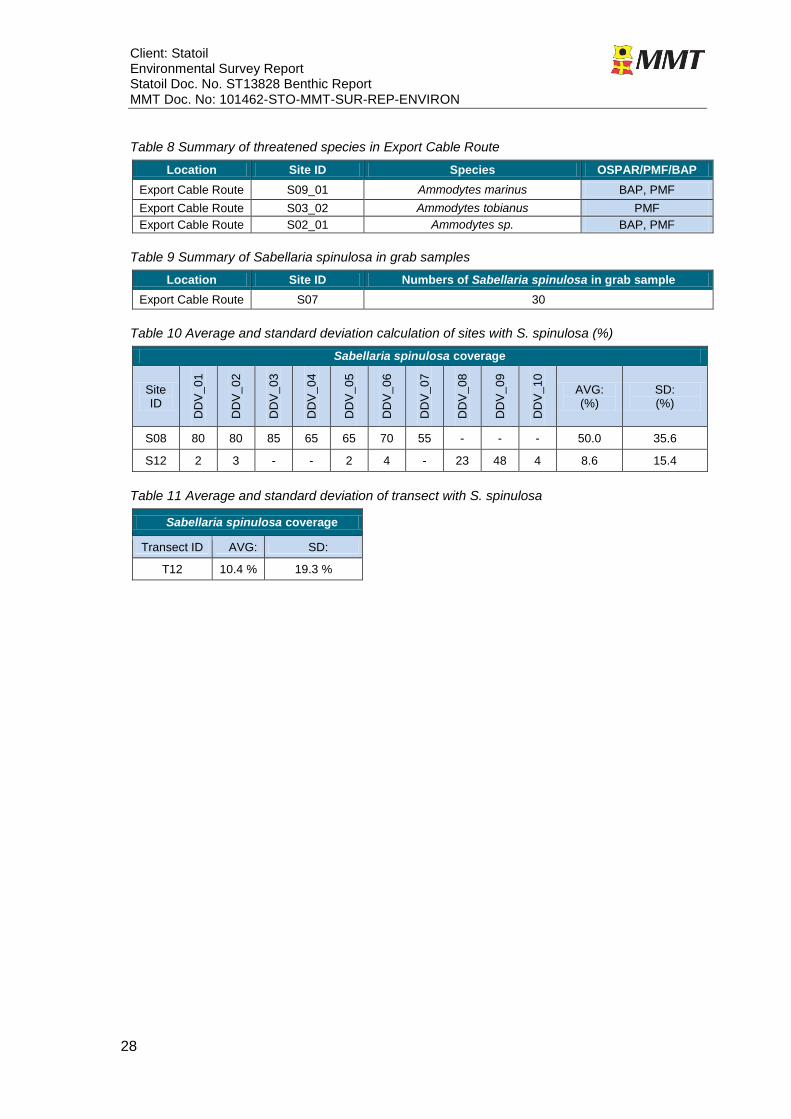
For a summary of threatened species identified within the Export Cable Route view Table 8 and for a summary of abundance of S. spinulosa identified in grab samples see Table 9.
The average and standard deviation of S. spinulosa coverage was calculated for each grab sample site from drop down photo and video (Table 10) and transect (Table 11). Furthermore a summary of sensitive habitats and sensitive habitats of special conservation interest identified within this survey can be seen in Table 12. Table 18 summarizes the occurrences of S. spinulosa where the
criteria’s were not met for a reef.
Client: Statoil Environmental Survey Report Statoil Doc. No. ST13828 Benthic Report MMT Doc. No: 101462-STO-MMT-SUR-REP-ENVIRON
28
Table 8 Summary of threatened species in Export Cable Route
Location Site ID Species OSPAR/PMF/BAP
Export Cable Route S09_01 Ammodytes marinus BAP, PMF
Export Cable Route S03_02 Ammodytes tobianus PMF
Export Cable Route S02_01 Ammodytes sp. BAP, PMF
Table 9 Summary of Sabellaria spinulosa in grab samples
Location Site ID Numbers of Sabellaria spinulosa in grab sample
Export Cable Route S07 30
Table 10 Average and standard deviation calculation of sites with S. spinulosa (%)
Sabellaria spinulosa coverage
Site ID
DD
V_
01
DD
V_
02
DD
V_
03
DD
V_
04
DD
V_
05
DD
V_
06
DD
V_
07
DD
V_
08
DD
V_
09
DD
V_
10
AVG: (%)
SD: (%)
S08 80 80 85 65 65 70 55 - - - 50.0 35.6
S12 2 3 - - 2 4 - 23 48 4 8.6 15.4
Table 11 Average and standard deviation of transect with S. spinulosa
Sabellaria spinulosa coverage
Transect ID AVG: SD:
T12 10.4 % 19.3 %
Client: Statoil Environmental Survey Report Statoil Doc. No. ST13828 Benthic Report MMT Doc. No: 101462-STO-MMT-SUR-REP-ENVIRON
29
Table 12 Sensitive and threatened habitats found within the Export Cable Route
Transect / Sample ID
Example photo Habitat classification
Observed occurrence Elevation
(cm) Coverage
(%)
Extent habitat
(m2)
Annex I Habitats
OSPAR PMF/BAP Habitats Start End
BIO_DDV_T01
IR.HIR.KfaR.LhypR.Ft Laminaria hyperborea forest with dense foliose red seaweeds on exposed upper infralittoral rock IR.HIR – High energy infralittoral rock
The transect runs partly over the bedrock reef that is situated at the landfall area of the Export Cable Route.
__ __ 361 010 Bedrock
reef __ E 573197 E 573286
N 6375116 N 6375235
BIO_DDV_T02
IR.MIR.KR.Lhyp.GzFt Grazed laminaria hyperborea forest with coraline crusts on upper infralittoral rock
The transect runs over the bedrock reef that is situated at the landfall area of the Export Cable Route.
__ __ 361 010 Bedrock
reef __
E 573019 E 573103
N 6375508 N 6375562
Client: Statoil Environmental Survey Report Statoil Doc. No. ST13828 Benthic Report MMT Doc. No: 101462-STO-MMT-SUR-REP-ENVIRON
30
Transect / Sample ID
Example photo Habitat classification
Observed occurrence Elevation
(cm) Coverage
(%)
Extent habitat
(m2)
Annex I Habitats
OSPAR PMF/BAP Habitats Start End
BIO_DDV_T03
IR.HIR.KFaR.FoR.Dic Foliose red seaweeds with dense D. dichotoma a/o D. membranacea on exposed low infralittoral rock
The transect runs over a bedrock reef that is situated at the landfall area on the Export Cable Route.
__ __ 361 010 Bedrock
reef __
IR.HIR.KfaR.LhypR Laminaria hyperborea with dense foliose red seaweeds on exposed infralittoral rock
E 573340 E 573461
N 6375717 N 6375789
BIO_DDV_T12
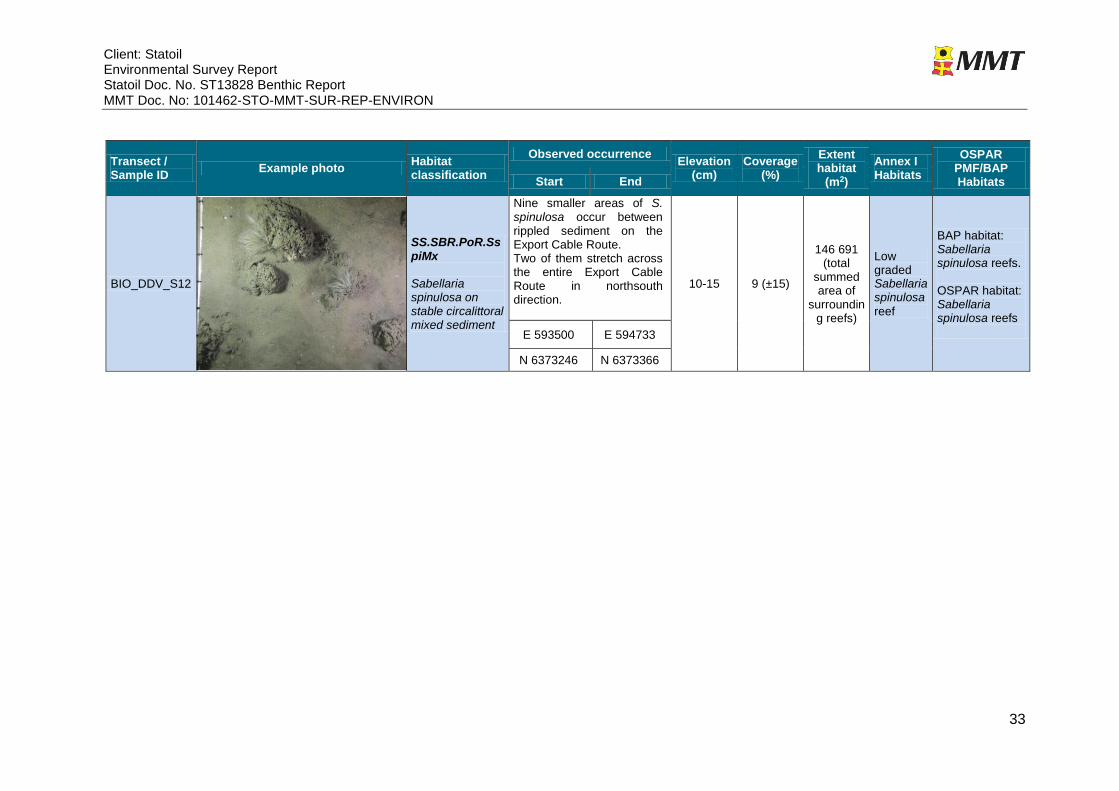
SS.SBR.PoR.SspiMx Sabellaria spinulosa on stable circalittoral mixed sediment
Nine smaller areas of S. spinulosa
occurring between rippled sediment on the Export Cable Route. Two of them stretch across the entire Export Cable Route in north-south direction.
5-10 10 (±19)
146 691 (sum of area of reefs)
Low graded
Sabellaria spinulosa
reef
BAP habitat: Sabellaria spinulosa reefs OSPAR habitat: Sabellaria spinulosa
reefs
E 593500 E 594733
N 6373246 N 6373366
Client: Statoil Environmental Survey Report Statoil Doc. No. ST13828 Benthic Report MMT Doc. No: 101462-STO-MMT-SUR-REP-ENVIRON
31
Transect / Sample ID
Example photo Habitat classification
Observed occurrence Elevation
(cm) Coverag
e (%)
Extent habitat
(m2)
Annex I Habitats
OSPAR PMF/BAP Habitats Start End
BIO_DDV_S02
CR.MCR.EcCr.FaAlCr.Sec Alcyonium digitatum with Securiflustra securifrons on tide-swept moderately wave-exposed circalittoral rock
The area of medium graded stony reef is situated in the tide swept sublittoral parts of the landfall area. The position of this site is E 573830, N 6375579. The site BIO_DDV_S04 was also located within this reef-area.
Generally>10-20
>50 549 136 Medium graded
stony reef __
BIO_DDV_S04
CR.MCR.EcCr.FaAlCr.Sec Alcyonium digitatum with Securiflustra securifrons on tide-swept moderately wave-exposed circalittoral rock
The area of medium graded stony reef is situated in the tide swept sublittoral parts of the landfall area. The position of this site is E 574286, N 637862. Site BIO_DDV_S02 is also located within this reef-area.
Generally>10-20
50-70 549 136 Medium graded
stony reef __
SSS interpretations
CR.MCR.EcCr.FaAlCr.Flu Flustra foliacea on slightly scoured silty circalittoral rock
This small area of medium graded stony reef consists of three patches and is located on the Export Cable Route with the center coordinates E 575810, N 6376644.
__ __ 2 120 Potential stony reef
__
Client: Statoil Environmental Survey Report Statoil Doc. No. ST13828 Benthic Report MMT Doc. No: 101462-STO-MMT-SUR-REP-ENVIRON
32
Transect / Sample ID
Example photo Habitat classification
Observed occurrence Elevation
(cm) Coverag
e (%)
Extent habitat
(m2)
Annex I Habitats
OSPAR PMF/BAP Habitats Start End
BIO_DDV_S06
CR.MCR.EcCr.FaAlCr.Flu Flustra foliacea on slightly scoured silty circalittoral rock
This small area of medium graded stony reef is located on the Export Cable Route with the center coordinates E 577206, N 6376916.
Max 2 m __ 1 341 Medium graded
stony reef __
BIO_DDV_S08
CR.MCR.CSab.Sspi.ByB Sabellaria spinulosa with bryozoans turf and barnacles on silty turbid circalittoral rock
Small area, with center coordinates E 580872, N 6375405 on the Export Cable Route.
__ 50 (±36) 1 346
Low graded
Sabellaria spinulosa
reef/ Bedrock
reef
OSPAR habitat: Sabellaria
spinulosa reefs
SSS interpretations
SS.SBR.PoR.SspiMx Sabellaria spinulosa on stable circalittoral mixed sediment
Smaller area of Sabellaria spinulosa occurrences as interpreted from SSS and bathymetrical data along with information from S12. It stretches across the entire Export Cable Route in north-south direction.
__ __ 54750
Low graded
Sabellaria spinulosa
reef
BAP habitat: Sabellaria
spinulosa reefs.
OSPAR habitat: Sabellaria
spinulosa reefs
E 592559 E 592727
N 6373193 N 6373256
Client: Statoil Environmental Survey Report Statoil Doc. No. ST13828 Benthic Report MMT Doc. No: 101462-STO-MMT-SUR-REP-ENVIRON
33
Transect / Sample ID
Example photo Habitat classification
Observed occurrence Elevation
(cm) Coverage
(%)
Extent habitat
(m2)
Annex I Habitats
OSPAR PMF/BAP Habitats Start End
BIO_DDV_S12
SS.SBR.PoR.SspiMx Sabellaria spinulosa on stable circalittoral mixed sediment
Nine smaller areas of S. spinulosa occur between rippled sediment on the Export Cable Route. Two of them stretch across the entire Export Cable Route in northsouth direction.
10-15 9 (±15)
146 691 (total
summed area of
surrounding reefs)
Low graded Sabellaria spinulosa
reef
BAP habitat: Sabellaria spinulosa reefs. OSPAR habitat: Sabellaria spinulosa reefs E 593500 E 594733
N 6373246 N 6373366
Client: Statoil Environmental Survey Report Statoil Doc. No. ST13828 Benthic Report MMT Doc. No: 101462-STO-MMT-SUR-REP-ENVIRON
34
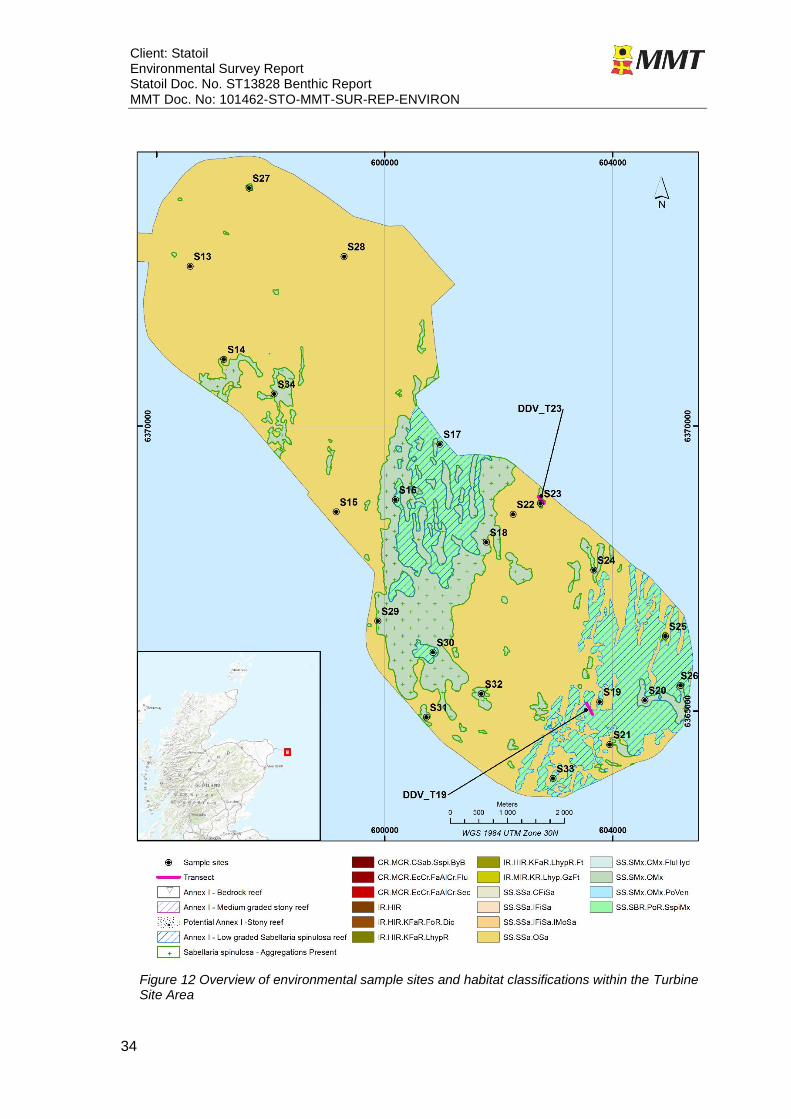
Figure 12 Overview of environmental sample sites and habitat classifications within the Turbine Site Area
Client: Statoil Environmental Survey Report Statoil Doc. No. ST13828 Benthic Report MMT Doc. No: 101462-STO-MMT-SUR-REP-ENVIRON
35
3.2. Turbine Site Area
The Turbine Site Area covers an area of 47 km2 approximately 25 km of the east coast of Scotland. The northwest part of the Turbine Site Area, with depths of around 100 m, is dominated by sand and gravel sediments with mega ripples. This type habitat constitutes almost half of the Turbine Site Area (Figure 12). The northwest areas also contain patches of scattered boulders (MMT Doc. No. 101462-STO-MMT-SUR-REP-ST13828).
With a depth of 118 m the seabed surface starts to flatten out in the centre of the Turbine Site Area. At this levelled area, a large continual field of frequent boulders is present covering over 7 km2. This is also the deepest part of the whole Turbine Site Area (MMT Doc. No. 101462-STO-MMT-SUR-REP-ST13828).
Southeast of the central area, the depth slowly decreases to around 100 m at the very end of the Turbine Site Area. Here, there are large fields with mega ripples consistent of sand and gravel situated between scattered and frequently occurring boulders (MMT Doc. No. 101462-STO-MMT-SUR-REP-ST13828).
In the Turbine Site Area, 20 sites as well as two video transects were surveyed ground truthing the area. On the short sections of the Export Cable Route that extend into the Turbine Site Area another two sites were sampled, the results from these will be also detailed within this section for easier illustration.
In the northwest, large sand and gravel areas were identified at sites S13, S14, S15, S28 and S34. The photos taken showed a very sparse epifauna among the sand with ripple features.
The video recordings showed similar patterns but at site S14, a small aggregation of S. spinulosa tubes was present. The boulder field present in the direct vicinity of S14 is likely to house S. spinulosa as well. Analysed infauna, from the five samples, showed a difference in the number of identified species, between 19 and 38. However, they all showed that the predominant species in those samples was very similar which indicated that they belonged to the same habitat. With depth over 100 m and clean sand with sparse epifauna these areas were classified as “Offshore circalittoral sand” (SS.SSa.OSa).
Within this habitat (SS.SSa.OSa) there were patches of smaller boulder fields. Site S27 was assigned to one of these fields and the analysed data showed that the seabed in this field comprised of sand with shell fragments and ripple formations in addition to occasional aggregations of S. spinulosa tubes. Only a couple of smaller aggregations of S. spinulosa, with an elevation of around 10 cm, were visible in the video recordings. The coverage was generally low, about 1% of the seabed, but when tube aggregations were present in the photos the species were diverse with higher presence of shrimps, sponge animals and sessile cnidarians. The boulder fields were classified as “Offshore circalittoral mixed sediment” (SS.SMx.OMx) habitat but not as an Annex I reef structure due to low coverage of the S. spinulosa (Gubbay, 2007).
The central of the Turbine Site Area is the deepest, 118 m, and is also most levelled. Here, six sites, S16, S17, S18, S29, S30 and S31, were assigned to ground truth the large field of frequent boulders. At each of these sites aggregations of S. spinulosa tubes were present in both video and photos there was however a significant difference in seabed coverage when comparing between the sites.
Client: Statoil Environmental Survey Report Statoil Doc. No. ST13828 Benthic Report MMT Doc. No: 101462-STO-MMT-SUR-REP-ENVIRON
36
Sites S16, S18, S29 and S31 had a coverage of approximately 1 % of tube aggregations. While, sites S17 and S30 had a coverage reaching up to about 10 %. At S17 and S30 the sediment was in general comprised of sand with biogenic gravel from S. spinulosa tubes or larger aggregations of fixed tubes. The aggregated S. spinulosa structures were elevated significantly from the seabed and in some places they had an elevation over 10 cm. The diversity, at these aggregations, was also significantly higher with flatfish, arthropods, cnidarians and echinoderms when compared to that of a flat sandy bottom located between the aggregations.
The coverage differences coincide with the boulder density interpreted from SSS and multibeam data concluding in that the interpreted boulder area consisted of two habitats; “Offshore circalittoral mixed sediment” (SS.SMx.OMx) (S16, S17, S18, S29, S30 and S31) and “S. spinulosa on stable circalittoral mixed sediment” (SS.SBR.PoR.SspiMx) (S17 and S30). With the higher coverage of about 10 % and significant elevation areas at sites S17 and S30, the criteria for “Low graded S. spinulosa reef” (Gubbay, 2007) was met.
With decreasing depths towards southeast, the centre boulder field area fades into sand ripples with a few scattered boulder fields. Site S22 validated that the “Offshore circalittoral sand” (SS.SSa.OSa) habitat continued through the Turbine Site Area while S23, S24 and S32 confirmed that the boulder fields comprised of S. spinulosa aggregations, generally with low coverage of
approximately 1 %.
The aggregations around sites S23, S24 and S32 were not elevated significantly above the seabed. Various species of hydrozoans, crustaceans, cnidarians and fish were present around the few aggregations. With generally low coverage of around 1 % none of the sites, where S. spinulosa tube aggregations were present, were considered to meet the criteria of an Annex I reef. These sites were classified as ”Offshore circalittoral mixed sediment” (SS.SMx.OMx). Transect T23, in the vicinity of grab sample site S23, was conducted and showed that the tube aggregations did not continue past the interpreted boulder area and further into the sand ripple area.
In the southeast corner the depth slowly decreases to around 100 m. Six grab sample sites and 1 transect were assigned to this area (Figure 12). A mixed pattern of sand with ripples and numerous boulder fields characterised this area according to the geophysical survey report (MMT Doc. No. 101462-STO-MMT-SUR-REP-ST13828). All six sites, S19, S20, S21, S25, S26 and S33, as well as transect T19 were located within the same boulder field area but with different boulder density. All sites demonstrated aggregations of S. spinulosa tubes in video and photo recordings.
The coverage varied between the sites. Sites S19, S26 and S33 together with transect T19 had an average coverage of 8 to 14 % in fields where numerous boulders were interpreted from the geophysical survey (MMT Doc. No. 101462-STO-MMT-SUR-REP-ST13828). In the area around sites S20, S21 and S25 the S. spinulosa aggregations were found to have a lower coverage of around 0.2 to 5 %. These sites, with the lower S. spinulosa coverage, showed during the ground truthing a seabed of clean silty sand with small shell fragments and almost no epifauna present between the S. spinulosa aggregations. The aggregations had in general a low elevation and did not meet the criteria for a reef. These areas were therefore classified as “Offshore circalittoral mixed sediment” (SS.SMx.OMx).
Sites where a higher S. spinulosa coverage was interpreted, around 10 %, had aggregations with a clear elevation from seabed surface, up to 15 cm. The spacing and elevation gave an image of a reef that was common throughout the videos. The reef was inhabited by anemones, hydrozoans, arthropods, echinoderms and flatfishes which were observed around the tube aggregations. In the surrounding soft sediments, holes from burrowing infauna were observed.
Client: Statoil Environmental Survey Report Statoil Doc. No. ST13828 Benthic Report MMT Doc. No: 101462-STO-MMT-SUR-REP-ENVIRON
37
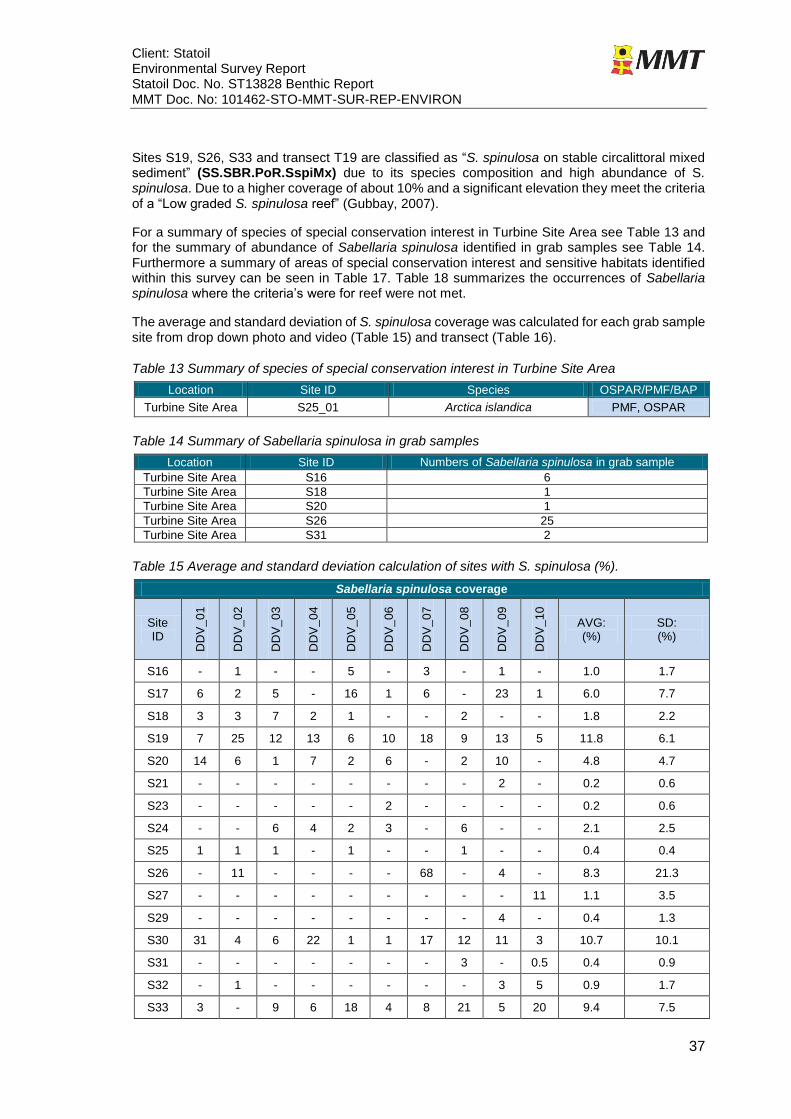
Sites S19, S26, S33 and transect T19 are classified as “S. spinulosa on stable circalittoral mixed sediment” (SS.SBR.PoR.SspiMx) due to its species composition and high abundance of S. spinulosa. Due to a higher coverage of about 10% and a significant elevation they meet the criteria of a “Low graded S. spinulosa reef” (Gubbay, 2007).
For a summary of species of special conservation interest in Turbine Site Area see Table 13 and for the summary of abundance of Sabellaria spinulosa identified in grab samples see Table 14. Furthermore a summary of areas of special conservation interest and sensitive habitats identified within this survey can be seen in Table 17. Table 18 summarizes the occurrences of Sabellaria spinulosa where the criteria’s were for reef were not met.
The average and standard deviation of S. spinulosa coverage was calculated for each grab sample site from drop down photo and video (Table 15) and transect (Table 16).
Table 13 Summary of species of special conservation interest in Turbine Site Area
Location Site ID Species OSPAR/PMF/BAP
Turbine Site Area S25_01 Arctica islandica PMF, OSPAR
Table 14 Summary of Sabellaria spinulosa in grab samples
Location Site ID Numbers of Sabellaria spinulosa in grab sample
Turbine Site Area S16 6
Turbine Site Area S18 1
Turbine Site Area S20 1
Turbine Site Area S26 25
Turbine Site Area S31 2
Table 15 Average and standard deviation calculation of sites with S. spinulosa (%).
Sabellaria spinulosa coverage
Site ID
DD
V_
01
DD
V_
02
DD
V_
03
DD
V_
04
DD
V_
05
DD
V_
06
DD
V_
07
DD
V_
08
DD
V_
09
DD
V_
10
AVG: (%)
SD: (%)
S16 - 1 - - 5 - 3 - 1 - 1.0 1.7
S17 6 2 5 - 16 1 6 - 23 1 6.0 7.7
S18 3 3 7 2 1 - - 2 - - 1.8 2.2
S19 7 25 12 13 6 10 18 9 13 5 11.8 6.1
S20 14 6 1 7 2 6 - 2 10 - 4.8 4.7
S21 - - - - - - - - 2 - 0.2 0.6
S23 - - - - - 2 - - - - 0.2 0.6
S24 - - 6 4 2 3 - 6 - - 2.1 2.5
S25 1 1 1 - 1 - - 1 - - 0.4 0.4
S26 - 11 - - - - 68 - 4 - 8.3 21.3
S27 - - - - - - - - - 11 1.1 3.5
S29 - - - - - - - - 4 - 0.4 1.3
S30 31 4 6 22 1 1 17 12 11 3 10.7 10.1
S31 - - - - - - - 3 - 0.5 0.4 0.9
S32 - 1 - - - - - - 3 5 0.9 1.7
S33 3 - 9 6 18 4 8 21 5 20 9.4 7.5
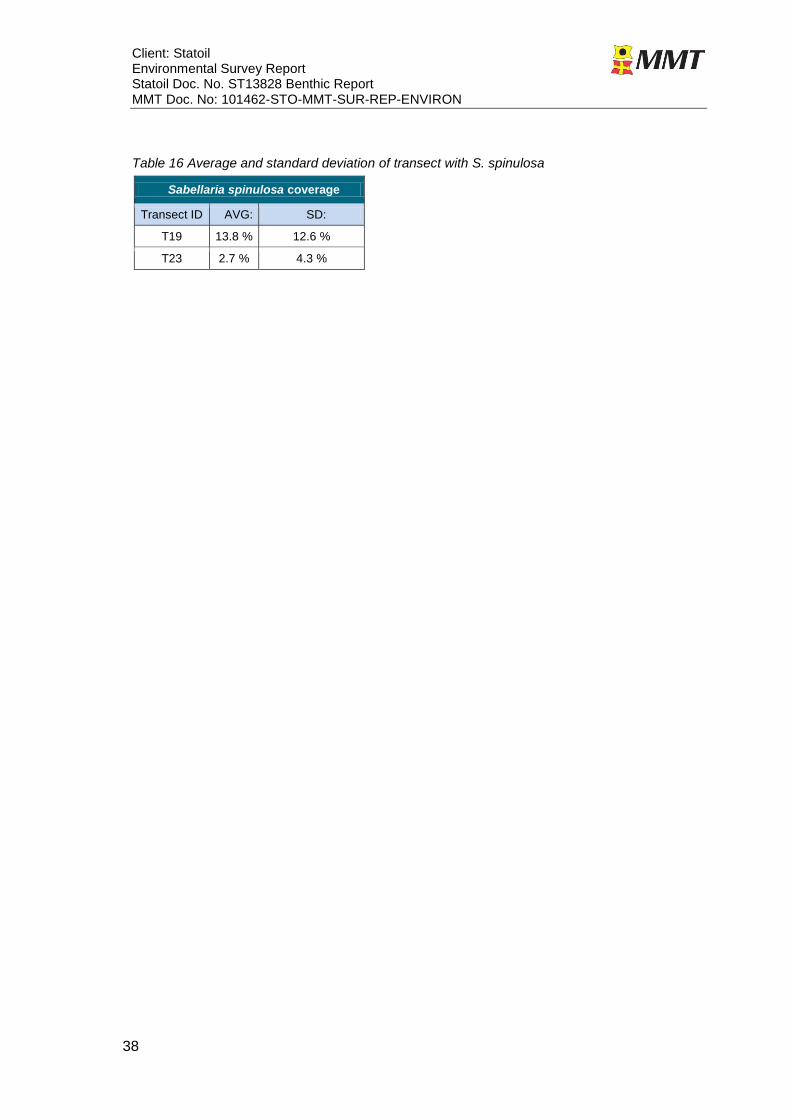
Client: Statoil Environmental Survey Report Statoil Doc. No. ST13828 Benthic Report MMT Doc. No: 101462-STO-MMT-SUR-REP-ENVIRON
38
Table 16 Average and standard deviation of transect with S. spinulosa
Sabellaria spinulosa coverage
Transect ID AVG: SD:
T19 13.8 % 12.6 %
T23 2.7 % 4.3 %
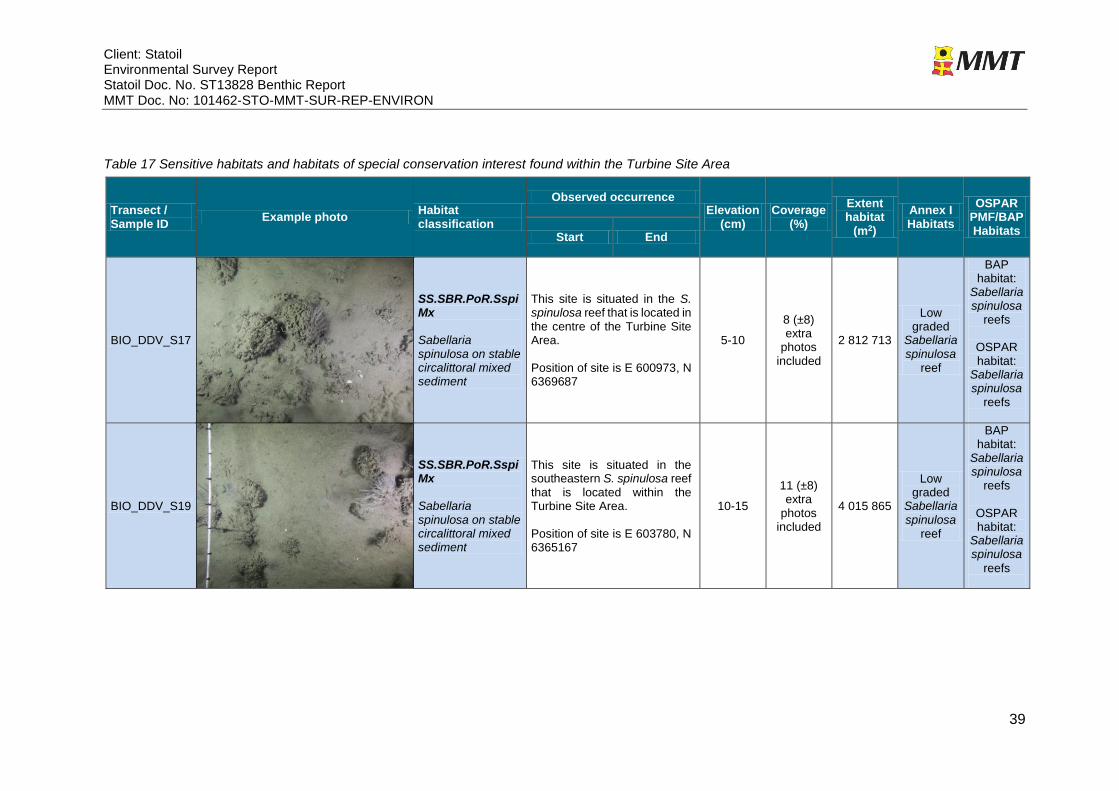
Client: Statoil Environmental Survey Report Statoil Doc. No. ST13828 Benthic Report MMT Doc. No: 101462-STO-MMT-SUR-REP-ENVIRON
39
Table 17 Sensitive habitats and habitats of special conservation interest found within the Turbine Site Area
Transect / Sample ID
Example photo Habitat classification
Observed occurrence Elevation
(cm) Coverage
(%)
Extent habitat
(m2)
Annex I Habitats
OSPAR PMF/BAP Habitats
Start End
BIO_DDV_S17
SS.SBR.PoR.SspiMx Sabellaria spinulosa on stable circalittoral mixed sediment
This site is situated in the S. spinulosa reef that is located in the centre of the Turbine Site Area. Position of site is E 600973, N 6369687
5-10
8 (±8) extra
photos included
2 812 713
Low graded
Sabellaria spinulosa
reef
BAP habitat:
Sabellaria spinulosa
reefs
OSPAR habitat:
Sabellaria spinulosa
reefs
BIO_DDV_S19
SS.SBR.PoR.SspiMx Sabellaria spinulosa on stable circalittoral mixed sediment
This site is situated in the southeastern S. spinulosa reef that is located within the Turbine Site Area. Position of site is E 603780, N 6365167
10-15
11 (±8) extra
photos included
4 015 865
Low graded
Sabellaria spinulosa
reef
BAP habitat:
Sabellaria spinulosa
reefs
OSPAR habitat:
Sabellaria spinulosa
reefs
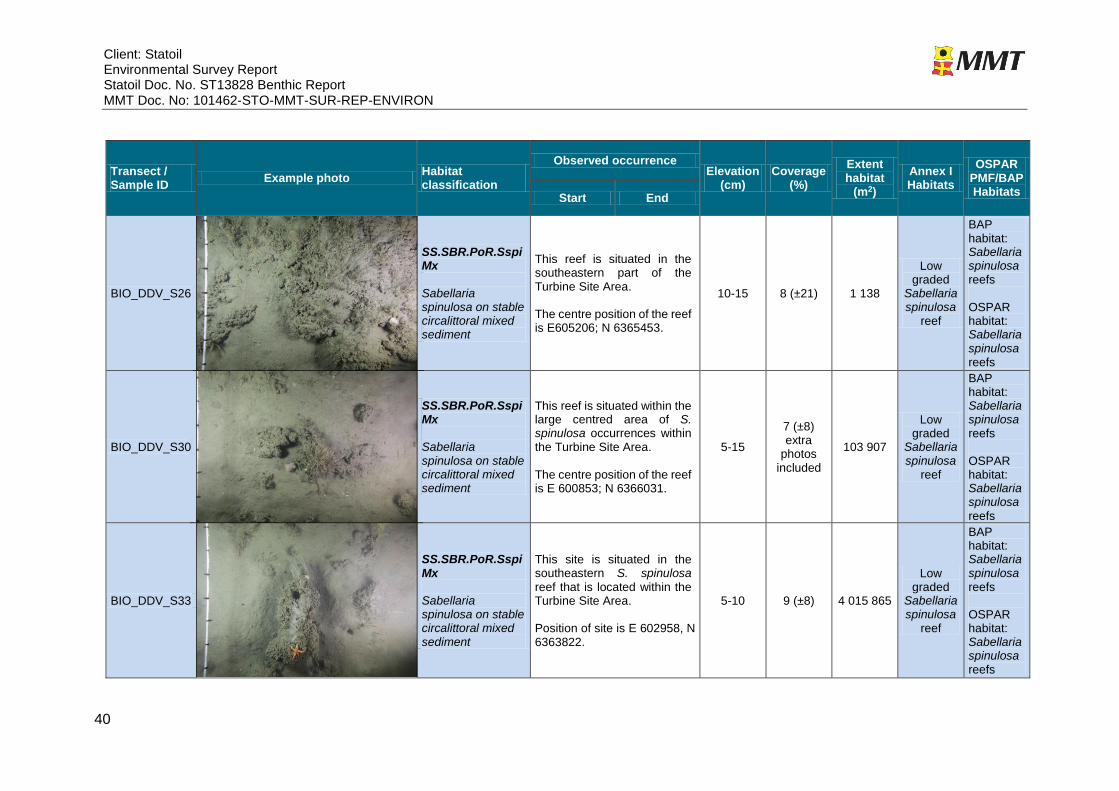
Client: Statoil Environmental Survey Report Statoil Doc. No. ST13828 Benthic Report MMT Doc. No: 101462-STO-MMT-SUR-REP-ENVIRON
40
Transect / Sample ID
Example photo Habitat classification
Observed occurrence Elevation
(cm) Coverage
(%)
Extent habitat
(m2)
Annex I Habitats
OSPAR PMF/BAP Habitats
Start End
BIO_DDV_S26
SS.SBR.PoR.SspiMx Sabellaria spinulosa on stable circalittoral mixed sediment
This reef is situated in the southeastern part of the Turbine Site Area. The centre position of the reef is E605206; N 6365453.
10-15 8 (±21) 1 138
Low graded
Sabellaria spinulosa
reef
BAP habitat: Sabellaria spinulosa reefs OSPAR habitat: Sabellaria spinulosa reefs
BIO_DDV_S30
SS.SBR.PoR.SspiMx Sabellaria spinulosa on stable circalittoral mixed sediment
This reef is situated within the large centred area of S. spinulosa occurrences within the Turbine Site Area. The centre position of the reef is E 600853; N 6366031.
5-15
7 (±8) extra
photos included
103 907
Low graded
Sabellaria spinulosa
reef
BAP habitat: Sabellaria spinulosa reefs OSPAR habitat: Sabellaria spinulosa
reefs
BIO_DDV_S33
SS.SBR.PoR.SspiMx Sabellaria spinulosa on stable circalittoral mixed sediment
This site is situated in the southeastern S. spinulosa reef that is located within the Turbine Site Area. Position of site is E 602958, N 6363822.
5-10 9 (±8) 4 015 865
Low graded
Sabellaria spinulosa
reef
BAP habitat: Sabellaria spinulosa reefs OSPAR habitat: Sabellaria spinulosa reefs
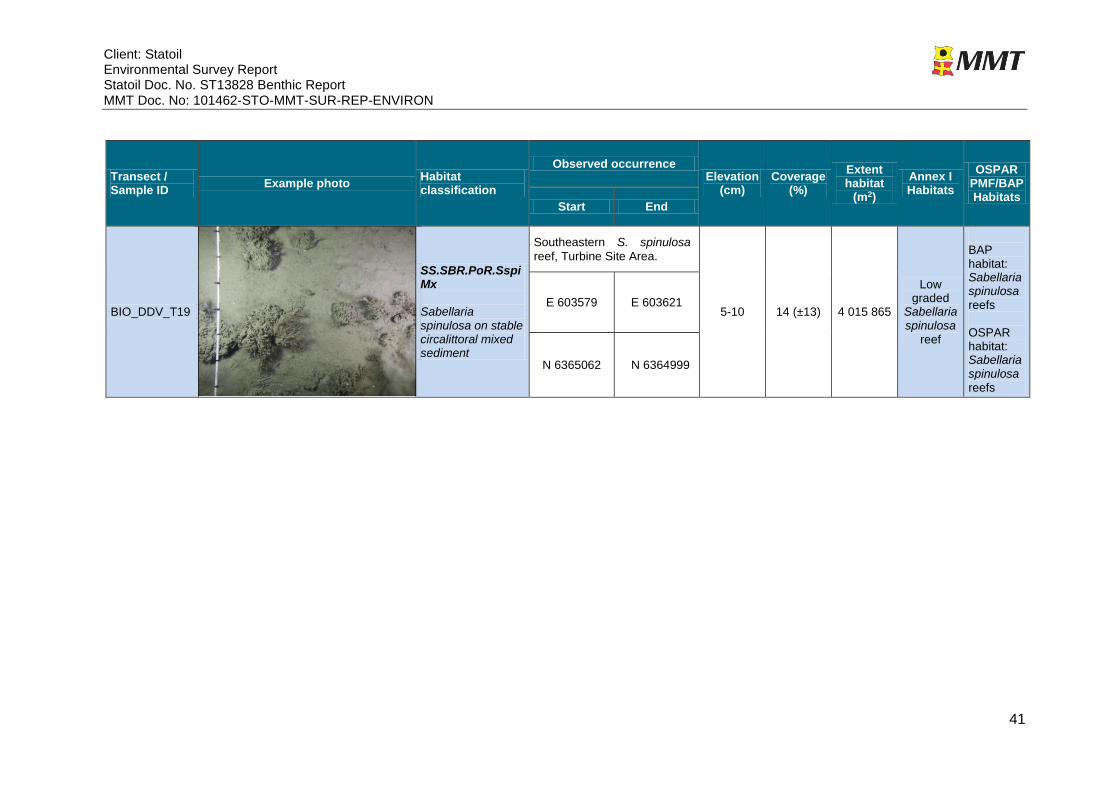
Client: Statoil Environmental Survey Report Statoil Doc. No. ST13828 Benthic Report MMT Doc. No: 101462-STO-MMT-SUR-REP-ENVIRON
41
Transect / Sample ID
Example photo Habitat classification
Observed occurrence Elevation
(cm) Coverage
(%)
Extent habitat
(m2)
Annex I Habitats
OSPAR PMF/BAP Habitats
Start End
BIO_DDV_T19
SS.SBR.PoR.SspiMx Sabellaria spinulosa on stable circalittoral mixed sediment
Southeastern S. spinulosa
reef, Turbine Site Area.
5-10 14 (±13) 4 015 865
Low graded
Sabellaria spinulosa
reef
BAP habitat: Sabellaria spinulosa reefs OSPAR habitat: Sabellaria spinulosa reefs
E 603579 E 603621
N 6365062 N 6364999
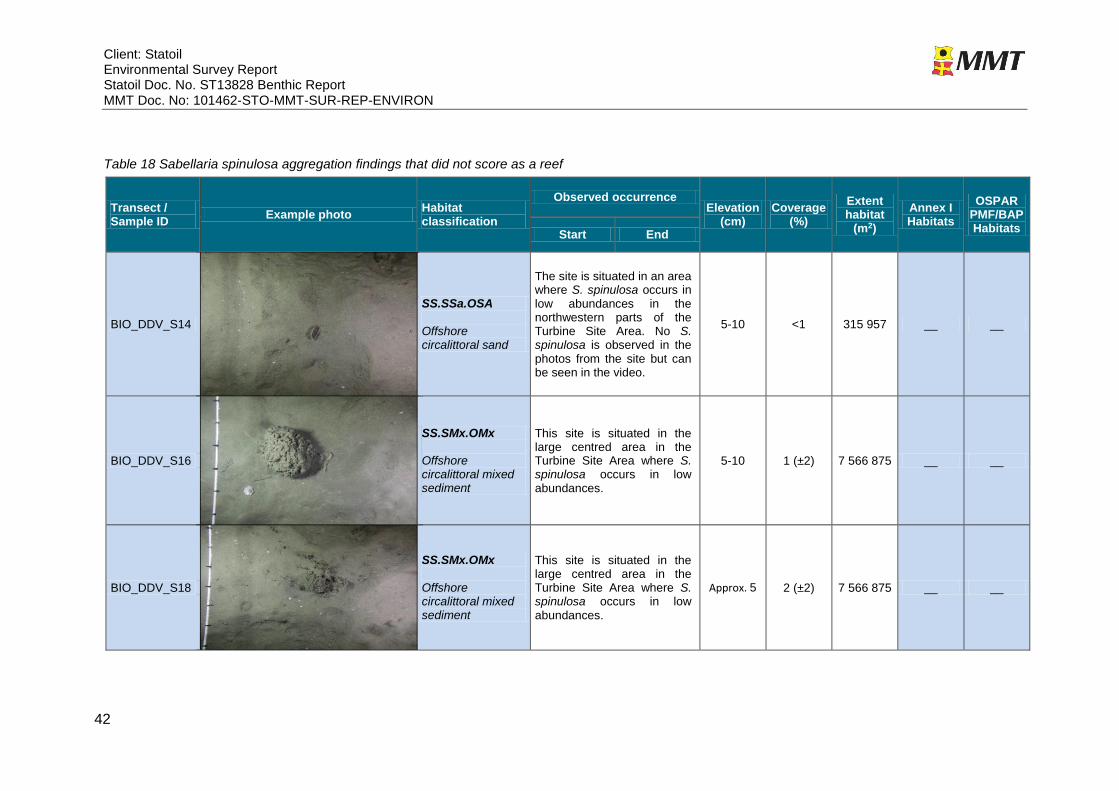
Client: Statoil Environmental Survey Report Statoil Doc. No. ST13828 Benthic Report MMT Doc. No: 101462-STO-MMT-SUR-REP-ENVIRON
42
Table 18 Sabellaria spinulosa aggregation findings that did not score as a reef
Transect / Sample ID
Example photo Habitat classification
Observed occurrence Elevation
(cm) Coverage
(%)
Extent habitat
(m2)
Annex I Habitats
OSPAR PMF/BAP Habitats
Start End
BIO_DDV_S14
SS.SSa.OSA Offshore circalittoral sand
The site is situated in an area where S. spinulosa occurs in low abundances in the northwestern parts of the Turbine Site Area. No S. spinulosa is observed in the photos from the site but can be seen in the video.
5-10 <1 315 957 __ __
BIO_DDV_S16
SS.SMx.OMx Offshore circalittoral mixed sediment
This site is situated in the large centred area in the Turbine Site Area where S. spinulosa occurs in low abundances.
5-10 1 (±2) 7 566 875 __ __
BIO_DDV_S18
SS.SMx.OMx Offshore circalittoral mixed sediment
This site is situated in the large centred area in the Turbine Site Area where S. spinulosa occurs in low abundances.
Approx. 5 2 (±2) 7 566 875 __ __
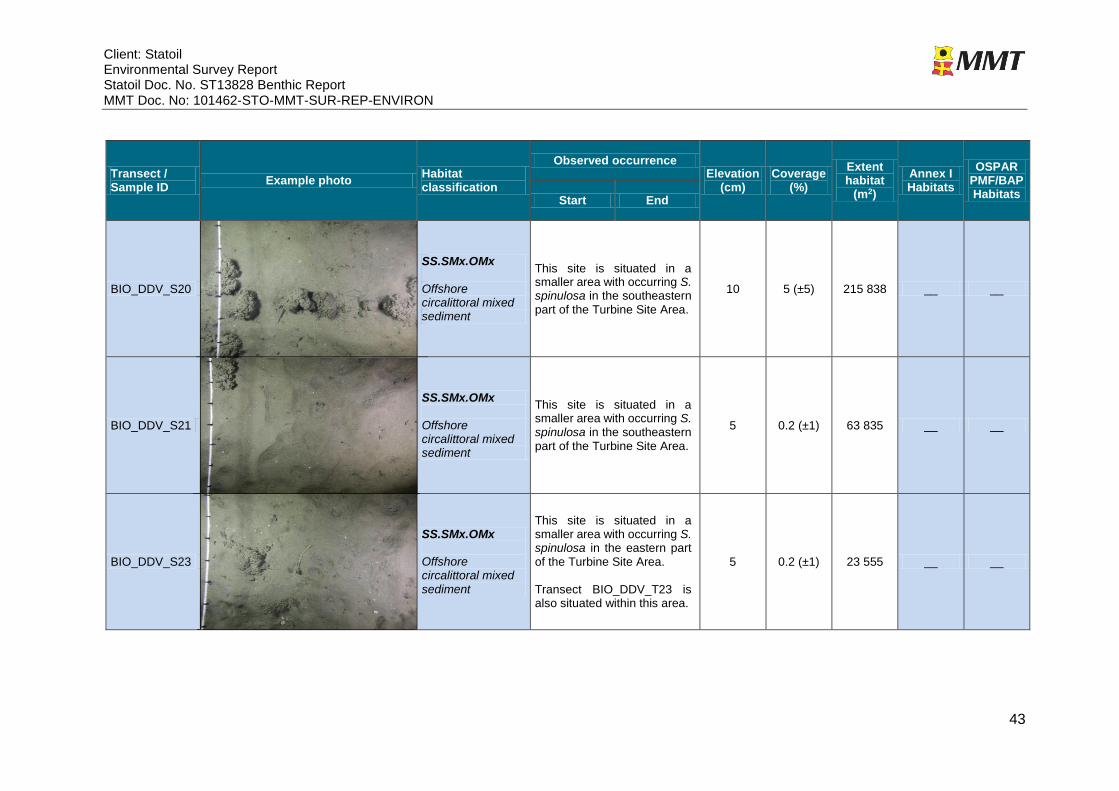
Client: Statoil Environmental Survey Report Statoil Doc. No. ST13828 Benthic Report MMT Doc. No: 101462-STO-MMT-SUR-REP-ENVIRON
43
Transect / Sample ID
Example photo Habitat classification
Observed occurrence Elevation
(cm) Coverage
(%)
Extent habitat
(m2)
Annex I Habitats
OSPAR PMF/BAP Habitats
Start End
BIO_DDV_S20
SS.SMx.OMx Offshore circalittoral mixed sediment
This site is situated in a smaller area with occurring S. spinulosa in the southeastern part of the Turbine Site Area.
10 5 (±5) 215 838 __ __
BIO_DDV_S21
SS.SMx.OMx Offshore circalittoral mixed sediment
This site is situated in a smaller area with occurring S. spinulosa in the southeastern part of the Turbine Site Area.
5 0.2 (±1) 63 835 __ __
BIO_DDV_S23
SS.SMx.OMx Offshore circalittoral mixed sediment
This site is situated in a smaller area with occurring S. spinulosa in the eastern part of the Turbine Site Area. Transect BIO_DDV_T23 is also situated within this area.
5 0.2 (±1) 23 555 __ __
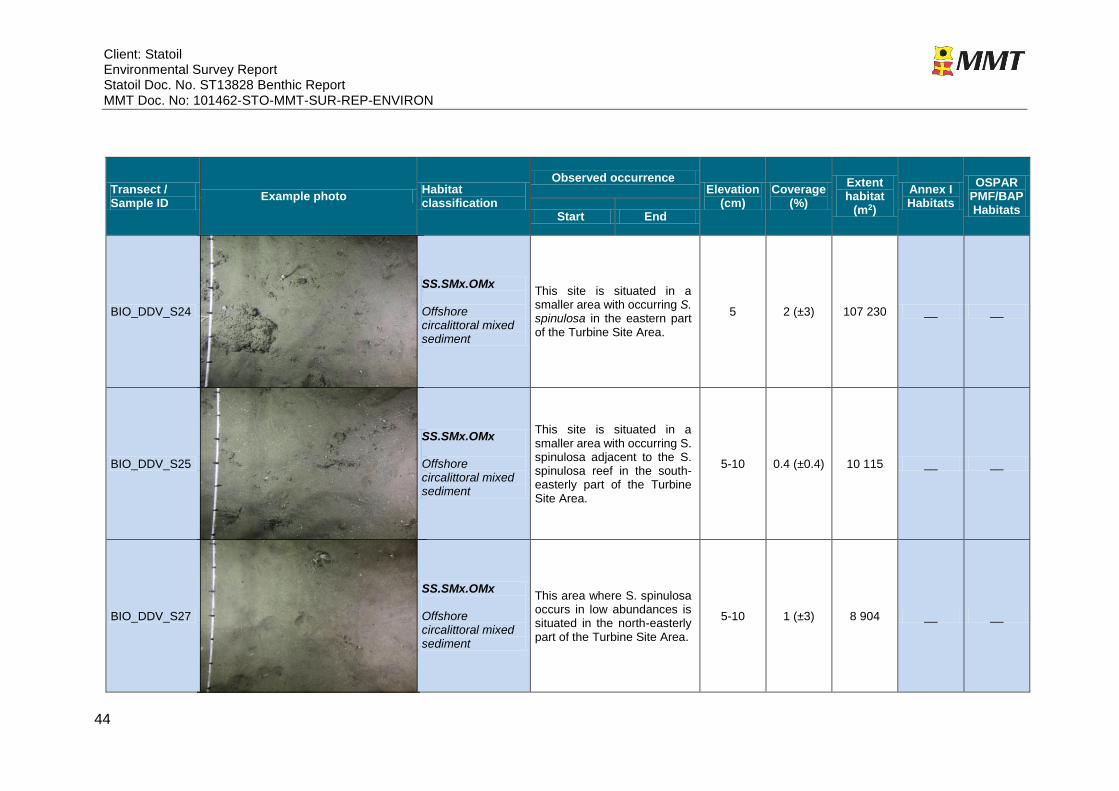
Client: Statoil Environmental Survey Report Statoil Doc. No. ST13828 Benthic Report MMT Doc. No: 101462-STO-MMT-SUR-REP-ENVIRON
44
Transect / Sample ID
Example photo Habitat classification
Observed occurrence Elevation
(cm) Coverage
(%)
Extent habitat
(m2)
Annex I Habitats
OSPAR PMF/BAP Habitats
Start End
BIO_DDV_S24
SS.SMx.OMx Offshore circalittoral mixed sediment
This site is situated in a smaller area with occurring S. spinulosa in the eastern part of the Turbine Site Area.
5 2 (±3) 107 230 __ __
BIO_DDV_S25
SS.SMx.OMx Offshore circalittoral mixed sediment
This site is situated in a smaller area with occurring S. spinulosa adjacent to the S. spinulosa reef in the south-easterly part of the Turbine Site Area.
5-10 0.4 (±0.4) 10 115 __ __
BIO_DDV_S27
SS.SMx.OMx Offshore circalittoral mixed sediment
This area where S. spinulosa occurs in low abundances is situated in the north-easterly part of the Turbine Site Area.
5-10 1 (±3) 8 904 __ __

Client: Statoil Environmental Survey Report Statoil Doc. No. ST13828 Benthic Report MMT Doc. No: 101462-STO-MMT-SUR-REP-ENVIRON
45
Sample ID Transect ID
Example photo Habitat classification
Observed occurrence Elevation
(cm) Coverage
(%)
Extent habitat
(m2)
Annex I Habitats
OSPAR PMF/BAP Habitats
Start End
BIO_DDV_S29
SS.SMx.OMx Offshore circalittoral mixed sediment
This site is situated in the large centred area in the Turbine Site Area where S. spinulosa occurs in low abundances.
5-10 0.4 (±1) 7 566 875 __ __
BIO_DDV_S31
SS.SMx.OMx Offshore circalittoral mixed sediment
This area where S. spinulosa occurs in low abundances is situated in the south-westerly part of the Turbine Site Area.
5-10 0.4 (±1) 38 716 __ __
BIO_DDV_S32
SS.SMx.OMx Offshore circalittoral mixed sediment
This area where S. spinulosa occurs in low abundances is situated in the south-westerly part of the Turbine Site Area.
5-10 1 (±2) 74 072 __ __
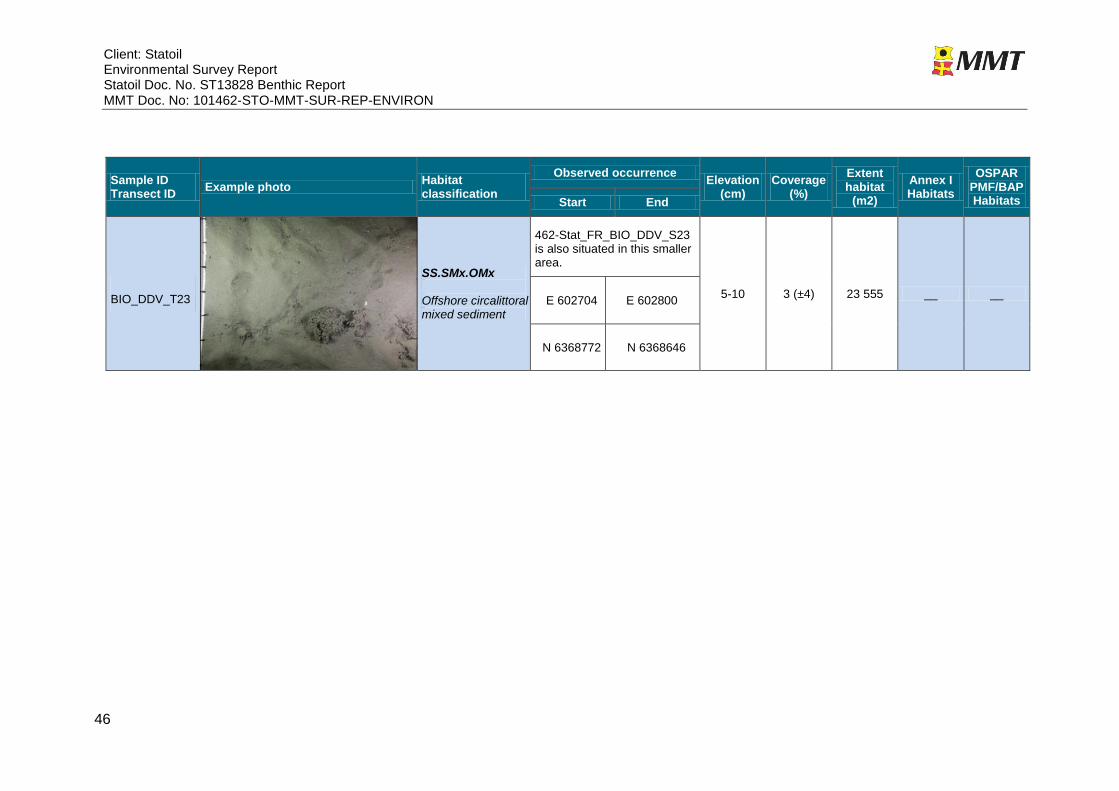
Client: Statoil Environmental Survey Report Statoil Doc. No. ST13828 Benthic Report MMT Doc. No: 101462-STO-MMT-SUR-REP-ENVIRON
46
Sample ID Transect ID
Example photo Habitat classification
Observed occurrence Elevation
(cm) Coverage
(%)
Extent habitat
(m2)
Annex I Habitats
OSPAR PMF/BAP Habitats Start End
BIO_DDV_T23
SS.SMx.OMx Offshore circalittoral mixed sediment
462-Stat_FR_BIO_DDV_S23 is also situated in this smaller area.
5-10 3 (±4) 23 555 __ __ E 602704 E 602800
N 6368772 N 6368646
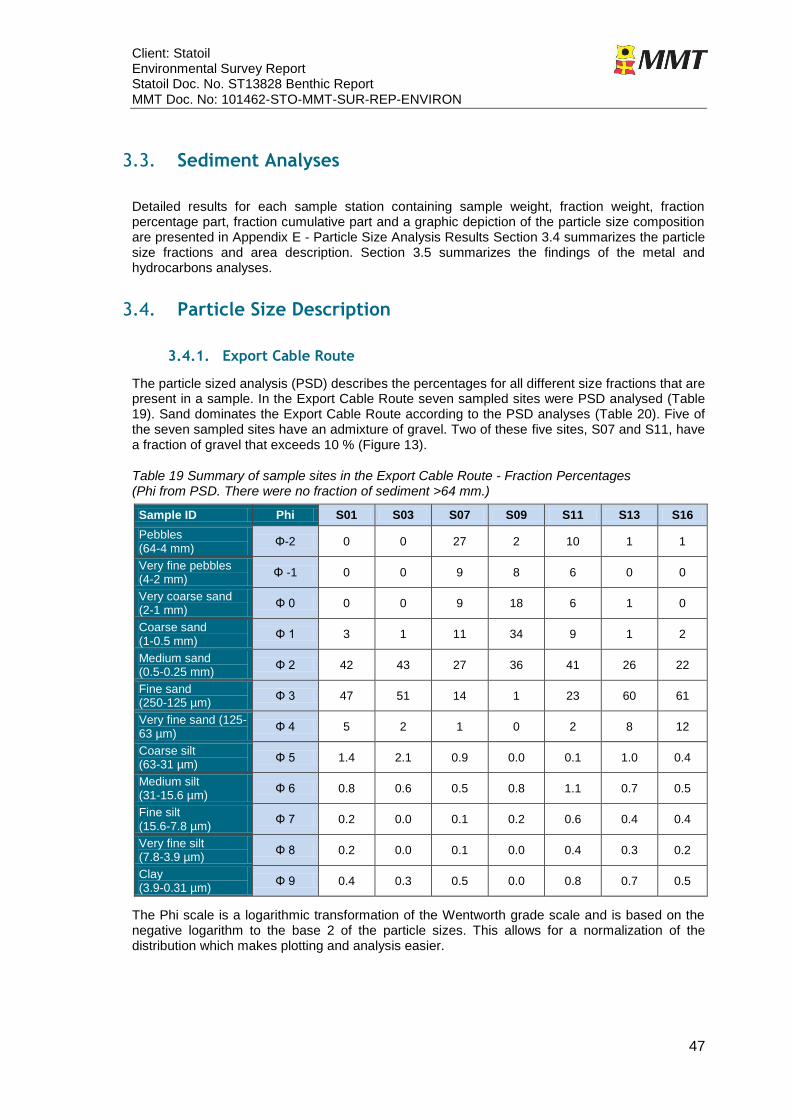
Client: Statoil Environmental Survey Report Statoil Doc. No. ST13828 Benthic Report MMT Doc. No: 101462-STO-MMT-SUR-REP-ENVIRON
47
3.3. Sediment Analyses
Detailed results for each sample station containing sample weight, fraction weight, fraction percentage part, fraction cumulative part and a graphic depiction of the particle size composition are presented in Appendix E - Particle Size Analysis Results Section 3.4 summarizes the particle size fractions and area description. Section 3.5 summarizes the findings of the metal and hydrocarbons analyses.
3.4. Particle Size Description
3.4.1. Export Cable Route
The particle sized analysis (PSD) describes the percentages for all different size fractions that are present in a sample. In the Export Cable Route seven sampled sites were PSD analysed (Table 19). Sand dominates the Export Cable Route according to the PSD analyses (Table 20). Five of the seven sampled sites have an admixture of gravel. Two of these five sites, S07 and S11, have a fraction of gravel that exceeds 10 % (Figure 13).
Table 19 Summary of sample sites in the Export Cable Route - Fraction Percentages (Phi from PSD. There were no fraction of sediment >64 mm.)
Sample ID Phi S01 S03 S07 S09 S11 S13 S16
Pebbles (64-4 mm)
Φ-2 0 0 27 2 10 1 1
Very fine pebbles (4-2 mm)
Φ -1 0 0 9 8 6 0 0
Very coarse sand (2-1 mm)
Φ 0 0 0 9 18 6 1 0
Coarse sand (1-0.5 mm)
Φ 1 3 1 11 34 9 1 2
Medium sand (0.5-0.25 mm)
Φ 2 42 43 27 36 41 26 22
Fine sand (250-125 µm)
Φ 3 47 51 14 1 23 60 61
Very fine sand (125-63 µm)
Φ 4 5 2 1 0 2 8 12
Coarse silt (63-31 µm)
Φ 5 1.4 2.1 0.9 0.0 0.1 1.0 0.4
Medium silt (31-15.6 µm)
Φ 6 0.8 0.6 0.5 0.8 1.1 0.7 0.5
Fine silt (15.6-7.8 µm)
Φ 7 0.2 0.0 0.1 0.2 0.6 0.4 0.4
Very fine silt (7.8-3.9 µm)
Φ 8 0.2 0.0 0.1 0.0 0.4 0.3 0.2
Clay (3.9-0.31 µm)
Φ 9 0.4 0.3 0.5 0.0 0.8 0.7 0.5
The Phi scale is a logarithmic transformation of the Wentworth grade scale and is based on the negative logarithm to the base 2 of the particle sizes. This allows for a normalization of the distribution which makes plotting and analysis easier.
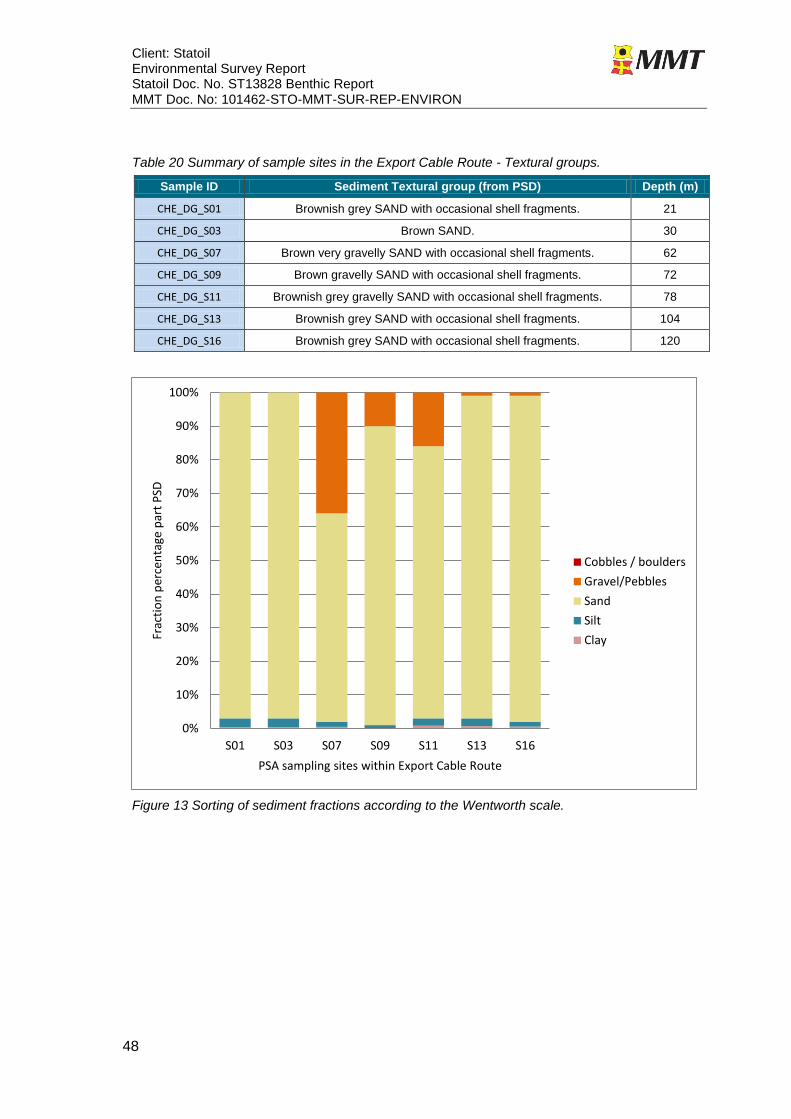
Client: Statoil Environmental Survey Report Statoil Doc. No. ST13828 Benthic Report MMT Doc. No: 101462-STO-MMT-SUR-REP-ENVIRON
48
Table 20 Summary of sample sites in the Export Cable Route - Textural groups.
Sample ID Sediment Textural group (from PSD) Depth (m)
CHE_DG_S01 Brownish grey SAND with occasional shell fragments. 21
CHE_DG_S03 Brown SAND. 30
CHE_DG_S07 Brown very gravelly SAND with occasional shell fragments. 62
CHE_DG_S09 Brown gravelly SAND with occasional shell fragments. 72
CHE_DG_S11 Brownish grey gravelly SAND with occasional shell fragments. 78
CHE_DG_S13 Brownish grey SAND with occasional shell fragments. 104
CHE_DG_S16 Brownish grey SAND with occasional shell fragments. 120
Figure 13 Sorting of sediment fractions according to the Wentworth scale.
0%
10%
20%
30%
40%
50%
60%
70%
80%
90%
100%
S01 S03 S07 S09 S11 S13 S16
Frac
tio
n p
erce
nta
ge p
art
PSD
PSA sampling sites within Export Cable Route
Cobbles / boulders
Gravel/Pebbles
Sand
Silt
Clay
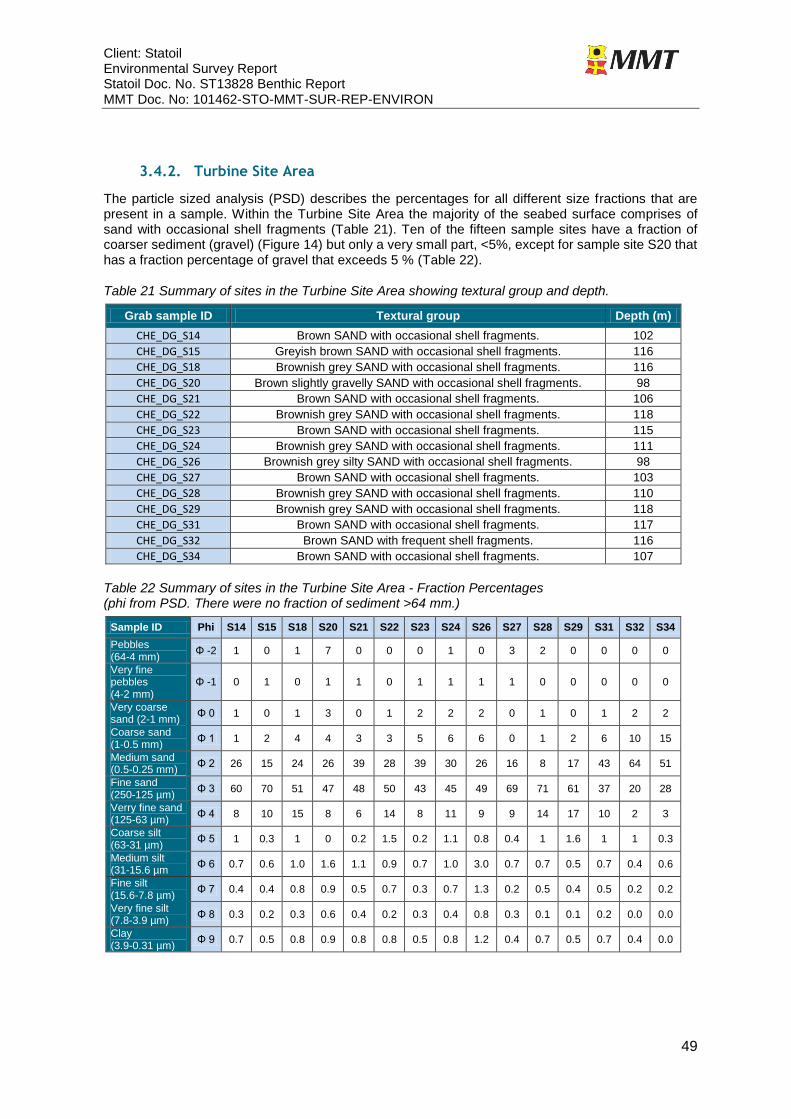
Client: Statoil Environmental Survey Report Statoil Doc. No. ST13828 Benthic Report MMT Doc. No: 101462-STO-MMT-SUR-REP-ENVIRON
49
3.4.2. Turbine Site Area
The particle sized analysis (PSD) describes the percentages for all different size fractions that are present in a sample. Within the Turbine Site Area the majority of the seabed surface comprises of sand with occasional shell fragments (Table 21). Ten of the fifteen sample sites have a fraction of coarser sediment (gravel) (Figure 14) but only a very small part, <5%, except for sample site S20 that has a fraction percentage of gravel that exceeds 5 % (Table 22).
Table 21 Summary of sites in the Turbine Site Area showing textural group and depth.
Grab sample ID Textural group Depth (m)
CHE_DG_S14 Brown SAND with occasional shell fragments. 102
CHE_DG_S15 Greyish brown SAND with occasional shell fragments. 116
CHE_DG_S18 Brownish grey SAND with occasional shell fragments. 116
CHE_DG_S20 Brown slightly gravelly SAND with occasional shell fragments. 98
CHE_DG_S21 Brown SAND with occasional shell fragments. 106
CHE_DG_S22 Brownish grey SAND with occasional shell fragments. 118
CHE_DG_S23 Brown SAND with occasional shell fragments. 115
CHE_DG_S24 Brownish grey SAND with occasional shell fragments. 111
CHE_DG_S26 Brownish grey silty SAND with occasional shell fragments. 98
CHE_DG_S27 Brown SAND with occasional shell fragments. 103
CHE_DG_S28 Brownish grey SAND with occasional shell fragments. 110
CHE_DG_S29 Brownish grey SAND with occasional shell fragments. 118
CHE_DG_S31 Brown SAND with occasional shell fragments. 117
CHE_DG_S32 Brown SAND with frequent shell fragments. 116
CHE_DG_S34 Brown SAND with occasional shell fragments. 107
Table 22 Summary of sites in the Turbine Site Area - Fraction Percentages (phi from PSD. There were no fraction of sediment >64 mm.)
Sample ID Phi S14 S15 S18 S20 S21 S22 S23 S24 S26 S27 S28 S29 S31 S32 S34
Pebbles (64-4 mm)
Φ -2 1 0 1 7 0 0 0 1 0 3 2 0 0 0 0
Very fine pebbles (4-2 mm)
Φ -1 0 1 0 1 1 0 1 1 1 1 0 0 0 0 0
Very coarse sand (2-1 mm)
Φ 0 1 0 1 3 0 1 2 2 2 0 1 0 1 2 2
Coarse sand (1-0.5 mm)
Φ 1 1 2 4 4 3 3 5 6 6 0 1 2 6 10 15
Medium sand (0.5-0.25 mm)
Φ 2 26 15 24 26 39 28 39 30 26 16 8 17 43 64 51
Fine sand (250-125 µm)
Φ 3 60 70 51 47 48 50 43 45 49 69 71 61 37 20 28
Verry fine sand (125-63 µm)
Φ 4 8 10 15 8 6 14 8 11 9 9 14 17 10 2 3
Coarse silt (63-31 µm)
Φ 5 1 0.3 1 0 0.2 1.5 0.2 1.1 0.8 0.4 1 1.6 1 1 0.3
Medium silt (31-15.6 µm
Φ 6 0.7 0.6 1.0 1.6 1.1 0.9 0.7 1.0 3.0 0.7 0.7 0.5 0.7 0.4 0.6
Fine silt (15.6-7.8 µm)
Φ 7 0.4 0.4 0.8 0.9 0.5 0.7 0.3 0.7 1.3 0.2 0.5 0.4 0.5 0.2 0.2
Very fine silt (7.8-3.9 µm)
Φ 8 0.3 0.2 0.3 0.6 0.4 0.2 0.3 0.4 0.8 0.3 0.1 0.1 0.2 0.0 0.0
Clay (3.9-0.31 µm)
Φ 9 0.7 0.5 0.8 0.9 0.8 0.8 0.5 0.8 1.2 0.4 0.7 0.5 0.7 0.4 0.0
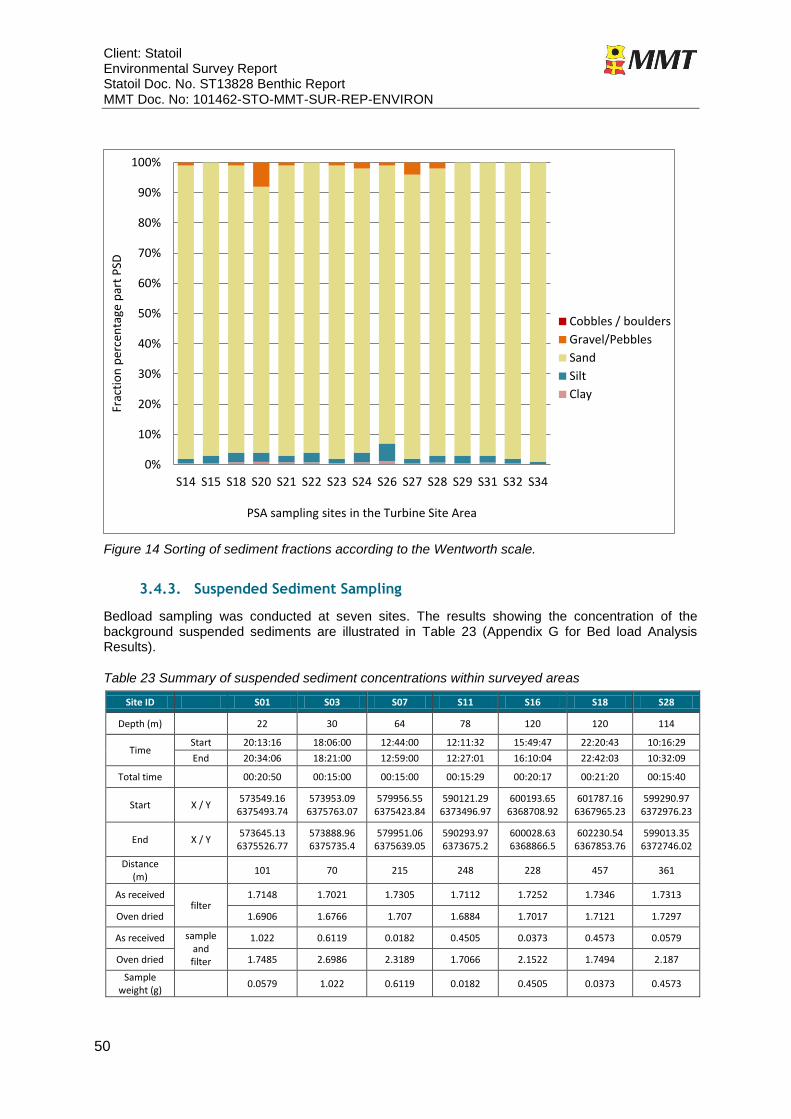
Client: Statoil Environmental Survey Report Statoil Doc. No. ST13828 Benthic Report MMT Doc. No: 101462-STO-MMT-SUR-REP-ENVIRON
50
Figure 14 Sorting of sediment fractions according to the Wentworth scale.
3.4.3. Suspended Sediment Sampling
Bedload sampling was conducted at seven sites. The results showing the concentration of the background suspended sediments are illustrated in Table 23 (Appendix G for Bed load Analysis Results).
Table 23 Summary of suspended sediment concentrations within surveyed areas
Site ID S01 S03 S07 S11 S16 S18 S28
Depth (m) 22 30 64 78 120 120 114
Time Start 20:13:16 18:06:00 12:44:00 12:11:32 15:49:47 22:20:43 10:16:29
End 20:34:06 18:21:00 12:59:00 12:27:01 16:10:04 22:42:03 10:32:09
Total time 00:20:50 00:15:00 00:15:00 00:15:29 00:20:17 00:21:20 00:15:40
Start X / Y 573549.16
6375493.74 573953.09
6375763.07 579956.55
6375423.84 590121.29
6373496.97 600193.65
6368708.92 601787.16
6367965.23 599290.97
6372976.23
End X / Y 573645.13
6375526.77 573888.96 6375735.4
579951.06 6375639.05
590293.97 6373675.2
600028.63 6368866.5
602230.54 6367853.76
599013.35 6372746.02
Distance (m)
101 70 215 248 228 457 361
As received filter
1.7148 1.7021 1.7305 1.7112 1.7252 1.7346 1.7313
Oven dried 1.6906 1.6766 1.707 1.6884 1.7017 1.7121 1.7297
As received sample and filter
1.022 0.6119 0.0182 0.4505 0.0373 0.4573 0.0579
Oven dried 1.7485 2.6986 2.3189 1.7066 2.1522 1.7494 2.187
Sample weight (g)
0.0579 1.022 0.6119 0.0182 0.4505 0.0373 0.4573
0%
10%
20%
30%
40%
50%
60%
70%
80%
90%
100%
S14 S15 S18 S20 S21 S22 S23 S24 S26 S27 S28 S29 S31 S32 S34
Frac
tio
n p
erce
nta
ge p
art
PSD
PSA sampling sites in the Turbine Site Area
Cobbles / boulders
Gravel/Pebbles
Sand
Silt
Clay
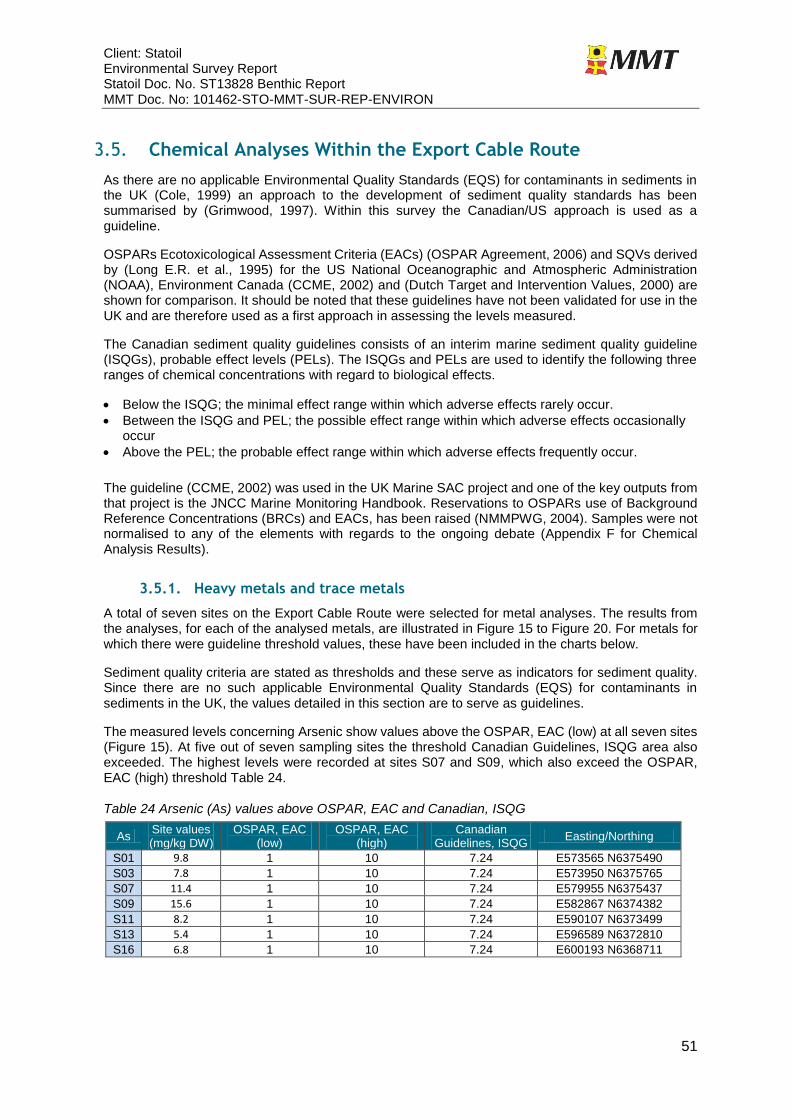
Client: Statoil Environmental Survey Report Statoil Doc. No. ST13828 Benthic Report MMT Doc. No: 101462-STO-MMT-SUR-REP-ENVIRON
51
3.5. Chemical Analyses Within the Export Cable Route
As there are no applicable Environmental Quality Standards (EQS) for contaminants in sediments in the UK (Cole, 1999) an approach to the development of sediment quality standards has been summarised by (Grimwood, 1997). Within this survey the Canadian/US approach is used as a guideline.
OSPARs Ecotoxicological Assessment Criteria (EACs) (OSPAR Agreement, 2006) and SQVs derived by (Long E.R. et al., 1995) for the US National Oceanographic and Atmospheric Administration (NOAA), Environment Canada (CCME, 2002) and (Dutch Target and Intervention Values, 2000) are shown for comparison. It should be noted that these guidelines have not been validated for use in the UK and are therefore used as a first approach in assessing the levels measured.
The Canadian sediment quality guidelines consists of an interim marine sediment quality guideline (ISQGs), probable effect levels (PELs). The ISQGs and PELs are used to identify the following three ranges of chemical concentrations with regard to biological effects.
Below the ISQG; the minimal effect range within which adverse effects rarely occur.
Between the ISQG and PEL; the possible effect range within which adverse effects occasionally occur
Above the PEL; the probable effect range within which adverse effects frequently occur.
The guideline (CCME, 2002) was used in the UK Marine SAC project and one of the key outputs from that project is the JNCC Marine Monitoring Handbook. Reservations to OSPARs use of Background Reference Concentrations (BRCs) and EACs, has been raised (NMMPWG, 2004). Samples were not normalised to any of the elements with regards to the ongoing debate (Appendix F for Chemical Analysis Results).
3.5.1. Heavy metals and trace metals
A total of seven sites on the Export Cable Route were selected for metal analyses. The results from the analyses, for each of the analysed metals, are illustrated in Figure 15 to Figure 20. For metals for which there were guideline threshold values, these have been included in the charts below.
Sediment quality criteria are stated as thresholds and these serve as indicators for sediment quality. Since there are no such applicable Environmental Quality Standards (EQS) for contaminants in sediments in the UK, the values detailed in this section are to serve as guidelines.
The measured levels concerning Arsenic show values above the OSPAR, EAC (low) at all seven sites (Figure 15). At five out of seven sampling sites the threshold Canadian Guidelines, ISQG area also exceeded. The highest levels were recorded at sites S07 and S09, which also exceed the OSPAR, EAC (high) threshold Table 24.
Table 24 Arsenic (As) values above OSPAR, EAC and Canadian, ISQG
As Site values (mg/kg DW)
OSPAR, EAC (low)
OSPAR, EAC (high)
Canadian Guidelines, ISQG
Easting/Northing
S01 9.8 1 10 7.24 E573565 N6375490
S03 7.8 1 10 7.24 E573950 N6375765
S07 11.4 1 10 7.24 E579955 N6375437
S09 15.6 1 10 7.24 E582867 N6374382
S11 8.2 1 10 7.24 E590107 N6373499
S13 5.4 1 10 7.24 E596589 N6372810
S16 6.8 1 10 7.24 E600193 N6368711
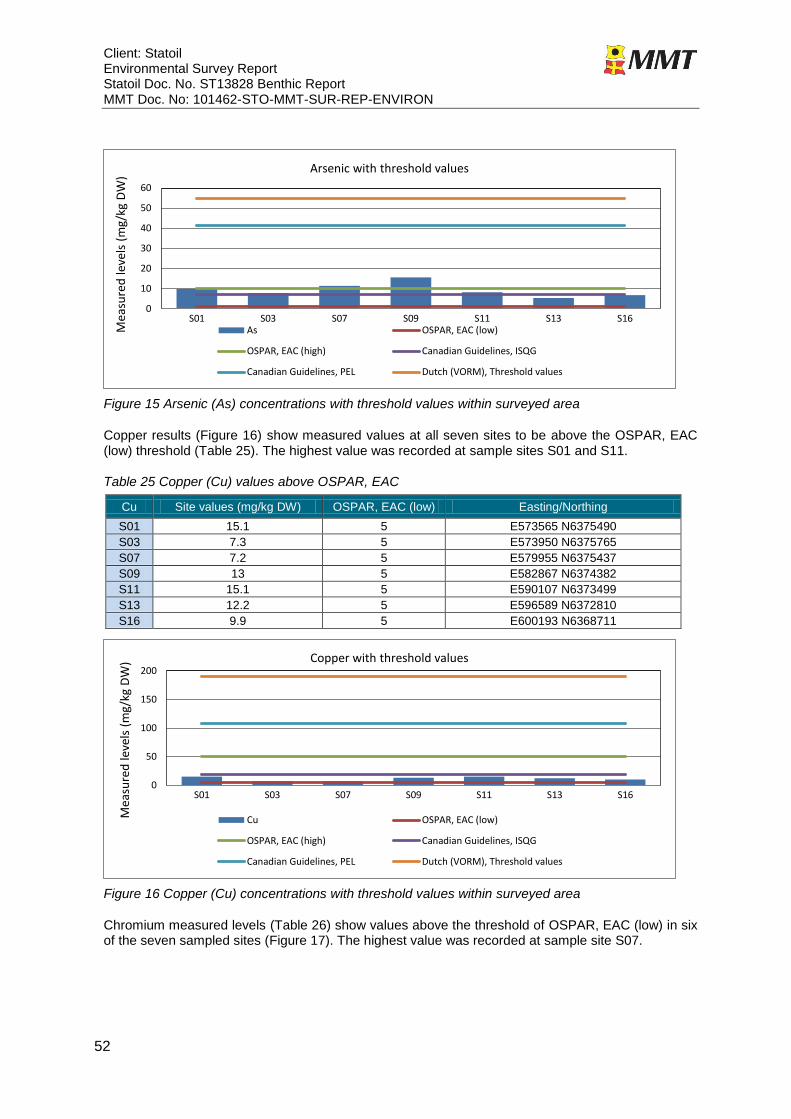
Client: Statoil Environmental Survey Report Statoil Doc. No. ST13828 Benthic Report MMT Doc. No: 101462-STO-MMT-SUR-REP-ENVIRON
52
Figure 15 Arsenic (As) concentrations with threshold values within surveyed area
Copper results (Figure 16) show measured values at all seven sites to be above the OSPAR, EAC (low) threshold (Table 25). The highest value was recorded at sample sites S01 and S11.
Table 25 Copper (Cu) values above OSPAR, EAC
Cu Site values (mg/kg DW) OSPAR, EAC (low) Easting/Northing
S01 15.1 5 E573565 N6375490
S03 7.3 5 E573950 N6375765
S07 7.2 5 E579955 N6375437
S09 13 5 E582867 N6374382
S11 15.1 5 E590107 N6373499
S13 12.2 5 E596589 N6372810
S16 9.9 5 E600193 N6368711
Figure 16 Copper (Cu) concentrations with threshold values within surveyed area
Chromium measured levels (Table 26) show values above the threshold of OSPAR, EAC (low) in six of the seven sampled sites (Figure 17). The highest value was recorded at sample site S07.
0
10
20
30
40
50
60
S01 S03 S07 S09 S11 S13 S16
Mea
sure
d le
vels
(m
g/kg
DW
)
Arsenic with threshold values
As OSPAR, EAC (low)
OSPAR, EAC (high) Canadian Guidelines, ISQG
Canadian Guidelines, PEL Dutch (VORM), Threshold values
0
50
100
150
200
S01 S03 S07 S09 S11 S13 S16
Mea
sure
d le
vels
(m
g/kg
DW
) Copper with threshold values
Cu OSPAR, EAC (low)
OSPAR, EAC (high) Canadian Guidelines, ISQG
Canadian Guidelines, PEL Dutch (VORM), Threshold values
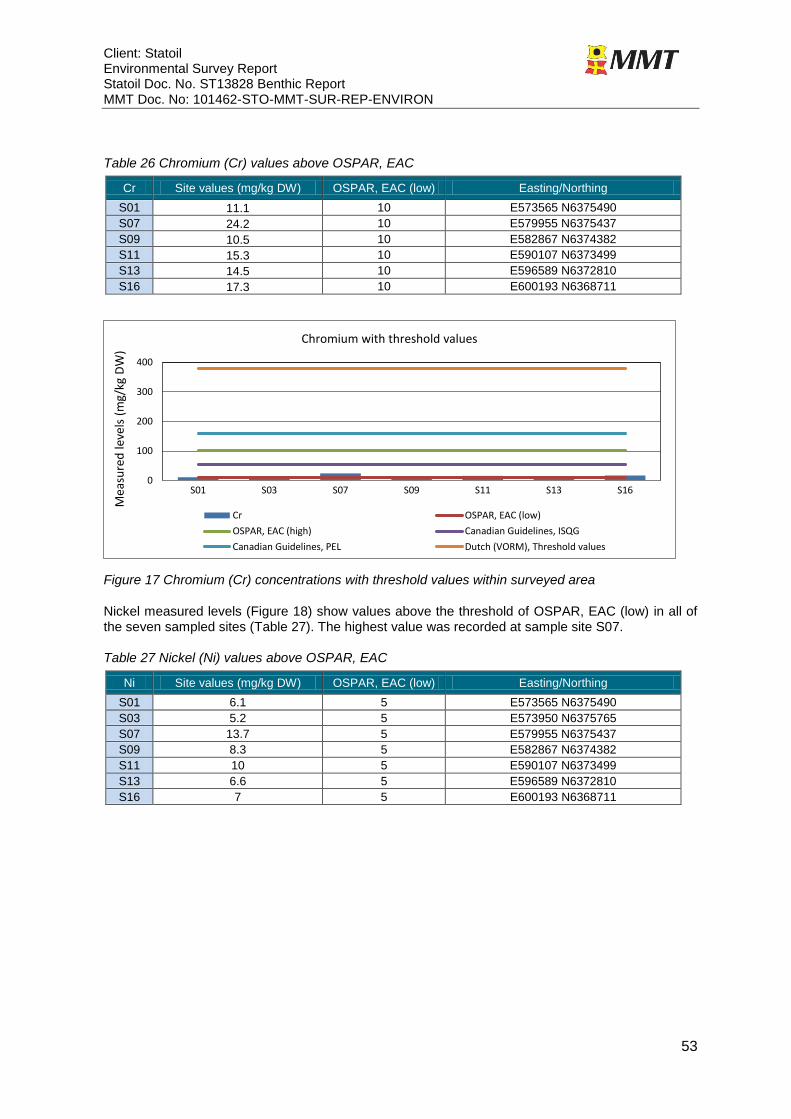
Client: Statoil Environmental Survey Report Statoil Doc. No. ST13828 Benthic Report MMT Doc. No: 101462-STO-MMT-SUR-REP-ENVIRON
53
Table 26 Chromium (Cr) values above OSPAR, EAC
Cr Site values (mg/kg DW) OSPAR, EAC (low) Easting/Northing
S01 11.1 10 E573565 N6375490
S07 24.2 10 E579955 N6375437
S09 10.5 10 E582867 N6374382
S11 15.3 10 E590107 N6373499
S13 14.5 10 E596589 N6372810
S16 17.3 10 E600193 N6368711
Figure 17 Chromium (Cr) concentrations with threshold values within surveyed area
Nickel measured levels (Figure 18) show values above the threshold of OSPAR, EAC (low) in all of the seven sampled sites (Table 27). The highest value was recorded at sample site S07.
Table 27 Nickel (Ni) values above OSPAR, EAC
Ni Site values (mg/kg DW) OSPAR, EAC (low) Easting/Northing
S01 6.1 5 E573565 N6375490
S03 5.2 5 E573950 N6375765
S07 13.7 5 E579955 N6375437
S09 8.3 5 E582867 N6374382
S11 10 5 E590107 N6373499
S13 6.6 5 E596589 N6372810
S16 7 5 E600193 N6368711
0
100
200
300
400
S01 S03 S07 S09 S11 S13 S16
Mea
sure
d le
vels
(m
g/kg
DW
)
Chromium with threshold values
Cr OSPAR, EAC (low)
OSPAR, EAC (high) Canadian Guidelines, ISQG
Canadian Guidelines, PEL Dutch (VORM), Threshold values
Client: Statoil Environmental Survey Report Statoil Doc. No. ST13828 Benthic Report MMT Doc. No: 101462-STO-MMT-SUR-REP-ENVIRON
54
Figure 18 Nickel (Ni) concentrations with threshold values within surveyed area
Lead measured levels (Figure 19) show values above the threshold of OSPAR, EAC (low) in all of the seven sampled sites (Table 28). The highest value was recorded at sample site S01.
Table 28 Lead (Pb) values above OSPAR, EAC
Pb Site values (mg/kg DW) OSPAR, EAC (low) Easting/Northing
S01 12.4 5 E573565 N6375490
S03 11 5 E573950 N6375765
S07 11.8 5 E579955 N6375437
S09 8.9 5 E582867 N6374382
S11 10.8 5 E590107 N6373499
S13 9.9 5 E596589 N6372810
S16 11.1 5 E600193 N6368711
Figure 19 Lead (Pb) concentrations with threshold values within surveyed area
For the elements Aluminium (Figure 20), Vanadium (Figure 21) and Tin (Figure 22) there are no threshold values or guidelines set at this moment. The values for Aluminium were divided by 1000 to easier illustrate the measured values.
0
50
100
150
200
250
S01 S03 S07 S09 S11 S13 S16
Mea
sure
d le
vels
(m
g/kg
DW
) Nickel with threshold values
Ni OSPAR, EAC (low)
OSPAR, EAC (high) Canadian Guidelines, ISQG
Canadian Guidelines, PEL Dutch (VORM), Threshold values
0
100
200
300
400
500
600
S01 S03 S07 S09 S11 S13 S16
Mea
sure
d le
vels
(m
g/kg
DW
) Lead with threshold values
Pb OSPAR, EAC (low)
OSPAR, EAC (high) Canadian Guidelines, ISQG
Canadian Guidelines, PEL Dutch (VORM), Threshold values
Client: Statoil Environmental Survey Report Statoil Doc. No. ST13828 Benthic Report MMT Doc. No: 101462-STO-MMT-SUR-REP-ENVIRON
55
Figure 20 Aluminium (Al) concentrations within surveyed area. All values are divided with 1000.
Figure 21 Vanadium (V) concentrations within surveyed area
Figure 22 Tin (Sn) concentrations values within surveyed area
For the element Barium (Figure 23) there were Dutch guideline values, which were not exceeded during this survey (Dutch Target and Intervention Values, 2000).
0
5
10
15
20
25
30
35
S01 S03 S07 S09 S11 S13 S16
Mea
sure
d le
vels
(m
g/kg
DW
)
Aluminium values
Al/1000
0
5
10
15
20
25
30
35
S01 S03 S07 S09 S11 S13 S16Mea
sure
d le
vels
(m
g/kg
DW
)
Vanadium values
V
0
1
2
3
4
S01 S03 S07 S09 S11 S13 S16Mea
sure
d le
vels
(m
g/kg
DW
)
Tin values
Sn
Client: Statoil Environmental Survey Report Statoil Doc. No. ST13828 Benthic Report MMT Doc. No: 101462-STO-MMT-SUR-REP-ENVIRON
56
Figure 23 Barium (Ba) concentrations with threshold values within surveyed area
The elements Mercury (Figure 24), Cadmium (Figure 25) and Zinc (Figure 26) did not exceed any of the guideline threshold values. For Mercury the results at all sampled sites were also below the detection level (<0.01 mg/kg DW).
Figure 24 Mercury (Hg) concentrations with threshold values within surveyed area
Figure 25 Cadmium (Cd) concentrations with threshold values within surveyed area
0
100
200
300
400
500
600
700
S01 S03 S07 S09 S11 S13 S16
Mea
sure
d le
vels
(m
g/kg
DW
)
Barium with threshold values
Ba Dutch (VORM), Threshold values
0
2
4
6
8
10
12
S01 S03 S07 S09 S11 S13 S16
Mea
sure
d le
vels
(m
g/kg
DW
)
Mercury with threshold values
Hg (Values below detection level 0.01) OSPAR, EAC (low)OSPAR, EAC (high) Canadian Guidelines, ISQGCanadian Guidelines, PEL Dutch (VORM), Threshold values
0
5
10
S01 S03 S07 S09 S11 S13 S16
Mea
sure
d le
vels
(m
g/kg
DW
) Cadmium with threshold values
Cd (Values at 0.1) OSPAR, EAC (low)
OSPAR, EAC (high) Canadian Guidelines, ISQG
Canadian Guidelines, PEL Dutch (VORM), Threshold values
Client: Statoil Environmental Survey Report Statoil Doc. No. ST13828 Benthic Report MMT Doc. No: 101462-STO-MMT-SUR-REP-ENVIRON
57
Figure 26 Zinc (Zn) concentrations with threshold values within surveyed area
Heavy metals occur naturally in the marine environment. As a result sediment concentrations reflect a combination of natural and anthropogenic inputs. Some contributing factors may be industrial activities and chemical dumping. No patterns have been found for these elevated levels, and a correlation to existing dumping sites as a possible cause for elevated values has not been found.
3.5.2. Hydrocarbon Analysis
In addition to heavy metals & trace metals, seven sites were analysed for polycyclic aromatic hydrocarbons. (PAH). The total hydrocarbon concentration distribution, for the seven sample sites, are illustrated in Figure 27. The total n-alkanes concentrations are presented in Figure 28.
As for the heavy metals and trace metals, for comparison purposes, the Canadian threshold guidelines for marine sediment quality were used.
The ISQGs and PELs are used to identify the following three ranges of chemical concentrations with regard to biological effects.
Below the ISQG; the minimal effect range within which adverse effects rarely occur.
Between the ISQG and PEL; the possible effect range within which adverse effects occasionally occur
Above the PEL; the probable effect range within which adverse effects frequently occur. For several of the hydrocarbons the values were below the detection limit (<1). Additionally there were hydrocarbons for which no guideline values were found (N/A) for marine sediment (Table 30).
0
200
400
600
800
S01 S03 S07 S09 S11 S13 S16
Mea
sure
d le
vels
(m
g/kg
DW
)
Zinc with threshold values
Zn OSPAR, EAC (low)
OSPAR, EAC (high) Canadian Guidelines, ISQG
Canadian Guidelines, PEL Dutch (VORM), Threshold values
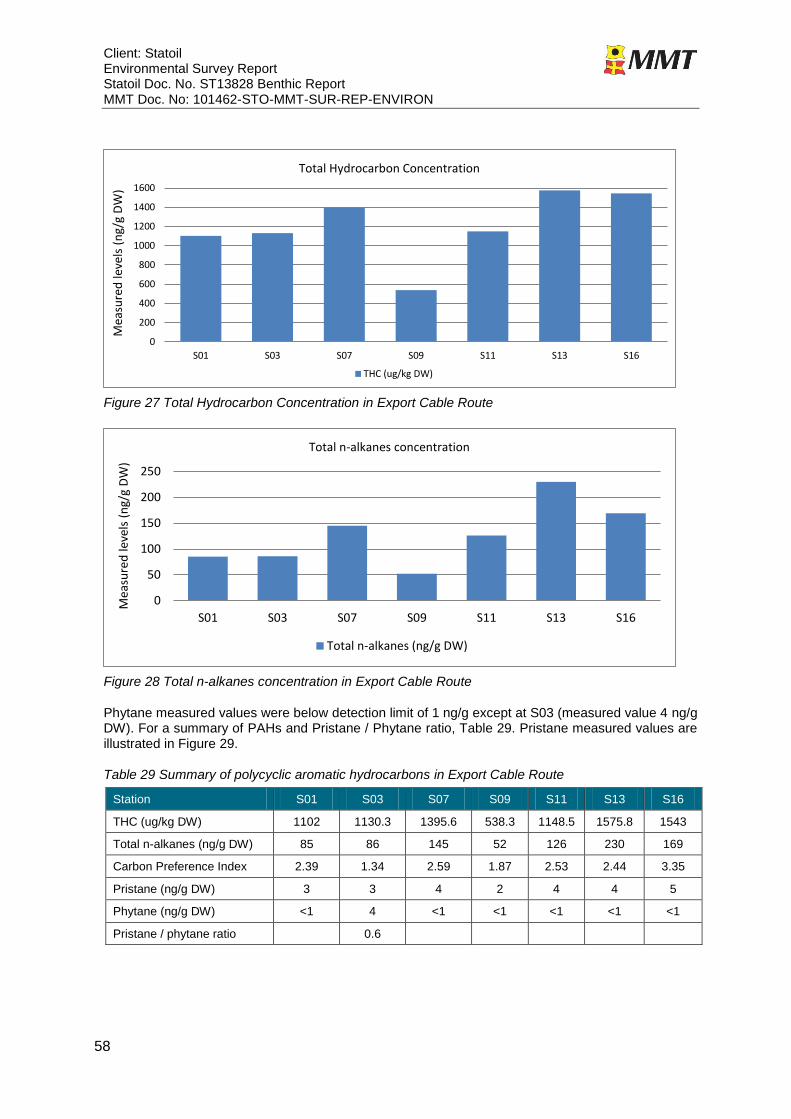
Client: Statoil Environmental Survey Report Statoil Doc. No. ST13828 Benthic Report MMT Doc. No: 101462-STO-MMT-SUR-REP-ENVIRON
58
Figure 27 Total Hydrocarbon Concentration in Export Cable Route
Figure 28 Total n-alkanes concentration in Export Cable Route
Phytane measured values were below detection limit of 1 ng/g except at S03 (measured value 4 ng/g DW). For a summary of PAHs and Pristane / Phytane ratio, Table 29. Pristane measured values are illustrated in Figure 29.
Table 29 Summary of polycyclic aromatic hydrocarbons in Export Cable Route
Station S01 S03 S07 S09 S11 S13 S16
THC (ug/kg DW) 1102 1130.3 1395.6 538.3 1148.5 1575.8 1543
Total n-alkanes (ng/g DW) 85 86 145 52 126 230 169
Carbon Preference Index 2.39 1.34 2.59 1.87 2.53 2.44 3.35
Pristane (ng/g DW) 3 3 4 2 4 4 5
Phytane (ng/g DW) <1 4 <1 <1 <1 <1 <1
Pristane / phytane ratio 0.6
0
200
400
600
800
1000
1200
1400
1600
S01 S03 S07 S09 S11 S13 S16
Mea
sure
d le
vels
(n
g/g
DW
)
Total Hydrocarbon Concentration
THC (ug/kg DW)
0
50
100
150
200
250
S01 S03 S07 S09 S11 S13 S16
Mea
sure
d le
vels
(n
g/g
DW
)
Total n-alkanes concentration
Total n-alkanes (ng/g DW)
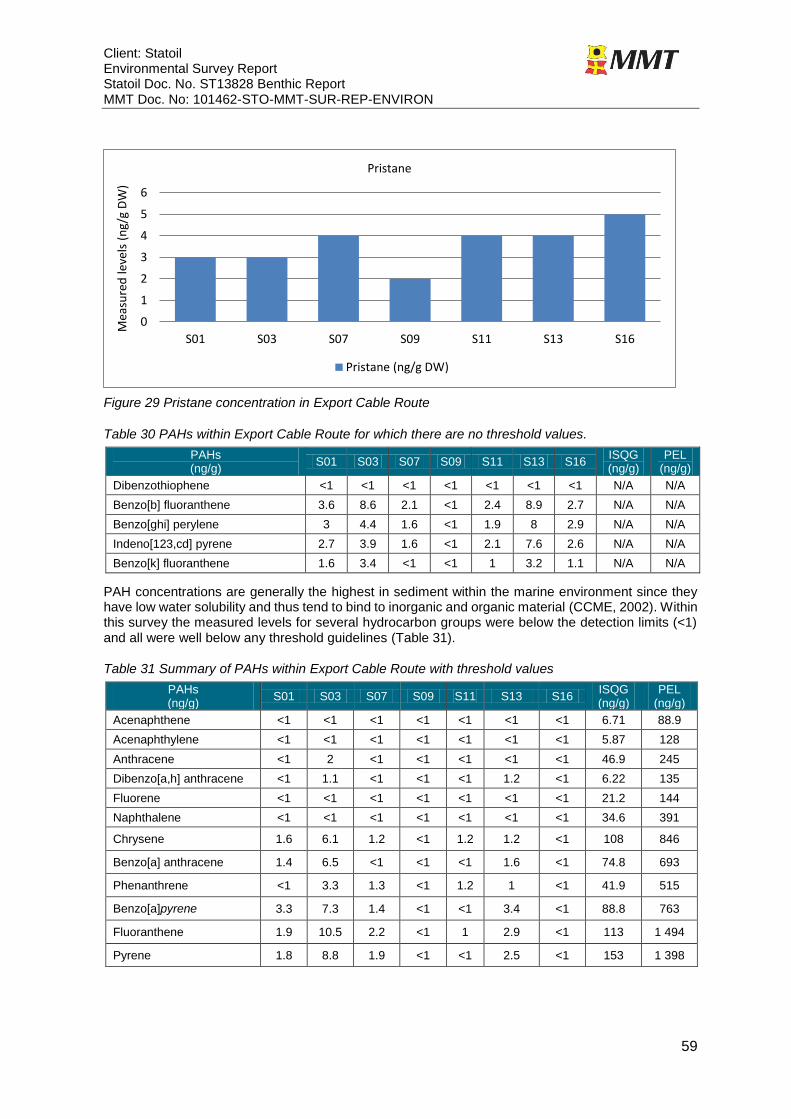
Client: Statoil Environmental Survey Report Statoil Doc. No. ST13828 Benthic Report MMT Doc. No: 101462-STO-MMT-SUR-REP-ENVIRON
59
Figure 29 Pristane concentration in Export Cable Route
Table 30 PAHs within Export Cable Route for which there are no threshold values.
PAHs (ng/g)
S01 S03 S07 S09 S11 S13 S16 ISQG (ng/g)
PEL (ng/g)
Dibenzothiophene <1 <1 <1 <1 <1 <1 <1 N/A N/A
Benzo[b] fluoranthene 3.6 8.6 2.1 <1 2.4 8.9 2.7 N/A N/A
Benzo[ghi] perylene 3 4.4 1.6 <1 1.9 8 2.9 N/A N/A
Indeno[123,cd] pyrene 2.7 3.9 1.6 <1 2.1 7.6 2.6 N/A N/A
Benzo[k] fluoranthene 1.6 3.4 <1 <1 1 3.2 1.1 N/A N/A
PAH concentrations are generally the highest in sediment within the marine environment since they have low water solubility and thus tend to bind to inorganic and organic material (CCME, 2002). Within this survey the measured levels for several hydrocarbon groups were below the detection limits (<1) and all were well below any threshold guidelines (Table 31).
Table 31 Summary of PAHs within Export Cable Route with threshold values
PAHs (ng/g)
S01 S03 S07 S09 S11 S13 S16 ISQG (ng/g)
PEL (ng/g)
Acenaphthene <1 <1 <1 <1 <1 <1 <1 6.71 88.9
Acenaphthylene <1 <1 <1 <1 <1 <1 <1 5.87 128
Anthracene <1 2 <1 <1 <1 <1 <1 46.9 245
Dibenzo[a,h] anthracene <1 1.1 <1 <1 <1 1.2 <1 6.22 135
Fluorene <1 <1 <1 <1 <1 <1 <1 21.2 144
Naphthalene <1 <1 <1 <1 <1 <1 <1 34.6 391
Chrysene 1.6 6.1 1.2 <1 1.2 1.2 <1 108 846
Benzo[a] anthracene 1.4 6.5 <1 <1 <1 1.6 <1 74.8 693
Phenanthrene <1 3.3 1.3 <1 1.2 1 <1 41.9 515
Benzo[a]pyrene 3.3 7.3 1.4 <1 <1 3.4 <1 88.8 763
Fluoranthene 1.9 10.5 2.2 <1 1 2.9 <1 113 1 494
Pyrene 1.8 8.8 1.9 <1 <1 2.5 <1 153 1 398
0
1
2
3
4
5
6
S01 S03 S07 S09 S11 S13 S16
Mea
sure
d le
vels
(n
g/g
DW
)
Pristane
Pristane (ng/g DW)
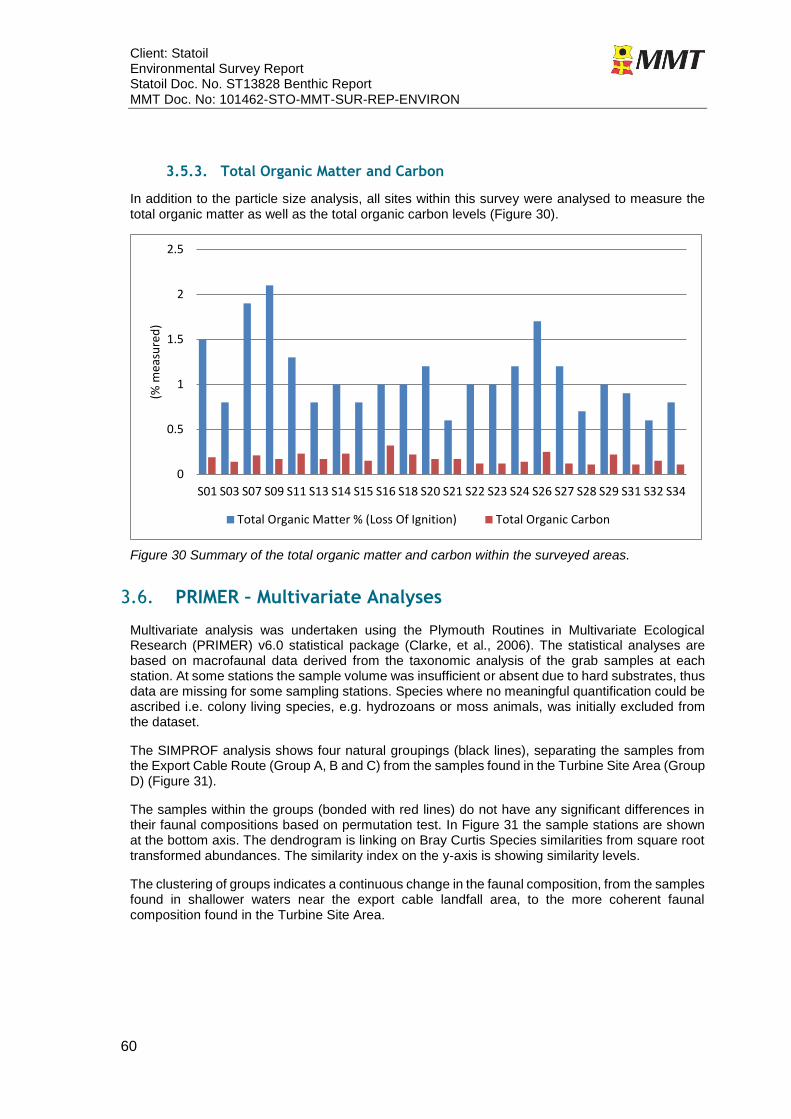
Client: Statoil Environmental Survey Report Statoil Doc. No. ST13828 Benthic Report MMT Doc. No: 101462-STO-MMT-SUR-REP-ENVIRON
60
3.5.3. Total Organic Matter and Carbon
In addition to the particle size analysis, all sites within this survey were analysed to measure the total organic matter as well as the total organic carbon levels (Figure 30).
Figure 30 Summary of the total organic matter and carbon within the surveyed areas.
3.6. PRIMER – Multivariate Analyses
Multivariate analysis was undertaken using the Plymouth Routines in Multivariate Ecological Research (PRIMER) v6.0 statistical package (Clarke, et al., 2006). The statistical analyses are based on macrofaunal data derived from the taxonomic analysis of the grab samples at each station. At some stations the sample volume was insufficient or absent due to hard substrates, thus data are missing for some sampling stations. Species where no meaningful quantification could be ascribed i.e. colony living species, e.g. hydrozoans or moss animals, was initially excluded from the dataset.
The SIMPROF analysis shows four natural groupings (black lines), separating the samples from the Export Cable Route (Group A, B and C) from the samples found in the Turbine Site Area (Group D) (Figure 31).
The samples within the groups (bonded with red lines) do not have any significant differences in their faunal compositions based on permutation test. In Figure 31 the sample stations are shown at the bottom axis. The dendrogram is linking on Bray Curtis Species similarities from square root transformed abundances. The similarity index on the y-axis is showing similarity levels.
The clustering of groups indicates a continuous change in the faunal composition, from the samples found in shallower waters near the export cable landfall area, to the more coherent faunal composition found in the Turbine Site Area.
0
0.5
1
1.5
2
2.5
S01 S03 S07 S09 S11 S13 S14 S15 S16 S18 S20 S21 S22 S23 S24 S26 S27 S28 S29 S31 S32 S34
(% m
easu
red
)
Total Organic Matter % (Loss Of Ignition) Total Organic Carbon
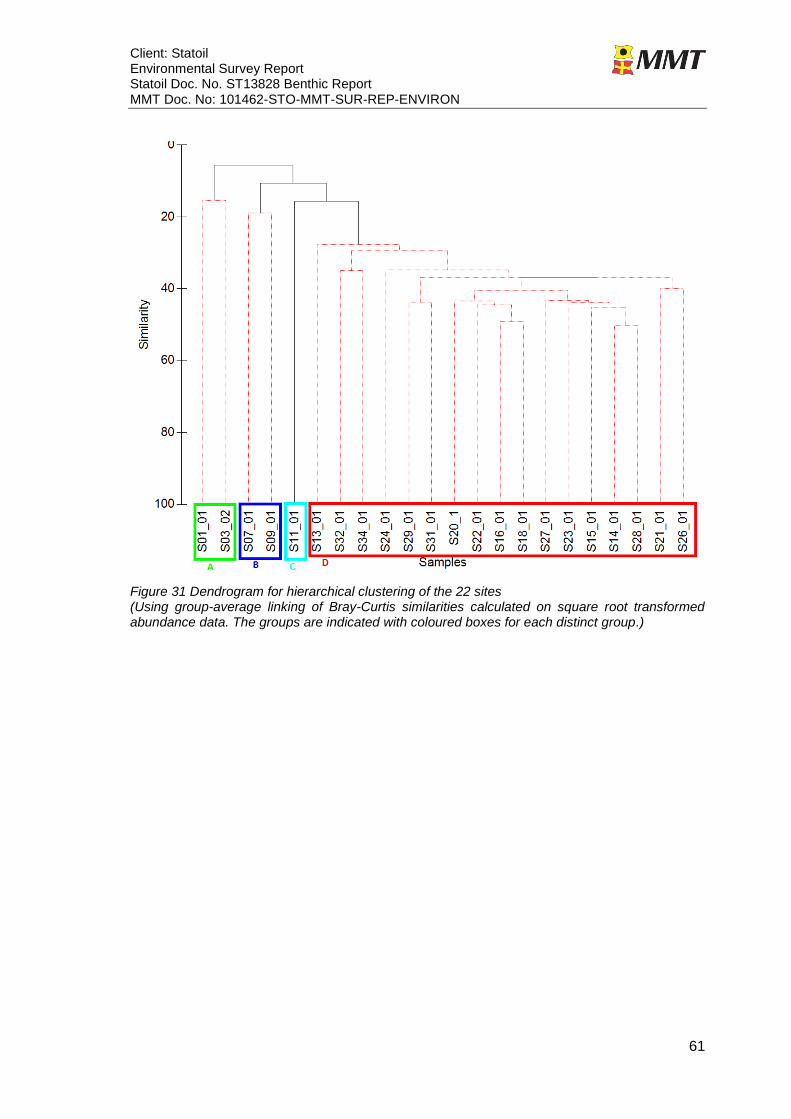
Client: Statoil Environmental Survey Report Statoil Doc. No. ST13828 Benthic Report MMT Doc. No: 101462-STO-MMT-SUR-REP-ENVIRON
61
Figure 31 Dendrogram for hierarchical clustering of the 22 sites (Using group-average linking of Bray-Curtis similarities calculated on square root transformed abundance data. The groups are indicated with coloured boxes for each distinct group.)
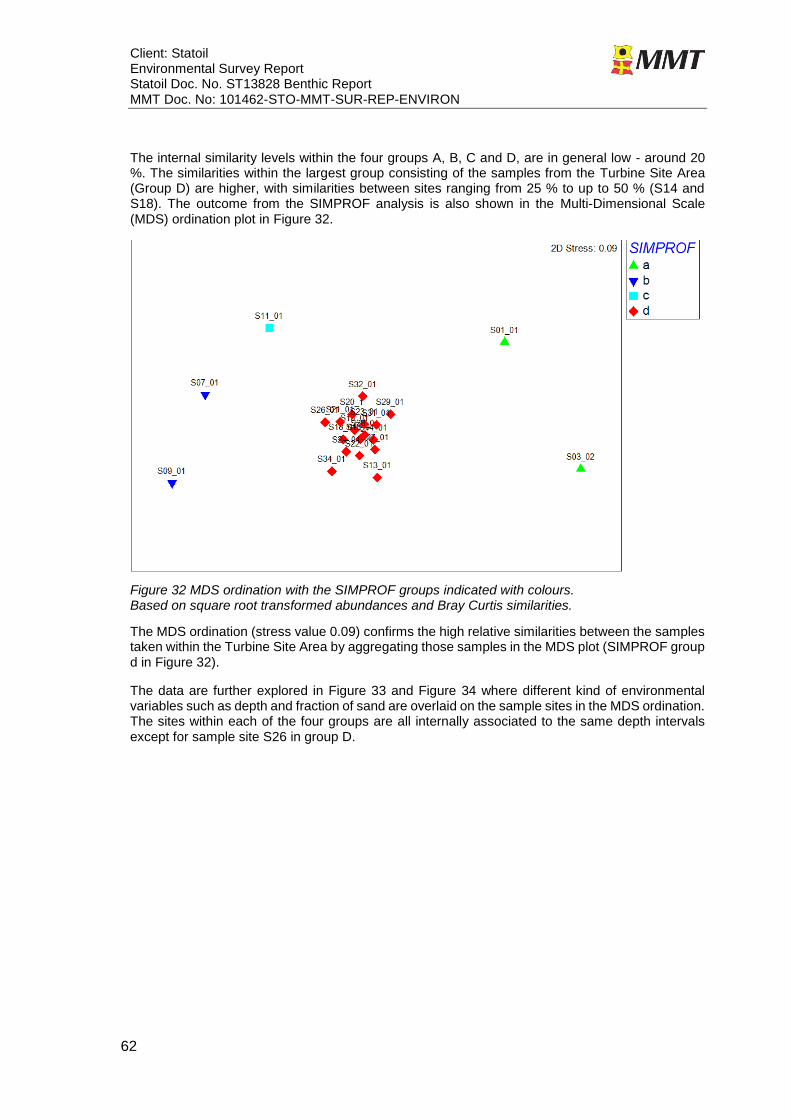
Client: Statoil Environmental Survey Report Statoil Doc. No. ST13828 Benthic Report MMT Doc. No: 101462-STO-MMT-SUR-REP-ENVIRON
62
The internal similarity levels within the four groups A, B, C and D, are in general low - around 20 %. The similarities within the largest group consisting of the samples from the Turbine Site Area (Group D) are higher, with similarities between sites ranging from 25 % to up to 50 % (S14 and S18). The outcome from the SIMPROF analysis is also shown in the Multi-Dimensional Scale (MDS) ordination plot in Figure 32.
Figure 32 MDS ordination with the SIMPROF groups indicated with colours. Based on square root transformed abundances and Bray Curtis similarities.
The MDS ordination (stress value 0.09) confirms the high relative similarities between the samples taken within the Turbine Site Area by aggregating those samples in the MDS plot (SIMPROF group d in Figure 32).
The data are further explored in Figure 33 and Figure 34 where different kind of environmental variables such as depth and fraction of sand are overlaid on the sample sites in the MDS ordination. The sites within each of the four groups are all internally associated to the same depth intervals except for sample site S26 in group D.
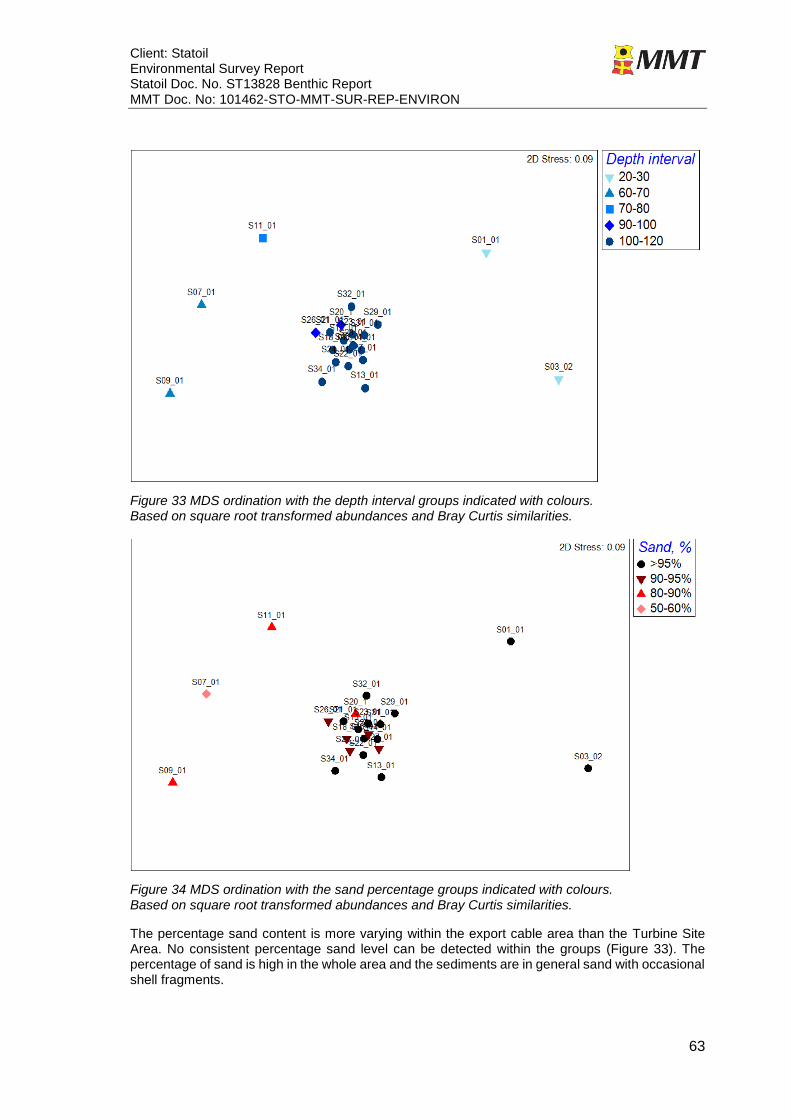
Client: Statoil Environmental Survey Report Statoil Doc. No. ST13828 Benthic Report MMT Doc. No: 101462-STO-MMT-SUR-REP-ENVIRON
63
Figure 33 MDS ordination with the depth interval groups indicated with colours. Based on square root transformed abundances and Bray Curtis similarities.
Figure 34 MDS ordination with the sand percentage groups indicated with colours. Based on square root transformed abundances and Bray Curtis similarities.
The percentage sand content is more varying within the export cable area than the Turbine Site Area. No consistent percentage sand level can be detected within the groups (Figure 33). The percentage of sand is high in the whole area and the sediments are in general sand with occasional shell fragments.
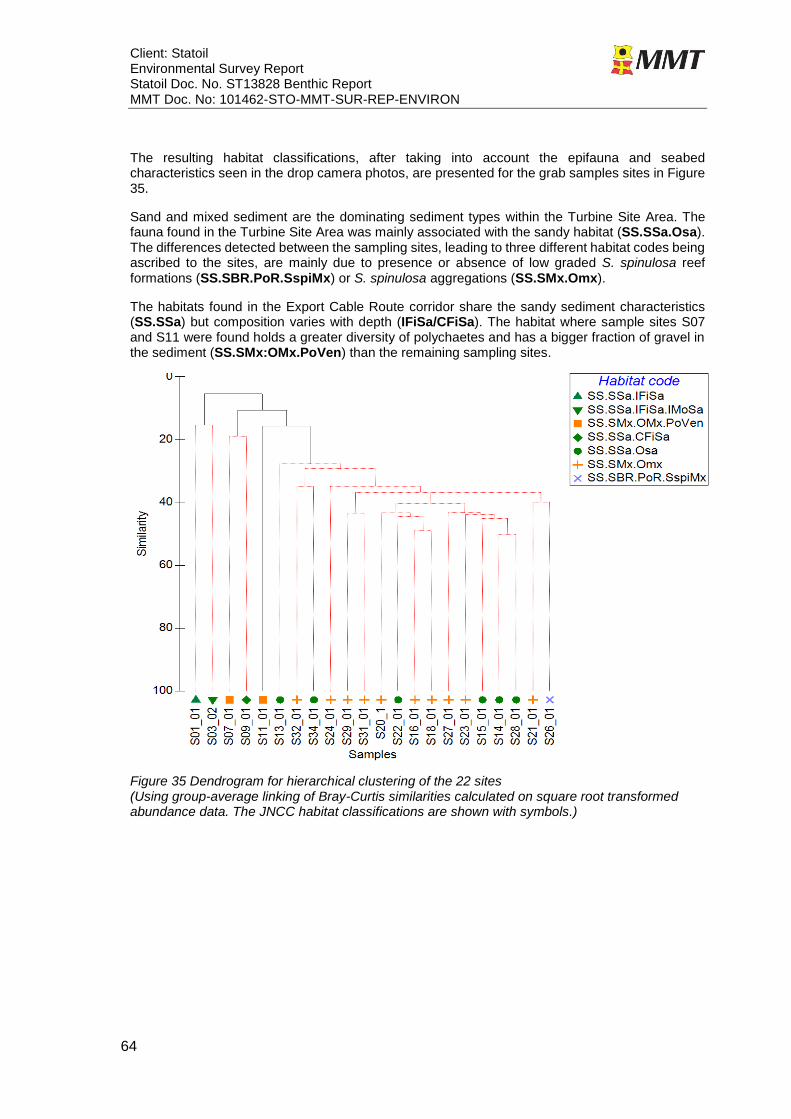
Client: Statoil Environmental Survey Report Statoil Doc. No. ST13828 Benthic Report MMT Doc. No: 101462-STO-MMT-SUR-REP-ENVIRON
64
The resulting habitat classifications, after taking into account the epifauna and seabed characteristics seen in the drop camera photos, are presented for the grab samples sites in Figure 35.
Sand and mixed sediment are the dominating sediment types within the Turbine Site Area. The fauna found in the Turbine Site Area was mainly associated with the sandy habitat (SS.SSa.Osa). The differences detected between the sampling sites, leading to three different habitat codes being ascribed to the sites, are mainly due to presence or absence of low graded S. spinulosa reef formations (SS.SBR.PoR.SspiMx) or S. spinulosa aggregations (SS.SMx.Omx).
The habitats found in the Export Cable Route corridor share the sandy sediment characteristics (SS.SSa) but composition varies with depth (IFiSa/CFiSa). The habitat where sample sites S07 and S11 were found holds a greater diversity of polychaetes and has a bigger fraction of gravel in the sediment (SS.SMx:OMx.PoVen) than the remaining sampling sites.
Figure 35 Dendrogram for hierarchical clustering of the 22 sites (Using group-average linking of Bray-Curtis similarities calculated on square root transformed abundance data. The JNCC habitat classifications are shown with symbols.)
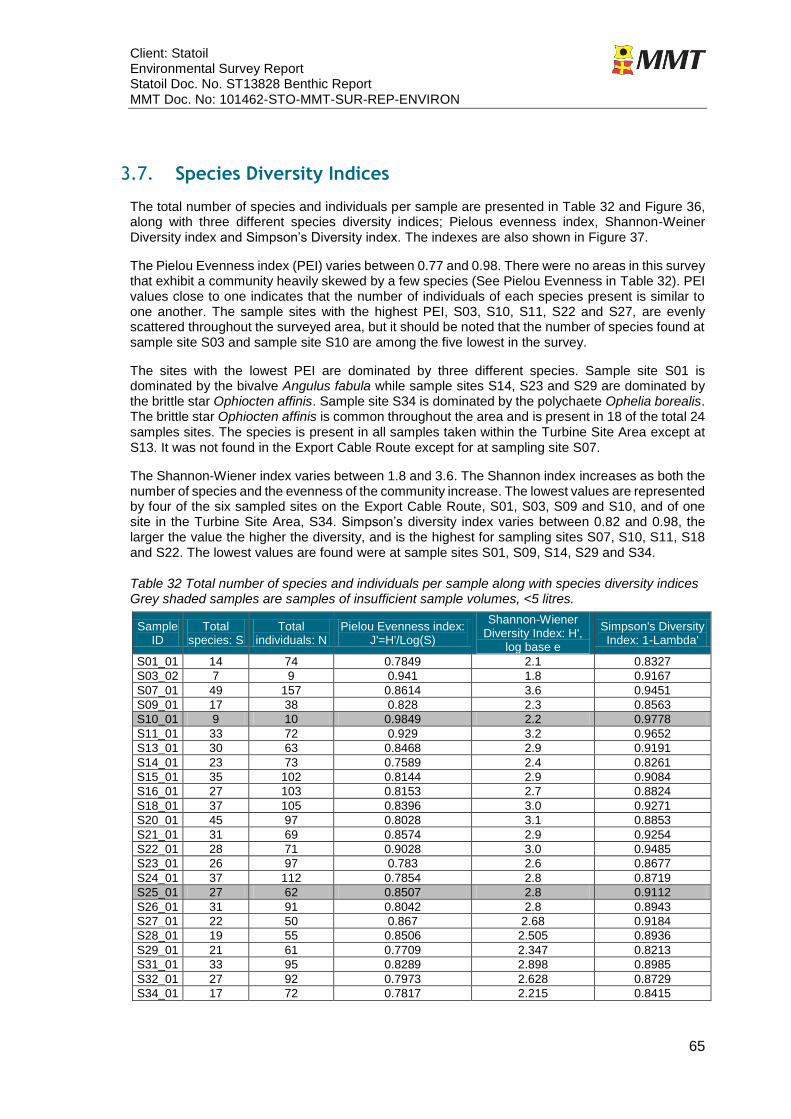
Client: Statoil Environmental Survey Report Statoil Doc. No. ST13828 Benthic Report MMT Doc. No: 101462-STO-MMT-SUR-REP-ENVIRON
65
3.7. Species Diversity Indices
The total number of species and individuals per sample are presented in Table 32 and Figure 36, along with three different species diversity indices; Pielous evenness index, Shannon-Weiner Diversity index and Simpson’s Diversity index. The indexes are also shown in Figure 37.
The Pielou Evenness index (PEI) varies between 0.77 and 0.98. There were no areas in this survey that exhibit a community heavily skewed by a few species (See Pielou Evenness in Table 32). PEI values close to one indicates that the number of individuals of each species present is similar to one another. The sample sites with the highest PEI, S03, S10, S11, S22 and S27, are evenly scattered throughout the surveyed area, but it should be noted that the number of species found at sample site S03 and sample site S10 are among the five lowest in the survey.
The sites with the lowest PEI are dominated by three different species. Sample site S01 is dominated by the bivalve Angulus fabula while sample sites S14, S23 and S29 are dominated by the brittle star Ophiocten affinis. Sample site S34 is dominated by the polychaete Ophelia borealis. The brittle star Ophiocten affinis is common throughout the area and is present in 18 of the total 24 samples sites. The species is present in all samples taken within the Turbine Site Area except at S13. It was not found in the Export Cable Route except for at sampling site S07.
The Shannon-Wiener index varies between 1.8 and 3.6. The Shannon index increases as both the number of species and the evenness of the community increase. The lowest values are represented by four of the six sampled sites on the Export Cable Route, S01, S03, S09 and S10, and of one site in the Turbine Site Area, S34. Simpson’s diversity index varies between 0.82 and 0.98, the larger the value the higher the diversity, and is the highest for sampling sites S07, S10, S11, S18 and S22. The lowest values are found were at sample sites S01, S09, S14, S29 and S34.
Table 32 Total number of species and individuals per sample along with species diversity indices Grey shaded samples are samples of insufficient sample volumes, <5 litres.
Sample ID
Total species: S
Total individuals: N
Pielou Evenness index: J'=H'/Log(S)
Shannon-Wiener Diversity Index: H',
log base e
Simpson's Diversity Index: 1-Lambda'
S01_01 14 74 0.7849 2.1 0.8327
S03_02 7 9 0.941 1.8 0.9167
S07_01 49 157 0.8614 3.6 0.9451
S09_01 17 38 0.828 2.3 0.8563
S10_01 9 10 0.9849 2.2 0.9778
S11_01 33 72 0.929 3.2 0.9652
S13_01 30 63 0.8468 2.9 0.9191
S14_01 23 73 0.7589 2.4 0.8261
S15_01 35 102 0.8144 2.9 0.9084
S16_01 27 103 0.8153 2.7 0.8824
S18_01 37 105 0.8396 3.0 0.9271
S20_01 45 97 0.8028 3.1 0.8853
S21_01 31 69 0.8574 2.9 0.9254
S22_01 28 71 0.9028 3.0 0.9485
S23_01 26 97 0.783 2.6 0.8677
S24_01 37 112 0.7854 2.8 0.8719
S25_01 27 62 0.8507 2.8 0.9112
S26_01 31 91 0.8042 2.8 0.8943
S27_01 22 50 0.867 2.68 0.9184
S28_01 19 55 0.8506 2.505 0.8936
S29_01 21 61 0.7709 2.347 0.8213
S31_01 33 95 0.8289 2.898 0.8985
S32_01 27 92 0.7973 2.628 0.8729
S34_01 17 72 0.7817 2.215 0.8415
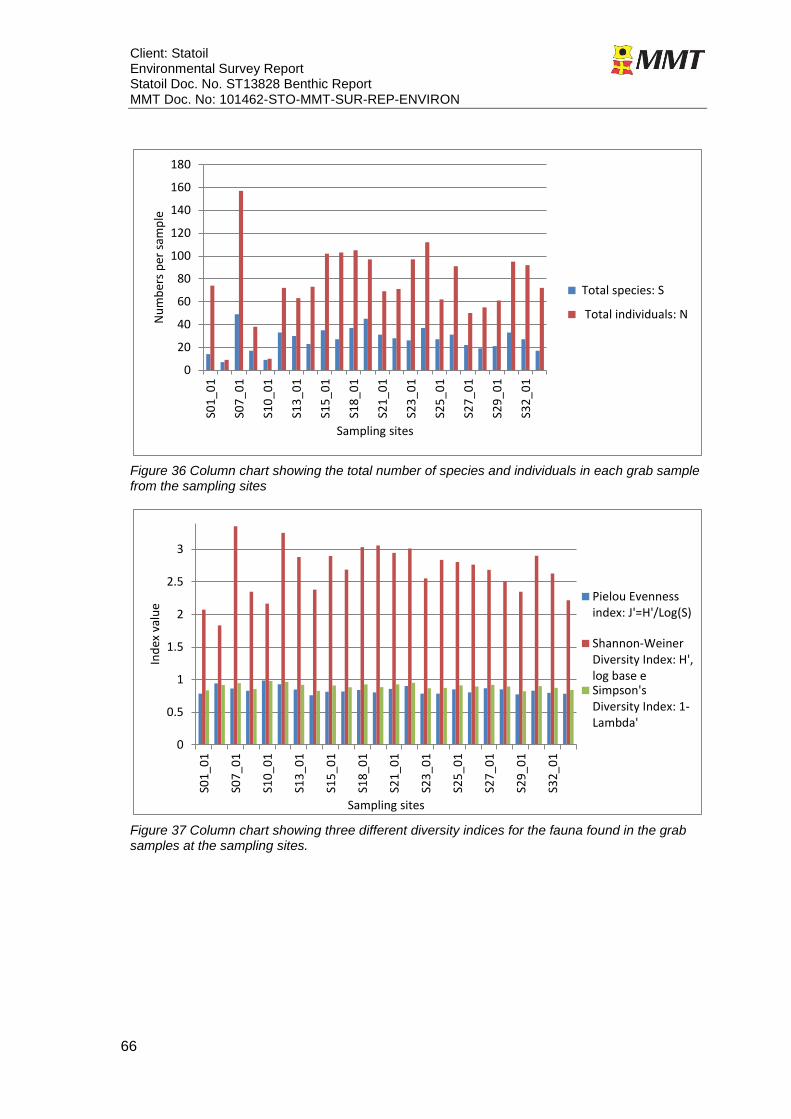
Client: Statoil Environmental Survey Report Statoil Doc. No. ST13828 Benthic Report MMT Doc. No: 101462-STO-MMT-SUR-REP-ENVIRON
66
Figure 36 Column chart showing the total number of species and individuals in each grab sample from the sampling sites
Figure 37 Column chart showing three different diversity indices for the fauna found in the grab samples at the sampling sites.
0
20
40
60
80
100
120
140
160
180
S01
_01
S07
_01
S10
_01
S13
_01
S15
_01
S18
_01
S21
_01
S23
_01
S25
_01
S27
_01
S29
_01
S32
_01
Nu
mb
ers
per
sam
ple
Sampling sites
Total species: S
Total individuals: N
0
0.5
1
1.5
2
2.5
3
S01
_01
S07
_01
S10
_01
S13
_01
S15
_01
S18
_01
S21
_01
S23
_01
S25
_01
S27
_01
S29
_01
S32
_01
Ind
ex v
alu
e
Sampling sites
Pielou Evennessindex: J'=H'/Log(S)
Shannon-WeinerDiversity Index: H',log base eSimpson'sDiversity Index: 1-Lambda'
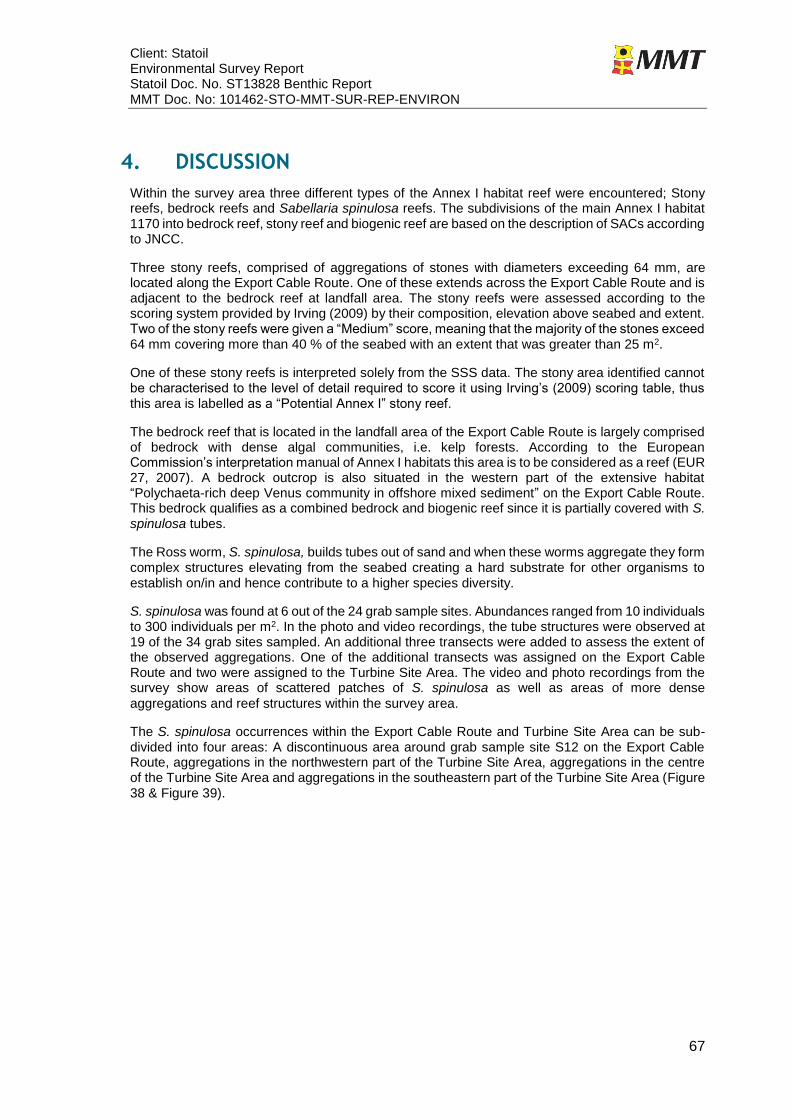
Client: Statoil Environmental Survey Report Statoil Doc. No. ST13828 Benthic Report MMT Doc. No: 101462-STO-MMT-SUR-REP-ENVIRON
67
4. DISCUSSION
Within the survey area three different types of the Annex I habitat reef were encountered; Stony reefs, bedrock reefs and Sabellaria spinulosa reefs. The subdivisions of the main Annex I habitat 1170 into bedrock reef, stony reef and biogenic reef are based on the description of SACs according to JNCC.
Three stony reefs, comprised of aggregations of stones with diameters exceeding 64 mm, are located along the Export Cable Route. One of these extends across the Export Cable Route and is adjacent to the bedrock reef at landfall area. The stony reefs were assessed according to the scoring system provided by Irving (2009) by their composition, elevation above seabed and extent. Two of the stony reefs were given a “Medium” score, meaning that the majority of the stones exceed 64 mm covering more than 40 % of the seabed with an extent that was greater than 25 m2.
One of these stony reefs is interpreted solely from the SSS data. The stony area identified cannot be characterised to the level of detail required to score it using Irving’s (2009) scoring table, thus this area is labelled as a “Potential Annex I” stony reef.
The bedrock reef that is located in the landfall area of the Export Cable Route is largely comprised of bedrock with dense algal communities, i.e. kelp forests. According to the European Commission’s interpretation manual of Annex I habitats this area is to be considered as a reef (EUR 27, 2007). A bedrock outcrop is also situated in the western part of the extensive habitat “Polychaeta-rich deep Venus community in offshore mixed sediment” on the Export Cable Route. This bedrock qualifies as a combined bedrock and biogenic reef since it is partially covered with S. spinulosa tubes.
The Ross worm, S. spinulosa, builds tubes out of sand and when these worms aggregate they form complex structures elevating from the seabed creating a hard substrate for other organisms to establish on/in and hence contribute to a higher species diversity.
S. spinulosa was found at 6 out of the 24 grab sample sites. Abundances ranged from 10 individuals to 300 individuals per m2. In the photo and video recordings, the tube structures were observed at 19 of the 34 grab sites sampled. An additional three transects were added to assess the extent of the observed aggregations. One of the additional transects was assigned on the Export Cable Route and two were assigned to the Turbine Site Area. The video and photo recordings from the survey show areas of scattered patches of S. spinulosa as well as areas of more dense
aggregations and reef structures within the survey area.
The S. spinulosa occurrences within the Export Cable Route and Turbine Site Area can be sub-divided into four areas: A discontinuous area around grab sample site S12 on the Export Cable Route, aggregations in the northwestern part of the Turbine Site Area, aggregations in the centre of the Turbine Site Area and aggregations in the southeastern part of the Turbine Site Area (Figure 38 & Figure 39).
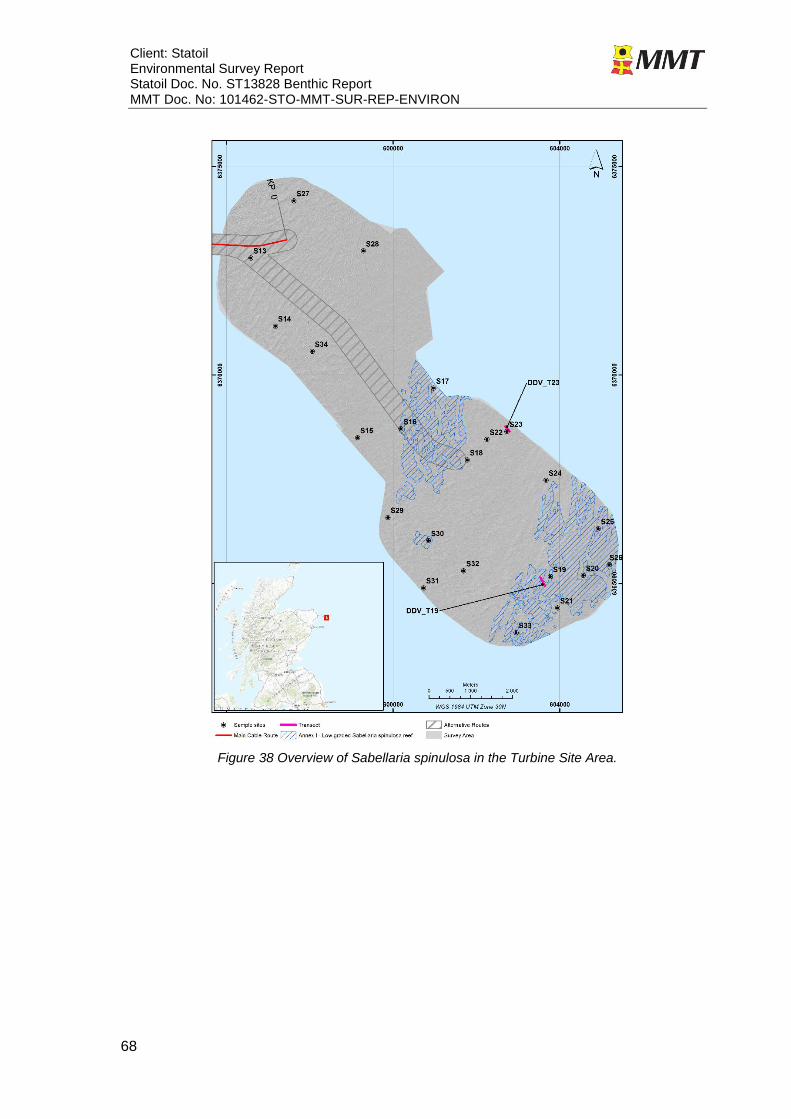
Client: Statoil Environmental Survey Report Statoil Doc. No. ST13828 Benthic Report MMT Doc. No: 101462-STO-MMT-SUR-REP-ENVIRON
68
Figure 38 Overview of Sabellaria spinulosa in the Turbine Site Area.
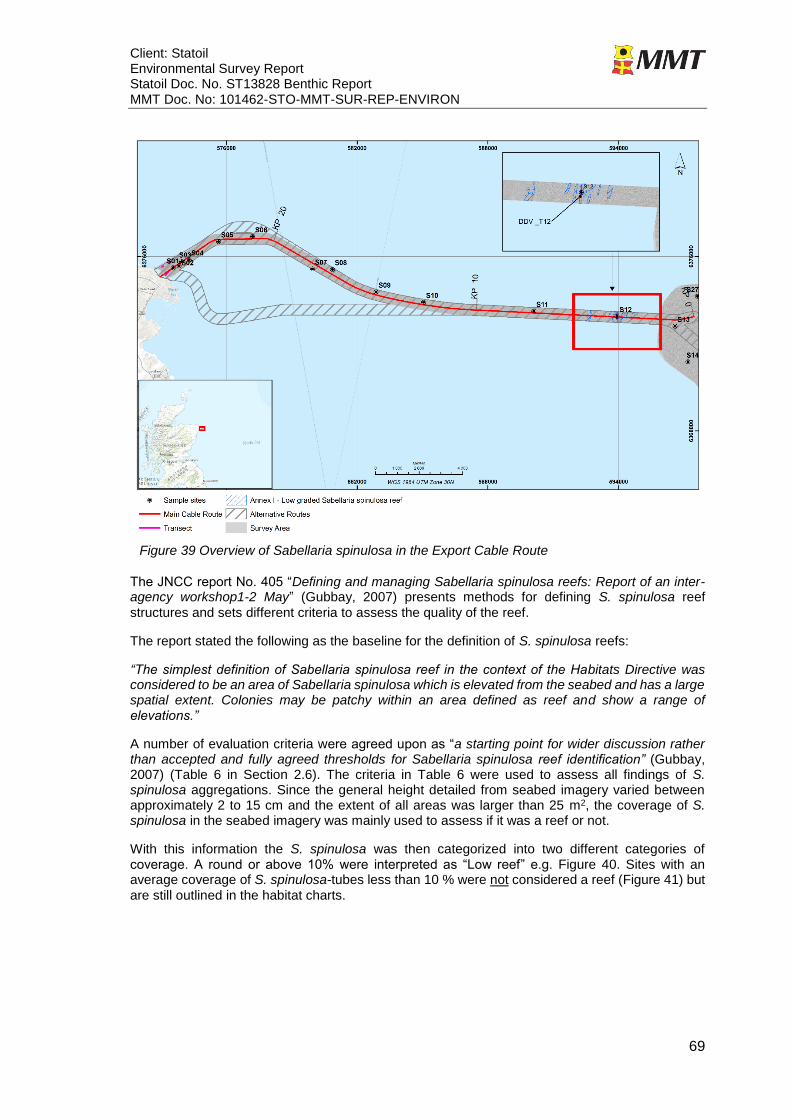
Client: Statoil Environmental Survey Report Statoil Doc. No. ST13828 Benthic Report MMT Doc. No: 101462-STO-MMT-SUR-REP-ENVIRON
69
Figure 39 Overview of Sabellaria spinulosa in the Export Cable Route
The JNCC report No. 405 “Defining and managing Sabellaria spinulosa reefs: Report of an inter-agency workshop1-2 May” (Gubbay, 2007) presents methods for defining S. spinulosa reef
structures and sets different criteria to assess the quality of the reef.
The report stated the following as the baseline for the definition of S. spinulosa reefs:
“The simplest definition of Sabellaria spinulosa reef in the context of the Habitats Directive was considered to be an area of Sabellaria spinulosa which is elevated from the seabed and has a large spatial extent. Colonies may be patchy within an area defined as reef and show a range of elevations.”
A number of evaluation criteria were agreed upon as “a starting point for wider discussion rather than accepted and fully agreed thresholds for Sabellaria spinulosa reef identification” (Gubbay, 2007) (Table 6 in Section 2.6). The criteria in Table 6 were used to assess all findings of S. spinulosa aggregations. Since the general height detailed from seabed imagery varied between approximately 2 to 15 cm and the extent of all areas was larger than 25 m2, the coverage of S. spinulosa in the seabed imagery was mainly used to assess if it was a reef or not.
With this information the S. spinulosa was then categorized into two different categories of coverage. A round or above 10% were interpreted as “Low reef” e.g. Figure 40. Sites with an average coverage of S. spinulosa-tubes less than 10 % were not considered a reef (Figure 41) but
are still outlined in the habitat charts.
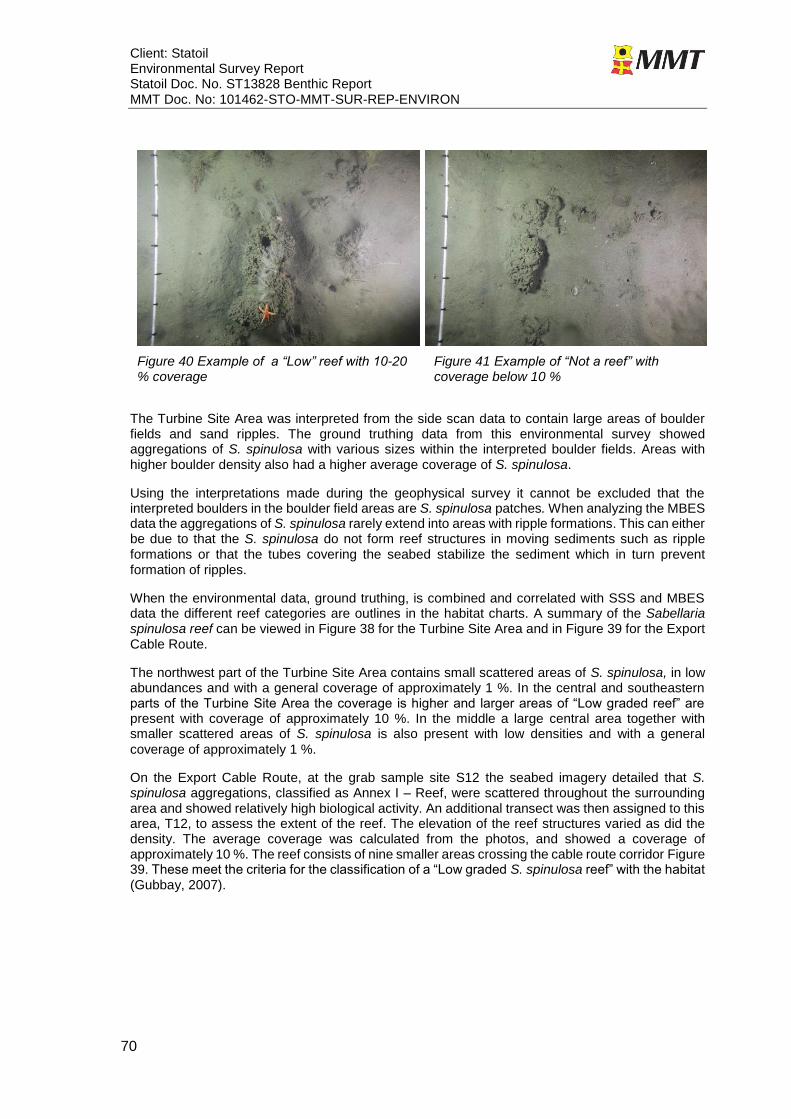
Client: Statoil Environmental Survey Report Statoil Doc. No. ST13828 Benthic Report MMT Doc. No: 101462-STO-MMT-SUR-REP-ENVIRON
70
Figure 40 Example of a “Low” reef with 10-20 % coverage
Figure 41 Example of “Not a reef” with coverage below 10 %
The Turbine Site Area was interpreted from the side scan data to contain large areas of boulder fields and sand ripples. The ground truthing data from this environmental survey showed aggregations of S. spinulosa with various sizes within the interpreted boulder fields. Areas with higher boulder density also had a higher average coverage of S. spinulosa.
Using the interpretations made during the geophysical survey it cannot be excluded that the interpreted boulders in the boulder field areas are S. spinulosa patches. When analyzing the MBES data the aggregations of S. spinulosa rarely extend into areas with ripple formations. This can either be due to that the S. spinulosa do not form reef structures in moving sediments such as ripple formations or that the tubes covering the seabed stabilize the sediment which in turn prevent formation of ripples.
When the environmental data, ground truthing, is combined and correlated with SSS and MBES data the different reef categories are outlines in the habitat charts. A summary of the Sabellaria spinulosa reef can be viewed in Figure 38 for the Turbine Site Area and in Figure 39 for the Export Cable Route.
The northwest part of the Turbine Site Area contains small scattered areas of S. spinulosa, in low abundances and with a general coverage of approximately 1 %. In the central and southeastern parts of the Turbine Site Area the coverage is higher and larger areas of “Low graded reef” are present with coverage of approximately 10 %. In the middle a large central area together with smaller scattered areas of S. spinulosa is also present with low densities and with a general
coverage of approximately 1 %.
On the Export Cable Route, at the grab sample site S12 the seabed imagery detailed that S. spinulosa aggregations, classified as Annex I – Reef, were scattered throughout the surrounding area and showed relatively high biological activity. An additional transect was then assigned to this area, T12, to assess the extent of the reef. The elevation of the reef structures varied as did the density. The average coverage was calculated from the photos, and showed a coverage of approximately 10 %. The reef consists of nine smaller areas crossing the cable route corridor Figure 39. These meet the criteria for the classification of a “Low graded S. spinulosa reef” with the habitat (Gubbay, 2007).
Client: Statoil Environmental Survey Report Statoil Doc. No. ST13828 Benthic Report MMT Doc. No: 101462-STO-MMT-SUR-REP-ENVIRON
71
The Southern trench which is a geographical area of sloping seabed that runs along Scotland’s east coast from Cullen to Aberdeen, and crossing a part of the Export Cable Route, is pinpointed as a MPA search area by SNH. (Figure 2) This is an area that may hold protected features. These features include cetaceans and one marine benthic habitat; Burrowed mud. These are listed in the data confidence assessment for the Southern Trench (SNH, 2012). The mapping of burrowed mud was included in the scope of work for this survey. No burrowed mud was encountered in the Export Cable Route, or in the Turbine Site Area. This is consistent with the results from the video and image sampling made by Marine Scotland during a cruise to the Buchan Deep 2010 (Xodus, 2013).
No habitat listed among the PMF’s was detected during this survey. The intertidal area at the landfall areas of the Export Cable Route is largely comprised of bedrock with dense algal communities. None of the sampled vegetated bedrock qualifies as a PMF, since the PMF only lists a sub-group of the tide-swept algal habitats. These are fucoids in tide-swept conditions and kelp along with Halidrys siliquosa on coarse or mixed substrata or in sheltered areas. The infralittoral algal communities found in this survey are not dominated by fucoids and are all found on bedrock and are not sheltered (Howson, M C; Steel, L; Carruthers, M, 2012).
Three species listed among the PMF’s were encountered during this survey. The Raitt’s sand eel Ammodytes marinus, the lesser sand eel Ammodytes tobianus and the ocean quahog, Arctica islandica. One specimen of A. marinus was found at grab sample S09 and one specimen of A. tobianus was found at grab sample site S03. Both sites are situated in areas of fine sand on the Export Cable Route. The ocean quahog, Arctica islandica was found in one grab sample in the southeastern part of the Turbine Site Area. A. islandica is by the OSPAR commission listed as a species that is threatened or under decline (OSPAR Commission 2009b) and A. marinus is listed on the UK BAP species list (BRIG (ed. Ant Maddock), 2008 (Uppdated Dec 2011)).
Oil and heavy metal concentrations were also determined at seven sites. The measured levels of heavy metals and trace metals show elevated values for Arsenic, Copper, Chromium and Lead. The Arsenic values exceed the OSPAR, EAC (low) at all seven sites (Figure 15). At five out of seven sampling sites the thresholds of the Canadian Guidelines, ISQG is also exceeded. The highest levels were recorded at sites S07 and S09, which also exceed the OSPAR, EAC (high) threshold Table 24. Measured values for Copper, Chromium and Lead showed low concentrations values above the OSPAR, EAC (low). Elevated concentrations in the sediment close to the coast reflect a combination of natural and anthropogenic inputs. No distribution patterns have been found for these elevated levels, and no correlation to existing dumping sites as a possible cause for elevated values has been found.
Client: Statoil Environmental Survey Report Statoil Doc. No. ST13828 Benthic Report MMT Doc. No: 101462-STO-MMT-SUR-REP-ENVIRON
72
5. CONCLUSIONS
The interpretation and classification of habitats of the survey areas was made using the JNCC habitat classification scheme. Data from grab sampling, video and photo were used together with PSA results and statistical analyses from each grab sample site. To assess the extent of the classified biotopes bathymetry, SSS and backscatter data collected during the geophysical survey were analysed from a biological point of view. The results are presented in this report as well as habitat charts (Appendix H – Chart Index).
Three stony reefs are located along the Export Cable Route. One of them extends across the Export Cable Route and is adjacent to the bedrock reef at landfall area. The bedrock reef is comprised of dense algal communities, i.e. kelp forests and is thus considered to be a reef according to the European Commission’s interpretation manual (EUR 27, 2007). Additional bedrock areas, on the Export Cable Route, were situated in the western part of the extensive habitat “Polychaeta-rich deep Venus community in offshore mixed sediment”. Due to the coverage of S. spinulosa tubes
and the extent of the bedrock this area qualified a combination of bedrock and biogenic reef.
Within the Turbine Site Area, Sabellaria spinulosa findings varied and were scattered over this surveyed area. In the northwest parts the densities recorded were small, as was the coverage. Several locations in the central and southeastern parts of the Turbine Site Area had a coverage that was approximately 10% and therefore these areas were classified as “Low graded reef”. One additional S. spinulosa reef was recorded at grab sample site S12. Furthermore, S. spinulosa was found at 6 out of the 24 grab sample sites within this survey with abundances that ranged from 10 individuals to 300 individuals per m2.
No burrowed mud was identified with in the Southern trench, which is pinpointed as a MPA search area by SNH. No burrowed mud was encountered in the Export Cable Route, or in the Turbine Site Area which is consistent with the results from the video and image sampling made by Marine Scotland during a cruise to the Buchan Deep 2010.
No habitat listed among the PMF’s was detected during this survey. Three species listed among the PMF’s were encountered during this survey. The Raitt’s sand eel Ammodytes marinus, the lesser sand eel Ammodytes tobianus and the ocean quahog, Arctica islandica. One specimen of A. marinus was found at grab sample S09 and one specimen of A. tobianus was found at grab sample site S03. The ocean quahog, Arctica islandica was found in one grab sample in the
southeastern part of the Turbine Site Area.
The PSA analyses detail that sand dominates the Export Cable Route while in the seabed surface within the Turbine Site Area is predominantly comprised of sand with occasional shell fragments. No distribution patterns have been found for the elevated levels of heavy metals and trace metals and no correlation to existing dumping sites as a possible cause for elevated values has been found. PAH concentrations levels measured within in the Export Cable Route were for several hydrocarbon groups below the detection limits (<1) and all were well below any threshold guidelines (Table 30).
Client: Statoil Environmental Survey Report Statoil Doc. No. ST13828 Benthic Report MMT Doc. No: 101462-STO-MMT-SUR-REP-ENVIRON
73
6. REFERENCES
BRIG (ed. Ant Maddock). 2008 (Uppdated Dec 2011). UK Biodiversity Action Plan Priority Habitat Descriptions. u.o. : JNCC, 2008 (Uppdated Dec 2011). CCME. 2002. Canadian Council of Ministers of the Environment. 2002. Canadian sediment quality guidelines for the protection of aquatic life: Summary tables.Updated. In: Canadian environmental quality guidelines, 1999, Canadian Council of Ministers of the Environment. Winnipeg : u.n., 2002. Clarke, K. R. and Gorley, R. N. 2006. PRIMER v6: User Manual/Tutorial. Plymouth : PRIMER-E, 2006. Clarke, K. R. and Warwick, R. M. 2001. Change in marine communities: An approach to statisctical analysis and interpretation, 2nd edition. Plymouth : PRIMER-E, 2001. Cole, S., Codling, I.D., Parr, W. and Zabel, T. 1999. Guidelines for managing water quality impacts. 1999. Connor et al. 2004. THE MARINE HABITAT CLASSIFICATION FOR BRITAIN AND IRELAND VERSION 04.05. u.o. : JNCC, 2004. Dutch Target and Intervention Values. 2000. ANNEXES Circular on target values and intervention values for soil remediation. 2000. EUR 27. 2007. Interpretation manual of European Union Habitats. u.o. : COMMISSION, EUROPEAN, 2007. Grimwood, M.J. & Dixon, E. 1997. Assessment of risks posed by List II metals to Sensitive. 1997. Gubbay, S. 2007. Defining and managing Sabellaria spinulosa reefs: Report of an inter-agency workshop Report of an inter-agency workshop. s.l. : Joint Nature Conservation Committee, 2007. Holt et al. 1998. Biogenic Reefs (volume IX). An overview of dynamic and sensitivity characteristics for conservation management of marine SACs. u.o. : UK Marine SACs Project, 1998. Howson, M C; Steel, L; Carruthers, M. 2012. Identification of Priority Marine Features in Scottish territorial waters. Commissioned Report No. 388. u.o. : Scottish Natural Heritage, 2012. Irving, R. 2009. The identification of the main characteristics of stony reef habitats under the Habitats Directive. Summary report of an inter-agency workshop 26-27 March 2008. Peterborough : JNCC Report No.432, 2009. ISSN 0963-8091. Limpenny, et. al. 2010. Best methods for identifying and evaluating Sabellaria spinulosa and cobble reef. s.l. : Joint Nature Conservation Committee, 2010. Long E.R. et al. 1995. Incidence of adverse biological effects within ranges of chemical concentration in marine and estuarine sediments. u.o. : Environmental Management, 1995. Maddock, BRIG ed. Ant. 2008, Updated December 2011. UK Biodiversity Action Plan Priority Habitat Descriptions. JNCC Defta. [Online] 2008, Updated December 2011. http://jncc.defra.gov.uk/PDF/UKBAP_PriorityHabitatDesc-Rev2011.pdf. NMMPWG, National Marine Monitoring Programme Working Group. 2004. UK National Marine Monitoring Programme - Second Report (1999-2001). 2004. OSPAR Agreement. 2006. Agreement on background concentrations for contaminants in seawater, biota and sediment. OSPAR Agreement 2005-6. 2006. OSPAR Commision. Revised OSPAR Guidelines for the Management of Dredged Material Ref. No. 2004-08. CEDA-Central Dredging Association. [Online] [Cited: 13 August 2012.] http://www.dredging.org/documents/ceda/downloads/environ-ospar-revised-dredged-material-guidelines.pdf. OSPAR Commission 2008. Case Reports for the OSPAR List of threatened and/or declining species and habitats.
Client: Statoil Environmental Survey Report Statoil Doc. No. ST13828 Benthic Report MMT Doc. No: 101462-STO-MMT-SUR-REP-ENVIRON
74
OSPAR Commission 2009b. OSPAR Background for the Ocean quahog [Arctica islandica] 407/2009. s.l. : OSPAR Commission. 978-1906840-47-1. OSPAR Commission. 2008. Overview of Contracting Parties’ National Action Levels for Dredged Material (2008 Update) 2008/363. s.l. : OSPAR Commission, 2008. 978-1-906840-02-0. SNH. 2012. SOUTHERN TRENCH MPA SEARCH LOCATION. u.o. : Scottish Natural Heritage, 2012. The Council of the European Communities. 1992. Council Directive 92/43/EEC of 21 May 1992 on the conservation of the natural habitats and of wild fauna and flora. 1992. ss. 7-50. Xodus, Group. 2013. EIA Scoping Report. u.o. : Xodus Group, 2013. A-100142-S00-REPT-001.