Embed Size (px)
Citation preview

793
Status and Management of the Java Sea FisheriesPurwanto
Directorate General of Capture Fisheries,Ministry of Marine Affairs and Fisheries
Jl. Medan Merdake Timur 16Jakarta, Indonesia
Email: [email protected]
Purwanto, 2003. Status and management of the Java Sea fisheries, p. 793 - 832. In G. Silvestre, L. Garces, I. Stobutzki, M. Ahmed, R.A. Valmonte-Santos, C. Luna, L. Lachica-Aliño, P. Munro, V. Christensen and D. Pauly (eds.) Assessment, Management and Future Directions for Coastal Fisheries in Asian Countries. WorldFish Center Conference Proceeding 67, 1 120 p.
Abstract
The Java Sea is a major fishing ground in Indonesia contributing 31% of the national marine fisheries production. Demersal and small pelagic fishery resources account for most production in the area. During the 1960s and 1970s, strong demand for fish, which in Indonesia resulted from both increased human popula-tion and increased per capita fish consumption, stimulated the development of fishing in the Java Sea. This led to development of up-stream and down-stream industries, increases in employment opportunities, and increases in the number of fishers and fishing households.
Like most Indonesian fisheries, the Java Sea fisheries may be characterized as de facto open access with no restrictions on fishing effort. Free competition occurs among large-scale and small scale fishers. Increasing numbers and sizes of fishing gear and boats, as well as extension of operations into new fishing grounds, have resulted in biological and economic over-exploitation. Meanwhile, the quality of coastal habitats such as mangroves and coral reefs has decreased due to adverse effects of human activities. Over-exploitation, as indicated by decreases in CPUE and profit per vessel, and environmental degradation has led to poverty of fishers in coastal areas. Small scale fishers who comprise the majority of fishers have suffered most because the small boats they operate are less efficient.
Fisheries management in the Java Sea would involve controlling fishing effort, which in turn would require the provision of alternative livelihood for displaced fishers. This paper describes key features of an “Integrated Program of Fisheries Management and Development for the Java Sea”, and outlines the activities for improving fisheries management in the area. Among other things, the program calls for establishment of a Fisheries Management Body to implement management at a regional level with the central government supervising the provincial govern-ments. All stakeholders should be involved in managing the fisheries. Beyond the Java Sea fisheries, two actions are recommended to promote regional co-operation and sharing of experiences with other countries. These are (1) networking for transfer of information and experiences on fisheries co-management, and (2) regional pilot projects for shared stock management.
794 WorldFish Center 795
Introduction
The Java Sea is an important area for small scale fisheries in Indonesia. The Java Sea fisheries supply fish for consumption and processing, support marketing industries and provide jobs. In 1997, the Java Sea fisheries contributed about 31% of the national marine fisheries production Directorate General of Fisheries (DGF 1999a). Demersal and small-pelagic fishery resources are the main con-tributors to fisheries production. Various traditional fishing gears have exploited these fishery resources long before Indonesian independence (Butcher 1995; Dwiponggo 1987). The demersal fishery rap-idly developed after the introduction of trawl fish-ing during the late 1960s, prompted by stronginternational demand for shrimp (Bailey and Dwi-ponggo 1987). Meanwhile, the small pelagic fish-ery developed rapidly after the introduction of purse seines during the early 1970s (Bailey and Dwiponggo 1987).
Development of trawl fishing threatened the sus-tainability of demersal stocks and resulted in seri-ous conflict between small scale fishers and trawl fishers. In response, the Government of Indonesia banned trawl fishing through the promulgation of Presidential Decree No. 39 in 1980. However, other demersal fishing gear emerged after the trawl ban. This increased fishing pressure on coastal demersal fishery resources off the northern coast of Java. Consequently, catch rates decreased again. Increa-sed fishing pressure has resulted in over-exploita-tion of the demersal resources in inshore areas. Similarly, the purse seine fleet grew rapidly. Sizes of fishing gear and boats have increased to extend fishing areas. Consequently, the small-pelagic re-sources in the Java Sea are reportedly over-exploit-ed National Commission on Stock Assessment of Marine Fisheries Resources (NCSAMFR) 1998.
Under conditions of open access and free competi-tion among large scale and small scale fishing fleets, the small scale fishers are disadvantaged since they use less efficient gear. The result is widespread pov-erty among small scale fishers (Purwanto 1995). In addition, the current economic slowdown exac-erbates poor socioeconomic conditions among small scale fishers. The problem is extensive since small scale fishers comprise a large majority of fish-ers Directorate General of Fisheries (DGF 1999a).
Management of the Java Sea fisheries is required to ensure sustainability of the fisheries and to opti-
mise economic benefits from utilization of the resources. Fisheries management will require re-ducing fishing effort, which in turn will need the provision of alternative livelihood for many fishers. A development program for such a purpose is clearly needed. This study proposes an integrated management and development program for the Java Sea fisheries. It is based on a review of the area’s coastal environment, fishery resources, and socioeconomic setting. The study also reviews legal and institutional aspects relevant to fisheries man-agement, then focuses on the coastal capture fisher-ies, particularly on their economics and exploita-tion status. Finally, the foregoing are considered in an analysis of management issues and opportuni-ties, and the major elements of the management and development program are briefly described.
Coastal Environment
Indonesia is an archipelagic state composed of over 17 000 islands with a coastline of about 81 000 km. The country has a total land area of about 1.9 mil-lion km2. The marine fishery area of Indonesia is about 5.8 million km2, consisting of territorial and archipelagic waters of 3.1 million km2 and an Exclu-sive Economic Zone (EEZ) of 2.7 million km2.
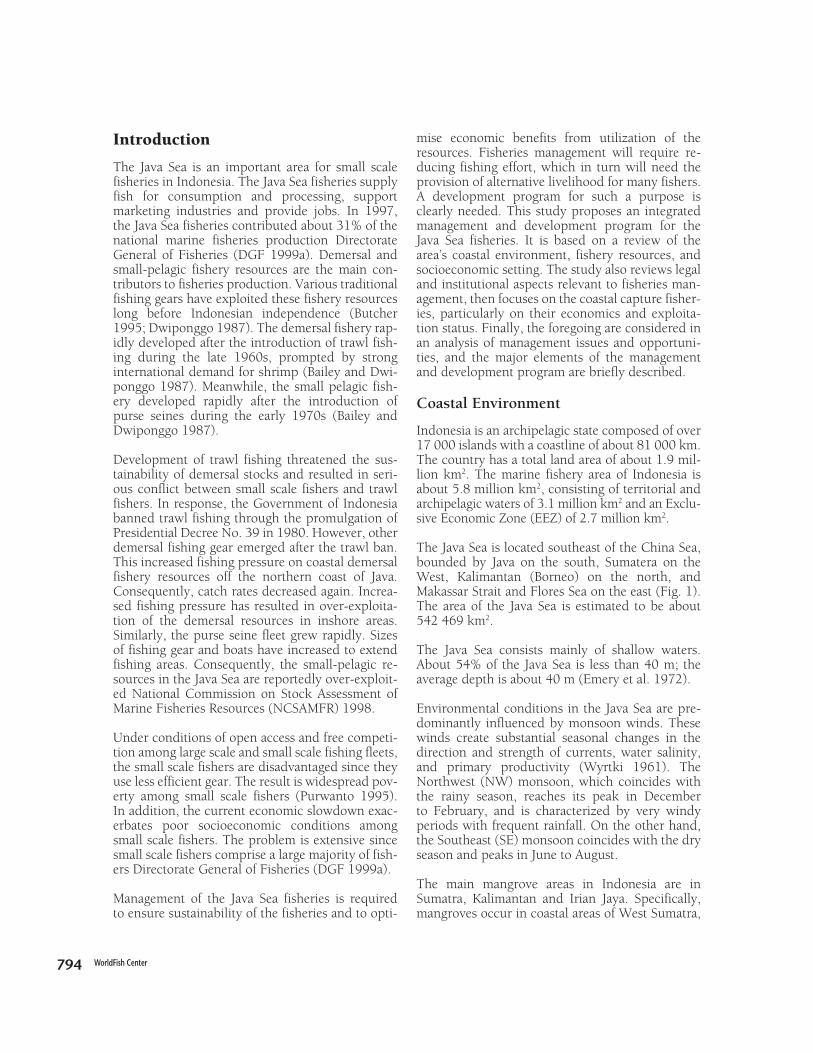
The Java Sea is located southeast of the China Sea, bounded by Java on the south, Sumatera on the West, Kalimantan (Borneo) on the north, and Makassar Strait and Flores Sea on the east (Fig. 1). The area of the Java Sea is estimated to be about 542 469 km2.
The Java Sea consists mainly of shallow waters. About 54% of the Java Sea is less than 40 m; the average depth is about 40 m (Emery et al. 1972).
Environmental conditions in the Java Sea are pre-dominantly influenced by monsoon winds. These winds create substantial seasonal changes in the direction and strength of currents, water salinity, and primary productivity (Wyrtki 1961). The Northwest (NW) monsoon, which coincides with the rainy season, reaches its peak in December to February, and is characterized by very windy periods with frequent rainfall. On the other hand, the Southeast (SE) monsoon coincides with the dry season and peaks in June to August.
The main mangrove areas in Indonesia are in Sumatra, Kalimantan and Irian Jaya. Specifically, mangroves occur in coastal areas of West Sumatra,
794 WorldFish Center 795
the eastern coast of Sumatra, the southern coast of Irian Jaya, and the western, southern and eastern coast of Kalimantan (Moosa et al. 1996). There are at least 47 mangrove species in Indonesia (Office of the Minister of Environment. Department of For-estry. Indonesian Institute of Sciences. Department of Home Affairs and Mangrove Foundation (OME-DF-IIS-DHA-MF) 1997).
The area of mangrove in Indonesia decreased by about 1 million ha and about 0.8 million ha during the periods 1982 - 87 and 1987 - 93, respectively. The area of coastal aquaculture, brackish-water
ponds, by contrast, has only increased by about 40 thousand ha and about 70 thousand ha during the periods 1982 - 87 and 1987 - 93, respectively. It seems that coastal aquaculture was not the main cause of mangrove destruction in Indonesia. Silvo-fish culture has been introduced in order to con-serve the mangrove resources while allowing local people to earn their livelihood (Purwanto 1999).
Indonesian coral reef communities are among the most diverse in the world. In 1984, the Snellius II Expedition surveyed nine areas in the eastern part of the archipelago and collected approximately 350 scleractinian coral species, belonging to 75 coral genera (Borel-Best et al. 1989). The three most important reef-building coral genera in Indonesia, Acropora, Montipora and Porites, are represented by a large number of species (Moosa et al. 1996).
The sustainability of Indonesian coral reefs is threatened. An assessment based on living coral cover at 421 stations in 43 different areas reported that only 6.4% of the reef areas are in excellent
Fig. 1. Location of the Java Sea.
4
0
-4
-8
Area 4
104 108 112 116 120
LATI
ITU
DE
ºS &
ºN
KALIMANTAN
Table 1. Areas of Mangrove and Brackish-water Ponds in Indonesia (in 1 000 ha).
1982 1987 1993
1. Mangrove a 4 251.0 3 235.7 2 490.2
2. Brackish-water ponds b 220.4 263.2 331.8
SUMATRA
JAVA SEA
JAVA
Area 2
Area 1
Area 3
Sources: a OME-DF-IIS-DHA-MF 1997; b DGF 1997; DGF 1998.
LONGITUDE ºE

796 WorldFish Center 797
condition, 24.3% in good condition, 29.2% in fair condition, and 40.1% in poor condition (Suharsono 1998). Destruction of coral reefs is mainly caused by blast-fishing, the use of poisons for catching ornamental fishes, and coral mining The World Bank (WB 1998).
Fishery Resources and Potentials
The National Commission on Stock Assessment of Marine Fisheries Resources (NCSAMFR 1998) cat-egorised fishery resources of Indonesia into seven groups (Table 2). The maximum sustainable yield (MSY) of fishery resources in Indonesia is estimated to be about 6.26 million t (Agriculture Ministerial Decree no. 995 of 1999) (Table 2). At the national level, small pelagics and demersals can be consid-ered the main resources since they contri-bute 52.4% and 28.9%, respectively, of total MSY.
About 13.7 % of potential yield in Indonesia comes from the Java Sea. The MSY of fishery resources is about 852 000 t (Table 2). The two main fishery resources are small pelagic and demersal fishes. The demersal fish stocks contribute about 50.8 % of MSY while small pelagics contribute about 40.1 %.
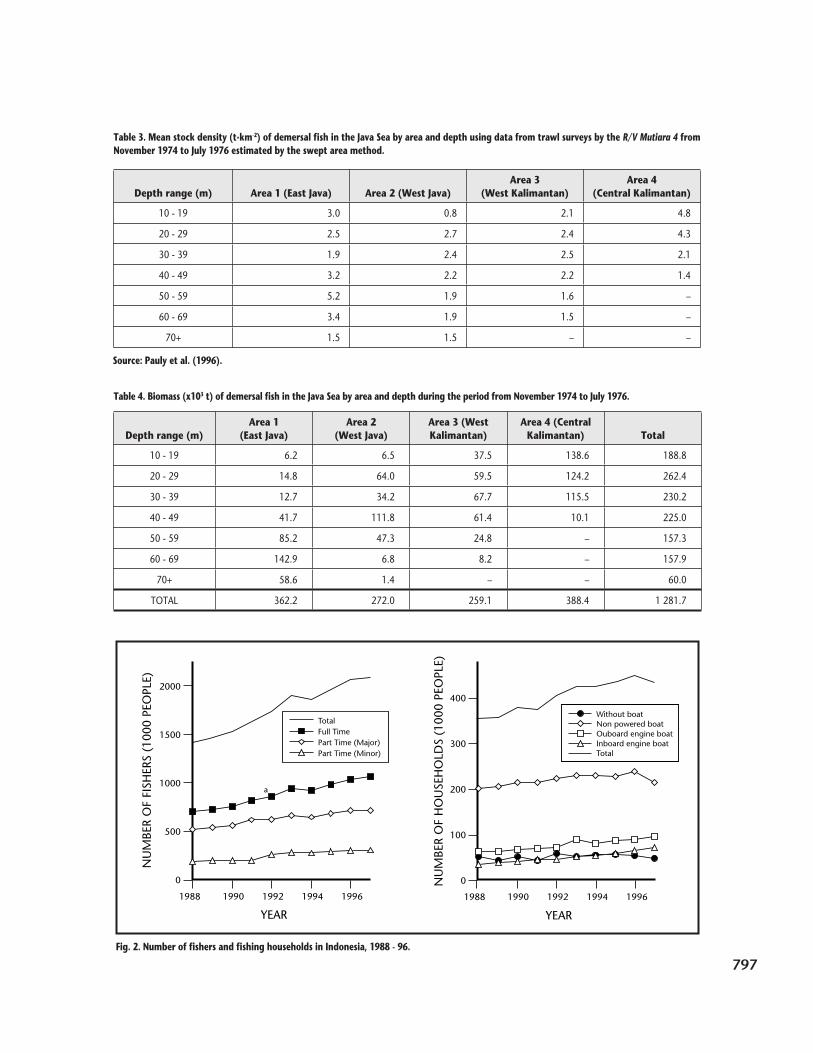
Table 3 gives mean densities of demersal fish at different areas and depths in the Java Sea estimated
Table 2. Estimate of maximum sustainable yield (x103 t) of marine fisheries resources of Indonesia and the Java Sea, 1997 a.
Fishery Resources Groups National
Java Sea(includes
Sunda Strait)
Small pelagic 3 236 340
Large pelagic 1 054 55
Demersal 1 786 431
Crustacea:
Penaeid prawns 74 11
Lobster 5 0.5
Carangids 76 9.5
Ornamental fishes b (1.52 x 10⁹) (3.4 x 10⁷)
Squids 28 5.0
TOTAL 6 259 852
Note: a Agriculture Ministerial Decree No. 995 of 1999; b number of individuals.
during 1974 - 76. The highest stock density of 5.2 t·km-2 occurred in the northern coast of the Province of East Java (Area 1), between 50 and 59 m depth. The lowest stock density of 0.8 t·km-2 occurred in the northern coast of the Province of West Java (Area 2), which has heavily exploited shallow waters (Pauly et al. 1996).
Table 4 presents biomass estimates of demersal fish in the Java Sea by area and depth. Area 4 on the southern coast of Central Kalimantan had the highest standing stock of demersal fish during 1974 - 76.
Socioeconomic Background
The population of Indonesia stood at 195 million in 1995. The annual growth rate has declined, from 2.32% during 1971 - 80 to 1.66% during 1990 - 95. Most of the population is concentrated in the west-ern part of Indonesia, with Java being the most populated island. Java accounts for only about 6.6 % of the total area of Indonesia, but 59% of the population resided there in 1997. In 1997, the population density of Indonesia was about 104 persons/km2, while the population density in Java was about 926 persons/km2 Central Board of Statistics (CBS 1998).
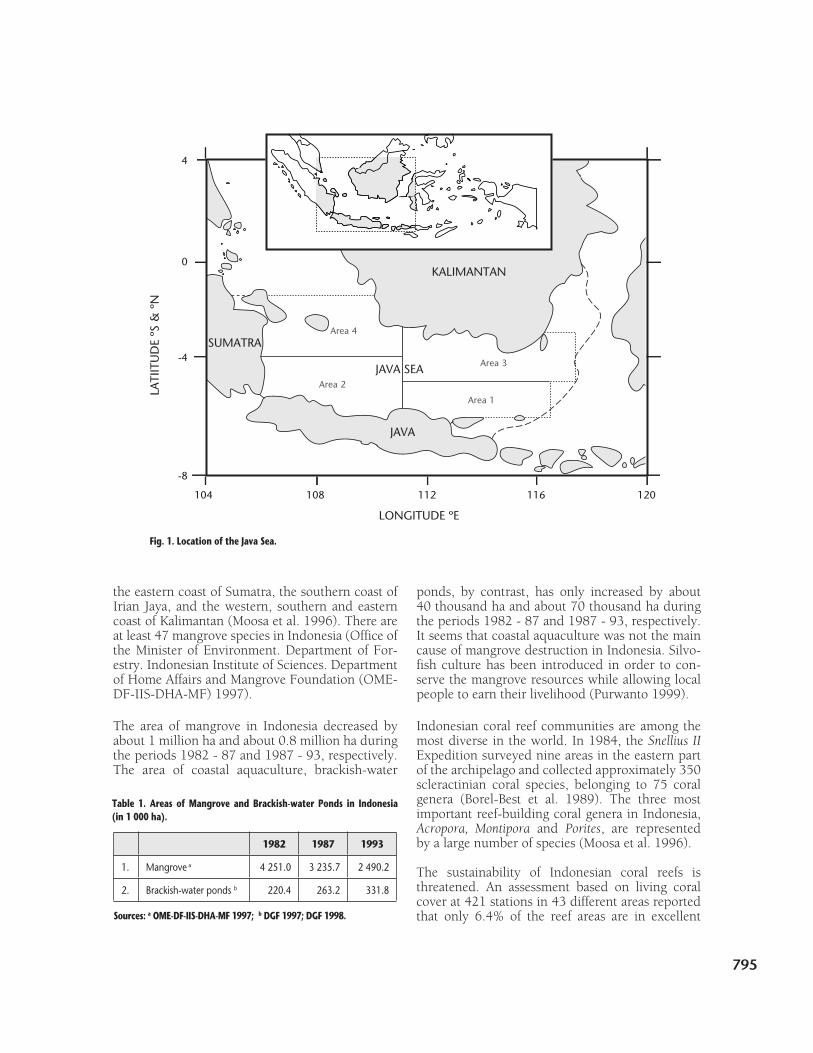
In Indonesia most of the employed population (41.2 %) worked in the agricultural sector in 1997 (CBS 1998). The number of fishers was about 2.1 million (435 000 fishing households) (Fig. 2). The number of fishers and fishing households increased from 1.4 million persons and 356 000 households in 1988 Directorate General of Fisher-ies (DGF 1999a). The rates of increase of the num-ber of fishers and fishing households were about 4.4 % year-1 and 2.30 % year-1, respectively, during 1988 - 97.
The fishers can be categorised as full-time fishers, part-time fishers mainly engaged in fishing activities, and part-time fishers mainly engaged in non-fishing activities. The proportion of the population employed as full-time fishers increased from 49.5% in 1988 to 50.9% in 1997. Among part-time fish-ers, those mainly engaged in fishing and those mainly engaged in non-fishing activities in 1988 accounted for 37.1% and 13.5% of the total number of fishers, respectively. In 1997, part-time fishers mainly engaged in fishing activities and thosemainly engaged in non-fishing activities represented 34.3% and 14.8% of the total number of fishers, respectively.
796 WorldFish Center 797
Table 3. Mean stock density (t·km-2) of demersal fish in the Java Sea by area and depth using data from trawl surveys by the R/V Mutiara 4 from November 1974 to July 1976 estimated by the swept area method.
Depth range (m) Area 1 (East Java) Area 2 (West Java)Area 3
(West Kalimantan)Area 4
(Central Kalimantan)
10 - 19 3.0 0.8 2.1 4.8
20 - 29 2.5 2.7 2.4 4.3
30 - 39 1.9 2.4 2.5 2.1
40 - 49 3.2 2.2 2.2 1.4
50 - 59 5.2 1.9 1.6 –
60 - 69 3.4 1.9 1.5 –
70+ 1.5 1.5 – –
Source: Pauly et al. (1996).
2000
1500
1000
500
0
NU
MBE
R O
F FI
SHER
S (1
000
PEO
PLE)
1988 1990 1992 1994 1996
YEAR
400
300
200
100
0NU
MBE
R O
F H
OU
SEH
OLD
S (1
000
PEO
PLE)
1988 1990 1992 1994 1996
YEAR
a
TotalFull TimePart Time (Major)Part Time (Minor)
Without boatNon powered boatOuboard engine boatInboard engine boatTotal
Table 4. Biomass (x103 t) of demersal fish in the Java Sea by area and depth during the period from November 1974 to July 1976.
Depth range (m)Area 1
(East Java)Area 2
(West Java)Area 3 (West Kalimantan)
Area 4 (Central Kalimantan) Total
10 - 19 6.2 6.5 37.5 138.6 188.8
20 - 29 14.8 64.0 59.5 124.2 262.4
30 - 39 12.7 34.2 67.7 115.5 230.2
40 - 49 41.7 111.8 61.4 10.1 225.0
50 - 59 85.2 47.3 24.8 – 157.3
60 - 69 142.9 6.8 8.2 – 157.9
70+ 58.6 1.4 – – 60.0
TOTAL 362.2 272.0 259.1 388.4 1 281.7
Fig. 2. Number of fishers and fishing households in Indonesia, 1988 - 96.

798 WorldFish Center 799
Most fishing households in Indonesia are engaged in small scale fishing, using non-powered boats, outboard engine boats or small-sized (≤ 5 gross ton) inboard engine boats. In 1997, 49% of fishing households operated non-powered boats, 22% operated boats with outboard engines and 17% operated boats with inboard engines (DGF 1999a). From 1988 to 1997, households operating boats with outboard engines and those operating boats with inboard engines increased at 5% year-1 and 8% year-1, res-pectively. On the other hand, the number of households without boats and those with non-powered boats increased at lower rates of 0.5% year-1 and 0.8% year-1 respectively, during the same period.
In 1997, there were 54 000 fishing households on the northern coast of Java and 16 000 on the south-ern coast of Kalimantan (DGF 1999a), representing 12.3% and 3.8% of the total fishing households respectively, in Indonesia. Most fishing households (77.8%) on the northern cost of Java operate boats with outboard engines. In contrast, most fishing households (54.1%) on the southern coast of Kali-mantan operate boats with less powerful inboard engines.
Fish is the main source of animal protein in Indo-nesia, accounting for about 60.2% of total animal protein consumption in 1997. However, plant prod-
ucts are still the main protein source Central Board of Statistics (CBS 1998). Average per capita fish con-sumption increased during 1989 - 98 at a rate of 2.41% year-1 and stood at 19.3 kg·capita-1·year-1 in 1998 (Fig. 3).
The gross domestic product (GDP) of Indonesia increased at the rate of 7.1% year-1 during 1993 - 97, but decreased during 1998 - 99 due to the eco-nomic crisis. The GDP of Indonesia in 1998 was 13.2% lower than in 1997. By 1999, the national economy had not yet recovered from the crisis. Meanwhile, the GDP from fisheries increased con-tinuously, even during the economic crisis. The rate of increase during 1993 - 97 was about 5.3% year-1. The GDP from fisheries in 1998 was 4.1% higher than in 1997.
The Government of Indonesia has developed fish-eries infrastructure to support the development of marine fisheries. The infrastructure consists of fishing ports and fish landing places. The optimal service capacity of existing fisheries infrastructure in Indonesia is only about 887 000 t·yr-1. This can only accommodate about 25 % of 1997 marine fisheries production. Most fishing ports and fish landing places are located in the western part of Indonesia, primarily in Java and Sumatera. Total service capacity of the infrastructure in western Indonesia is about 671 000 t·year-1 (i.e. 76 % of the
Fig. 3. Fish Consumption in Indonesia, 1989 - 98.
19
18
17
16
15
3900
3600
3300
3000
2700
PER
CA
PITA
C
ON
SUM
PTIO
N (
kg·y
ear-1
)
TOTA
L C
ON
SUM
PTIO
N
('000
t)
YEAR1988 1990 1992 1994 1996 1998
Per capita consumption Total consumption

798 WorldFish Center 799
total service capacity country-wide). Infrastructure in western Indonesia can only accommodate 28.4% of marine fishery production. The largest fishing ports of Indonesia are located in Pekalongan and Jakarta on the northern coast of Java.
Institutional and Legal Background
All laws and regulations dealing with fisheries have their roots in the 1945 Constitution, in particular Article 33, Sub-Article 3, which provides the legal basis for State control over Indonesia’s land and waters and the natural resources therein. There are two main laws currently in force dealing with fishery-related activities - Act No. 5 of 1983 and Act No. 9 of 1985. Act No. 5 of 1983 deals with the Indone-sian Exclusive Economic Zone (IEEZ). Act No. 9 of 1985 deals with all aspects of fisheries, including fishery areas, management, exploitation, develop-ment, delegation of authority to local governments, control and surveillance, and penalties. The gov-ernment has issued a number of regulations to implement Act No. 5 of 1983.
Laws and regulations on marine fisheries before the 1980s focused mostly on coastal and small scale fisheries (Bailey 1987). Since then, concern for small scale fisheries has remained but the coverage of policies has extended to include fisheries in the IEEZ. Such policies reflect the commitment of Indonesia to implement the 1982 UNCLOS.
Sustainability and productivity of marine fishery resources are affected not only by fishing pressure but also by environmental quality. Thus, a number of environmental laws also protect fishery resources. An example is Act No.5 of 1990 concerning the conservation of living resources and their eco-systems. Among the regulations made to imple-ment this Act is a regulation to protect endangered species, including some fish species. Despite the economic crisis, the fisheries sector contributes positively to the Indonesian economy (Subagyo 1998; Surono 1998). A development pro-gram called PROTEKAN 2003 (Program Peningka-tan Ekspor Hasil PeriKANan 1999 - 2003) seeks to further develop the fisheries sector to assist in the recovery of the Indonesian economy (DGF 1999b). The main objective of the program is to boost the export of fisheries commodities to increase foreign exchange earnings. Other objectives of the program are to increase fishers’ and farmers’ incomes, to provide new employment opportunities and to
increase domestic fish consumption. This program is currently being revised to meet current economic conditions.
The program also seeks to increase aquaculture production and utilization of under-exploited fish stocks. This will require the problems in marine fisheries and aquaculture to be addressed. In marine fisheries, problems include: the lack of infrastructure especially in eastern Indonesia, inef-fective surveillance, and the predominance of artisanal fisheries characterized by limited capital and technical capabilities. The problems in aqua-culture include: shrimp disease outbreaks and inadequate irrigation systems. Thus, capture fisher-ies and aquaculture are to be developed and sup-ported via product quality improvement, product diversification, market development, infrastructure development and improvement of the quality of human resources engaged in fisheries. Hazards Analysis and Critical Control Point (HACCP) regu-lations will be applied to increase the quality of fishery products. Also, the Code of Conduct for Responsible Fisheries Food and Agriculture Organi-sation (FAO 1995) will be adopted to guarantee sustainability of the resources.
Among under-exploited stocks targeted for in-creased utilization are tuna, pelagic species (includ-ing small pelagics) and demersal species (inclu-ding shrimps). Increasing productivity and the number of vessels will do increase this utilization. Development of capture fisheries is expected to contribute about one-fourth of targeted foreign exchange earnings. Aquaculture development is expected to contribute the remainder. Aquaculture will be developed through (1) intensification of under-utilised aquaculture areas, and (2) extension of aquaculture areas into potential areas outside Java Island. The main cultured species will be shrimps, which are expected to contribute about two-thirds of targeted foreign exchange earnings. Other species to be cultivated include seabass, grouper, pearl oyster and seaweed.
Management of fishery resources in Indonesia involves a number of activities, including: stock assessment, establishment of total allowable catch, control of fishing effort, surveillance and law enforcement, monitoring of fishery resources utili-sation, and protection and rehabilitation of the aquatic environment. Stock assessment is conducted to determine the distribution and abundance of fish stocks as well as the level of exploitation com-
800 WorldFish Center 801
pared to the MSY. If a stock is under-exploited, the possibility of further exploitation is investigated. The Government establishes total allowable catch (TAC) on the basis of biological parameters. Cur-rently, the TAC for most stocks is 80% of MSY and is used as a target reference point. Ideally, the TAC should be established using also the socioeco-nomic characteristics of fisheries.
To control fishing effort, the Government imposes a licensing system and zoning of fishing activities. Fishing boats of 5 GT or larger require licenses to fish. Surveillance and law enforcement are carried out to ensure compliance with fisheries laws and regulations, and to prevent unauthorised fishing in Indonesian waters. The fisheries management system needs a number of improvements. In par-ticular, monitoring, control and surveillance (MCS) should be integrated and strengthened to ensure effective management. Priority should be placed on strengthening the surveillance component, which is currently the weakest component of the MCS system. In this regard, the Government has con-ducted training and workshops for fishery officers and representatives from the Police and the Navy.
National institutions directly involved in the admi-nistration, development and management of fisher-ies in Indonesia are the Directorate General of Fisheries (DGF), the Directorate General of Marine Surveillance and Protection (DGSP) and the Cen-tral Research Institute for Fisheries (CRIFI). At the local level, the Provincial and the District Fisheries Services regulate fisheries.
The functions of DGF include fishery resources monitoring, evaluation, allocation and manage-ment through the issuance of licenses and the formulation of regulations. DGF issues fishing licenses for fishing vessels greater than 30 GT, using engines of more than 90 HP, and those ope-rating in the IEEZ. It has five developmental cen-tres that serve as technical implementation units in various fields, including fishing techniques, and fish quality and processing. In assessing the state of stocks in Indonesian waters, DGF receives support from the National Commission on Stock Assess-ment of Marine Fisheries Resources, which is composed of scientists from CRIFI / Research Insti-tute for Marine Fisheries (RIMF), Bogor Agriculture University, the National Institute for Aeronautics and Space, and the Agency for the Assessment and Application of Technology.
The DGSP is in charge of marine protected area management, marine biodiversity preservation, living marine resources rehabilitation, management of living marine resource conservation areas, and surveillance of ecosystem utilisation. CRIFI sup-plies biophysical information on fishery resources to implementing agencies, as well as to fishers and the fisheries industry.
The Provincial and District Fisheries Services are responsible for administration of local fisheries, including implementation of fishery resources management under the technical guidance of DGF. The Provincial Fisheries Services issue licenses for local fishing vessels of 30 GT or less, using engines of not more than 90 HP. The main functions of the District Fisheries Services are to disseminate infor-mation and technology, provide technical back-stopping through extension, and collect statistics.
To manage fishery resources that are shared by fishers from different provinces, DGF created man-agement zones and initiated establishment of the Coordinating Forum for Management and Utilisa-tion of Fishery Resources (Forum Koordinasi Penge-lolaan Pemanfaatan Sumberdaya Ikan - FKPPS) for each management zone. The Forum consists of representatives from DGF, Provincial Governments/Fisheries Services, and other government agencies. The main tasks of each Forum include the alloca-tion of fishing effort, coordination in issuance of fishing licenses, monitoring of utilisation of fish stocks, implementation of surveillance, and evalua-tion of management measures.
Pursuant to the Autonomy Act No. 22 of 1999, responsibilities of government agencies are being redefined and significant changes are expected.
Coastal Capture FisheriesCatch and Effort
The total number of marine fishing boats in Indo-nesia was about 402 000 units in 1997, of which 94% were artisanal/small scale units. The small scale fleet consists of non-powered boats, out-board engine boats and in-board engine boats of less than 5 GT. Boats in these categories are allowed to operate in coastal areas. The proportion of non-powered boats has decreased from 66% in 1988 to 57% in 1997. Fishing boats operating in the Java Sea accounted for about 16% of the total number in Indonesia in 1997. Fishers from the northern coast
800 WorldFish Center 801
1988 1990 1992 1994 1996
YEAR
4000
3500
3000
2500
2000
1500
PRO
DU
CTI
ON
('0
00 t
)
PRO
DU
CTI
ON
('0
00 t
)1400
1200
1000
800
600
400
200
0
DemersalSmall pelagicLarge pelagic
CrustaceansMolluscs
1988 1990 1992 1994 1996
YEAR
(a) (b)
of Java operated about 47 000 fishing boats while fishers from the western and southern coasts of Kalimantan operated 17 000 units.
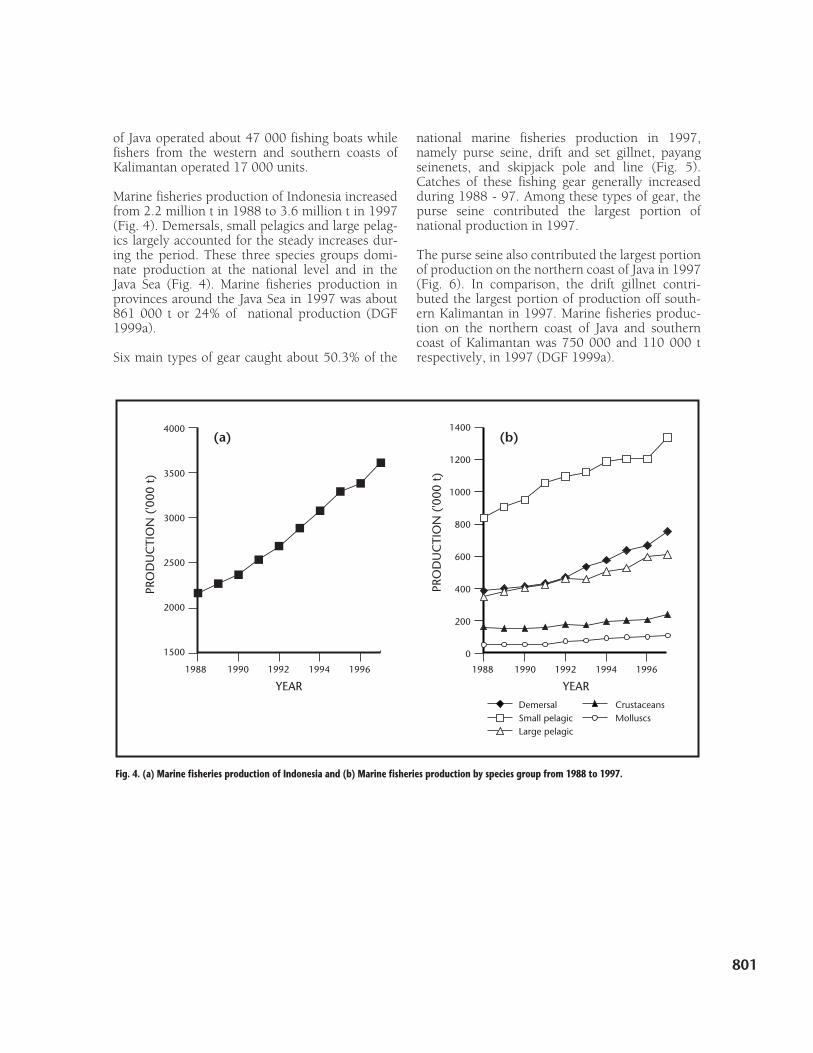
Marine fisheries production of Indonesia increased from 2.2 million t in 1988 to 3.6 million t in 1997 (Fig. 4). Demersals, small pelagics and large pelag-ics largely accounted for the steady increases dur-ing the period. These three species groups domi-nate production at the national level and in the Java Sea (Fig. 4). Marine fisheries production in provinces around the Java Sea in 1997 was about 861 000 t or 24% of national production (DGF 1999a). Six main types of gear caught about 50.3% of the
Fig. 4. (a) Marine fisheries production of Indonesia and (b) Marine fisheries production by species group from 1988 to 1997.
national marine fisheries production in 1997, namely purse seine, drift and set gillnet, payang seinenets, and skipjack pole and line (Fig. 5). Catches of these fishing gear generally increased during 1988 - 97. Among these types of gear, the purse seine contributed the largest portion of national production in 1997.
The purse seine also contributed the largest portion of production on the northern coast of Java in 1997 (Fig. 6). In comparison, the drift gillnet contri-buted the largest portion of production off south-ern Kalimantan in 1997. Marine fisheries produc-tion on the northern coast of Java and southern coast of Kalimantan was 750 000 and 110 000 t respectively, in 1997 (DGF 1999a).

802 WorldFish Center 803
PRO
DU
CTI
ON
('0
00 t
)700
600
500
400
300
200
100
0
1988 1990 1992 1994 1996
YEAR
Purse Seine17.6%
Drift Gillnets11.0%
Payang 8.2%(includes Lampara)
Boat/RaftNets 5.4%
Set Gillnets5.0%
Skipjack Poleand Line 3.1%
Other Gears 49.7%(more than 22 gear types)
Purse seine
Drift gillnets
Payang (includes Lampara)
Boat/Raft nets
Set gillnets
Skipjack pole and line
Fig. 5. (a) Production by six main types of fishing gear used in Indonesia (1988 - 97) and (b) Contribution of the six main fishing gears in Indonesia to 1997 production.
NORTHERN COAST OF JAVA
Drift Gillnets9.0%
Payang 15.4%(includes Lampara)
Shrimp Gillnets3.4%
Danish Seine 3.9%
Trammel Net 3.7%
SOUTHERN COAST OF KALIMANTAN
Drift Gillnets24.7%
Purse Seine11.1%
Trammel Net8.4%
Scoop Nets7.7%
Set Gillnets7.0%
Payang 5.5%(includes Lampara)
Other Gears 35.6%Purse Seine37.9%
Other Gears 26.7%
Fig. 6. Production share of six main fishing gears in the northern coast of Java and in the southern coast of Kalimantan in 1997.
(a) (b)

802 WorldFish Center 803
Fig. 7. Disposition of marine fisheries production in Indonesia.
Economics of Coastal Capture Fisheries
Most catches in Indonesia are sold fresh. Typically, the quantity of dried or salted fish is about half the quantity sold fresh. During 1997, however, an unusually large proportion (77.6%) of the produc-tion was sold fresh (Fig. 7). In the Java Sea, most catches were also sold fresh in 1997 (Fig. 8). Fresh fish accounts for a larger proportion of catches sold in the northern coast of Java than in the southern coast of Kalimantan because frequent over-supply of fish in the latter area makes drying/salting a popular practice.
Fishing ports and landing places in the eastern part of Central Java supply fish to local markets and markets in East Java. On the other hand, ports and landings in the western part of Central Java supply towns in the area as well as towns in West Java, Jakarta and Sumatra. Fish channelled through the
QU
AN
TITY
('0
00 t
)
3000
2500
2000
1500
1000
500
0
1988 1990 1992 1994 1996
YEAR
Dried 11.9%
Frozen 6.9%
Boiled 1.2%
Others 2.4%
Solid Fresh 77.6%
Sold fresh
Dried/salted
Frozen
Boiled
Others
1997
ports and landing places in the northern coast of Java may be exported to neighbouring countries or marketed locally in Java and other islands (Clucas and Basmal 1995).
Table 5 presents costs and returns of five demersal fishing gear used in the Java Sea based on recalcula-tion of data given by (Priyono 1999). The large Danish seine, a modification of traditional fishing gear called dogol and cantrang, is the most econo-mically viable fishing gear.
Table 6 presents the costs and returns of three size categories of purse seiners in the Java Sea based on data of (Soegiarto et al. 1997) and adjusted using the consumer price index and current fish prices. The figures suggest that purse seining is economi-cally profitable and that large boats are economi-cally more efficient than small ones.

804 WorldFish Center 805
Small purse seiner Medium purse seiner Large Purse seiner
Tonnage of boat (GT) 15 54 114
Engine power (HP) 23 X 2 80 232
Fishing days per year 155 164 149
Fishing power index 4.4 7.0 1.0
Running cost (Rp. million/yr) 121.40 218.76 50.53
Return (Rp. million/yr) 161.20 299.53 62.94
Margin (Rp. million/yr) 39.80 80.77 12.41
Table 6. Costs and returns of purse seiners operating in the Java Sea1.
Table 5. Costs and returns of five types of demersal fishing gear used in the Java Sea1.
Arad
Danish seine
GillnetBottomlonglineSmall Large
Tonnage of boat (GT) 23 23 25 21
Fishing power index 1.03 0.38 1.00 0.75 0.51
Return (Rp. million/yr) 82.62 30.21 80.43 88.55 101.96
Cost (Rp. million/yr) 65.46 26.33 60.02 72.29 81.76
Margin (Rp. million/yr) 17.16 3.88 20.42 16.26 20.20
Note: 1 Recalculation of data used by (Priyono 1999). 1 US$ = Rp10,000 (1999)
Note: 1 Based on data of (Soegiarto et al. 1997). 1 US$ = Rp10,000 (1999)
NORTHERN COAST OF JAVA
Boiled 2.6%
Dried 7.7%Others 1.1%
SOUTHERN COAST OF KALIMANTAN
Dried 37.5%
Frozen 4.0%
Others 2.6%
Solid Fresh 55.9%Solid Fresh 88.6%
Fig. 8. Disposition of marine fisheries production on the northern coast of Java and the southern coast of Kalimantan in 1997.
804 WorldFish Center 805
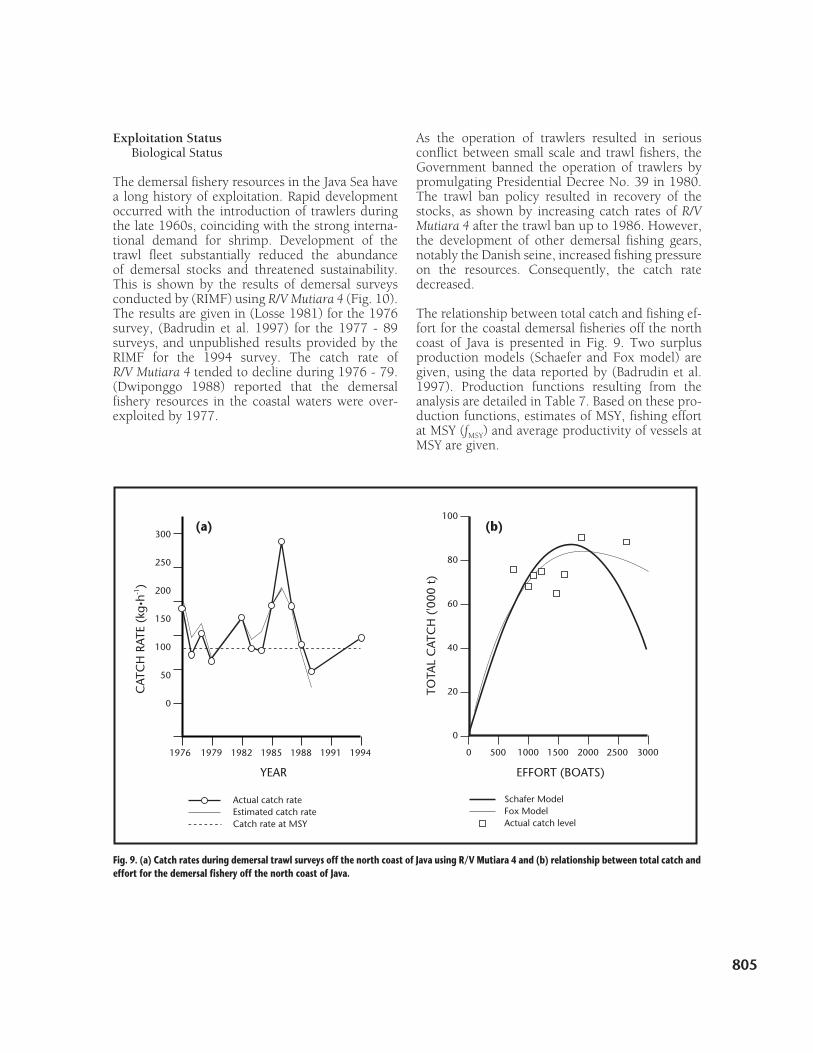
Fig. 9. (a) Catch rates during demersal trawl surveys off the north coast of Java using R/V Mutiara 4 and (b) relationship between total catch and effort for the demersal fishery off the north coast of Java.
300
250
200
150
100
50
0
CAT
CH
RAT
E (k
g·h-1
)
1976 1979 1982 1985 1988 1991 1994
YEAR
100
80
60
40
20
0
TOTA
L C
ATC
H (
'000
t)
0 500 1000 1500 2000 2500 3000
EFFORT (BOATS)
Schafer ModelFox ModelActual catch level
Actual catch rateEstimated catch rateCatch rate at MSY
Exploitation StatusBiological Status
The demersal fishery resources in the Java Sea have a long history of exploitation. Rapid development occurred with the introduction of trawlers during the late 1960s, coinciding with the strong interna-tional demand for shrimp. Development of the trawl fleet substantially reduced the abundance of demersal stocks and threatened sustainability. This is shown by the results of demersal surveys conducted by (RIMF) using R/V Mutiara 4 (Fig. 10). The results are given in (Losse 1981) for the 1976 survey, (Badrudin et al. 1997) for the 1977 - 89 surveys, and unpublished results provided by the RIMF for the 1994 survey. The catch rate of R/V Mutiara 4 tended to decline during 1976 - 79. (Dwiponggo 1988) reported that the demersal fishery resources in the coastal waters were over-exploited by 1977.
As the operation of trawlers resulted in serious conflict between small scale and trawl fishers, the Government banned the operation of trawlers by promulgating Presidential Decree No. 39 in 1980. The trawl ban policy resulted in recovery of the stocks, as shown by increasing catch rates of R/V Mutiara 4 after the trawl ban up to 1986. However, the development of other demersal fishing gears, notably the Danish seine, increased fishing pressure on the resources. Consequently, the catch rate decreased.
The relationship between total catch and fishing ef-fort for the coastal demersal fisheries off the north coast of Java is presented in Fig. 9. Two surplus production models (Schaefer and Fox model) are given, using the data reported by (Badrudin et al. 1997). Production functions resulting from the analysis are detailed in Table 7. Based on these pro-duction functions, estimates of MSY, fishing effort at MSY (fMSY) and average productivity of vessels at MSY are given.
(a) (b)

806 WorldFish Center 807
Table 7. Fishery production functions for the coastal demersal fisheries off the north coast of Java after the trawl ban1.
Model Fishery production function
Maximum sustainable yield
(MSY) (x103t)
Fishing effortat MSY (fMSY)
(units)
Productivity of vessel at MSY
(t·boat-1)
Schaefer h = 100.2 f - 0.029 f2 86.2 1721 50.1
Fox h = f exp (4.76 - 0.00052 f) 82.9 1929 43.0
Note: 1 Analyzed on the basis of the data from (Badrudin et al. 1997); h = quantity of catch (metric tonnes); f = fishing effort; 1 unit of f equal to 1 unit of Danish seiner operated using 23 GT boat. Data on fishing days·year-1 and fishing hours·day-1 of R/V Mutiara 4 from (Dwiponggo 1981) were used in standardizing effort into the number of 23 GT Danish seiners.
Fig. 10. Fishing ground extension for the small pelagic fishery (Source: Potier and Petit 1994).
LATI
TUD
E ºS
and
ºN
KALIMANTAN
106 108 112 116 118
JAVA
SUMATRA
Fishing ground I, during 1973-1982
Fishing ground I-II, during 1983-1985
Fishing ground I-III, after 1985
LONGTITUDE ºE
4
0
-4
-8
806 WorldFish Center 807
Fishing ground Fishery production function1
Maximum sustainable yield (MSY)
(x103t·year-1)
Fishing effortat MSY (fMSY)(x103days)
Productivity of vessel at MSY
(kg·day-1)
I h = 284.7 f - 0.215 E2 94.3 662 142
I - II h = 323.9 f - 0.215 E2 122.0 753 162
I - III h = 368.1 f - 0.215 E2 157.6 856 184
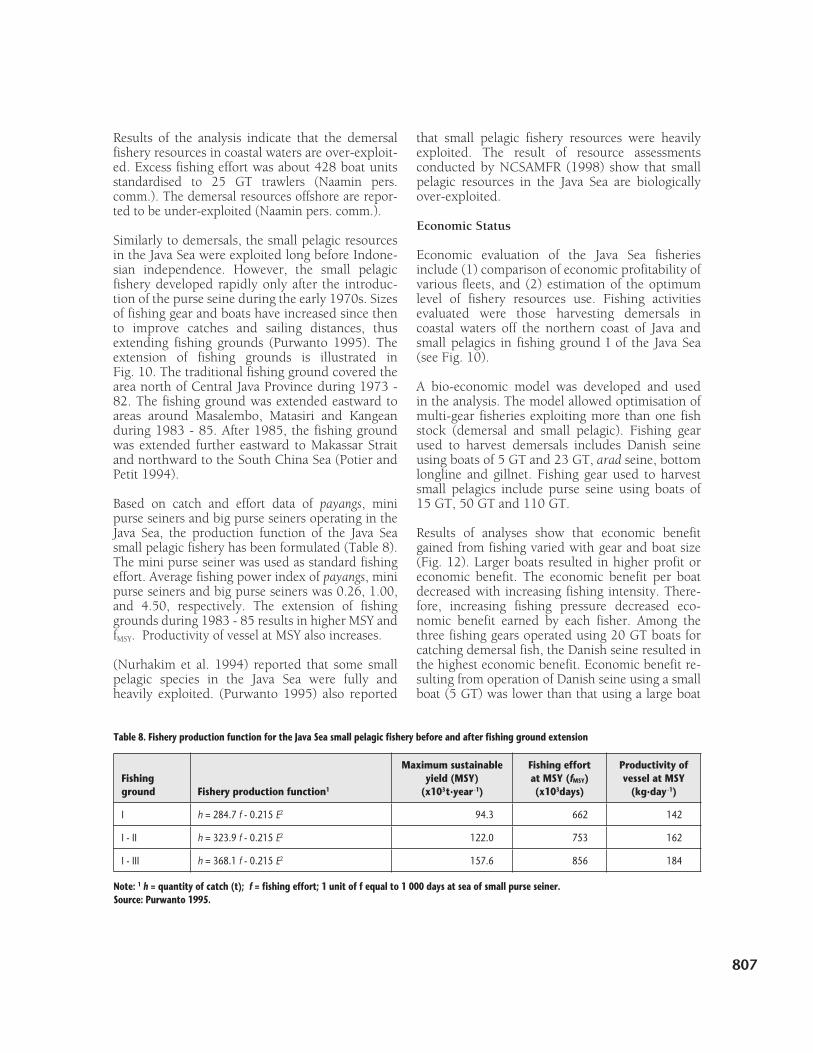
Table 8. Fishery production function for the Java Sea small pelagic fishery before and after fishing ground extension
Note: 1 h = quantity of catch (t); f = fishing effort; 1 unit of f equal to 1 000 days at sea of small purse seiner.Source: Purwanto 1995.
Results of the analysis indicate that the demersal fishery resources in coastal waters are over-exploit-ed. Excess fishing effort was about 428 boat units standardised to 25 GT trawlers (Naamin pers. comm.). The demersal resources offshore are repor-ted to be under-exploited (Naamin pers. comm.).
Similarly to demersals, the small pelagic resources in the Java Sea were exploited long before Indone-sian independence. However, the small pelagic fishery developed rapidly only after the introduc-tion of the purse seine during the early 1970s. Sizes of fishing gear and boats have increased since then to improve catches and sailing distances, thus extending fishing grounds (Purwanto 1995). The extension of fishing grounds is illustrated in Fig. 10. The traditional fishing ground covered the area north of Central Java Province during 1973 - 82. The fishing ground was extended eastward to areas around Masalembo, Matasiri and Kangean during 1983 - 85. After 1985, the fishing ground was extended further eastward to Makassar Strait and northward to the South China Sea (Potier and Petit 1994).
Based on catch and effort data of payangs, mini purse seiners and big purse seiners operating in the Java Sea, the production function of the Java Sea small pelagic fishery has been formulated (Table 8). The mini purse seiner was used as standard fishing effort. Average fishing power index of payangs, mini purse seiners and big purse seiners was 0.26, 1.00, and 4.50, respectively. The extension of fishing grounds during 1983 - 85 results in higher MSY and fMSY. Productivity of vessel at MSY also increases.
(Nurhakim et al. 1994) reported that some small pelagic species in the Java Sea were fully and heavily exploited. (Purwanto 1995) also reported
that small pelagic fishery resources were heavily exploited. The result of resource assessments conducted by NCSAMFR (1998) show that small pelagic resources in the Java Sea are biologically over-exploited.
Economic Status
Economic evaluation of the Java Sea fisheries include (1) comparison of economic profitability of various fleets, and (2) estimation of the optimum level of fishery resources use. Fishing activities evaluated were those harvesting demersals in coastal waters off the northern coast of Java and small pelagics in fishing ground I of the Java Sea (see Fig. 10).
A bio-economic model was developed and used in the analysis. The model allowed optimisation of multi-gear fisheries exploiting more than one fish stock (demersal and small pelagic). Fishing gear used to harvest demersals includes Danish seine using boats of 5 GT and 23 GT, arad seine, bottom longline and gillnet. Fishing gear used to harvest small pelagics include purse seine using boats of 15 GT, 50 GT and 110 GT.
Results of analyses show that economic benefit gained from fishing varied with gear and boat size (Fig. 12). Larger boats resulted in higher profit or economic benefit. The economic benefit per boat decreased with increasing fishing intensity. There-fore, increasing fishing pressure decreased eco-nomic benefit earned by each fisher. Among the three fishing gears operated using 20 GT boats for catching demersal fish, the Danish seine resulted in the highest economic benefit. Economic benefit re-sulting from operation of Danish seine using a small boat (5 GT) was lower than that using a large boat

808 WorldFish Center 809
Fig. 11. (a) Profit gained from catching demersals in the Java Sea using different boat sizes and fishing gear. (b) Profit gained from catching small pelagics in the Java Sea using different boat sizes (Purwanto, 1995).
(23 GT). Similarly, economic benefit resulting from operation of small scale purse seiners was also lower than that of large scale purse seiners. This suggests that under free competition (with no restrictions on increasing fishing effort), small scale fishers are the first to lose and to suffer from poverty.
Table 9 summarizes results of the bio-economic optimisation approach for multi-gear fisheries. The analysis was carried out simultaneously for the demersal and the small pelagic fisheries using a mathematical programming model. The analysis indicates the optimum level of fishing effort, appropriate fishing gear, and optimum size and number of fishing boats resulting in optimum economic benefit to fishers.
There were five types of fishing gear in the demersal fishery evaluated, namely, Danish seines operated by 5 and 23 GT boats, the arad seine operated by 23 GT boats, the gillnet operated by 25 GT boats and the bottom long line operated by 21 GT boats. Among these fishing gear, the Danish seine operated by 23 GT boats was found to be the most econo-
mical. The optimum number of 23 GT-Danish seiners that should be operated in the northern coastal waters of Java is 1 297 units (Table 9; Fig. 13). Optimum economic benefits that would be gained by demersal fishers would be about Rp117 billion per year. Meanwhile, the number of fishers that should be engaged in the coastal demersal fishery in the Java Sea is about 9 000 people. The demersal fishery in the northern coastal waters of Java would land about 81 200 t of fish.
Three small pelagic fishing fleets (15 GT purse seiner, 50 GT purse seiner and 110 GT purse seiner) were evaluated. Among these three fleets, the 50 GT purse seiner was found to be the most eco-nomical for fishing ground I (see Fig. 10). The op-timum number of this fleet that should operate is 648 units (Table 9 and Fig. 13). Optimum eco-nomic benefits that would be gained by small pelagic fishers is about Rp53 billion per year. Meanwhile, the number of fishers engaged in the small pelagic fishery of Java Sea should be about 22 thousand people. This fishery would land about 83 800 t of small pelagic fishes.
100 500 900 1300 1700 2100 2500
EFFORT (BOATS)
160
120
80
40
0
-40
PRO
FIT
PER
BOAT
(RP
. MIL
LIO
N)
ƒMSY
Danish seiner 5 GTDanish seiner 23 GTGillnetter 25 GTBottom longliner 21 GT
100 300 500 700 900 1100
EFFORT (1000 FISHING DAYS)
120
90
60
30
0
-30
PRO
FIT
PER
BOAT
(RP
. MIL
LIO
N)
ƒMSY
Purse-seiner 5 GTPurse-seiner 30 GTPurse-seiner 50 GTPurse-seiner 100 GT
(a) (b)

808 WorldFish Center 809
Table 9. Estimate of optimum effort, total economic benefits and number of fishers for the coastal demersal and small pelagic fisheries in the Java Sea.
Note: 1 DS-23 = 23 GT Danish seiner; PS-50 = 50 GT purse seiner. 2 fMEY = effort resulting in MEY, that is when optimum economic benefit is achieved; optimum effort of demersal fishery was standardised in number of DS-23 boats, while optimum effort of small pelagic fishery was standardised in number of days at sea of small purse-seiners.
Fig. 12. Total return, cost and economic benefit (profit) from (a) Coastal demersal fishery, and (b) Small pelagic fishery in the Java Sea . (fMEY = level of effort resulting in optimum economic benefit; fMSY = level of effort resulting in maximum sustainable yield; fOA = level of effort when total returns equal total costs).
0 200 400 600 800
EFFORT (BOATS)
250
200
150
100
50
0
-50
PRO
FIT
PER
BOAT
(RP
. MIL
LIO
N )
0 500 1000 1500 2000 2500
EFFORT (1000 FISHING DAYS)
120
90
60
30
0
-30
PRO
FIT
PER
BOAT
(RP
. BIL
LIO
N )
TRTCProfit
TRTCProfit
EMEY EMSY EOA EMEY EMSY EOA
FisherySelected
fleet1
Optimum effort(fMEY)2
OptimumNumberof boats
Maximum economic
yield (MEY)(103 t·year-1)
Total cost of fishing
Totalreturn
Optimum economic benefit Total
number of fishers(Rp. Billion·year-1)
DemersalSmall pelagic
DS - 23PS - 50
1 297442 000
1 297648
81.283.8
7852
195105
11753
10 37322 045
TOTAL 1 945 165.0 130 300 170 32 418
(a) (b)
810 WorldFish Center 811
Fishery resources in the Java Sea are basically com-mon property resources with no single user having exclusive rights to the resources or the right to pre-vent others from sharing in their exploitation. Con-sequently, commercial fishers are in competition with one another and are motivated to get a larger portion of the resource for themselves. Under this condition of open access, commercial fishers tend to increase their fishing effort, i.e. the capacity to catch fish, as long as they gain economic profit. The only restriction for fishers against increasing their fishing effort is the level of economic profit. In this open access fishery, economic profit is dissipated. Therefore, fishing effort should be controlled in order to achieve optimum economic benefits. The Government of Indonesia has regulated fishing in the Java Sea with the objectives of sustaining fishery resources and optimizing sustainable yield. However, the Java Sea fishery is in fact an open access fishery since fisheries surveillance and law enforcement is ineffective.
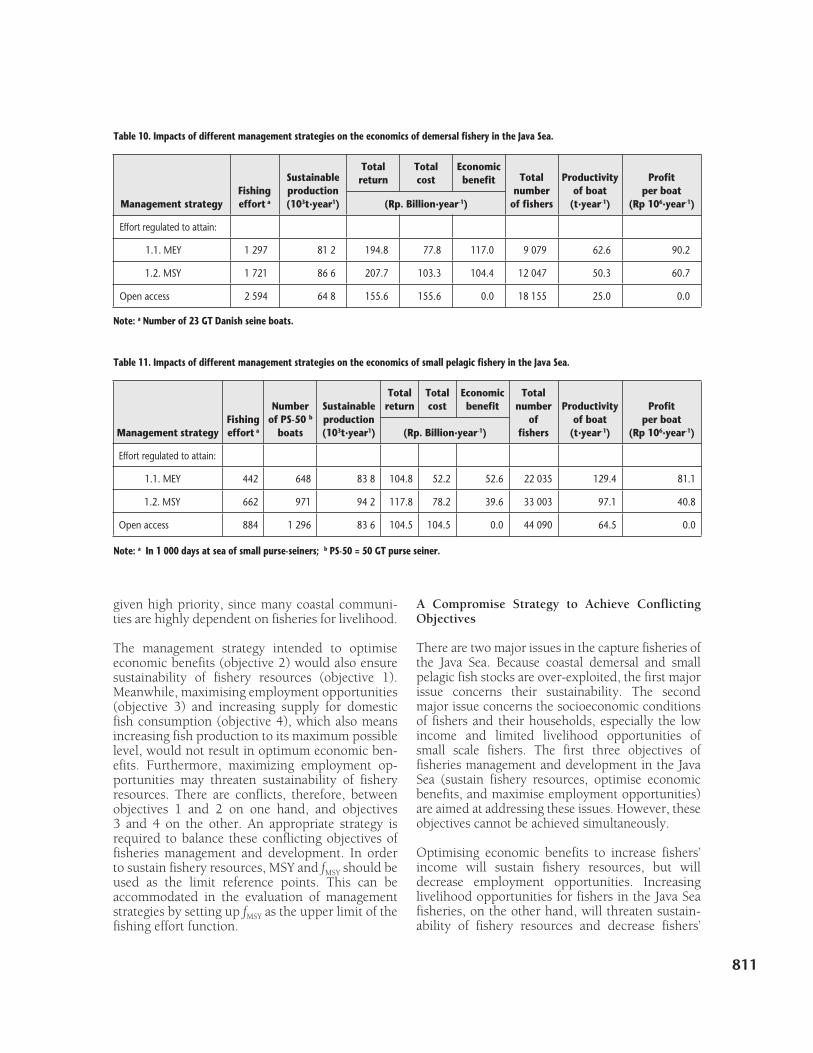
There are different economic consequences of using MSY and MEY as target reference points in management, as presented in Tables 10 and 11. These tables also show the economic consequence of open access fisheries. The use of MEY as target reference point in the management of the Java Sea fisheries results in optimum economic benefits. However, the quantity of fish harvested at this reference point is lower than that obtained at MSY. Moreover, the number of fishers when the MEY is the reference point is lower than at MSY or open access. The use of the MSY as target reference point would result in maximum quantity of fish harvested. However, the economic benefit gained at this reference point is lower than at MEY. The number of fishers when the MSY is the reference point is higher than at MEY but lower than at open access. On the other hand, the open access fishery results in the maximum number of people engaged in the fishery. However, the economic benefit and sus-tainable yield resulting from open access are lower than that at MEY or MSY.
The open access fishery and the regulated fishery with MSY as target reference point result in dissipa-tion of economic benefits. Therefore, fishery re-sources exploited with no restriction on the level of effort or exploited beyond fMEY are uneconomical or economically over-fished. As the coastal demersal fishery and small pelagic fishery in the Java Sea are biologically over-fished (NCSAMFR 1998), it fol-lows that these resources are also economically over-fished.
Management Issues and OpportunitiesManagement Objectives
Fish stocks are renewable resources with the capa-bility to recover when harvested, as long as fishing intensity does not exceed carrying capacity. To sustain fishery resources, fishing effort should be controlled at the level equal to or lower than the level that results in maximum sustainable yield (fMSY). However, fishing is basically an economic activity. Commercial fishers catch fish in order to earn economic profit. If there is open access, commercial fishers will tend to increase fishing effort as long as they still gain economic profit. The restriction for fishers to increase their fishing effort under an open access condition is the level of economic profit, which would be dissipated when fishing effort is continuously increased. Optimum economic benefit can only be gained by controlling fishing effort at the economically optimum level. Restricting fishing effort at the level resulting in optimum economic benefit (fMEY) would also ensure sustainability of fishery resources as fMEY is less than fMSY.
The Java Sea Fishery is de facto open access since there are no real restrictions on fishing effort. This has resulted in over-exploitation of fishery resources and dissipation of economic rent, which in turn has resulted in poverty of small scale fishers. The main goal of coastal fisheries management, therefore, should be the alleviation of small scale fishers’ pov-erty (see Annex 1). To achieve this goal, fisheries management in the Java Sea should be aimed at (1) sustaining fishery resources, and (2) increasing fishers’ incomes by optimising economic benefits from fishery resources utilisation.
The objectives of the fisheries development in Indonesia are to (1) promote economic develop-ment, (2) alleviate poverty by increasing fishers’ incomes, (3) provide new employment opportuni-ties and (4) increase domestic fish consumption (DGF 1999b). Considering these development objectives, the objectives of the Java Sea fisheries management and development should be to (1) sustain fishery resources, (2) optimize economic benefits, (3) maximize employment opportunities and (4) increase supply for domestic fish consump-tion. Fisheries should be managed in order to sustain fishery resources while optimising fishers’ incomes, employment opportunity and fisheries’ contribution to the national economy. When opti-mising incomes, however, poverty alleviation and creation of employment opportunities should be
810 WorldFish Center 811
Table 10. Impacts of different management strategies on the economics of demersal fishery in the Java Sea.
Management strategyFishing effort a
Sustainable production (103t·year1)
Totalreturn
Totalcost
Economic benefit Total
number of fishers
Productivity of boat
(t·year-1)
Profitper boat
(Rp 106·year-1)(Rp. Billion·year-1)
Effort regulated to attain:
1.1. MEY 1 297 81 2 194.8 77.8 117.0 9 079 62.6 90.2
1.2. MSY 1 721 86 6 207.7 103.3 104.4 12 047 50.3 60.7
Open access 2 594 64 8 155.6 155.6 0.0 18 155 25.0 0.0
Note: a Number of 23 GT Danish seine boats.
Table 11. Impacts of different management strategies on the economics of small pelagic fishery in the Java Sea.
Management strategyFishing effort a
Number of PS-50 b
boats
Sustainable production (103t·year1)
Totalreturn
Totalcost
Economic benefit
Total number
of fishers
Productivity of boat
(t·year-1)
Profitper boat
(Rp 106·year-1)(Rp. Billion·year-1)
Effort regulated to attain:
1.1. MEY 442 648 83 8 104.8 52.2 52.6 22 035 129.4 81.1
1.2. MSY 662 971 94 2 117.8 78.2 39.6 33 003 97.1 40.8
Open access 884 1 296 83 6 104.5 104.5 0.0 44 090 64.5 0.0
Note: a In 1 000 days at sea of small purse-seiners; b PS-50 = 50 GT purse seiner.
given high priority, since many coastal communi-ties are highly dependent on fisheries for livelihood.
The management strategy intended to optimise economic benefits (objective 2) would also ensure sustainability of fishery resources (objective 1). Meanwhile, maximising employment opportunities (objective 3) and increasing supply for domestic fish consumption (objective 4), which also means increasing fish production to its maximum possible level, would not result in optimum economic ben-efits. Furthermore, maximizing employment op-portunities may threaten sustainability of fishery resources. There are conflicts, therefore, between objectives 1 and 2 on one hand, and objectives 3 and 4 on the other. An appropriate strategy is required to balance these conflicting objectives of fisheries management and development. In order to sustain fishery resources, MSY and fMSY should be used as the limit reference points. This can be accommodated in the evaluation of management strategies by setting up fMSY as the upper limit of the fishing effort function.
A Compromise Strategy to Achieve ConflictingObjectives
There are two major issues in the capture fisheries of the Java Sea. Because coastal demersal and small pelagic fish stocks are over-exploited, the first major issue concerns their sustainability. The second major issue concerns the socioeconomic conditions of fishers and their households, especially the low income and limited livelihood opportunities of small scale fishers. The first three objectives of fisheries management and development in the Java Sea (sustain fishery resources, optimise economic benefits, and maximise employment opportunities) are aimed at addressing these issues. However, these objectives cannot be achieved simultaneously.
Optimising economic benefits to increase fishers’ income will sustain fishery resources, but will decrease employment opportunities. Increasing livelihood opportunities for fishers in the Java Sea fisheries, on the other hand, will threaten sustain-ability of fishery resources and decrease fishers’

812 WorldFish Center 813
Fig. 13. Trade-off curve for employment opportunity (number of fishers) and total income gained by fishers in the Java Sea fisheries.
FISH
ERS'
INC
OM
E (R
P. B
ILLI
ON
/YR)
25 35 45 55 65 75 85
NUMBER OF FISHERS (1000 PEOPLE)
A
K
C
B
180
160
140
120
100
income. Fig. 13 illustrates the trade-off between the objectives of optimising economic benefits from utilization of fishery resources and increasing employment opportunities constrained by fMSY as the limit reference point. The levels of employment and total fishers’ income at point A result from income optimisation. On the other hand, point B represents maximising employment opportunities constrained by fMSY. Non-feasibility of simultane-ously achieving optimum income and optimum employment can be shown from the position of the coordinate of these ideal solutions, that is point C in Fig. 13, which is outside the frontier of the income-employment trade-off.
Optimisation of economic benefits results in an increase in fishers’ income by 48% of its optimum
level, but decreases the number of fishers by 61%. The best compromise solution for the conflict between the two objectives is represented by point K in Fig. 13. There are a number of consequences of achieving the best compromise solution in Table 12. If priority is given to increasing domestic fish consumption (objective 4) and maximising em-ployment opportunities (objective 3) with fMSY as an upper limit of fishing effort, the best compromise solution should be achieved by reducing the num-ber of small boats used for the demersal fishery. This is relevant as demersal fishery resources in inshore waters are over-exploited. Similarly, the number of large boats (50 GT) used for small-pelagic fishery should also be reduced to achieve the best compromise solution.

812 WorldFish Center 813
Table 12. Economic benefits, number of fishers, fleet structure and fish production at different efficiency points.
EfficiencyPoints1
Economicbenefits
(Rp. Billion ·year-1)
Number of
fishers(people)
Fleet structureFish production
(1 000 t)Demersal Pelagic
Boat size (GT)
Number of
boatsFishing gear2)
Boat size (GT)
Number of
boatsFishing
gear Demersal Pelagic Total
A 169.6 32 418 23 1 297 D 50 648 PS 81.2 83.8 165.0
K 155.4 69 611 5 505 D 15 2 221 PS 83.4 91.4 174.8
23 1 207 D 50 317 PS
B 114.5 82 504 5 2 263 D 15 2 221 PS 86.2 94.3 180.8
25 1 148 GN 50 485 PS
Note: 1 K is the best compromise solution. 2 D, GN and PS are Danish seine, gillnet and purse seine, respectively.
Strategic Factors of Fisheries Management and Develo t
A number of strategic factors can affect achieve-ment of fisheries management and development objectives mentioned above. These factors can be divided into two: (1) factors which tend to restrict achievement of the objectives, (restricting factors), and (2) factors which tend to promote achievement of the objectives, (promoting factors). Further-more, these factors can be ranked according to the strength with which they restrict or promote achievement of the objectives. The author and other fisheries management specialists conducted an ex-ercise to identify and evaluate these strategic factors (Annex 2). The results of the exercise are summa-rized in Table 13.
There are three restricting factors and three pro-moting factors that should be given highest priority in formulating a program to sustain fishery resources in the Java Sea. The three restricting fac-tors are (1) inappropriate pattern of fishery re-source use, (2) lack of MCS and law enforcement, and (3) destruction of habitats. On the other hand, the three most important promoting factors are, (1) under-exploitation of offshore demersal fish resources, (2) availability of fishers’ associations, and (3) high dependency of coastal communities on fishery resources.
The three restricting factors that should receive highest attention to increase incomes of the Java Sea fishers are (1) small scale fleet domination,
(2) lack of enterprise managerial skill, and (3) over-exploitation of small pelagic fish stock. The three promoting factors that should be given highest attention are (1) availability of fishing cooperatives, (2) availability of potential area of business for fishing households, and (3) under-exploitation of offshore demersal fish resources. Proposed Management and Development Program
The key features of the proposed “Integrated Program of Fisheries Management and Develop-ment for the Java Sea”, which was developed as part of this review are given in Annex 3. As mentioned earlier, the two major issues concerning capture fisheries in the Java Sea are the threatened sustain-ability of fishery resources and the poor socioeco-nomic conditions of small scale fishers. To cope with these issues, there is a need for an integrated management and development program with the main objectives of sustaining fishery resources and increasing incomes and livelihood opportunities of small scale fishers. The preceding section high-lighted the most important promoting and restrict-ing factors relevant to each of the two objectives. These objectives and factors were taken into account in formulating the program.
The key issues and corresponding actions dealing with sustainability of fishery resources and im-provement of socioeconomic conditions of fishers and their households are detailed in Annex 3. The actions can be grouped into four program compo-nents, namely: fishery resources co-management,

814 WorldFish Center 815
Table 13. Strategic factors to achieve the objectives of coastal fisheries management and development in the Java Sea.
Goal Objectives Strategic factors/Issues Priority rank
Alleviate poverty Sustain fishery resources
Restricting factors
1. Inappropriate pattern of fishery resource use I
2. Lack of MCS and law enforcement II
3. Small scale fishing fleet VII
4. Use of destructive fishing practices V
5. Destruction of habitats III
6. Lack of any skill except fishing VI
7. Lack of compliance IV
Promoting factors
1. Under-exploitation of offshore demersal fish resources I
2. High dependency of coastal community on fishery resources III
3. Availability of fisheries extension officers VII
4. Availability of potential area of business for fishing households VI
5. Availability of traditional knowledge V
6. Availability of fishers’ associations II
7. Promulgation of laws and regulations IV
Increase fishers’ incomes
Restricting factors
1. Over-exploitation of small pelagic and coastal demersal fish stocks III
2. Small scale fleet domination 1
3. Lack of surveillance and law enforcement VII
4. Inappropriate pattern of fishers’ expenditure VI
5. Lack of enterprise managerial skill II
6. Lack of technical skill to adopt higher level of post-harvest technology IV
7. Lack of capital V
Promoting factors
1. Under-exploitation of offshore demersal fish resources III
2. Good coordination with other institutions VI
3. High and increasing demand for fish and fishery products V
4. Availability of potential area of business for fishing households II
5. Availability of fisheries extension officers IV
6. Availability of fisheries training centres VII
7. Availability of fishing cooperatives I

814 WorldFish Center 815
public awareness, business opportunity develop-ment and fishers’ capacity building. These actions can also be categorized as policy, public campaign and investment actions.
Fishery resources in the Java Sea are shared among fishers from different provinces. Consequently, it would be difficult for each provincial government to manage these shared resources. The provincial governments and the central government should manage these resources collaboratively. Moreover, all stakeholders should be involved in a co-man-agement framework in order to achieve the objectives of management efficiently. Co-manage-ment involves sharing responsibility and/or author-ity between the government and resources users (Pomeroy and Williams 1994). To manage shared fishery resources in the Java Sea effectively, a Fish-eries Management Body (FMB) should be set up, that involves all key stakeholders.
The Integrated Program of Fisheries Management and Development for the Java Sea would cover various aspects of fisheries and involve relevant stakeholders. Because government funds are limit-ed, the program should be divided into at least two phases. The first phase would be to initiate the pro-gram. In the second phase, investments (consisting of private, cooperative and government investment) would be required.
The duration of the first phase would be three years. The objectives of the first phase would be to:
a. Develop a co-management framework involving all stakeholders;b. Increase public awareness in sustaining fishery resources;c. Develop business opportunities other than fish- ing in order to reduce pressure on heavily ex- ploited fishery resources; d. Develop fishers’ capacity to utilize business opportunities.
Activities that should be carried out during the first phase include:
a. Establishment of fishery resources co-manage- ment and formulation of the first management plan. In the first phase, management should not reduce the number of fishing vessels. Decreasing fishing pressure should be carried out by adjusting the number of fishing trips; b. Formulation of the drafts of government policies;
c. Public campaign; d. Creation of alternative income sources for fisher’s households and coastal communities.
Potential Regional Collaborative Activities
Countries in the region can collaborate in at least two activities, namely: (1) sharing information and experience, and (2) implementing a pilot project on shared stock management.
Some countries can share their experience of co-management of fishery resources. A co-manage-ment framework is an efficient way to manage fishery resources, since it involves community participation and a sharing of responsibility and/or authority between the government and local resources users/community. Indonesia has success stories regarding conservation, management of fishery resources and enforcement conducted by local people. The co-management framework is site-specific, but the sharing of experiences on co-management could lead to development of a framework with wider applicability.
Pilot projects on shared stock management could be implemented in the Malacca Straits, involving Indonesia, Malaysia and Thailand; in the Sulu-Sulawesi Seas, involving Indonesia, Malaysia and the Philippines; or in the South China Sea, invol-ving countries around this area. Such pilot projects would be desirable because joint management of shared stocks will help ensure their sustainability. The countries in the region have no previous experience with collaborative management of shared stocks. The pilot projects would provide such valuable experience.
Conclusion
The following are major trends in the Java Sea fisheries:
1. Increasing human population and per capita consumption of fish have combined to raise demand for fish. This promoted the develop- ment of fishing in the Java Sea. In order to increase the catch, the size of gear and boats were increased and the fishing grounds were extended.
2. Fishing and fishing-related activities, which tended to increase in response to the increased

816 WorldFish Center 817
demand for fish, became the main livelihood of coastal communities living around the Java Sea.
3. Intensified fishing activities stimulated the development of up-stream and down-stream industries. This increased employment oppor- tunities. The number of fishers and fishing households also increased. This is a significant contribution of the fisheries sector to the regio- nal economy.
4. The Java Sea Fishery was de facto open access, indicated by free competition among fishers and no real restriction on fishing effort. In this open access fishery, fishing pressure increased as the number and size of fishing boats increased. This resulted in biological over-exploitation and eco- nomic inefficiency.
5. The two main fishery resources in the Java Sea, which are small-pelagic and inshore demersal fishery resources, are over-exploited.
6. The quality of coastal habitats has decreased as a result of destructive human activities. The sustainability of mangroves and coral reefs, two important coastal habitats, is threatened.
7. Economic and biological over-exploitation and environmental degradation has led to poverty of fishers, especially small scale fishers in the coas- tal areas around Java Sea. This is indicated by decreases in CPUE and profit per vessel exploi- ting demersal and small-pelagic fish stocks.
8. Although the development of fishing industries had adverse impacts on the sustainability of fishery resources and the socioeconomic condi- tions of small scale fishers, there has been an increase in the commitment of the Government to develop fisheries and to conserve and manage fishery resources in line with the Code of Con- duct for Responsible Fisheries (Food and Agri- culture Organization (FAO) 1995). The devel- opment policies and programs, the coverage of regulations, and the establishment of the Minis- try of Sea Exploration and Fisheries are proof of this commitment.
The Java Sea fisheries, however, remain de facto open access since there are no real restrictions on fishing effort. This has resulted in over-exploitation of resources and dissipation of economic rent, which has in turn exacerbated the poverty of small
scale fishers. Improved fisheries management is urgently needed.
The fishery resources in the Java Sea are shared among fishers from different provinces. Therefore, concerned provincial governments under the supervision of central government should collab-oratively manage these resources. All stakeholders should be involved in the process of management of the fisheries to ensure sustainable fisheries.
The main goal of fisheries management in the Java Sea should be the alleviation of small scale fishers’ poverty. To achieve this goal, fisheries management in the Java Sea should be aimed at (1) sustaining fishery resources and (2) increasing fishers’ income by optimising economic benefits and employment opportunities. These in turn are expected to have a positive impact on the regional economy.
An integrated management and development program for the Java Sea fisheries is required. The proposed program covers various aspects of fisher-ies and should involve relevant stakeholders. The activities should include establishment of a Fisheries Management Body involving all key stakeholders.
In the context of regional cooperation, two poten-tial activities are highlighted. These are (1) net-working for transfer of information and experience in fisheries co-management and (2) regional pilot projects in shared stock management.
Acknowledgements
The WorldFish Center and Asian Development Bank (ADB) are gratefully acknowledged for initiat-ing, organising and supporting this study through the Project on Sustainable Management of Coastal Fish Stocks in Asia (ADB RETA 5766). Purwito Martosubroto (FAO, Rome), Cesar Luna and G. Silvestre (WorldFish Center) are appreciat-ed for their valuable suggestions and comments on this report. My appreciation is also due to J. Widodo, S. Kushendrayana, D. Monintja, A. Ghofar, K. Nitimulyo, S. Nurhakim, N. Naamin, L. Garces, K.A. Azis, S. Hutagalung, Sukoco, and P. Tambunan for their suggestions provided during the National Workshop on the Management of Coastal Fish Stocks during the Java Sea, conducted in Jakarta, Indonesia during 11 - 13 September 2000.

816 WorldFish Center 817
Annex 1. The Goal and Objectives of Coastal Fisheries Management in the Java SeaThe Goal
The Java Sea Fishery is de facto open access, al-though the Government of Indonesia regulates coastal fishing zones. This open access condition results from ineffective fishery surveillance. Conse-quently, there are no real restrictions on increasing fishing effort. This open access condition has re-sulted in the over-exploitation of coastal demersal and pelagic resour-ces. Another consequence is an inefficient allocation of economic resources, where consumers receive more economic benefits than should be the case (Purwanto et al. 1988), and economic rent is dissipated, resulting in fishers poverty (Purwanto 1992; Purwanto 1995; Pur-wanto et al. 1988).
Under open access conditions, there is free compe-tition between large scale and small scale fleets. As the large scale fleet is usually more efficient than the small scale fleet, small scale fishers typically lose in this competition and suffer from poverty. Unfortunately, the majority of fishers in the Java Sea belong to the small scale sector. Therefore, the main goal of coastal fisheries management should be alleviating poverty of small scale fishers. This is in accord with the current fisheries development program of Indonesia (DGF 1999b).
The Objectives
As discussed previously, poverty alleviation is the main goal of fisheries management in the Java Sea. Efforts to alleviate poverty may be classified as direct or indirect. Direct efforts are carried out by optimising economic benefits that can be gained by small scale fishers from fishery resources utilisation. This includes efforts to increase fishers’ income from fishing and creation of new job opportunities other than fishing. The indirect efforts include those to sustain fishery resources and their environment, which involves the adoption of proper fishery management, as fishers’ poverty is a result of inap-propriate fishery management.
That effort is in accord with the objectives of fisheries management stated in Fisheries Act No. 9 of 1985, which is the legal basis of coastal fisheries management in Indonesia. This act has its roots
in the 1945 Constitutions of the Republic of Indonesia, in particular Article 33, Sub-Article 3, which pro-vides the legal basis for State control over Indone-sia’s land and waters and the natural resources contained therein.
Article 33, Sub-Article (3), of the 1945 Constitution, stipulates that the natural resources, including fishery resources, of Indonesia are to be used in a manner that best benefits all Indonesians. The management of fishery resources in fishery areas of Indonesia therefore is intended to obtain maximum benefits gained from fishery resour-ces utilisation for all Indonesians (Fisheries Act No. 9 of 1985, Article 3, Sub-Article (1)). To achieve this objective, the Government shall carry out inte-grated fishery resources management in order to sustain fishery resources and their environment for the benefits of all Indonesians (Fisheries Act No. 9 of 1985, Article 3, Sub-Article (2)). It is clear there-fore that the objectives of coastal fisheries manage-ment in the Java Sea are to sustain fishery resources and to optimise economic benefits that can be gained from fishery resources utilisation.
Annex 2. Strategic Factors to Achieve the Objectives of Coastal Fisheries Management in the Java SeaBackground
As mentioned in Annex 1, the goal of fisheries management in the Java Sea is the alleviation of fishers’ poverty. To achieve this goal, two objec-tives of fisheries management in the Java Sea were derived. These objectives are (1) to sustain fishery resources and (2) to increase fishers’ income by optimising economic benefits that can be gained from fishery resources utilisation.
A number of strategic factors can affect the achieve-ment of fisheries management objectives. These factors can be divided into two: (1) factors which tend to restrict the achievement of the objectives, or restricting factors, and (2) factors which tend to promote the achievement of the objectives, or promoting factors. Identification of these strategic factors is presented here. These factors were considered in formulating the management and development program of the Java Sea fisheries in Annex 3.

818 WorldFish Center 819
Methods
The method used here is a modification of that used in Performance Improvement Planning (PIP) (Soedjadi 1997). In the analysis, the strategic factors were identified and ranked in order to determine their levels of priority. The steps of ranking were:
1. Valuation of the relative impact of the factors on the achievement of the objectives. Each factor was scored between 1 and 5; score 1 for a factor with very weak impact on the achievement of an objective, and score 5 for a factor with very strong impact.
2. Valuation of the ability to (a) cope with problems or restricting factors or (b) control opportunities or promoting factors. Again, scores between 1 and 5 were used. For problems or restricting factors, score 1 was provided when the factor was very difficult to solve, while score 5 was provided when the factor was very easy to solve. For opportunities or promoting factors, score 1 was provided when the factor was very difficult to control, while score 5 was provided when the factor was very easy to control.
3. Valuation of the relative force of the factors to restrict or to promote the objective achievement. The force was valued on the basis of (a) relative impact and (b) the ability to cope with pro- blems/restricting factors or to control oppor- tunities/promoting factors. Scores varying bet- ween 1 and 5 was also used in the valuation (score 1 for the factor with very weak relative force, score 5 for the factor with very strong relative force).
4. Valuation of the degree of factors’ inter-relationship. Scores 0, 1, 3, or 5 were provided to represent the degree of factors’ inter-relationship. Score 5 was provided when the inter-relationship bet- ween two factors was very strong; score 3 was provided when the inter-relationship between two factors was strong; score 1 was provided when the inter-relationship between two factors was weak; score 0 was provided when there was no inter-relationship between two factors. Then the scores for each factor were added up.
5. Valuation of the priority rank of the factors. This was carried out on the basis of the relative forces of the factors and the total scores of factors’
inter-relationship. Rank 1, receiving the highest priority, was for the factor with the strongest relative force and the greatest amount inter- relationship. The lowest rank was for the factor with the weakest relative force and the smallest amount inter-relationship.
Using their judgement, the Indonesian Project Team of the WorldFish Center/ADB Project on Sus-tainable Management of Coastal Fish Stocks in Asia provided the valuation scores.
Results
The results of the analysis are divided into two sections. The first section describes factors affecting the effort to sustain fishery resources, while the second section presents factors that should be considered in increasing fishers’ income.
Factors affecting Effort to Sustain Fishery ResourcesIdentification of Strategic FactorsRestricting Factors
There were seven major problems or factors considered restricting the effort to sustain fishery resources. These factors are (1) inappropriate pattern of fishery resource use, (2) lack of MCS and law enforcement, (3) small scale fishing fleet, (4) use of destructive fishing practices, (5) destruc-tion of habitat, (6) lack of any skills except fishing, and (7) lack of compliance. Justification for each restricting factor is described here.
1. Inappropriate pattern of fishery resource use. Lack of coordination between DGF, Provincial Fisheries Services and District Fisheries Services in issuing licenses and in developing the marine capture fishery increases the threat to the sustainability of fishery resources.
2. Lack of MCS and law enforcement. Monitoring (M), control (C) and surveillance (S) are the important components of fishery man- agement. With limited capacities and facilities however monitoring and control cannot be car- ried out effectively. Similarly, limited number and capabilities of personnel and facilities result in ineffective surveillance and enforcement.
3. Small scale fishing fleet. Coastal fishery resources of the Java Sea are highly exploited, even over-exploited in some coastal areas. Therefore development of the fish-

818 WorldFish Center 819
ery should be aimed at optimising the utilisa- tion of offshore fishery resources in order to sustain the whole fishery resources. However, the majority of fishing boats are small scale and can only exploit coastal fishery resources.
4. Use of destructive fishing practices. There is an increasing tendency to use destruc- tive fishing practices such as blast fishing and use of poisons on coral reefs.
5. Destruction of habitat. The sustainability of aquatic habitats is increa- singly under threat from human activities such as coral mining and mangrove deforestation, and human-induced impacts such as pollution, and sedimentation.
6. Lack of skills other than fishing. As mentioned previously, the small pelagic and demersal fishery resources in inshore waters of the Java Sea are over-exploited. In order to sustain fishery resources, fishing effort in coastal areas should be reduced either by reducing the number of boats or by encouraging fishers to reduce the number of fishing days. However, the reality is that fishing is the only skill of the majority of fishers.
7. Lack of compliance. The government has issued a number of policies and regulations that are intended to sustain fish- ery resources. However, the lack of compliance results in ineffective policies and regulations.
Promoting Factors
Seven major factors that could promote sustaining resources were identified. These are (1) under-exploitation of offshore demersal fish stock, (2) high dependency of coastal communities on fishery resources, (3) availability of fisheries extension officers, (4) availability of potential area of business for fishing households, (5) availability of traditional knowledge, (6) availability of fishers’ associations, and (7) promulgation of laws and regulation. Justi-fication for each promoting factor is described here.
1. Under-exploitation of offshore demersal fish stock. As mentioned previously, fishery resources in some coastal areas are reported to be over-exploited, so effort in these coastal areas should be reduced.
Development of a capture fishery should be carried out in order to meet increasing demand for fish.
2. High dependency of coastal community on fishery resources. As fishing is the only skill fishers have, they are highly dependent on fishery resources. Aware- ness of coastal communities on the benefits of sustaining fishery resources on the sustainability of the fishery resources-based economic activi- ties would promote the effort to encourage fish- ers to be involved in sustaining fishery resources.
3. Availability of fisheries extension officers. The message to sustain fishery resources should be delivered to fishers and other community members. Extension activities can deliver the message effectively.
4. Availability of potential area of business for fishing households. As mentioned previously, fishing is the only skill most fishers have. Fishing pressure could be decreased if the fishers could earn additional income in businesses other than fishing. Some areas of business that can be undertaken by fishing households include fish processing and marketing.
5. Availability of traditional knowledge. Indonesia has experienced success in conserving fishery resources with the involvement of communities. The communities in the coastal areas around the Java Sea have traditional knowledge concerning the sustainability of fishery resources, which has enabled them to understand the importance of the dynamics of the resources.
6. Availability of fishers association. The roles of fishers’ associations such as the Indonesian Fishers’ Association and the National Fisheries Society are significant in promoting conservation and management of fishery resou- rces. The Indonesian Fishers’ Association had the role, for example, of proposing the ban of the operation of trawlers in Indonesian waters in 1980. The National Fisheries Society had an important role in the establishment of the Department of Sea Exploration and Fisheries. This in turn increases the capability of fisheries institutions in sustaining fishery resources.

820 WorldFish Center 821
7. Promulgation of laws and regulations. To ensure compliance with fisheries manage- ment policies, legal power should be provided to the policies by promulgation of laws and regula- tions on the policies.
Factor Valuation and Priority RankingValuation of Forces
The relative impacts, solvability and relative forces of restricting factors are presented in Table 2.1. An inappropriate exploitation pattern was consi-dered the main factor with the largest impact in restrict-ing the effort to sustain the resources. As indicated by the relative force solving this problem can result in the highest contribution to the achievement of the objective, which is to sustain fishery resources in the Java Sea.
Relative impacts, solvability and relative forces of promoting factors are presented in Table 2.2. As
indicated by the relative force, under-exploitation of demersal fish stock and availability of fishers’ associations are the two most important factors that can potentially help sustain fishery resources in the Java Sea.
Priority Ranking
Scores indicating the degrees of inter-relationship among factors are presented in a matrix form in Figure 2.1. Based on the relative forces of the fac-tors and the total scores of factors’ inter-relation-ships, there are three restricting factors and three promoting factors that should be given the highest consideration when formulating alternative mana-gement strategies to sustain fishery resources. The most important restricting factors are (1) inappro-priate pattern of fishery resource use, (2) lack of MCS and law enforcement, and (3) destruction of habitat. Meanwhile, the three most important promoting factors are (1) under-exploitation of
Table 2.1. Restricting factors in sustaining fishery resources in the Java Sea.
No Restricting factors Relative impact Solvability Relative force
1 Inappropriate pattern of fishery resource use 5 3 5
2 Lack of MCS and law enforcement 4 3 4
3 Small scale fishing fleet 3 2 2
4 Use of destructive fishing practices 3 2 2
5 Destruction of habitat 4 2 3
6 Lack of any skill but fishing 2 3 2
7 Lack of compliance 3 2 2
Table 2.2. Promoting factors in sustaining fishery resources in the Java Sea.
No Promoting factors Relative impact Control-ability Relative force
1 Under-exploitation of offshore demersal fish stock 4 3 5
2 High dependency of coastal community on fishery resources 3 3 4
3 Availability of fisheries extension officers 2 3 3
4 Availability of potential area of business for fishing households 4 2 3
5 Availability of traditional knowledge 3 2 3
6 Availability of fishers’ associations 4 3 5
7 Promulgation of laws and regulation 2 3 3
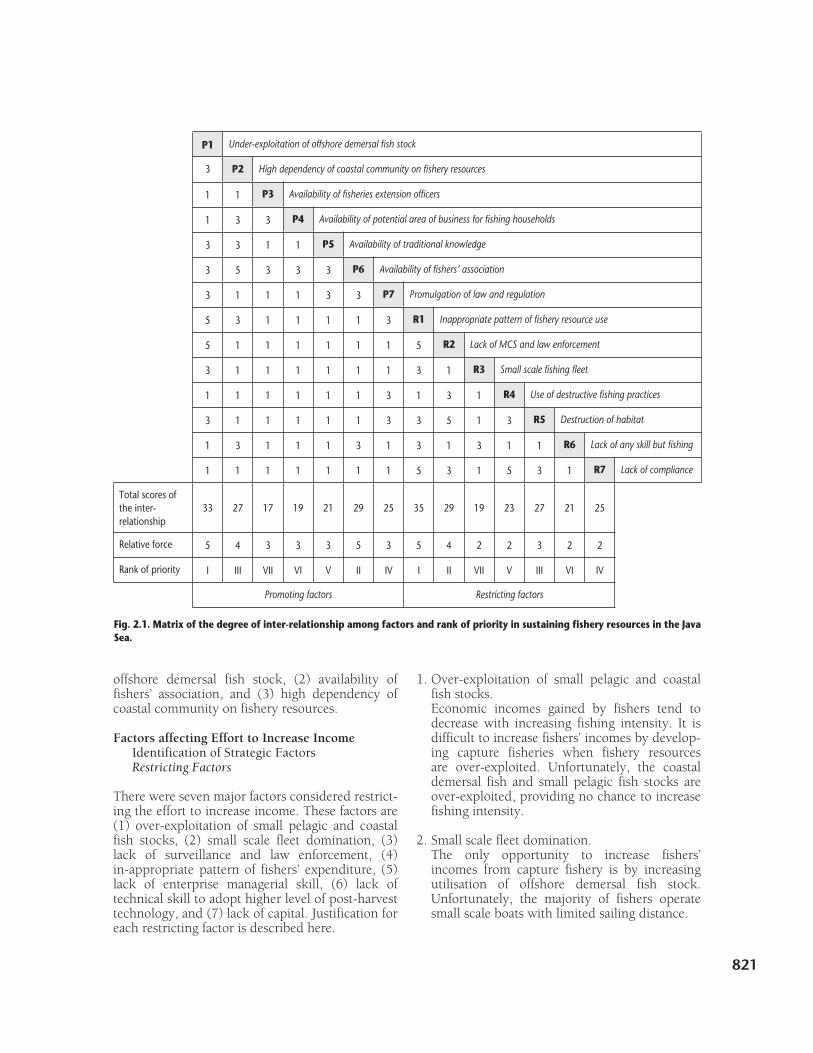
820 WorldFish Center 821
Fig. 2.1. Matrix of the degree of inter-relationship among factors and rank of priority in sustaining fishery resources in the Java Sea.
P1 Under-exploitation of offshore demersal fish stock
3 P2 High dependency of coastal community on fishery resources
1 1 P3 Availability of fisheries extension officers
1 3 3 P4 Availability of potential area of business for fishing households
3 3 1 1 P5 Availability of traditional knowledge
3 5 3 3 3 P6 Availability of fishers’ association
3 1 1 1 3 3 P7 Promulgation of law and regulation
5 3 1 1 1 1 3 R1 Inappropriate pattern of fishery resource use
5 1 1 1 1 1 1 5 R2 Lack of MCS and law enforcement
3 1 1 1 1 1 1 3 1 R3 Small scale fishing fleet
1 1 1 1 1 1 3 1 3 1 R4 Use of destructive fishing practices
3 1 1 1 1 1 3 3 5 1 3 R5 Destruction of habitat
1 3 1 1 1 3 1 3 1 3 1 1 R6 Lack of any skill but fishing
1 1 1 1 1 1 1 5 3 1 5 3 1 R7 Lack of compliance
Total scores of the inter-relationship
33 27 17 19 21 29 25 35 29 19 23 27 21 25
Relative force 5 4 3 3 3 5 3 5 4 2 2 3 2 2
Rank of priority I III VII VI V II IV I II VII V III VI IV
Promoting factors Restricting factors
offshore demersal fish stock, (2) availability of fishers’ association, and (3) high dependency of coastal community on fishery resources.
Factors affecting Effort to Increase IncomeIdentification of Strategic FactorsRestricting Factors
There were seven major factors considered restrict-ing the effort to increase income. These factors are (1) over-exploitation of small pelagic and coastal fish stocks, (2) small scale fleet domination, (3) lack of surveillance and law enforcement, (4) in-appropriate pattern of fishers’ expenditure, (5) lack of enterprise managerial skill, (6) lack of technical skill to adopt higher level of post-harvest technology, and (7) lack of capital. Justification for each restricting factor is described here.
1. Over-exploitation of small pelagic and coastal fish stocks. Economic incomes gained by fishers tend to decrease with increasing fishing intensity. It is difficult to increase fishers’ incomes by develop- ing capture fisheries when fishery resources are over-exploited. Unfortunately, the coastal demersal fish and small pelagic fish stocks are over-exploited, providing no chance to increase fishing intensity.
2. Small scale fleet domination. The only opportunity to increase fishers’ incomes from capture fishery is by increasing utilisation of offshore demersal fish stock. Unfortunately, the majority of fishers operate small scale boats with limited sailing distance.

822 WorldFish Center 823
3. Lack of surveillance and law enforcement. There are a number of laws and regulations to sustain resources and to protect the income- earning capacity of small scale fishers. The effectiveness of the laws and regulations depends on law enforcement and surveillance capabili- ties, which are presently weak due to limited personnel and facilities.
4. Inappropriate pattern of fishers’ expenditure. Fishers have a habit of spending most of their income when they obtain good catches and neglecting to save for off-season periods. This habit constrains the effort to increase fishers’ incomes.
5. Lack of enterprise managerial skill. The utilisation of under-exploited fishery resou- rces, i.e. offshore demersal fish stocks, involves establishing and managing a larger scale of busi- ness. This requires a higher level of managerial skill, which unfortunately most small scale fish- ers do not possess.
6. Lack of technical skill to adopt higher level of post-harvest technology. Utilisation of offshore demersal fish stocks will also require a higher level of post-harvest technology to preserve catches during the longer fishing trips. However, small scale fishers have limited skill to adopt more advanced post- harvest technology.
7. Lack of capital. Larger boats and different fishing gear are needed to utilise under-exploited offshore demersal fish stocks. However, fishers do not have easy access to funds for new investments.
Promoting Factors
Seven major factors that could promote increasing income were identified. These factors are (1) under-exploitation of offshore demersal fish stock, (2) good coordination among institutions, (3) high and increasing demand for fish and fishery products, (4) availability of potential area of business for fishing households, (5) availability of fisheries extension officers, (6) availability of fisher-ies training centres, and (7) availability of fishing cooperatives. Justification for each promoting factor is described here.
1. Under-exploitation of offshore demersal fish stock. The under-exploited offshore demersal fish stocks provide an opportunity for increasing fishers’ incomes.
2. Good coordination among institutions. Factors that could affect the success of increa- sing fishers’ incomes include not only technical but also non-technical factors. One of the more important non-technical factors is good coordi- nation among institutions that will collaborate in this effort.
3. High and increasing demand for fish and fishery product. Data published by DGF and FAO show the high and increasing demand for fish and fishery pro- ducts. This tendency would ensure the develop- ment of fisheries and could result in increasing fishers’ incomes.
4. Availability of potential area of business for fishing households. Diversification of business is the other way to increase incomes of fishing households. There are various areas of business that could be con- ducted by fishing households, for example pro- cessing and marketing. These types of business have been conducted by a number of fishing households in some coastal areas, for example in Cilacap, Tegal, Pekalongan and Brondong.
5. Availability of fisheries extension officers. Transfer of knowledge and sharing of experience can benefit fishers who want to expand their fishing grounds and business scale. Fisheries extension officers should carry out this exten- sion work. Fortunately, the government has trained extension officers in fisheries and assigned them to work in local offices close to the coastal communities.
6. Availability of fisheries training centres Training centres and training equipment are needed as facilities to transfer knowledge to fish- ers, to share experience among fishers and to train them on new technologies and business skills. Fortunately, there is at least one training centre in each province that could be used to conduct extension and training activities.
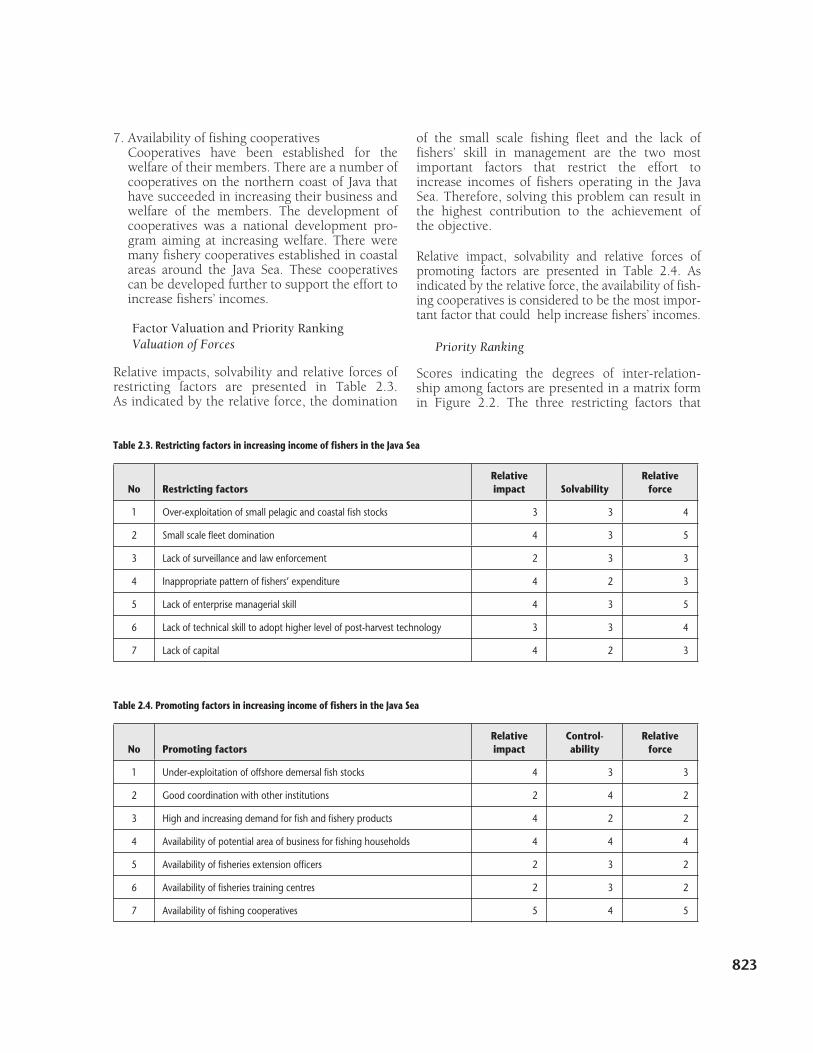
822 WorldFish Center 823
Table 2.3. Restricting factors in increasing income of fishers in the Java Sea
No Restricting factorsRelative impact Solvability
Relative force
1 Over-exploitation of small pelagic and coastal fish stocks 3 3 4
2 Small scale fleet domination 4 3 5
3 Lack of surveillance and law enforcement 2 3 3
4 Inappropriate pattern of fishers’ expenditure 4 2 3
5 Lack of enterprise managerial skill 4 3 5
6 Lack of technical skill to adopt higher level of post-harvest technology 3 3 4
7 Lack of capital 4 2 3
Table 2.4. Promoting factors in increasing income of fishers in the Java Sea
No Promoting factorsRelative impact
Control-ability
Relative force
1 Under-exploitation of offshore demersal fish stocks 4 3 3
2 Good coordination with other institutions 2 4 2
3 High and increasing demand for fish and fishery products 4 2 2
4 Availability of potential area of business for fishing households 4 4 4
5 Availability of fisheries extension officers 2 3 2
6 Availability of fisheries training centres 2 3 2
7 Availability of fishing cooperatives 5 4 5
7. Availability of fishing cooperatives Cooperatives have been established for the welfare of their members. There are a number of cooperatives on the northern coast of Java that have succeeded in increasing their business and welfare of the members. The development of cooperatives was a national development pro- gram aiming at increasing welfare. There were many fishery cooperatives established in coastal areas around the Java Sea. These cooperatives can be developed further to support the effort to increase fishers’ incomes.
Factor Valuation and Priority RankingValuation of Forces
Relative impacts, solvability and relative forces of restricting factors are presented in Table 2.3. As indicated by the relative force, the domination
of the small scale fishing fleet and the lack of fishers’ skill in management are the two most important factors that restrict the effort to increase incomes of fishers operating in the Java Sea. Therefore, solving this problem can result in the highest contribution to the achievement of the objective.
Relative impact, solvability and relative forces of promoting factors are presented in Table 2.4. As indicated by the relative force, the availability of fish-ing cooperatives is considered to be the most impor-tant factor that could help increase fishers’ incomes.
Priority Ranking
Scores indicating the degrees of inter-relation-ship among factors are presented in a matrix form in Figure 2.2. The three restricting factors that
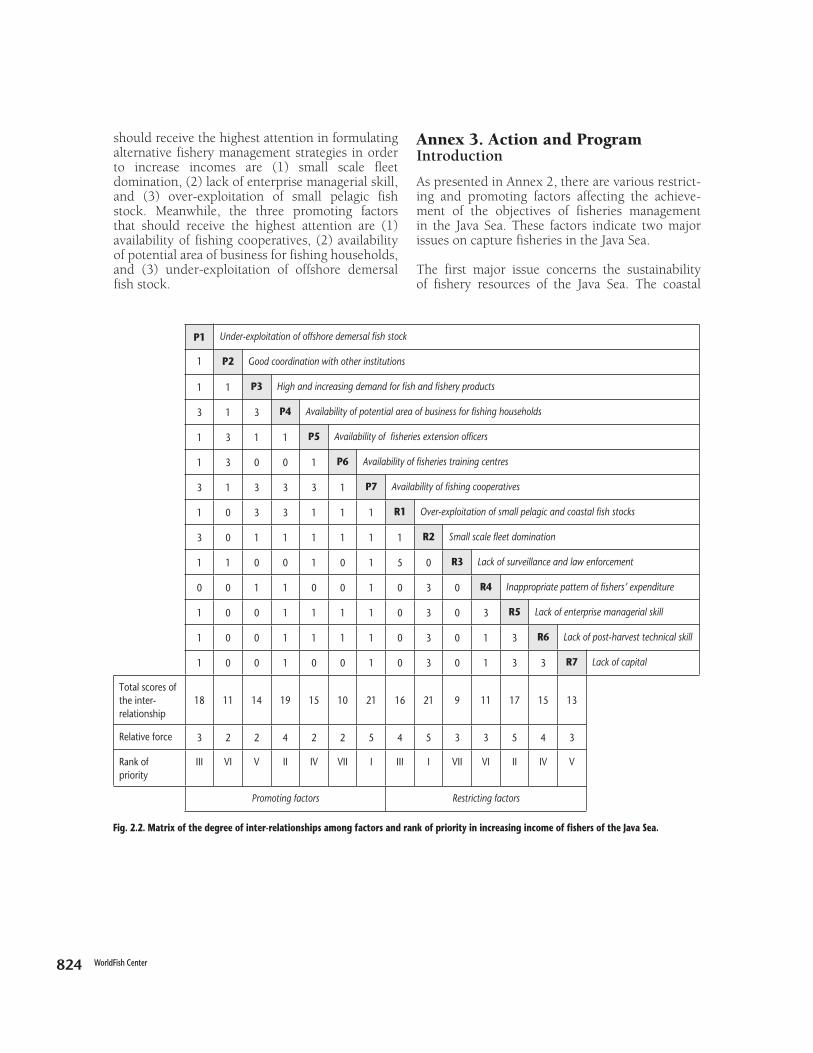
824 WorldFish Center 825
should receive the highest attention in formulating alternative fishery management strategies in order to increase incomes are (1) small scale fleet domination, (2) lack of enterprise managerial skill, and (3) over-exploitation of small pelagic fish stock. Meanwhile, the three promoting factors that should receive the highest attention are (1) availability of fishing cooperatives, (2) availability of potential area of business for fishing households, and (3) under-exploitation of offshore demersal fish stock.
Fig. 2.2. Matrix of the degree of inter-relationships among factors and rank of priority in increasing income of fishers of the Java Sea.
P1 Under-exploitation of offshore demersal fish stock
1 P2 Good coordination with other institutions
1 1 P3 High and increasing demand for fish and fishery products
3 1 3 P4 Availability of potential area of business for fishing households
1 3 1 1 P5 Availability of fisheries extension officers
1 3 0 0 1 P6 Availability of fisheries training centres
3 1 3 3 3 1 P7 Availability of fishing cooperatives
1 0 3 3 1 1 1 R1 Over-exploitation of small pelagic and coastal fish stocks
3 0 1 1 1 1 1 1 R2 Small scale fleet domination
1 1 0 0 1 0 1 5 0 R3 Lack of surveillance and law enforcement
0 0 1 1 0 0 1 0 3 0 R4 Inappropriate pattern of fishers’ expenditure
1 0 0 1 1 1 1 0 3 0 3 R5 Lack of enterprise managerial skill
1 0 0 1 1 1 1 0 3 0 1 3 R6 Lack of post-harvest technical skill
1 0 0 1 0 0 1 0 3 0 1 3 3 R7 Lack of capital
Total scores of the inter-relationship
18 11 14 19 15 10 21 16 21 9 11 17 15 13
Relative force 3 2 2 4 2 2 5 4 5 3 3 5 4 3
Rank of priority
III VI V II IV VII I III I VII VI II IV V
Promoting factors Restricting factors
Annex 3. Action and ProgramIntroduction
As presented in Annex 2, there are various restrict-ing and promoting factors affecting the achieve-ment of the objectives of fisheries management in the Java Sea. These factors indicate two major issues on capture fisheries in the Java Sea.
The first major issue concerns the sustainability of fishery resources of the Java Sea. The coastal

824 WorldFish Center 825
Table 3.1. Key issues and actions needed to sustain fishery resources to increase the income and livelihood opportunities of small scale fishers in the Java Sea.
Key issues Action or key intervention
Sustaining fishery resources
Inappropriate pattern of fishery resource use
Formulate appropriate fishery resource usesInvolve all stakeholders in the management planning and actionsIncrease public awareness
Lack of MCS and law enforcement
Strengthen MCS systemIncrease the participation of coastal communities
Destruction of habitat Increase public awarenessCreate alternative income sources
Under-exploitation of offshore demersal fish stock
Formulate appropriate management planInvolve all stakeholders in the management planning and actionsRevise spatial planning for fisheries development
Availability of fishers’ associations
Involve fishers’ associations in the management planning and actionStrengthen fishers’ associations and increase their awareness
High dependency of coastal community on fishery resources
Increase public awarenessInvolve coastal communities in the management planning and action
Increasing income and livelihood opportunity
Small scale fleet domination
Special scheme on access to capital/bank serviceIncrease technical skill in fishing and post-harvest technologies
Lack of enterprise managerial skill
Training programExtension program
Over-exploitation of small pelagic and coastal demersal fish stocks
Control fishing effortIncrease public awarenessCreate alternative income sources
Availability of fishing cooperatives
Strengthen fishing cooperativesInvolve fishing cooperatives in the creation of alternative income sources
Availability of potential area of business for fishing households
Create, optimise and use opportunities Training programExtension program
Under-exploitation of offshore demersal fish stock
Formulate appropriate management planInvolve all stakeholders in the management planning and actionsRevise spatial planning for fisheries developmentMinimise free competition between small scale and large scale fisheriesDevelop offshore demersal fishing fleet
demersal fish stock and the small pelagic fish are over-exploited. An appropriate strategy of fishery resources management and its supporting actions are required to sustain these resources.
The second major issue concerns the socioeco-nomic conditions of fishers and their households, particularly the low incomes and the limited liveli-hood opportunities of small scale fishers. An appro-priate development strategy, its actions and invest-ment programs are required to address this issue.
Action and investment programs of the Java Sea Fisheries Management and Development Program are presented here. This is an integrated program involving various aspects of fisheries and relevant stakeholders. Processes in formulating the action and investment programs include (a) identifying possible actions for each key issue, (b) categorising actions by key issues, (c) defining program compo-nents and sorting the actions by these components, and (d) defining the type of actions. The proposed project required to initiate the program is present-ed here.
Issues, Program Components and Imple-mentationIssues, Actions and Program Components
As mentioned previously, there are two major issues of the Java Sea fisheries, namely, sustaina-bility of fishery resources and socio-economic con-ditions of fishers and their households. Six key issues for each of these major issues were selected from the restricting and promoting factors, which were categorised as top three factors (see Annex 2). The key issues and actions dealing with the sustain-ability of fishery resources and the improvement of socio-economic conditions of fishers and their households are listed in Table 3.1.
An integrated management and development program for the Java Sea fisheries is required in order to sustain fishery resources and to increase the income and livelihood opportunities of small scale fishers. The actions of this program can be grouped into four program components, namely, fishery resources co-management, public aware-ness, business opportunity development and fishers’ capacity building. These actions can be categorised as policy, public campaign and invest-ment (Table 3.2). Data and information are required to establish fisheries co-management, to formulate government policies, management plans

826 WorldFish Center 827
Table 3.2. Components and actions of the Management and Development Program for the Java Sea Fisheries.
Key issues Action or key interventionAction
category
1. Fishery resources co-management component
Availability of fishers’ associations Involve fishers’ associations in the management planning and action to sustain fishery resources
Government policy
High dependency of coastal community on fishery resources
Involve coastal communities in the management planning and action to sustain fishery resources
Inappropriate pattern of fishery resource use Formulate appropriate fishery resource uses
Involve all stakeholders in the management planning and actions to sustain fishery resources
Over-exploitation of small pelagic and coastal demersal fish stocks
Control fishing effort to sustain fishery resources and to increase fishers’ incomes
Under-exploitation of offshore demersal fish stocks
Involve all stakeholders in the management planning and actions to sustain fishery resources and to increase fishers’ incomes
Formulate appropriate management plan to sustain fishery resources and to increase fishers’ incomes
Minimise free competition between small scale and large-scale fisheries to sustain fishery resources and to increase fishers’ incomes
Revise spatial planning for fisheries development to sustain fishery resources and to increase fishers’ incomes
Lack of MCS and law enforcement Strengthen MCS system to sustain fishery resources Government policy and investmentInvolve fishing communities in the surveillance
2. Public awareness component
Destruction of habitat Increase public awareness to sustain fishery resources in order to increase fishers’ incomes
Public campaign
High dependency of coastal community on fishery resources
Inappropriate pattern of fishery resource use
Over-exploitation of small pelagic and coastal demersal fish stocks
Lack of MCS and law enforcement Increase the awareness of fishing communities in fisheries surveillance in order to sustain fishery resources
Availability of fishers’ associations Increase the awareness of fishers’ associations to sustain fishery resources
Availability of fishing cooperatives Involve fishing cooperatives in the creation of alternative income sources Government policy
Destruction of habitat Create alternative income sources Private investment
Over-exploitation of small pelagic and coastal demersal fish stocks
Create alternative income sources
Under-exploitation of offshore demersal fish stock
Develop offshore demersal fishing fleet

826 WorldFish Center 827
Key issues Action or key interventionAction
category
3. Fishers’ capacity building and institutional strengthening component
Availability of fishing cooperatives Strengthen fishing cooperatives to increase their capacity to run businesses Government policy and private investment
Lack of enterprise managerial skillExtension and training program to increase fishers’ skill in managing their business in order to increase income
Small scale fleet dominationIncrease technical skill in fishing and post-harvest technologies
Special scheme for access to capital/bank service Government policy
Availability of fishers’ associationsStrengthen fishers’ associations to increase their involvement in fisheries management and surveillance
4. Fisheries research component
Up-date data on bio-physical characteristics of the fisheries Research
Collect data on socio-cultural characteristics of coastal communities
Policies and legal reviews
Table 3.2. Components and actions of the Management and Development Program for the Java Sea Fisheries. (continued)
and materials for a public campaign, and to create alternative income sources. Therefore, a fisheries research component is also required.
Program ImplementationBackground
Fishing effort should be controlled to sustain fish-ery resources and to optimise the economic benefit gained from these resources. Licensing is one of the management tools to control the development of fishing effort. Based on Article 10 of the Govern-ment Regulation no. 15 of 1990, the provincial government issues licenses for fishing boats with sizes equal or less than 30 GT; the central govern-ment issues licenses for fishing boats greater than 30 GT. Both government levels issue fishing licenses in the Java Sea since the fisheries in the area include both small scale and large-scale.
The Autonomy Act no. 22 of 1999 provides greater responsibility to the provincial and district govern-ments to undertake exploration, exploitation, con-servation and management of fishery resources in their marine areas (see Article 10 of the Act). Based on Article 3 of the Act, the marine area of the province covers waters up to 12 nm from the coast-line. However, fish stocks in the Java Sea are distributed from inshore to offshore waters, far beyond 12 nm. These resources are shared among fishers from different provinces. Therefore, it would
be difficult for each provincial government to man-age shared fish stocks, as management of fishery resources should be as a unit. The concerned pro-vincial governments and the central government should manage fishery resources in the Java Sea collaboratively. Moreover, all stakeholders should be involved in a co-management framework in or-der to achieve management objectives efficiently.
Program Objectives
The Java Sea Fisheries Management and Develop-ment Program is aimed at sustaining fishery resources and optimising the economic benefits that could be gained from fishery resources utilisa-tion in order to alleviate fishers’ poverty.
Program Organisation Structure
As presented in Table 3.2, there are four possible program components consisting of various actions. These actions could be categorised into three types of actions, namely policy, public campaign and investment. The policies would be formulatedby the governments, either central, provincial or district governments. Public campaigns could be carried out by government and non-government organisations. Meanwhile, investment could be by government or private sectors.
A Fisheries Management Authority (FMA), to be

828 WorldFish Center 829
established with the involvement of all key stake-holders, will implement policies on the manage-ment of shared fishery resources in the Java Sea. Stakeholders include government institutions, fish-ers, fish processors and traders. The government institutions consist of the Directorate General of Fisheries, the Directorate General of Marine Sur-veillance and Protection, and the Provincial Fisher-ies Services of East Java, Central Java, West Java, Jakarta, West Kalimantan, Central Kalimantan and South Kalimantan.
The Java Sea FMA would be responsible for ensu-ring the sustainable use and efficient management of fisheries resources on behalf of the community and key stakeholders. The Java Sea FMA should commit to excellence in managing fisheries resour-ces, considering the needs of the marine ecosys-tems and current and future generations. The Java Sea FMA would make decisions on fisheries man-agement consistent with national policies.
The Java Sea FMA should be supported by a Management Advisory Committee (MAC). The members of the Java Sea Fisheries MAC would consist of relevant stakeholder groups, including the commercial fishing industry. The Java Sea Fish-eries MAC would be expertise-based and advisory in nature, and would make recommendations to the Java Sea FMA on management and operational issues. The Java Sea Fisheries MAC would identify and discuss issues and problems relating to a fish-ery and develop possible solutions. The outcome of these activities would determine the recommenda-tions the MAC would make to the Java Sea FMA.
The FMA and the MAC of the Java Sea have yet to be established. The FKPPS of management area III could be used in initiating the establishment of this co-management body.
Financial/Resource Requirements
As presented in Table 3.2, the program would consist of various activities categorized into formu-lation and implementation of policies, public cam-paign, and government and private investments. A budget would be required to carry out the pro-gram. The budget should come from the govern-ment and non-government organizations, and the private sector.
In the long-term, the budget for the formulation and implementation of government policies, public campaign, and government investment, needed to
manage and develop the Java Sea fisheries, should come from fishery resource rents that would be charged to the resource. In the short-term, how-ever, the budget for the program activities carried out by the government should come from the gov-ernment. Unfortunately, the government budget is very limited under current economic conditions. Therefore, availability of a grant would be very important to carry out the program.
Monitoring and Evaluation
Monitoring will be done to evaluate the achieve-ment of the program objectives. The main indica-tors that would be used to measure the objective achievement could be (1) the level of fishing effort, (2) fishing boat productivity, (3) species composi-tion of catch, (4) the average annual income per fisher household, and (5) the frequency of violation (number of cases per year). Problems and con-straints encountered in the implementation of the program should also be monitored in order to evaluate the program and adjust the policies. In order to sustain fishery resources, the level of fishing effort should be equal to the effort achieving a target reference point or lower. Meanwhile, the fishing boat productivity should be equal to that when the target reference point is achieved or higher. Bio-diversity of fishery resources, indicated by the species composition of catch, should remain high. The frequency of violation should decrease. The average annual household income of small scale fishers should increase.
There are two approaches used in monitoring, namely direct and indirect approaches. Official mechanisms are used to monitor programs directly. Indirect monitoring is carried out by the involve-ment of communities.
Proposed Project Digest
The project, named the Java Sea Fisheries Manage-ment and Development Project, would implement the Java Sea Fisheries Management and Development Pro-gram. As government funds are limited, the pro-gram coverage is wide and some program activities need to be carried out simultaneously, the project should be divided into at least two phases. The first phase would be carried out to initiate the pro-gram. In the second phase of the project, invest-ment, consisting of private and cooperative invest-ment and government investment, would be made.
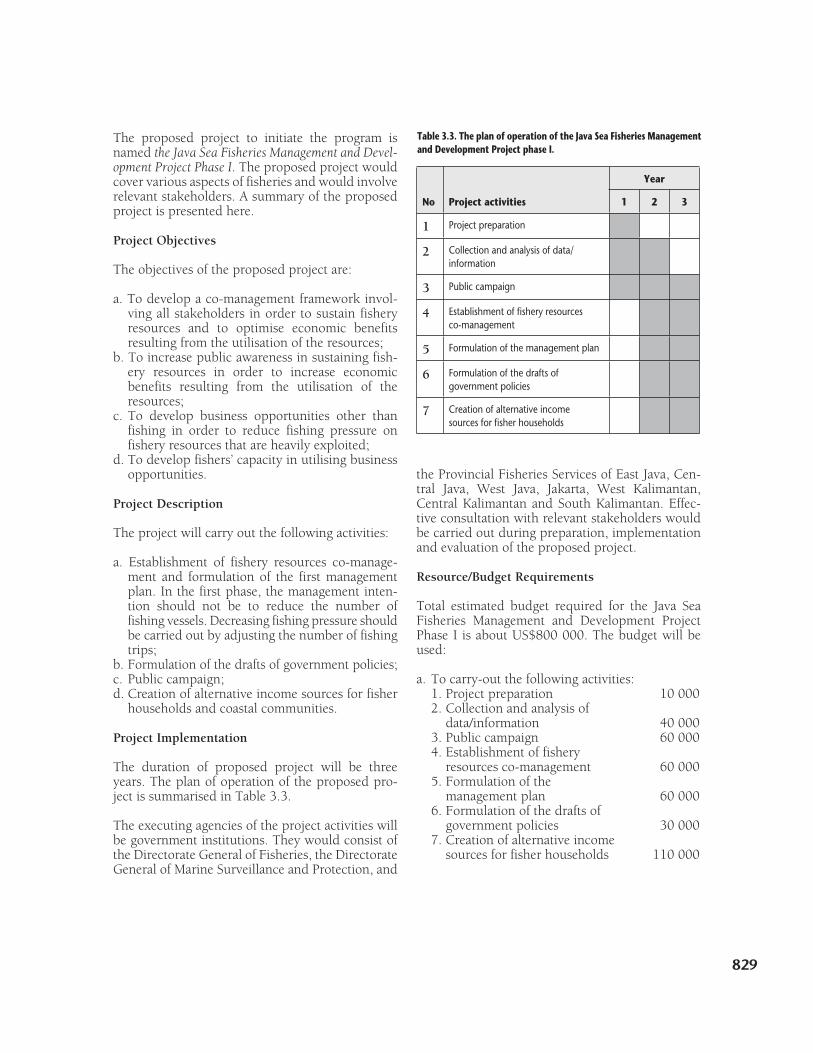
828 WorldFish Center 829
Table 3.3. The plan of operation of the Java Sea Fisheries Management and Development Project phase I.
No Project activities
Year
1 2 3
1 Project preparation
2 Collection and analysis of data/information
3 Public campaign
4 Establishment of fishery resources co-management
5 Formulation of the management plan
6 Formulation of the drafts of government policies
7 Creation of alternative income sources for fisher households
The proposed project to initiate the program is named the Java Sea Fisheries Management and Devel-opment Project Phase I. The proposed project would cover various aspects of fisheries and would involve relevant stakeholders. A summary of the proposed project is presented here.
Project Objectives
The objectives of the proposed project are:
a. To develop a co-management framework invol- ving all stakeholders in order to sustain fishery resources and to optimise economic benefits resulting from the utilisation of the resources;b. To increase public awareness in sustaining fish- ery resources in order to increase economic benefits resulting from the utilisation of the resources;c. To develop business opportunities other than fishing in order to reduce fishing pressure on fishery resources that are heavily exploited;d. To develop fishers’ capacity in utilising business opportunities.
Project Description
The project will carry out the following activities:
a. Establishment of fishery resources co-manage- ment and formulation of the first management plan. In the first phase, the management inten- tion should not be to reduce the number of fishing vessels. Decreasing fishing pressure should be carried out by adjusting the number of fishing trips; b. Formulation of the drafts of government policies; c. Public campaign;d. Creation of alternative income sources for fisher households and coastal communities.
Project Implementation
The duration of proposed project will be three years. The plan of operation of the proposed pro-ject is summarised in Table 3.3.
The executing agencies of the project activities will be government institutions. They would consist of the Directorate General of Fisheries, the Directorate General of Marine Surveillance and Protection, and
the Provincial Fisheries Services of East Java, Cen-tral Java, West Java, Jakarta, West Kalimantan, Central Kalimantan and South Kalimantan. Effec-tive consultation with relevant stakeholders would be carried out during preparation, implementation and evaluation of the proposed project.
Resource/Budget Requirements
Total estimated budget required for the Java Sea Fisheries Management and Development Project Phase I is about US$800 000. The budget will be used:
a. To carry-out the following activities: 1. Project preparation 10 000 2. Collection and analysis of data/information 40 000 3. Public campaign 60 000 4. Establishment of fishery resources co-management 60 000 5. Formulation of the management plan 60 000 6. Formulation of the drafts of government policies 30 000 7. Creation of alternative income sources for fisher households 110 000
830 WorldFish Center 831
b. To hire experts/consultants and project staffs: 1. Experts/consultants specialising in Fisheries Biology, Fisheries Economics, Sociology, Fisheries Management, Aquaculture and Fish Processing, Mass Communication, Fisheries Law 240 000 2. Project staffs (6 people) 15 000
c. To rent office 90 000
d. For transportation expenses (car and its operational/maintenance) 40 000
e. For telecommunication, stationery, and other expenses 45 000
The budget to carry out the proposed project is expected to come from a grant, as government funds are very limited under current economic conditions.
Project Monitoring and Evaluation
Monitoring would be done to identify problems and constraints encountered in the implemen-tation of the project, to evaluate the progress of the project and the achievement of the program objectives or benefits. There would be two approaches used in the monitoring, namely direct and indirect approaches. Official mechanisms would be used to monitor the project and program directly. The involved communities would carry out indirect monitoring.
Monitoring the evaluation of the achievement of the project targets, consisting of physical and financial targets, would be done monthly through a reporting system. Supervision would be carried out in order to monitor the project. Project indica-tors would be used to evaluate the progress of the project and the achievement of the project objectives. The project indicators would consist of (1) physical target attainment, and (2) financial target attainment.
Monitoring the evaluation of the achievement of the program objectives or benefits would be done annually. The indicators that would be used to evaluate the achievement of the program objectives or benefits would consist of (1) the level of fishing effort, (2) fishing boat productivity, (3) composi-tion of species caught, (4) the average annual income per fisher household, (5) types of business
conducted by fisher household, (6) the frequency of violation (number of cases per year).
References
Badrudin, M., S. Budihardjo and M.D. Pawarti. 1997. The potential of demersal resources in Indonesian waters. In S. C. Venema, ed. Report on the INDONESIA/FAO/DANIDA Workshop on the Assessment of the Potential of the Marine Fishery Resources of Indonesia held in Jakarta, Indonesia, 13 - 24 March 1995. FAO (FI:GCP/INT/575/DEN), Rome, Italy.
Bailey, C. 1987. Marine fisheries management and development: policies and programs, p. 89 - 102. In C. Bailey, et al. (eds.) Indonesian marine capture fisheries. ICLARM Studies and Reviews 10.
Bailey, C., and A. Dwiponggo. 1987. Indonesian marine fisheries: Structure and change, p. 64 - 88. In C. Bailey, et al. (eds.) Indonesian marine capture fisheries. ICLARM Studies and Reviews 10.
Borel-Best, M., B.W. Hoeksema, W. Moka, H. Moll, Suharsono and I.N. Sutarna. 1989. Recent scleractinian coral species collected during the Snellius-II Expedition in Eastern Indonesia. Netherlands Journal of Sea Research 23 (2) : 107 - 115.
Butcher, J.G. 1995. Extending the frontier: the marine fisheries of Southeast Asia since 1850, p. 19 - 28. In J. Roch et al. (eds.) Proceedings of Socioeconomics, Innovation and Management of the Java Sea Pelagic Fisheries (SOSEKIMA), 4 - 7 December 1995. Java Sea Pelagic Fishery Assessment Project, Jakarta.
CBS (Central Board of Statistics). 1998. Statistical Yearbook of Indonesia 1997 CBS, Jakarta.
Clucas, I.J. and J. Basmal. 1995. The precessing, distribution and marketing of small pelagic fish from three fishing ports in Central Java, Indonesia, p. 181-190. In J. Roch, et al. (eds.) Proceedings of Socioeconomics, Innovation and Management of the Java Sea Pelagic Fisheries (SOSEKIMA), 4 - 7 December 1995. Java Sea Pelagic Fishery Assessment Project, Jakarta.
DGF (Directorate General of Fisheries). 1997. Statistik perikanan Indonesia 1995 (Fisheries statistics of Indonesia 1995). DGF, Jakarta, Indonesia.
DGF (Directorate General of Fisheries). 1998. Statistik perikanan Indonesia 1996 (Fisheries statistics of Indonesia 1996). DGF, Jakarta.
830 WorldFish Center 831
DGF (Directorate General of Fisheries). 1999a. Statistik perikanan Indonesia 1997 (Fisheries statistics of Indonesia 1997). DGF, Jakarta.
DGF (Directorate General of Fisheries). 1999b. Program peningkatan ekspor hasil perikanan 2003 (A program to boost fisheries export 2003). DGF, Jakarta.
Dwiponggo, A. 1981. Review of the demersal resources and fisheries in the Java Sea. Contribution of the Demersal Fisheries Project No. 9. Special Report. Research Institute for Marine Fisheries, Jakarta.
Dwiponggo, A. 1987. Indonesian marine fisheries resources, p. 10 - 63. In C. Bailey, et al. (eds.) Indonesian marine capture fisheries. ICLARM Studies and Review 10.
Dwiponggo, A. 1988. Recovery of over-exploited demersal resource and growth of its fishery on the North Coast of Java. Indonesian Agricultural Research and Development Journal 10 (3) : 65 - 72.
Emery, K.O., E. Uchupi, J. Sunderland, H. Uktolseja and E.M. Young. 1972. Geological structure and some water characteristics of the Java Sea and adjacent continental shelf. United Nations ECAFE, CCOP Technical Bulletin 6 : 197 - 223.
FAO (Food and Agriculture Organisation). 1995. Code of Conduct for Responsible Fisheries FAO, Rome, Italy.
Losse, G.F. 1981. Final report on the Indonesian-German Demersal Fisheries Project 1973 - 79. Contribution of the Demersal Fisheries Project No. 8. Special Report. Research Institute for Marine Fisheries, Jakarta.
Moosa, M.K., R. Dahuri, M. Hutomo, I.S. Suwelo and S. Salim. 1996. Indonesian Country Study on Integrated Coastal and Marine Biodiversity Management. Ministry of State for Environment, Republic of Indonesia and Directorate for Nature Management, Kingdom of Norway.
NCSAMFR (National Commission on Stock Assessment of Marine Fisheries Resources). 1998. Potensi dan Penyebaran Sumberdaya Ikan Laut di Perairan Indonesia (Potency and distribution of the marine fishery resources in the Indonesian waters). Directorate General of Fisheries, Jakarta.
Nurhakim, S., B. Sadhotomo and M. Potier. 1994. Composite model on small pelagic resources, p. 145 - 153. In M. Potier and S. Nurhakim (eds.) Proceedings of the Seminar on Biology, Dynamic and Exploitation of Javanese Purse-seiners Fisheries (BIODYNEX). Agency for Agricultural Research and Development, Indonesia, ORSTOM and European Union.
OME-DF-IIS-DHA-MF (Office of the Minister of Environment. Department of Forestry. Indonesian Institute of Sciences. Department of Home Affairs and Mangrove Foundation). 1997. National Strategy for Mangrove Management in Indonesia.
Office of the Minister of Environment, Department of Forestry, Indonesian Institute of Sciences, Department of Home Affairs, and Mangrove Foundation.
Pauly, D., P. Martosubroto and J. Saeger. 1996. The Mutiara 4 surveys in the Java and southern South China Seas, November 1974 to July 1976, p. 47 - 54. In D. Pauly and P. Martosubroto (eds.) Baseline studies of biodiversity: the fish resources of Western Indonesia. ICLARM Studies and Reviews 23.
Pomeroy, R.S. and M.J. Williams. 1994. Fisheries Co-management and smallscale Fisheries: A Policy Brief. ICLARM, Manila.
Potier, M. and D. Petit. 1994. Fishing strategies and tactics in the Javanese seiners fisheries, p. 171 - 184. In M. Potier and S. Nurhakim (eds.) Proceedings of the Seminar on Biology, Dynamic and Exploitation of Javanese Purse-seiners Fisheries (BIODYNEX). Agency for Agricultural Research and Development, Indonesia, ORSTOM and European Union.
Priyono, B.E. 1999. Socioeconomics of demersal fishing in the northern part of Central Java. Working paper prepared for the ADB/ICLARM Project on Sustainable Management of Coastal Fish Stocks in Asia.
Purwanto. 1992. Rente ekonomi dan tingkat pengusahaan sumberdaya perikanan lemuru di perairan selat Bali (Economic rent and optimal utilisation of Indian-oil sardine fishery resources in the Bali strait). Jurnal Ekonomi Linkungan 1(3) : 28 - 39.
Purwanto. 1995. Pengusahaan Sumberdaya Perikanan sesuai GBHN 1993: Analisis Awal (Fishery resources management based on the Broad Guidelines of the State Policy of 1993: Preliminary analysis). Paper presented at the first Scientific Paper Competition of the Indonesian Students’ Association of Australia 11 March 1995, Melbourne, Australia.
Purwanto. 1999. A strategy of the development of sustainable shrimp culture industry in Indonesia. Paper presented in Annual International Conference and Exposition of the World Aquaculture Society, 26 April - 2 May 1999, Sydney, Australia. Purwanto, K.H. Nitimulyo and T. Jatileksono. 1988. Optimisasi ekonomi penangkapan udang di pantai selatan Jawa Tengah dan sekitarnya (The economic optimisation of the shrimp fishery in the South Coast of Central Java and Adjacent waters). Gadjah Mada University Graduate Research Publication 1(4) : 557 - 567.
Soedjadi. 1997. Analisis Manajemen Modern (Modern Management Analysis), Vol 2., Gunung Agung, Jakarta.
Soegiarto, D., B. Wahyudi, S.P. Hutagalung and Purwanto. 1997. Indonesia: A Study on Coasts and Earnings of Fishing Fleet. Director General of Fisheries, Jakarta.
832 WorldFish Center
Subagyo. 1998. Percepatan Pemasaran dan Ekspor Hasil Perikanan menghadapi Era Globalisasi dan Perdagangan Bebas serta Krisis Ekonomi Keuangan (Accelerating marketing and export of fishery products to anticipate globalisation and free trade era and economic crisis). A paper presented at the meeting for preparing policy and program of increasing export of fishery products, Directorate General of Fisheries, Jakarta.
Suharsono. 1998. Condition of coral reef resources in Indonesia. Indonesian Journal of Coastal and Marine Resources 1(2) : 44 - 52.
Surono, S. 1998. Posisi produksi dan Industri Pertanian Indonesia serta Antisipasi terhadap Era Globalisasi dan Perdagangan Bebas. (Position of Indonesian agricultural industry and products and anticipation of globalisation and free trade era and economic crisis). A paper presented at the meeting for preparing policy and program of increasing export of fishery products, Directorate General of Fisheries, Jakarta.
WB (The World Bank). 1998. Project Appraisal Document on a proposed loan in the amount of UD$6.9 million and a grant from the Global Environment Facility Trust Fund in the amount of SDR 3.1 million to the Republic Indonesia for a Coral Reef Rehabilitation and Management Project in support of the first phase of the Coral Reef Rehabilitation and Management Program. Rural Development and Natural Resources Sector Unit, the World Bank.
Wyrtki, K. 1961. Physical oceanography of the Southeast Asian waters. NAGA Report 2, 195p.


![Java morld cap2 [CURSO JAVA]](https://img.pdfslide.tips/doc/110x75/546d809aaf79595d298b5416/java-morld-cap2-curso-java.jpg)


![[OFICINA JAVA] - Conhecendo Java](https://img.pdfslide.tips/doc/110x75/559baf261a28ab6b358b4872/oficina-java-conhecendo-java.jpg)