Embed Size (px)
Citation preview
Structural Analysis of a Core Periphery Network: Co-
Authorship on Dengue
Ricardo Barros Sampaio1, Jorge Henrique Cabral Fernandes2, Brigitte Gay3
1Faculdade de Ci�ncia da Informa��o РUniversidade de Bras�lia (UnB) РCampus
Universit�rio Darcy Ribeiro Ð Edif�cio da Biblioteca Central, Entrada Leste Ð CEP:
70.919-970 Ð Bras�lia-DF Ð Brasil
1 Funda��o Oswaldo Cruz РDiretoria Regional de Bras�lia РAvenida L3 Norte, Campus
Universit�rio Darcy Ribeiro, Gleba A, SC 4 Ð CEP: 70910-900 Ð Bras�lia - DF Ð Brasil
2Universidade de Bras�lia (UnB) Ð Campus Universit�rio Darcy Ribeiro Ð Edif�cio da
Biblioteca Central, Entrada Leste Ð CEP: 70.919-970 Ð Bras�lia-DF Ð Brasil
3Toulouse Business School (TBS) - ESC Toulouse Ð 20 boulevard Lascrosses - BP 7010
- 31068 - Toulouse Ð France
[email protected], [email protected], [email protected]
Abstract. We find in the literature empirical results and models to explain the
growth of Small World and Scale Free networks but very little on Core
Periphery networks. The present work focuses on a co-authorship network
based on scientific publications for Dengue Fever, a so-called ÒNeglected
DiseaseÓ. We found that for this network the Core Periphery structure
presented resembles a crossover between Small World and Scale Free
networks, with a heterogeneous behavior of its authors. As a further result of
this research we demonstrate, based on the network cores, how the authors
divide themselves into groups and their influence over the network.
Resumo. A literatura apresenta uma s�rie de pesquisas e modelos que
explicam o crescimento de redes ÒSmall WorldÓ e ÒScale FreeÓ. No entanto,
pouco � discutido sobre redes ÒCore PeripheryÓ. O presente trabalho utiliza
uma rede de coautoria baseada em publica��es cient�ficas da Dengue,
conhecida como uma das doen�as ÒNegligenciadasÓ. Para esta rede foi
analisado o quanto que a estrutura ÒCore PeripheryÓ se assemelha a
estrutura de redes ÒSmall WorldÓ e ÒScale FreeÓ, demonstrando o
comportamento heterog�neo dos seus autores. Como resultado complementar
da pesquisa � apresentada, com base nas comunidades centrais, a forma como
os autores se dividem em grupos e a sua influencia na rede.
1. Introduction
The use of articles and research from journals and scientific databases has, for a long
time, been a good source of information for analysis on complex networks, providing an
overview on the patterns of collaboration within the academic community and its
authors. ÒCo-authorship of a paper can be seen as a documented form of collaboration
between two or more authors. These collaborations form a co-authorship network, in
which the network nodes represent authors, and the lines between the nodes the
collaboration of authors that have coauthored one or more papers together. The structure
��������������� ������ ��� ���� ��������� ���������������
��

of such networks turns out to reveal many interesting features of academic
communitiesÓ (M. E. J. Newman 2004).
In the past few years, co-authorship analysis has been applied in scientific
research and publications quite often and in many different fields. Some of the first
researchers on the area of complex network, such as Albert Barab�si and Mark J.
Newman have used co-authorship networks on their studies (Barabasi et al. 2002; M. E.
J. Newman 2004; M. E. J. Newman 2001), which provided a good basis for the work
been pursued today. In regards to the medical fields and specially on specific diseases
we have also encountered research applied with this type methodology and corpus
(Morel et al. 2009; Ramos, Gonzalez-Alcaide, e Bolanos-Pizarro 2013).
The use of complex network analysis methodologies have been often used to
find communities within research fields. The use of dynamic or temporal analysis is also
another area within co-authorship research where the analysis focuses on the network
structural change. In our study we have been looking on formation and maintenance of
relations within and between communities, taken into consideration the dynamics of the
network, in order to understand how positional control might come into place and why.
For our research the data defined for the analysis is based on research
publications for Dengue Fever (also know as Dengue), a disease contained in the so-
called neglected tropical diseases (NTD). The term NTD, which has been used since the
mid 1990s, has become a Òbrand-nameÓ referring to a group of diseases that are
especially endemic in low-income populations living in tropical and subtropical
countries (Ramos, Gonzalez-Alcaide, e Bolanos-Pizarro 2013). However, up to this
date, there are no clear or agreed definitions for what constitute a Neglected Disease.
Our intentions at this point with this research is to understand the structure of
such networks and how this structure and the influence of key actors might affect the
understanding of the network, with the possibility to aid or provide valuable information
for government agencies or public policies makers on regards to NTD research.
1.1. Network Structures
One of the issues been faced in statistical physics was to define new concepts and
measures to try to infer the structural properties of large empirical networks. ÒThe main
outcome has been the identification of a series of unifying principles and statistical
properties shared by most of the real-world networks examinedÓ (Gay 2012).
Real-world networks have been found to differ from the classical random graph
theory of Erd�s and R�nyi (1959), which carried statistical regularities not been
anticipated. For those networks, the small-world property (relatively short paths
between any two nodes and a large clustering coefficient) and scale-free degree profile
(power-law scaling for the probability distribution of the number of links at a node)
were a common structure. New models were developed to reproduce those structural
properties observed in real topologies. Networks with high clustering coefficient and
small average path length can be generated with an evolution by the small-world model
of Watts and Strogatz (1998), while networks with power-law degree distribution can be
generated with an evolution by the scale-free model of Barab�si and Albert (1999).
Another common but informal notion in social network analysis and other fields
is the concept of a core/periphery structure. The intuitive conception entails a dense,
��������������� ��������������������� ������������� ���������������
��
cohesive core and a sparse, unconnected periphery. According to Borgatti (2000) Òthe
notion of a Core Periphery network can be seen as a center with many cores and a
peripheral community that are connected to those different cores.Ó
1.2. Network Concepts
ÒA network can be seen in its simplest form as a collection of points, called nodes or
vertices, joined together in pairs by lines, called edgesÓ (M. Newman 2010). Networks
can be used to model systems where entities could be seen as the nodes and their
relations the edges on the network. In order to understand and analyze the network a
series of measures have been developed and some of the most common and widely used
is regarded as node centrality. Some of those measures are degree, betweenness and
eigenvector, which have been used on our study. The degree of a node is the number of
lines that are incident with it; betweenness is a measure of how nodes might influence
the interaction of other nodes on the network; Òeigenvector centrality gives each vertex
a score proportional to the sum of the scores of its neighbors, in a sense that as more
influential nodes a node has as its neighbors higher its own scoreÓ (Wasserman e Faust
1994; M. Newman 2010).
In regards to structure the concepts of cluster coefficient also know as
transitivity and average path length or geodesic distance play an important roll. There
are many types of relations on a network where the simplest is Òconnected by an edge.Ó
If the Òconnected by an edgeÓ relation were transitive it would mean that if vertex u is
connected to vertex v, and v is connected to w, then u is also connected to w. As for
geodesics itÕs definition implies the shortest path between two nodes and the average of
all the paths on a given network (Wasserman e Faust 1994; M. Newman 2010).
For last this study have made use of the concepts of k-core and community
detection as a form to understand the structure and its subdivisions. A k-core is a
subgraph in which each node is adjacent to at least a minimum number, k, of the other
nodes in the subgraph (M. Newman 2010). For community detection there is a concept
called modularity (M. Newman 2006) that measures how well a network is subdivided.
1.3. Methodology
The advance of technology has permitted a wider analysis of some networks especially
on large data sets. Analysis of data sets with tens or hundreds of thousands of vertices
and edges were not common and restricted to small groups of researchers. For the data
treatment we used the software Tetralogie and R programing language and for network
manipulation and visualization we used the package Igraph on R and Gephi.
Tetralogie allows users to conduct strategic analysis from heterogeneous textual
data through the use of conventional and innovative methods. Another feature of the
software is that it allows graphical visualization for understanding human activities and
their interactions as well as their evolution in a decision-making perspective (Gay e
Dousset 2006).
The R software is a free descriptive programming language and environment for
statistical computing and graphics. It allows the treatment and analysis of large data sets
including network analysis by the use of packages such as igraph and sna. Gephi is an
interactive visualization and exploration platform for all kinds of networks and complex
systems, dynamic and hierarchical graphs.
��������������� ������ ��� ���� ��������� ���������������
��

For the data collection we have used PubMed1 database, with a search
term/descriptor ÒdengueÓ for papers from 1981 to 2012 included. PubMed is a free
database accessing references and abstracts on life sciences and biomedical topics.
2. Data on Scientific publications
The research has been made taking into consideration authors of articles, countries
where those authors were from and journals used for the scientific publications. Data
files were retrieved from PubMed with the term/descriptor ÒdengueÓ for title and
abstract. The database was than converted into a co-authorship network taken into
consideration the authors and their co-appearances on the respective articles.
2.1. Statistical Data
The numbers concerning the research publications on Dengue has grown with the past
years as concerns with the NTDs have become more common. Countries that had many
cases of the diseases became key research players on this growth. Over the 30 years
span for this research the number of publications have jumped from 67 on 1981 to 1,053
publications on 2012. For the total number of publications we have retrieved 9,496
articles containing a total of 21,083 authors from 102 different countries. The number of
journals added up to 1,257, however only 309 of those had 5 or more articles in the area
and 175 journals had 10 or more publications. The most common journals retrieved
from the database and their respective number of publications on Dengue for the period
were: American Journal of Tropical Medicine and Hygiene with 506 publications;
Southeast Asian Journal of Tropical Medicine and Public Health (304); Journal of
Virology (282); PLOS Neglected Tropical Disease (192); Virology (180).
FIGURE 1 - WORLD MAP FOR PUBLICATIONS ON DENGUE(1981-2013)
As for the countries of authors on the research we have noticed a great change
on participation over the years. Some countries have been responsible for the research
for much of the period studied but others became key players as the time progressed.
Countries such as USA (3,386) and France (918) falls on the first category and
1 http://www.ncbi.nlm.nih.gov/pubmed accessed on october 2012
��������������� ��������������������� ������������� ���������������
��

emerging countries happen to be Brazil (1,911) , India (889) and Thailand(836). Those
were the top 5 countries in terms of number of publications and the respective numbers
in parenthesis. Figure 1 shows a world map for publications. The liter the color for the
country the greater the number of publications assigned to that country.
2.2. Network Data
Network information is important in the sense that it gives insights and helps clarify the
structure of the network, the main goal of our research. Because of the size of the
network, visualization at this point is meaningless once there is no clear understanding
of its positioning. One point we can make at this stage is that, using a centrality-based
distribution such as Frunchterman Reingold, there is a very dense center on the network
and a periphery of less connected vertices. Table 1 gives some of the information
regarding the network with a comparison over a random network based on Erd�s and
R�ny theory of random graphs.
TABLE 1. COMMUNITIES AND NODE DISTRIBUTION
Nodes on Main
Component
Edges on Main
Component
Mean Path
Length
Mean Path Length
Random Network
Cluster
Coefficient
Cluster Coefficient
Random Network
Values 18,023 119,148 4.85 4.06 0.38 0.00068
The first column on Table 1 shows the number of nodes on the main component
(biggest connected component) as 18,023 and the number of edges as 119,148. Those
numbers have been used to create a random network. The mean path length of the
network is similar to the random network denoting a possibility for small-world
structure. As for the Cluster Coefficient the network studied shows a much greater
score. This denotes how well connected a scientific collaboration network might be in
comparison to a random network.
The number of edges and its cluster coefficient implies a very dense network
with large number of connections amongst the different authors. The average degree
found is 13, which means that on average each author collaborates with 13 other
authors. The maximum degree for the network was 386.
3. Network Structure
The network structure defines how the interactions amongst the different actors might
occur and several conclusions can be drawn for the understanding of this structure in
regards to scientific research collaboration. In a heterogeneous behavior, some vertices
on the network will act in a very different way from the rest of the network, not in a
sense of an outlier but in log scale distribution. Networks on this form are called scale-
free once this is an attribute of a true log log distribution curve. Few vertices have a
very large number of connections and the majority of vertices have a very small number
of connections.
Many networks studied over the past years have been called scale-free but some
of those have not presented true evidences of its claims. According to a study on power-
law distribution (Clauset, Shalizi, e Newman 2009) half of the networks analyzed by
them failed to behave as such. On our research we have applied the algorithm of Clauset
��������������� ������ ��� ���� ��������� ���������������
�
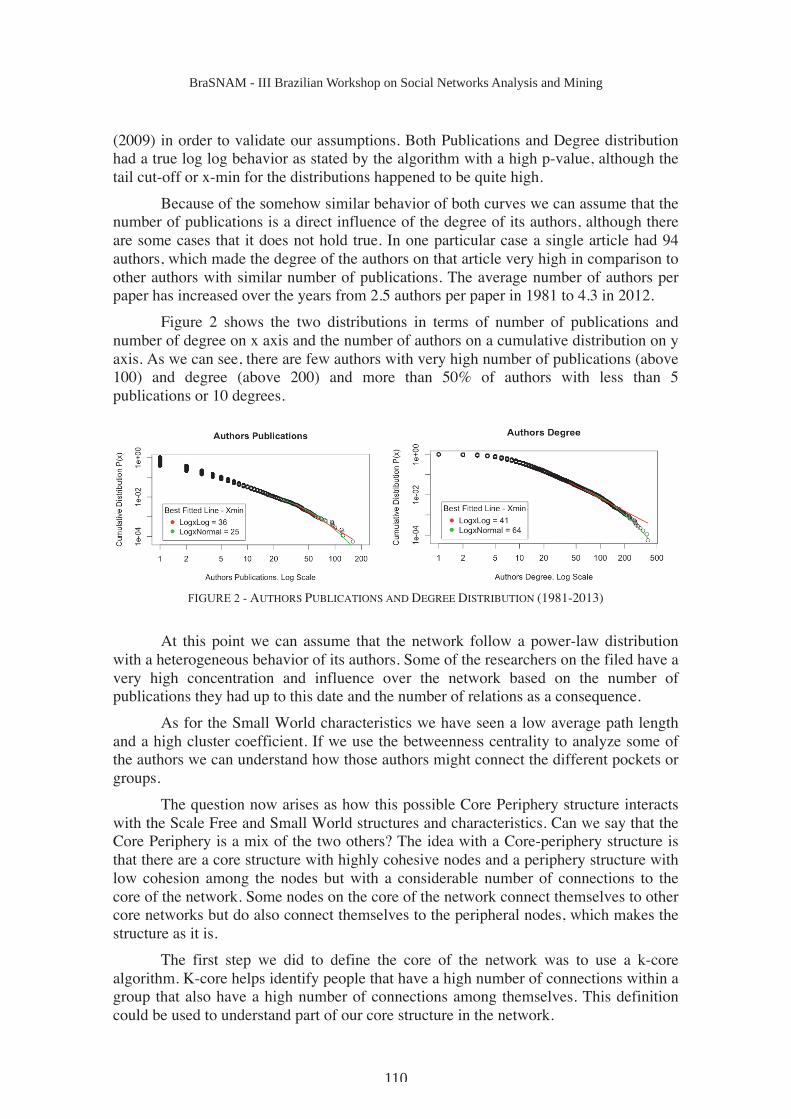
(2009) in order to validate our assumptions. Both Publications and Degree distribution
had a true log log behavior as stated by the algorithm with a high p-value, although the
tail cut-off or x-min for the distributions happened to be quite high.
Because of the somehow similar behavior of both curves we can assume that the
number of publications is a direct influence of the degree of its authors, although there
are some cases that it does not hold true. In one particular case a single article had 94
authors, which made the degree of the authors on that article very high in comparison to
other authors with similar number of publications. The average number of authors per
paper has increased over the years from 2.5 authors per paper in 1981 to 4.3 in 2012.
Figure 2 shows the two distributions in terms of number of publications and
number of degree on x axis and the number of authors on a cumulative distribution on y
axis. As we can see, there are few authors with very high number of publications (above
100) and degree (above 200) and more than 50% of authors with less than 5
publications or 10 degrees.
FIGURE 2 - AUTHORS PUBLICATIONS AND DEGREE DISTRIBUTION (1981-2013)
At this point we can assume that the network follow a power-law distribution
with a heterogeneous behavior of its authors. Some of the researchers on the filed have a
very high concentration and influence over the network based on the number of
publications they had up to this date and the number of relations as a consequence.
As for the Small World characteristics we have seen a low average path length
and a high cluster coefficient. If we use the betweenness centrality to analyze some of
the authors we can understand how those authors might connect the different pockets or
groups.
The question now arises as how this possible Core Periphery structure interacts
with the Scale Free and Small World structures and characteristics. Can we say that the
Core Periphery is a mix of the two others? The idea with a Core-periphery structure is
that there are a core structure with highly cohesive nodes and a periphery structure with
low cohesion among the nodes but with a considerable number of connections to the
core of the network. Some nodes on the core of the network connect themselves to other
core networks but do also connect themselves to the peripheral nodes, which makes the
structure as it is.
The first step we did to define the core of the network was to use a k-core
algorithm. K-core helps identify people that have a high number of connections within a
group that also have a high number of connections among themselves. This definition
could be used to understand part of our core structure in the network.
��������������� ��������������������� ������������� ���������������
��

4. Network Core and Communities
One important concept over the network analysis is the idea of a cohesive or core group.
An easy form to find this group is to make use of a k-core algorithm. In this way one
can understand how groups of people connect themselves with others that have similar
degrees. This definition is very adequate to the understanding of a core periphery
network, although it is not enough by itself.
For this research we have applied a filtering to find the k-core nodes that would
help explain a core periphery structure and control. At first we filtered all the nodes that
have only one publication to avoid the problem of getting authors that only published
once but with many co-authors in the same article. Second we used the software to find
the k-core levels close to 10% and 1% of the nodes on the network but in the last case
with the concern that it would not disrupt or disconnect the clusters entirely. The k-
cores and number of nodes were k-core 5 with 1,820 authors, approximately 10% of the
network, and k-core 20 with 279 authors representing 1.55% of the network.
Another important concept for our analysis is the idea of network clusterization
or modularization. How should we separate groups within a network based on their
connections with other nodes? Many studies have been made in regards to the division
of networks by algorithms and we have decided to use the latest NewmanÕs leading
eigenvector algorithm (M. E. J. Newman 2006) implemented on R by Igraph package.
The decision was made based on the possibility of application on large size networks,
not possible for other algorithms with the same level of modularity. The idea of the
algorithm is to break the network into groups based on their eigenvector values where a
node would become the leading eigenvector for a particular group and other nodes on
the network with similar eigenvector values would fall on the same group.
After applying the algorithm to the network we were able to get 22 communities
with its sizes shown on Table 2. Within each community we analyzed how the nodes on
k-core 5 and nodes on k-core 20 were distributed within the communities.
TABLE 2. COMMUNITIES AND NODE DISTRIBUTION
Node Distribution within Communities
Community # Nodes K-core
5
K-core
20 Community # Nodes
K-core
5
K-core
20
1 2488 371 95 12 381 40 8
2 348 45 19 13 59 0 0
3 3736 431 62 14 401 42 1
4 350 53 7 15 727 55 21
5 6127 355 0 16 132 11 5
6 1207 188 47 17 83 12 0
7 161 26 0 18 68 9 0
8 278 34 1 19 13 1 0
9 251 22 1 20 9 0 0
10 482 37 3 21 85 19 0
11 618 68 9 22 19 1 0
As the first analysis of the communities we can see that the division is not
regular in terms of size, with community 5 with 6,127 nodes and community 20 with 9
nodes for the two high and low extremes. It is important at this point to understand how
the algorithm behaves in terms of eigenvector centrality. Because the highest
��������������� ������ ��� ���� ��������� ���������������
���

eigenvector values found are appointed to the primary groups, some authors on
communities 1 through 4 might have a higher importance than those authors on
community 5 as we will see later on. If we follow this concept one can see that on k-
core 20 there are no authors on community 5, which implies that these community,
although has a great number of nodes, those nodes do not carry a great significance in
terms of degree.
The second step on the analysis is the distribution of nodes within the
communities at the k-core level. What we aim to see is how the k-core behaves in terms
of distribution within each community once there is a clear differentiation of sizes. Do
some communities carry a greater number of important, or higher k-core, authors or not.
We found that the distribution of k-core nodes in the communities follows the same
percentage as the entire network, close to 10% for k-core 5 and close to 1.5% for k-core
20. This means that for each community, independent of its size, the number of authors
belonging to k-core 5 is approximately 10% varying between 8% and 12% on average
with higher percentages for communities 1, 4, 6 and 7 but not more than 16%. This
implies that the algorithm, based on eigenvector centrality, do not discriminate the
communities in terms of degrees. If we check the distribution with k-core 20 that has
only 279 authors, the average of 1,55 % remains very close with communities 1, 2 and 6
with higher percentages and some communities without any author at this level, such as
community 5, 7, 13 and 17 to 20.
The distribution of the k-core nodes happened to be a very interesting one. If we
think in terms of research groups we could understand how they come to be formed.
Some researchers, as head of research groups, hold a greater number of publications and
degrees, but their group of people, divided by the algorithm, does not put them together
with other authors just based on the degree.
5. Relations and Control
The last attempt of our study was to understand how those core groups, defined by the
k-core algorithm, relate themselves to the rest of the network. Going back to the
definition of a core periphery network, a node to be considered core must have a high
number of connections with nodes at the same level, found by the k-core, and
connections with the rest of the network as seen by the division of the groups, or the
periphery on other groups.
Applying a one level node neighborhood we could find how many connections
or degree each author has. We used the same concept for all the nodes in each k-core
and subtracted the repeated nodeÕ neighbors to find the level of influence for each of the
k-cores. For the k-core 5 we found that with only 10% of the nodes (1820) that level
could influence or connect themselves to more than 82% of the network. For the k-core
20 the 279 authors, or 1.55% of the network, had a direct influence over almost 37% of
the network. If we take into consideration that close to 50% of the network has fewer
than 5 publications we could assume that a very few group of authors might have
influenced the entire field over 3 decades.
What we have found up to now is that the network divides itself into groups that
are not related to degree centrality but to eigenvector centrality. We also have found that
a very few number of authors have influence over a great portion of the network. But
how are those nodes, divided into groups, related to themselves? In order to answer
��������������� ��������������������� ������������� ���������������
���

these question we have draw a network of communities and their relations. The idea
was to understand the influence of the communities, their exchange or relations and the
structures in regards to the core periphery characteristics.
Figure 3 shows the network of community relations. The size of each node is a
proportional relation to the number of nodes on each community, normalized in order to
be able to see all the communities. The size of the links is a direct proportion of the
number of relations between each community. The number on each node is the
respective community number that could be compared to Table 2. For the distribution it
was applied the Fruchterman Reingold algorithm. The communities with less
importance or size were mostly drawn on its periphery while the most important
communities stayed at the center of the graph.
An important analysis of Figure 3 is the number of connections coming from
community 1 and to which communities it most connects itself. If we relate this
information with the number of k-cores 5 and 20 nodes we could understand the reason
for this great exchange.
FIGURE 3 - NETWORK COMMUNITY RELATIONS
With this analysis we could conclude our assumption on a core periphery
network. Within each community, there is a regular distribution of high degree nodes
that holds the community together. Those high degree nodes connect themselves to
lower degree nodes within each community. Between the communities there are a high
number of relations, as seen on Figure 3, which enforces the idea of a small world
attribute with few high betweenness score authors. There are also smaller communities
that do not carry many high degree authors. Nevertheless, those smaller communities
still well connected over the network defining its periphery.
��������������� ������ ��� ���� ��������� ���������������
���

6. Conclusions
For this research we have tried to understand the structural behavior of a scientific
collaboration network based on a specific field, Dengue. We have found a clear core
periphery structure with many central communities on the network that relate
themselves to the periphery but also to other central communities and authors. Those
communities were well distributed and the authors within those communities played an
important roll in maintaining the network together with its distributed relations.
We have also found that this network carry characteristics of Scale Free
networks once we have applied techniques to confirm its distribution and behavior.
Over the scientific field there are few very well connected researchers that somehow
controls the relations with the rest of the network. With the assumption of Small World
attributes such as small short path lengths, high clustering coefficients and communities
connecting themselves with important nodes relations we confirm all three network
structures implying a possibility of interlayer characteristics among those structures.
As for the field we could conclude that it is very cohesive, as a scientific field
should be, but is also well controlled by few authors on the network. Further studies on
the structure could help understand how knowledge is distributed or dispersed in the
network and how innovation, if any, happens on the network and where, on the core or
on the periphery.
7. References
Barabasi, A. L., H. Jeong, Z. Neda, E. Ravasz, A. Schubert, e T. Vicsek. 2002.
ÒEvolution of the social network of scientific collaborationsÓ. Physica A:
Statistical Mechanics and its Applications 311 (3-4): 590Ð614.
doi:10.1016/S0378-4371(02)00736-7.
Barab�si, Albert-L�szl�, e R�ka Albert. 1999. ÒEmergence of Scaling in Random
NetworksÓ. Science 286 (5439): 509Ð12. doi:10.1126/science.286.5439.509.
Borgatti, Stephen P, e Martin G Everett. 2000. ÒModels of core/periphery structuresÓ.
Social Networks 21 (4): 375Ð95. doi:10.1016/S0378-8733(99)00019-2.
Clauset, Aaron, Cosma Rohilla Shalizi, e M. E. J. Newman. 2009. ÒPower-law
distributions in empirical dataÓ. SIAM Review 51 (4): 661Ð703.
doi:10.1137/070710111.
Erd�s, P., e A. R�nyi. 1959. ÒOn random graphsÓ. Publicationes Mathematicae 6: 290Ð
97.
Gay, Brigitte. 2012. ÒUniversal Dynamics Onf Complex Networks, Really?Ó In Social
Network Mining, Analysis, and Research Trends: Techniques and Applications.
Gay, Brigitte, e Bernard Dousset. 2006. ÒCartographie de r�seaux dÕalliances et analyse
strat�giqueÓ. Ing�nierie des syst�mes dÕinformation 11 (2): 37Ð51.
doi:10.3166/isi.11.2.37-51.
Morel, Carlos Medicis, Suzanne Jacob Serruya, Gerson Oliveira Penna, e Reinaldo
Guimar�es. 2009. ÒCo-authorship Network Analysis: A Powerful Tool for
Strategic Planning of Research, Development and Capacity Building Programs
��������������� ��������������������� ������������� ���������������
���

on Neglected DiseasesÓ. PLoS Negl Trop Dis 3 (8): e501.
doi:10.1371/journal.pntd.0000501.
Newman, M. E. J. 2001. ÒThe structure of scientific collaboration networksÓ.
Proceedings of the National Academy of Sciences of the United States of
America 98 (2): 404Ð9.
Newman. 2004. ÒCoauthorship networks and patterns of scientific collaborationÓ.
Proceedings of the National Academy of Sciences 101 (suppl_1): 5200Ð5205.
doi:10.1073/pnas.0307545100.
Newman. 2006. ÒModularity and community structure in networksÓ. Proceedings of the
National Academy of Sciences of the United States of America 103 (23): 8577Ð
82. doi:10.1073/pnas.0601602103.
Newman, Mark. 2010. Networks: An Introduction. 1o ed. Oxford University Press,
USA.
Ramos, Jose M, Gregorio Gonzalez-Alcaide, e Maxima Bolanos-Pizarro. 2013.
ÒBibliometric analysis of leishmaniasis research in Medline (1945-2010)Ó.
Parasites & Vectors 6 (mar�o): 55. doi:10.1186/1756-3305-6-55.
Wasserman, Stanley, e Katherine Faust. 1994. Social Network Analysis: Methods and
Applications. 1o ed. Cambridge University Press.
Watts, Duncan J., e Steven H. Strogatz. 1998. ÒCollective dynamics of `small-worldÕ
networksÓ. Nature 393 (junho): 440Ð42. doi:10.1038/30918.
��������������� ������ ��� ���� ��������� ���������������
���