Embed Size (px)
Citation preview

STRUKTUR PERMODALAN
1

Struktur Permodalan
Bagaimana kita ingin mendanai perusahaan?
UtangSaham PreferensSaham Biasa

Mengapa Struktur Permodalan Penting?
• 1) Leverage: pada tingkat imbalan investasi sama, makin tinggi penggunaan utang makin tinggi imbalan pemegang saham, tetapi berisiko lebih tinggi dalam hal pembayaran bunga.
• 2) Biaya Modal: setiap sumber dana membebankan biaya berbeda, maka struktur permodalan mempengaruhi biaya modal.
• Struktur Modal Optimal: adalah komposisi yang meminimumkan biaya modal dan memaksimumkan nilai perusahaan.
3

Hipotesis
• Oleh karena nilai perusahaan didefinisikan sebagai penjumlahan nilai utang dan modal perusahaan, atau
• V = B + S
4
Nilai Perusahaan, V
S B
Jika tujuan keuangan perusahaan adalah memaksimumkan nilai perusahaan, maka perusahaan harus memilih rasio utang/modal yang memaksimumkan besar “kue” perusahaan.

Utang, Laba dan Imbalan
CurrentAktiva $20,000Utang $0Modal $20,000Rasio Utang/Modal 0.00Suku bunga n/aSaham beredar 400Harga per lembar $50
5
Usulan
$20,000
$8,000
$12,000
2/3
8%
240
$50
Misalkan suatu perusahaan tak berutang mempertimbangkan untuk berutang

EPS dan ROE dibawah Struktur Modal Sekarang
Recession Normal BoomingEBIT $1,000 $2,000 $3,000Interest 0 0 0Net income $1,000 $2,000 $3,000EPS $2.50 $5.00 $7.50ROA 5% 10% 15%ROE 5% 10% 15%
Current Shares Outstanding = 400 shares
6

EPS dan ROE dibawah Struktur Modal Usulan
Recession Normal BoomingEBIT $1,000 $2,000 $3,000Interest 640 640 640Net income $360 $1,360 $2,360EPS $1.50 $5.67 $9.83ROA 5% 10% 15%ROE 3% 11% 20%
Proposed Shares Outstanding = 240 shares
7

Perbandingan EPS and ROE
LeveredRecession Normal Booming
EBIT $1,000 $2,000 $3,000Interest 640 640 640Net income $360 $1,360 $2,360EPS $1.50 $5.67 $9.83ROA 5% 10% 15%ROE 3% 11% 20%
Proposed Shares Outstanding = 240 shares8
All-EquityRecession Normal Booming
EBIT $1,000 $2,000 $3,000Interest 0 0 0Net income $1,000 $2,000 $3,000EPS $2.50 $5.00 $7.50ROA 5% 10% 15%ROE 5% 10% 15%Current Shares Outstanding = 400 shares

Tingkat Utang dan EPS
9
(2.00)
0.00
2.00
4.00
6.00
8.00
10.00
12.00
1,000 2,000 3,000
EP
S
Debt
No Debt
Break-even point
EBI in dollars, no taxes
Advantage to debt
Disadvantage to debt EBIT

Model Modigliani-Miller: Asumsi
• Homogeneous Expectations• Homogeneous Business Risk Classes• Perpetual Cash Flows• Perfect Capital Markets:
– Perfect competition– Firms and investors can borrow/lend at the same rate– Equal access to all relevant information– No transaction costs– No taxes
10

The MM Propositions I & II (No Taxes)• Proposition I
– Firm value is not affected by leverageVL = VU
• Proposition II– Leverage increases the risk and return to stockholders
rs = r0 + (B / SL) (r0 - rB)rB is the interest rate (cost of debt)
rs is the return on (levered) equity (cost of equity)
r0 is the return on unlevered equity (cost of capital)
B is the value of debtSL is the value of levered equity
11

The MM Proposition I (No Taxes)
12UL VV
BrEBIT Breceive firm levered ain rsShareholde
BrB
receive sBondholderThe derivation is straightforward:
BrBrEBIT BB )(
is rsstakeholde all toflowcash total theThus,
The present value of this stream of cash flows is VL
EBITBrBrEBIT BB )(
Clearly
The present value of this stream of cash flows is VU

The MM Proposition II (No Taxes)
13
The derivation is straightforward:
SBWACC rSB
Sr
SB
Br
0set Then rrWACC
0rrSB
Sr
SB
BSB
S
SB by sidesboth multiply
0rS
SBr
SB
S
S
SBr
SB
B
S
SBSB
0rS
SBrr
S
BSB
00 rrS
Brr
S
BSB )( 00 BS rr
S
Brr

The Cost of Equity, the Cost of Debt, and the Weighted Average Cost of Capital: MM Proposition II
with No Corporate Taxes
14
Debt-to-equity Ratio
Cos
t of
capi
tal:
r (%
)
r0
rB
SBWACC rSB
Sr
SB
Br
)( 00 BL
S rrS
Brr
rB
S
B

15
L = B/S Equity WACC
0.00 9.00 9.00
Assume rAssume rassetsassets is 9% and the cost of debt be is 9% and the cost of debt be 6%.6%.
ContohContoh

16
Cost of
L = B/S Equity WACC
0.00 9.00 9.000.50 10.50 9.00
Assume rAssume rassetsassets is 9% and the cost of debt be is 9% and the cost of debt be 6%.6%.
ExampleExample

IT’S IRRELEVANT
17
Cost of
L = B/S Equity WACC
0.00 9.00 9.000.50 10.50 9.001.00 12.00 9.001.50 13.50 9.002.00 15.00 9.003.00 18.00 9.00
Assume rAssume rassetsassets is 9% and the cost of debt be is 9% and the cost of debt be 6%.6%.
With no taxes the WACC is the same With no taxes the WACC is the same regardless of leverage. Since we assumed regardless of leverage. Since we assumed that operating cash flows were also that operating cash flows were also unaffected, firm value is unaffected by unaffected, firm value is unaffected by leverageleverage
ExampleExample
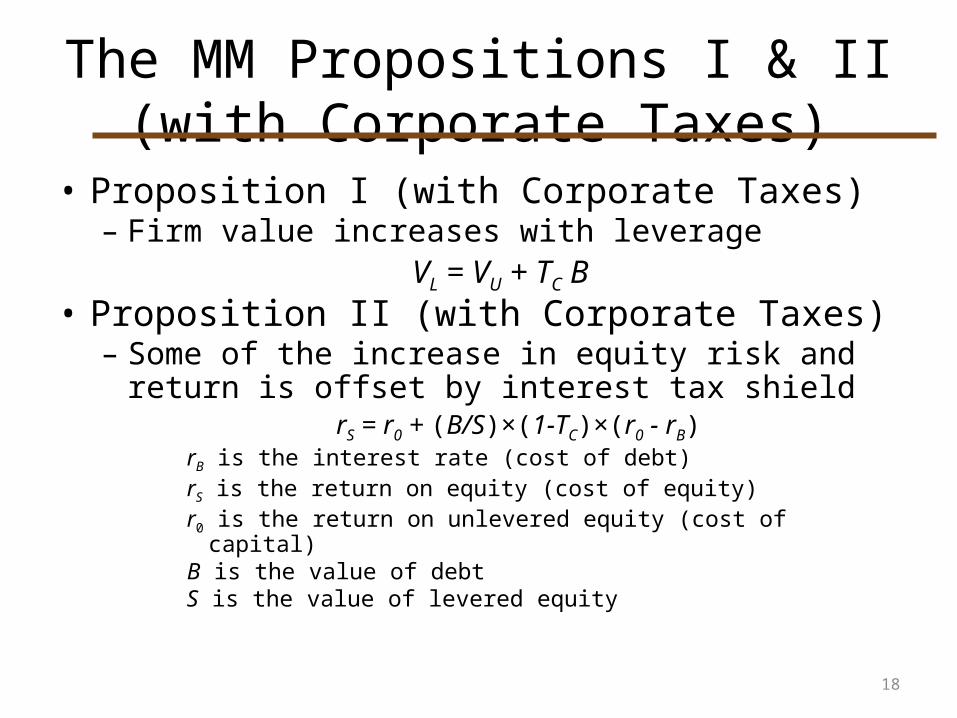
The MM Propositions I & II (with Corporate Taxes)
• Proposition I (with Corporate Taxes)– Firm value increases with leverage
VL = VU + TC B• Proposition II (with Corporate Taxes)
– Some of the increase in equity risk and return is offset by interest tax shield
rS = r0 + (B/S)×(1-TC)×(r0 - rB) rB is the interest rate (cost of debt)rS is the return on equity (cost of equity)r0 is the return on unlevered equity (cost of capital)B is the value of debtS is the value of levered equity
18

The MM Proposition I (Corp. Taxes)
19BTVV CUL
)1()(
receive firm levered ain rsShareholde
CB TBrEBIT BrB
receive sBondholder
BrTBrEBIT BCB )1()(
is rsstakeholde all toflowcash total theThus,
The present value of this stream of cash flows is VL
BrTBrEBIT BCB )1()(Clearly
The present value of the first term is VU
The present value of the second term is TCB
BrTBrTEBIT BCBC )1()1(
BrBTrBrTEBIT BCBBC )1(

The MM Proposition II (Corp. Taxes)
20
Start with M&M Proposition I with taxes:
)()1( 00 BCS rrTS
Brr
BTVV CUL
Since BSVL
The cash flows from each side of the balance sheet must equal:
BCUBS BrTrVBrSr 0
BrTrTBSBrSr BCCBS 0)]1([
Divide both sides by S
BCCBS rTS
BrT
S
Br
S
Br 0)]1(1[
BTVBS CU
)1( CU TBSV
Which quickly reduces to

The Effect of Financial Leverage on the Cost of Debt and Equity Capital
21
Debt-to-equityratio (B/S)
Cost of capital: r(%)
r0
rB
)()1( 00 BCL
S rrTS
Brr
SL
LCB
LWACC r
SB
STr
SB
Br
)1(

Total Cash Flow to Investors Under Each Capital Structure with Corp. Taxes
22
Perusahaan berutang membayar pajak kurang dibandingkan dengan perusahaan tak berutang.
Akibatnya, jumlah nilai utang dan modal perusahaan berutang menjadi lebih besar daripada tak berutang.
S G S G
B
All-equity firm Levered firm

Summary: No Taxes• In a world of no taxes, the value of the firm is unaffected
by capital structure. • This is M&M Proposition I:
VL = VU
• Prop I holds because shareholders can achieve any pattern of payouts they desire with homemade leverage.
• In a world of no taxes, M&M Proposition II states that leverage increases the risk and return to stockholders
23
)( 00 BL
S rrS
Brr

Summary: Taxes• In a world of taxes, but no bankruptcy costs, the value of
the firm increases with leverage. • This is M&M Proposition I:
VL = VU + TC B• Prop I holds because shareholders can achieve any
pattern of payouts they desire with homemade leverage.
• In a world of taxes, M&M Proposition II states that leverage increases the risk and return to stockholders.
24
)()1( 00 BCL
S rrTS
Brr

Bankruptcy Costs
• So far, we have seen M&M suggest that financial leverage does not matter, or imply that taxes cause the optimal financial structure to be 100% debt.
• In the real world, most executives do not like a capital structure of 100% debt because that is a state known as “bankruptcy”.
• We will introduce the notion of a limit on the use of debt: financial distress.
25

Review: Benefits of debt• Tax advantage
– According to MM, the company should have as much debt as possible
• Disciplining device– If a company has a lot of cash, its managers become
complacent. They might start making wrong investment decisions and divert cash flows to their own benefits
• Should companies have near 100% of debt?– Of course NO!– Debt has its own costs! These costs depend on the
amount of debt
26

Costs of debt• Direct Costs
– Legal and administrative costs (tend to be a small percentage of firm value)
• Indirect Costs– Impaired ability to conduct business (e.g., lost sales)– Agency Costs
• Selfish strategy 1: Incentive to take large risks• Selfish strategy 2: Incentive toward underinvestment• Selfish Strategy 3: Milking the property
27

Agency theory
• An agency relationship exists whenever a principal hires an agent to act on their behalf
• Within a corporation, agency relationships exist between:– Shareholders and managers– Shareholders and creditors
28

Shareholders versus managers
• Managers are naturally inclined to act in their own best interests
• But the following factors affect managerial behavior:– Managerial compensation plans– Direct intervention by shareholders– The threat of firing– The threat of takeover
• As a managers’ disciplining device debt is good!
29

Shareholders versus creditors
• Shareholders (through managers) could take actions to maximize stock price that are detrimental to creditors
• Creditors take this into account, when lending money
• Therefore, In the long run, such actions will raise the cost of debt and ultimately lower stock price
30

Capital structure and agency costs• Distortions in investment strategies due to
shareholders/debtholders conflict– Debt overhang problem:
• Pre-existing debt distorts the payoff from a new project to shareholders
• Results in underinvestment, because existing debt precludes from undertaking a good project)
– Asset substitution problem• Results in investment into too risky projects
– Shortsighted investment– Reluctance to liquidate when liquidation is
optimal
31

Agency cost of debt
• Debtholders know about shareholders opportunistic behavior
• They require higher interest rate• Positive NPV projects are not undertaken -
this is called the “agency cost of debt”• Possible remedy - convertible debt
– Convertible debt gives creditors the right to convert debt into shares to reap the benefits from a good outcome
32

Mitigating incentive problems
• Covenants• Issuing more short-term than long-term
debt– Potential problem - higher exposure to interest
rate risk
• Use of convertible bonds• Giving right incentives to the managers
33

34
Value of Stock
0 D1 D2
D/V
MM result
Actual
No leverage

Cost of capital and EPS
35
%
15
0 .25 .75.50 D/V
ks
WACCkd(1 – T)
$
D/V.25 .50
P0
EPS
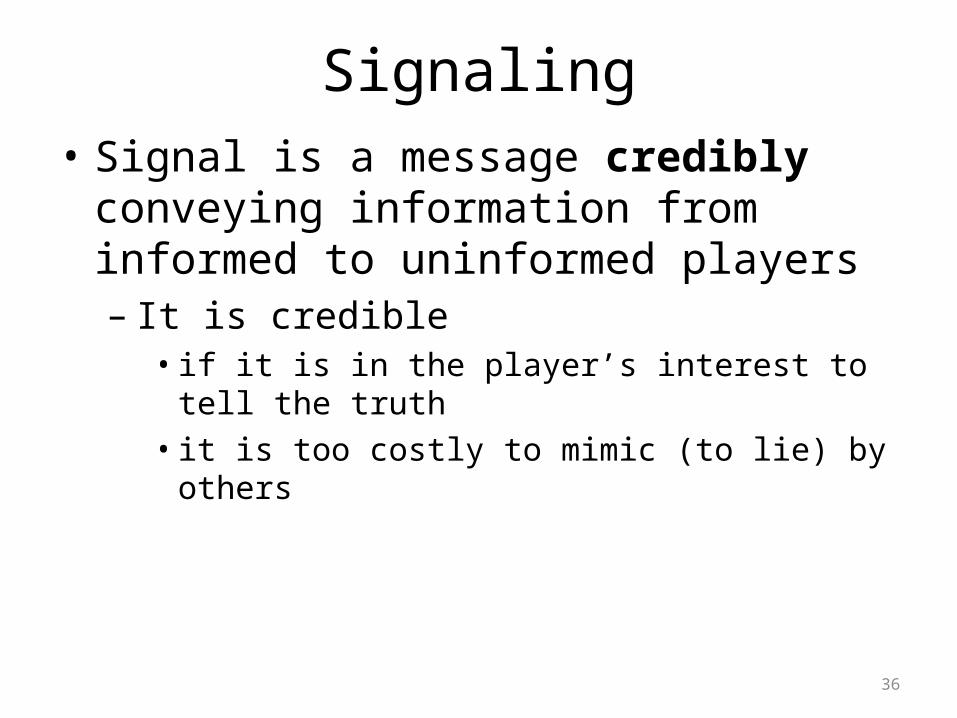
Signaling• Signal is a message credibly conveying
information from informed to uninformed players– It is credible
• if it is in the player’s interest to tell the truth• it is too costly to mimic (to lie) by others
36

Capital structure and signaling • Assumptions:
• Managers have better information about a firm’s long-run value than outside investors
• Managers act in the best interests of current stockholders
• Managers can be expected to:– Issue stock if they think stock is overvalued– Issue debt if they think stock is undervalued– As a result, investors view a common stock
offering as a negative signal -- managers think stock is overvalued
37

Capital structure and signaling (2)
• Signaling theory, suggests firms should use less debt than MM suggest
• This unused debt capacity helps avoid stock sales, which depress P0 because of signaling effects
38

The Pecking-Order Theory• Theory stating that firms prefer to issue
debt rather than equity if internal finance is insufficient– Rule 1: Use internal financing first– Rule 2: Issue debt next, equity last
• According to the pecking-order theory:– There is no target D/E ratio– Profitable firms use less debt (they use self-
financing instead)– Companies like financial slack
39

How Firms Establish Capital Structure?
• Most corporations have low D/V Ratios• Changes in leverage affect firm Value
– Stock price increases with increases in leverage and vice-versa; this is consistent with M&M with taxes
– Another interpretation is that firms signal good news when they lever up
• Capital structure varies across Industries• There is some evidence that firms behave as if
they had a target D/E ratio40

Factors in Target D/E Ratio• Taxes
– If corporate tax rates are higher than bondholder tax rates, there is an advantage to debt
• Types of assets– The costs of financial distress depend on the types of
assets the firm has• Uncertainty of operating Income
– Even without debt, firms with uncertain operating income have high probability of experiencing financial distress
• Pecking order and financial slack– Theory stating that firms prefer to issue debt rather
than equity if internal finance is insufficient
41

Long-term debt ratios (D/V) forselected industries
42
Industry Book MarketPharmaceuticals 27.4% 7.34%Computers 24.75% 7.46%Steel 32.88% 14.61%Aerospace 46.32% 23.25%Airlines 71.88% 32.86%Electr. Utilities 61.74% 47.71%Auto & Truck 81.52% 65.51%Internet 18.57% 2.18%Educational services 12.97% 2.24%
Source: Bloomberg, January 2005 (collected by Aswath Damodaran (NYU))

Summary and Conclusions• Costs of financial distress cause firms to restrain
their issuance of debt– Direct costs
• Lawyers’ and accountants’ fees– Indirect Costs
• Impaired ability to conduct business• Incentives to take on risky projects• Incentives to underinvest• Incentive to milk the property
• Three techniques to reduce these costs are:– Protective covenants– Repurchase of debt prior to bankruptcy– Consolidation of debt
43

Summary and Conclusions• Because costs of financial distress can be
reduced but not eliminated, firms will not finance entirely with debt
44
Debt (B)
Value of firm (V)
0
Present value of taxshield on debt
Present value offinancial distress costs
Value of firm underMM with corporatetaxes and debt
VL = VU + TCB
V = Actual value of firm
VU = Value of firm with no debt
B*
Maximumfirm value
Optimal amount of debt

Summary and Conclusions• If distributions to equity holders are taxed at a lower effective
personal tax rate than interest, the tax advantage to debt at the corporate level is partially offset. In fact, the corporate advantage to debt is eliminated if (1-TC) × (1-TS) = (1-TB)
45
Debt (B)
Value of firm (V)
0
Present value of taxshield on debt
Present value offinancial distress costs
Value of firm underMM with corporatetaxes and debt
VL = VU + TCB
V = Actual value of firm
VU = Value of firm with no debt
B*
Maximumfirm value
Optimal amount of debt
VL < VU + TCB when TS < TB but (1-TB) > (1-TC)×(1-TS)
Agency Cost of Equity Agency Cost of Debt