Embed Size (px)
Citation preview
DISSERTAITONES PHYSICAE UNIVERSITATIS TARTUENSIS
16
«.Я?
STUDIES OF CRYSTALLINE CELLULOSES USING POTENTIAL ENERGY
CALCULATIONS
Ph. D. Thesis
by
Alvo Aabloo
TARTU 1994

DISSERTATIONES PHYSICAE UNIVERSITATIS TARTUENSIS
16
STUDIES OF CRYSTALLINE CELLULOSES USING POTENTIAL ENERGY
CALCULATIONS
Ph. D. Thesis
by
Alvo Aabloo
TARTU 1994

The study has been performed in University of Tartu, Institute of Experimental
Physics and Technology, Tartu, Estonia.
Supervisors: Raik-Hiio Mikelsaar, Dr. Sei.
Alexander I. Pertsin, Dr. Sei.
Official j;jponents: Arvi Freiberg, Dr. Sei. (Tartu)
Valery Poltev, Dr. Sei. (Puchchino)
Raivo Teeäär, Cand. Sei. (Tallinn)
The thesis w ill be defended on May 25, 1994 at 2 p. m. in Council Hall of
University of Tartu, Ülikooli 18, EE2400 Tartu, Estonia.
The author was born in 1965. He graduated from University of Tartu in 1989.
During 1989-1991 he worked as a junior research worker in Institute of
Experimental Physics and Technology of University of Tartu. During 1991 -1994 he
was a PhD student at the same institute.
The permanent address of the author is:
University of Tartu, Institute of Experimental Physics and Technology, Tähe 4
Street, EE2400 Tartu, Estonia
E-mail: [email protected]
© Alvo Aabloo, 1994
Secretary of the Council: A. Lushcik

Table of contents
1. Introduction1.1. Polysaccharides and cellulose as wide-spread biopolymers .... 41.2. Survey of crystalline structure crystallographic and modelling
methods of saccharides .... 61.2.1. Experimental m ethods..................................................................61.2.2. Theoretical methods of conformational analyses.....................7
2. Methods2.1. Molecular m odelling .... 92.2. Molecular mechanics and the minicrystal m ethod .....11
2.2.1. Molecular m echanics....................................................................112.2.2. Constructing of a minicrystal for M M 3............................... .... 12
2.3. Rigid-ring calculations - advantages and drawbacks .....132.4. An implementation of rigid-ring method in cellulose crystal
structure refinem ent ..... 162.4.1. A force f ie ld ...................................................................................162.4.2. X-ray refinem ent...........................................................................17
3. Results and discussion3.1. Rigid-ring calculations improvement with different glucose
rings and force fie ld s ............................................................................193.2. Potential energy calculations of the crystalline structure of
cellulose I .... 293.2.1. Initial conform ations.....................................................................293.2.2. Parallel models of cellulose 1 crystalline structure...................303.2.3. Antiparallel models of native celluloses....................................31
3.3. The full molecular mechanics (MM3) calculations of cellu loses .....33
3.3.1. Experimental...................................................................................333.3.2. Effect of the dielectric constant............................................ ...... 343.3.3. Energies of cellulose polym orphs...............................................35
3.4. Discussion over cellulose structure .....37
4. Conclusions4.1. M ethods .....384.2. Structure of cellu loses .... 40
Acknowledgements .....41References ..... 41List of publications...................................................................... ..... 45Tselluloosi kristalsete faaside struktuuri uurimine kasutadesenergeetilisi arvutusi ............... .....46

1. Introduction
1.1. Polysaccharides and cellulose as wide-spread
biopolymers
Saccharides are ubiquitous in nature. They occur in all forms of life and,
because of their unusual properties, present a unique source of chemicals.
Saccharides of living organisms and plants perform a great biological role. They
function as structural materials, energy reserves and adhesives. They appear to be
essential in the process of infection by certain pathogenic species.
Cellulose is chemically a poly-(1-*4)-/?-D- glucopyranose - [(C6H100 5)2]n. A
cellulose chain unit consists of two pyranose rings (see Figure 1). The level of
polymerization n is between 1000 and 10000,
depending on the sample's nature. It is one of the
most widely spread biopolymers in the world. A
native sample consists of an amorphous phase as
well of a crystal phase of cellulose. The latter is
made up of microcrystallites. These microcrystals
form fibres. This very complicated and dynamical
structure makes native cellulose samples extremely
flexible and strong. An investigation of the
structure of this widely spread polymer seems to be important. Notwithstanding
multitudinous researches carried out in the past decades, the exact structure of
cellulose crystals remains w ithout satisfactory explanation. Pure cellulose crystals
exist in various forms, named I to IV, depending on the nature of the sample.
Cellulose I, the native cellulose, has recently been recognized to occur as a
- 4 -
Figure 1. The pyranose ring.

compound of two polymorphs, I a and \ß. These polymorphs occur in different ratios
in different native cellulose samples. The most important industrial cellulose is
cellulose II, which forms during a mercerization process (treatment in 22% sodium
hydroxide) or at crystallization from solution. Cellulose III is the product of
celluloses I and II treatment with liquid ammonia. Cellulose IV results from
treatment in high temperature. Both phases III and IV have also tw o subclasses
depending on their parent structure12.
Computational methods used up to now for solving a structure of cellulose
crystals have been extremely tremendous3,4. They use too enormous computer
resources. It is possible to refine structures with more simple algorithms. These
methods will solve a structure even more precisely.
There have arisen different questions which require explanations. As the
parameters of unit cells of native cellulose phases have been recently recognized5,
the first aim of the present paper is to attempt to refine a structure of these
phases. A second interesting problem dealt w ith in this paper is the issue of
cellulose chains' direction in an unit cell. Cellulose II is considered to have an
antiparallel structure8. It is known from experimental data that cellulose la converts
into cellulose \ß during annealing78 and cellulose I into cellulose II during
mercerization. The question is, how the parallel cellulose I converts into the
antiparallel cellulose II; whether cellulose I has an antiparallel structure or whether
there exists another option.
- 5 -
2

1.2. Survey of crystalline structure crystallographic and
modelling methods of saccharides
1.2.1. Experimental methods
The crystal structure analyses are generally routine; to obtain a single crystal
of suitable quality may be a serious problem for the majority of saccharides. In fact,
the diffraction analyses of a crystalline polymer cannot be approached in the same
manner as a classical single crystal analyses. Because of the lack of diffraction
data, positions of atoms cannot be determined directly from intensity data. A model
analysis technique s>nould be applied to refine the minimized differences between
the experimental data and a calculated model. X-ray, electron diffraction and
infrared spectroscopy9 are the most powerful diffraction techniques. Recent
developments in solid state NMR spectroscopy, particularly the crossed polarization
magic angle spinning technique indicate that this could be a very vigorous method
to investigate solid state molecular conformations and environments for
saccharides10. The high resolution NMR spectroscopy has become the most
valuable physical implement for studying conformations of saccharides11 12 ,:i,
particularly in solution. Chemical shifts, coupling constants, NOE's (Nuclear
Overheimer Effect) and relaxation rates contain detailed information about the
conformational structure of saccharides in solution.
- 6 -

1.2.2. Theoretical methods of conformational analyses
There exist various approaches to theoretical conformational analysis. The
classification of these can be made in several ways. One of the possible methods
is shown1415 in Figure 1.
Direct methods are based on the calculations of total energy of an object
which is minimized w ith respect to all or to some of the structural parameters. In
indirect methods, on the other hand, conclusions are made on the basis of analyses
different experimental data. There are several ways to estimate the total energy of
structure in direct methods. Usually there are two or more schemes to estimate the
total energy in non-uniform methods. The total energy calculations are split into
different interactions. In general, there are different basis to estimate bonded and
- 7 -
Figure 2. Classification of theoretical methods of conformational analyses.
2*

non-bonded terms. Further, non-bonded interactions are divided into different
terms. In case of a uniform method there is only one scheme to calculate total
energy. This happens when applying quantum mechanical methods in which all
electrons or all valence electrons are used. They constitute a group of uniform
methods. With neglect of relativistic effects and within the scope of the
Born-Oppenheimer approximation, the exact wave function of the structure is
derived from the solutions of the Schoedinger equation16. Based on the
approximations used in solving the Schoedinger equation, the uniform methods can
be classified into tw o groups: ab in itio (non-empirical) and semiempirical. The ab
in itio calculations need huge computer resources. Only smaller acyclic and cyclic
molecules can be used as models for the structural segment studies of
saccharides17. Classical methods originate from vibrational spectroscopy. The
system is held together by forces which are described as potential functions of
structural features, e. g. bond lengths, etc. A more detailed description of
molecular mechanic methods will be given further.
There exists one mighty method of structure refinement. The latter is related
to non-uniform classical methods of structure refinement and is called molecular
dynamics18. It differs from other refinement implements in the sense that the aim
of this method is not to minimize the total energy of the system, but to follow the
dynamical state of the system. Naturally, the system moves towards its
equilibrium. By application of the simulation method of MD, a trajectory
(configurations a function of time) of the system can be generated by simultaneous
integration of Newton's equations of motion for all atoms (i = 1,2,...,N) in the
system
- 8 -
d 2r,(t) ,— m t F j ( t )
d t2 ' (1)

where the force affected on atom i w ith mass m( is derived from
- 9 -
6V(r,(t),r2(t)....rN(t)), ( ) ‘ (2 )
MD methods use a classical mechanical force field as a potential energy
term. It means that MD cannot be more precise than the applied force field. MD,
in comparison with the standard classical mechanical methods, is more powerful
because it does not calculate only a static potential force field but also includes
kinetic energy. The latter makes it possible to calculate dynamic states. The issue
of minor local minimas is being solved. At the same time the MD requires huge
computer facilities. MD is wide-spread in investigations of proteins, nuclein acids,
solvations etc. It is used in structure refinement of celluloses19.
2. Methods
2.1. Molecular modelling
Despite many powerful computation methods to solve secondary and tertiary
structure of biological molecules, the molecular modelling remains one of the most
wide-spread methods in structure analyses. First, it has a role of visualization and
demonstration of the conformation of biomolecules. Second, it is a powerful
method to visualize computational methods. By using molecular modelling, we can
add human thought to the refinement of biostructures. We can find the initial
structures for calculations and follow the computing output. Molecular modelling
can be divided into two main branches: computer graphics modelling and physical
modelling.
3

Computer graphics modelling.
Close to computer calculation facilities. The results of calculations can be directly
converted into graphics routine input and vice versa. The results of graphic
modelling can serve as an input for calculations. We can also check the calculation
process by monitoring intermediate results through graphic output. System
modifications can be made easily. There is a lot of software built for computer
graphics' modelling. By using computer graphics, we can visually control and
improve several configurations of molecules. Shifting the molecules and rotating
the side groups makes it possible to follow the most likely models of
macromolecule systems.
Physical m olecular m odelling.20
Physical models are close to a 3-dimensional reality. Despite the fast development
of graphics hardware, the computer image cannot reach the desired quality.
Physical models are more handy and more informational, for they give full 3-
dimensional properties. They are more convenient for demonstration and study
purposes. On other the hand, the main negative qualities comprise technological
difficulties of building up a perfect model and making changes in the model.
Another type of negative properties concerns remoteness from computer-world. It
is hard to convert the results of physical modelling for computer computation
purposes and vice versa. We principally only get a basic idea from physical models
on which we can build up a computer model.
- 10 -

2.2. Molecular mechanics and the minicrystal method
2.2.1. Molecular mechanics
Molecular mechanics (MM) as a method of conformational analyses21 has a
wide usage being a rather simple method of substance structure refinement. We
look for a minimal value of energy function. When simulating a molecular system,
we postulate an energy function which describes the potential energy of the
molecular system as a function of the positions r, of the N atoms labeled by the
index i. The minimizing function is the crystal's potential energy, i. e. the steric
energy. The aim of this method is to find a energy minimum by changing the
conformation of molecules. The MM methods22 are based on the following
philosophy: a molecule is regarded as a collection of atoms held together by
harmonic forces. These forces can be described by the potential functions of
structural features. The main feature is to use a simplified parametric force field
instead of solving complicated equations. The need of parametrization results from
the enormous amount of calculations needed to solve the conformation of a
molecule. Even semiempirical valence-electron approximation16 calculations are too
extensive to solve the structure of bigger molecules, not do mention the biological
macromolecule and crystal structures. All of the most widely spread force fields
use a bond-related ideology - parameters are associated with bonds, bond angles,
torsional angles or distances between two atoms. The empirical functions have
been suggested in several works23 24. Depending on requirements they can be more
complicated w ith more correction members. The values of parameters and formulas
of empirical functions are derived from ab in itio calculations, semiempirical
calculations and experimental data on the conformations. We used the MM3(90)
-11 -
3 *

program25 26 for full molecular mechanics27-28 calculations. A thorough description
of this program can be *ound elsewhere2930.
2.2.2. Constructing of a minicrystal for MM3
The MM3 program is able to use a maximum of 800 atoms w ith block
diagonal minimization option standard. This limits the construction of crystals. With
the number of atoms increased, the minimization requires more time. Each atom
adds six more degrees of freedom into conformational space. As MM3 does not
have any crystal border effect facilities, it is necessary to construct a minicrystal'.
In order to establish a crystal force field for cellulose chains. For this reason we
built in the course of the research cellulose chains as cellotetroses (see Figure 3)
and arranged seven cellotetroses into crystal packing' in accordance w ith unit cell
parameters (see Figure 1.2 and Figure IV.2) refined from experimental diffraction
data. We presumed that at this minicrystal case glucose rings that are situated in
the central part of a minicrystal should have an average and periodical force field.
- 12 -
Figure 3. A cellotetrose of a cellulose chain used in minicrystals.

This approximation is relatively good as most o f the interactions vanished
significantly at distances less than 1 nm. We also added terminating hydrogen
atoms in the ends of cellotetroses. This is needed for neutralizing charges that we
used for the calculations of electrostatic interaction. The MM3 routine does not use
any cuto ff distances in atom-atom interaction calculations. VanderWaal's and
electrostatic interactions will be calculated over all atoms. The orientation of
terminal hydroxyl groups was random. Their positions optimized during
minimization.
2.3. Rigid-ring calculations - advantages and drawbacks
Full molecular mechanics calculates potential energy of structures (crystal)
including all components of a force field. In theory, we should get a heat of
formation of crystal as a result. As it was already mentioned above, conformation
of molecules is defined by the following interactions: bond lengths, bond angles,
torsion angles, non-bonded (VanderWaal's and electrostatic), and hydrogen bond
interactions. Variations in the molecular geometry of molecules are then very simply
defined as changes in bond length, bond angle or torsional angle. Application o f a
typical force constant o f bond stretching26 and assuming Hook's law dependence
indicate, that the distorsion of a single bond of 0.03 Ä would cost about 1.2
kJ/mol. A bond angle bending is less sensitive, and a bond stretch about 0.05 Ä
is equal to an angular distorsion of about 10° 15. Torsional changes involve rotation
around bond axis. The barrier to rotation around aeingle C-C bond is 12.3 kJ/mol.
The barrier to rotation of methoxyl group in dimethoxymetiiane is approximately
4.2 kJ/mol2®. At the same time distorsion of hydrogen bond of 0.1 Ä costs less
- 13 -
4

than 0.3 kcal/mol. These values show that different terms in the function of
potential energy have different "sensitivity". Sometimes there is no need to
calculate full potential energy for solving structures. The structure is determined
simply by some components of force field. Other terms are not changing
remarkably and only disturbing a minimization process. The crystal structure of
celluloses is mostly determined by hydrogen bond and non-bonded interactions
between the chains of cellulose. Due to stronger interactions (bond lengths and
bond angles of atoms in sugar ring) the geometry of glucose rings is rigid enough.
The values of these conformational parameters can be reached by an experiment
or by ab in itio and semiempirical calculations of similar and more simple
compounds. This is called a linked atom approach31. There are two reasons why
the above-mentioned terms disturb structure refinement.
First, by excluding these interactions from minimizing functions, we simply
decrease the number of variables. By this we make the refinement algorithm
more effective. Effectiveness depends on the algorithm we use.
Second, these components may be extremely "strong” in comparison with
others (see page 14). It means that small changes in conformation cause
relatively higher energy changes from equilibrium state. We have a situation
where some of the components of a force field are significantly more
intensive than others. The minimizing routine traps because of these
interactions. It starts to oscillate around the equilibrium states of these
components and, minimizing other interactions, remains on the background.
On the other hand, these terms are playing a leading role in the formation of
the crystals of polysaccharides. If we turn the terms which are more efficient
into constants, it is also possible to refine the terms that are weaker but
have an important role in structure formation.
- 14 -

- 15 -
0 6 рдеМ от
This method has many dangerous
nuances. When fixing some conformational
parameters as bond lengths or bond angles, we
must be assured that these parameters would
not change remarkably. Moreover, small
deviances from the best solution - in force field
meaning - do not significally affect the results
Figure 4. D i f f e r e n t 0 6 of refinement. Even if we take these values
molecules in crystal structure can be different from their equilibrium in a free state,
e. g. in solution. The final energy of all crystal structures can even be lower if a
molecule has been distorted. For example, it is known from experimental data and
theoretical calculations that hydroxymethyl groups of polysaccharide chains are
preferable in gg position (see Figure 4). However, as it will be shown later, it seems
that in celluloses they are preferably in tg position. At the same time, a glucose ring
seems to be extremely stable. Calculations w ith MM3 show32 in 99.99% percent
of the cases that a pyranose ring is in the 4C, conformation position (see Figure 5).
Figure 5. Some examples of different conformations of a pyranose ring.
positions (tg.ggand gt) in glucose frorri similar substances, they are not exactlyring. .the same as in our structure. The geometry of
4 *
2.4. An implementation of rigid-ring method in cellulose
crystal structure refinement
2.4.1. A force field
In the following discussion of structure refinement we will apply the rigid-ring
refinement method to find the crystal structure of different polymorphs of cellulose.
As the structure of native celluloses is not clearly solved yet, this is a good reason
to try to improve different models for these phases by rigid-ring calculations. The
method to build up cellulose chains from glucose rings using virtual bond33 and a
unit cell from these chains is described elsewhere1,34. Measurements of unit cells
of native celluloses is taken from Sugiyama et a/6. Experimental data for cellulose
II is taken from Ko/pak e t a/35.
All calculations have been made in internal coordinates - bond lengths, bond
angles etc. - and the program uses the so-called Z-matrix coordinates. As a force
field we have used a simple one without an outlined electrostatic interaction term.
The electrostatic interaction has been considered in other terms. Avoiding direct
electrostatic interaction simplifies the usage of periodic boundary conditions and
an infinite chain in calculations. As we did not variate any bond length, this
interaction term is not necessary.
Bond angle bending potential. In equation (3) в is a bond angle, 0O is a
equilibrium bond angle and ke is a force constant.
Ев - кв(в -в 0)г(3)
Torsional potential.36 In equation (4) w is a torsional angle U0 is a force

- 17 -
constant.
E.. = — (1 +cos3u)2 (4)
Hydrogen bond potential.36 37 A Morse equation was used for hydrogen bond
term calculations. In the equation (4) r is a distance between the acceptor oxygen
and donor hydrogen atoms. D is a force constant.
EH = D[e 6{r ro)- 2e 3M>)](5)
Non-bonded atom-atom potential.38 A Buckingham expression was used for
non-bonded interaction modelling. In the equation (6) r is a distance between
atoms, A, В and С are force constants. As this term includes VanderWaals',
electrostatic and other interactions between two non-bonded atoms, we use
different force constants in case of intramolecular interactions and intermolecular
interactions39.
Ел = -A r* + Be 01(6 )
This force field is simple compared to the MM3's field. As we do not variate
the glucose ring or any bond length, these terms are sufficient enough to express
forces in our case.
2.4.2. X-ray refinement
The difficulties with cellulose are not unexpected regarding its comparatively
poor quality of diffraction pattern from oriented cellulose samples. Typical X-ray
diagrams of cellulose II, III and IV contain only a few dozens reflections, which is
clearly insufficient to refine all atomic parameters by standard crystallographic
5

studies. X-ray data of cellulose I is not available yet, as the phase I a coexists only
with the phase \ß. To increase the terms of refinement of the cellulose crystalline
structure, we use X~ray diffraction patterns as part of the minimizing function. We
compute the objective function
- 18 -
Ф U I WR‘(7)
where U is a potential energy, W - a weighing factor, R" - a crystallographic
discrepancy factor.
/?"-factor is defined by
R
E , r— obs m r-F
E “ J F ‘m 1
(8 )
where Fn°bt and Fmcelc are the observed and calculated structure factor amplitudes,
uim is the weight factor applied to the m-th reflection. M is the number of observed
reflections. Each Fn,cah is a function of the parameters of model and is computed
from:
f t - * { e [/=;Ге~мг}: (9)
The summation in this equation is over all planes hkl, contributing to the
m-th reflection, pm is the reciprocal «/-spacing, К is the scale factor.
We can see from the equation (7) that the calculated fl"-factor is given a weight
of W. The value of W is chosen in order as to make small changes in Ft" and U
equal meaning for objective function. The idea is that statistically significant
changes in R "-factor should be equal to significant changes in potential energy

level. A significant level can be obtained from Hamilton' tables40. The latter
depends on a number of variables. In potential energy calculations the typical level
of accuracy is about 1 kcal/mol41.
As mentioned before, we could use this objective function refinement only
for the crystal structure of cellulose II. It is not possible in case of native celluloses
the X-ray data and we can refine the structure by using potential energy
minimization.
3. Results and discussion
3.1. Rigid-ring calculations improvement with different
glucose rings and force fields
In rigid-ring calculations we used fixed glucose rings and made an attempt
to investigate the influence of residue geometry on the resuits of minimization".
Using different glucose rings, we found the minimums for several crystalline models
of cellulose II described elsewhere41. We improved six different glucose ring
conformations42 43, including even o-glucose rings which were converted into
/ff-glucose by chiral inversion of residues. All other conformational parameters of
minimization were kept the same. Similarly, several minimization technique were
used to obtain the best results. All results are presented elsewhere". Tables 1 and
2 show the objective function and the potential energies of the thirteen most
probable models of crystalline structure of cellulose II. Consequently, we can see
that the best and most important models do not change remarkably. Only one
model ( A l l ) was not found in some cases and it was minimized to model A 1 . In
- 19 -
5*

Table 3 there are presented the mean movements of the models according to
Arnott-Scott average ring case. We can see that generally all results of different
rings for most models have good accordance with Arnott-Scott ring results. It
seems that models with lower energy deviate less during the change of the glucose
ring. In Table 4 are presented variable torsion angles as the results of different
rigid-ring minimizations w ith different glucose rings.
Another attempt to improve the rigid-ring method was made. We built an
alternative force field23. As this force field includes an electrostatic equation, due
to boundary condition, some virtual hydrogens were included in the boundary
glucose rings to correct the charge neutrality problem. Positions of these hydrogens
were not minimized. We used an electrostatic constant of 4 IV" as in the case of full
minimization technique of MM3. Results of these calculations are shown in Table
5, 6 and 7. We can see that in this case the best models remain in their present
positions. The values of energies are different. There exist different reasons for the
diverse energy values obtained as a result of crystal energy minimizations are
different. The most important of them is that during fixed-ring the minimization we
switched off some interactions. If we change the force field, the components of
force field act in a different way. The value of crystal energy obtained by the
minimization process has minor significant meaning. The analyze is possible by
comparing different values and making conclusions at this level. We can see that
these results are somewhat dispersed in comparison with different ring
calculations, but the best models are in their place. The three last models
(A10-A12) were not found in some cases and were minimized to positions of other
models. In Table 6 the mean movement was calculated against the conformations
that these models had in the initial force field. Similarly to the previous computer
experiment, the models which had lower energy terms deviated less during
different minimization processes. We can see that values of the mean atomic
- 20 -

movement are low.
According to these calculation experiments we can say that small changes
in glucose rings do not remarkably influence the minimization results. Also, having
used different force fields that gave us similar results in full minimization process4,
we can conclude that all rigid-ring calculations gave the same kind of structures.
We also saw that structures w ith lower crystal energy have a iower mean atom
movement in different conditions. As the model with the lowest energy is also the
most probable model, it depends least of all on minor changes in a glucose ring or
on force field deviations. The glucose ring is rigid enough in polysaccharides to
omit its degrees of freedom in a energy term function. Components of force field
related to bond lengths, bond angles and glucose ring conformations are too
efficient in comparison to the components related to torsional angles of side groups
and hydrogen bonds. These forces play a leading role in the formation of crystal
phases of polysaccharides. By decreasing the amount of degrees of freedom in a
minimizing function, we make the minimization process more efficient as we
decrease the amount of variables in potential energy function from 285 to 12 (in
case of phase la).
- 21 -
6

Table 1. Objective functions of most probable models of cellulose II crystals using different rigid glucose rings. Glucose rings: AS - average Arnott- Scott; CHA2 - cyclohexaamylose; PLA - planteose; GUR - glucose-urea; CBIO - cellobiose; ßGLU - /З-D-glucose. A 1 A 1 2 , P1 - most probable models of the unit cell of cellulose II.
Models Objective functions with different glucose rings (kcal/mol)
AS CHA2 PLA GUR CBIO BGLUA1 -18.70 -19.75 -18.53 -19.05 -19.94 -18.60A2 -18.50 -19.31 -19.25 -18.41 -19.72 -18.41A3 -18.54 -18.00 -17.90. -17.89 -18.60 -19.03A4 -17.59 -16.88 -15.98 -17.49 -16.97 -18.70A5 -17.60 -19.10 -18.13 -17.22 -18.99 -17.34A6 -17.48 -16.90 -18.37 -18.60 -17.21 -18.15A 7 -17.40 -16.41 -16.53 -17.83 -17.34 -18.06P1 -16.90 -18.00 -16.67 -15.95 -19.32 -16.43A8 -16.40 -15.86 -17.00 -16.19 -16.61 -16.80A9 -15.80 -14.99 -16.41 -16.83 -15.43 -16.63A10 -15.10 -14.20 -10.03 -12.76 -9.11 -13.01A11 -8.00 -13.10 -11.50 -9.54 -19.80 -18.64A12 -7.80 -8.10 -11.83 -14.48 -15.20 -15.11

Table 2. Potential energies of most probable models of the cellulose II crystal using different fixed glucose rings. AS - average Arnott-Scott; CHA2 - cyclohexaamylose; PLA - planteose; GUR - glucose-urea; CBIO - cellobiose; ßGLU - Д-D-glucose. A1,,.., A12, P1 - most probable models of the unit cell of cellulose II.
Models Energies with different glucose rings (kcal/mol)
AS CHA2 PLA GUR CBIO BGLUA1 -21.40 -22.62 -21.38 -21.86 -22.89 -21.39A2 -21.20 -22.04 -21.94 -21.49 -22.01 -21.40A3 -21.20 -20.67 -20.66 -20.94 -21.22 -21.89A4 -20.10 -20.06 -18.91 -20.10 -19.98 -21.89A5 -20.39 -21.80 -20.67 -20.39 -21.52 -20.20A6 -1940 -19.33 -20.49 -20.54 -19.84 -20.57A7 -20.50 -19.40 -20.22 -21.01 -19.82 -21.21P1 -19.40 -21.20 -19.31 -18.52 -18.17 -22.07A8 -18.30 -18.07 -15.86 -18.34 -19.07 -18.75A9 -17.60 -17.32 -18.38 -18.63 -17.68 -18.54A10 -17.10 -14.50 -13.38 -15.28 -11.94 -15.21A11 -9.70 -13.30 -13.51 -11.36 -22.63 -21.47A12 -9.40 -14.70 -13.87 -16.51 -17.81 -18.11
Table 3. The mean atomic movements that result from the change of glucose ring at rigid-ring minimization of cellulose II crystals. For abbrevations see Table 2. The initial glucose ring was the average Arnott-Scott ring.
Models Mean movements
CHA2 PLA GUR CBIO BGLUA1 0.040 0.093 0.081 0.172 0.110A2 0.057 0.112 0.109 0.157 0.171A3 0.102 0.054 0.067 0.108 0.146A4 0.101 0.186 0.101 0.011 0.090A5 0.093 0.148 0.092 0.185 0.059A6 0.025 0.135 0.190 0.101 0.168A7 0.086 0.078 0.108 0.169 0.086P1 0.183 0.074 0.201 0.139 0.113A8 0.139 0.183 0.103 0.137 0.107A9 0.131 0.203 0.139 0.184 0.118A10 0.109 0.056 ' 0.087 0.264 0.092A11 0.299 0.164 0.179 0.214 0.320A12 0.241 0.203 0.181 0.213 0.248

ТаЫе 4.
Models
" a i
A2
A3
A4
A5
Variable toouon «ogles of different cellulose II crystal models using several glucose
rings. For abbrevation see Table 2.
Glucose
rings T„ T,« T* T22 T» T*CHA2 73 -48 -151 167 74 164 -54 157
PLA 66 -51 -151 174 69 162 -53 163
GUR вв -51 -151 174 69 162 -53 162
BGLU 72 -56 -167 181 71 178 -58 164
CBIO 68 -51 -147 190 74 181 -59 167
AS 66 -51 -151 174 69 162 -53 163
CHA2 73 -48 -152 166 76 103 -56 158
PLA 68 -51 -152 175 70 103 -57 163
GUR 68 -51 -152 176 71 103 -57 163
BGLU 75 -52 -152 -197 76 108 -56 167
CBIO 73 -55 -150 -197 70 115 -62 183
AS 68 •52 -152 -176 71 103 -57 163
CHA2 71 58 -80 175 74 167 -53 173
PLA 65 57 -79 177 71 166 -52 175
GUR 65 57 -79 177 71 166 -52 175
BGLU 65 60 -84 189 72 163 -57 180
CBIO 72 60 -80 189 73 173 -56 191
AS 65 57 -79 177 71 166 -52 175
CHA2 -68 176 -163 173 72 164 -54 158
PLA -63 173 -161 182 69 163 -52 174
GUR -63 173 -161 182 69 163 -52 174
BGLU -63 186 -158 182 69 167 -56 191
CBIO -70 193 -164 181 74 165 -52 174
AS -63 173 -161 182 69 163 52 174
CHA2 71 -48 -152 -54 73 101 56 158
PLA 66 -50 -152 -55 68 102 -56 160
GUR 67 -50 -152 -55 68 102 -56 161
BGLU 69 -53 -166 -56 71 99 -59 163
CBIO 71 -53 -169 -58 72 106 -60 171
AS 67 -50 -152 -55 68 102 -56 161
CHA2 177 165 -97 172 75 161 -57 166
PLA 179 164 -96 164 70 159 -55 164
GUR 173 164 -97 174 72 161 -56 167
BGLU 199 180 -107 179 80 177 -56 173
CBIO 196 182 -95 172 69 180 -59 176
AS 178 164 -97 174 71 161 -56 167

A7
P1
Ae
A9
A10
A11
(continuing)
Glucoserings T,. T12 T21 *22 T24CHA2 70 -51 -153 176 74 35 -54 72
PLA 67 -52 153 176 70 34 -54 72
GUR 65 -52 -153 175 70 34 -54 71
BGLU 67 -51 -161 191 70 33 -52 79CBIO 68 -53 -149 177 75 35 -59 73
AS 67 -52 -153 176 70 34 -54 72
CHA2 72 64 -68 163 177 174 -78 161
PLA 64 64 -70 172 171 175 -77 169
GUR 64 64 -70 172 171 175 -77 169
BGLU 63 68 -78 171 181 175 -77 180
СВЮ 62 71 -76 171 165 185 -81 176
AS 64 64 -70 172 170 175 -77 169
CHA2 174 166 -124 172 75 61 176 166PLA 174 166 -123 177 64 -65 177 166
GUR 174 166 -123 177 64 -65 177 166BGLU 195 171 -131 185 66 -65 193 181CBIO 186 164 -121 196 65 -72 183 172AS 175 166 -123 177 64 -65 177 106CHA2 178 166 -110 170 81 171 181 166
PLA 177 162 -109 175 77 172 183 167
GUR 177 162 -109 176 76 172 183 167BGLU 182 173 -115 188 79 177 195 178CBIO 191 176 -107 172 81 171 201 176AS 177 162 -109 176 76 172 183 167CHA2 -178 208 86 173 -171 -57 -30 166PLA -199 204 87 174 -170 -57 -28 170GUR -178 187 88 167 -155 -54 -27 166BGLU -193 175 93 188 -161 -69 -36 183CBIO -192 180 90 192 -171 -63 -35 186AS -178 168 88 174 -164 -62 -35 167CHA2 77 -52 -164 183 103 171 -55 177PLA 84 -54 -157 176 109 174 -58 170GUR 77 -48 -156 173 102 162 -52 160BGLU 68 -52 -161 189 68 167 -55 168CBIO 66 -52 -152 181 70 161 -52 159AS 77 -48 -156 173 102 162 -52 160
7

Table 5. Potential energies of most probable models of thecellulose II crystal using different glucose ring and an alternative force field. For abbrevations see Table 2.
Models Potential energies(kcal/tnol)
AS CHA2 PLA GUR CBIO BGLU jAI -22.01 -23.12 -21.91 -22.70 -23.79 -22.58 jA2 -21.95 -22.32 -22.80 -21.92 -22.26 -21.25]
A3 -21.20 -20.82 -21.24 -21.49 -21.12 -21.54
A4 -20.67 -19.14 -19.89 -19.70 -19.17 -21.26
A5 -20.13 -19.45 -20.76 -19.58 -20.57 -20.97
A6 -19.80 -19.19 -20.68 -20.78 -19.17 -20.78
A7 -19.30 -19.58 -20.08 -19.39 -18.92 -20.22
PI -18.93 -19.20 -19.72 -18.86 -18.28 -18.07
A8 -17.83 -17.16 -16.69 -18.95 -21.36 -19.23
A9 -18.34 -17.73 -17.81 -18.85 -19.69 -18.08
A10 -16.51 -15.39 -12.92 -15.39 -17.15 -17.77
A ll -8.90 -14.05 -14.49 -11.52 -11.71 -15.35
A12 -8.82 -14.04 -13.56 -17.39 -22.73 -20.34
Table 6. The mean atomic movements that result from the change of force field at rigid-ring minimization of cellulose II crystals. For abbrevations see Table 2.
г-----------Models Mean movements
AS CHA2 PLA GUR CBIO BGLU 1
A1 0.008 0.067 0.127 0.092 0.103 0.131
A2 0.010 0.076 0.295 0.147 0.092 0.077
A3 0.006 0.114 0.269 0.184 0.219 0.124
A4 0.016 0.066 0.276 0.090 0.195 0.230
A5 0.012 0.147 0.074 0.047 0 175 0.112
A6 0.019 0.128 0.283 0.211 0.195 0.139
A7 0.007 0.059 0.221 0.124 0.250 0.153
PI 0.004 0.086 0.186 0.127 0.053 0.105
A8 0.008 0.063 0.293 0.070 0.119 0.203
A9 0.009 0.114 0.213 0.083 0.205 0.075
A10 0.019 0.101 0.259 0.159 0.226 0.134
A ll 0.018 0.081 0.289 0.096 0.166 0.083
A12 0.007 0.086 0.125 0.098 0.128 0.165
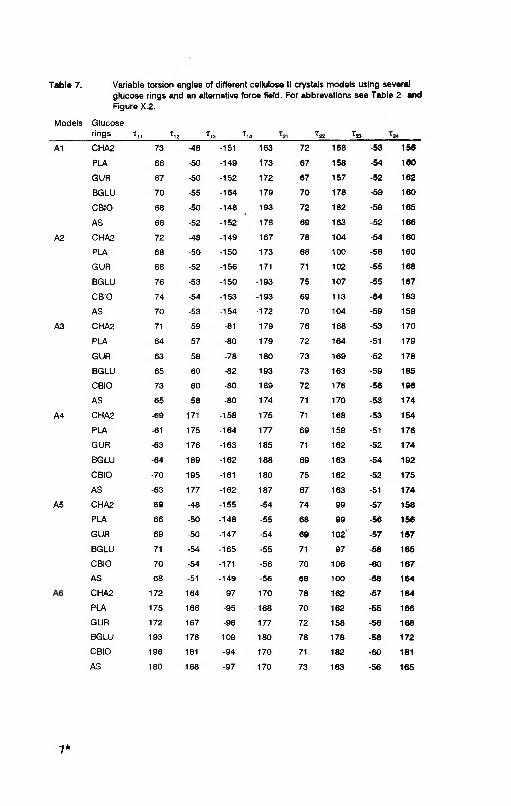
Table 7. Variable torsion angles of different cellulose II crystals models using severalglucose rings and an alternative force field. For abbrevations see Table 2 and Figure X.2.
Models
A1
A2
A3
A4
A5
Glucoser i n g s T , ,__________ T j j __________T u,__________т 14_______________________ T 2 2 __________^ 2 3
CHA2 73 -48 -151 163 72 168 -53 156
PLA 66 -50 -149 173 67 158 -54 160
GUR 67 -50 -152 172 67 157 -52 162
BGLU 70 -55 -164 179 70 178 -59 160
CBIO 68 -50 -148 193 72 182 -59 165
AS 66 -52 -152 178 69 163 -52 166
CHA2 72 -48 -149 167 78 104 -54 160PLA 68 -50 -150 173 68 100 -58 160
GUR 68 -52 -156 171 71 102 -55 168
BGLU 76 -53 -150 -193 75 107 -55 167
CBIO 74 -54 -153 -193 69 113 -64 183AS 70 -53 -154 -172 70 104 -59 159
CHA2 71 59 -81 179 76 168 -53 170
PLA 64 57 -80 179 72 164 -51 179
GUR 63 58 -78 180 73 169 -52 178BGLU 65 60 -82 193 73 163 -59 185CBIO 73 60 -80 189 72 176 -56 196AS 65 58 -80 174 71 170 -53 174CHA2 -69 171 -158 175 71 168 -53 154PLA -61 175 -164 177 69 159 -51 176GUR -63 176 -163 185 71 162 -52 174BGLU -64 189 -162 188 69 163 -54 192CBIO -70 195 -161 180 75 162 -52 175AS -63 177 -162 187 67 163 -51 174CHA2 69 -48 -155 -54 74 99 -57 156PLA 66 -50 -148 -55 68 99 -56 156GUR 69 -50 -147 -54 69 102 -57 157BGLU 71 -54 -165 -55 71 97 -58 165CBIO 70 -54 -171 -56 70 106 -60 167AS 68 -51 -149 -56 68 100 -58 164CHA2 172 164 -97 170 78 162 -57 164PLA 175 166 -95 168 70 162 -55 166GUR 172 167 -96 177 72 158 -56 168BGLU 193 178 -109 180 78 178 -58 172CBIO 196 181 -94 170 71 182 -60 181AS 180 168 -97 170 73 163 -56 165
7*

Table 7.
Models
~A7
P1
AS
A9
A10
(continuing)
Glucose rings T,CHA2 71 -51 -150 177 75 34 -56 71
PLA 68 -52 157 179 66 34 -54 71
GUR 68 -53 -157 178 70 34 -55 72
BGLU 66 -52 -159 188 70 32 -52 81
CBIO 69 -53 -148 174 74 34 -59 73
AS 68 •53 -154 173 69 33 -54 73
CHA2 74 62 -67 161 176 177 -76 160
PLA 65 62 -68 169 167 173 -75 164
GUR 66 65 -71 174 172 175 -79 169
BGLU 64 69 -79 168 177 177 -75 178
CBIO 63 73 -76 175 169 190 -81 172
AS 63 64 -69 173 170 172 -75 166
CHA2 176 166 -122 174 76 62 179 167
PLA 175 164 -121 180 63 -65 179 164
GUR 175 162 -123 173 66 -63 173 163
BGLU 193 171 -128 180 67 -63 189 186
CBIO 184 160 -122 192 67 -73 180 167
AS 172 161 -120 . 181 66 -64 177 161
CHA2 183 161 -108 168 80 167 177 164
PLA 182 163 -110 170 77 171 188 167
GUR 176 158 -112 171 76 175 186 167
BGLU 182 169 -114 192 77 175 197 180
CBIO 189 171 -105 172 60 173 197 174
AS 179 162 -111 180 77 168 183 164
CHA2 -173 212 88 175 -172 -58 -30 168
PLA -194 202 89 172 -166 -57 -28 175
GUR -162 172 76 218 -173 -60 -32 181
BGLU -148 161 78 201 -161 -58 -32 183
CBIO -160 165 80 191 -179 -63 -32 179
AS -174 173 86 179 -166 -63 -36 169
CHA2 74 -52 -162 187 104 174 56 174
PLA 83 -54 -159 176 109 177 -57 167
GUR 79 -48 -154 177 99 165 -52 163
BGLU 71 -44 -126 195 104 153 -60 152
CBIO 78 -48 -137 191 103 148 -57 163
AS 78 -48 -161 178 104 164 -52 156

3.2. Potential energy calculations of the crystalline
structure of cellulose I
3.2.1. Initial conformations
- 29 -
Besides the problem of a correct force field another major issue in the
methods based on molecular mechanics is the problem concerning initial models
and local minimas. As we already discussed, in case of MM methods, when
calculating only potential energy of crystals we should be aware that the
minimization process will not trap into local minima of force field. It is not possible
to avoid this problem completely, but we can minimize the probability to pass the
global minima. Firstly, our minimizing algorithm should be appropriate for such kind
of minimizations. It must be powerful enough to cross small local minimas and at
the same time reasonably sensitive to fall into narrow, but deep minimas. We tried
several minimization algorithms44,45. Finally, we chose the Powell-Davidson
algorithm48 47. Parameters of optimization routine were optimized in each case and
we saw that the process was very sensitive even to minor details o f minimization
algorithm. For example, parameters depended on a version of Fortran compiler and
on an operating system using the same Fortran source code. The considerations in
selecting parameters of minimizations are as follows: during the refinement
procedure the equilibrium of structure, caused by different forces of force field,
must be found. It is clear that this minimum of potential energy is not the
equilibrium of different forces. On the one hand, the gradients of forces are
remarkable, on the other, the minimization should not pass any significant minima.
A first step in estimating initial models for computation is the molecular
modelling. Using physical models and computer graphics software we presumed
8

all kinds of possible conformations, according to unit cell measures. The chief idea
was to avoid bad contacts. Based on this modelling system, the computer
generated hundreds of initial models. These models were minimized by using the
rigid-ring method. Results of these were checked on the basis of the local minimas
reached and also by computer graphics facilities. Correspondingly, to check the
results, a new set of initial models were generated and minimized. The results were
subjected to yet another graphic check. On the basis of these results some
minimization levels were sometimes added. The models obtained have already been
•ubject to analysis and conclusions. In some cases an improvement of rigid-ring
calculations MM3 calculations followed.
3.2.2. Parallel models of cellulose I crystalline structure
Several years ago VanderHart and Atalla48 discovered that all native cellulose
I -s are composed of two phases of crystals49 60. Later, Sugiyama et a/.5 described
these phases in M icrodictyon tenius. They used electron diffraction technique and
solved tw o unit cells: a triclinic one-chain unit cell for phase of la w ith cell
parameters a = 6.74 A, b = 5.93 Л, с = 10.36 Ä, a = 1 1 7 ° ,/? = 1 1 3 ° , к = 81°, and
a monoclinic two-chain unit cell for phase of \ß w ith cell measures a = 8.01 A,
b = 8.17 Ä, с = 10.36 Ä, / = 97.3°. We refined the structures of these phases by
using the rigid-ring method. A complete description of that work and its results are
given elsewhere,V-V. The structures have similar hydrogen bondings. It is possible
to convert the structure of I a into \ß via simple shifting of the chain sheets. The
energy barrier calculated by the rigid-ring method is about 9 kcal/mol. This has an
extremely high value. Calculations with annealing conditions would probably give
less value. This high value can explain why the phase I a does not transform into
the \ß phase in normal conditions. Minimized energies are in agreement with
- 30 -

experimental data51. As cellulose lor converts into the phase \ß during annealing
process and cellulose I reforms into the phase II w ith mercerization process, the
energy differences of 0.4 kcal/mol between la and \ß and 1.5 kcal/mof between \ß
and II are extremely low. The difference between the phases of native cellulose are
at the significant level. The hydrogen bond system is the same in native phases,
although some investigators have reported changes in the system. From the point
of view of energy calculations and modelling, it is hard to find another hydrogen
bond system which would enable us to make comparisons with systems found by
minimization (see Table IV. 1). This statement is valid only for parallel structures of
native celluloses derived from the data reported by Sugiyama et at.
3.2.3. Antiparallel models of native celluloses
Recent data of electron
d i f f r a c t i o n o f n a t i v e
ce llu loses obtained by
Sugiyama e t a l are explained
as parallel structures. All
chains in a unit cell are
parallel. In one-chain unit
cells there are no other
possibilities, however, in the
two-chain one, there exists
an antiparallel option, too.
The issue of parallelity ofFigure 6. A conversion of native cellulose into
cellulose chains has been cellulose II during a mercerizationprocess.
under discussion for several
- 31 -
8*

decades5263. A number of researchers have given their interpretation, but no
satisfactory explanation has been reached yet. According to the diffraction data35 54
and energy calculations66 “ it seems that cellulose II has an antiparallel structure.
However, cellulose I was interpreted as parallel structure. During mercerization
treatment native cellulose converts into cellulose II forming several intermediate
structures. These phases have been thoroughly described by Sarko's group57. They
declare that already the first intermediate phase, the so-called Na-cellulose-l (see
Figure 6), already has an antiparallel structure. It is extremely difficu lt to explain
how it is possible to change the direction of a cellulose chain which has a
molecular weight over 10000. Different researchers have elucidated this as
interdigitation. There are different microcrystals in a cellulose fibre. Some of them
are oriented up, some of them down. During the first step of mercerization process
these crystallites w ill mix and form antiparallel structures. This process is
complicated and has not been satisfactorily explained.
Another way to explain antiparallel cellulose II structures is to presume that
cellulose I or at least some phases or components are already by themselves
antiparallel. We have also proposed several models for the antiparallel structures
of native celluloses. The construction of antiparallel models of unit cells is based
on the parameters of unit cells as reported by Sugiyama et al. We constructed
eight-chain unit cells68 for both phases of native cellulose and simple antiparallei
two-chain unit cell for the phase of \ß. We calculated these models by using the
rigid-ring method, improving several initial models by modelling and calculation
methods71 VHI. These initial models are thoroughly described invu". Results of these
calculations are presented in table VI. 1.
An antiparallel two-chain unit cell has a relatively high energy level. At the
same time, an eight-chain unit cell for the \ß phase, denoted as A3a (see Figure
VI. 10), has a low energy of -21.0 kcal/mol. However, antiparallel eight-chain unit
- 32 -

cell models for the la phase do not offer good energy results. There exists an
explanation why the la phase needs not to be in global minima. A la phase, existing
independently from the \ß phase, has not been discovered yet. There appear only
mixtures of tw o native cellulose phases. This explains why the la phase can be
found in structures which have comparatively higher crystal energies, for example,
model A1 a (see Figure VI.4). The model has a different hydrogen bond system from
both the mode! P2 (see Figure VI.8) and the A3a (see Figure V I.10). This is in
accordance w ith the hydrogen bond change in la to \ß conversion marked by
VanderHart and Atalla.
3.3. The full molecular mechanics (MM3) calculations
of celluloses
3.3.1. Experimental
The starting coordinates of atoms were calculated by the rigid-ring method
or taken from literary sources. Cellulose la was described inlv, cellulose \ß inv and
crystalline small molecules as a-D and /7-D-glucopyranose in69. Minicrystals were
constructed for calculating energies (see p.2.2 and in '). The molecular graphics
software and some conversion software were used to construct crystals, to use the
PLMR output data, to manipulate the molecules and to prepare MM3 input files.
After minimization the initial and final structures were fitted by the least squares
procedure. After the fitting procedure the average of the absolute values of
differences between the initial and the final coordinates was reported as the mean
atom ic movement. This was also used for comparing different results o f PLMR
calculations.
- 33 -
9
3.3.2. Effect of the dielectric constant
- 34 -
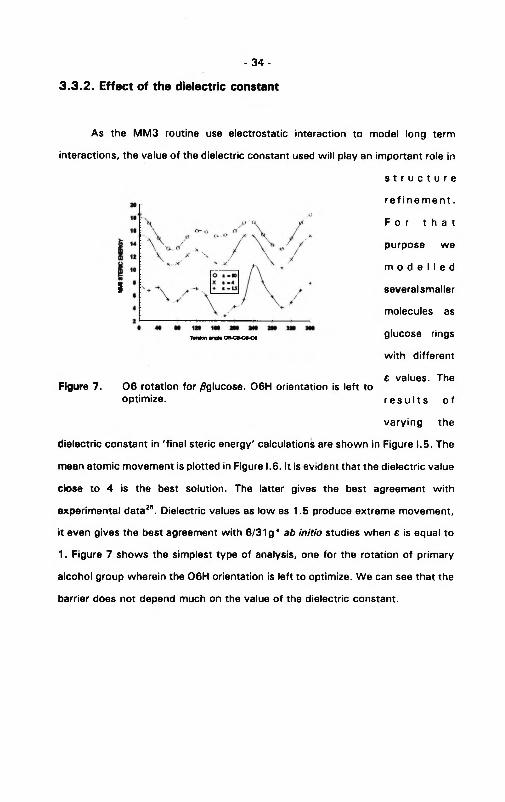
As the MM3 routine use electrostatic interaction to model long term
interactions, the value of the dielectric constant used will play an important role in
s t r u c t u r e r e f i n e m e n t .
F o r t h a t
purpose we
m o d e l l e d
several smaller
molecules as
glucose rings
w ith different
с values. The
r e s u l t s o f
varying the
1
IbM an «по** 0в-С #-С *-0€
Figure 7. 0 6 rotation for /fglucose. 06H orientation is left to optimize.
dielectric constant in 'final steric energy' calculations are shown in Figure 1.5. The
mean atomic movement is plotted in Figure 1.6. It is evident that the dielectric value
close to 4 is the best solution. The latter gives the best agreement with
experimental data26. Dielectric values as low as 1.5 produce extreme movement,
it even gives the best agreement with 6/31 g* ab in itio studies when e is equal to
1. Figure 7 shows the simplest type of analysis, one for the rotation of primary
alcohol group wherein the 06H orientation is left to optimize. We can see that the
barrier does not depend much on the value of the dielectric constant.

3.3.3. Energies of cellulose polymorphs
The starting structures in MM3 calculations were taken from the best models
of the PLMR process. The description of minicrystals built for minimization is given
in'. The model crystals were optimized with no restrictions of space group. The full
molecular mechanics minimization process should be more valid than rigid-residue
calculations. There are no restrictions to moving and flexing. The energy values
calculated by MM3 are likely to be accurate; the standard deviation in calculated
heat formation for 40 isolated alcohols and ethers was 0.38 kcal/mol. Energies of
the minicrystals are probably less accurate. The results of MM3 minimization are
given in Table V.3 and Table IV. 1. The analysis of these results is described
elsewherev. We got the energy of 185 kcal for I a phase and 182 kcal for \ß phase.
Analogous values of PLMR were -19.5 kcal/mol and -19.9 kcal/mol. For cellulose
II the energy values were 176 kcal by MM3eo and -21.4 kcal/mol by PLMR. These
values are in good agreement with the experiment. The energies of both phases of
cellulose I are slightly higher than the energy of cellulose II, and the la phase is a
bit higher than \ß. The energies of both phases of native cellulose are extremely
close. This may explain why they can coexist. The energy values of cellulose III and
IV are comparatively higher. To compare the results of PLMR and MM3 we
calculated the mean atom movement. These results are presented in Table V.3.
Relatively low values show good agreement of both methods. Most of the best
models of PLMR remain at their positions also after MM3 minimization. MM3
method found some additional intersheet hydrogen bonds in models of U„3, U04
and 11̂ 6. PLMR did not find these bonds. Actually these models trapped into local
minimas of a constrained force field. We also calculated lattice energies using
MM3. For this purpose we removed the central chain and calculated energies o f the
chain and they remained 6 chains without minimization. These results are in Table
- 35 -
9 *
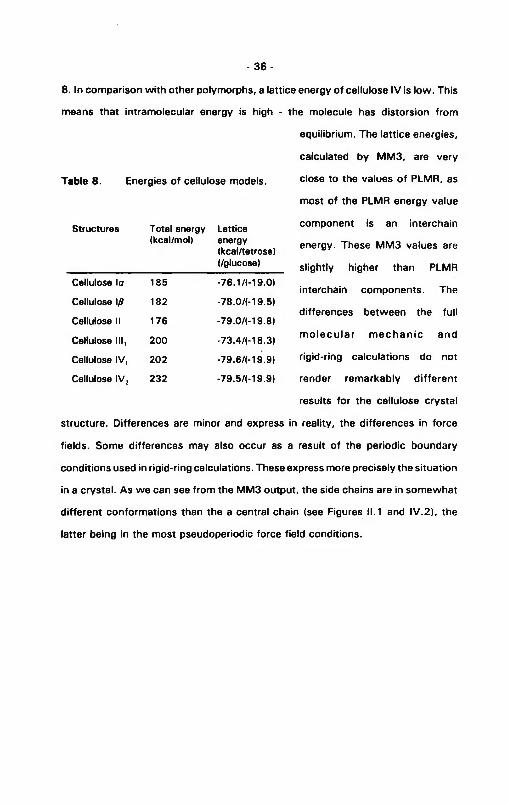
8. In comparison w ith other polymorphs, a lattice energy of cellulose IV is low. This
means that intramolecular energy is high - the molecule has distorsion from
equilibrium. The lattice energies,
calculated by MM3, are very
Table 8. Energies of cellulose models. close to the values of PLMR, as
most of the PLMR energy value
- 3 6 -
Structures Total energy (kcal/mol)
Latticeenergy(kcal/tetrose)(/glucose)
component is an interchain
energy. These MM3 values are
slightly higher than PLMRCellulose la 185 -76.1/(-19.0)
interchain components. TheCellulose \ß 182 -78.0/И9.5)
differences between the fullCellulose II 176 -79.0/И9.8)
Cellulose III, 200 -73.4Д-18.3) m o le cu la r m ech an ic and
Cellulose IV, 202 -79.6/M9.9) rigid-ring calculations do not
Cellulose IV2 232 -79.5/M9.9) render remarkably different
results for the cellulose crystal
structure. Differences are minor and express in reality, the differences in force
fields. Some differences may also occur as a result of the periodic boundary
conditions used in rigid-ring calculations. These express more precisely the situation
in a crystal. As we can see from the MM3 output, the side chains are in somewhat
different conformations than the a central chain (see Figures 11.1 and IV.2), the
latter being in the most pseudoperiodic force field conditions.

3.4. Discussion over cellulose structure- 37 -
It is clear that the issue of the structure of different cellulose polymorphs is
far from being solved. The parallelity of cellulose chains and the structure o f native
celluloses remains the most dubious questions. The latter question has been given
some light on, but serious problems still exist in the field.
It seems that the structure of cellulose II (mercerized) has an antiparallel
structure. This is confirmed by different experiments and calculations. At the same
time recent experiments reveal that cellulose I has a parallel structure. X-ray
diffraction investigations of different intermediate states of mercerization process
report that already the Na-cellulose-l has an antiparallel structure. It is explained as
an interdigitation of chains, but this is not a very good interpretation. In our opinion
the main problem in solving the structure of celluloses is to find the construction
of unit cells and to solve the problem of parallelity of cellulose chains. An idea has
been put forward that it is likely that native celluloses from different sources have
unit cells w ith somewhat different parameter value. As our calculations show, very
exact parameters of unit cells are not obvious. The results of the \ß unit cell
refinement w ith parameters reported in Pertsin e t a l,61 and the results of the
refinement o f ramie celluloses80 62 are extremely close. It is more important to find
a symmetry group and positions of cellulose chains. The problem of how to explain
the conversion of cellulose I into cellulose II remains to be a common topic. An
interdigitation is not a very satisfactory explanation. Atalla proposes that there can
be tw o different cellulose II unit cells. This is one way to explain the situation. The
other way to explain it is to look for antiparallel native cellulose structures. For
these purposes we calculated several antiparallel structures based on unit cell
measures reported in Sugiyama et a/6. As we found an antiparallel structure with
10
a very good energy, this explanation cannot be overlooked.
- 38 -
4. Conclusions
4.1. Methods
Analyzing the material presented in this paper, we can conclude that the
structure of cellulose crystallites is mostly determined by hydrogen bonds and
non-bonded interactions. Therefore, to refine these structures by using the steric
energy minimization technique we can discard some of the components of full
steric energy. The glucose ring is rigid enough to assume that it would remain fixed
during a cellulose crystal structure refinement. Due to these simplifications, we can
investigate the structural properties of cellulose chains in a crystal structure more
precisely and faster.
Advantages o f the rig id-ring m ethod:
By decreasing the number of variables, we make the minimizing routine more
efficient, i. e. the process will converge better.
By avoiding comparatively strong interactions in potential energy function, we
make refinement routine more sensitive against weaker interaction which
plays the main role in the formation of cellulose crystals. In fact the
minimization process will not oscillate around strong interactions.
Drawbacks o f the rig id-ring method-.
The force field is deformed and does not correspond to the "real" force field.
Values of crystal energies that we get as a result have not enough physical
background. It corresponds only to some terms of force field and have no
accordance with experimental data.
Due to distorsions in the force field there are more conformational barriers and local
minimums compared to full molecular mechanics which makes the
refinement of a global minimum more complicated.
We must be certain that the minimization would not remarkably affect the
restricted degrees of freedom, and that the refining structure is not very
sensitive to minor changes of these terms from equilibrium. It means that
molecules in a crystal structure are not far from their conformation of "free"
equilibrium.
As calculations improve, these simplifications will justify themselves. In the
course of the calculations we got the right initial structure of cellulose \ß, which
was not achieved by the previous calculation with MM3 mostly due to the lack of
complicated minimization functions. Even extremely simple potential energy
functions give precise enough results.
The rigid-ring method seems to be suitable for fast and powerful research on
crystal structures of celluloses and other polysaccharides. Even if the force field is
deformed, it will not affect the results. Although this force field has more erroneous
local minimas, the best results are easy to refine. It is possible to incorporate X-ray
diffraction data for this refinement process, though, it seems that the potential
energy calculations are very powerful even without the diffraction data.
The construction of minicrystal models for modelling cellulose crystals is
valuable, even if it has drawbacks which were mentioned above. Incorporating X-
ray data into this minimization technique makes it more awkward. At the same time
calculations with full molecular mechanics give us a possibility to compare our
results w ith experimental data, i.e. comparison of heat of formation. Similarly, a full
molecular mechanics studies may give more detailed information about the
structure. For final refinement purposes it would be more useful as it gives more
accurate results. Larger crystal models would be better but they need extremely
- 39 -
10*

large computer resources. However, for structure refinement purposes it suffices
w ith the rigid-ring calculations.
4.2. Structure of celluloses
As we have mentioned several times, the complete solving of cellulose
polymorphs structure is not yet finished. Cellulose II seems to have an antiparallel
structure. The crystal energy calculations of both phases of native cellulose give
results which are in a good agreement with the experimental data on the
conversion lcrH/f-41. Though the results of the parallel structure of native celluloses
is very easy to interpret, it is hard to explain the conversion of a parallel structure
into an antiparallel structure during mercerization process. According to this we
cannot overlook the idea about antiparallel structures of native celluloses. An
alternative way is to reinspect the conception of cellulose II. Only further
experiments will be able to answer that problem.
* * #
In the present work the rigid-ring methodology has been developed to refine
structures of celluloses and other polysaccharides. This routine has been improved
by several ways and compared with full molecular mechanics calculations. Several
calculations have been made by using full molecular mechanics. Also, structures
of both polymorphs of celluloses refined by using both the rigid-ring method and
the full molecular mechanics refinement. Several hypothesis on the structure of
polymorphs of native celluloses were set up according to the results of molecular
modelling and rigid-ring calculations.
- 40 -

Acknowledgements
I am very thankful to Alfred D. French for the productive collaboration. Also,
I am greatful to Raik-Hiio Mikelsaar and Alexander J. Pertsin for their excellent
ideas and for supervising the present research. I thank Aksel Haav for helping me
during my first steps in crystallography. Also, I wish thank Normann L. Allinger for
providing me with the MM3 program.
- 41 -
References
1. Sarko, A.; Southwick, J.; Hayashi, J. Macromolecules 1976, 9, 857.
2. Chanzy, H.; Imada, K.; Vuong Protoplasma 1978, 94, 299.
3. Smith, P. J. C.; Arnott, S. Acta Crystallographica 1978, A34, 3
4. Millane, R. P.; Narasaiah, Т. V, Polymer 1989, 60, 1763.
5. Sugiyama, J; Vuong, R.; Chanzy, H. Macromolecules 1991, 24, 4108.
6. Stipanovic, A. J.; Sarko, A. Macromolecules 1976, 9, 851.
7. Sugiyama, J.; Okano, Т.; Yamamoto, H.; Horii, F. Macromolecules 1990,
23, 3196.
8. Yamamoto, H.; Horii, F.; Odani, H. Macromolecules 1989, 22, 4130.
9. Marrinan, H. J.; Mann, J. J Polymer Sei 1956, 21, 301.
10. Horii, F.; Hirai, A.; Kitamaru, R. ACS Symp Series 1984, 260, 27.
11. Bock, K. Pure and Applied Chemistry 1983, 55, 605.
11

12. Homans, S. W.; Dwek, R. A.; Rademacher, T. W. Biochem istry 1987, 11,
1465.
13. Cherniak, R.; Jones, R. G.; Reiss, E Carbohydrate Research 1988, 172,
113.
14. Golebiewski, A.; Parczweski, A. Chem Rev 1974, 74, 519.
15. Tvaroška, I. Pure and Applied Chemistry 1989, 61, 1201.
16. Pullman, В Quantum Mechanics o f M olecular Conformations, 1976, Wiley,
New York.
17. Tvaroška, I.; Bleha, T. Chem Papers 1985, 39, 805.
18. VanGunsteren, W. F.; Weiner, P. K. Computer Simulation o f Biomolecular
Systems, Leiden, 1989.
19. Hardy, B. J.; Sarko, A. in Cellulosics: Chemical, Biochemical and M aterial
Aspects, Eds. Kennedy, J. F.; Phillips, G. 0.; Williams, P. A.; Ellis Horwood
Ser. Polymer Science and Technology, Ellis Horwood, New York, 1993, 41.
20. Mikelsaar, R.-H. Trends in Biotechnology 1986, 4, 162.
21. Boyd, D. B.; Lipkowitz, K. B. J Chem Educ 1982, 59, 269.
22. Burkert, U.; Allinger, N. L. M olecular Mechanics, ACS Monograph 177, ACS,
Washington D. C., 1982.
23. Ha, S. N.; Giammona, A.; Field, M.; Brady, J. W. Carbohydrate Research
1988, 180, 207.
24. Weiner, S. J.; Kollman, P.A.; Case, D. A.; Shandra Singh, ü.; Ghio, C.;
Alagona, G.; Prefeta, S. Jr.; Weiner. P. J Amer Chem Soc 1984, 106, 765.
25. Allinger, N. L.; Rahman, M.; Lii, J.-H. J Am er Chem Soc 1990, 112, 8293.
26. Allinger, N. L.; J Am er Chem Soc 1977, 99, 8127.
27. Lii, J. H.; Allinger, N. L. J Comput Chem 1991, 12, 186.
28. Lii, J. H.; Allinger, N. L. J Am er Chem Soc 1989, 111, 8576.
29. Allinger, N. L.; Yuh, Y. H.; Lii, J.-H. J Am er Chem Soc 1989, 111, 8551.
30. Lii, J. H.; Allinger, N. L. J Am er Chem Soc 1989, 111, 8566.
- 4 2 -

31. Arnott, S.; Scott, W. E. J Chem Soc Perkin / / 1972,324.
32. French, A. D.; Dowd, D. in Ceiluiosics: Chemical, Biochemical and M aterial
Aspects, Eds. Kennedy, J. F.; Phillips, G. 0 .; Williams, P. A. Ellis Horwood
Series Polymer Science and Technology, Ellis Horwood, New York 1993, 51,
33. Zugermaier, P.; Sarko, A. in Fiber D iffraction Methods, Eds. French, A. D;
Gardner, K. H.; ACS Symposium Series 141, ACS Books, Washington DC
1980, 225.
34. Pertsin, A. J.; Kitaigorodsky, A. I. The Atom -Atom Potential M ethod
Applications to Organic Molecular Solids, Springer Ser. Chem. Phys., V43,
Springer-Verlag, Berlin, 1987.
35. Kolpak, J. F.; Weih, M.; Blackwell, J. Polymer 1978, 19, 123.
36. Дашевгжий. В.Г. Конфирмационный' анализ макромолекул. Москва: Наука
I987.(in Russian).
37. Дашевгкии. В. Г. Конформацштныи анализ органиуеских молекул. Москва:
Химия. I982.(in Russian).
38. Mirskaya,K. V.; Kozlova. I. E.; Bereznitskaya, V. F. Phys S tat Solid 1974,
62, 291.
39. Kitaigorodsky, A. I.; Mirskaya, K. V.; Nauchitel', V. V. Kristallografia 1969,
62, 291.
40. Hamilton, W. C. Acta Crystallographica 1965, 18, 502.
41. Pertsin, A. J.; Nugmanov, 0 . K.; Marchenko, G. N.; Kitaigorodsky, A. I.;
Polymer 1984, 25, 107.
42. French, A. D.; Murphy, V. G. Carbohydrate Research 1973, 27, 391.
43. Chu, S. S. C.; Jeffrey, G. A. Acta Crystallographica 1970, B26, 1373.
44. Бгргаин. И. (!.: Жидков. H. П. Методы вычислении. Москва 1959.(in Russian).
45. Himmelbau, D. M. Applied Nonlinear Programming, McGraw Hill, 1979.
46. Powell, M. J. D. C om putJ 1964, 7, 155.
47. Zangwill, W. I. C om putJ 1967, 10, 293.
- 43 -
1 1 *

48. VanderHart, D. L.; Atalla, R. H. Macromolecules 1984, 17, 1465.
49. Atalla, R., H.; VanderHart, D. L. Science 1984, 223, 283.
50. Horii, F.; Hirai, A.; Kitamaru, R. Macromolecules 1987, 20, 2117.
51. Ranby, B. G. A cta Chem Scand 1952, 6, 101.
52. Gardner, K. H.; Blackwell, J. Biopolymers 1974, 13, 1975.
53. French, A. D. in Polymers fo r Fibers and Elastomers, Ed. by Jett C. Arthur,
Jr., ACS Symp Series V26, 43.
54. Kolpak, J. F.; Blackwell, J. Macromolecules 1976, 9, 273.
55. Nishimura, H.; Okano, Т.; Sarko, A. Macromolecules 1991, 24, 759.
56. Nishimura, H.; Sarko, A. Macromolecules 1991, 24, 771.
57. Sarko, A.; Nishimura, H.; Okano, T. in The Structure o f Cellulose, ACS Symp
Series 340, ACS Washington DC, 1987, 169.
58. Honjo, G.; Watanabe, M. Nature 1958, 181, 326.
59. Brown, G. M.; Levy, H. A. Acta Crystallographica 1979, B35, 656.
60. Woodcock, C.; Sarko, A. Macromolecules 1980, 13, 1183.
61. Pertsin, A. J.; Nugmanov, O. K.; Marchenko, G. N. Polymer 1986, 27, 597.
62. French, A. D.; Howley, P. S. in Cellulose and Wood - Chem istry and
Technology, Ed. Schuerch, C. John Wiley & Sons, New York 1989, 159.
- 44 -

- 45 -
List of publications
I. French, A. D.; Dowd, D.; Aabloo, A. In t J B iol Macromolecules 1993, 15
30-36.
II. Aabloo, A.; Pertsin, A. J.; Mikelsaar, R.-H. in Cellulosics: Chemical
Biochem ical and M ateria! Aspects, Eds. J. F. Kennedy, G. O. Phillips, P. A
Williams, Ellis Horwood Series Polymer Science and Technology, Elli
Horwood, New York, 1993, 61-65.
III. Mikelsaar, R.-H.; Aabloo, A. in Cellulosics: Chemical, Biochem ical an
M aterial Aspects, Eds. J. F. Kennedy, G. 0 . Phillips, P. A. Williams, Elli
Horwood Series Polymer Science and Technology, Ellis Horwood, New Yort
1993, 57-60.
IV. Aabloo, A.; French A. D. Makromolek Chem, Theory and Sim ulations 199^
2, in press.
V. Aabloo, A.; French A. D.; Mikelsaar, R.-H.; Pertsin, J. Cellulose , in pres
VI. Mikelsaar, R.-H.; Aabloo, A. Cellulose, in print.
VII. Aabloo, A.; French, A. D.; Mikelsaar, R.-H. in Cellulose Derivates at
Related Polysaccharides, Eds J. F. Kennedy et al, Ellis Horwood Series
Polymer Science and Technology, in press.
VIII. Mikelsaar, R.-H.; Aabloo, A. in Cellulose Derivates and Relati
Polysaccharides, Eds. J. F. Kennedy et al, Ellis Horwood Series in Polym
Science and Technology, in press.
12

Tselluloosi kristalsete faaside struktuuri uurimine kasutades
energeetilisi arvutusi
- 4 6 -
Tselluloos on üks levinumaid biopolümeere maailmas. Tema struktuuri on
uuritud juba aastakümneid, kuid sellest hoolimata leidub veel palju lahendamata
probleeme. Kristalne tselluloos esineb erinevates vormides-polümorfides. Looduslik
tselluloos (I) koosneb kahest komponendist nn. faasid lo ja \ß. Sõltuvalt päritolust
sisaldab looduslik tselluloos neid komponente erinevas vahekorras. Kõige levinum
tööstuslik tselluloosi vorm on tselluloos II. Teised faasid on vähem levinud.
Tselluloos I kristalsete faaside ühikrakkude ehitus on määratud hiljuti,
seetõttu ongi käesoleva töö üheks eesmärgiks nende faaside struktuuri uurimine.
Samuti pakume välja mõningaid alternatiivseid ühikraku struktuure, mis seletaksid
paremini tselluloosi faaside üleminekuid. Struktuuri määramiseks kasutame kristalli
potentsiaalse (steeri/ise) energia arvutusi. Arvutuste käigus me fikseerisime need
konformatsioonilised parameetrid, mis minimiseerimise käigus niikuinii oluliselt ei
varieeru ning seetõttu ainult segavad arvutusi. Samuti kasutasime kristalli
konstrueerimise käigus perioodilisi ääretingimusi jms., mis vastab paremini reaalsele
jõuväljale, mille paikneb suhteliselt pikk polümeerahel. Arvutusmetoodikat
kontrollisime ka molekulaarmehaanika meetodiga. Tulemused langevad vägagi hästi
kokku.

Miniature crystal models of cellulose polymorphs and other carbohydrates
Alfred D. French*Southern Regional Research Center, PO Box 19687, New Orleans, Lousiana 70179, USA
DomM P. MillerConsultant, PO Box 423, Waveland, Mississippi 39576, USA
and Alvo AablooDepartment o f Experimental Physics, Tartu University, 202400 Tartu, Estonia
(Received 10 September 1992; revised 28 September 1992)
Miniature crystal models o f cellulose and other carbohydrates were evaluated with the molecular mechanics program MM3. The models consisted of groups o f 24 to 32 monosaccharide residues, with the models of mono- and disaccharides based on well-established, single-crystal work. Structures o f the cellulose forms and cellotetraose were based on published work using fibre diffraction methods. A structure for the single-chain la cellulose unit cell was also tested. A dielectric constant o f about 4 was best for this type o f work. Calculated intra- and intermolecular energy for glucose agreed with literature values for the heat o f combustion. Cellulose II had the lowest calculated energy for a cellulose form, followed by la, cellulose 111,, ramie I, IV,, and IV,. Optimization o f cellulose IV caused larger mean atomic movements from the original crystallographic positions than the other cellulose forms, and cellotetraose had larger movements than any o f the other structures. Lattice energies for the cellulose forms were about 20 kcal/mol o f glucose residues, with a dominant van der Waals component.
Keywords: Cdtukwe; crystal model*; molecular mechanics
IntroductionPure cellulose crystallizes in various forms, named I to IV, depending on the history of the sample. Cellulose I, the m ajor native type, has recently been recognized to occur mostly as mixtures of the two subclasses, la and l ß l . The two subclasses occur in different am ounts and have, respectively, one and two chains per unit cell. Together' they account for the 8-chain unit cell proposed earlier3. Cellulose II results from mercerization (treatment in 22% sodium hydroxide) or crystallization from solution. Cellulose III, the product of treatment of cellulose I or II with liquid ammonia or other amines, has two subclasses, III, and III„, depending on the parent structure. Finally, cellulose IV results from treatm ent at high temperature (in glycerol at 260°C) of I, II or III, with subclasses IV, and IV„ depending on the parent structure. Cellulose IV also appears in immature native samples*.
Researchers have long thought that these various forms have different relative stabilities, with the most stable form being cellulose И. Of the native la and \ß forms, the product of annealing a mixture is pure fß, so Iß is thought to have the next lowest energy2. Since the III and IV forms can revert to their parent I or II forms, they are thought to have slightly higher energy than the parent forms.
As far as we are aware, quantitative comparison of the
•To whom correspondence should be addressed.This work is the property of ihe US Government and is not subject to copyright
0141 -«130/93/010030-07 О 19931 Battcrwofth-Heinemann Limited30 In t J. BioL Macromol., 1993, Vol. 15, February
energies of the various forms has not been attem pted before. Instead, these differences in stability are normally ascribed to different intra- and intermolecular hydrogen bonding schemes, often proposed from X-ray fibre diffraction experiments. However, such experiments are so difficult that even Ihe chain-packing polarity is often not well-determined. Even in the far more accurate X-ray diffraction studies of single crystals of small molecules, the hydrogen bonding is often difficult to assess. If accurate positions of hydrogen atoms are needed, low temperatures an d /o r neutron diffraction are used. Thus, hydrogen bonding schemes resulting from fibre diffraction studies are speculative. In fibre diffraction work, hydrogen bonding is derived with the aid of computer models. These models are necessary components of the fibre diffraction method, but typically come from software that is less well developed than other software used only for modelling.
In the present work, we have studied the energies of small model crystals of most of the cellulose forms, using a sophisticated molecular mechanics system, M M 35’®, that was designed to handle a wide variety of organic molecules. For comparison, we have modelled several crystal structures of smaller carbohydrate molecules for which good crystal structure data are available. A variety of information comes from these studies. An approximate lattice energy (or heat of sublim ation) can be determined from the optimized minicrystal by first removing the central molecule. The energy of the central molecule and the total energy of the surrounding molecules are then calculated (without further optimization). Their sum exceeds the energy of
12*

Crystal models o f cellulose polymorphs: A. D. French et al.
ict m inicrystal by the am o u n t o f the lattice energy, ttice energy can be added to the h eat o f form ation isolated m olecule (calcu lated as a norm al o p tion (3) giving a to ta l AH, which can be com pared with ire values for the heat of fo rm ation of solid ydrates.lattice energy can be b roken dow n in to the van lals and ‘d ip o le -d ip o le ' term s. These co rrespond dispersive forces and-the e lectrostatic forces. F rom olubility of cellulosic m olecules in m any solvents, ■ns th at bo th are relatively stro n g , but we law are of specific p roposa ls o f their relative udes.to ta l steric energy reported by M M 3 is a sum of
irious a ttrac tio n s and repulsions. It includes o lecular term s, such as the b ond s tre tch ing and ig costs of form ing p yranose and furanose rings, I as n o n-bonded forces th a t can apply to bo th and in term olecular in teractions. T he m ore stable
will have a low er to ta l energy, regard less of :r the stab ility com es from a m ore s tab le isolated lie o r from a be lte r in term olecu lar arran g em en t. ;css the stabilities of the various cellulose form s, ire, the to ta l steric energy term s for each can be red. If the energy is m uch h igher th an for an o th e r, ly sized g ro u p of m olecules, then the proposed ire may n o t be valid.r the m inicrystals are optim ized , there will have om e changes in a tom ic positions from the original nates, even when sta rtin g with w ell-determ ined ! structu res. Lii and A llinger, w ho used a special im (C R S T I.) based on the n o n -b o n d ed term s of
for m odelling c ry sta ls1, found ad ju stm en ts of con stan ts of as m uch as 0.28 A for relatively
, h y drocarbon m olecules. T hose differences were ited to lim iting a ssum ptions such as a spherical for a tom s. W hile som e m ovem ent is therefore
ed , excessive m ovem ent w ould indicate a defective sed structu re .
choice o f dielectric co n stan t is critical in M M 3 itio n s, wherein it scales the e lec trostatic inter- s relative to the o th er forces. In M M 3 (9 0 ), the -d ip o le energy , used instead o f energy schem es on explicit a tom ic charges in o th er m odelling
ire, depends on the d ielectric co n s tan t, as does aI hydrogen b ond ing term th a t is rep o rted as part d ip o le -d ip o le value. A value n ear 4 was suggested
when M M 3 results were com pared with crysta l s truc tu res, to m im ic the efTect of crysta lline e nv ironm ents on isolated m olecules8. H ow ever, we were explicitly creating a m in ia tu re c rysta l, and the q u estion therefore a rose w hether the op tim um balance betw een the dispersive and e lec trostatic forces w ould be o b ta in ed w ith 4 or with som e o th er value.
ExperimentalStarling coordinates
W e started with the proposed atomic coordinates of the crystal structures already in the literature, or tables deposited with the structure reports. F o r the cellulose structures, we chose for internal consistency mostly the work from S ark o 's group at S yracuse9-12. C ellu lose la was described elsewhere . C rysta lline sm all molecules included a-D-14 and 0-D-glucopyranose15, /i-D-fructo- pyranosc16, methyl Д-D-galactopyranoside17, sucrose" and /?-D-cellobiose‘\ W e also modelled a crystal of cellotetraose proposed from fibre difTraction studies'*. Som e results of a similar miniature crystal study were reported elsewhere for the tetrasaccharide nystose20.
Construction o f m ini-crystalsO u r m odels of the cellulose form s consisted o f seven
cello te traose m olecules a rran g ed by the ap p licab le sym m etry o p e ra to rs to m ake a pseu d o h ex ag o n al, close-packed m in ia tu re crystal ( F ig u re I) . T h e sm all m olecules were sim ilarly a rran g ed (see Figure 2), depend ing on the crysta l stru c tu re , so th a t a cen tra l m olecule was su rro u n d ed , in so far as possib le, on all sides. T erm inal hydroxyl hydrogen a to m s o r hydroxyl gro u p s were ad d ed to the cellulose m odels as needed, with the o rien tatio n s o f the new O H g ro u p s being essentially ran d o m . O th e r O H gro u p s o f th e cellulose m odels were o rien ted to build a ne tw o rk of hydrogen bond in g co rresp o n d in g to th e a u th o rs ' p roposa ls. In the case o f cello te traose, ab sen t a p ro p o sed hydrogen b ond ing schem e, a n e tw ork was devised. These m inicrystals were then op tim ized , w ith o u t res tric tions o f any k ind on the a to m ic m ovem ent.
CalculationsT h e ca lcu lations were d o n e w ith 1B M -PC com patib le
486 and VAX com puters . T he 1990 version o f M M 3 was
1 The minicrystal model of cellulose III,, before (— ) and after (— ) optimization with MM3
Int. J. Biol. Macromol., 1993, Vol. 15, February 31

Crystal models o f cellulose polymorphs: A. D. French et al.
r ig u re 2 The starling minicrystal of 7 I) glucopyrnnose with 27 molecules
used, with the energy-based ( ra th e r than geom etry- based ) default term in a tio n c riterion th a t depends on the num ber of a tom s in the s tru c tu re (0.05 k ca l/m o l for a 27-m olecule m in ic ry sta l). T h e O H E M -X p ro g ra m 21 was used to construc t the crysta ls, to m an ipu late the m olecules, and to p repare M M ? input files. C H E M -X was also used to fit the initial and final struc tu res by a least squares p rocedure, m inim izing the function
where a, and bt are the a to m co o rd in a te s of the ith a to m after and before m in im ization22. After this fitting procedure, (he average of the abso lu te values of the residual differences betw een a, and bi was reported as the m ean a tom ic m ovem ent. It was co m p u ted only for the oxygen and carb o n atom s.
Lim itationsSeveral lim ita tions characterize o u r m odels. T he
num ber of m olecules is sm all, as is the chain length. T he lim its on size arise bccause of the lim it o f 700 a to m s in the M M 3 program . W hile th a t size lim it is som ew hat artificial, significantly larger m odels w ould requ ire m uch m ore com puter time. F o r exam ple, one m ore layer of m olecules a ro u n d the cu rren t 27-m olecule crystal of glucose w ould add 98 m olecules. T he larger m odel would require ab o u t 20 tim es as long to optim ize.
Energy increasesIn these and o th er m odelling studies o f ca rb o h y d ra te s ,
M M 3 often has a p roblem wiih energy increases that term inate the m inim ization . T his happens only when using the block d iagonal least squ ares m inim izer, necessary for s truc tu res co n ta in in g m ore th an 80 a tom s. Figure 3 show s the energy values d u rin g three separa te m inim ization runs o f the glucose m inicrystal derived from the neu tra l d iffraction study. O n the 71st cycle of o p tim iza tion , the energy went up slightly. O p tim izatio n s of struc tu res th a t yield energy increases a lso ind icate
Figure 3 Energy minimization of i-n-glucosc at a dielectric constant of 4. The restarts are indicated. After the energy went up al the end of the first run. the hydroxyl groups showing maximum movement were rotated and the optimization restarted. At the end ofthc second run. there was still substantial fluctuation of some other hydroxyl hydrogen atoms (see Figure 4). The energy declined only slightly during the third run
severe oscilla tions o f hydroxyl hydrogen a to m s on the o u tp u t, as the a to m s w ith m axim um ato m ic m ovem ent, show n in Figure 4. T he M M 3 o u tp u t lists, at each five ite rations, w hich a to m w ould be m oved the m ost and the pro jected ex ten t of the m ovem ent, based on the derivatives ca lcu lated d u rin g the op tim iza tio n step. The ato m ic m ovem ent per ite ra tio n is ac tua lly lim ited to a b o u t 0.25 A an d does no t occur to th e ex ten t show n in Figure 4. T h is p rob lem preven ted the full o p tim iza tion o f several o f the m inicrystals, at least un til the indicated hydroxyl g ro u p s were ro ta ted (w ith C H E M -X ) to a su itab le a lte rn a te staggered o rien ta tio n . After ro ta tio n of the hydroxyl g ro u p s, the energy w ould be m om entarily h igher, such as the 5 k c a l/m o l increase show n for ite ratio n 72 in Figure 3, bu t m in im ization w ould quickly
32 Int. J. Biol. M acrom ol., 1993, Vol. 15, F eb ru ary

Crystal models o f cellulose polymorph** A . D . French et al.
21 41 61 61 101 121 14! Iteration number
Figure 4 The maximum movement by any atom, as indicated by MM3. The movement reached a suitable value only during the third run. even though the energy changed only slightly. The atoms are limited to movements of about 0.25 A by the program; they are not actually moved as much as indicated. As in figurcS. the first run ended al 71 iterations, and the second at the I IXth iteration
lower the to ta l to a value less than the previous low. T he problem happened often with the som ew hat random o rien tation given to the added hydroxyl g roups at the cello te traose ends, but som etim es it also afflicted o ther g roups on the surfaces of the m inicrystals.
T he m axim um m ovem ent of any individual atom indicated in Figure 4 is distinct from the m ean atom ic m ovem ent that we have used to indicate the qua lity of the force field a n d , in the case o f the s truc tu res determ ined by fibre d iffraction, the q ua lity o f the s tru c tu re . T he m ean a tom ic m ovem ent refers to the average o f all the d istances betw een the initial and final positions of each a to m , and is only applied to the carb o n and oxygen a to m s in this w o rk . The m axim um a tom ic m ovem ent refers to the a tom th at is indicated to need to m ove the m ost to low er the energy d u rin g m inim ization . The a to m th a t is indicated to have the greatest m ovem ent is alm ost alw ays a hydroxyl oxygen when the problem with energy increase d u ring m inim ization occurs.
W hen this problem causes p rem atu re term in a tio n of the o p tim iza tion , the differences in the initial and final a tom ic positions are not as large as if the s tru c tu re were fully optim ized . Also, the energy is not as low as when the o p tim iza tion has been carried full term after ro ta tio n of the indicated groups. O f course, p a rt of the increased m ovem ent and decreased energy is due to the ro ta tio n o f the hydroxyl hydrogen atom s. In a few instances, it was not possible to find an a lternative position that allowed full op tim ization . H ow ever, after several trials, even the s truc tu res that con tinued to term inate with an energy increase were th o u g h t to be reasonably well optim ized T herefore, we reluctan tly accepted these results as the best available.
R esu lts a n d d iscu ssio n
Effect o f varied dielectric constantResults of varying the d ielectric co n tan t in the M M 3
calculation a re show n in Figures 5 and 6. Figure 5 shows the varia tion in calcu lated energy. In view of its 880 k ca l/m o l range, the im portance of the dielectric co n stan t w ould be hard to ignore. F o r bo th glucose
Figure 5 Plot of the MMJ 'final steric energy' for the minicrystal models of ®-i»-glucose at different dielectric constants
Figure ft Plot of Ihe mean atomic movement for the minicrystal models of glucose at different dielectric constants. ( 0 ) f»-n glucose; i • ) /(-l)-glucose
m olecules, the m ean a tom ic m ovem ent d u rin g o p tim izatio n seem s to have a general m inim um centred a ro u n d a d ielectric o f 4, as show n in Figure 6. /?-l)-G lucopyranose has lower values on e ither side o f 4, bu t they m ay be due to incom plete m inim ization of those structures. Therefore, a value of 4 was used on the o th er m odels in this study . D ielectric values as low as 1.5 p roduced extrem e m ovem ent, even though M M 3 agreed best w ith 6 / 3 1 g* ah initio studies when the dielectric co n stan t was set to1,025. W hen condensed phase system s are m odelled w ith m olecular m echanics p rogram s using a dielectric constan t of I, the resulting im balance betw een the electrostatic forces and all o th er energy term s is a likely source of e rro r. T h is o b serva tion also suggests th a t ab initio studies and condensed phase experim ents will no t have co m p arab le results.
M ovem entsTable I show s the m ean a tom ic m ovem ents th a t result
from the o p tim iza tion with M M 3 o f the different crystal s tructures. The struc tu res based on good single crystal d a ta have a range of 0.09 to 0.21 Ä in the m ean atom ic m ovem ents. T here is a slightly wider range for the cellulose s truc tu res and a large m ovem ent for cellotetraose. T he tw o cellulose IV s tru c tu res , in p a rticu la r, have large m ean m ovem ents. Inspection of the in itial and final s truc tu res show ed th a t the prim ary a lcohol g roups in bo th cellulose IV, and 1V„ m oved substan tia lly d u rin g o p tim iza tion , accoun ting for m uch o f the m ean
Int. J. Biol. M acrom ol., 1993, Vol. 15, F eb ru ary 33

Crystal models o f cellulose polymorphs: A. D. French et al.
Table I Models, movements (A ) and energies (kcal/mol) for minicrystals
Compounds modelled' Model size MovementTotalenergy(kcal)
Lattice energy (kcal) /tetraose (/glucose)
Cellulose lot 7 tetramers 0.106 185Ramie cellulose 1 7 tetramers 0.160 201 — 76.1 / — 19 0Cellulose II 7 tetramers 0.202 176 - 7 9 .0 / / -19 .75Cellulose III, 7 tetramers 0.198 200 - 7 3 .4 / - 18 3Cellulose IV, 7 tetramers 0.255 209 — 79.6/ — 19.9Cellulose IV„ 7 tetramers 0.254 202 - 7 9 .5 / -1 9 9Cellotetraose 8 tetramers 0.418 232
Energy/moleculeot-n-Glucose 27 monomers 0 205 68 -3 7 .4/(-nCilucose 27 monomers 0.211 36 -3 7 .6/(-n-Fructopyranose 25 monomers 0.118 97 — 35.8Methyl 0-l>-galactopyranosidc 27 monomers 0 091 114 - 36.1/(-i)-Cellohiose 16 dimers 0.092 199 -6 1 .0Sucrose 14 dimers 0.209 296 — 44.5
m ovem ent. T he considerable a to m ic m ovem ent in the celio te traose s tru c tu re suggests th at the p roposed s tru c tu re m ay not be co rrect, as indicated by the au th o rs . The confo rm ations o f som e of the m odel cello te traose m olecules changcd to s truc tu res with ap p ro x im ate two-fold screw sym m etry. T hose changes in conform ation , how ever, could have resulted instead from o u r guesses regard ing the hydrogen bonding in the struc tu re . In retrospect, it seem s that having m ore specific guidance to the p roposed hydrogen bonding would be w orthw hile, even though the hydrogen bonding is not rigorously de term ined . A result consisten t w ith the orig inal au th o rs ' op in ion would be useful for tests such as the present work
The m ean a tom ic m ovem ent in the m odel struc tu res was not iso tropic. Superirnposition o f the optim ized m odel and intial s tru c tu re show ed that there was very little m ovem ent a long the fibre axis. In the (100) planes of the ram ie cellulose I, III (see Figure I ) and IV s truc tu res that co n ta in the in ter-chain hydrogen b o nd ing , there was also little m ovem ent. T he m ajo rity of m ovem ent was p erpend icu lar to those planes. The (100) planes were slightly sep ara ted , as if the h y d rophob ic bond ing were not pulling (he s tru c tu re together strongly enough. How ever, this m ay be a result o f the small m odel size. T he v iariations in unit cell d im ensions reported for different native celluloses24 m ay be due in part to the different crystallite sizes found in the different m aterials. Sm all crystallites would give slightly larger unit cells because of fewer long-range in te rac tions pulling the struc tu re together.
M ovem ent in the cellulose II lattice was assessed by ro ta tin g the struc tu res 74", so that the planes o f the chains were parallel to the x-axis. T he co m p o n en ts o f m ovem ent were separated and , again , the m ajo r m ovem ent occurred perpend icu lar to the m ain p lanes of the cellulose chains. The m ovem ent a long the z-axis (the fibre ax is) was0.058 A, a long the x-axis was 0.083 A, and a long the у-axis of C artesian space it was 0.149 Ä. Because the lengths in M M 3 for the glycosidic C -l 0 -1 bond are off by as m uch as 0.02 A2', the deficiencies in the z-d irection , to which the glycosidic bond are nearly paralle l, a re small. S im ilar calcu lations for /?-D -fructopyranose show ed x-, y- and z-axis m ovem ents o f 0.043, 0 054 and 0.074 A.
respectively. In th a t crysta l s tru c tu re , the p lanes of the rings are p erpend icu lar to the z-axis, a long which the greatest m ovem ent is observed.
EnergiesTable / also show s the to ta l s teric energies and heats
of fusion (w hen ca lcu lated ). T he energy values for the different s truc tu res vary w idely, even a cco u n tin g for the dilTercnccs in the sizes of the c rysta ls needed to provide a tota lly su rro u n d ed cen tra l m olecule. As a check on the overall validity of these ca lcu lations, we have also com puted the heat of fo rm ation of /)-n-g lucose with MM.V T he isolated /f-D-glucose m olecule in its lowest energy co n fo rm atio n has a A/ / , o f —265.8 k c a l/m o l. calcu lated at a d ielectric co n stan t of 1.5. W hen added to the —37.6 k c a l/m o l of fusion energy , the to ta l o f 303.4 equals the lite ra tu re value of —303 k c a l/m o l calcu lated from the heat of com b u stio n for solid g lucose26. The diclectric c o n ta n t is som ew hat less critical for the in tram olecu lar energy. At a d ielectric co n stan t of 4, the iso lated /J-п -glucose m olecule has a AH , o f -260.0 k c a l/m o l, still allow ing a sum reasonab ly close to the lite ra tu re value.
Energies o f cellulose polym orphs. O f the cellulose s tru c tu res , cellulose II has the lowest energy , resulting from bo th the low in tram o lecu lar energy , and as show n by the lattice energy, the second-low est in te rm olecu lar energy. Its an tip ara lle l m odel has four up ( c o rn e r ) chains and three (dow n ) centra l chains. T he co rn e r chains have 0 6 in the gl position at slightly low er energy th an the Ig p o sition occupied on the cen tra l chains. (T he lower energy for the gt form is a consequence of the dielectric c o n s tan t of 4, as w ell.) The energy of the p ack ing m odel w ith four dow n chains and three up ch a in s sh ou ld also be averaged with this one. W hen this is done , the to ta l energy increases ab o u t 5 kcal, still leaving cellulose II with the lowest energy. O n ly the ram ie cellulose m odel differs from expectations, h av ing energy su b tan tia lly higher than the la m odel, equal to the III, m odel. The lattice energy of cellulose III, is b roken dow n in Table 2 in to the van der W aals and d ipo le d ipo le term s for the
34 Int. J. Biol. M acrom ol., 1993, Vol. 15, F ebruary

Crystal models o f cellulose polymorph:.: A. D. French et al.
Г«Ые 2 Breakdown of energy calculations for cellulose 111,
Energy term7-tetramerminicrystal
6 outer chains
1 inner chain
Lattice energy /tetraose (/giucose)
van der Waals -189.2 -117 .9 -9 .0 -6 2 .3 ( -1 5 .6 )OtherDipole -dipole -5 8 .7 -4 2 .6 -4 .9 — 11.2 ( — 2.8)Total -7 3 .4 ( -1 8 .3 )
entire m odel, the isolated cen tre m olecule and the rem ain ing m odel. It shows th a t, com puted at a dielectric constan t of 4, the m agn itude of the van der W aais a ttrac tio n s (15 k ca l/m o l of glucose residues) is considerably larger than the values for e lectrostatic a ttrac tio n (3 k ca l/m o l of glucose residues). T hus, in the past, the con trib u tio n s by the hyd ro p h o b ic g roups to crystal s tability have been underestim ated . H ydrogen bonds have bo th electrostatic and van der W aals com ponents.If the single hydrogen bond in the cellulose III m odel has an energy of 5 k c a l/m o l, the rem ain ing lattice energy would be ab o u t 13 k c a l/m o l, all arising from van der W aals forces.
T he lattice energy of IV, is slightly low er than all the o ther form s, while its overall energy is greater. This suggests th a t the in tram olecu lar energy term is higher.
M ono- and oligosaccharide energies. The m o n o saccharide struc tu res have su bstan tia lly low er (m ore negative) lattice energies per residue th an the larger m odels, ow ing to the larger n um ber of in term oiecular hydrogen bonds th a t a re possible in m onosaccharides. Cellobiose has less stability per residue th an glucose, partly because two of the hydroxyl groups of glucose have been replaced by the glycosidic linkage in the d isaccharide. The m odel sucrose d isaccharide has a high energy com pared with the cellobiose m odel. Since the sucrose m odel had only 14 d isaccharide residues in a structu re with P 2 , sym m etry , the packing in its m inicrystal was sim ilar to that of the cellulose m odels, except that there were two layers. T herefore , som e of the three-d im ensional cha rac te r of the sinall-m olecule struc tu res was lost. A better m odel of sucrose would have a th ird layer of m olecules above o r below our arran g em en t, bu t this was beyond the capacity of o u r m ethod. T he high energy can also be a ttr ib u te d to two o ther factors. O ne is the presence of furanose rings, which have significantly higher angle-bending and torsional energies than pyranose rings (am o u n tin g to several k ca l/m o l per residue). A nother factor is the presence of overlapp ing anom eric effects a t the sucrose linkage.O th e r work has shown that M M 3 m ay overestim ate the energies of such linkages, a lthough the increase for sucrose is not as severe as for o th er crysta ls, such as rafiinosc, where the largest problem exists27. In the m odels of nystosc20, where the sucrose linkage has an M M 3 energy 3 k ca l/m o l h igher th an the global m inim um , the m ean atom ic m ovem ent in the m inicrystal was 0.312 A, a lthough the m ovem ent for the central m olecule in the crystal was sm aller. A p artial reason for 3 the sm aller lattice energy in the sucrose m odel com pared * with m ay be th a t crystalline sucrose has tw o in tra m olecular hydrogen bonds, dim inish ing the o p p o rtu n ity (, for in term oiecular hydrogen bonds.
C o n c lu sio n s
T he con stru c tio n of m odel m inicrystals and the calcu lation o f their energies seem s to be a valuable type of m odelling study. W e have show n th a t it is possible to ob tain nearly q u an tita tiv e values o f the heat of fo rm ation , an im p o rtan t experim ental qu an tity . Also, the ap p ro ach provides a useful m eans to determ ine the value of the dielectric co n stan t used to scale the e lectrostatic and o th er forces in a m olecu lar m echanics force field. T he work show ed th a t a value of 4 is a b o u t righ t; the consequences o f excessive a tom ic m ovem ent and decreased energy from using a value o f 1 o r 1.5 to m odel condensed phases are m ade qu ite c lear in this study.
The m inicrystal m ethod also seem ed to be useful for testing s truc tu res proposed in fibre d iffraction studies. The proposed s truc tu res of cellulose IV had sub stan tia l m ovem ent o f the p rim ary a lcohol g roups and were thus the least com patib le with the M M 3 force field. W e were also unab le to supplem ent the p ro p o sed c a rb o n and oxygen positions for ceilo te traose w ith a hydrogen bond ing schem e th a t avoided su b stan tia l m ovem ent d uring o p tim iza tion w ith M M 3. T h e a u th o rs had concluded that the ceilo te traose d a ta were not solved and refined to an acceptable degree o f accuracy . Like any m odelling study , the m inicrystal techique c an n o t prove that a s tru c tu re is co rrect, n o r, because o f the extensive tim e required for op tim iza tio n , is it useful for finding the range of likely possibilities. Instead , it seem s to function as a soph isticated secondary check o f the m odelling com ponen t o f s truc tu res derived by fibre d iffraction m ethods.
This type o f investigation could be im proved in num erous ways. L arger crystal m odels w ould be better, if accom pan ied by significantly faster com puters , o r periodic b o u n d ary cond itio n s could be in co rp o ra ted into M M 3. T he M M 3 (9 2 ) p ro g ram in co rp o rates a test on the angle o f hydrogen bond ing , a lthough the p roblem of p rem atu re energy term ina tion still exists. T he C R ST L program allows a m uch larger crystal size to be em ployed, for m ore rigorous calcu lations. H ow ever it does not allow the m olecules them selves to optim ize, crucial for the study of the relative stabilities of different form s.
R efe ren ces1 vanderHart, D. L. and Alalia, R. I f . Macromolecules 1984, 17,
14652 Sugiyama, J., Vuong, R. and Chan/.y, H. Macromolecules 1991,
24, 4108Honjo, G. and Watanabe. M. Nature 1958, 181, 326 C'han/y, H., Imada. K. and Vuong. R. Protoplasma 1978,94,299 Allingcr, N. L., Yuh, Y. H. and L ii, J.-H. J. Am. Chem. Soc.1989, I I I , 8551Allingcr, N. L., Raman, M. and L ii, J.-H. J. Am. Chem. Soc.1990, 112, 8293
Int. J Biol. M acrom ol., 1993, Vol. 15, F eb ru ary 35

^ l ii. J H and A llinger. N. L J Am. Cli-ni Soc. IP89. I I 1 .85768 French. A I) . Rowland. R S. and Allinger. N. I. in 'Computer
M odeling o f Carbohydrate Molecules'. ( Fds French, A . D. and Brady, J. W I, AC'S Symposium Series 430. ACS Books. Washington, DC. 1980. p 121
9 W oodcock, C. and Sarko, A. Maeromolft ulr.s 1980, 13, U8310 Stipanovic, A. J. and Sarko, A. Macroiuolrtulcs 1976. 9. 85111 Sarko. A., Southwick, J, and Hayashi, J. M armm oht ales 1976.
«. 85712 Ciardiner. F. S. and Sarko. A ' Vm ./. Chem 1985. 63. 17313 Aablo, A. and French. A. D. M acronwlaulvs (in press)14 B row n.(I. M. and l.cvy. H. A. /irfuCrixtitllotir. 1979. ВЛ5,65615 Chu. S S C. and JelTrry.C». A. Art и ( ’гуш Н щ г. 1968, B24.83016 Kanters. J. A., Roelofscn. G.. Alblas. В. P. and Meindcrs, I.
A rm Cn.Molhifr 1977. BJ.1, 66517 S held rick, B. Aria СгуМаНщг 1977. B33. 300318 Brown,C5. M. and Levy. I I. A. Aria Cry slather. 1973. B29. 790
Crystal models o f cellulose polymorphs: A. D. French et al.
19 Henrissat, B.. Perez, S.. Tvaroska, (. and W inter. W. T in T h e Structures of Cellulose: Characterization o f the Solid State'. (F.d. Atallas, R. H .), ACS Symposium Series no. 340. ACS Books, W ashington, D C , 1987. p 38
20 French. A. D ., M ohous-R iou, N. and Perez, S. С arhohydr Res ( in press I
21 C H F M -X is developed and distributed by Chemical Design Ltd. O xford, England
22 Ferro. D. R. and Hermans, J. Acta i ryslalloifr 1977, A33.34523 Aabloo, A. and French, A. D. (unpublished)24 O kano. T. and Koyanagi, A. B io po litu rr .s (9X6. 25, 85125 Dowd. M . K ., F'rench, A. D. and Reilly. P. J. Corhohydr. Res
1992 ( in press)26 ‘CRC Handbook of Physics and Chem istry’, 1983. p 1)18127 French, A. D .. Schäfer. L and Newton. S. О C m hohutr Rrs.
(in press)
36 Int. J. Biol. M acro m o l., 1993, Vol. 15, F eb ru a ry

10
Calculations of potential energy of the cellulose crystal structureAhro Aabloo, Aleksandr J. Pertsin* and R.-HL MikeUaar** - Tartu University, Department of Experimental Physics, Tähe 4 Street, 202400 Tartu, Estonia. "Institute of Element-Organic Compounds, Vavilova 28 Street, GSPI, V-334, 117813 Moscow. ••Tartu University, Institute of General and Moleculai Pathology, Veski 34 Street, 202400 Tartu, Estonia.
ABSTRACT
Many aspects of cellulose crystal structure remain without satisfactory explanation. We have calculated objective functions based on diffraction intensities and potential energies of the cellulose П crystal using ‘rigid model' calculations. We used different geometries of the glucose rings and found that this does not shift the results of potential energy calculations very much. The second part of this work contains preliminary results of potential energy calculations for the cellulose la crystal structure. Models with the lowest energy are in the tg conformation. However, the best gg model has very complicated hydrogen bonding that includes two hydrogen bonds between sheets.
INTRODUCTION
In recent years there have been only a few attempts to determine the structure of cellulose by combined potential energy and X-ray diffraction calculations [1]. A typical X-ray diagram of cellulose contains only few dozen reflections, a number that is clearly insufficient to refine all atomic parameters by standard crystallographic methods. To increase the ratio of observations to refineable parameters we have used various stereochemical and packing constraints and non-bonded contacts calculated by the atom-atom potential method. For calculating the most
62 Biosynthesis, Structure and Organisation [PLl
probable models of a crystal of cellulose we have minimized the objective function
F=UtWR"
where U is the potential energy of the system, R" is the crystallographic discrepancy factor based on the cellulose f] intensity data from Kolpak et al [2]. The potential energy consists of
in which U „ « is the conformational energy of the monomer residues, Ц »« 1» the conformational energy between two successive residues along both of the two crystallographically distinct chains, U *., is the intermoiecular energy which includes non-bonded and H-bond energy between the atoms of different chains. Calculations have been executed in internal coordinates. There are two different extents of atomic adjustments that can be used to reduce F. The first possibility is to leave all bond lengths etc flexible. The second way is to fix some structural components that do not vary much during minimization. This method allows us to decrease the number of variables. In earlier work [3] thirteen most probable models for the cellulose II crystal structure were calculated.
CALCULATIONS OF THE POTENTIAL ENERGY OF THE CRYSTAL STRUCTURE OF CELLULOSE II
To learn the importance of variable residue geometry, we have calculated all thirteen most probable models of cellulose II crystal structure [3] by the use of the "rigid model" method described in [3,4], applying five different initial glucose rings. We used ß-glucose rings constructed by chiral inversion of residues found in cydohexaamylose-KOAc/CHA2/, planteose/PLA/ and glucose-urea/GUR/ [5]. We also used reducing ß-D- cellobiose/СВЮ / and ß-D-glucose/ÖGLU/ [6]. We presumed symmetry P2, for the chain of cellulose II. During minimization we fixed the bond lengths, bond angles and glucose ring geometry. We varied the totsional angles of the hydroxymethyl and three hydroxyl groups and the torsional and bond angles describing the junction between two successive monomer residues. We also varied rotations and shift of chains in the unit cell w cellulose II [2]. As for the most probable models, their variable parameters do not shift remarkably when the “Xxfferent geometries are used. The only models that shifted were ones that ranked last in the Initial preference list [3] (using "average Amott-Scott" ring). When the model A ll was based on PLA and ÖGLU rings, it did not find the same energy minimum. Instead the A ll shifted to the A l model. In Figs. 1 and2 we present the value of the objective function and the potential energies of the thirteen most probable models of crystal structure П. It can been
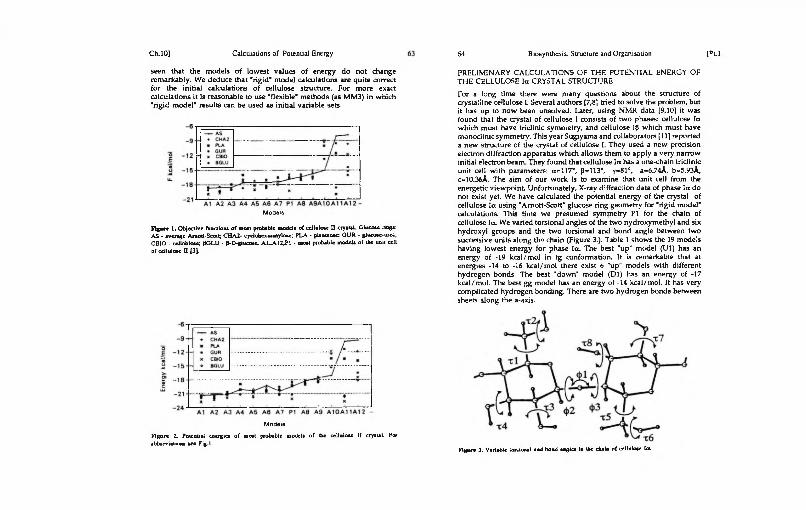
Ch.10] Calculations of Potential Energy
seen that the models of lowest values of energy do not change remarkably. We deduce that 'rigid" model calculations are quite correct for the initial calculations of cellulose structure. For more exact calculations it is reasonable to use "flexible” methods (as MM3) in which "rigid model" results can be used as initial variable sets.
Models
ftgnn I. Objective function* of moat probable model* of celluloae П cryiul Glucoac .ings: AS - average AnoO-Scott; CHA2- cydohexsamyloac; PLA - planteose: GUR - glucose-urei; CBIO - cellobioee; ßCLU - ß-D-giucoae. A1_A12.P1 - n u l probable model* of the unit cell of ccllulose Q [Э].
Models
Figure 2. Potential eneigies of moat probable models of the celluloae II crystal. For abbreviation* tee Fig 1.
64 Biosynthesis, Structure and Organisation p u
PRELIMINARY CALCULATIONS OF THE POTENTIAL ENERGY OF THE CELLULOSE la CRYSTAL STRUCTURE
For a long time there were many questions about the structure of crystalline cellulose I. Several authors [7,8] tried to solve the problem, but it has up to now been unsolved. Later, using NMR data [9,10] it was found that the crystal of cellulose I consists of two phases: cellulose [a which must have triclinic symmetry, and cellulose Iß which must have monoclinic symmetry. This year Sugiyama and collaborators [11] reported a new structure of the crystal of cellulose I. They used a new precision electron diffraction apparatus which allows them to apply a very narrow initial electron beam. They found that cellulose la has a one-chain triclinic unit cell with parameters: a=117”, ß=U3°, у=81°, а=6.74А, Ь=5.93А, с=10.3бА. The aim of our work is to examine that unit cell from the energetic viewpoint. Unfortunately, X-ray d;ffraction data of phase la do not exist yet. We have calculated the potential energy of the crystal of cellulose la using "Amott-Scott" glucose ring geometry for "rigid model" calculations. This time we presumed symmetry PI for the chain cf cellulose la. We varied torsional angles of the two nydroxymethyl and six hydroxyl groups and the two torsional and bond angle between two successive units along th? chain (Figure 3.). Table 1 shows the 19 models having lowest energy for phase la. The best "up” model (Ul) has an energy of -19 kcal/mol in tg conformation. It is remarkable that at energies -14 to -16 kcal/mol there exist b "up” models with different hydrogen bonds. The best "down" model (Dl) has an energy of -17 kcal/mol. The best gg model has an energy of -14 kcal/mol. It has very complicated hydrogen bonding. There are two hydrogen bonds between sheets along the a-axis.
Пциг» X Variable tonloaal and bond angles In tie dials of celluloae la.

Ch. 10] Calculaiions of Potential Energy
Table 1. Tbe mo« probable models of die cellulose la tridlnic wait cell.U_ * ’up' modele; D_ - ‘down* models; - variable bond and torsional angles
(see Fig. 3.); r - angle describing chain rotation; ' - H-boods in a chain; 1 - H-bonds in s sheet <1I0>; 1 - H bonds between sheets <100>.
17S -77 tg <
170 -1 tq I
171 -71 t<t (
HI -71 t-J <177 -7i t? <
osa. .os*o«a. -7S M os..aoj_‘ osa
-7» 4 OS- -"noj"oiioa..ao«'"
-j гч o»..pQS'‘ .ola la n ся..поэ-‘ oi.
oaa.-04'-* £9 03*- -O*'1 OJB-as tg os. .воз' ‘
oiioa..nos-1 -7s qt о*. .во)'* ОЭВ
Comparing these crystal energies with energies of a crystal of cellulose II which are calculated by the same method, it can seen that cellulose la has slightly higher energy minima than cellulose II. It can explained by the conversion of cellulose I into cellulose II. This conversion must be energetically profitable.
REFERENCES
1. Millane, R. P.; Narasaiah.T. V.; Polymer 1989, 60, 1763.2. Kolpak,F. J.; Weih, M.; Blackwell, J.; Polymer 1978, 19, 123.3. Pertsin, A. J.; Nugmanov, O. K.; Marchenko, G. N.; Kitaigorodsky,
A. I.; Polymer 1984, 25, 107.4. Pertsin. A. J.; Kitaigorodsky A. I.; The Atom - Atom Potential
Method Applications to Organic Molecular Solids, Springer Ser. Chem. Phys., V43, Springer-Verlag, Berlin Heidelberg New-York London Paris Tokyo, 1987.
5. French, Л. D.; Murphy, V. G.; Carbohydrate Research 1973, 27, 391.6. Chu,S. S, C , Jeffrey, G. A.; Acta Cryst. В 1970, 26, 1373.7. French, A.D.; Carbohydrate Research 1978, 61, 67.8. Gardner. К H.; Blackwell, J.; Biopolymers 1974, 13, 1975.9. Horii, F., Hirai, A.; Kitamaru, R.; Macromolecules 1987, 20, 2117.10. VanderHart, D. L.; Atalla.R H.; Macromolecules 1984, 17, 1465.11. SugiyamaJ.; Vuong, R.; Chanzy,H.; Macromolecules 1991, 24, 4108.

Antiparallel molecular models ofcrystalline cellulose5L-HL Miliriiaar aad Ah’» А |Ы м ‘ - Tartu University, Institute of General and Molecular Pathology, 34 Veiki Street, 202400 Tutu, Estonia. *Tartu University, Department o f Experimental Physics, 4 Tähe Street, 202400 Tartu, Estonia.
KEYWORD: molecular modelling, structure of cellulose I.
ABSTRACT
Antipanllel molecular structure models are proposed for cellulose I having the same geometric parameters which were established by Sugiyama et al. [1] for cellulose a and g phases.
INTRODUCTION
Although the presence of two crystalline phases in native cellulose (I) was demonstrated by NMR spectroscopy in 1984 [2.3], the exact unit cell geometries of the a and S phases were established only recently [1]. Sugiyama et al. (1) interpret their experimental data according to a parallel molecular chain hypothesis.
DISCUSSION
The aim of the present paper is to show that antiparallel cellulose molecular structures may exist having the same unit cell dimensions. Molecular modelling was carried out by Tartu plastic space-filling atomic models (4). The results of the modelling experiments allowed us to present following schemes of cellulose structure (Fig. 1-5).
58 Biosynthesis, Structure and Organisation
Figur« 1. A structure of cellulose la phase according to Sugiyama et al [1]. Symbols: white ovala * parallel chains; «.b.C-f - unit cell dimensions: numbers in ovals - the amount of c/4 shifts in the direction of c- axis of this unit cell: 6-3 • bonds 06H..03.
Figure 2. Antipanllel cellulose structure model "Ia-V". Symbols: white ovals • parallel chains; grey ovals - antiparallel chains: *,b.c,y - unit cell dimension*: number in ova to - the amount of c/4 shifts In direction of с • axis of this unit cell: 6-2 - bond* 06-H..02. Each chain(oval) contain* two Intra molecular bonds (03-H..0S' and О Т . H..06) and oxymethyl group* in tg or gg conformation.

Ch.9] Aniiparallel M olecular Models
Figure 3. Antiparallel cellulose structure model *la-P". Symbols see Fig .2.
The analysis o f schemes presented in cu rre n t paper a llo w us to suppose tha t a n t ip a r a l le l m o le c u la r structu res o f ce llu lose m ay have u n it ce ll param eters co rre sp o n d in g to those g ive n in the w o rk o f S u g iy a m a e t a l . j l j . A n t ip a r a l le l s t r u c tu r e m o d e l s s h o u l d b e c o n s i d e r e d i n t h e in te rp re ta t io n b o th o f ce llu lose I and ce llu lose II inves tiga tions [5-7].
cellulose Iß phase. Symbols see Fig.l and 2.
cellulose U. Symbols see Ftg.l. and 2.
Biosynthesis. Structure and Organisation
REFERENCES
1. Sugiyam a,]., Vuong,R ., Chanzy, H. Macromolecules 1991, 24, 4168.2. A ta lla , R. H.. V ande rH art, D. G. Science 1984, 223, 283.3. V ande rH art, D. G., A ta ila , R. H . Macromolecules 1984, 17, 1465.4. M ike lsaar, R. Trends in Biotechnology 1986, 6, 162.5. S tipanovic, A . Sarko, A . Macromolecules 1976, 9, 851.6. K o lpak, J. F., W eih, M., B lackw ell, j . Polymer 1978, 19, 123.7. Takahashi, Y., Matsunaga, H . Macromolecules 1991, 24, 3968.

IV. A a b lo o , A .; F re n ch A . D. Makromolek Chem, Theory and Simuiations
in p ress.
Preliminary Potential Energy Calculations of Cellulose la Crystal Structure.
A lvo ЛаЫооTarlu U niversity , D epartm en t o f Experim ental Physics, Tähe 4 S treet, 202400 T artu , Estonia
A lfre d D. F rench*Southern Regional R esearch C en ter, U .S . D epartm ent o f A gricu lture , 1100 Robert E. Lee B lvd ., P .O . Box 19687, New O rleans, LA 70179, U . S. A.
(R eceived: J a n u a r y 1993)
SU M M A K Y :
Packing energy ca lcu lations w ere used to evaluate various m odels o f l a
cellulose, based on u n it cell d im ensions proposed by Sugiyam a et al. Both a
rigid-ring m ethod, P L M R , and a fuli-optirm zation m olecular m echanics
technique, M M 3, w ere used . T h e m odel found to be best w ith both m ethods
was packed "up" (the z coord ina te o f 0 (5 ) is grea te r than that o f C (5)); 0 (6 )
atom s w ere in tg po sitio n s , form ing sheets o f hydrogen bonded chains. W ith
the PLM R p ro g ram , th e energy o f the best m odel was alm ost 3 kcal/m ol low er
than the second best m odel. T h e M M 3 studies also showed substantially h igher
energ ies for the a lte rn a tiv e m odels. A lso, som e alternative PLM R m odels had
substantially higher a to m ic m ovem ent during M M 3 optim isation.
Several years a g o , V anderH art and A talla found that all crysta lline native
cellulose I is com posed o f tw o phases M ore recently , Sugiyam a et al.
characterized those tw o p hases in M icrodictyon tenuius with selected area
electron d iffraction techn iques T w o unit cells w ere resolved, a m onoclinic,
two-chain cell and a triclinic, one-chain cell. W hen roughly equivalent amounts
of both phases diffract sim ultaneously, the resulting diffraction pattern is
identical to the pattern first indexed as an eight-chain cell by Honjo and
W atanabe T hus, the eight-chain cell is apparently an artifact of the previous
diffraction techniques. Previous structural studies w ere based on the
assum ption that cellulose I is only a single phase. Since those patterns
contained inform ation from two phases, new studies o f cellulose 1 structu re are
needed.
H ow ever, x-ray diffraction data are not yet available, so it is useful to
propose a crysta l structure based on m odeling m ethods. T he triclinic, one-
chain unit cell is especially conducive to structural studies using packing energy
because the variety o f possible structures is m inimal. All proposals m ust be
based on parallel chains, and each chain must be identical with its neighbors.
This com m unication reports the results o f two d ifferent types o f packing energy
calculations using various m odels o f l a cellulose. All studies used the cell
param eters a = 6 .74 Ä, b = 5 93 A, c = 10.36Ä, a = l l 7 ° , /3= 113° and 7 = 81°,
as published by Sugiyama et al. The present w ork shows that reasonable
models ex ist for those published unit cell dim ensions. O ur w ork is also part o f
a larger pro ject to screen , with m olecular m echanics, s tructures first proposed
based on fiber diffraction studies.

T he first m ethod used to select likely structu res was based on the PLM R
program developed by Pertsin and K itaigorodsky 4-5*. It kept the A m ott-
Scott 6) residues used in the starting structures rigid except for orien tation o f the
p rim ary and seco n d ary alcohol g roups (see Fig. 1). T he chain was free to
rotate about its ax is in the unit cell, and the torsion angles and bond angles at
the glycosidic linkages w ere allow ed to vary , consistent with the P t space
group. In the second m ethod , m odel cellulose crysta ls w ere built o f seven
ceilotetraose m olecu les, placed in a m anner sim ilar to hexagonal c lose packing,
but w ith the chains a rran g ed accord ing to the l a unit cell d im ensions (see Fig.
2). T h e starting s tru c tu res w ere based on the best m odels from the PL M R
w ork. T h e m odel c ry sta ls w ere optim ized with the m olecular m echanics
p rogram , M M 3 7,8\ a llow ing all atom s to seek positions o f m inim um energy.
In the M M 3 o p tim izations, th ere w ere no restric tions o f any kind on atom ic
m ovem ent o ther than th o se o f the relatively com plex M M 3 force field. Unlike
the P L M R pro g ram , M M 3 req u ires the neighboring m olecules to be explicitly
included. B ecause M M 3 , as d istribu ted , has a lim it o f 700 atom s, w e used a
relatively sm all m odel, s im ila r to the initial nucleus that eventually grow s into a
crystal. F o r this reaso n , ceilo te traose m olecules w ere chosen to rep resen t the
very long cellu lose chain m olecules.
In the PLM R calculations, the potential energy consisted of
intram onom eric, junction and interm oiecular values. The intram onom eric term
consisted o f torsional potentials for the side group rotations. T he junctional
energy consisted o f torsional potentials for the rotations, bending potentials for
the angles, and interm onom eric hydrogen bonding and van der W aals term s.
The interm oiecular term consisted o f hydrogen bonding and van der W aals
term s. The starting models used in the PLM R calculations w ere based on an
assum ption that the cellulose chains would be centered in the unit cell and
aligned approxim ately with the 110 plane as shown in Fig. 2; chain rotation
was also one o f the refined param eters. Surveys indicated the likely
orientations o f the side groups, and about 500 o f the most likely structures were
energy-m inim ized, based on Pow ell’s quasi-New ton algorithm .
Thirty five o f the 500 m odels optim ized to give PLM R energ ies lower
than -10 kcal/m ol, o f which the 10 lowest are in T able 1. T he best “u p “ model
(U l) has an energy o f -19 kcal/m ol. This value can be com pared w ith the
value o f -21 kcal/m ol for a m odel o f cellulose II calculated with the same
m ethod. (These a rb itrary energies are for a cellobiose unit in either case).
Although U l is lower in energy than the others in T able 1 by about
3 kcal/m ol, there are six m odels within -14 to -16 kcal. The best “d ow n“
m odel (D l) has an energy o f -17 kcal/m ol. T he best nine m odels have 0 (6 ) in

the lg conform ation. T he best gg m odel has an energy o f -14 kcal/m ol, and the
best gt model is even h igher in energy at -12 kcal/m ol. T h e gg m odels all have
com plicated hydrogen bonding system s (see T able 2).
In the M M 3 studies, the energy optim ization option w as used , as was a
dielectric constant o f 4 . This value was also chosen for studies o f crystalline
am ides, polypeptides and p ro te in s.10* H ydroxyl hydrogen atom s on 0 (1 ) and
0 (4 ) on the ends o f the tetram ers w ere m anually adjusted to positions that gave
low energy and perm itted m inim ization to reach a norm al term ination . The
m ean atom ic m ovem ent (Table 3) after a least squares fit w as com puted using
C H E M -X 9). T hese m ean atom ic m ovem ents w ere calcu lated both w ith the
hydrogen atom s included and excluded. They show the d iffe ren ces betw een the
struc tu res as determ ined by PL M R and the final M M 3 stru c tu res . T h e energy
o f the m odel crystal is affected by all o f the intra- and as well as the in ter
m olecular interactions, so the M M 3 calculations a re poten tially m ore valid than
rigid residue calculations that do not contain in tra -residue bending and
stre tch ing energies. T h e m ean atom ic m ovem ent resu lting from M M 3
optim ization show s the ex tent o f agreem ent o f the tw o m ethods.
Tab le 3 shows that U1 is sup erio r accord ing to the energy values from
both the M M 3 and the P L M R calculations. T he m ean atom ic m ovem ents for
U1 are also lower than for som e o f the o ther s tru c tu res . C oord in ates for the
М М З-optimized U l model are in T able 4 , and the optim ized values o f the
PLM R variables are given in T able 1. Because o f slight distortions within the
M M 3 m odel, the value o f the chain rotation, e, loses its m eaning and was not
calculated, despite the freedom for the chain to rotate during MM3
optim ization. T h e best gg m odel, U7, is c learly w orse than the others, based
on the m ovem ent criterion . US, with unusually low m ovem ent but high energy,
appears to have been trapped in a high-energy local m inim um . Tw o o f the
structures determ ined with PLM R , U3 and U 4, w ere not stable in the M M 3
force field, despite low m ovem ents o f the non-hydrogen atom s, because
hydrogen bonds w ere form ed, giving s tructures sim ilar to U l . T he relatively
high m ovem ents o f hydrogen atom s show that the structure changed to form the
hydrogen bonds (T able 3). Despite the sim ilarity with U l fo r the U3 and U4
chains that could form hydrogen bonds, the hydroxyl groups on the o ther chains
in the m odels rem ained in their initial conform ations, hence the high energies of
the final models.
T he M M 3 energy values in Table 3 can be com pared with our values of
200 kcal/m ol11* calculated for W oodcock and S a rk o ’s ram ie cellulose
s tru c tu re12̂ and 176 kcal/m ol for Stipanovic and S a rk o ’s structure o f cellulose
II 13). T he m ovem ent values can be com pared w ith non-hydrogen m ovem ents
that we calculated for a sim ilar m odel crystals o f sm all carbohydrates (0 .09 to

R eferences.
1. D. L . V an d erH art, R. H . Atalla, M acrom olecules 17, 1465 (1984)
2. J. Sugiyam a. R. V uong, H. C hanzy, M acrom olecules 24 , 4108 (1991)
3 G. H onjo, M . W atanabe, Nature 181, 326 (1958)
4. A. J. Pertsin , A . I. K itaigorodsky, "The A tom - A tom Potentia l M ethod
Applica tions to O rganic M olecular Solids", S pringer S er C hem . Phys.,
V43, S pringer-V erlag , Berlin, 1987.
5. A. J. Pertsin , O . K. N ugm anov, G. N . M archenko, A . I. K itaigorodsky,
P olym er 25 , 107 (1984)
6. S. A m ott, W . E. Scott, J. Chem. Soc. Perkin II, 324 (1972)
7. N. L . A llinger, Y . H . Y uh, I.-H . L ii, J. Am er. Chem . Soc. U l , 8551
(1989)
8. N. L . A llinger, M . Rahm an, J .-H . Lii, J. Am er. Chem. Soc. 112, 8293
(1990)
9. C H E M -X is developed and distributed by C hem ical D esign L td ., O xford,
England.
10. J .-H . Lii and N . L . A llinger, J. Comput. Chem. 12, 186 (1991)
11. A. D . F rench , D. P . M iller and A. Aabloo, Int. J. Biol. M acrom ol. 15,
30 (1993)
12. C . W oodcock, A. S a rk o , M acrom olecules 13, 1183 (1980)
13. A. J. Stipanovic, A . Sarko, M acrom olecules 9, 851 (1976)
0 .209 A )n \ Based on continuing work with these small model crystals, we
now believe that m ovem ents o f much less than 0 .20 Ä correspond to structures
that a re not fully optim ized because of difficulties1 ^ with block-diagonal M M 3
optim izations. The value of energy for U l is higher than the cellulose II
energy , as would be expected. If U l and the cellulose II structure are correct,
then the proposed ram ie structure may not be correct for cellulose Iß, since
annealing cellulose l a converts it to 1/3. Therefore, the energy o f 1/3 should be
low er than the l a energy. Still, the closeness o f the energy values for several
m odels from both the PLM R and M M 3 m ethods indicate that the conclusive
determ ination o f the crystal structures of these new phases will be difficult.

Table 1. Most probable PLMR models of the cellulose la triclinic unit cell.
U - "up" models; D - "down" models: Variable angles: rl=C 4-C 5-C 6-06, r2 = C5-C6-06-H,
r3= C l-C 2-02-H , r4=C2-C3-03-H, t5 = C 4 ’-C5’-C6,-0 6 ,) t6 = C 5 ’-C6’-0 6 ’-H \
t 7 = С1 ’-C 2'-02’-H, r8= C 2’-C3’-0 3 ’-H’, ф 1=С 1-04’-С 4 \ ф 2=05-С 1-01-С 4\
$3 =C 1-01-C 4’-C5’ (see Fig. 1); e - angle describing chain rotation.
EnergyModel kcal/mol T l T 2 T 3 Т 4 ф 1 Ф2 * 3 T 5 r e T 7 T 8 ( 0 6 1
Ul -19.5 -71 -116 52 -175 118 -93 -146 -73 -166 52 -175 77 tg
D1 -16.8 -59 -166 53 -168 117 -87 -143 -74 -163 53 -170 1 tg
U2 -16.3 -69 61 164 -168 119 -92 -148 -72 63 170 -171 72 tg
U3 -16.2 -68 -102 56 -161 115 -94 -147 -69 -102 56 -161 78 tg
U4 -15.7 -64 -60 79 -177 116 -95 -146 -66 -57 79 -177 79 tg
US -15.0 -69 -34 54 -72 116 -94 -146 -71 -35 54 -72 78 tg
Ü« -14.3 -•101 -162 52 -161 115 -94 -147 -101 -162 52 -161 79 tg
02 -14.3 -50 -108 55 -168 119 -83 -143 -70 -109 56 -171 6 tg
D3 -14.2 -53 53 150 -175 119 -83 -138 -72 50 150 -177 1 tg
U7 -14. 1 35 62 45 -185 115 -100 -138 17 113 -24 -186 97 gg
Ul (after MM3 optimization)
-65 -167 61 155 116 -92 -150 -75 -158 60 -177 - tg

T a b le 2 . H ydrogen b o nds o f ten most probable P L M R m odels o f the
cellu lose l a crysta l,
U - “up" m odels; D - "down" m odels; * - H -bonds in a chain;
2 - H -bonds in sheets parallel to the < 110 > planes; 3 - H -bonds
betw een sh eets (parallel to the < 1 0 0 > p lanes); * - H -bonds which
w ere found by M M 3.
U l t g 0 5 . НОЗ 1 0 2 Я . О б ' 1 06H. .ОЗ2
D1 t g 0 5 . НОЗ 1 0 2 H . О б ' 1 06H. .ОЗ2
02 t g 0 5 . H03 1 0 1 ; 0 2 . . H O 6 ' 1
Ü3 t g 0 5 . H03 1 0 2 H . О б ' 1 ОбН. .ОЗ4
04 t g 0 5 . НОЗ 1 0 2 H . О б ' 1 ОбН. .ОЗ4
OS t g 02H . 0 6 1 ОЗН. Об2
06 t g 0 5 . НОЗ 1 0 6 H . о о
02 ft 0 5 . H03 1 0 2 H . О б ' 1 ОбН. .ОЗ2
D3 rt vfl 0 5 . H03 1 0 1 ; 0 2 . . H 0 6 ' 1
07 gg 0 5 . .НОЗ 1 0 2 H . О б ' 1 ОбН. . 0 5 3
T a b le 3. T he results o f PLM R energy (kcal/m ol o f cellobiose residues) and
M M 3 energy (kcal/m ol o f seven tetraose units) calculations. For
M M 3, PL M R m odels were used as input. M ean deviations (A) are
calculated w ith hydrogens and without hydrogens.
Mean a to m mo ve m en tPLMR ммз w i t h w i t h o u t
H ' s H ' s
U1 - 1 9 . 5 185 . 1 7 5 . 1 0 6 up t g
D1 - 1 6 . 8 206 . 1 5 8 . 1 0 8 down t gU2 - 1 6 . 3 222 . 1 7 8 . 1 4 8 up t gиз - 1 6 . 2 218 . 1 7 7 . 0 9 2 up t gU4 - 1 5 . 7 2 15 . 193 . 0 9 8 up t gÜ5 - 1 5 . 0 234 . 0 5 6 . 0 3 5 up t gU6 - 1 4 . 3 2 10 . 2 5 7 . 1 6 3 up t gD2 - 1 4 . 3 206 . 2 3 2 . 1 5 8 down t gD3 - 1 4 . 2 213 . 2 7 7 . 2 3 4 down t gU7 - 1 4 . 1 229 . 4 5 1 . 3 8 4 up g g
0 6 H . . 0 3 f o r m a t i o n
0 6 H . . 0 3 f o r m a t i o n

T a b le 4.
Naa*
1 042 C43 C54 05
5 C l6 C27 СЭ8 C69 0 4 '
10 02
11 0312 H-C413 H-C5
14 H -C l
15 H-C216 H-C317 06
18 H -C6a19 H -C 6b20 H -0 621 H -0222 H -03
23 С4 '
2 4 C 5 '
25 0 5 '
26 C l '27 C 2'28 C3 '
29 C6'
C a r te s ia n c o o rd in a te s o f th e best m odel (U l) o f cellulose Icr.
T h e a to m s a r e from the c e n tra l tw o res id u es in th e m idd le o f
th e m in ic ry s ta l.
x<&)
.00000
. 2 1 1 4 2
. 7 2 7 9 7
. 8 1 1 2 7
- . 4 6 4 4 8
- 1 . 0 2 5 1 4
- 1 . 1 4 7 3 4 2 . 1 3 8 7 7
- . 3 0 1 6 0
- 2 . 3 4 4 9 0
- 1 . 5 0 4 2 6
. 9 4 0 9 4
. 0 4 3 3 6
- 1 . 1 5 3 7 2
- . 3 8 3 3 5
- 1 . 9 2 1 4 4
2 . 1 4 3 2 1
2 . 8 3 9 7 5
2 . 4 9 7 7 9
2 . 9 7 1 2 8 - 2 . 2 6 7 9 7
- 1 . 5 1 7 1 2
- . 3 9 9 3 1
- . 9 4 2 1 7
- . 9 8 5 3 8
. 3 1 1 9 9
. 9 1 2 8 3
. 9 9 3 3 6
- 2 . 3 7 8 2 1
y<*>
.00000
. 7 5 4 1 7
- . 1 8 6 7 0
. 5 4 1 8 2
. 9 7 2 2 8
1 . 9 7 5 3 0 1 . 3 2 9 0 7
- . 6 9 3 1 5
1 . 6 7 4 0 8
2 . 3 1 5 0 6
2 . 3 5 0 8 2 1 . 5 7 6 5 7
- 1 . 0 5 5 2 1
. 1 1 0 6 5 2 . 8 8 2 7 5
. 5 2 8 2 2
- 1 . 5 0 4 9 8
. 1 5 6 3 9
- 1 . 2 8 9 4 3
- 1 . 9 6 7 5 8
2 . 7 1 5 5 5 1 . 9 5 1 2 8
. 8 9 3 1 0
1 . 8 3 1 4 9
1 . 1 1 9 7 9
. 7 5 2 5 2
- . 2 2 9 0 0
. 3 9 8 2 3
2 . 2 8 4 1 9
I (A)
.00000 1 . 2 0 3 1 7
2 . 2 9 6 2 2
3 . 5 1 6 8 1
3 . 9 8 6 0 0
2 . 9 8 2 4 0
1 . 6 0 4 8 8
2 . 0 1 5 9 4 5 . 1 9 6 7 7
3 . 4 2 4 3 2
. 6 6 1 6 8 1 . 0 2 3 9 8
2 . 4 1 7 7 6
4 . 1 0 3 4 4 2 . 9 2 7 6 9
1 . 6 2 4 2 1
. 8 3 4 8 3
1 . 8 8 7 0 9
2 . 8 8 0 3 6
. 8 0 1 9 6
4 . 2 8 1 9 9 - . 1 9 8 5 7
6 . 3 8 6 6 9
7 . 4 7 4 2 8
8 . 7 0 7 7 9
9 . 1 7 5 7 6
8 . 1 7 6 7 5
6 . 7 8 7 3 2 7 . 2 0 2 4 1
13
30 02 *31 0 3 '32 H-C 4 '
33 H-C 5 *
34 H -C l '
3 5 H -C 2 '36 H-C3'37 0 6 '
38 H-C6 a'
39 H-C6b'40 H - 0 6 '
41 H - 0 2 '42 H - 0 3 '
2 . 2 5 1 3 4 1 . 4 1 1 7 1
- 1 . 1 0 1 0 6 - . 2 8 9 3 0
. 9 6 5 5 5
. 3 1 3 7 2
1 . 7 2 3 4 6
- 2 . 4 0 7 4 5
- 3 . 0 1 7 4 1
- 2 . 8 0 8 8 9
- 3 . 2 0 9 8 8 2 . 1 9 9 2 7
1 . 5 0 3 2 7
- . 5 0 4 5 8 - . 6 3 9 4 4
. 0 3 9 2 2 2 . 7 2 6 5 3
1 . 6 4 2 3 1
- 1 . 1 6 6 0 2 1 . 2 3 8 6 8
3 . 2 5 9 7 8
1 . 4 1 9 6 1
2 . 7 2 8 1 7
3 . 7 6 0 2 5
- . 8 8 6 9 2
- . 2 5 6 0 2
8 . 6 0 7 1 5 5 . 8 8 9 1 2 6 . 2 6 0 7 1
7 . 5 8 1 0 3
9 . 2 8 8 9 5
8 . 1 3 9 6 6
6 . 7 8 6 0 5
6 . 1 5 0 4 1
6 . 9 2 7 4 4 8 . 1 2 5 5 0
6 . 2 3 7 2 0 9 . 4 7 4 7 1
5 . 0 2 6 9 7

A unit o f the cellulose chain showing the num bering of the ring and
glycosidic atoms and the torsion and bond angle variables of the PLMR
program .
Вo o t
В I 0 Ю
Mod
el
Ul,
afte
r M
M3
min
imiz
atio
n,
show
ing
the
unit
cell
para
met
ers
a,
b an
d y.
Th
e vie
w is
dow
n the
ch
ain
axes
of
the
seve
n te
tram
ers.
Inte
rmoi
ecul
ar
hydr
ogen
bo
ndin
g oc
curs
in
the
110
plan
es
of the
cr
ysta
l
(the
plan
es
are
defin
ed
in in
set)
.

Studies of Crystalline Native Celluloses Using Potential Energy Calculations.
Running Title: Model Cellulose ia and \ß
Alvo Aabloo' U n ive rs ity o f Tartu , Ins titu te o f Experimental Physics and Technology, Tähe 4 S tree t, EE2400 Tartu Estonia; Alfred D. French Southern Regional Research Center, U. S. Departm ent o f A gricu ltu re , 110 0 Robert E. Lee B lvd., P. 0 . Box 1Э 687, N ew Orleans, LA 7 0 1 7 9 , U. S. A ; Raik-Hiio Mikelsaar U niversity o f Tartu, Ins titu te of General and M olecular Pathology, Veski 35 S treet, EE2400 Tartu, Estonia; Aleksandr J. Pertain Ins titu te o f Element-Organic Com pounds, Vavilova 28 S tree t, GSP1, V -3 3 4 , 1 1 7 8 1 3 M oscow , Russia.
Keywords: Cellulose I, molecular mechanics, crystal structure, phase change, modelling
AbstractEnergies for various trial packing arrangements of unit cells for the I a and \ß phases of native
cellulose discovered by Sugiyama et al. were evaluated. Both a rigid-ring method, PLMR, and the full-
optimization, molecular mechanics program, MM3(90) were used. For both phases, the models that
had lowest PLMR energy also had the lowest MM3 energy. Both have the chains packed "up", 0-6 's
in tg positions, and the same sheets of hydrogen bonded chains. The \ß structure is essentially identical to the structure proposed previously for ramie cellulose by Woodcock and Sarko. It is also the same
as the best parallel model previously proposed that was based on the X-ray data of Mann, Gonzalez
and Wellard, once the various unit cell conventions are considered. Also, the energies from both
methods for all three celluloses, la, \ß and II are in the order that rationalizes their relative stabilities.
Introduction
The tw o main forms of cellulose are I, the major native type, and II, which occurs after
mercerization or regeneration. A proposal for the solid-state conversion from I into cellulose II, including different intermediates, is described elsewhere (Nishimura et al., 1991, Nishimura and Sarko, 1991)
Some years ago, it was discovered (VanderHart and Atalla, 1984, Atalla and VanderHart, 1984) that
native cellulose occurs mostly as combinations of the tw o phases, la and \ß. Depending on the sample,
these phases are in different ratios. For example, the ratio \al\ß was estimated to be 65% /35% for Valonia cellulose (VanderHart and Atalla, 1984). Initially, electron diffraction patterns from this mixture
were indexed based on an 8-chain unit cell (Honjo and Watanabe, 1958). More recently, however,
electron diffraction from small selected areas of the same microfibril showed tw o patterns that were
interpreted (Sugiyama et al., 1991) to have, respectively, one-chain, triclinic and two-chain monoclinic unit cells. One of the most important conclusions from the finding of a 1-chain unit cell is that the chains must have a parallel orientation, i.e. the reducing ends of the cellulose molecules must all be
at the same end in a given microfibril. Because both phases are found within the same microfibril in
that work, the conclusion of parallel packing for \ß is almost inescapable.
Several decades ago, Ränby (1952) showed that cellulose II is slightly more stable than
cellulose I, by about 2 cal/gram or 0.3 kcal/mol of glucose residues. Because hydrothermal annealing
converts mixtures of la and \ß into pure \ß (Horii et al., 1987), it is thought that \ß is more stable than
la. As X-ray diffraction intensity data for the pure phases of native cellulose are yet not available, it

is reasonable to propose structures based on energy calculations. This was especially so for I a,
because of the limited number of variables that must be considered for a 1-chain model, and our
preliminary results for I a were already published (Aabloo and French, in press). In the present work we
have studied various possible model structures for the I a and \ß celluloses, based on the published unit
cell dimensions and on calculated packing energy. These results are then compared w ith other work.
Methods.All of our computer models consisted of parallel chains and were based on published unit cell
dimensions (Sugiyama et al., 1991). For I a, a = 6.74 Ä, b = 5.93 Л, с = 10.36 Ä, a = 1 1 7 ° , /3=113°
and к= 8 1 °, and for I/?, a = 8.01 Ä, b = 8 .17Ä, c= 10.36Ä, o = 90 °, 0 = 90° and к = 9 7 .3 ° . Space group
P1 was used for the I a form, and the cellulose \ß chain models conformed to space group P2,. We used
tw o different methods to calculate packing energies, PLMR and MM3. The PLMR (derived from a word
polymer) program, described by Pertsin et al. (1984) and Pertsin and Kitaigorodsky (1987), uses a
"rigid-ring" strategy. In PLMR models of the cellulose chains, most of the intraresidue parameters of
the glucose rings are kept at average values reported by Arnott and Scott (1972). Only the exocyclic torsion angles r, (see Fig. 1) that locate the hydroxymethyl and three hydroxyl groups were varied. The
chains were free to rotate about their axes in the unit cell. The angles </>, describe those rotations. They
are defined as the angles formed by vectors A (see Fig. 2) and projection of the unit cell axes
a' =a*cos(K-tf/2). For I a, the torsion angles and bond angles at the glycosidic linkages were allowed to vary. For I/?, the monomer residues were linked to form the chain w ith the variable virtual bond
method (Zugenmaier and Sarko, 1980). Keeping 2, symmetry requires an additional parameter that
characterizes the chain conformation (see Fig. 2). The angle 6 describes rotation of the monomer
residue about the 0 4 -0 4 ' virtual bond. It is defined by three vectors A, fJ, and v. The vector A is perpendicular to the с-axis, и is along the 04-C4 bond, and v is along the 0 4 - 0 4 ’ virtual bond. The
angle 6 is the dihedral angle between the plane f/v and the plane vA. In the variable virtual bond
method, the conformational parameters at the junction of tw o successive residues are not independent
variables, but are implicit functions of h (the rise per monomer along the c-axis), 6 and the residue conformation. For the two-chain unit cell, one more parameter, s, characterizes the vertical shift, or
stagger, of the central chain. In all, there were 1 2 independent variables to be minimized for I a and 13
for I/?. One binary variable parameter defines the chain direction as "up" or "dow n". A chain is "up"
if the z coordinate of 0-5 is greater than the z-coordinate of C-5.The PLMR potential energy U includes the intramonomer energy, junction energy, and
intermolecular energy:U = Umon+ U,unc,+ Uinttr
in which Umi)n includes the torsional and nonbonded contributions from dihedral angles and nonbonded contacts that are influenced by variation of the monomer parameters r . Briefly, U|unc, includes
contributions from the bending of the glycosidic bond angle, from the torsional angles at the junction
and from non-bonded contacts between two successive residues. U,nte, includes nonbonded interactions
between the atoms belonging to different chains, consisting of hydrogen bonding and van der Waals terms. Previously published formulas and the values of parameters are used to calculate bond angle energies (Pertsin and Kitaigordsky, 1987). A Morse-like equation is used for hydrogen bond modelling
and a 6th order exponential potential function is used for van der Waals calculations (Pertsin and

Kitaigordsky, 1987). As PLMR uses continuous chains, no electrostatic interactions were considered
Calculations were executed in internal coordinates. PLMR uses periodic boundary conditions to
calculate the interchain energies.Model cellulose crystals for the MM3(90) (Allinger et al., 1989, Allinger et al., 1990) molecular
mechanics calculations were built of seven cellotetraose molecules which represented the very long cellulose chain molecules. They were placed in a manner similar to hexagonal close packing, but conformed to the unit cell dimensions. Terminating 0-4 and 0 -1 ” ' hydrogens were moved manually
to positions that gave low energy. The dielectric constant was 4.0, a value used for crystalline amides,
polypeptides and proteins (Lii and Allinger, 1991). Starting structures in the MM3 calculations were
taken from the best models from the PLMR process. The model crystals were optimized w ith MM3(90)
w ith no restrictions such as unit cell dimensions or space group. All atoms were allowed to seek
positions of minimum energy. The MM3 minimization process should be more valid than rigid-residue
calculations because the molecule can relax and adapt to the local environment. Also, the energies calculated by MM3 are likely to be fairly accurate; the standard deviation in calculated heat of formation for 40 isolated alcohols and ethers was 0.38 kcal/mol, although energies for the minicrystals
may be less accurate. On the other hand, MM3 takes considerable computer time to optimize a
miniature crystal. PLMR rapidly scanned hundreds of trial structures and maintained the unit cell
dimensions precisely.
Using these two minimization processes we got most probable models for both crystalline
phases of cellulose. To learn the differences between the structures determined by PLMR and by MM3,
we computed mean atomic movement using a routine in CHEM-X, developed and distributed by
Chemical Design, Ltd, Oxford, U. K. These atomic movements were calculated w ith the hydrogen atoms included and excluded. The mean atomic movement indicates the degree of stability of the
PLMR models in the MM3 force field. Some lattice expansion in the miniature crystal models is
expected, because they are small, and do not fully account for long-range forces present in the
somewhat larger actual microfibrils. However, the movements for the best cellulose models are somewhat smaller than computed for fully optimized similar models of small carbohydrate molecules
(about O .lk ) . This is because the averaged molecular geometries in the PLMR starting models are not
changad as much by MM3 optimization as are structures determined individually by diffraction
methods. Also, the crystals of the small molecules are much larger than cellulose microfibrils, and their long range forces result in slightly greater lattice compression.
The starting models for PLMR were developed with Tartu space filling models (Mikelsaar, 1986)
and computer graphics modeling. To avoid missing some reasonable energy minima we built several
models in the regions of conformational space where we found structures having low energies. We also tried many models in other regions. The initial sets of starting models consisted of about five
hundred models. "Up" and "down" starting models were constructed independently for both polymorphs la and I/?.

Results and discussion
Cellulose la
The models having the six lowest PLMR energies for Iff are presented in Table 1. The best model, U„1, has an energy of -19.5 kcal/mol of cellobiose residues and is packed "up". The energy
value can be compared w ith the value of -21.4 kcal/mol for a model of cellulose II calculated w ith same
method (Pertsin et al., 1984). The best "dow n” model has an energy of -16.8 kcal/mol and is in second
place. All six models have 0-6 in the tg conformation. The best gg model had an energy of
-14.1 kcal/mol and the best gt mode! had an energy of -12.3 kcal/mol. The hydrogen bonds of these
six models are listed in Table 3. The gg and gt models had very complicated hydrogen bonding
systems.
The structures having the lowest PLMR energies were then minimized using MM3. The best model, U01, kept its leading position, but some other models changed places (Table 3). Table 3 also
presents mean atomic movements. The structure U„1 preserves its conformation after MM3
minimization. Its MM3 energy is 185 kcal/mol for the assembly of 28 glucose residues. The structures
U„3 and Ua4 were not stable in the MM3 force field, but were trapped during PLMR minimization
because of the use of rigid residues. These models optimized to structures similar to U01 in the MM3
calculations. The coordinates of atoms in the PLMR-minimized la structure are in Table 4.
Cellulose Iß
The models w ith the seven lowest PLMR energies for \ß are shown in Table 2. The best model,
U ^ l, has an energy of -19.9 kcal/mol. It is packed "up", and has 0-6 in tg positions. The best gg and
gt models had energies higher than -12 kcal/mol. Model \Jß2 has the same hydrogen bonding scheme
(Table 3) and chain conformation as U#1, and differs only in the shift of the central chain.
The results of minimizing these seven structures with MM3 are shown in Table 3. As with the
la studies, the model best by PLMR calculations also gave the lowest MM3 energy for \ß, 182 kcal/mol.
This was slightly lower than for the la model and slightly higher than for cellulose II. Also shown are the mean atomic movements. It seems that models U#2, Ц,3 and U#4 were trapped in local minima in
the PLMR calculations. Structures U„2 and Ц 4 had high movements of oxygen atoms during MM3
minimizations. Thus, those PLMR structures were substantially disrupted by MM3 optimization. As in
the PLMR work on la, the U3 structure did not have any intersheet hydrogen bonds. MM3 minimization did result in such hydrogen bonds for the U3 model, showing that these structures were caught in local
minima in the PLMR studies and are not really stable. Structure U„6 also formed new, intersheet
hydrogen bonds during MM3 minimization.
Structure U„1 is essentially identical to the structure proposed by Woodcock and Sarko for ramie cellulose I on the basis of X-ray fiber diffraction data and the limited force field incorporated in
the PS-79 software (Woodcock and Sarko, 1980). Our previously published (French et al., 1993) value
of 201 kcal/mol for the MM3 energy of their structure is in error because our model was inadvertently
an incorrect representative of their structure. In our incorrect model, the central chain was translated
in the opposite direction, causing the high energy. The U#1 structure is also the same as the best

parallel model proposed (Pertsin et al., 1986) based on the PLMR program and the fiber diffraction data of Mann et al., (1958), once adjustments are made for the differences in unit cell conventions (French
and Howley, 1989). The coordinates of atoms in the PLMR model of \ß are in Table 5.Despite the difficulties w ith the application of M M 3to miniature crystals of cellulose that were
documented in earlier (French et al., 1993), both minimization procedures agreed on the most probable
structures for I a and \ß cellulose, models U„1 and U#1. PLMR energies for cellulose I a, \ß and II were
-19.5, -19.9 and -21.4 (Pertsin et al.,1984) kcal/mol of cellobiose units. MM3(90) energies for the
same series were 185, 182 and 181 kcal for the 7-chain minicrystals. (To obtain 181 kcal/mol for II,
both model structures of cellulose II must be averaged, i.e., the model composed of four up gt chains and three down tg chains must be balanced by the model with four up tg chains and three down g t
chains.) These trends of relative energies agree well with experiment. The energies of both phases
of cellulose I are slightly higher than the energy of cellulose II, as expected from Ränby's experimental
difference of 0.6 kcal/mol of cellobiose units.The energies of la and I/? are very close. This may explain why these celluloses coexist in a
single microfibril. Both models have the same hydrogen bonding schemes. The conversion from la to
\ß may take place by a vertical shifting of sheets. During a modeled shift of sheets, w ithout change in the lateral dimensions of the unit cell, PLMR calculations gave a barrier of 9 kcal/mol. Fully optimized
structures with annealing conditions would probably give a barrier w ith lower energy.The finding of the same hydrogen bonds in both systems conflicts w ith the conclusions of
Wiley and Atalla (1987), who found that the hydrogen bonds must change during conversion from la
to I/?. However, O-H stretching frequencies are easily affected by very small structural differences, and
the Wiley-Atalia results may not indicate important differences in the hydrogen bonding schemes.lt is
remarkable that the structures of \ß cellulose obtained by three different methods agree so well. The
unit cells varied by 0.23 Ä in the x-axis direction, as well as smaller differences in the other
dimensions, and the energy functions differed substantially among the PS-79, PLMR and MM3 methods. Finally, the models in the earlier studies/ were affected by fiber diffraction intensity data, known to have low reliability (French et al., 1987), while the unit cell dimensions were the only
experimental data in the present calculations. The packing energies of both phases of cellulose I and
of cellulose II are all very close, and the errors in the minicrystal modeling calculations are unknown.
Since fiber diffraction methods depend on modeling studies for discrimination between alternative
models, conclusive results will be difficult to obtain, even when diffraction intensities are available.
Conclusions
Available experimental diffraction and calorimetric data for cellulose I and II have been rationalized by computer models. Because the predicted energies were in qualitative agreement with experimental values, and because the structure predicted for cellulose \ß matched tw o based on fiber
diffraction data, the method herein appears to be worth further development. According to these
calculations, cellulose la and \ß are each at local minima and thus metastable.

References
A. Aabloo and A. D. French, Preliminary potential energy calculations of cellulose I a crystal structure, Macromolek. Chem., Theory and Simulations, in press.
N. L. Allinger, Y. H. Yuh and J.-H. Lii, Molecular Mechanics. The MM3 Force Field fo r Hydrocarbons.J. Amer. Chem. Soc. 111, 8551-8566 (1989)
N. L. Allinger, M. Rahman and J.-H. Lii, A molecular mechanics force field (MM3) for alcohols and ethers. J. Amer.Chem. Soc. 112, 8293-8307 (1990)
S. Arnott and W. E. Scott, Accurate X-ray diffraction analysis of fibrous polysaccharides containing pyranose rings. Part I. The linked-atom approach, J. Chem Soc Perkin II, 324 (1972)
R. H. Atalla and D. L. VanderHart, Native cellulose: a composite of tw o distinct crystalline forms, Science 223, 283 (1984)
A. D. French and P. S. Howley, Comparisons of structures proposed for cellulose. Cellulose and Wood - Chemistry and Technology, C. Schuerch, ed., John Wiley & Sons, New York, p. 159-167, 1989
A. D. French, D. P. Miller and A. Aabloo, Miniature crystal models of cellulose polymorphs and other carbohydrates, Int. J. Biol. MacromoLAb, 1993, 30-36.
A. D. French, W. A. Roughead and D. P. Miller, X-ray diffraction studies of ramie cellulose I. ACS Symposium Series 340, 15-37 (1987)
G. Honjo and M. Watanabe, Examination of cellulose fibers by the low-temperature specimen methodof electron diffraction and electron microscopy. Nature 181, 326-328 (1958)
F. Horii, H. Yamamoto, R. Kitamura, M. Tanahashi and T. Higuchi, Transformation of native cellulose crystals induced by saturated steam at high temperatures. Macromolecules 20, 2946-2949 (1987)
J. H. Lii and N. L. Allinger, The MM3 force field for amides, polypeptides and proteins, J. Comput.Chem. 12, 186-199 (1991)
J. Mann, L. Roldan-Gonzalez and H. J. Wellard, Crystalline modifications of cellulose. Part IV.Determination of X-ray intensity data. J. Polym. Sei., 47, 165-171 (1960)
R. - H. Mikelsaar, New space-filling atomic-molecular models, Trends in Biotechnology 4, 162-163 (1986)
H. Nishimura, T. Okano and A. Sarko, Mercerization of cellulose. 5. Crystal and molecular structureof Na-cellulose I. Macromolecules 24, 759-770 (1991)
H. Nishimura and A. Sarko, Mercerization of cellulose. 6. Crystal and molecular structure of Na- cellulose IV. Macromolecules 24, 771-778 (1991)
A. J. Pertsin. A. I. Kitaigorodsky, " The Atom-Atom Potential Method Applications to Organic Molecular Solids”, Springer Ser. Chem Phys., V43, Springer Verlag, Berlin, 1987
A. J. Pertsin, A. I. Kitaigorodsky and G. N. Marchenko, Crystal structure of cellulose polymorphs by potential energy calculations: 2. Regenerated and native celluloses. Polymer 27, 597-601(1986)
A. J. Pertsin, O. K. Nugmanov, G. N. Marchenko, A. I. Kitaigorodsky, Crystal structure of cellulosepolymorphs by potential energy calculations: 1. Most probable models for mercerized cellulose. Polymer 25, 107-114 (1984)
B. G. Ränby, The mercerization of cellulose. I. A thermodynamic discussion. Acta Chem. Scand. 6,101-115 (1952)
J. Sugiyama, R. Vuong and H. Chanzy, Electron diffraction study on the two crystalline phases occurring in native cellulose from an algal cell wall. Macromolecules 24, 4168-4175 (1991)
D. L. VanderHart and R. H. Atalla, Studies of microstructure in native celluloses using solid state l3C NMR. Macromolecules 17, 1465-1472 (1984)
J. H. Wiley and R. H. Atalla, Raman spectra of celluloses, /4CS Symposium Series 340, 151-168(1987)
C. Woodcock and A. Sarko, Packing analysis of carbohydrates and polysaccharides. 11. Molecular andcrystal structure of native ramie cellulose. Macromolecules 13, 1183 (1980)
P. Zugenmaier and A. Sarko, The variable virtual bond, ACS Symposium Series 141, 226-237 (1980).

Table 1. Most probable PLMR models of cellulose la
U - "up" models; D - "down" models; r, = C4-C5-C6-06; r 2 = C5-C6-06-H ;r3 = C1-C2-02-H; r 4 = C2-C3-03-H; r 5 = C4 '-C 5 '-C 6'-06 '; re = C 1 '-C 2 '-02 '-H '; r 8 = C2 '-C 3'-03 '-H '; 0, = C1-04'-C4';
0 3 = C1-01-C4'-C5'; ( - angle describing chain rotation.r2 T3 r„ . f , r b T,Energy г,
kcal/molU.1 -1 9 .5 -71D.1 -1 в .8 -59
1в.З -вэи.э • 1в.2 -68
и.* -1 5 .7 6 4U .6 -1 5 .0 69
116 52 -175 118166 53 -168 11761 164 -168 119
102 56 -161 115-во 79 -177 11634 54 -72 116
-93 -1 4 6 73 -1 6 6-87 -143 7 4 -1 6 3-92 -148 -72 63-94 -147 69 102-95 -1 4 6 -66 -57-94 -1 4 6 -71 -35
= C 5 '-C 6 '-06 '-H '; r 7
02 = 05-C1-01-C 4';
г, г. (
52 -175 7753 -1 7 0 1
170 -171 7256 -161 7879 -1 7 7 795 4 -72 78
Table 2. Most probable PLMR models of cellulose \ß
Variables: r 11( r 12 = C4-C5-C6-06 for a corner and a central chain;r21, r 22 = C5- C6-06-H for a corner and a central chain;r31, r 32 = C1-C2-02-H for a corner and a central chain; r41, r 42 = C2-C3-03-H for a corner and a central chain; w 0 2 = angles describing the chain rotation; S2 = angles describing a virtual bond rotation; s = a verical shift of a central chain (unit = 1 / 1 Oc).
Еkcal/mol
г„ г „ г„ тп гзг U i V, * 7 S
U,1 19 .9 -71 -1 6 6 52 -175 -71 -166 52 -1 7 5 42 42 -127 -1 2 6 -2 .7U ,2 -1 9 .0 67 160 61 162 68 160 60 161 4 4 4 4 -1 2 2 -1 2 6 2 .6
U ,3 -1 8 .7 -68 -67 62 -178 -70 63 60 -1 7 6 44 44 -1 1 6 -1 3 5 3.411,4 -1 7 .8 67 64 61 163 69 62 60 163 43 43 -1 1 6 136 3.3U ,5 16 .6 -63 56 61 59 68 61 60 -61 46 43 -1 2 0 -1 3 0 3.1и ,в -1 6 .4 72 60 -160 180 -72 67 -149 -1 7 6 41 42 -1 2 5 -1 2 4 2.6U,7 -16.1 -72 58 -1 7 2 61 -72 60 -167 -65 40 42 -1 2 5 -1 2 4 2.7
Table 3. Most probable models of cellulose I a and \ß.U__- “ up" models; D___- "down" models; e - models of phase la; ß - models of
phase \ß.
Energy kcal/mol Mean atommovement H-bonds in chain H-bonds in H-bonds
ModelPLMR M M 3 with
H'swithoutH's
sheet found by ММЗ
•я -19.5 186 .175 .106 05..H 03 06 H02 оз.. новD,1 'а 16.8 206 .158 .108 0 5 ..H 0 3 0 6 ..H 0 2 0 3 . новU.2 19 16.3 222 .178 .148 0 5 ..H 0 3 0 2 ;0 2 ..H 0 6и.з 'д 16 .2 218 .177 .092 0 5 ..H 0 3 0 6 ..H 0 2 0 3 ..Н 0 6U.4 'а 15.7 215 .193 .098 0 5 ..H 0 3 0 6 ..H 0 2 0 3 ..Н 0 6U.5 >а 15 .0 234 .056 .035 0 6 ..H 0 2 0 6 . .НОЗ4-1 V -19.9 182 .187 .167 06 .H03 06..H 02 оз.новU,2 'в -1 9 .0 185 .186 .153 0 5 ..H 0 3 0 6 ..H 0 2 0 3 . .нови , 3 'а 18.7 200 .176 .140 0 5 ..H 0 3 0 6 ..H 0 2
'в 17.8 196 .185 .143 0 5 ..H 0 3 0 6 ..H 0 2U ,5 ta 16.6 212 .201 .177 0 6 ..H 0 2 0 6 . .НОЗи,в ta 16 .4 200 .267 .234 0 5 ..H 0 3 0 2 ;0 4 ..H 0 6 0 6 ..Н 0 2VP ta 16.1 207 .254 .199 0 2 ;0 4 ..H 0 6 0 6 . НОЗ
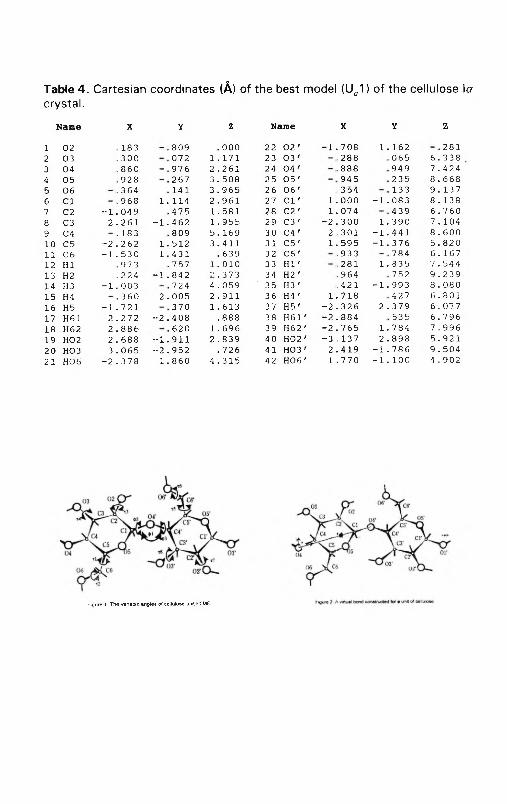
Table 4. Cartesian coordinates (Ä) of the best model (U01) of the cellulose la crystal.
Name X Y Z Name X Y Z
1 02 . 183 , 809 . 000 22 0 2 ' - 1 . . 708 1.. 162 , 2812 03 , 3 0 0 . 072 1 .. 171 23 0 3 ' . 288 , 065 6 .. 3383 04 . 86 0 . 976 2 ., 2 61 24 0 4 ' . 88 8 , 949 7 ., 4244 05 . 928 . 267 3 ., 508 25 0 5 ' 945 . 2 3 5 8 .. 6685 06 . 3 6 4 . 141 3 .. 965 26 0 6 ' . 354 . 133 9 .. 1376 C l . 968 1.. 114 2 .. 961 27 C l ' 1.. 000 - 1 , . 083 8 .. 1387 С2 - 1 , . 049 . 475 1,. 581 28 С2 ' 1.. 074 . 43 9 6 .. 7 608 СЗ 2 .. 2 6 1 - -1 ., 462 1,. 955 29 C3 ' - 2 .. 3 0 0 1.. 390 7 .. 1049 C4 . 183 . 809 5.. 169 30 C4 ' 2 ., 301 - 1 . . 44 1 8 .. 60010 C5 - 2 .. 2 6 2 1.. 512 3 .. 41 1 31 C5 ' 1.. 595 - 1 .. 3 7 6 5 .. 82011 C6 - 1 ,. 530 1 ., 43 1 . 639 32 C6 ' . 933 . 784 6 .. 16712 HI . 973 . 757 1.. 010 33 H I ' . 281 1 ., 8 3 5 7 ,, 54413 H2 . 2 2 4 - 1 , . 842 n . 373 34 H2 ' . 96 4 , 7 5 2 9 .. 23914 H3 - 1 .. 003 . 724 4 .. 059 35 H3 ' . 421 - 1 . , 993 8 .. 08015 H4 . 3 6 0 2 .. 005 2 .. 91 1 36 H 4 ' 1,. 7 1 8 ,427 6 ., 80116 H5 - 1 .. 7 2 1 . 3 7 0 1 .. 613 37 H 5 ' - 2 .. 3 2 6 2 .. 3 7 9 6 ., 07717 H61 2 ,. 2 7 2 - 2 ., 40 8 . 888 38 H 6 1 ' - 2 .. 884 . 535 6 .. 7 9 618 H62 2 .. 8 86 . 620 1 ,. 696 39 H62 ' - 2 .. 765 1 ., 7 8 4 7. , 99619 H02 2 .. 688 - -1 ., 91 1 2 .. 83 9 40 H02 ' - 3 . 137 2 .. 898 5. . 92120 H03 3 ,. 065 - 2 ., 952 . 726 41 H03 ' 2 .. 4 1 9 - 1 .. 7 86 9 ,, 50421 H06 - 2 ,. 378 1 ., 860 4 .. 31 5 42 H06 ' 1 , 770 - 1 ., 100 4 .. 902
Figur« 1. Th« vanabte angle;» of ce'lMo.«* unit PLMR

Table 5. Carthesian coordinates (Ä)of the best model (U^D of cellulose \ß crystal.
Name x у z
C o r n e r C h a i n
1 02 .339 2. . 694 3. 4342 03 . 084 2. , 107 6583 04 .487 , 651 0004 05 . 403 . 882 3. , 5085 06 . 326 - 3 . , 280 , 8676 Cl . 134 . 358 3. , 9727 C2 . 208 1.. 459 2 .. 9778 C3 . 325 1.. 111 1., 5939 C4 . 145 , 264 1.. 17510 C5 . 174 - 1 . . 287 2. , 25711 C6 . 3 7 6 - 2 . , 662 1.. 94312 HI - 1 . . 207 , 274 4. . 06313 H2 1.. 2 7 9 1,. 582 2. . 93014 H3 - 1 , . 404 1., 066 1., 62315 H4 1.. 213 , 230 1.. 01616 H5 - 1 , . 245 - 1 . . 374 2. . 36617 H61 1,. 4 2 3 - 2 . . 582 1.. 69118 H62 . 3 1 0 - 3 . . 286 2, . 82219 H02 . 152 3.. 005 4. . 33920 НОЗ . 233 2.. 071 . 26321 H06 . 2 1 9 - 4 . . 234 . 69922 02 ' . 3 3 9 - 2 . . 694 8. . 61423 03 • . 0 8 4 - 2 , . 107 5 .. 83824 0 4 ' . 487 . 651 5.. 18025 05 ' . 4 0 3 . 882 8. . 68826 0 6 ' . 3 2 6 3.. 28 0 6.. 04727 Cl ’ . 134 . 358 9,. 15228 C2 ' . 2 0 8 - 1 . . 459 8. . 15729 C3 ' . 3 2 5 - 1 . . 111 6.. 77330 C 4 ' . 145 . 264 6.. 35531 C5 ' . 174 1,. 287 7 ,. 43732 C6 ' . 3 7 6 2 . 662 7.. 12333 HI ' 1.. 2 0 7 . 274 9.. 24334 H2 ' - 1 . .2 7 9 - 1 , . 582 8.. 11035 H3 ' 1,. 4 0 4 - 1 . . 066 6.. 80336 H4 ' - 1 , . 2 1 3 . 230 6.. 19637 H5 ' 1,. 245 1,. 374 7,. 54638 H 6 1 ' - 1 ,. 4 2 3 2.. 582 6.. 87139 H62 ' . 3 1 0 3,. 286 8,. 00240 H02 ' . 152 - 3 , . 005 9,. 51941 НОЗ' . 2 3 3 - 2 , . 071 4.. 91742 H06 ' . 2 1 9 4.. 234 5.. 879
Name x у z
C e n t r a l c h a i n
1 02 3. 573 6. , 262 6852 03 4. 009 5. . 684 - 2 . 0913 04 3. 500 2. . 915 - 2 . 7504 05 4. , 396 2 .. 703 7595 06 3. 718 . 289 - 1 . 8826 Cl 3. 831 3. . 931 1 . 2237 C2 4. ,147 5.. 039 . 2278 C3 3. 622 4. . 679 - 1 . 1569 C4 4. 123 3.. 3 15 - 1 . 57410 C5 3. , 827 2. . 286 49211 C6 4 ., 408 . 923 80712 HI 2. , 760 3.. 823 1.. 31413 H2 5.. 216 5.. 187 , 18014 H3 2. ,545 4. . 61 0 - 1 . . 12615 H4 5 .. 190 3.. 374 - 1 . , 73416 H5 2 .. 758 2. . 175 . 38317 H61 5.. 453 1.. 027 - 1 . , 06018 H62 4. . 358 . 29 8 . 07219 H02 3. . 753 6.. 576 1.. 59020 НОЗ 3.. 693 5.. 641 - 3 .. 01221 H06 3,. 847 . 663 - 2 .. 0 5022 02 ' 4 ., 372 . 891 5.. 86523 03 ' 3. . 936 1,. 468 3 .. 08924 04 ' 4.. 445 4. . 2 37 2 .. 4 3025 05 ' 3.. 549 4, . 44 9 5,. 93926 06 ' 4. . 227 6,. 863 3.. 29827 C l ' 4. . 114 3.. 2 21 6.. 40328 C2 ' 3., 798 2. . 11 3 5.. 40729 C3 ' 4. , 323 2,. 4 73 4. . 0 2430 C 4 ' 3.. 822 3.. 837 3.. 6 0631 C5 ' 4.. 1 1 8 4.. 867 4. . 68832 C6 ' 3. . 537 6,. 22 9 4, . 37333 H I ' 5,. 185 3,. 329 6,. 49434 H2 ' 2 .. 729 1,. 9 6 6 5 ,. 36035 H3 ' 5., 400 2 ,. 542 4 ,. 05436 H4 ' 2 ,. 755 3.. 7 7 8 3 ,. 4 4637 H5 ' 5.. 187 4,. 97 8 4. . 79738 H 6 1 ' 2.. 492 6,. 125 4 ,, 12039 H62 ' 3.. 587 6.. 8 54 5,. 25240 H02 ' 4.. 192 . 57 6 6,. 77 041 НОЗ' 4. . 252 1.. 511 2 ,, 16842 H06 ' 4.. 098 7.. 8 15 3. . 130

PARALLEL AND ANTIPARALLEL MODELS FOR CRYSTALLINE
PHASES OF NATIVE CELLULOSE
Parallel and antiparallel models of cellulose
Raik-Hiio Mikelsaar' Institute of General and Molecular Pathology, Tartu University, Veski Street 34, Tartu EE2400, Estonia; Alvo Aabloo Institute of Experimental Physics and Technology, Tartu University, Tähe Street 4, Tartu EE2400, Estonia.
ABSTRACT
Tartu plastic space-filling atomic-molecular models were used to investigate the
structure of cellulose do and \ß) phases. It was elucidated that both parallel and antiparallel
structures can be accommodated with unit cell geometries described by Sugiyama et al.
(1991). Packing energy calculations revealed that parallel models of I a and \ß phases have very
close energy. In contrast, in case of antiparallel structure models, lyJis energetically much more
favourable in comparison w ith I a phase. Our data indicate that antiparallel structure proposed
for cellulose la phase is metastable and should be easily converted to \ß phase. So the
antiparallel models are more suitable for explanation of cellulose lo-H£-HI interconversion.
Keywords, cellulose molecular and crystalline structure, molecular modelling by plastic atomic
models, packing energy calculations.
INTRODUCTION
Native cellulose I is a wide-spread biopolymer which, through either mercerization or
regeneration, can be converted irreversibly into another form - cellulose II. It is generally
accepted that both mercerized and regenerated cellulose II have nearly identical crystal structures w ith two-chain unit cells (Stipanovic and Sarko, 1976; Kolpak and Blackwell, 1976;
Kolpak era/., 1978; Pertsin et al., 1984; Nishimura era/., 1991; Nishimura and Sarko, 1991).
In contrast, IR-spectroscopy, X-ray, electron diffraction and NMR methods revealed that
cellulose I occurs in tw o forms; type IA (algal-bacterial) cellulose and type IB (ramie-cotton)
cellulose (Marrinan and Mann, 1956; Honjo and Watanabe, 1958; Fisher and Mann, 1960;
Hebert, 1985; Horii era/., 1987a). On 1984 by NMR investigations it was elucidated that both
forms are a mixture of tw o crystalline phases (a and ß) which proportion depends on the source
of cellulose (Atalla and VanderHart. 1984; VanderHart and Atalla, 1984). Also w ith NMR spectroscopy Horii et al. (1987b) showed that the lo phase of cellulose is metastable and,
through a hydrothermal annealing treatment, can be converted readily into the
thermodynamically stable \ß phase. Recently Sugiyama et al. (1991) studied cellulose from a

green alga Microdictyon by electron diffraction. It was found that the major lo phase has a one-
chain, triclinic (P1) structure and the minor \0 phase is characterized by two-chain unit cell and a munoclinic (P2,) structure. This study disclosed the unit cell parameters but did not present a detailed molecular structure of these native cellulose crystalline phases.
The aim of the current paper was using molecular modelling method and packing energy
calculations to elucidate the most favourable stereochemical structures corresponding to unit
cell parameters found by Sugiyama et al. (1991) in cellulose la and I/S crystalline phases.
MATERIAL AND METHODS
Molecular modelling was carried out by Tartu plastic space filling models having
improved parameters and design (Mikelsaar et al.. 1985; Mikelsaar 1986). Packing energy
calculations were carried out by the PLMR program, a rigid-ring method (Pertsin et al., 1984).
To present graphically the stereochemical models investigated, we drew unit cell
projections on the plane crossing the с-axis at 90°. Cross-sections of up cellulose chains were
given by white and down chains by grey ovals. The number of c/4 shifts of molecules in the
direction of the с-axis is noted by numbers inside of the ovals.
To make a short digital designation of the cellulose models: 1) symbols "P" and "A "
were used to represent correspondingly "parallel" and "antiparallel", 2) numbers indicating c/4 shifts were applied for characterizing of each chain in the unit cell, 3) underlining was used to
differentiate down chains from up chains.
RESULTS
1. Molecular models fitting with cettulose la unit cell parameters
1.1. Model PI
Fig. 1
The investigation of green alga Microdictyon by Sugiyama et at. (1991) is the first work where unit cell parameters are given for pure cellulose la microcrystals: a = 0 .674 nm, b =
0.593 nm, с = 1.036 nm, а = 117°, ß = 113° and у = 81 °. One-chain unit cells result in
parallel packing of molecular chains. In Figure 1 there are our graphic presentations of above
described one-chain unit cell and sterically corresponding two- and eight-chain cells on the plane crossing the с-axis at 90°.
Molecular modelling by Tartu devices showed that if there are the usual intramolecular
bonds 03 -H ...05 and 02 -H ...06 the hydroxymethyl groups should be in tg conformation and all parallel chains are bound by intrasheet bonds 06 -H ...03 (Fig. 2 and Fig.3).
Fig. 2
Fig. 3
2

Packing energy calculations of the above-described cellulose structure imitation revealed that model P1 has potential energy -19.5 kcal/mol.
1.2. Models A 1a and A 1b
Fig. 4
Fig. 5
Two antiparallel models A1a and A1b characterized by eight-chain unit cell may be geometrically derived from the one-chain unit cell described by Sugiyama et at. (1991) (Fig. 4 and 5). The geometry of these two models is very similar. The only difference is that in A1a
parallel chains follow each other from down right to up left dividing major angles of unit cell
and in A1b from down left to up right dividing minor angles of unit cell. So A1a may be called
"le ft" and A1b "right" type of structures.
Fig. 6
Fig. 7
According to molecular modelling data, chains having usual intramolecular H-bonds and
tg conformation of hydroxymethyl groups should be in models A1a and A1b bound by intrasheet bonds 06 -H ...02 (Fig. 6 and 7).
The potential energy values of above-described structures are rather similar: model A1a
has - 16.4 kcal/mol and A1b - 15.5 kcal/mol.
2. Molecular models fitting with cellulose Iß unit cell parameters
2.1. Model P2
Sugiyama et al. (1991) have established that \ß phase of Microdictyon cellulose has a two-chain monoclinic structure with unit cell parameters of a = 0.801 nm, b = 0.817 nm, с
= 1.036 nm and у = 97 .3°. The authors suppose that this structure consists of parallel
molecules and the center and corner chains are staggered by c/4. Figure 8 shows our graphic
presentation of above-mentioned structure.
Fig. 8
Molecular modelling revealed that intra- and intermolecular H-bonds in model P2 are identical to those in model P1 (Fig. 2 and 3).
The energy value of model P2 is close to the model P1 one: -19.9 kcal/mol.
2.2. Model A 2
A graphic presentation of the structure corresponding to model A2 is demonstrated in Figure 9.
3

Fig. 9Molecular modelling showed that chain conformation and intrasheet H-bonding network
in model A2 are identical to the model P2 one's.The only difference is that sheets are parallel
in model P2 and antiparallel in model A2.
Potential energy of model A2 is relatively high: - 15.8 kcal/mol.
2.3. Models A 3a and A3b
Fig. 10
Fig. 11Two antiparallel models A3a and A3b characterized by eight-chain unit cell may be
geometrically derived from the two-chain unit cell described by Sugiyama et al. (1991) (Fig. 10
and 11). These structures are similar to the "left" and "right" models A1a and A1b differing
mainly by the presence of intrasheet stagger of cellulose chains.
Fig. 12
Fig. 13The investigation by plastic models indicated that in case of the preservation of
standard intramolecular H-bonds and tg conformation of hydroxymethyl groups the antiparallel
molecular chains are bound by bonds 06 -H ...03 (Fig. 12 and 13).
There is a considerable difference between energies of above-described tw o structures:
the "le ft” type model A3a has -21.0 kcal/mol and "right" model A3b -15.1 kcal/mol.Table 1
A generalized characterization of above-described cellulose models is presented in Table 1.
DISCUSSION
Our investigation revealed that both parallel and antiparallel structure models can be
proposed, based on cellulose la and \ß crystalline phase unit cell parameters published by Sugiyama era/. (1991). Although all they have usual chain conformation and intramolecular H-
bonding network, the potential energy values between seemingly close structures in certain cases are very different.
Sugiyama ef al. (1991) interpret their experimental data in the light of all-parallel- structure view. Following this view, the la phase structure should correspond to our model P1 and \ß phase to model P2. However, the conception of Sugiyama et al. (1991) meets many
difficulties when one try to explain the molecular mechanisms of cellulose la-»l/?-»ll interconversion.
First, if the structures of la and \ß phases correspond to the models P1 and P2, the only change after the process of \a-*\ß conversion will be a c/2 shift of each third and fourth
molecular sheet. The intra- and intersheet distances between molecular chains should remain
4

unchanged. However the comparison of \ß phase two-chain unit cell parameters in the work
of Sugiyama et al. (1991) w ith corresponding data derived by us from lo one-chain unit cell
indicates that there are rather considerable differences: 1) unit cell of \ß phase: a = 0.801 nm,
b = 0.817 nm, у = 97 .3°, and 2) corresponding unit cell derived from lo phase: a = 0.814 nm, b = 0.825 nm, у - 99 .2°.
Second, if the only rearrangement in the lo-H/3 conversion was a c/2 shift of chains, the H-bonding network in the cellulose structure must remain unchanged. However, Raman
spectroscopic data reveal that H-bonds in lo phase cellulose are different from those of \ß
(Atalla, 1989).
Third, if there only c/2 shift of chains occurs and sheets are bound only by weak
VanderWaals' interactions, the energy barrier between molecular structures of lo and \ß phases
should be very small. It would be expected that cellulose I crystallites contain equai amounts
of both phases. However, lo dominates in IA and \ß in IB celluloses.
Fourth, because annealing of cellulose lo converts it irreversibly to \ß, the energy of stable \ß should be considerably lower than the metastable lo energy. However, the packing
energy difference between P1 and P2 models is very small.
Fifth, cellulose II is generally considered to have antiparallel molecular structure. Sarko
eta l. (1987) and Nishimura et al. (1991) established that already Na-cellulose I, formed during
the initial step of a controlled mercerization of ramie cellulose, has antiparallel-chain structure.
Because the change of chain direction in this phase is not possible, it would be very difficult
to imagine how an antiparallel structure could arise from the parallel one. It is true that antiparallel structure of cellulose II can arise through a process of "interdigitation” (see French, 1985) and energy minimization procedure reveal a possibility of parallel chain packing in
cellulose II (Sakthivel et al. , 1988), but these arguments seem to be not very convincing. In our
opinion the molecular mechanisms of cellulose lo-»l/?-»ll interconversion can be easier explained
in the light of antiparallel structure models.
Comparing cellulose parallel model P1 with antiparallel models A1a and A1b one can
see that these models are sterically very similar. If the H-bonding network and chain polarity are not clearly established, the structure characterized by eight-chain unit ceil can be
considered as structure of one-chain unit cell. We think that antiparallel model A la having lower energy (-1 6.4 kcal/mol) in comparison with the model A1 b (-15.5 kcal/mol) is a possible
pretender for a "masked" eight-chain unit cell in the cellulose lo crystal structure described by
Sugiyama et al. (1991). It may be that the experimental procedure of electron diffraction in above-mentioned investigation allowed to record only the parameters of subunits of eight-chain
unit celis. The antiparallel structure is not excluded also for cellulose \ß crystalline phase
because these authors marked that the exact position of the cellulose chains in the monoclinic
unit cell was even more difficult to ascertain as long as the structure refinemant was not achieved. No doubt, A3a is the best antiparallel model for fitting to the unit cell structure of \ß
5

crystalline phase because it has an excellent packing energy: -21.0 kcal/mol. For both A1 and
A3 models, the "left type” structures A1a and A3a have lower energy than the "right type"
A1b and A3b models.If the "left type" antiparallel models A1a and A3a are thought to be the candidates for
structures of cellulose lo and \ß crystalline phases, correspondingly, it would be easy to explain
the experimental data on the interconversion of these phases. Model A1a, having relatively high
energy -16.4 kcal/mol, is metastable and can during annealing process easily to be converted
irreversibly into the model A3a, having very low energy -21.0 kcal/mol. Because the models
A la and A3a have different H-bonding network, our conception on antiparallel cellulose
structure is in accordance also with Raman-spectroscopic data of Atalla (1989). The high
energy barrier between lo and \ß crystalline phases, bound w ith rearrangement of hydrogen
bonds, may be the reason why the proportion of these phases in different samples of native cellulose is relatively constant. The notable structural differences between models A1a and A3a
allow one also to understand the differences between corresponding unit cell parameters of I a
and I/? cellulose crystalline phases.
The order of chain rearrangements in the transformation of models A1a-*A3a, probably
corresponding to the cellulose Ia-Aß phase conversion, seems to be simple. A fter the
interruption in model A1a of intrasheet bonds 02 -H ...06 the alternate sheets of parallel chains
must move one step diagonally in the plane of these sheets and new intrasheet bonds ОЗ-
H ...0 6 characteristic of model A3a should be formed.The process of cellulose U?~»ll conversion can be also easily interpreted by all-antiparallel
conception. Because already Na-cellulose I, formed in the initial step of mercerization, has
antiparallel structure (Sarko et al., 1987; Nishimura et al., 1991), no change of chain direction
is needed. The conversion from the structure corresponding to model A3a to Na-cellulose I may
contain following steps: 1) interruption of intrasheet H-bonds, 2) including of Na+ and OH ions
and water molecules, 3) forming of a large four-chain unit cell. The intersheet hydrogen bonding
found in cellulose II is one of the most significant differences between this structure and the native cellulose and may be the reason of irreversibility of cellulose l-HI conversion (Kolpak et
a/.. 1978)
In some electron-microscopical studies it was shown that the reducing ends of cellulose
exposed at the tip of a fragmented microfibril of Valonia and Acetobacter can be
asymmetrically labeled w ith silver indicating a unidirectional alignment of glucan chains (Hieta et al., 1984; Kuga and Brown, 1988). The same feature was visualized also by Chanzy and
Henrissat (1985), who showed that the digestion of Valonia cellulose by cellobiohydrolase
proceeds in one direction in a single microfibril. These data have been used in favour of
conception on parallel cellulose structure. In our opinion these results may equally well be explained from the position of antiparallel conception. For example, according to our model A1 a it may be supposed that crystallites of cellulose I a phase contain on one surface a layer
6

including exclusively parallel molecular chains. Probably the asymmetrical silver labeling and enzymatic digestion w ill occur on this layer.
Summing up, molecular modelling by plastic models and packing energy calculations
revealed that both parallel and antiparallel structure models can be accommodated with
cellulose unit cell geometries described by Sugiyama et al. (1991). However, the all-antiparallel
conception has several advantages in comparison w ith all-parallel view in explaining the
experimental data on molecular mechanisms of cellulose 1<7-*1Д-Ч1 conversion.
REFERENCES
Atalla, R.H.; VanderHart, D.L. Native cellulose: a composite of two distinct crystalline forms. Science
1984, 223, 283-285.
Atalla, R.H. Patterns of aggregation in native celluloses: implication of recent spectroscopic studies.
Cellulose structural and functional aspects. Eds. J.F.Kennedy, G,0.Phillips, P. A. Williams. Ellis
Horwood Ltd., New York, Chichester, Brisbane, Toronto, 1989, 61-73.
Chanzy, H.; Henrissat, B. Undirectional degradation of Valonia celulose microcrystals subjected to
celluloase FEBS lett. 1985, 184, 285-288.Fisher, D.G.; Mann, J. Cristalline modifications of cellulose. IV. Unit cell and molecular symmetry of
cellulose I. J. Polymer Sei. 1960, 17, 189-194.
French, A.D. Physical and theoretical methods for determining the supramolecular structure of
cellulose. In: Cellulose chemistry and its applications. Eds. T.P.Nevell, S.H.Zeronian 1985, 84-
111 .
Hebert, J.J. Crystalline form of native celluloses. Science 1985, 227, 79.
Hieta, K.; Kuga, S.; Usuda, M. Electron staining of reducing ends evidences a parallel-chain structure
in Valonia cellulose. Biopolymers 1984, 23, 1807-1810.Honjo, G.; Watanabe, M. Examination of cellulose fibre by the low-temperature specimen method of
electron diffraction and electron microscopy. Nature 1958, 181, 326-328.
Horii, F.; Hirai, A.; Kitamaru, R. CP/MAS'3C NMR spectra of the crystalline components of native
celluloses. Macromolecules 1987a, 20, 2117-2120.
Horii, F.; Yamamoto, H.; Kitamaru, R.;Tanahashi,M.;Higuchi,T. CP/MAS,3C NMR spectra of crystalline
components of native celluloses. Macromolecules 1987b, 20, 2946-2949.
Kolpak, F.J.; Blackwell J. Determination of the structure of cellulose II. Macromolecules 1976, 9, 273-
278.
Kolpak, F.J.; Weih, M.; Blackwell J. Mercerization of cellulose. 1. Determination of the structure of mercerized cotton. Polymer 1978, 19, 123-131.
Kuga, S.; Brown, R.M., Jr. Silver labeling of the reducing
ends of bacterial cellulose. Carbohydrate Research 1988, 180, 345-350.
7

Marrinan, H.J.; Mann, J. Infrared spectra of the crystalline modifications of cellulose. J. Polymer Sei.
1956, 21,301-311.Mikelsaar, R.-H.N.; Bruskov, V .l.; Poltev, V.l. New precision space-filling atomic-molecular models:
Scientific Center of Biological Research of the Academy of Sciences of the USSR in Pushchino,
1985.
Mikelsaar, R. New space-filling atomic-molecular models. Trends Biotechnol. 1986, 6, 162-163.
Nishimura, H.; Okano, Т.; Sarko, A. Mercerization of cellulose. 5. Crystal and molecular structure of
Na-cellulose I. Macromolecules 1991, 24, 759-770.Nishimura, H.; Sarko, A. Mercerization of cellulose. 6. Crystal and molecular structure of Na-cellulose
IV. Macromolecules 1991, 24, 771-778.
Pertsin, A.J.; Nugmanov, O.K.; Marchenko, G.N.; Kitaigorodsky, A.I. Crystal structure of cellulose
polymorphs by potential energy calculations. 1. Most probable models for mercerized cellulose.
Polymer 1984, 25, 107-114.
Sakthivel, A.; Turbak, A.F.; Young, R.A. New structural models for cellulose II derived from packing
energy minimization. In; Cellulose and wood - chemistry and technology. Ed. C.Schuerch. State
University of New York, College of Environmental Science and Forestry, Syracuse, New York 13210, USA, 1988, 67-76.
Sarko, A.; Nishimura, H.; Okano, T. Crystalline alkali-cellulose complexes as intermediates during
mercerization. In: The structure o f cellulose; ACS Symposium Series 340; American Chemical
Society: Washington, DC, 1987, 169-177.
Stipanovic, A .J.; Sarko, A. Packing analysis of carbohydrates and polysaccharides. 6. Molecular and
crystal structure of regenerated cellulose II. Macromolecules 1976, 9, 851-857.
Sugiyama, J.; Vuong, R.; Chanzy, H. Electron diffraction study on the two crystalline phases occurring
in native cellulose from an algal cell wail. Macromolecules 1991, 24, 4168-4175.VanderHart, D.L.; Atalla, R.H. Studies of microstructure in native cellulose using solid-state 13C NMR,
Macromolecules 1984, 17, 1465-1472.
8

References
1. Sugiyama,J; Vuong, R; Chanzy, H. Macromolecules 1991,v. 24, p. 4168.
2. Atalla, R. H.; VanderHart, D. L. Science 1984, v. 223, p. 283.
3. VanderHart, D. L.; Atalla, R. H. Macromolecules 1984, v. 17, p. 1465.
4. Horii, F.; Yamamoto, H.; Kitamaru, R.; Takahashi, M.; Higuchi, T. Macromolecules 1987, v. 20, p. 2946.
5. Mikelsaar, R. Trends Biotechnol. 1986, v. 6, p. 162.
6. Pertsin, A. J.; Nugmanov, 0 . K.; Marchenko, G. N.; Kitaigorodsky, A. I. Polymer 1984,
v. 25, p. 107.
7. Mikelsaar, R.-H.; Aabloo, A. In: Cellulosics: Chemical, Biochemical and Material Aspects.
Eds. J. F. Kennedy, G. 0 . Phillips, P. A. Williams. Ellis Horwood, Chichester, 1993, p. 57.
8. Atalla, R. H. In: Cellulose Structural and Functional Aspects. Eds. J. F. Kennedy, G. 0.
Phillips, P. A. Williams. Ellis Horwood, Chichester, 1989, p .61.
9. Sarko, A.; Nishimura, H.; Okano, T. In: Structure of Cellulose; ACS Symposium Series
340; Amercan Chemical Society: Washington, DC, 1987 p. 169.
10. Nishimura, H.; Okano, Т.; Sarko, A. Macromolecules 1991, v. 24, p. 759.

Parallel and antiparallel stereochemical models for cellulose I a and I/? crystalline phases.
Phase Model Unit cell
designation
Intramolecular H-bonds Intrasheet H-
bonds
-CH20H
groupconfor
mation
Packing
energy
kcal/mol
lo P1 1 03 -H ...05 02 -H ...06 06 -H ...03 t9 -19.5
W P2 01 03 -H ...05 02-H ...06 0 6 -H ...03 tg -19.9
1 a A1 a 0Q112233 C3-H ...05 02 -H ...06 0 6 -H ...02 tg -16.4
lo A1b 00112232 03 -H ...05 02 -H ...06 06 H ...02 tg -15.5
\ß A2 01 03 -H ...05 02 -H ...06 06 -H ...03 tg -15.8
\ß A3a 01123243 03 -H ...05 02 -H ...06 0 6 -H ...03 tg -21.0
\ß A3b 01213234 03 -H ...05 02 -H ...06 06 -H ...03 tg -15.1

Ос ф fõb CÕ} CÕ} 01 ■■•*€ о О О CD О О CDi * ?> О CD О О <2? CD С м< о © 0 0 G)̂0 о I.- D © О о с
5/4с 0 0 0 j 0 j \ Ž j j 0 О6/ 4С ̂ 0 0 © 0 - 0 © Cl7/4С О О 0 0 0.0 о 2с 5 CD О 0 © СЕ
9 1C 0 © 0 0 0<->0«©10,4с > < *кГ) С ю Ъ
114с 2D CD CD CDм CD ̂ CD •■'CD,1c f5 ) <TT̂ <TT}
1 on (
Fig 1 Model P1 One-chain unit cell: 1. The projection of one-chain unit cell
described by Sugiyama et al (1991) for cellulose IOC phase is compared with projections of sterically corresponding two-chain and eight-chain unit cells on the plane crossing с-axis at 90° Symbols -vhite ovals - cross sections of up chains, number in ovals - the
amount o f c/4 shifts in the direction of с-axis a b. с, у - unit cell parameters, 6-3 intrasheet bonds OS-H 03.
Fig. 3 M o d e /P f Plastic space-filling molecular model - Cf. Fig.2
Fig. 2 Model P1. Stereochemical formula with H-bonding network.
ос cV> 0 —сУэ—0 CÕ4 <*у*з—i/'fc CD О © - © - © - 0 - 0 2 4c t > 0 О CD О CD CD С3/4c
Ic
5/4c
6 /4c 5
7/4c 0 ©
ic > C D ©9/4c < T )
ю/4с v c ^ _~C&— »-»CB* n /4 c 2 D C D C D C D - C D - C D - O —
Fig 4 Model A1a. Eight-chain unif cell: 00112233 Symbols: grey ovals - cross sections of down chains: 6-2 - intrasheet bonds 06-H 02 : other symbols see Fig 1

Fig. 6 Models A a end A lb Stereochemical formula with H-bonding network.
Oc © <T)
> Ф сl/4c I— © —
Oc 2 > - < õ > < o > r C £ > « < D - ’ C
l/4c © ^ - © ‘■ 'O '- 'O
Oc © © © © ©
I4< > © CD © © ©
1 1'. I о оТс^э ©Or ^ »-><"?
M< © © © ^ © t ^ ©"• °> О © и® н© н<»

Fig. 13 Models A3a and АЗЬ Plastic space-fillina molecular model Cf Fig 12

Packing Energy Calculations on the Crystalline
Structure of Cellulose I
Alvo Aabloo', Alfred D. French2, Raik-Hiio Mikelsaar3 - 1 Tartu University, Institute of Experimental Physics and Technology, Tähe 4 Street, EE2400 Tartu, Estonia;2 Southern Regional Research Center, USDA, 1100 Robert E. Lee Blvd, P.O. Box 19687, New Orleans, LA 70179, USA; 3 Tartu University, Institute of General and Molecular
Pathology, Veski 34 Street, EE2400 Tartu, Estonia.
AbstractThe crystalline structure of native cellulose were investigated with packing energy calculations of crystals. Unit cell measures based on dimensions proposed by Sugiyama et al . The packing energy calculations of phases lo and \ß of native
cellulose (I) were evaluated using tw o different algorithms. As a first step we used
rigid ring method. The best structures found by this method were further minimized
with a full optimization molecular mechanics program MM3(90). Different
minimization methods gave analogous structures for best models of both phases.
The best mode! for phase lo one-chain unit cell is in tg position and is packed "up".
The chains of the best model for phase \ß two-chain unit cell are also in tg positions
and are packed "up” . The structure found for the phase \ß of native cellulose is completely similar w ith a structure proposed several years ago by Woodcock and
Sarko for ramie cellulose
Introduction
Several years ago, VanderHart and Atalla found that all crystalline native cellulose
I is composed from two phases1. Different samples consists these phases in
different relation. Later Sugiyama et al2, described those phases as lo w ith a triclinic
one-chain unit cell and as \ß with a monoclinic two chain unit cell. They investigated Microdlctyon tenius with electron diffraction techniques. The one-chain triclinic unit
cell for the phase lo has parameters of a = 0,674 nm, b = 0.593 nm,
с = 1.036 nm, а = 117°, ß = 113° and у = 81 °. The two-chain unit monoclinic
unit cell has parameters of a = 0.801 nm, b = 0.817 nm, с = 1.036 nm and V = 97 .3° as published by Sugiyama et al2. Early these two phases together were
indexed as eight-chain unit cell3.

Material and methods
We used tw o different strategies to find the most probable models using the crystal packing energy calculations. A t the first step we using molecular modelling4 and rigid ring calculations6 6 to find the most probable models of both phases of native
cellulose. The parallel packing of chains were presupposed. During these
calculations we used P1 symmetry for the phase lo and P2, symmetry for the \ß
phase. The rigid-ring method means that during the minimization process the
glucose ring was kept fixed. The Arnott-Scott7 glucose ring was used. The torsion
angles of the hydroxymethyl and hydroxyl groups and the torsion angles and the
bond angles at the glycosidic linkages were allowed to vary (see Figure 1.). In the
case of space group P2, the monomer residues were linked into the chain with virtual bond method8.
The best models of these calculations were further minimized with a full molecular
mechanics program■ММЗ(ЭО)9 ,0. During these minimizations ttie dielectric constant
was chosen of 4. th is value was also used for crystalline amides, polypeptides and
proteins” . In this method, a model of the crystal of cellulose was built of seven
ceilotetraose molecules placed to hexagonal close packing. All chains were arranged
according to the unit cell measures.
The best model of both phases of cellulose I obtained by rigid-ring method preserved their leader position after MM3 minimization. While the conformation of
these models have not changed significally. The best model of both phases w ith
needed results of calculations are presented in table 1. As we can see in the case
of the phase lo the hydroxymethyl groups are in tg position. The orientation of chain
is "up". In the case of the phase \ß the hydroxymethyl groups of both chains are
also in tg position and they are also packed "up". The central chain is shifted down
approximately 1/4 с (see Figure 2.). Hydrogen bonds are completely same in the
case of both phases. The conversion from lo phase to \ß phase is possible by simple
vertical shifting of sheets of chains. The direct shifting of sheets needs to cross the barrier of 9 kcal/mol.
Results and discussion
The best model of the phase lo has an energy of -19.5 kcal/mol by rigid-ring method
and 185 kcal/mol by MM3. The best model of the phase \ß has an energies of
-19.9 kcal/mol and 182 kcal/mol, respectively. We can compare it w ith energies of -21.4 kcal/mol6 and 176 kcal/mol” calculated for cellulose II. Although the energies

Molecular Modelling of Parallel and Antiparallel Structure of Native Cellulose
M k-H Io ШМаааг and Alvo Aabioo' ■ T*rtu Urivaraity, In rttu ti al Qcneral and Molecular Pathology, 34 Veski Street, EE2400 Tutu Estonia “Tartu Unvanty, Institute d Experimental Physica and Technology. 4 Tiha Street, EE2400 Tartu, Eatonia
Abstract
Tartu plastic space-filling atomic-molecular models were used to investigate die structure of cellulose crystalline (la and Iß) phases. It was elucidated that both parallel and antipanllel structures can be accommodated with unit cell geometries described by Sugiyama et al.1. Packing energy calculations revealed that parallel models of la and Iß phases have similar energy. In contrast, in case of antiparallel structure models, Iß is energetically much more favourable in comparison with la phase. Our data indicate that antiparallel structure proposed for cellulose la phase is metastable and should be easily converted to Iß phase. So the antiparallel models are more suitable for explanations of cellulose Ia-»Iß-»II interconversion.
Introduction
Recently it was elucidated that native cellulose is a mixture of two crystalline phases (a and ß ) the proportion of which depends on the source of cellulose15. Horii et al.* showed that the la phase of cellulose is metastable and, through a hydrothermal annealing treatment, can be converted readily into the thermodynamically stable Iß phase. Sugiyama et al.1 studied cellulose from a green alga Microdictyon by electron diffraction and found that the major la phase has a one-chain, triclinic structure and the minor Iß phase is characterized by two-chain unit cell and a monoclinic structure. This study disdoeed the detail molecular structure of native cellulose crystalline phases. The aim of current paper was to use the molecular modelling method and packing energy calculations to elucidate die most favourable stereochemical structures corresponding to unit cell parameters found by Sugiyama et al.1 in cellulose l a and Iß crystalline pluses.
Material and methods
Molecular modelling was carried out by Tartu plastic space-filling models having improved parameters and design3. Packing energy calculations were carried out by rigid-ring method6.To present graphically the stereochemical models investigated, we drew unit cell projections on the plane crossing the с-axis at 90“. Cross-sections of up cellulose chains were given by white and down chains by grey ovals. The number of c/4 shifts of molecules in the direction of с-axis is noted by numbers inside of ovals1.To make a short digital designation of the cellulose models: 1) symbols "P" and "A* were used to represent correspondingly "parallel" and "antipanller, 2) numbers indicating c/4 shifts were applied for characterizing each chain is the unit cell, 3) underlining was used to differ up and down chains.

of both phases of native cellulose are very close, these energies are in a good agreement w ith experimental data about lo-*l/?-»ll conversion. It is remarkable that
the most probable model for \ß phase is completely analogous w ith a structure
proposed by Woodcock and Sarko'2 for ramie cellulose. Also it is close to structure
proposed by Pertsin et at for ramie cellulose using similar minimization technique'3.
It means that the diffraction patterns of ramie cellulose mostly belong to the phase
\ß. We got same result for phase \ß without any diffraction data.
Table 1. The best model for the phase lo and for the phase \ß of native cellulose.
Model Energy kcal/mol H-bonds in chain H-bonds
in sheet
-CH2OH
positionRigid-ring MM3
Uo -19.5 185 05 ..H 03 06 ..H 02 03 ..H 06 tg
u/? -19.9 182 05 ..H 03 06 ..H 02 03 ..H 06 19
References1. VanderHart D. L.; Atalla R. H., Macromolecules 1984, v. 17, p. 1465.2. Sugiyama,J; Vuong, R; Chanzy, H. Macromolecules 1991, v. 24, p. 4168.
3. Honjo G.;Watanabe M. Nature 1958, v. 181, p. 326.
4. Mikelsaar, R. Trends Biotechnol. 1986, v. 6, p. 162.
5. Pertsin, A. J.; Nugmanov, 0. K.; Marchenko, G. N.; Kitaigorodsky, A. I.
Polymer 1984, v. 25, p. 107.
6. Mikelsaar, R. H.; Aabloo, A. In: Cellulosics: Chemical, Biochemical and
Material Aspects. Eds. J. F. Kennedy, G. 0 . Phillips, P. A. Williams. Ellis Horwood, Chichester, 1993, p. 61.
7. Arnott S.; Scott W. E. J. Chem. Soc. Perkin II 1972, p. 324.
8. Zugenmayer P.; Sarko A. ,4CS series 1980, v. 141, p. 226.
9. Allinger N. L.; Yuh Y. H.; Lii J.-H. J. Amer. chem. Soc. 1989, v. 111, p.
8551.
10. Allinger N. L.; Rahman, M.; Lii J.-H. J. Amer. chem. Soc. 1990, v. 112, p.
8293.
11. Stipanovic A. J.; Sarko A. Macromolecules 1976. v. 9, p. 851.12. Woodcock C.; Sarko A. Macromolecules 1980, v. 13, p. 1183.13. Pertsin A. J.; Nugmanov O. K.; Marchenko G. N. Polymer 1986, v. 27, p.
597.

Results
The characteristics of the cellulose structure models investigated is presented in Table 1.
1. Molecular models fitting with cellulose lor unit cell parameters
1J . Models PI
The investigation of green alga Microdktyon by Sugiyama et a l1 is the first work where unit ceil parameters are given for pure cellulose la phase microcrystals: a = 0.674 nm, b - 0.593 nm, с = 1.036 nm, a = 117°, ß = 113° and у = 81°. This one-chain unit cell requires parallel packing of molecular chains. Molecular modelling by Tartu devices showed that if there are the usual intramolecular bonds 03-H...05 and 02-H...06 the hydroxymethyl groups should be in tg conformation and all parallel chains are bound by intrasheet bonds 06-H...03. Packing energy calculations of the above-described cellulose structure imitation revealed that model PI has potential energy -193 kcal/mol.
13. Models A la and A lb
Two antiparallel models A la and Alb characterized by eight-chain unit cell maybe geometrically derived from the one-chain unit cell described by Sugiyama et alЛ The geometry of these two models is very similar. The only difference is that in Ala parallel chains follow each other from down right to up left dividing major angles of unit cell and in A lb from down left to up right dividing minor angles of unit cell. So Ala may be called ’left" and A lb 'right* type of structures. According to molecular modelling data chains having usual intramolecular H-bonds and tg conformation of hydroxymethyl groups should be in models Ala and A lb bound by intrasheet bonds 06-H...02. The potential energy values of above-described structures are rather similar: model A la has -16.4 kcal/mol and A lb -15-5 kcal/mol.
1. Molecular models fitting with cellulose Iß unit cell parameters
2J . Model P2
Sugiyama et al.1 have established that Iß phase of Microdictyon cellulose has two-chain monoclinic structure with unit cell parameters of a = 0.801 nm, b = 0.817 nm, с = 1.036 nm and у = 97.3°. The authors suppose that this structure consists of parallel molecules and die center and comer chain are staggered by c/4. Molecular modelling revealed that intra- and intermoiecular H-bonds in model P2 are identical to those in model PI. The energy value of model P2 is close to model PI: -19.9 kcal/mol.
23. Model A2
Molecular modelling showed that a chain conformation and an intrasheet H-bonding network in model A2 are identical to model P2. The only difference is that sheets are parallel in model P2 and antiparallel in model A2. The potential energy of model A2 is relatively high: -15.8 kcal/mol.
23. Models A3a and A3b
Two antiparallel models A3a and A3b characterized by eight-chain unit cell may be geometrically derived from the two-chain unit cell described by Sugiyama et al.1. These structures are similar to the

"left'' and ’right" models Ala and Alb differing mainly by pretence of intrashect stagger of celluloee chains. The investigation by plastic models indicated that in the case where standard intramolecular H-bonds and tg conformation of hydroxymethyl group« are preserved the antiparallel molecular chains are bound by bonds 06-H...03. There is considerable difference between energies of above-described two structures: the "left* type model A3a has -21.0 kcal/mol and "right" mode] A3b -15.1 kcal/mol.
Discus§ion
Our investigation revealed (hat both parallel and antiparallel structure models can be proposed based on cellulose la snd Iß crystalline phases unit cell parameters published by Sugiyama et al.1. Although they all have usual chain conformation and intramolecular H-bonding network, the potential energy values between seemingly close structure* in certain cases are very differentSugiyama et al.' interpret their experimental data in the light of all-parallel structure view. Following this view, the l a phase structure should correspond to our model PI and Iß phase to model PZ Comparing cellulose psrallel model PI with antiparallel models Ala and A lb one can see that these models are sterically very similar. If the H-bonding network and chain polarity are not clearly established the structure characterized by eight-chain unit cell can be considered as the one-chain unit cell. We think that antiparallel model Ala having lower energy (-16.4 kcal/mol) in comparisoa with the model A lb (-15.5 kcal/mol) is a possible pretender for a "masked* eight-chain unit cell in the cellulose la crystal structure described by Sugiyama et al.'. The antiparallel structure is not excluded also for cellulose Iß crystalline phase because these authors marked that the exact position of the celluloee chains in the monoclinic unit cell was even more difficult to ascertain as long as the structure refinement was not achieved. No doubt, A3a is the best antiparallel model for fitting to the unit cell structure of Iß crystalline phase because it has sn excellent pscking energy: -21.0 kcal/mol.
Table 1. Parallel and antipanllel stereochemical models for celluloee l a and Iß crystallinephases.
Model Unit cell designation
Intramolecular H-bonda IntrasheetH-bonds
-CHjOH group conformation
Packingenergykcal/mol
.a PI 1 ОЗ-H...05 02-H ...06 Об-H .03 •* -19-5
Iß P2 01 03-H ...05 02-H ...06 06-H...03 -19.9
la Ala 00112233 03-H ...05 02-H ...06 06-H...02 -16.4
la A lb 00112233 03-H ...05 02-H ...06 06-H...02 tg -15.5
ip A2 01 03-H...05 02-H ...06 06-H...03 4 -158
ip A3a 01123243 03-H ...05 02-H ...06 06-H...03 •« -21.0
ip A3b 01213234 03-H ...05 02-H ...06 Об-H .03 4 -15.1
If the "left" type antiparallel models Ala and A3i are thought to be the candidates for structures ofcellu lose la and Iß crystalline phases, correspondingly, it would be easy to explain the experimental data on the interconversion o f these phases. Model Ala, having relatively high energy -16.4 kcal/mol. is metasUble and can during annealing process easily be converted irreversibility into the model A3a, having very low energy -21.0 kcal/mol. Because the models Ala and A3a have different H-bonding netw orks, our conception on antiparallel cellulose structure is in accordance also with Raman-

spectroscopic data*. The high energy barrier between la and Iß crystalline phases, bound with rearrangement of hydrogen bonds, may be the reason why the proportion of these phases in different samples of native cellulose is relatively constant The notable structural differences between models Ala and A3a allow one also to understand the differences between corresponding unit cell parameters of la and Iß cellulose crystalline phases.The process of cellulose I-»II conversion can be also easily interpreted by all-antiparallel conception, because already Na-celluloee I, formed in the initial step of mercerization, has antiparallel structure9'10.
References
1. Sugiyama,J; Vuong, R; Chanzy, H. Macromolecules 1991,v. 24, p. 4168.2. Atalla, R. H.; VanderHart, D. L. Science 1984, v. 223, p. 283.3. VanderHart, D. L.; Atalla, R H. Macromolecules 1984, v. 17, p. 1465.4. Horii, F.; Yamamoto, H.; Kitamaru, R ; Takahashi, M.; Higuchi, T. Macromolecules 1987, v. 20,
p. 2946.5. Mikelsaar, R Trends BiotechnoL 1986, v. 6, p. 162.6. Pertsin, A J.; Nugmanov, O. K.; Marchenko, G. N.; Kitaigorodsky, A I. Polymer 1984, v. 25, p.
107.7. Mikelsaar, R-H.; Aabloo, A In: Cellulosics: Chemical, Biochemical and Material Aspects. Eds.
J. F. Kennedy, G. O. Phillips, P. A Williams. Ellis Horwood, Chichester, 1993, p. 57.8. Atalla, R H. In: Cellulose Structural and Functional Aspects. Eds. J. F. Kennedy, G. O. Phillips,
P. A Williams. Ellis Horwood, Chichester, 1989, p.61.9. Sarko, A ; Nishimura, H.; Oka oo, T. In: Structure of Cellulose; ACS Symposium Series 340;
Amercan Chemical Society: Washington, DC, 1987 p. 169.10. Nishimura, H.; Oka no, Т.; Sarko, A Macromolecules 1991, v. 24, p. 759.

TÜ 94. Т. 124. 150. 6,0.