Embed Size (px)
Citation preview

1
修士 論文
水中における人体の熱的応答に関する研究
Study of Human Thermal Reaction in Water Immersion
1-75ページ 完
平成 14年 2月 15日 提出
指導教官 : 庄司 正弘 教授
学生証番号:06831 氏名:連 宗旺 (LEAN CHONG HWANG)

2
CONTENTS
ACKNOWLEDGEMENT ......................................................................................................4
INTRODUCTION....................................................................................... 5
1.1 BACKGROUND ...............................................................................................................5
1.2 OBJECTIVE ....................................................................................................................6
MATHMATICAL MODELING ................................................................ 7
2.1 BODY HEAT BANLANCE EQUATION ........................................................................7
2.2 METABOLIC HEAT PRODUCTION ..........................................................................10
2.3 EVAPORATIVE HEAT EXCHANGE ..........................................................................10
2.4 HEAT EXCHANGE WITH ATMOSPHERE BY SENISIBLE HEAT........................13
2.5 HEAT EXCHANGE WITH WATER ENVIRONMENT ..............................................13
NUMERICAL SIMULATION.................................................................15
3.1 CONTROL SYSTEM .....................................................................................................15
3.2 CONTROLLING SYSTEM ...........................................................................................20
EXPERIMENTS........................................................................................28
4.1 INTRODUCTION ..........................................................................................................28
4.2 METHOD .......................................................................................................................28
RESULTS AND DISCUSSIONS..............................................................32
5.1 EXPERIMENTAL RESULTS .......................................................................................32
5.2 EXPERIMENTS VS SIMULATIONS ..........................................................................38
5.3 SIMULATIONS..............................................................................................................45
CONCLUSION..........................................................................................49

3
APPENDIX ................................................................................................50 APPENDIX A – TABLES ....................................................................................................51
Table 1: Surface Area, Weight and Heat Capacity of the Four Compartment in each Segment. ...........................................................................................................................51 Table 2: Thermal Conductance between Compartments, Basal Metabolic Heat Production and Basal Blood Flow for Each Compartment. ........................................52 Table 3: Values of Heat Transfer Coefficient for Each Segment .................................53 Table 4: Estimation of Distribution of Skin Receptors, Sweating, Vasodilatation and Vasoconstriction Command over the different Skin Areas..........................................53 Table 5: Estimates of Distribution of Heat Production in Muscle Compartment. ....53 Table 6: Temperature Set Point for initial condition....................................................54
APPENDIX B.......................................................................................................................55 Programming 1: Simulation of Physiology Reaction in water immersion .................55 Programming 2: Conversion Volt to Celsius .................................................................70
REFERENCE ......................................................................................................................74

4
ACKNOWLEDGEMENT
I would like to acknowledge with sincere appreciation the facilities made available and the
generous help given my supervisor, Prof. Masahiro Shoji during the whole period of study.
My deep gratitude is due to his continuous guidance and encouragement which were really
invaluable and fruitful.
I would like to thanks Associate Prof. Shigeo Maruyama, for his careful help and valuable
opinion in performing my study. Thanks are extended to Mr. Makoto Watanabe how provided
sincere help during the experimental work.
Finally, I am grateful to my parents who dedicated their lives full of sacrifices to provide
me with all means of the success.

5
CHAPTER 1
INTRODUCTION
1.1 BACKGROUND
Even though we spend most of our time in land, more and more people involve in water
activities for the purpose of such as doing daily activities (taking hot bath, shower etc) and
recreational activities (swimming, scuba diving, snorkeling etc). In addition, for occupational
reason, some people need to work in a deep sea water and for the purpose of survival, for
instance accidental cold water immersion, a proper understand of human thermal or
physiological response while they immerse into water is very important. The physical
properties of water are very different from those in air. Accordingly, the environmental stress
easily become severe and may even threaten life. On immersion heat exchange between the
body and its environment is enhanced. Water has a volumetric specific heat 4000 times
greater than that of air, and a conductivity 25 times that of air. Water therefore serves as a
gigantic heat sink around the body. As the results, it is equally important to study the human
thermal response in aquatic environment.
Various human body models have been developed to simulate human thermoregulation. In
a simple model, the human body may be considered as only two concentric cylinders, while in
some complex models, the body can be divided into more than 50 major elements and body
temperatures are computed at tens of thousands of nodal points on a supercomputer. In most
cases, human body models are used to predict physiological responses to thermal condition.
However, almost all of those model were done in air environment, there is none developed for
water environment.
In this study, a numerical modeling has been developed to simulate the human thermal
responses in water immersion. The model is then validated with experimental data of taking a

6
bath only. In general, the model is a basic whole body water immersion for taking a bath,
further development can be continue to include other water activities as well.
1.2 OBJECTIVE
Since the understanding of human thermal reaction in aquatic environment is so important,
the purpose of this study is to
1. To develop numerical model that simulates the human thermal response in water immersion
such as mean skin temperature, core temperature, metabolic heat production and evaporative
heat loss. This model to be developed in such a format that this can be used to simulate human
thermal response in different environment conditions (such as water temperature, air and
humidity temperature etc), and also different part of body immersion (i.e. either whole body
immersion with only head out or half body immersion)
2. Carry out experiments that measure skin and oral temperature of human in water immersion.
The purpose of doing experiment is to validate the simulation result. The experiment is done
in three cases that to validate the simulation results in various criteria for instance, different
water temperature conditions, two types of body part of immersion and different subjects.

7
CHAPTER 2
MATHMATICAL MODELING
2.1 BODY HEAT BANLANCE EQUATION
Since the purpose of the thermoregulatory system of the body is to maintain an essentially
constant internal body temperature, it can be assumes that for long exposures to a constant
(moderate) thermal environment with a constant metabolic rate a heat balance will exist for
the human body, i.e., the heat production will the heat dissipation, and there will be no
significant heat storage within the body. The heat balance equation [8] describing the thermal
exchange between the body and its environment is
[ ]2.)( −±−±±−= mWWCREMH (2.1)
where H = rate of storage of body heat (+ for net gain)
M = rate of metabolic energy production (always +)
E = rate evaporative heat loss
R = rate of radiant heat exchange (+ for gain)
C = rate of convective heat transfer (+ for gain)
W = rate of work (+ for work against external force)
2.11 Body Temperature – Mean Skin Temperature and Core Temperature
Skin temperature may be measured experimentally by appropriately designed
thermocouples. Mean skin temperature Tsk, is an average of local values of skin temperature
over the body surface. Each weighted by the fraction of the total body surface represented. A
useful weighting scale is head (7%), chest (17.5%), back (17.5%), upper arms (7%), forearms
(7%), hands (5%), thighs (19%), and legs (20%). In the cold, wide differences in skin
temperature over the body surface can be expected, which hinder proper interpretation of Tsk.

8
However, in the water immersion, the skin surface temperature tends to be fairly uniform and
thus the weighting factors are less significant in determining Tsk.
Skin temperature serve as an significant index of the mode of regulation of body
temperature. Values of Tsk may also serve as indices of our sensory judgment of heat, cold and
pain as well as of the thermal comfort the environment. Table 2.1 outlines the general
relationships that may be expected between skin temperature and various physiological and
sensory states. It shows that the comfort range skin temperature for human is quite limited i.e.
34-36°C. Human will be in critical condition with small increase (about 6°C) and decrease
(18°C) in mean skin temperature.
Table 2.1: Range of Skin Temperature
0 - 5
15
32 - 33
33 - 34
35 - 37
35-39
39 - 41
41 - 43
45
0 - 5
15
32 - 33
33 - 34
35 - 37
35-39
39 - 41
41 - 43
45
Sensation of cold
Sensation of warm
Sensation of heat
Pain
Threshold of burning pain
Rapid tissue damage
Temp*
* in degrees Celcius
No sensation
Comfort Zone
State
The temperature of blood reaching the hypothalamus (Tcore) is regarded as a major afferent
stimulus for the intensity of the effector response of sweating, vasomotor activity and
shivering. To estimate Tcore in humans, measurement sites other than the hypothalamus have

9
frequently been utilized, including the oral cavity, tympanice membrane, pulmonary artery
(PA) and right heart (RH), rectum and esophagus. Measurement of Tcore is important both as
an estimate of afferent input in the temperature-control system and as an estimate of the
temperature of the blood going to the brain. Table 2.2 outlines the general relationships that
may be expected between core temperature and various physiological and sensory states.
Table 2.2: Range of Core Temperature
Loss of consciousness
Central nervous system breakdown
Death
Temp*
* in degrees Celcius
Normal
Muscle failure
Loss of body temp. control28
30
33
37
42
44
State
In contrast to the situation in air, water exposure of a nude person will bring the
temperature of the skin close to that of water within minutes. The skin-to-water temperature
gradient is affected by water temperature, water movement and people` movements. The core
temperature is affected little during the first 5 minutes of immersion, irrespective of water
temperature and metabolic rate. A longer exposure will, except in a rather narrow
`thermoneutral` range of water temperature, induce a change in core temperature. The rate of
this change is dependent on factors including water temperature, and the subject metabolic
rate and skinfold thickness. Thus the temperature zone in which man can stay in water
without excessive heating or cooling is very narrow compared to air.

10
2.12 Skin Wettedness
Skin wettedness (w) is defined as the ratio of an equivalent akin area (Awet), which, if
covered with water, would produce the observed skin evaporative heat loss (Esk) to the total
skin surface area (Atotal). Evaluating of w will be discussed in the section 3.23.
2.2 METABOLIC HEAT PRODUCTION
The metabolic energy term M in the basic heat balance Equation 1 represents the free
energy produced by the transformation of chemical energy during aerobic and anaerobic
metabolic activities within an organism.
2.3 EVAPORATIVE HEAT EXCHANGE
Evaporative heat loss in man occurred through respiratory system and skin. Evaporation
heat loss through skin can then be further divided into skin diffusion and sweat secretion.
2.31 Evaporation Heat Loss by Skin Diffusion
Water vapor diffusion through the skin is one part of the insensible perspiration, a process
not subject to thermoregulatory control. The magnitude of the diffusion per unit area is
assumed to be proportional to the difference between the saturated water vapor pressure ps at
skin temperature and the partial vapor pressure of water vapor pa in the ambient air. The
equation [3] for the heat loss by water vapor through skin diffusion is
)( astotalfgdiff ppmAhE −= (kJ/hr) (2.2)
where Ediff = heat loss by vapor diffusion through the skin (Watt)
hfg = heat of vaporization of water (kJ/kg, value from Steam table)

11
m = permeation coefficient of skin, (6.1×10⁻⁴kg/hr m2 mm Hg, from analysis data of
Inouye et al)
ps = saturated vapor pressure at skin temperature (mmHg)
pa = vapor pressure in ambient air (mmHg)
By substitute the permeation coefficient of skin into eq.2.2 and convert the unit of
kJ/hr into Watt, the evaporative heat loss through skin diffusion can be rewritten as:
)(106944.1 4astotalfgdiff ppAhE −×= − (W) (2.2a)
2.32 Evaporation Heat Loss by Sweat Secretion
The heat loss by the evaporation of sweat secretion on the skin surface is humans` most
effective means of survival in the heat. The magnitude of the sweat secretion is a function of
the activity level. The amount of heat removed by evaporation of sweat is given by
)/( ototaltotalsw qAMAE −= λ (2.3)
According to Eq. (2.3) sweating will not occur for metabolic rates (M) lower than qo (a typical
value for humans is 58 W/m2), Above this value, which corresponds to average sedentary
conditions in humans, sweating is an increasing function of thermal exposure. λ is an
experimental coefficient relating the amount of heat exchange by sweating to physiological
parameters. A typical value of isλfor human is 0.32.
2.33 Evaporation Heat Loss by Latent Respiration
Heat and water vapor are transferred to inspired air by convection and evaporation from
the mucosal lining of the respiratory tract. On reaching the alveoli the air is at deep body
temperature and saturated with water vapor. As the air moves outward through the respiratory
tract some heat is transferred back to the body and water is condensed but the expired air

12
emerging from the nose still contain more heat and water than the inspired air in comfortable
environments. Breathing therefore results in a latent heat loss and a dry heat loss from body.
The latent respiration heat loss is a function of the pulmonary ventilation and the
difference in water content between expired and inspired air:
( )λaexres WWVE −=•
(kcal/hr) (2.4)
where Eres = latent respiration heat loss (kcal/hr)
•
V = pulmonary ventilation
Wex = humidity ratio of the expiration air (kg water/ kg dry air)
Wa = humidity ratio of the inspiration air (kg water/ kg dry air)
λ = heat of vaporization of water (value from steam table)
Pulmonary ventilation is mainly a function of the metabolic rate, through minor
differences have been observed between working tasks where arm and leg movements
respectively are dominant. The following linear expression has been found as a practical
approximation for the mean pulmonary for different type of work:
MV 0060.0=•
(2.5)
Although the function of the respiratory tract is quite effective, the condition of the
expired air will still depend to a certain degree upon the condition of inspired are. The
difference between expired and inspired air can be expressed by the following equation:
Wex - Wa = 0.0277 + 0.000065ta - 0.80Wa (2.6)
≅ 0.029 - 0.80Wa (kg water/kg dry air)

13
Substituting aa
aa p
pPp
W 00083.0622.0 ≅−
= in Eq. (6) gives
Wex - Wa = 0.029 - 0.00066pa (kg water/kg dry air) (2.6a)
Where pa = the partial pressure if water vapor in inspired air (ambient air) (mmHg)
P = 760 mmHg (sea level barometric pressure)
Substituting the expression for •
V and Wex - Wa in Eq. (4), one obtains the following
formula for the latent respiration heat loss:
( )ares pME −= 440023.0 (kcal/hr) (2.4a)
2.4 HEAT EXCHANGE WITH ATMOSPHERE BY SENISIBLE HEAT
The exchange of sensible heat from skin surface at average temperature Tsk is usually
accomplished by radiation and convection from the skin surface to the surrounding medium.
The heat exchange from the body surface without cloth, at skin temperature is given by
( )asksen TThQ −= (Wm-2) (2.7)
where h is the combined coefficient for heat transfer by radiation and convection in W.m-2C-1
and Ta is the ambient air temperature.
2.5 HEAT EXCHANGE WITH WATER ENVIRONMENT
Heat will either transfer from the human body to water or on the other way round is
depend upon the temperature difference between the skin and water temperature. In cold
water immersion, heat produced in the body core and the limbs is transport by blood
convection and tissue conduction to the skin surface for dissipation. Heat arriving at the skin
surface will be dissipated to the colder water by convection at a rate determined by the skin to
water temperature (Tw) gradient (Tsk- Tw) and the heat transfer coefficient for external
convection hw(Wm-2C-1).

14
( )wskwwater TThQ −= (Wm-2) (2.8)
This is the only important heat transfer at the skin because in water evaporation of sweat
cannot be used as a heat dissipating mechanism and heat loss hue to radiation is negligible.
On the other hand, warm water immersion will result in a negative Qwater showing that the
heat is transferred from the water environment to human body.
Values for the convective heat transfer coefficient hw have been derived analytically,
measured on a heated copper manikin placed in water or determined from experimental data
on human. RAPP [6] presented values for hw of 105 Wm-2C-1 in still water, increasing nearly
linearly to 411 Wm-2C-1 at 0.5 ms-1.

15
CHAPTER 3 NUMERICAL SIMULATION
The mathematical model for human thermoregulation involves both a passive system and
a controlling system. Commonly, the geometrical and anatomical representations of the body
and mathematical expressions of the heat transfer within the body and between the body and
its environment are referred to as the passive system. The mathematical representation of the
regulatory mechanisms by which the body regulates its heat exchanges to control the body
temperature is referred to as the controlling system. The model is expressed in a form of
computer simulation, which is written in FORTRAN programming language.
For the present study, a 29-node model is used. The development of this model is derived
from the Stolwijk and Hardy model [1], particularly in aspects of body heat flow analysis and
mechanisms for thermal regulation. However, Stolwijk and Hardy model is only modeling of
temperature control of human in air environment, whereas, the developed model has included
the air environment as well as water environment. In addition, the six-element body
representation by Stolwijk and Hardy is replaced by seven-element representation, which the
“trunk” part has been divided into “thorax” and “abdomen”. The purpose is to allow
simulation for half body water immersion.
3.1 CONTROL SYSTEM
Figure 3.1 shows the anatomical representation of the human body. As shown in the figure,
the body is divided into seven segments (I), i.e. head, thorax, abdomen, arm (included arm
and forearm), hand, leg (included thigh and calves) and feet. Each of the body segments is
further divided into four compartments (N): core, muscle, fat and skin. An additional central
blood compartment, representing large arteries and veins, exchange heat with all the other
compartment through the convective heat transfer occurring with the blood flow to each

16
compartment. To simplify the model, each compartment is assumed to have direct blood
convective heat transfer with the central blood compartment rather than the adjacent body
compartments. The total compartments are 29 compartments. For each of the 29
compartments complete heat balance equation must be developed to account for heat flow
into and out of the compartments, through conduction, convection, and the metabolism heat
production within the compartment. For those compartments in contact with outside
environment, equations will be derived to express the heat exchange by evaporation, radiation,
and convection. Chapter 2, Mathematical Modeling, has details discussion about general Heat
Balance Equation of human being.
The dimensions and thermal properties of each compartment are derived from Handbook
of Physiology ~ Reaction to Environmental Agents [1]. The average The “Standard man” in
the calculation is taken as 172 cm in height and 74.4 kg in weight. Table 3.1 shows the
definition of symbols and their dimension used in FORTRAN programming. In numerical
calculation, each segment is presented as I and each compartment is presented as N. Therefore,
the symbol I in Table 3.1 are refer to the segment, I=1 being the head,I=2, the thorax, I=3, the
CB2 44
6 6
7 7
5
1
5
3
core, N
muscle, N+1
fat, N+2
skin, N+3
Figure 3.1 Seven-segment human thermoregulation model

17
abdomen, I=4, the arms, I=5, the hands, I=6, the legs and I=7, the feet. The character N is
refer to the individual compartment, i.e. N=4*I-3 always indicates the core layer of segment I,
N=4*I-2 the muscle layer, N=4*I-1 the fat layer and N=4*I the skin compartment. The central
blood compartment is represented by N=29. Table 1 (Appendix A) gives the surface area and
weight of each segment together with parameters of weight and heat capacitance for each
compartment. The values of heat capacitance are based on a specific heat for the skeleton of
0.58 W.h/kg.°C, 0.70 W.h/kg.°C for fat and 1.05 W.h/kg.°C for all other tissues. The central
blood compartment representing the blood in the heart and the great vessels is assumed to
contain 2.5 liters of blood at a specific heat of 1.04 W.h/°C. Table 2 (Appendix A) shows the
thermal conductance between compartments, basal metabolic heat production and basal blood
flow for each compartment (Data are taken from Handbook of Physiology ~ Reaction to
Environmental Agents [1]).
Table 3.1 Definition of Symbols used in Controlled System.
SYMBOL TOTAL
VALUE
DEFINITION DEMEN-
SION
(SI units)
QC(N) 29 Heat capacitance of compartment N W.h°C-1
QF(N) 29 Rate of heat flow into or from N W T (N) 29 Temperature of C °C F(N) 29 Rate of change of temperature in N °C.h-1
MB(N) 28 Basal metabolic heat production in N W M(N) 28 Total metabolic heat production in N W EV(N) 28 Total evaporative heat loss from N W TK(N) 28 Thermal conductance between N and N+1 W. °C-1
TD(N) 28 Conductive heat transfer rate, N to N+1 W BFB(N) 28 Basal effective blood flow to N l.h-1 BF(N) 28 Total effective blood flow to N l.h-1

18
BCV(N) 28 Convective heat transfer between central blood and N
W
S(I) 7 Surface area of Segment I m2 HRD(I) 7 Radiation heat transfer coefficient for Segment I Wm-2°C-1
HCV(I) 7 Air environmental convective heat transfer coefficient for Segment I
W.m-2°C-1
H(I) 7 Total environmental heat transfer coefficient for Segment I
W.°C-1
HW Water environmental convective heat transfer coefficient for Segment I
W.m-2°C-1
EMAX (I)
7 Calculated maximum rate of evaporative heat loss from Segment I
W
PSKIN (I)
7 Saturated water vapor pressure at skin temperature
Torr
PV 10 Vapor pressure from 5-50°C (from Steam Table) Torr WORK Total metabolic rate required by exercise W TAIR Air temperature °C TW Water temperature °C V Air Movement m.s-1 RH Relative humidity in air NONE PAIR Water Pressure in air Torr TIME Elapsed time hr ITIME Elapsed time min DT Integration Step hr INT Intervals between outputs min

19
3.11 Metabolic Heat Production
Metabolic rate of the brain is estimated about 17% of the basal metabolic rate, and the
trunk core accounts for about 60% of the resting metabolic rate. The total skin and
musculature to produce 18% of the basal metabolic heat which leaves 5% for the skeleton and
connective tissue. Since the resting metabolic rate is taken as 86.5 W for the whole standard
man (45.8 W.m-2), the head core has a metabolic rate of 14.9 W, the trunk core of 52.6 W and
15.6 W is to be divided between skin and musculature. The full estimated values of basal
metabolic rate, MB(N) is shown in Table 2 (Appendix A).
3.12 Convective Heat Exchange Resulting from Blood Flow.
Convective heat transfer occurred between its parts as a result of blood flow. Some
regions are characterized as relatively constant blood flow. For example, the brain receives a
constant blood flow of about 45 l.hr-1. Resting muscle is estimated to require 1.2 l.hr-1 of
blood flow for each 1.16 W of metabolic heat production, purely on the basis of supplying the
needed oxygen. The distribution blood flood to different compartment in different segment
including that of different skin areas is shown in Table 2 (Appendix A).
3.13 Heat Exchange with Environment
In air environment, the environmental heat transfer coefficient of each segment is shown
in Table 3 (Appendix A). Air velocity considered in terms of the convective coefficient and
estimated in Table 3 are for the natural convection. Substitution of proper environmental
factors into the heat loss equations enables the model to respond so as to simulate
thermoregulatory activity. For the condition estimated in Table 3, the sensible heat loss from
the skin of segment I in air environment can be written as
(HRD(I)+HCV(I))*(T(4*I)-TAIR) = HA(I)*(T(4*I)-TAIR) (3.1)

20
In water environment, expression HA(I)*(T(4*I)-TAIR) will then be present in
HW(I)*(T(4*I)-TW).
3.2 CONTROLLING SYSTEM
A controlling system of the model is developed to simulate human physiological response
by body thermoregulation. A closed control loop with set and feedback temperature for each
compartment is developed to simulate the four kinds of thermal sensations: vasoconstriction
and shivering against cold; vasodilatation and shivering against heat. The actual instantaneous
temperature in all the compartments are compared with the set point temperature so that
“SIGNAL” can be obtained and then the outputs of “WARM” or “COLD” can be determined
as the following:
SIGNAL(N) = T (N) – TSET(N) + RATE(N)*F(N) (3.2)
In the first approximation, the SIGNAL is thus equal to the difference between the
instantaneous temperature T(N) and the reference temperature TSET(N). For appropriate
compartment where dynamic sensitivity of the thermoreceptors is quantitatively known, the
dynamic term RATE(N)*F(N) can assume positive or negative values. T(N) and F(N) are
continuously computed from the passive system, and TSET(N) and RATE(N) are controlling
system characteristics supplies as initial constants.
WARM(N) = SIGNAL(N), if SIGNAL>0;
WARM(N) = 0, if SIGNAL<=0;
COLD(N) = -SIGNAL(N), if SIGNAL<0;
COLD(N) = 0 , if SIGNAL>=0;
Table 3.2 Shows the definition of all symbol used in the controlling system.

21
Table 3.2 Definition of Symbols used in Controlling System.
SYMBOL TOTAL
VALUE
DEFINITION DEMEN-
SION
(SI units)
SIGNAL(N) 29 Output from thermoreceptors in compartment N °C WARM(N) 29 Output from warm receptors in N °C
COLD(N) 29 Output from cold receptors in N °C
TSET(N) 29 Set point of temperature for receptors in N °C
RATE(N) 29 Dynamic sensitivity of thermoreceptors in N
WARMS Integrated output from skin warm receptors °C
COLDS Integrated output from skin cold receptors °C
SWEAT Total efferent sweat command W CHILL Total efferent shivering command W DILAT Total efferent skin vasodilatation command l.hr-1 STRIC Total efferent skin vasoconstriction command NONE SKINR(I) 7 Fraction of all skin receptors in Segment I NONE SKINSW(I) 7 Fraction of sweating command applicable to skin
of Segment I NONE
SKIND(I) 7 Fraction of vasodilatation command applicable to skin of Segment I
NONE
SKINC(I) 7 Fraction of vasoconstriction command applicable to skin of Segment I
NONE
WORKM(I) 7 Fraction of total work done by muscles in Segment I
NONE
CHILLM(I) 7 Fraction of total shivering occurring in muscle of Segment I
NONE
CSW Sweating from head core W.°C-1 SSW Sweating from skin W.°C-1 CDIL Vasodilatation from head core l.h-1.°C-1
SDIL Vasodilatation from skin l.h-1.°C-1
CCON Vasoconstriction from head core °C-1 SCON Vasoconstriction from skin °C-1 CCHIL Shivering from head core W.°C-1 SCHIL Shivering from skin W.°C-1 PSW Sweating from head core and skin W.°C-2 PDIL Vasodilatation from skin and head core l.h-1.°C-2

22
PCON Vasoconstriction from skin and head core °C-2 PCHIL Shivering from skin and head core °C-2
The distribution of receptors is different in individual compartment. This is to ensure
every different part of compartment can have different temperatures especially important in
skin compartment. Thus, the value for fraction of all skin receptors in particular segment I ,
SKINR shown in Table 4 (Appendix A) have been estimated from experiment by Nadel et.al
[1]. The distribution of vasodilatation and vasoconstriction is also not uniform over the skin
area. The relative distribution of sweat secretion, in the absebce of information based on local
secretion measurements is estimated by the distribution od sweat glands. Table 4 also shows
the value of SKIND, SKINC and SKINSW.
The total warm receptor output from the skin, WARMS, is obtained by summing of
SKINR(I)*WARM(4*I) for the skin compartments of all segment. The total cold receptor
output can be calculated from the same summation.
WARMS=∑ SKINR(I)*WARM(I) where I = 1 to 7
and
COLDS=∑ SKINR(I)*COLD(I) where I = 1 to 7
Based on a central temperature signal from head core and the integrated signal from the
skin, the efferent outputs of the controlling systems are determined, respectively, for the four
thermal reactions:
SWEAT = CSW*SIGNAL(1)+SSW*(WARMS-COLDS)+PSW*WARM(1)*WARMS
DILAT = CDIL*SIGNAL(1)+SDIL*(WARMS-COLDS)+PDIL*WARM(1)*WARMS
CHILL=(CCHIL*SIGNAL(1)+SCHIL*(COLDS-WARMS))*PCHIL*(WARMS- COLDS)
STRIC = CCON*SIGNAL(1)+SCON*( COLDS- WARMS)+PCON*COLD(1)COLDS

23
The controlling system equations all have a first term consisting of the product of control
coefficient and a central temperature signal, a second term consisting of the product of a
control efficient and an integrated skin temperature signal, and a third term consisting of the
product of control efficient, a central temperature signal, and a skin temperature signal. These
expression will become negative under some circumstances, therefore, any negative values of
SWEAT, DILAT, CHILL or STRIC will be set to zero in numerical calculation.
3.21 Metabolic Heat Production – Work and Chill
The basal metabolic rates for all core compartments can be expressed in numerical form
as the following:
M(N) = MB(N) (3.3)
These expression shows that the basal metabolic rate for all core compartments is not change
under the relatively short-term condition.
For the muscle layer,
M(N+1) = MB(N+1)+WORKM(I)*(WORK)+CHILLM(I)*CHILL (3.4)
The metabolic heat production in muscle compartment is the sum of the basal heat production
MB(N+1), and the heat production rates assigned to muscular work done and shivering
thermogenesis. Table 5 (Appendix A) shows the estimated values of WORKM and CHILLM,
which is taken from the Handbook of Physiology [1]
In the fat and skin compartments, it is assumed that the basal metabolic heat production does
not change in the conditions to be evaluated by the model, so that
M(N+2) = MB(N+2) (3.5)
M(N+3) = MB(N+3) (3.6)

24
3.22 Blood Flow
The convective heat transfer by blood flow plays a very important role in the thermal
response to internal and external stresses. The blood flow to the core compartment is assumed
to be remain at the basal values:
BF(N) = BFB(N) (3.7)
This expression ignores the fact that blood flow to the trunk core can be reduced during
exercised stress, but the blood flow to these compartments is considerably in excess of that
required to supply oxygen to these compartments, and thus only small thermal gradients can
exist between core compartments.
Unlike the core compartment, muscle compartment can have widely different metabolic
rates and, consequently, variations in blood flow as well. Under conditions in which heat loss
in exercise is mostly from evaporation of sweat, the working muscle is about 1.0 °C above
that of the arterial blood supplying oxygen. If venous blood leaves at muscle temperature,
then every liter of blood contains about 200 ml O2 which, if completely scavenged, could
produce 1.16 W.h of heat. As the result, the following equation expresses the blood flow to the
muscle compartment.
BF(N+1) = BFB(N+1) + M(N+1) – MB(N+1) (3.8)
Blood flow to the fat layer is not very high in basal value, and it is not effectively changed as
a result of thermoregulatory adjustments
BF(N+2) = BFB(N+2) (3.9)
Skin blood flow is highly dependent on the thermoregulatory controller. The basal blood flow
at thermal neutrality can be reduced to very low values through vasoconstriction, and
increased through vasodilatation. The expression for local skin blood flow then becomes
BF(N+3) = ((BFB(N+3) + SKINV(I)*DILAT)/(1. + SKINC(I)*STRIC))
*2.** (SIGNAL(N+3)/10.) (3.10)

25
In this expression, the weighted DILAT central drive is added to the basal blood flow. The
weighted constrictive tone operates through a resistance and thus is entered as a divisor. The
local skin temperature effect (2**(SIGNAL(N+3/10)) then acts on the total flow drive
multiplying it by unity in neutral condition (SIGNAL(N+3)=0), by less than unity at skin
temperatures below normal and by more than one at skin temperature above the neutral value.
3.23 Evaporative Heat Loss and Sweating
For the resting subject in air environment, evaporative heat loss occurred through skin
diffusion and respiratory system. Respiratory water loss is a function of water pressure in the
inspired air (PAIR) and the ventilation volume. The ventilation volume is closely related to
the metabolic rate. Thus, the evaporative heat loss from respiratory water loss can be as
EV(5) = (86.4+WORK)*(0.0026749)*44.0-PAIR) (3.11)
Where 44.0 is the vapor pressure in expired air.
There is no evaporation heat loss occurred in other core, muscle and fat compartment, thus
EV(N) = EV(N) = 0 (besides EV(5)) (3.12)
EV(N+1) = EV(N+1) = 0 (3.13)
EV(N+2) = EV(N+2) = 0 (3.14)
From eq.2.2 (Chapter 2), the evaporative heat loss through skin diffusion (ED) for segment I
can be rewritten in numerical form as the following:
ED(I)=(1.6944×10⁻⁴)*HFGSKIN*SA(I)*(PSKIN-PAIR) (3.15)
Where HFGSKIN is calculated by interpolation from the steam table.
The different skin compartments receive a sweating drive, SWEAT from the central
controller. The local response in a skin compartment depends on the surface area and on the
number of sweat glands present, expressed by SKINS(I). The evaporative heat loss through
sweating (ES) then can be expressed as

26
ES(N+3) = SKINS(I)*SWEAT)*2.**((T(N+3)-TSET(N+3)) (3.16)
The maximum evaporative heat loss (EMAX) from a totally wet skin is proportion
gradient from the water vapor on the skin surface to the water vapor in the ambient air and
can be described by the relation
EMAX = λ .hD(PSKIN-PAIR) (W.m2) (3.17)
where λ is latent heat of sweat in 0.68 W.h.g-1: hD is mass transfer coefficient (for diffusion
of water vapor) in m.hr-1.
The wetted area of the skin (Aw) us defined as the area of skin, if covered with sweat,
would provide the observed rate of skin evaporation under the prevailing condition. Thus by
definition
EV = Aw.EMAX/Atotal (3.18)
Skin wettedness (w) is defined as the ratio of Aw/AD. Thus
w = Aw/AD = EV/EMAX (3.19)
Skin wettedness ranges from a certain minimum value, which occurs when there is no
evaporative heat loss by regulatory sweat (i.e., ES=0), to a maximum theoretical value of
unity. A theoretical minimum value of zero would occur if the skin were completely
impermeable to water vapor. At the minimum w value the evaporative heat loss from the skin
surface is entirely due to the diffusion of water vapor (ED), evaporated within outer layers of
the skin. The ED is also directly proportional to the value of EMAX. When regulatory
sweating begins, evaporative heat loss may occur both by diffusion (ED) as well as by the
evaporation of sweat (ES). When the skin is completely wet (i.e., w =1 ), ED no longer occurs
and EV is attributed entirely to regulatory sweating (ES). The ratio ES/EMAX describes the
skin wettedness (wS) due to sweating, i.e.,
wS = ES/EMAX (3.20)
27
and the ratio ED/EMAX is the skin wetttedness due to diffusion (wD), i.e.,
wD = ED/EMAX (3.21)
The total wettedness (w) any time is given by
w = wD + (1 - wD) wS (3.22)
By substitute Eq. (3.20) and Eq. (3.21) into Eq. (3.22), we get
EV=ES+ED-(ES*ED/EMAX) (3.23)

28
CHAPTER 4
EXPERIMENTS
4.1 INTRODUCTION
Numerous studies have simulated the human physiological response in water immersion.
In order to validation of the simulation result, experiments have been conducted on human
subjects to measure the oral and skin temperature. Oral temperature can be used to compare
with core temperature that was calculated in the simulation whereas skin temperature will be
directly validated by simulation results.
4.2 METHOD
4.21 Instrumentation
Figure 4.1 illustrates the experimental instrumentation. Oral temperature (Toral) was
measured using a Copper-Constantan thermocouple directly inserted into mouth. Skin
temperature was also measured by same thermocouple placed on the following sites: face,
chest, abdomen, arm, forehand and leg (thigh). The measured sites were insulated with a
small patch of plastic and masking tape. A layer of water strong bandages were also pasted
over the patch to prevent them getting out from water. The area weighted mean skin
temperature, Tsk was calculated by assigning the following regional percentages: face 7%,
chest 17.5%, abdomen 17.5%, arm 14%, hand 5% and thigh 39%. Signal were amplified,
noise filtered and then collected and digitized (by NEC digital recorder, model DR-F2A) at
1-s intervals and recorded in a floppy disk. The data in Volt will then converted to temperature
in Celsius by computer programming (see Programming 2: Conversion Volt to Celsius,
Appendix B).

29
Measurement Points
Noise Filter
Amplifier
Digital Recorder
Thermocouple
leghand
abdomen
thoraxarm
faceoral
Figure 4.1 Experiment apparatus
4.22 Experiment procedure
The experiments were done in a single apartment where the room and bath room
temperature was around 23 to 25 °C and relative humidity was 50 to 60%. Subjects were
taking bath in a one person use bathtub. Subjects were nude (wearing only swimming trunk is
assumed to be nude) and were instrumented appropriately before the experiments were started.
When the experiment was started, subject was resting by sitting on a chair in the room for 10
minutes (pre-immersion phase). The subject then immersed into water in the bathtub with set
water temperature for 15 minutes (water immersion phase). After the water immersion,
subjects then sat in the room for 30 minutes that allow the body and skin temperature
recovered back to the normal condition (recovery phase).

30
4.23 Experiment Cases
There were 3 variable parameters in the experiments i.e. subjects, water temperature and
body part of immersion. However, only one of the three parameters was become variable
parameter and the other two were constant. Therefore, there were 3 cases in the experiments
where in the first case, subjects were variable whereas water temperature and body part of
immersion were set to constant. In the second case, water temperature was variable and
subjects and body part of immersion were set to constant. Finally, in the last case, body part of
immersion was variable whereas subjects and water temperature were set to constant.
Case 1:
Variable: Subjects
Constant: Water temperature and body part of immersion.
Four experiments with different subjects were carried on in this case. Four male subjects A, B,
C and D, in theirs 20s with details individual particular showing in Table 4.1 participated in
the experiment.
Table 4.1: Subjects Particular and Environmental Conditions
SUBJECT PERSONAL DETAILS ENVIRONMENTAL COND. (Temp. & RH)
Height(cm) Weight(kg) Ethinic Room (before) Bath Room Room (recovery)
A 172 68.5 Asian 24.6 C, 49% 23.5 C, 50% 24.7 C, 48%
B 173 69 Caucasian 25.2 C, 64% 25.4 C, 64% 25.7 C, 66%
C 168 64 Asian 25.2 C, 61% 25.4 C, 66% 24.7 C, 66%
D 174 70 Asian 23.2 C, 55% 23.6 C, 60% 23.7 C, 61%
STANDARD* 172 74.4 - 24.6 C, 57% 24.5 C, 60% 24.7 C, 60%
Water temperature was fixed to 40°C and the immersions were done by whole body
immersion with only head out for the entire four experiments. Table 4.1 shows also the
environmental conditions (temperature and relative humidity) while the experiments were

31
carried on.
Case2:
Variable: Water temperature
Constant: Subjects and body part of immersion.
Only subject A was participated in these experiments and immersion was whole body
immersion with head out. Subject A was immersed in water at 28, 40 and 44 °C in different
day. Water temperature at 40°C is the normal hot bath water temperature recommended by
non-technical researcher. Cold water (relatively to skin temperature) at 28°C was selected to
validate the experiment and simulation results for the cold water. For the same reason, water
temperature at 44°C was selected for the extremely hot water condition.
Case 3:
Variable: body part of immersion
Constant: Subjects and water temperature
In this case, subject and water temperature were fixed to subject A and 40°C. There were two
experiments were carried out, first one was whole body immersion with head out and the
other was half body immersion (until chest level). This experiment is to investigate the
different between the different part body of immersion where some non-technical researcher
suggested that half body immersion hot bath is beneficial to human.

32
CHAPTER 5
RESULTS AND DISCUSSIONS
5.1 EXPERIMENTAL RESULTS
Case 1
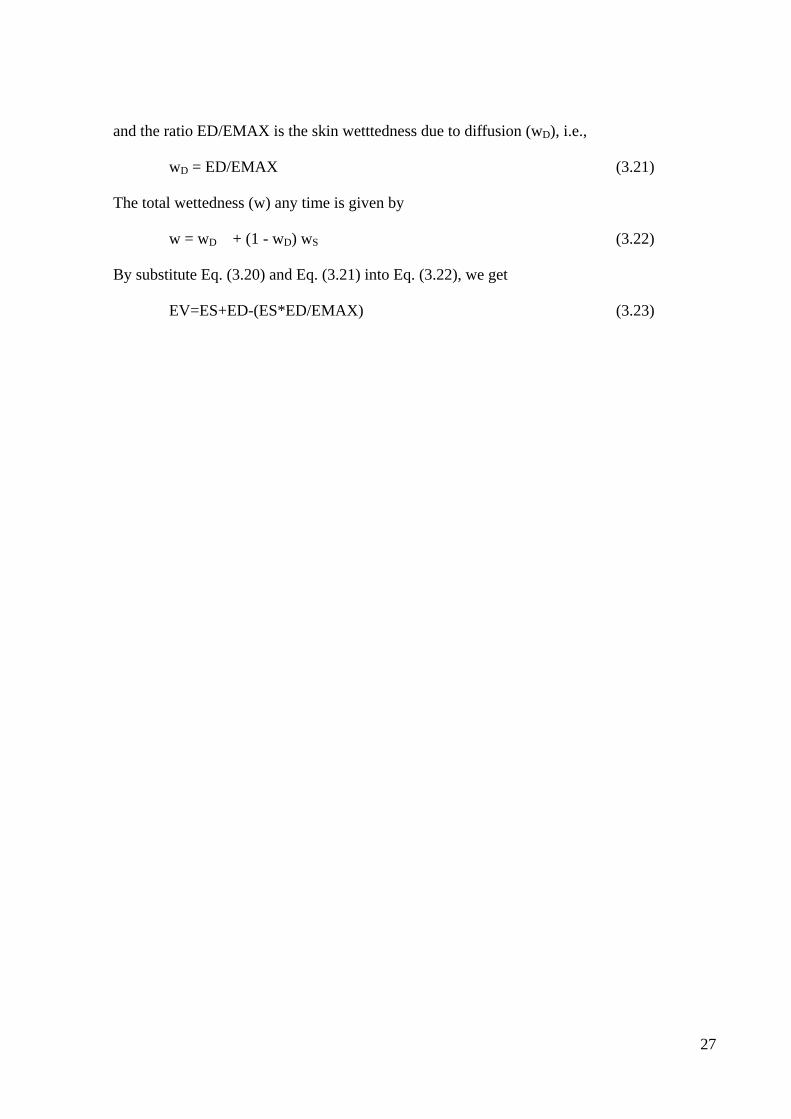
The experimental results of mean skin temperature of four subjects, A, B, C and D were
shown in Figure 5.1. It can be seen that mean skin temperature. Tsk remained stable and
constant (around 32 to 34 °C) during the 10 minutes period prior to water immersion,.
Immediately upon immersion Tsk increased sharply to about 38 °C in 5 minutes time and kept
on increasing slowly until the end of immersion. Immediately the subjects left the water, Tsk
fell sharply to normal mean skin temperature of around 32°C in 5 minutes time and kept on
decreasing slowly until it reached a constant state at the end of recovery phase.
No significant different of Tsk were observed among the four subjects. The minor different
of Tsk in the pre-immersion and recovery phase was due to the different individual particular
(such as weight, height, fat percentage etc) and the slightly different environmental conditions
(Table 4.1) when the experiment was carried out.
The experimental results of oral temperature for the four subjects are indicated in Figure
5.2. As shown in the figure, the oral temperatures, Toral have reached a constant state of
around 35°C to 36°C before the immersion. The head-out immersion only induced small
increase (about 1 to 1.5°C) in oral temperature. After the immersion, the oral temperature
slightly increased in the first 1 to 2 minutes and then decreased slowly and returned to
pre-immersion values within 20 minutes of leaving the water.
Subject B, C and D show very consistent results whereas there was not so good result was
taken from subjects A. The inconstant of experimental data is due to the difficulty of oral
temperature measurement by using thermocouple. This is because the saliva inside the mouth
33
affected the accuracy of temperature measurement.
Mean Skin Temperature
Time (minute)0 5 10 15 20 25 30 35 40 45 50 55
Tem
pera
ture
(Cel
sius
)
28
30
32
34
36
38
40
Subject ASubject BSubject CSubject D
PRE-IMMERSION WATER IMMERSION RECOVERY
Figure 5.1 Experiment Results: Mean Skin Temperature of Different Subjects
Oral Temperature
Time (minute)0 5 10 15 20 25 30 35 40 45 50 55
Tem
pera
ture
(Cel
sius
)
30
32
34
36
38
40
Subject ASubject BSubject CSubject D
PRE-IMMERSION WATER IMMERSION RECOVERY
Figure 5.2 Experiment Results: Oral Temperature of Different Subjects

34
Case 2
Figure 5.3 shows the experimental results of mean skin temperature for different water
temperature conditions (44, 40 and 28°C). For water temperature of 44 and 40 °C, Tsk
increased sharply immediately upon immersion whereas Tsk decreased for water temperature
of 28 °C. In the recovery phase, for higher water temperature of 44 and 40 °C, Tsk fell sharply
to normal mean skin temperature of around 35°C in 5 minutes time and kept on decreasing
slowly until it reached a constant state at the end of recovery phase. On the other hand, for
lower water temperature of 28 °C, Tsk kept on decreasing and only reached stable Tsk at the
end of recovery phase.
The oral temperature profiles are given in Figure 5.4. It is obvious that Toral increased
tremendously from 35.0 °C upon immersion to 39.6 °C at the end of immersion. For water
temperature of 40 °C, even though the data is inconstant (increasing and decreasing) from
time to time, it can be seen clearly that Toral increased in water immersion phase and
decreased after the immersion. The experimental results of Toral for water temperature of
28 °C were rather inconstant, but in generally it fluctuated at the line of oral temperature of
35°C. This indicates that there was no significant change of oral temperature profile for the
immersion of 28°C water temperature condition. The inconstant of experimental data is due to
the same reason as indicated in 5.1 Experiment – Case 1. This also suggests that thermocouple
is not a good device to measure oral temperature.

35
Mean Skin Temperature
Time (minutes)0 5 10 15 20 25 30 35 40 45 50 55
Tem
pera
ture
(Cel
sius
)
28
30
32
34
36
38
40
42
Experiment: T water = 44 CExperiment: T water = 40 CExperiment: T water = 28 C
PRE-IMMERSION WATER IMMERSION RECOVERY
Figure 5.3 Experiment Results: Mean Skin Temperature of Different Water Temperature Conditions
Core Temperature
Time (minnute)
0 5 10 15 20 25 30 35 40 45 50 55
Tem
pera
ture
(Cel
sius
)
34
35
36
37
38
39
40
Experiment : T water = 44 CExperiment : T water = 40 CExperiment : T water = 28 C
RECOVERYWATER IMMERSIONPRE-IMMERSION
Figure 5.4 Experiment Results: Oral Temperature of Different Water Temperature Conditions

36
Case 3
Some non-academic researcher suggested that taking half body (until chest level)
immersion bath can be more relaxing than whole body immersion. In order to see the
physiological response of human in half body immersion, experiments were carried out.
Figure 5.5 are results for mean skin temperature Tsk with different part body of immersion i.e.
either whole body immersion with head out or half body immersion. It can be seen that in
both cases, Tsk has same profile. However, in the water immersion phase, Tsk for head-out
whole body immersion is much higher than half body immersion, which is about 2 °C higher
at the end of immersion. In recovery phase, Tsk for half body immersion recovered to that of
pre-immersion phase much faster than head-out whole body immersion.
The experimental oral profile for the both body part of immersion are given in figure 5.6.
Similarly, the less efficient performance of the measurement by thermocouple caused the
experimental data rather inconstant. However, it still can be seen that Toral fluctuated around
the temperature line of 36°C for half body immersion whereas in head-out whole body
immersion, Toral increase slowly upon immersion and decreased to that temperature of
pre-immersion phase after immersion.
The half body immersion that has much less increasing in Tsk and no increasing in Toral
and faster recovery suggest that half body immersion can be more relaxing bath and can cater
for higher water temperature.

37
Mean Skin Temperature
Time (minute)
0 5 10 15 20 25 30 35 40 45 50 55
Tem
pera
ture
(Cel
sius
)
31
32
33
34
35
36
37
38
39
Experiment : Whole body w/ head outExperiment : Half body
PRE-IMMERSION WATER IMMERSION RECOVERY
Figure 5.5 Experiment Results: Mean Skin Temperature of Different Part of Body Immersion
Oral Temperature
Time (minute)
0 5 10 15 20 25 30 35 40 45 50 55
Tem
pera
ture
(Cel
sius
)
30
31
32
33
34
35
36
37
38
Experiment: Whole body w/ head outExperiment: Half Body
PRE-IMMERSION WATER IMMERSION RECOVERY
Figure 5.6 Experiment Results: Oral Temperature of Different Part of Body Immersion

38
5.2 EXPERIMENTS VS SIMULATIONS
The simulation results are validated with experiment data.
Case 1
The human` temperature simulation in pre-immersion phase is begun with mean skin
temperature Tsk of 34°C and core temperature, Tcore of 37°C. In order to let the simulated
human` temperature get equilibrium with the experiment environment condition, the human is
simulated for 60 minute period before the immersion. Figure 5.7 shows the last 10 minute
simulation result of Tsk in pre-immersion phase and the comparison between simulation and
experiments results. It can be seen that the predicted Tsk matches well with the experimental
results especially in water immersion phase. This suggests that the predicted mean skin
temperatures are practically accurate and useful. However, it is noticed that the predicted Tsk
is slightly higher than experiment results for all subjects in recovery phase. The deviation is
due to small measurement error in experiment. The bandages that were pasted on top the skin
got wet when the subjects immersed into water. The wet bandage would not dry immediately
after the immersion in the recovery phase. As the result, the wet bandage cooled down the
skin surface that consequently decreased the skin temperature. Thus, the measured skin
temperatures were lower then the actual skin temperature.
The “cooling effect” of bandage is given in Figure 5.7, where comparison between
experiments with dry bandage (change wet bandage to dry one immediately after immersion),
and the one with wet bandage. It can be seen that by changing the bandage to dry one, the
mean skin temperature recovered very fast to normal mean skin condition. The sudden drop of
Tsk immediately after the immersion was due to the time that changing the wet bandage to dry
bandage.

39
Mean Skin Temperature
Time (minute)0 5 10 15 20 25 30 35 40 45 50 55
Tem
pera
ture
(Cel
sius
)
28
30
32
34
36
38
40
Subject ASubject BSubject CSubject DSimulation
PRE-IMMERSION WATER IMMERSION RECOVERY
Figure 5.7 Experiments VS Simulation Results: Mean Skin Temperature of Different Subjects
Mean Skin Temperature
Time (minute)
0 5 10 15 20 25 30 35 40 45 50 55
Tem
pera
ture
(Cel
sius
)
31
32
33
34
35
36
37
38
39
Experiment: Change to Dry BandageExperiment: Wet BandageSimulation
PRE-IMMERSION WATER IMMERSION RECOVERY
Estimation
Figure 5.8 Comparison between experiment with dry bandage and wet bandage usage with simulation
result.

40
The comparison of core temperature in simulation and oral temperature in experiment data
are given in Figure 5.9. One important point has to stress that oral temperature is not equal to
core temperature and in fact core temperature is always higher than oral temperature. Oral
temperature is measured during the experiments but not core temperature because no
experiment apparatus is available for measurement without consultancy from medical
specialist. It can be seen from the diagram that the predicted core temperature always higher
than oral temperature and follow the same trend of increasing and decreasing. This suggest
that the predicted core temperature is reasonable accurate.
Oral and CoreTemperature
Time (minute)0 5 10 15 20 25 30 35 40 45 50 55
Tem
pera
ture
(Cel
sius
)
30
32
34
36
38
40
Subject A (Core Temperature)Subject B (Core Temperature)Subject C (Core Temperature)Subject D (Core Temperature)Simulation (Oral Temperature)
PRE-IMMERSION WATER IMMERSION RECOVERY
Figure 5.9 Experiments VS Simulation Results: Oral and Core Temperature of Different Subjects

41
Case 2
In order to test the performance of the model in predicting the results of mean skin
temperature, Tsk and core temperature Tcore, in different water temperature conditions, a
comparisons was made between simulation and experimental data which is given in Figure
5.10. It can be seen that the simulation results follows exactly the trend of experimental
results, i.e. Tsk increased when water temperature increased and Tsk decreased when water
temperature decreased. In addition, only Tsk for the water temperature of 28°C decreased upon
immersion, which is also matched with the experimental result very well. However, it is
noticed that the predict Tsk is slightly higher than experimental data in higher water
temperature (44 and 40 °C) and slightly lower than experimental data in lower water
temperature (28 °C). The deviation is due to the fact that Subject A has different individual
characteristic (such height weight, body fat and etc) with standard man that used in numerical
calculation. In recovery phase, experimental data of Tsk was always lower than the predicted
one and took longer time to recover. The deviation is mainly due to the cooling effect of
bandage, which has been discussed in 5.2 Experiments vs. Simulations – Case 1.
The comparison between simulation and experimental results of oral temperature, Toral are
given in Figure 5.11. Similar observations to that from Figure 5.10 can be obtained, i.e. Toral
profile of simulation result increased when water temperature increased and decreased when
water temperature decreased. However, the performance of experimental results is not so
good and this give rise to difficulty of comparison with simulation results.
The good agreement of simulation and experimental result especially for mean skin
temperature suggests that the model can be applicable to simulate mean skin temperature and
core temperature for different water temperature conditions including cold water.

42
Mean Skin Temperature
Time (minutes)0 5 10 15 20 25 30 35 40 45 50 55
Tem
pera
ture
(Cel
sius
)
26
28
30
32
34
36
38
40
42
44
Experiment: T water = 44 CExperiment: T water = 40 CExperiment: T water = 28 CSimualtion: T water = 44 CSimualtion: T water = 40 CSimualtion: T water = 28 C
WATER IMMERSION RECOVERYPRE-IMMERSION
Figure 5.10 Experiments vs. Simulation Results: Mean Skin Temperature of Different Water Conditions
Oral / Core Temperature
Time (minnute)
0 5 10 15 20 25 30 35 40 45 50 55
Tem
pera
ture
(Cel
sius
)
34
35
36
37
38
39
40
41
Experiment : T water = 44 CExperiment : T water = 40 CExperiment : T water = 28 CSimulation : T water = 40 CSimulation : T water = 44 CSimulation : T water = 28 C
RECOVERYWATER IMMERSIONPRE-IMMERSION
Figure 5.11 Experiments vs. Simulation Results: Oral and Core Temperature of Different Water
Conditions

43
Case 3
Figure 5.12 represents the comparison of Tsk between simulation and experimental results.
The agreement is good despite the predicted Tsk is a little bit higher than experimental data in
immersion phase. This is due to the different individual characteristics (such height weight,
body fat and etc) with standard man that used in numerical calculation. In the recovery phase,
predicted T sk for head-out whole body immersion is always slightly higher than experimental
data. The discrepancy was due to the same reason, i.e. cooling effect of bandage, which has
been discussed in 5.2 Experiments vs. Simulations – Case 1.
The comparison between predicted Tcore and Toral in experimental data are given in Figure
5.13. As indicated in the diagram, both predicted Tcore and experimental Toral have same
profile, i.e. a small increasing (about 1°C) in water immersion phase for head-out whole body
immersion whereas no increment of temperature was found in half body immersion phase.
The constant results in the comparison between simulation and experimental data suggest
that the model can also be used to predict half body immersion.
Mean Skin Temperature
Time (minute)
0 5 10 15 20 25 30 35 40 45 50 55
Tem
pera
ture
(Cel
sius
)
30
32
34
36
38
40
Experiment : Whole body w/ head outExperiment : Half bodySimulation: Whole body w/ head outSimulation: Half Body
PRE-IMMERSION WATER IMMERSION RECOVERY
Figure 5.12 Simulation vs. Experimental Results: Mean Skin Temperature of Different Part of Body
Immersion

44
Core/ Oral Temperature
Time (minute)
0 5 10 15 20 25 30 35 40 45 50 55
Tem
pera
ture
(Cel
sius
)
30
31
32
33
34
35
36
37
38
39
Experiment: Whole body w/ head outExperiment: Half BodySimulation: Whole body w/ head outSimulation: Half body
PRE-IMMERSION WATER IMMERSION RECOVERY
Figure 5.13 Simulation vs. Experimental Results: Oral Temperature of Different Part of Body Immersion

45
5.3 SIMULATIONS
This model is not only able to predict core and skin temperature but also other human
physiology response in water immersion such as metabolism rate, evaporative heat loss and
how the heat flow into and out of the body. Examples of the simulation results of these
parameters are given in the following diagram. They are the predicted thermal response for
whole body immersion with head out in water temperature of 40°C. They are similar
environmental and phases conditions with the previous experiments in section 5.1
Experiments.
Figure 5.14 shows the predicted metabolic rate for the above mentioned conditions. As
shown, the metabolism rate is about constant at the around 46 W, which is the resting
metabolic rate for normal people. Immediately upon immersion, metabolic rate is raising
linearly to maximum at the end of immersion. After the immersion, metabolic rate is
decreasing and takes about 15 minutes to reach the resting metabolic
rate.
M E T A B O L IS M R A T E
T IM E (M IN U T E )
0 5 1 0 1 5 2 0 2 5 3 0 3 5 4 0 4 5 5 0 5 5 6 0
MET
ABO
LLIS
M R
ATE
(WAT
T)
4 4
4 6
4 8
5 0
5 2
5 4
5 6
5 8
P R E -IM M E R S IO N W A T E R IM M E R S IO N R E C O V E R Y
Figure 5.14 Simulation result: Metabolic Rate for Water Immersion at 40°C Temperature.

46
The simulation results of evaporative heat loss, EV are given in Figure 5.15. It is noticed
that at the resting conditions of pre-immersion phase, human is predicted to loss heat to
environment mainly through skin diffusion and latent respiration at the rate below 20 W.
Upon immersion, EV slightly decrease because evaporative heat loss through skin no longer
occurred in water immersion except in small potion of face skin. In this phase, the evaporative
heat loss is mainly through latent respiration and it is increasing slowly. This is because the
body try to loss heat to environment that against the heat transfer from higher water
temperature into body. Once the subject leave water, EV increases sharply to about 170 W
mainly from sweating through skin all over the body. It can be then prove that sweating is the
important means for human loss heat to environment. EV is decreasing slowly when the
subject continuous transfer heat to environment and recover to normal conditions after 15
minutes when core and skin temperature recover to optimum conditions.
EVAPORATIVE HEAT LOSS
Time (minute)
0 5 10 15 20 25 30 35 40 45 50 55 60
Evap
orat
ive
Hea
t Los
s (W
att)
0
20
40
60
80
100
120
140
160
180
PRE-IMMERSION WATER IMMERSION RECOVERY
Figure 5.15 Simulation result: evaporative Heat Loss for Water Immersion at 40°C Temperature.

47
Figure 5.16 represents the simulation results of how heat flow into or out of body in term
of body storage of heat. Positive value means that heat is flow from the outside environment
into body and on the other hand, negative values represent the heat flow from body to outside
environment. It can be noticed that, in the resting conditions in pre-immersion phase, the
value of storage of heat is slightly below zero, which indicates that the slightly losing heat to
environment in that environment conditions. However, immediately upon immersion, the
storage heat of the body has very high value of higher than 400 W, this is due to the sudden
heat transfer into the body from the 40 °C warm water. During the immersion phase, it is
noticed that even though it has a positive value but it is decreasing. This suggests that, the
thermoregulation has activated some mechanism such as vasodilatation and evaporation heat
loss through latent respiration to against the increased body and skin temperature. At recovery
phase, the subject immediately has a storage of heat of the value of about –200 W. This
indicates that the body loss a lot of heat to environment, main through sweating immediately
after leaving water. This losses of heat to environment become decreasing as shown in
diagram, the value tend to become less negative, and it takes about 15 minute to reach the
optimum conditions as it was in pre-water immersion phase.

48
STORAGE OF HEAT
Time (minute)
0 5 10 15 20 25 30 35 40 45 50 55 60
Stor
age
of H
eat (
wat
t)
-400
-200
0
200
400
600
PRE-IMMERSION WATER IMMERSION RECOVERY
Figure 5.16 Simulation result: Body Heat Storage for Water Immersion at 40°C Temperature.
49
CHAPTER 6
CONCLUSION
A 29-node human thermoregulation model in water immersion has been developed to
simulate the human thermal response such as skin and core temperature, metabolic rate,
evaporative heat loss and etc. Meanwhile, the model can predict the mentioned thermal
response with different water temperature and part of body immersion. Experimental data of
oral and mean skin temperature are used for the validation of the model. The experiments
were done in three cases so that validated with simulation result in different criteria. It is
noticed that in most cases the simulation results are consistent with experimental data. This
concludes that the model can be useful in the simulation of human thermal reaction in water
immersion.

50
APPENDIX

51
APPENDIX A – TABLES
Table 1: Surface Area, Weight and Heat Capacity of the Four Compartment in each Segment.
Segment SA Wt CO RE MUSCLE FAT SK IN
m2 kg Wt,kg QC,Wh/°C Wt,kg QC,Wh/°C Wt,kg QC,Wh/°C Wt,kg QC,Wh/°C
HEAD 0.1326 4.02 3.01 2.57 0.37 0.39 0.37 0.26 0.27 0.28
THORAX 0.3402 19.25 6.09 5.72 8.95 9.4 3.54 2.47 0.68 0.71
ABDOMEN 0.3402 19.25 6.09 5.72 8.95 9.4 3.53 2.47 0.67 0.70
ARMS 0.2536 7.06 2.25 1.63 3.37 3.54 0.97 0.67 0.48 0.50
HANDS 0.0946 0.67 0.26 0.16 0.07 0.07 0.15 0.10 0.19 0.20
LEGS 0.5966 20.68 6.94 4.94 10.19 10.67 2.38 1.66 1.20 1.25
FEET 0.1299 0.97 0.43 0.27 0.07 0.07 0.22 0.15 0.24 0.26
CB 2.5 2.5 2.6
TOTAL 1.8877 74.4 27.574 23.61 31.97 33.54 11.16 7.79 3.73 3.90
*CB = central blood

52
Table 2: Thermal Conductance between Compartments, Basal Metabolic Heat Production and Basal Blood Flow for Each Compartment.
SEGMENT COMPAERMENT TK(N) MB(N) BFB(N)
(I) (N) W/°C W l/hr
HEAD core 1.61 14.95 45
1 muscle 13.25 0.12 0.12
fat 16.1 0.13 0.13
skin 0 0.1 1.44
THORAX core 0.8 26.31 105
2 muscle 2.77 2.9 3
fat 11.54 1.24 1.28
skin 0 0.23 1.05
ABDOMEN core 0.8 26.31 105
3 muscle 2.77 2.9 3
fat 11.54 1.24 1.28
skin 0 0.23 1.05
ARMS core 1.4 0.82 0.84
4 muscle 10.3 1.11 1.14
fat 30.5 0.21 0.2
skin 0 0.15 0.5
HANDS core 6.4 0.09 0.1
5 muscle 11.2 0.23 0.24
fat 11.5 0.04 0.04
skin 0 0.06 2
LEGS core 10.5 2.59 2.69
6 muscle 14.4 3.32 3.43
fat 74.5 0.5 0.52
skin 0 0.37 2.85
FEET core 16.3 0.15 0.16
7 muscle 20.6 0.02 0.02
fat 16.4 0.05 0.05
skin 0 0.08 3
TOTAL 86.45 285.13

53
Table 3: Values of Heat Transfer Coefficient for Each Segment
Table 4: Estimation of Distribution of Skin Receptors, Sweating, Vasodilatation and Vasoconstriction Command over the different Skin Areas.
Table 5: Estimates of Distribution of Heat Production in Muscle Compartment.
SEGMENT HR HCW/M2.C W/M2.C
HEAD 4.8 3.0THORAX 4.8 2.1ABDOMEN 4.8 2.1ARMS 4.2 2.1HANDS 3.6 4.0LEGS 4.2 2.1FEET 4.0 4.0
SEGMENT SKINR SKINS SKINV SKINC(I) (I) (I) (I)
HEAD 0.21 0.081 0.132 0.01
THORAX 0.21 0.24 0.161 0.025ABDOMEN 0.21 0.24 0.161 0.025ARMS 0.1 0.154 0.095 0.19HANDS 0.04 0.031 0.121 0.2LEGS 0.2 0.219 0.23 0.2FEET 0.03 0.035 0.1 0.35
SEGMENT WORKM CHILLM(I) (I)
HEAD 0 0.02THORAX 0.15 0.43ABDOMEN 0.15 0.43ARMS 0.08 0.05HANDS 0.01 0LEGS 0.6 0.07FEET 0.01 0

54
Table 6: Temperature Set Point for initial condition.
SEGMENT N COMPARTMENT TSETC
HEAD 1 core 36.961 2 muscle 35.07
3 fat 34.814 skin 34.58
THORAX 5 core 36.892 6 muscle 36.28
7 fat 34.538 skin 33.62
ABDOMEN 9 core 36.893 10 muscle 36.28
11 fat 34.5312 skin 33.62
ARMS 13 core 35.534 14 muscle 34.12
15 fat 33.5916 skin 33.25
HANDS 17 core 35.415 18 muscle 35.38
19 fat 35.320 skin 35.22
LEGS 21 core 35.816 22 muscle 35.3
23 fat 35.3124 skin 34.1
FEET 25 core 35.147 26 muscle 35.03
27 fat 35.1128 skin 35.04
CENTRAL BLOOD 29 36.71

55
APPENDIX B
Programming 1: Simulation of Physiology Reaction in water immersion
Figure B.1 indicates step by step how the simulation of body temperature regulation in air and
water environment is written by programming in FORTRAN .
InputCHOISE
Read Constant:CONTROLLED
SYSTEM
Read Constant:
CONTROLER
ReadINITIAL
CONDITIONSRead
EXPERIMANTAL CONDITIONS
Determine“SIGNAL”OUTPUT
EstablishTHERMO-
REGULATION
CalculateM, EV & BCV
SUBROUTINE“EVAPORATION”
CalculateHEAT FLOW
DetermineINTEGRATION
STEP
CalculateNEW
TEMPEARTURE
OUTPUT<
LIMIT?
EstablishOUTPUT
ITIME<
SET TIME
?
END
1
2
3 4
5
8
6
7
11
109
12
Figure B1 Flow Chart of Programming Steps
The first step is to select if the programming simulates water immersion with only head
out or half body immersion. If (CHOICE=1) then simulation will do for water immersion with

56
only head out whereas (CHOICE=2) for half body immersion.
The second section reads the constants as defined in the tables in Appendix A (Table 1,2
&3). The values of PV are taken from the Steam table and consist of the saturated water vapor
pressure at 5°C intervals from 5°C to 50°C. As the same way, the third phase read the
constants for controlling system as defined in the Table 4,5, & 6 (Appendix A). Table 6 shows
the temperature set point, TSET, the value of steady-state equilibrium temperature which have
reached the following conditions: air temperature 29.45°C, air velocity 0.1 m/s and relative
humidity of 0.3.
The fourth step read the initial conditions for all compartment and set all elapsed time
(TIME & ITIME) and rate of change of temperature in N to zero. The initial values for
temperature of all compartments are set to those values of TSET.
The fifth step read the experimental conditions according to its environmental conditions.
A loop is established here to run the program for 3 phases: 1. air environment, 2. water
environment and 3. air environment again. The environmental conditions for air environment
are air temperature (°C), air velocity (m/s), relative humidity (%), work rate (W) and intervals
between output (INT). The value from work rate will be then used to calculate the total extra
heat production in the working muscle by subtracting it from basal metabolic rate. Thus,
WORK represents the total extra heat production in the working muscle. Next is to determine
H(I), the total environmental heat transfer coefficient according to its environment:
(MEDIA=100) for air environment and other for water environment. In water environment is
further divided into water immersion with head out and half body immersion. Lastly, PAIR is
calculated from the interpolation of PV according to the air temperature in experimental
conditions.
In the sixth step, the output of “SIGNAL” will be determined by comparing the actual
instantaneous temperature in all compartments with the set point temperature.

57
In the following step (seventh step), the thermoregulation of SWEAT, DILAT, CHILL and
STRIC will be determined. Since the “SIGNAL” can be negative as well as positive, thus, the
negative result of SWEAT, DILAT, CHILL and STRIC will then be set to zero.
In section 8, metabolic heat production, evaporative heat loss and blood flow fro each
compartment in each section are calculated. Evaporative heat loss through skin will be
different accordingly to the environmental media i.e. either air or water. Since evaporative
heat loss through skin can not occur inside water immersion, only part of body which is
expose to air environment will be considered for this heat loss. Evaporative heat loss is
calculated in SUBROUINE “EVAPORATION”. In this subroutine, the water vapor pressure,
PS and heat of vaporization of water, HFGSKIN at the skin surface temperature is read and
interpolated from the steam table. If the computed evaporative heat loss, EVA is higher than
maximum evaporative heat loss, EMAX, then EVA is set equal to EMAX.
Section 9 calculates the heat flow rate into or out of each of the compartments. Before that,
BCV, the convective heat transfer between central blood and compartments. and TD, the
conductive heat flow rate from each layer compartment to the next one are calculated. After
this, all the heat flow rate component (M, EV, BCV & TD) are summed up for each
compartment. In skin compartment where heat flow into or out from the surrounding
environment, HF(N+3) is dependent on the environment media (air or water). Again, in the
water environment, HF(N+3) is calculated differently for whole body immersion with head
out and half body immersion. In water immersion, the evaporative heat loss through skin, E
does not exist and the conductive heat transfer between skin layer and water (TW) instead of
between skin layer and air (TAIR) in air environment.
In section 10 the optimum integration time step is determined. The initial value for the
time increment is set to 1 min (0.01667 hr). Based on this increment, the temperature steps in
each compartment are calculated, if any exceed 0.1°C, the time increment step, DT is reduced

58
so that the maximum temperature change in any compartment is kept to 0.1 °C or less.
In section 11, new temperature is calculated based on the rate of change of temperature, F
and time increment, DT. This is follow by testing if the clock exist the set interval between
output, INT, If it is not exist, then the program return to the section “Determine SIGNAL
output”, otherwise the program proceeds to the section 12, “ESTABLISH OUTPUT”.
In section 12, output such as total metabolic rate HP, and evaporative heat loss EVA is
obtained by summing that of all compartments. Mean skin temperature, TS is calculated by
summing of segmental skin temperatures. Net rate of heat storage, HFLOW for the whole
body is obtained by summing all the heat flow over all compartments. HP, EVA, and HFLOW
are reduced to W/m2 by dividing them by the total body surface area SA. The calculation will
then continue until ITIME is over the “SET TIME” in the section of “READ
ENVIRONMENT CONDITIONS”.

59
PROGRAM TEMPERATURE
REAL,DIMENSION (29) :: T,TSET,RATE,QC,F,WARM,COLD,QF,SIGNAL REAL,DIMENSION (28) :: MB,BFB,TK,M,EV,BF,BCV,TD REAL,DIMENSION (10) :: PV REAL,DIMENSION(7) :: S,SKINR,SKIND,SKINC,WORKM,CHILM,HRD,HCV,H
! Constant for controller
REAL,PARAMETER::CSW=372.,SSW=33.7,PSW=0.,CDIL=136.,SDIL=17.,PDIL=0. REAL,PARAMETER::CCON=10.8,SCON=10.8,PCON=0.0,CCHIL=13.,SCHIL=0.4,PCHIL=1.0
REAL,PARAMETER :: HW=105.0 ! by Rapp(1971) REAL :: LTIME INTEGER :: MEDIA,CHOICE
! INPUT CHOISE: WHOLE OR HALF BODY IMMERSION
PRINT*, "Enter 1 or 2 for the following choice" PRINT*, "1. Water immersion with head out" PRINT*, "2. Half Body water immersion" READ(*,*) CHOICE
! READ CONSTANT FOR CONTROLLED SYSTEM
OPEN (2,FILE='QC.DAT',STATUS='OLD') READ(2,'(1X,4F12.2)') QC CLOSE(2) OPEN (2,FILE='MB.DAT',STATUS='OLD') READ(2,'(1X,4F12.2)') MB CLOSE(2) OPEN (2,FILE='BFB.DAT',STATUS='OLD') READ(2,'(1X,4F12.2)') BFB CLOSE(2)
OPEN (2,FILE='TK.DAT',STATUS='OLD')

60
READ(2,'(1X,4F12.2)') TK CLOSE(2) OPEN (2,FILE='S.DAT',STATUS='OLD') READ(2,'(1X,1F12.4)') S CLOSE(2) OPEN (2,FILE='HRD.DAT',STATUS='OLD') READ(2,'(1X,1F12.1)') HRD CLOSE(2) OPEN (2,FILE='HCV.DAT',STATUS='OLD') READ(2,'(1X,1F12.1)') HCV CLOSE(2) OPEN (2,FILE='PV.DAT',STATUS='OLD') READ(2,'(1X,1F12.2)') PV CLOSE(2) SA=0. DO I=1,7 SA=SA+S(I) END DO READ CONSTANT FOR THE CONTROLLER OPEN (2,FILE='TSET.DAT',STATUS='OLD') READ(2,'(1X,4F12.2)') TSET CLOSE(2) OPEN (2,FILE='RATE.DAT',STATUS='OLD') READ(2,'(1X,4F12.2)') RATE CLOSE(2)
OPEN (2,FILE='SKINR.DAT',STATUS='OLD') READ(2,'(1X,1F12.3)') SKINR CLOSE(2)

61
OPEN (2,FILE='SKIND.DAT',STATUS='OLD') READ(2,'(1X,1F12.3)') SKIND CLOSE(2) OPEN (2,FILE='SKINC.DAT',STATUS='OLD') READ(2,'(1X,1F12.3)') SKINC CLOSE(2) OPEN (2,FILE='WORKM.DAT',STATUS='OLD') READ(2,'(1X,1F12.3)') WORKM CLOSE(2) OPEN (2,FILE='CHILM.DAT',STATUS='OLD') READ(2,'(1X,1F12.3)') CHILM CLOSE(2)
! READ INITIAL CONDITIONS OPEN (1,FILE='RESULT.TXT',STATUS='OLD') WRITE(1,'(1X,"TIME SH M EV TS TR")') OPEN (2,FILE='T.DAT',STATUS='OLD') READ(2,'(1X,4F12.2)') T CLOSE(2) TIME=0. ITIME=0 DO N=1,29 F(N)=0. END DO
! READ EXPERIMENT CONDITIONS 10 IF (ITIME<11) THEN
MEDIA=100 ! For Air Environment OPEN (2,FILE='EXPERIMENT1.DAT',STATUS='OLD')

62
READ(2,'(1X,4F12.2,I4)') TAIR,V,RH,WORK,INT CLOSE(2) ELSEIF (ITIME<26) THEN MEDIA=200 ! For Water Environment OPEN (2,FILE='EXPERIMENT2.DAT',STATUS='OLD') READ(2,'(1X,5F12.2,I4)') TAIR,V,RH,TW,WORK,INT CLOSE(2) ELSEIF (ITIME<56) THEN MEDIA=100 OPEN (2,FILE='EXPERIMENT3.DAT',STATUS='OLD') READ(2,'(1X,4F12.2,I4)') TAIR,V,RH,WORK,INT CLOSE(2) ELSE STOP ENDIF IF (WORK-86.5<0) THEN WORK=0. ELSE WORK=(WORK-86.5)*0.78 ENDIF IF (MEDIA==100) THEN DO I=1,7 H(I)=(HRD(I)+3.16*HCV(I)*V**0.5)*S(I) END DO ELSE PART0 : SELECT CASE (CHOICE) CASE (1) ! water immersion wtih head out H(1)=(HRD(1)+3.16*HCV(1)*V**0.5)*S(1) DO I=2,7 H(I)=HW*S(I) END DO CASE (2) ! half body water immersion DO I=1,2 H(I)=(HRD(I)+3.16*HCV(I)*V**0.5)*S(I) END DO
63
DO I=4,5 H(I)=(HRD(I)+3.16*HCV(I)*V**0.5)*S(I) END DO H(3)=HW*S(3) DO I=6,7 H(I)=HW*S(I) ENDDO END SELECT PART0 ENDIF I=TAIR/5 PAIR=RH*(PV(I)+(PV(I+1)-PV(I))*(TAIR-5*I)/5.)
! DETERMINE "SIGNAL" OUTPUT
100 DO N=1,29 WARM(N)=0. COLD(N)=0. SIGNAL(N)=T(N)-TSET(N)+RATE(N)*F(N) IF (SIGNAL(N)<0) THEN COLD(N)=-SIGNAL(N) ELSE WARM(N)=SIGNAL(N) ENDIF END DO
! ESTABLISH THERMOREGULATION WARMS=0. COLDS=0. DO I=1,7 K=4*I WARMS=WARMS+WARM(K)*SKINR(I) COLDS=COLDS+COLD(K)*SKINR(I) END DO

64
SWEAT=CSW*SIGNAL(1)+SSW*(WARMS-COLDS)+PSW*WARM(1)*WARMS DILAT=CDIL*SIGNAL(1)+SDIL*(WARMS-COLDS)+PDIL*WARM(1)*WARMS CHILL=(CCHIL*SIGNAL(1)+SCHIL*(COLDS-WARMS))+PCHIL*(WARMS-COLDS) STRIC=-CCON*SIGNAL(1)-SCON*(WARMS-COLDS)+PCON*COLD(1)*COLDS IF (SWEAT<0) THEN SWEAT=0. END IF IF (DILAT<0) THEN DILAT=0. END IF IF (STRIC<0) THEN STRIC=0. END IF IF (CHILL<0) THEN CHILL=0. END IF
! CALCULATE M,EV AND BF DO I=1,7 N=4*I-3 M(N)=MB(N) EV(N)=0. EV(5)=(86.4+WORK)*0.0026749*(44.-PAIR) BF(N)=BFB(N) M(N+1)=MB(N+1)+WORKM(I)*WORK+CHILM(I)*CHILL EV(N+1)=0. BF(N+1)=BFB(N+1)+M(N+1)-MB(N+1) M(N+2)=MB(N+2) EV(N+2)=0. BF(N+2)=BFB(N+2) M(N+3)=MB(N+3) BF(N+3)=(BFB(N+3)+SKIND(I)*DILAT)/(1.+SKINC(I)*STRIC)

65
END DO IF (MEDIA==100) THEN DO I=1,7 N=4*I-3
CALL EVAPORATION (I,T(N+3),PAIR,H(I),SWEAT,TSET(N+3),EV(N+3)) END DO ELSE PART1: SELECT CASE (CHOICE) CASE (1) ! water immersion wtih head out I=1 N=4*I-3 CALL EVAPORATION (I,T(N+3),PAIR,H(I),SWEAT,TSET(N+3),EV(N+3))
DO I=2,7 EV(4*I)=0. END DO CASE (2) ! half body water immersion DO I=1,2
N=4*I-3 CALL EVAPORATION (I,T(N+3),PAIR,H(I),SWEAT,TSET(N+3),EV(N+3))
END DO DO I=4,5 N=4*I-3 CALL EVAPORATION(I,T(N+3),PAIR,H(I),SWEAT,TSET(N+3),EV(N+3))
END DO EV(3)=0. DO I=6,7 EV(4*I)=0. ENDDO END SELECT PART1 ENDIF
! CALCULATE HEAT FLOWS
DO K=1,28 BCV(K)=BF(K)*(T(K)-T(29)) TD(K)=TK(K)*(T(K)-T(K+1))

66
END DO DO I=1,7 K=4*I-3 QF(K)=M(K)-EV(K)-BCV(K)-TD(K) QF(K+1)=M(K+1)-BCV(K+1)+TD(K)-TD(K+1) QF(K+2)=M(K+2)-BCV(K+2)+TD(K+1)-TD(K+2) ENDDO IF (MEDIA==100) THEN DO I=1,7
K=4*I-3 QF(K+3)=M(K+3)-BCV(K+3)-EV(K+3)+TD(K+2)-H(I)*(T(K+3)-TAIR)
END DO ELSE PART2 : SELECT CASE (CHOICE)
CASE (1) ! water immersion wtih head out QF(4)=M(4)-BCV(4)-EV(4)+TD(3)-H(1)*(T(4)-TAIR)
DO I=2,7 K=4*I-3
QF(K+3)=M(K+3)-BCV(K+3)+TD(K+2)-H(I)*(T(K+3)-TW) ENDDO
CASE (2) ! half body immersion DO I=1,2 K=4*I-3 QF(K+3)=M(K+3)-BCV(K+3)-EV(K+3)+TD(K+2)-H(I)*(T(K+3)-TAIR) END DO DO I=4,5
K=4*I-3 QF(K+3)=M(K+3)-BCV(K+3)-EV(K+3)+TD(K+2)-H(I)*(T(K+3)-TAIR)
END DO QF(12)=M(12)-BCV(12)+TD(11)-H(3)*(T(12)-TW)
DO I=6,7 K=4*I-3
QF(K+3)=M(K+3)-BCV(K+3)+TD(K+2)-H(I)*(T(K+3)-TW) ENDDO
END SELECT PART2

67
ENDIF QF(29)=0. DO K=1,28 QF(29)=QF(29)+BCV(K) END DO QF(29)=QF(29)-0.08*WORK
! DETERMINE OPTIMUM INTEGRATION STEP DT=0.016666667 DO K=1,29 F(K)=QF(K)/QC(K) U=ABS(F(K)) IF (U*DT-0.1>0) THEN DT=0.1/U END IF END DO
! CALCULATE NEW TEMPERATURE OPEN (3,FILE='TEMP.TXT',STATUS='OLD') DO K=1,29 T(K)=T(K)+F(K)*DT END DO CLOSE(3) TIME=TIME+DT LTIME=60.*TIME IF (LTIME-INT-ITIME<0) THEN GOTO 100 ENDIF
! ESTABLISH OUTPUT

68
ITIME=ITIME+INT HP=0. EVA=0. TS=0. HFLOW=0. DO N=1,28 HP=HP+M(N) EVA=EVA+EV(N) ENDDO EVA=EVA+0.08*WORK DO I=1,7 TS=TS+T(4*I)*QC(4*I)/3.90 ENDDO DO N=1,29 HFLOW=HFLOW+QF(N) ENDDO EVA=EVA/SA HP=HP/SA HFLOW=HFLOW/SA WRITE(1,'(1X,I4,5F8.2)')ITIME,HFLOW,HP,EVA,TS,T(5) GOTO 10 CLOSE(1) END PROGRAM TEMPERATURE

69
SUBROUTINE EVAPORATION (J,TSKIN,PRAIR,HEVN,SW,TEMSET,EVAP) REAL,DIMENSION (10) :: PV,HFG REAL,DIMENSION (7) :: HRD,S,SKINS OPEN (2,FILE='PV.DAT',STATUS='OLD') READ(2,'(1X,1F12.2)') PV CLOSE(2) OPEN (2,FILE='HRD.DAT',STATUS='OLD') READ(2,'(1X,1F12.1)') HRD CLOSE(2) OPEN (2,FILE='S.DAT',STATUS='OLD') READ(2,'(1X,1F12.4)') S CLOSE(2) OPEN (2,FILE='SKINS.DAT',STATUS='OLD') READ(2,'(1X,1F12.3)') SKINS CLOSE(2) OPEN (2,FILE='HFG.DAT',STATUS='OLD') READ(2,'(1X,4F12.2)') HFG CLOSE(2) K=TSKIN/5 PS=PV(K)+(PV(K+1)-PV(K))*((TSKIN-5*K)/5.) EMAX=(PS-PRAIR)*2.14*(HEVN-HRD(J)*S(J)) ES=SKINS(J)*SW*2.**((TSKIN-TEMSET)/4.) HFGSKIN=HFG(K)+(HFG(K+1)-HFG(K))*(TSKIN-5*K)/5. ED=(PS-PRAIR)*HFGSKIN*S(J)*(1.6944*10.**(-4.)) EVAP=ES+ED-(ES*ED/EMAX) IF(EVAP>EMAX) THEN EVAP=EMAX END IF END SUBROUTINE EVAPORATION

70
Programming 2: Conversion Volt to Celsius PROGRAM TERMOCOUPLE ! This is a programming to convert volt from digital recoerder to temperature in calsius PARAMETER(K=3660) INTEGER, DIMENSION (1,K) :: H REAL, DIMENSION (7,K) :: G INTEGER, DIMENSION (7,K) :: E REAL, DIMENSION (7,K) :: S OPEN(1,FILE="VOLTAN.DAT",STATUS="OLD") ! This is data from digital recoerder OPEN(2,FILE="TEMVSVOL.DAT",STATUS="OLD") ! The converted temperature will wirte in this file DO M=1,K,1 READ(1,"(I4,2X,F7.5,2X,F7.5,2X,F7.5,2X,F7.5,2X,F7.5,2X,F7.5,2X,F7.5)")H(1,M),G(1,M),G(2,M),G(3,M),G(4,M),G(5,M),G(6,M),G(7,M) ENDDO ! The thermocouple offset and multiple 1000 for conversion in amplifier N=1 DO M=1,K,1 E(N,M)=(G(N,M)-0.0302)*1000 ENDDO N=2 DO M=1,K,1 E(N,M)=(G(N,M)+0.0233)*1000 ENDDO N=3 DO M=1,K,1 E(N,M)=(G(N,M)+0.0037)*1000 ENDDO N=4 DO M=1,K,1 E(N,M)=(G(N,M)-0.0018)*1000
71
ENDDO N=5 DO M=1,K,1 E(N,M)=(G(N,M)-0.0002)*1000 ENDDO N=6 DO M=1,K,1 E(N,M)=(G(N,M)-0.0025)*1000 ENDDO N=7 DO M=1,K,1 E(N,M)=(G(N,M)+0.0078)*1000 ENDDO DO N=1,7,1 DO M=1,K,1 t1=0. t2=50. t3=(t1+t2)/2. 100 F1=F(t1) F2=F(t2) F3=F(t3) IF ((F2-F3) ==(F3-F1)) THEN TEMPERATURE: SELECT CASE (N) CASE (1) S(1,M)=t1 CASE (2) S(2,M)=t1 CASE (3) S(3,M)=t1 CASE (4) S(4,M)=t1 CASE (5)

72
S(5,M)=t1 CASE (6) S(6,M)=t1 CASE (7) S(7,M)=t1 END SELECT TEMPERATURE ELSEIF ((F2-E(N,M))<(E(N,M)-F1)) THEN t1=t3 t2=t2 t3=(t1+t2)/2. GOTO 100 ELSE t1=t1 t2=t3 t3=(t1+t2)/2. GOTO 100 ENDIF ENDDO ENDDO DO M=1,K,60 TS=0.07*S(1,M)+0.175*S(2,M)+0.175*S(3,M)+0.14*S(4,M)+0.05*S(5,M)+0.39*S(6,M)
WRITE(2,"(2F8.1)") S(7,M),TS ! S(7,M) is the core temperature and TS is mean skin temperature. ENDDO ClOSE(1) CLOSE(2) END PROGRAM TERMOCOUPLE

73
REAL FUNCTION F(t) ! This function calculate the formula for Copper-Thermocouple REAL,PARAMETER::b0=-1.8533063273*10.,b1=3.8918344612*10.,b2=1.6645154356*10.**-2
REAL,PARAMETER::b3=-7.8702374448*10.**-5,b4=2.2835785557*10.**-7, b5=-3.5700231258*10.**-10
REAL,PARAMETER::b6=2.9932909136*10.**-13,b7=-1.2849848798*10.**-16, b8=2.2239974336*10.**-20
F=(b0*t**0)+(b1*t**1)+(b2*t**2)+(b3*t**3)+(b4*t**4)+(b5*t**5)+(b6*t**6)+(b7*t**7)+(b8*t**8)+125.*EXP((-1./2.)*(((t-127.)/65.)**2)) END FUNCTION F

74
REFERENCE
[1] Nadel, E. R., W. Bullard, & J.A.J.Stolwijk, “Control of Body Temperature”, Handbook of
Physiology, Section 9, pp.45-68, 1977.
[2] A. Pharo Gagge & Yasunobu Nishi, “Heat exchange between human skin surface and
thermal environment” Handbook of Physiology, section 9, pp.69-92, 1977.
[3] Avraham Shitzer & Robert C. Eberhart, “Heat Generation, Storage, and Transport
Processes”, Heat Transfer in Medicine and Biology 1, pp.137-151, 1985.
[4] Wisser EH. “Mathematical Simulation of Human Thermal Behavior Using Whole Body
Model.”, Heat Transfer in Medicine and Biology 1, pp.325-373, 1985.
[5] Y. Nishi, “Measurement of Thermal Balance of Man”, Bioengineering, Thermal
Physiology and Comfort, pp.29-39, 1981.
[6] I. Holmer & U. Bergh, “Thermal Physiology of Man on the Aquatic Environment”,
Bioengineering, Thermal Physiology and Comfort, pp.145-168, 1981.
[7] Houdas Y. “Modeling of Heat Transfer in Man”, Bioengineering, Thermal Physiology and
Comfort, pp.111-120, 1981.
[8] Fanger P. O., “Conditions for Thermal Comfort.” Thermal Comfort, pp.19-66, 1970

75
以上
1-75ページ 完
修士 論文
平成 14年 2月 15日 提出
学生証番号:06831 氏名:連 宗旺 (LEAN CHONG HWANG)