Embed Size (px)
Citation preview
NATURE CHEMISTRY | www.nature.com/naturechemistry 1
SUPPLEMENTARY INFORMATIONDOI: 10.1038/NCHEM.2315
S1
Supplementary Information
Ultrahigh-throughput exfoliation of graphite into pristine ‘single-layer’ graphene using microwaves and molecularly engineered ionic liquids
Michio Matsumoto1, Yusuke Saito1, Chiyoung Park1,
Takanori Fukushima2 and Takuzo Aida1,3*
* To whom correspondence should be addressed.
[email protected] (T.A.)
Table of Contents
1. General ........................................................................................................................ S2 2. Synthesis and Characterization ................................................................................. S3 (Supplementary Figs. 1–14, Supplementary Table 1) 3. Effects of Microwaves .............................................................................................. S14 (Supplementary Figs. 15–17) 4. Characterization of Graphene Sheets ..................................................................... S17 (Supplementary Figs. 18–23) 5. Intercalation of HF into Graphite ........................................................................... S23 (Supplementary Fig. 24) 6. Redispersion of Graphene Sheets in IL2PF6 .......................................................... S24 (Supplementary Figs. 25 and 26) 7. Supplementary References ...................................................................................... S25
Ultrahigh-throughput exfoliation of graphite into pristine ‘single-layer’ graphene using microwaves and molecularly engineered ionic liquids
© 2015 Macmillan Publishers Limited. All rights reserved
NATURE CHEMISTRY | www.nature.com/naturechemistry 2
SUPPLEMENTARY INFORMATIONDOI: 10.1038/NCHEM.2315
S2
1. General
Unless otherwise noted, all reagents were purchased from Kanto Chemical, Aldrich, Tokyo Chemical Industry (TCI) and Wako Pure Chemical Industries, and used as received without further purification. Graphite supplied by Wako Pure Chemical Industries, Ltd was used after sieving with mesh #35. Microwave irradiation was performed with a CEM model Discover® microwave reactor. 1H and 13C NMR spectra were recorded at 25 °C on a JEOL model JEOL α-500 spectrometer, operating at 500 and 125 MHz, respectively, where chemical shifts (δ in ppm) were determined with respect to non-deuterated solvent residues as internal references. Electrospray ionization (ESI) mass spectrometry was performed on a Thermo Scientific model Exactive mass spectrometer. Transmission electron microscopy (TEM) and high-resolution TEM (HR-TEM) were carried out with JEOL model JEM-1400 and JEM-2100 electron microscopes operating at 120 kV, respectively. Samples were deposited on a specimen Cu grid covered with thin polymer and carbon support films manufactured by Okenshoji Co., Ltd. Tapping-mode atomic force microscopy (AFM) was performed in air at 25 °C on a SII NanoTechnology model NanoNavi S-image (scan range: 20 × 20 µm) with silicon cantilevers (SI-DF20S, SII NanoTechnology). Scanning electron microscopy (SEM) images were collected with a JEOL model JSM-7001F scanning electron microscopy. Differential scanning calorimetry (DSC) was performed on a Mettler–Toledo model DSC 822e differential scanning calorimeter, where the heating profile was recorded and analyzed using a Mettler–Toledo STARe software system. Electronica absorption and laser Raman spectra were recorded on a Molecular Devices SpectraMax® Paradigm® multi-mode microplate detection platform and a JASCO model NRS-5100 laser Raman spectrometer, respectively. Rheological properties were measured by using an Anton Paar model MCR-301 rheometer, with a 25-mm diameter parallel plate attached to a transducer. X-ray diffraction (XRD) measurements were carried out with a Rigaku model RINT-ULTIMA3 X-ray diffractometer. Small angle X-ray scattering (SAXS) was collected with a Rigaku model NANO-Viewer X-ray diffractometer using a Rigaku PILATUS 2D detector at a detection length of 120 cm. Surface tension measurements were carried out with a DataPhysics model OCA35 automatic video-based optical contact angle and drop contour analysis system. Electronic conductivity measurements were carried out with a Solartron model 1260 impedance/gain-phase analyzer.
© 2015 Macmillan Publishers Limited. All rights reserved
NATURE CHEMISTRY | www.nature.com/naturechemistry 3
SUPPLEMENTARY INFORMATIONDOI: 10.1038/NCHEM.2315
S3
2. Synthesis and Characterization
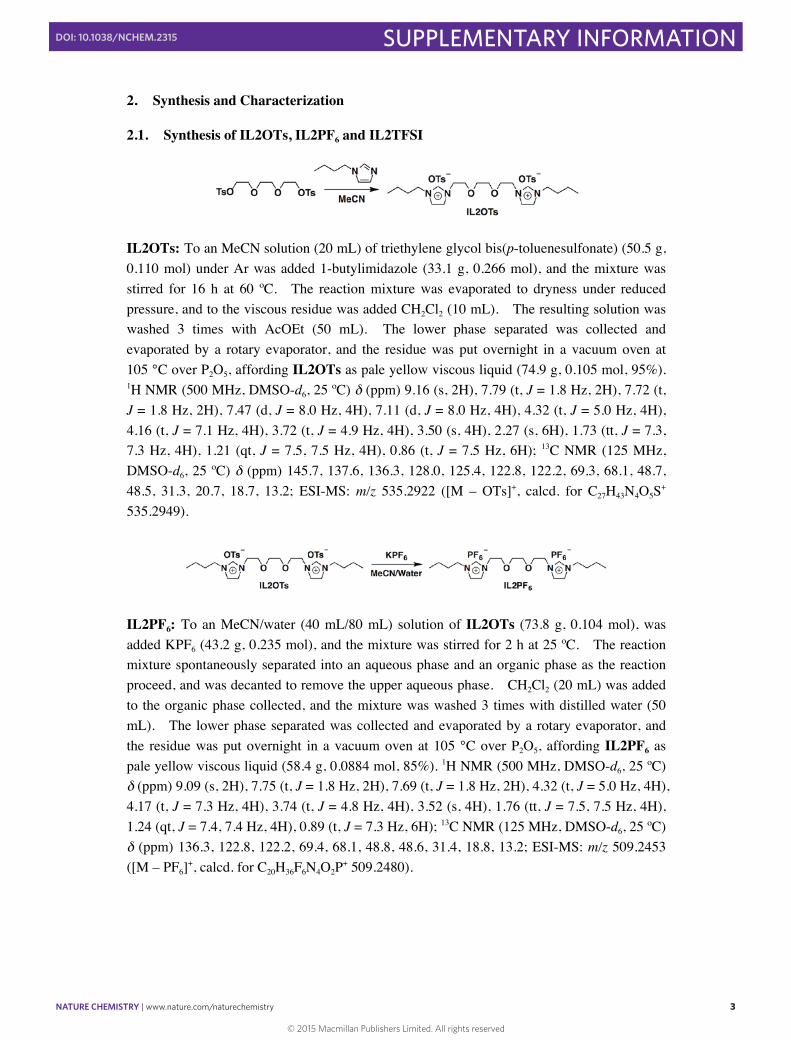
2.1. Synthesis of IL2OTs, IL2PF6 and IL2TFSI
IL2OTs: To an MeCN solution (20 mL) of triethylene glycol bis(p-toluenesulfonate) (50.5 g, 0.110 mol) under Ar was added 1-butylimidazole (33.1 g, 0.266 mol), and the mixture was stirred for 16 h at 60 ºC. The reaction mixture was evaporated to dryness under reduced pressure, and to the viscous residue was added CH2Cl2 (10 mL). The resulting solution was washed 3 times with AcOEt (50 mL). The lower phase separated was collected and evaporated by a rotary evaporator, and the residue was put overnight in a vacuum oven at 105 °C over P2O5, affording IL2OTs as pale yellow viscous liquid (74.9 g, 0.105 mol, 95%). 1H NMR (500 MHz, DMSO-d6, 25 ºC) δ (ppm) 9.16 (s, 2H), 7.79 (t, J = 1.8 Hz, 2H), 7.72 (t, J = 1.8 Hz, 2H), 7.47 (d, J = 8.0 Hz, 4H), 7.11 (d, J = 8.0 Hz, 4H), 4.32 (t, J = 5.0 Hz, 4H), 4.16 (t, J = 7.1 Hz, 4H), 3.72 (t, J = 4.9 Hz, 4H), 3.50 (s, 4H), 2.27 (s, 6H), 1.73 (tt, J = 7.3, 7.3 Hz, 4H), 1.21 (qt, J = 7.5, 7.5 Hz, 4H), 0.86 (t, J = 7.5 Hz, 6H); 13C NMR (125 MHz, DMSO-d6, 25 ºC) δ (ppm) 145.7, 137.6, 136.3, 128.0, 125.4, 122.8, 122.2, 69.3, 68.1, 48.7, 48.5, 31.3, 20.7, 18.7, 13.2; ESI-MS: m/z 535.2922 ([M – OTs]+, calcd. for C27H43N4O5S+ 535.2949).
IL2PF6: To an MeCN/water (40 mL/80 mL) solution of IL2OTs (73.8 g, 0.104 mol), was added KPF6 (43.2 g, 0.235 mol), and the mixture was stirred for 2 h at 25 ºC. The reaction mixture spontaneously separated into an aqueous phase and an organic phase as the reaction proceed, and was decanted to remove the upper aqueous phase. CH2Cl2 (20 mL) was added to the organic phase collected, and the mixture was washed 3 times with distilled water (50 mL). The lower phase separated was collected and evaporated by a rotary evaporator, and the residue was put overnight in a vacuum oven at 105 °C over P2O5, affording IL2PF6 as pale yellow viscous liquid (58.4 g, 0.0884 mol, 85%). 1H NMR (500 MHz, DMSO-d6, 25 ºC) δ (ppm) 9.09 (s, 2H), 7.75 (t, J = 1.8 Hz, 2H), 7.69 (t, J = 1.8 Hz, 2H), 4.32 (t, J = 5.0 Hz, 4H), 4.17 (t, J = 7.3 Hz, 4H), 3.74 (t, J = 4.8 Hz, 4H), 3.52 (s, 4H), 1.76 (tt, J = 7.5, 7.5 Hz, 4H), 1.24 (qt, J = 7.4, 7.4 Hz, 4H), 0.89 (t, J = 7.3 Hz, 6H); 13C NMR (125 MHz, DMSO-d6, 25 ºC) δ (ppm) 136.3, 122.8, 122.2, 69.4, 68.1, 48.8, 48.6, 31.4, 18.8, 13.2; ESI-MS: m/z 509.2453 ([M – PF6]+, calcd. for C20H36F6N4O2P+ 509.2480).
© 2015 Macmillan Publishers Limited. All rights reserved
NATURE CHEMISTRY | www.nature.com/naturechemistry 4
SUPPLEMENTARY INFORMATIONDOI: 10.1038/NCHEM.2315
S4
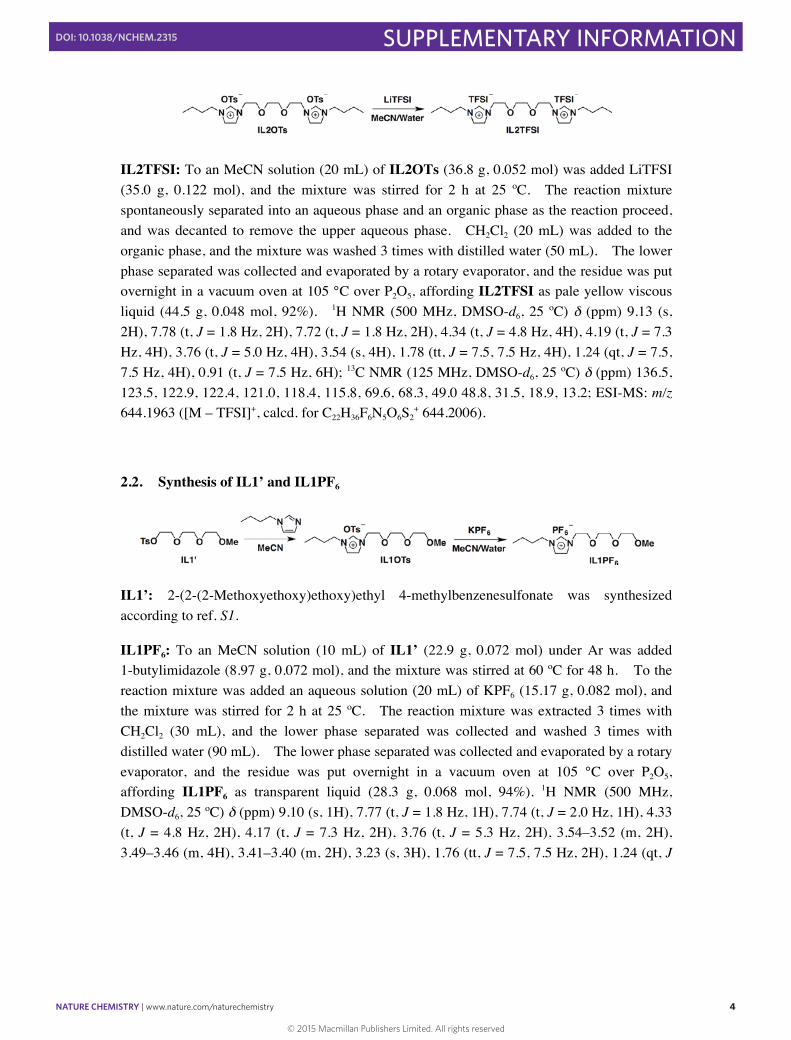
IL2TFSI: To an MeCN solution (20 mL) of IL2OTs (36.8 g, 0.052 mol) was added LiTFSI (35.0 g, 0.122 mol), and the mixture was stirred for 2 h at 25 ºC. The reaction mixture spontaneously separated into an aqueous phase and an organic phase as the reaction proceed, and was decanted to remove the upper aqueous phase. CH2Cl2 (20 mL) was added to the organic phase, and the mixture was washed 3 times with distilled water (50 mL). The lower phase separated was collected and evaporated by a rotary evaporator, and the residue was put overnight in a vacuum oven at 105 °C over P2O5, affording IL2TFSI as pale yellow viscous liquid (44.5 g, 0.048 mol, 92%). 1H NMR (500 MHz, DMSO-d6, 25 ºC) δ (ppm) 9.13 (s, 2H), 7.78 (t, J = 1.8 Hz, 2H), 7.72 (t, J = 1.8 Hz, 2H), 4.34 (t, J = 4.8 Hz, 4H), 4.19 (t, J = 7.3 Hz, 4H), 3.76 (t, J = 5.0 Hz, 4H), 3.54 (s, 4H), 1.78 (tt, J = 7.5, 7.5 Hz, 4H), 1.24 (qt, J = 7.5, 7.5 Hz, 4H), 0.91 (t, J = 7.5 Hz, 6H); 13C NMR (125 MHz, DMSO-d6, 25 ºC) δ (ppm) 136.5, 123.5, 122.9, 122.4, 121.0, 118.4, 115.8, 69.6, 68.3, 49.0 48.8, 31.5, 18.9, 13.2; ESI-MS: m/z 644.1963 ([M – TFSI]+, calcd. for C22H36F6N5O6S2
+ 644.2006).
2.2. Synthesis of IL1’ and IL1PF6
IL1’: 2-(2-(2-Methoxyethoxy)ethoxy)ethyl 4-methylbenzenesulfonate was synthesized according to ref. S1.
IL1PF6: To an MeCN solution (10 mL) of IL1’ (22.9 g, 0.072 mol) under Ar was added 1-butylimidazole (8.97 g, 0.072 mol), and the mixture was stirred at 60 ºC for 48 h. To the reaction mixture was added an aqueous solution (20 mL) of KPF6 (15.17 g, 0.082 mol), and the mixture was stirred for 2 h at 25 ºC. The reaction mixture was extracted 3 times with CH2Cl2 (30 mL), and the lower phase separated was collected and washed 3 times with distilled water (90 mL). The lower phase separated was collected and evaporated by a rotary evaporator, and the residue was put overnight in a vacuum oven at 105 °C over P2O5, affording IL1PF6 as transparent liquid (28.3 g, 0.068 mol, 94%). 1H NMR (500 MHz, DMSO-d6, 25 ºC) δ (ppm) 9.10 (s, 1H), 7.77 (t, J = 1.8 Hz, 1H), 7.74 (t, J = 2.0 Hz, 1H), 4.33 (t, J = 4.8 Hz, 2H), 4.17 (t, J = 7.3 Hz, 2H), 3.76 (t, J = 5.3 Hz, 2H), 3.54–3.52 (m, 2H), 3.49–3.46 (m, 4H), 3.41–3.40 (m, 2H), 3.23 (s, 3H), 1.76 (tt, J = 7.5, 7.5 Hz, 2H), 1.24 (qt, J
© 2015 Macmillan Publishers Limited. All rights reserved
NATURE CHEMISTRY | www.nature.com/naturechemistry 5
SUPPLEMENTARY INFORMATIONDOI: 10.1038/NCHEM.2315
S5
= 7.5, 7.5 Hz, 2H), 0.89 (t, J = 7.5 Hz, 3H); 13C NMR (125 MHz, DMSO-d6, 25 ºC) δ (ppm) 136.3, 122.8, 122.2, 71.3, 69.6, 69.5, 69.5, 68.0, 58.1, 48.8, 48.6, 31.4, 18.8, 13.2; ESI-MS: m/z 271.2009 ([M – PF6]+, calcd. for C14H27N2O3
+ 271.2017).
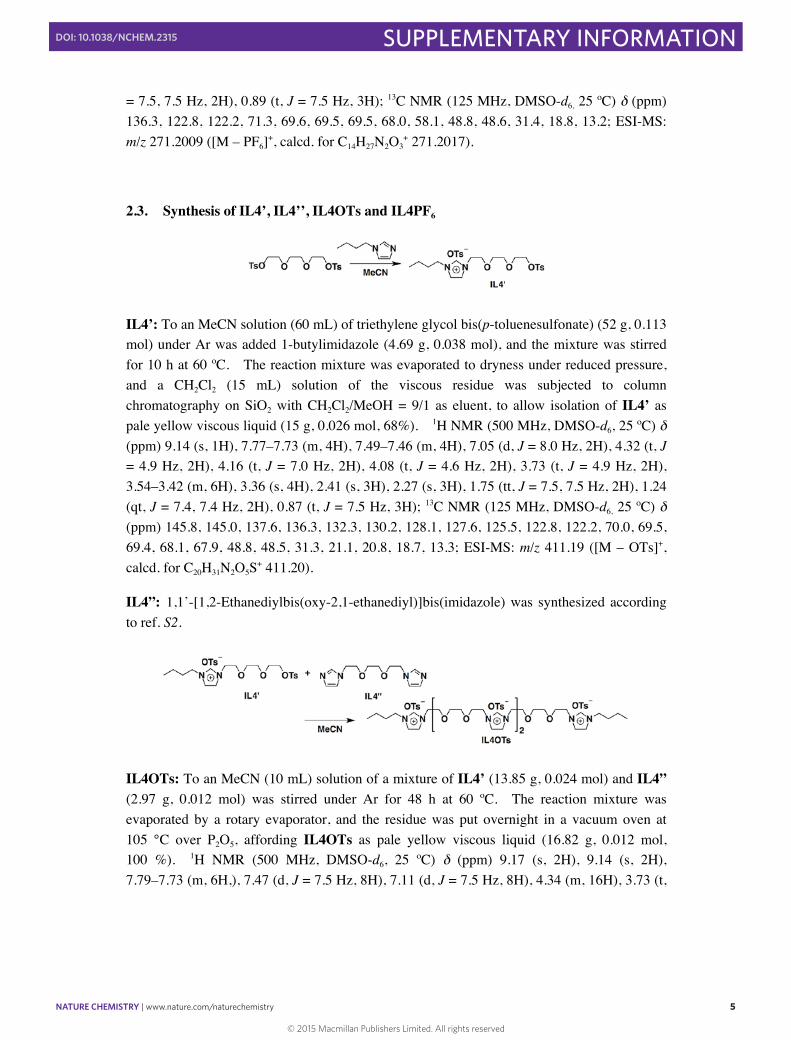
2.3. Synthesis of IL4’, IL4’’, IL4OTs and IL4PF6
IL4’: To an MeCN solution (60 mL) of triethylene glycol bis(p-toluenesulfonate) (52 g, 0.113 mol) under Ar was added 1-butylimidazole (4.69 g, 0.038 mol), and the mixture was stirred for 10 h at 60 ºC. The reaction mixture was evaporated to dryness under reduced pressure, and a CH2Cl2 (15 mL) solution of the viscous residue was subjected to column chromatography on SiO2 with CH2Cl2/MeOH = 9/1 as eluent, to allow isolation of IL4’ as pale yellow viscous liquid (15 g, 0.026 mol, 68%). 1H NMR (500 MHz, DMSO-d6, 25 ºC) δ (ppm) 9.14 (s, 1H), 7.77–7.73 (m, 4H), 7.49–7.46 (m, 4H), 7.05 (d, J = 8.0 Hz, 2H), 4.32 (t, J = 4.9 Hz, 2H), 4.16 (t, J = 7.0 Hz, 2H), 4.08 (t, J = 4.6 Hz, 2H), 3.73 (t, J = 4.9 Hz, 2H), 3.54–3.42 (m, 6H), 3.36 (s, 4H), 2.41 (s, 3H), 2.27 (s, 3H), 1.75 (tt, J = 7.5, 7.5 Hz, 2H), 1.24 (qt, J = 7.4, 7.4 Hz, 2H), 0.87 (t, J = 7.5 Hz, 3H); 13C NMR (125 MHz, DMSO-d6, 25 ºC) δ (ppm) 145.8, 145.0, 137.6, 136.3, 132.3, 130.2, 128.1, 127.6, 125.5, 122.8, 122.2, 70.0, 69.5, 69.4, 68.1, 67.9, 48.8, 48.5, 31.3, 21.1, 20.8, 18.7, 13.3; ESI-MS: m/z 411.19 ([M – OTs]+, calcd. for C20H31N2O5S+ 411.20).
IL4”: 1,1’-[1,2-Ethanediylbis(oxy-2,1-ethanediyl)]bis(imidazole) was synthesized according to ref. S2.
IL4OTs: To an MeCN (10 mL) solution of a mixture of IL4’ (13.85 g, 0.024 mol) and IL4” (2.97 g, 0.012 mol) was stirred under Ar for 48 h at 60 ºC. The reaction mixture was evaporated by a rotary evaporator, and the residue was put overnight in a vacuum oven at 105 °C over P2O5, affording IL4OTs as pale yellow viscous liquid (16.82 g, 0.012 mol, 100 %). 1H NMR (500 MHz, DMSO-d6, 25 ºC) δ (ppm) 9.17 (s, 2H), 9.14 (s, 2H), 7.79–7.73 (m, 6H,), 7.47 (d, J = 7.5 Hz, 8H), 7.11 (d, J = 7.5 Hz, 8H), 4.34 (m, 16H), 3.73 (t,
© 2015 Macmillan Publishers Limited. All rights reserved
NATURE CHEMISTRY | www.nature.com/naturechemistry 6
SUPPLEMENTARY INFORMATIONDOI: 10.1038/NCHEM.2315
S6
J = 4.9 Hz, 12H), 3.51 (d, J = 1.2 Hz, 12H), 2.28 (s, 12H), 1.74 (tt, J = 7.5, 7.5 Hz, 4H), 1.22 (qt, J = 7.5, 7.5 Hz, 4H), 0.87 (t, J = 7.3 Hz, 6H); 13C NMR (125 MHz, DMSO-d6, 25 ºC) δ (ppm) 145.7, 137.7, 136.6, 136.3, 128.1, 125.5, 122.8, 122.6, 122.3, 69.3, 68.2, 68.1, 48.7, 48.5, 31.4, 20.8, 187, 13.3; ESI-MS: m/z 1243.5404 ([M – OTs]+, calcd. for C59H87N8O15S3
+ 1243.5453).
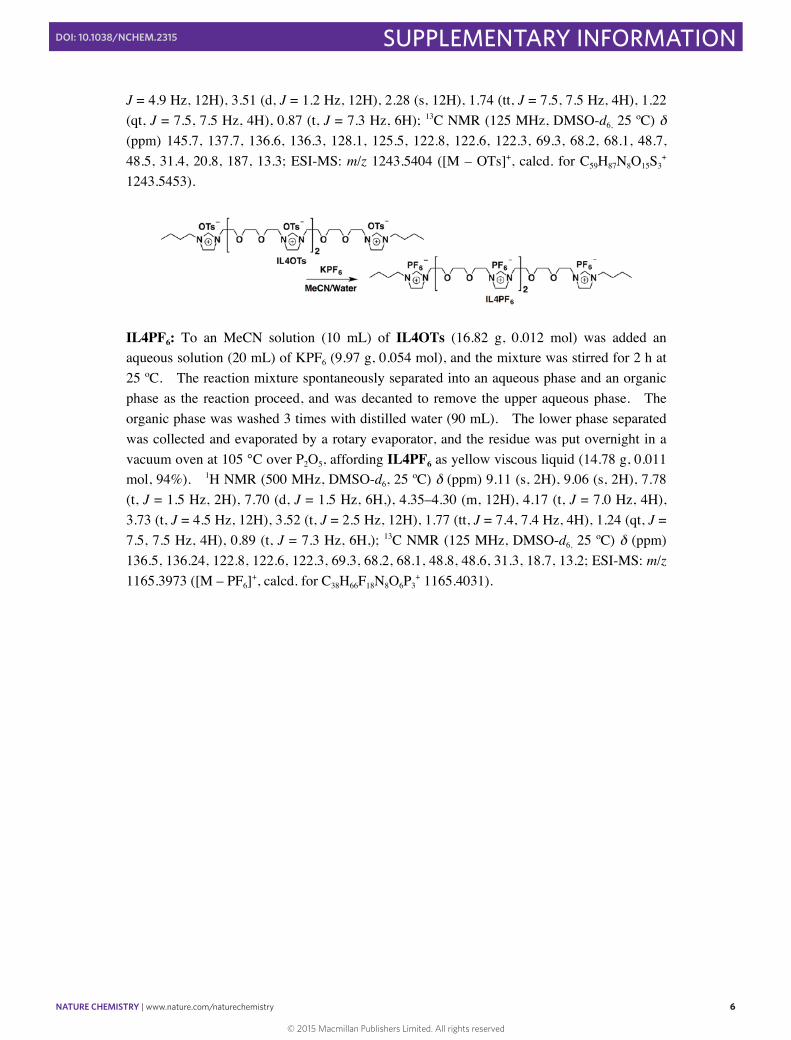
IL4PF6: To an MeCN solution (10 mL) of IL4OTs (16.82 g, 0.012 mol) was added an aqueous solution (20 mL) of KPF6 (9.97 g, 0.054 mol), and the mixture was stirred for 2 h at 25 ºC. The reaction mixture spontaneously separated into an aqueous phase and an organic phase as the reaction proceed, and was decanted to remove the upper aqueous phase. The organic phase was washed 3 times with distilled water (90 mL). The lower phase separated was collected and evaporated by a rotary evaporator, and the residue was put overnight in a vacuum oven at 105 °C over P2O5, affording IL4PF6 as yellow viscous liquid (14.78 g, 0.011 mol, 94%). 1H NMR (500 MHz, DMSO-d6, 25 ºC) δ (ppm) 9.11 (s, 2H), 9.06 (s, 2H), 7.78 (t, J = 1.5 Hz, 2H), 7.70 (d, J = 1.5 Hz, 6H,), 4.35–4.30 (m, 12H), 4.17 (t, J = 7.0 Hz, 4H), 3.73 (t, J = 4.5 Hz, 12H), 3.52 (t, J = 2.5 Hz, 12H), 1.77 (tt, J = 7.4, 7.4 Hz, 4H), 1.24 (qt, J = 7.5, 7.5 Hz, 4H), 0.89 (t, J = 7.3 Hz, 6H,); 13C NMR (125 MHz, DMSO-d6, 25 ºC) δ (ppm) 136.5, 136.24, 122.8, 122.6, 122.3, 69.3, 68.2, 68.1, 48.8, 48.6, 31.3, 18.7, 13.2; ESI-MS: m/z 1165.3973 ([M – PF6]+, calcd. for C38H66F18N8O6P3
+ 1165.4031).
© 2015 Macmillan Publishers Limited. All rights reserved
NATURE CHEMISTRY | www.nature.com/naturechemistry 7
SUPPLEMENTARY INFORMATIONDOI: 10.1038/NCHEM.2315
S7
2.4. 1H and 13C NMR Spectroscopy
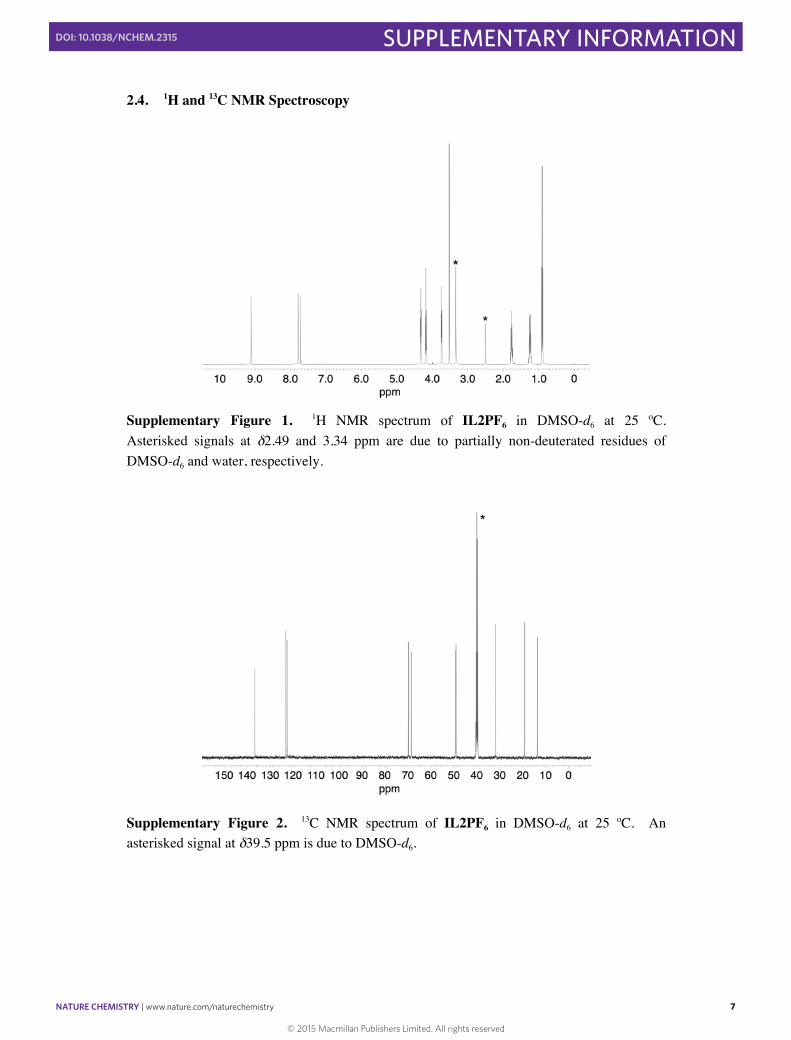
Supplementary Figure 1. 1H NMR spectrum of IL2PF6 in DMSO-d6 at 25 ºC. Asterisked signals at δ2.49 and 3.34 ppm are due to partially non-deuterated residues of DMSO-d6 and water, respectively.
Supplementary Figure 2. 13C NMR spectrum of IL2PF6 in DMSO-d6 at 25 ºC. An asterisked signal at δ39.5 ppm is due to DMSO-d6.
© 2015 Macmillan Publishers Limited. All rights reserved

NATURE CHEMISTRY | www.nature.com/naturechemistry 8
SUPPLEMENTARY INFORMATIONDOI: 10.1038/NCHEM.2315
S8
Supplementary Figure 3. 1H NMR spectrum of IL2TFSI in DMSO-d6 at 25 ºC. Asterisked signals at δ2.49 and 3.34 ppm are due to partially non-deuterated residues of DMSO-d6 and water, respectively.
Supplementary Figure 4. 13C NMR spectrum of IL2TFSI in DMSO-d6 at 25 ºC. An asterisked signal at δ39.5 ppm is due to DMSO-d6.
© 2015 Macmillan Publishers Limited. All rights reserved
NATURE CHEMISTRY | www.nature.com/naturechemistry 9
SUPPLEMENTARY INFORMATIONDOI: 10.1038/NCHEM.2315
S9
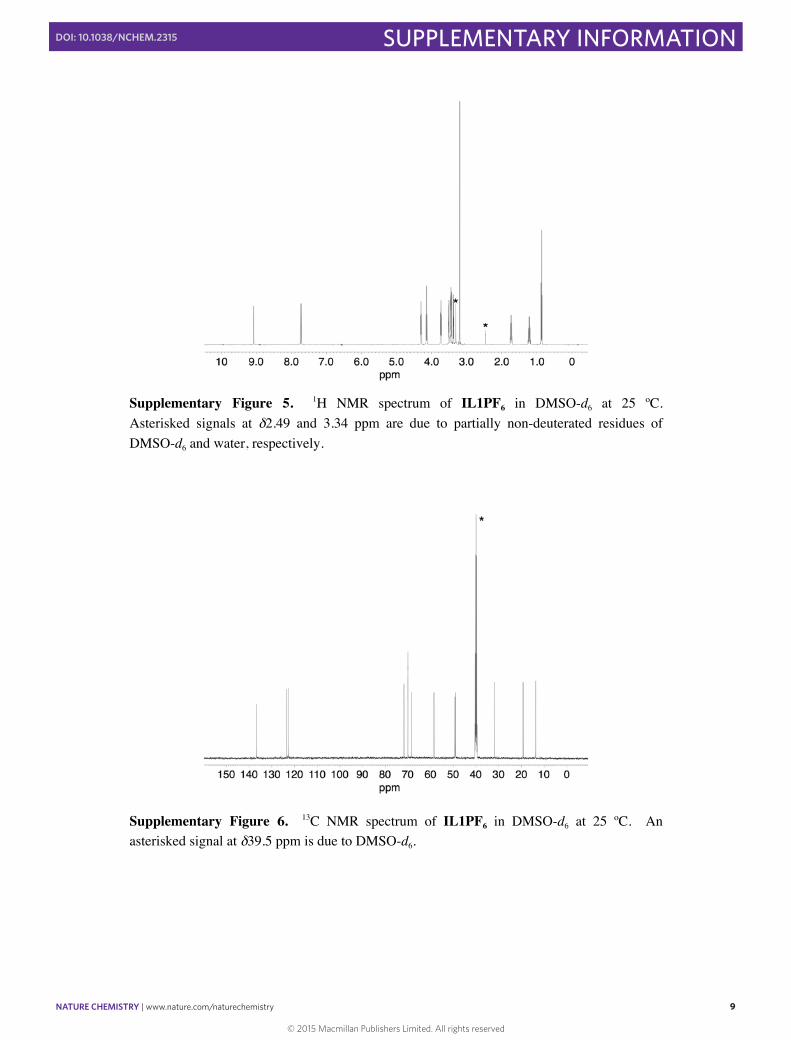
Supplementary Figure 5. 1H NMR spectrum of IL1PF6 in DMSO-d6 at 25 ºC. Asterisked signals at δ2.49 and 3.34 ppm are due to partially non-deuterated residues of DMSO-d6 and water, respectively.
Supplementary Figure 6. 13C NMR spectrum of IL1PF6 in DMSO-d6 at 25 ºC. An asterisked signal at δ39.5 ppm is due to DMSO-d6.
© 2015 Macmillan Publishers Limited. All rights reserved
NATURE CHEMISTRY | www.nature.com/naturechemistry 10
SUPPLEMENTARY INFORMATIONDOI: 10.1038/NCHEM.2315
S10
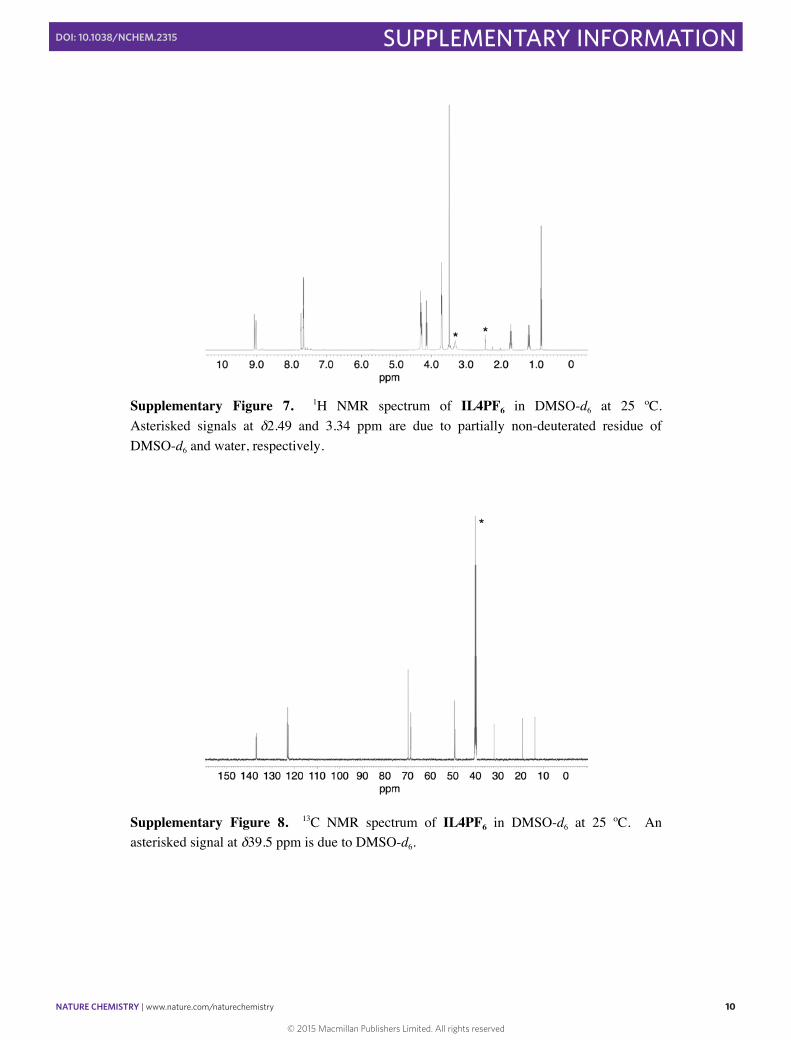
Supplementary Figure 7. 1H NMR spectrum of IL4PF6 in DMSO-d6 at 25 ºC. Asterisked signals at δ2.49 and 3.34 ppm are due to partially non-deuterated residue of DMSO-d6 and water, respectively.
Supplementary Figure 8. 13C NMR spectrum of IL4PF6 in DMSO-d6 at 25 ºC. An asterisked signal at δ39.5 ppm is due to DMSO-d6.
© 2015 Macmillan Publishers Limited. All rights reserved
NATURE CHEMISTRY | www.nature.com/naturechemistry 11
SUPPLEMENTARY INFORMATIONDOI: 10.1038/NCHEM.2315
S11
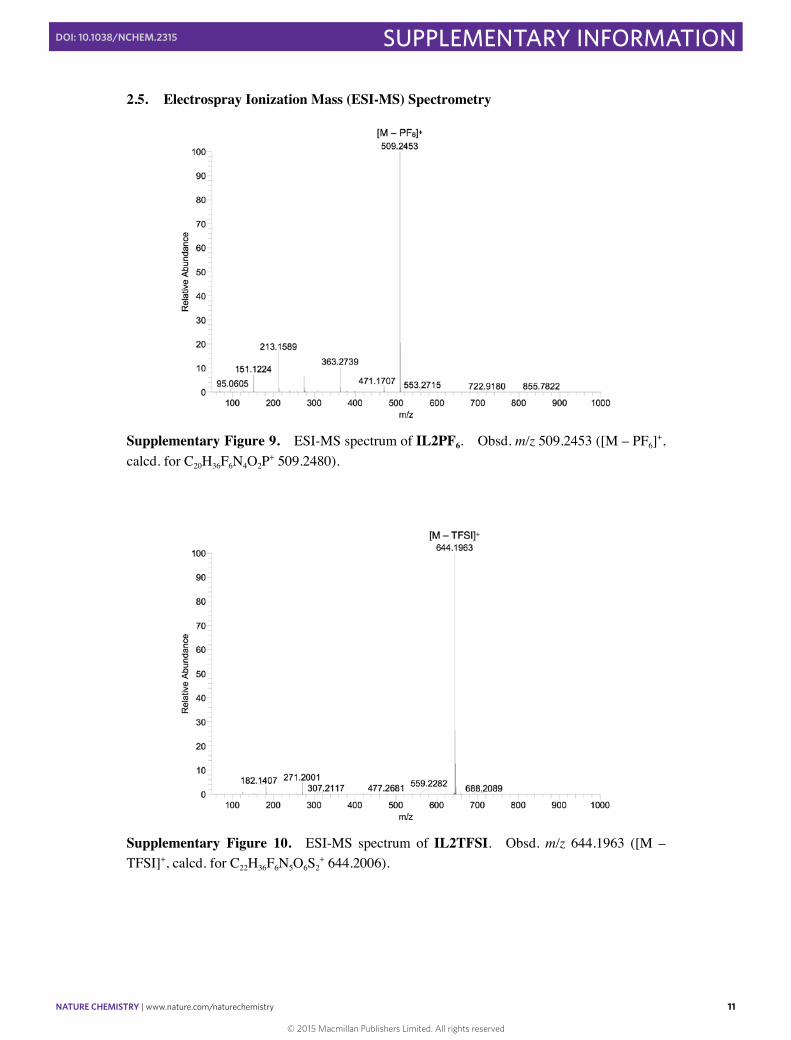
2.5. Electrospray Ionization Mass (ESI-MS) Spectrometry
Supplementary Figure 9. ESI-MS spectrum of IL2PF6. Obsd. m/z 509.2453 ([M – PF6]+, calcd. for C20H36F6N4O2P+ 509.2480).
Supplementary Figure 10. ESI-MS spectrum of IL2TFSI. Obsd. m/z 644.1963 ([M – TFSI]+, calcd. for C22H36F6N5O6S2
+ 644.2006).
© 2015 Macmillan Publishers Limited. All rights reserved
NATURE CHEMISTRY | www.nature.com/naturechemistry 12
SUPPLEMENTARY INFORMATIONDOI: 10.1038/NCHEM.2315
S12
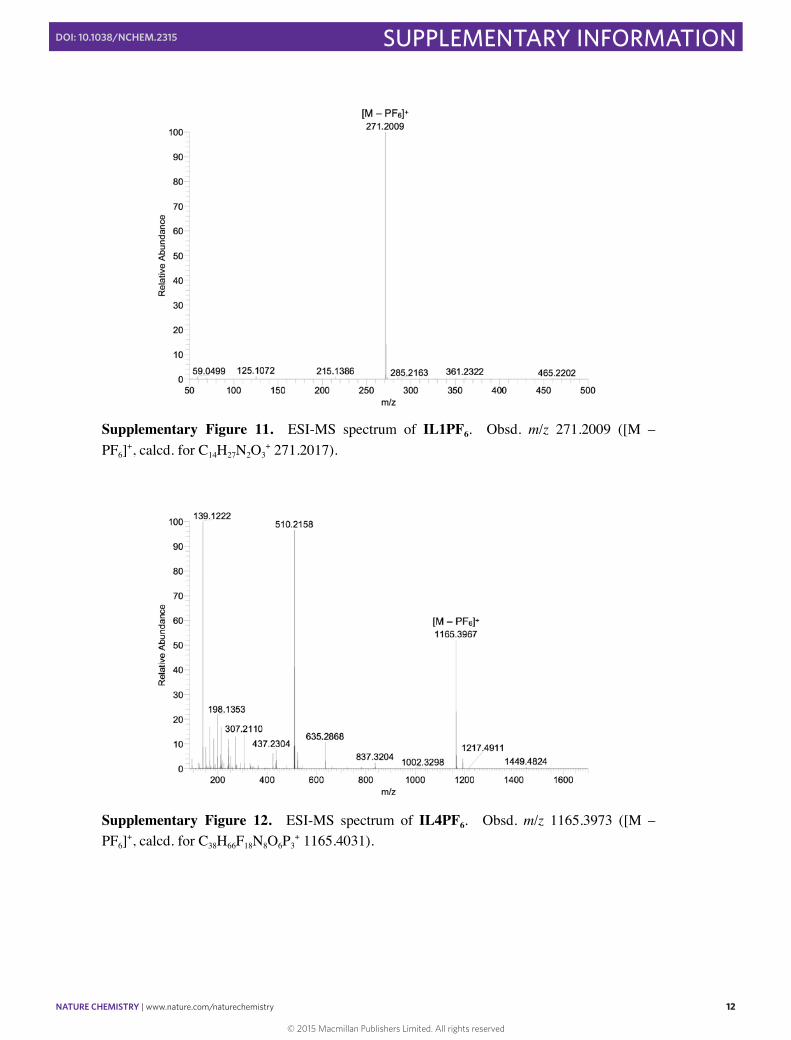
Supplementary Figure 11. ESI-MS spectrum of IL1PF6. Obsd. m/z 271.2009 ([M – PF6]+, calcd. for C14H27N2O3
+ 271.2017).
Supplementary Figure 12. ESI-MS spectrum of IL4PF6. Obsd. m/z 1165.3973 ([M – PF6]+, calcd. for C38H66F18N8O6P3
+ 1165.4031).
© 2015 Macmillan Publishers Limited. All rights reserved
NATURE CHEMISTRY | www.nature.com/naturechemistry 13
SUPPLEMENTARY INFORMATIONDOI: 10.1038/NCHEM.2315
S13
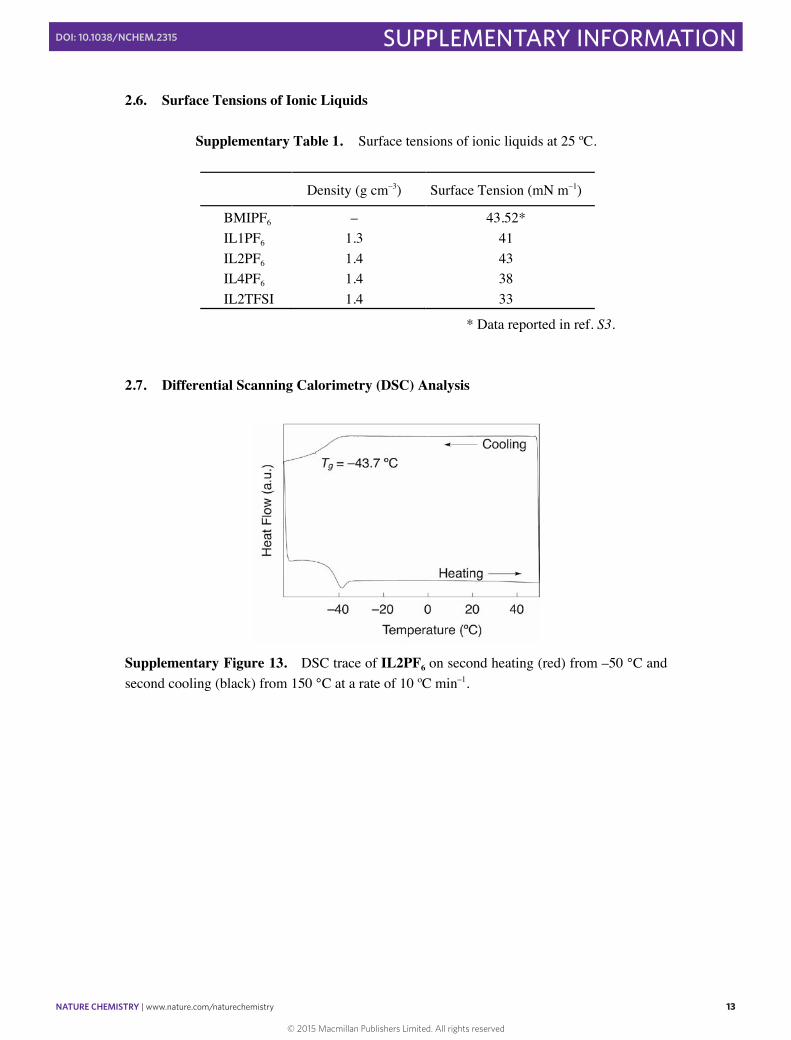
2.6. Surface Tensions of Ionic Liquids
Supplementary Table 1. Surface tensions of ionic liquids at 25 ºC.
* Data reported in ref. S3. 2.7. Differential Scanning Calorimetry (DSC) Analysis
Supplementary Figure 13. DSC trace of IL2PF6 on second heating (red) from –50 °C and second cooling (black) from 150 °C at a rate of 10 ºC min–1.
Density (g cm–3) Surface Tension (mN m–1)
BMIPF6 – 43.52* IL1PF6 1.3 41 IL2PF6 1.4 43 IL4PF6
IL2TFSI 1.4 1.4
38 33
© 2015 Macmillan Publishers Limited. All rights reserved
NATURE CHEMISTRY | www.nature.com/naturechemistry 14
SUPPLEMENTARY INFORMATIONDOI: 10.1038/NCHEM.2315
S14
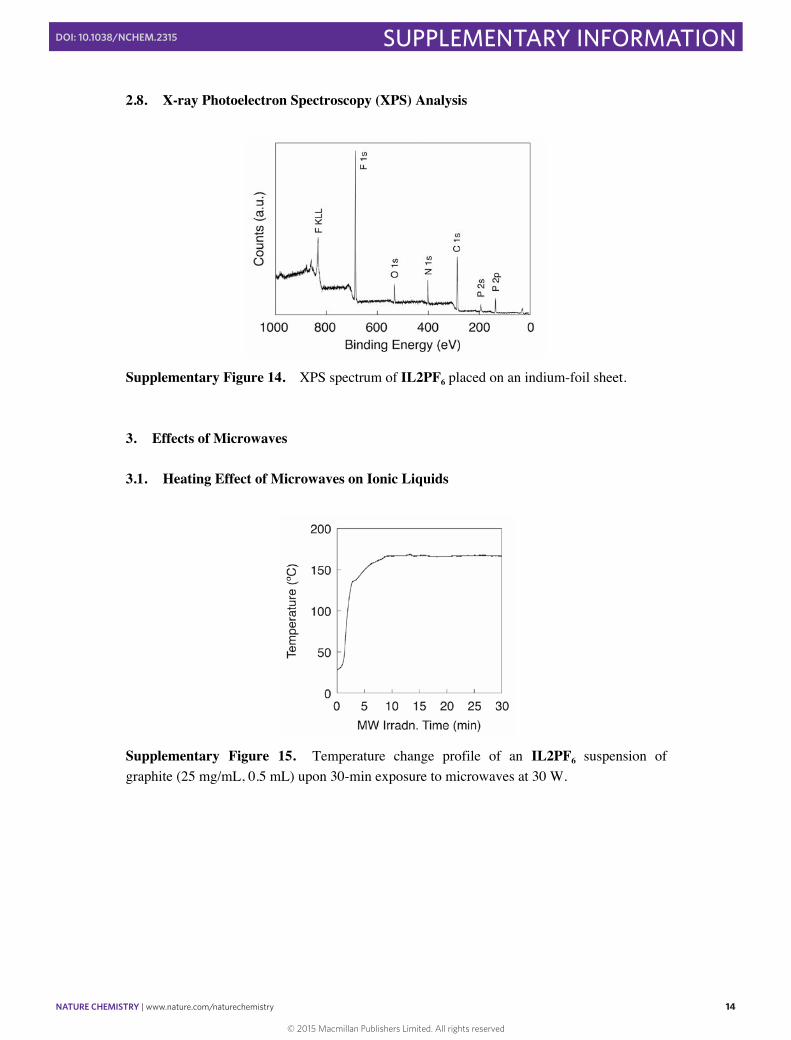
2.8. X-ray Photoelectron Spectroscopy (XPS) Analysis
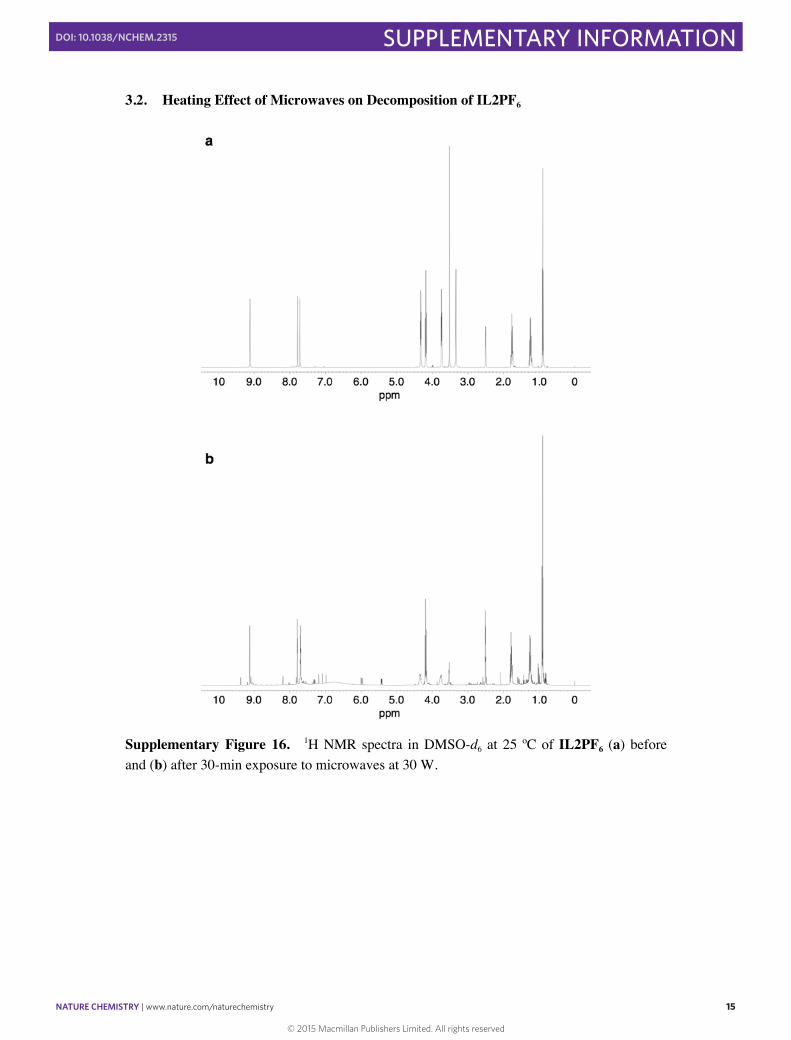
Supplementary Figure 14. XPS spectrum of IL2PF6 placed on an indium-foil sheet. 3. Effects of Microwaves 3.1. Heating Effect of Microwaves on Ionic Liquids
Supplementary Figure 15. Temperature change profile of an IL2PF6 suspension of graphite (25 mg/mL, 0.5 mL) upon 30-min exposure to microwaves at 30 W.
© 2015 Macmillan Publishers Limited. All rights reserved
NATURE CHEMISTRY | www.nature.com/naturechemistry 15
SUPPLEMENTARY INFORMATIONDOI: 10.1038/NCHEM.2315
S15
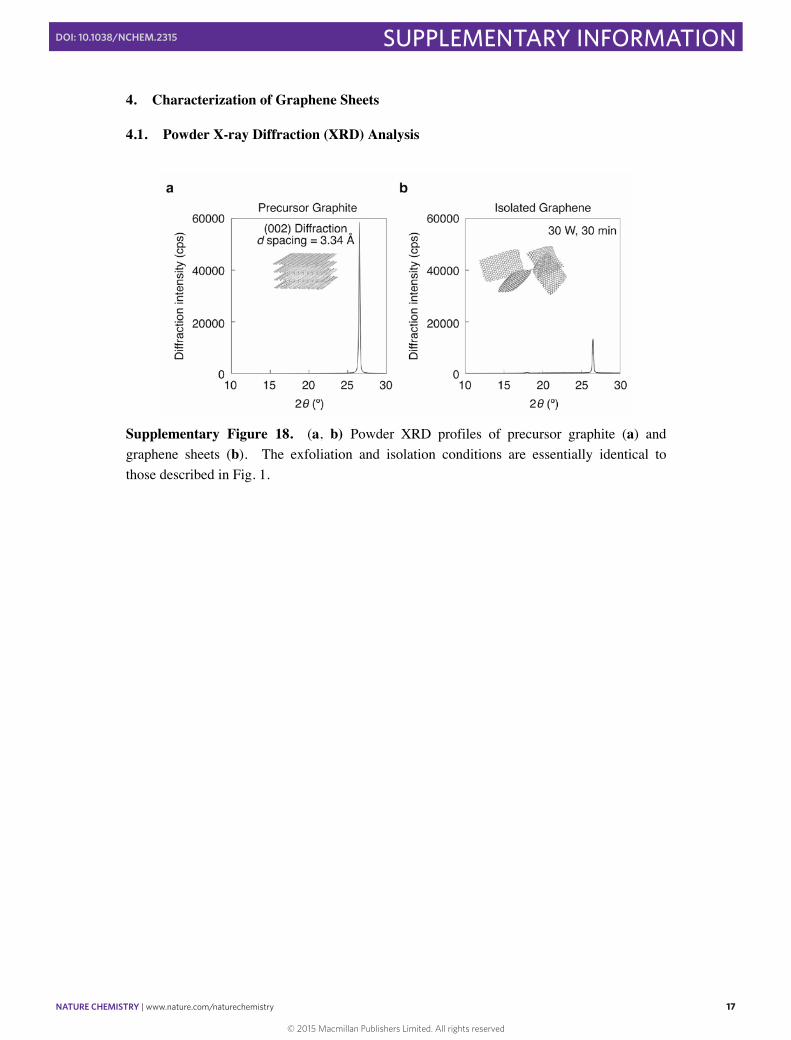
3.2. Heating Effect of Microwaves on Decomposition of IL2PF6
Supplementary Figure 16. 1H NMR spectra in DMSO-d6 at 25 ºC of IL2PF6 (a) before and (b) after 30-min exposure to microwaves at 30 W.
© 2015 Macmillan Publishers Limited. All rights reserved

NATURE CHEMISTRY | www.nature.com/naturechemistry 16
SUPPLEMENTARY INFORMATIONDOI: 10.1038/NCHEM.2315
S16
3.3. Heating Effect of Microwaves on Decomposition of IL2TFSI
Supplementary Figure 17. 1H NMR spectra in DMSO-d6 at 25 ºC of IL2TFSI (a) before and (b) after 30-min exposure to microwaves at 30 W.
© 2015 Macmillan Publishers Limited. All rights reserved
NATURE CHEMISTRY | www.nature.com/naturechemistry 17
SUPPLEMENTARY INFORMATIONDOI: 10.1038/NCHEM.2315
S17
4. Characterization of Graphene Sheets
4.1. Powder X-ray Diffraction (XRD) Analysis
Supplementary Figure 18. (a, b) Powder XRD profiles of precursor graphite (a) and graphene sheets (b). The exfoliation and isolation conditions are essentially identical to those described in Fig. 1.
© 2015 Macmillan Publishers Limited. All rights reserved
NATURE CHEMISTRY | www.nature.com/naturechemistry 18
SUPPLEMENTARY INFORMATIONDOI: 10.1038/NCHEM.2315
S18
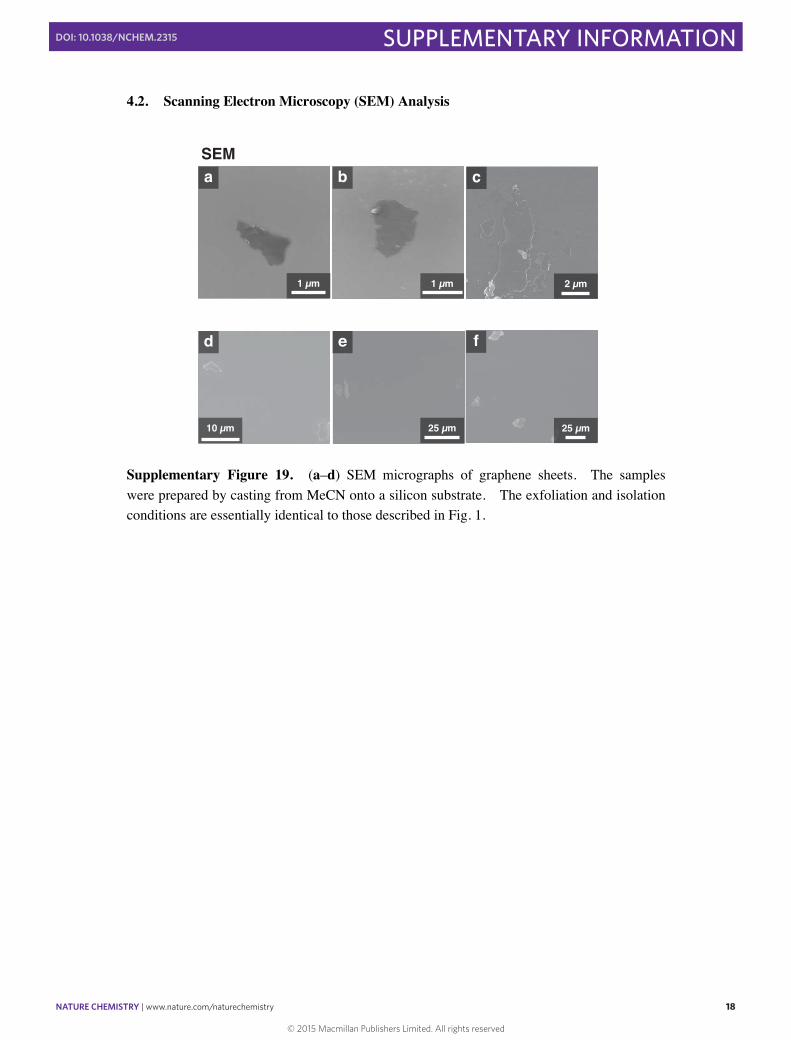
4.2. Scanning Electron Microscopy (SEM) Analysis
2 µm
25 µm
1 µm1 µm
a b
e
c
d
SEM
10 µm 25 µm
f
Supplementary Figure 19. (a–d) SEM micrographs of graphene sheets. The samples were prepared by casting from MeCN onto a silicon substrate. The exfoliation and isolation conditions are essentially identical to those described in Fig. 1.
© 2015 Macmillan Publishers Limited. All rights reserved
NATURE CHEMISTRY | www.nature.com/naturechemistry 19
SUPPLEMENTARY INFORMATIONDOI: 10.1038/NCHEM.2315
S19
4.3. Transmittance Electron Microscopy (TEM) Analysis
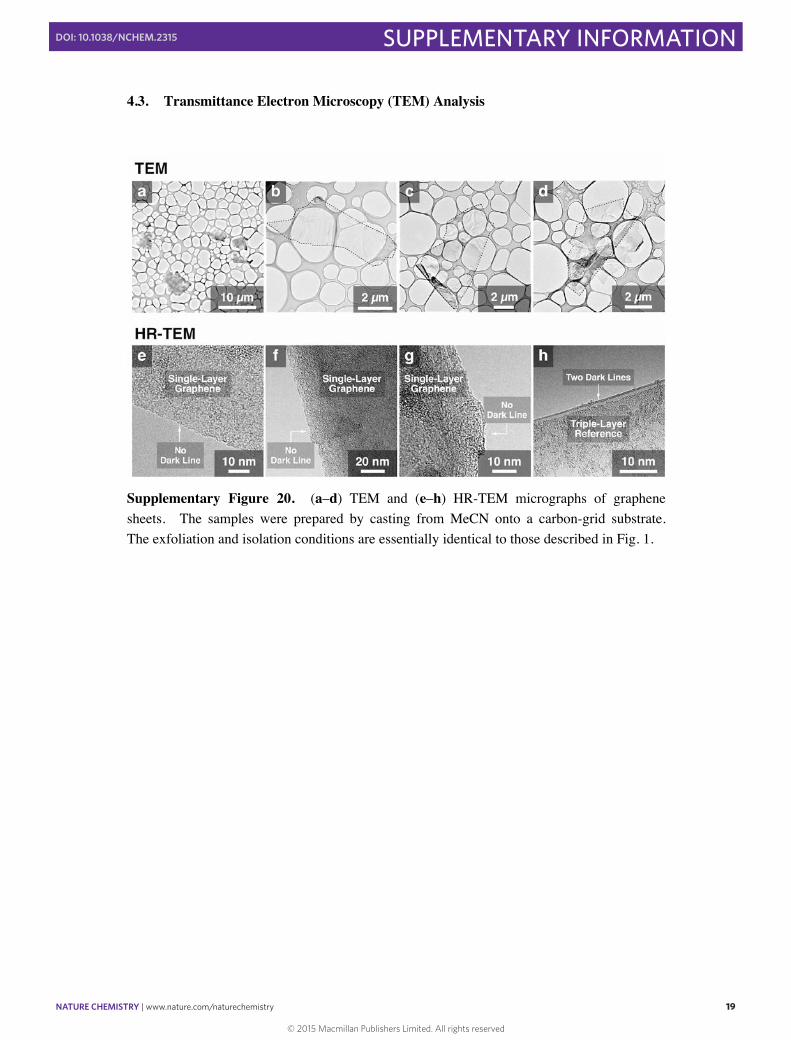
Supplementary Figure 20. (a–d) TEM and (e–h) HR-TEM micrographs of graphene sheets. The samples were prepared by casting from MeCN onto a carbon-grid substrate. The exfoliation and isolation conditions are essentially identical to those described in Fig. 1.
© 2015 Macmillan Publishers Limited. All rights reserved
NATURE CHEMISTRY | www.nature.com/naturechemistry 20
SUPPLEMENTARY INFORMATIONDOI: 10.1038/NCHEM.2315
S20
4.4. Atomic Force Microscopy (AFM) Analysis
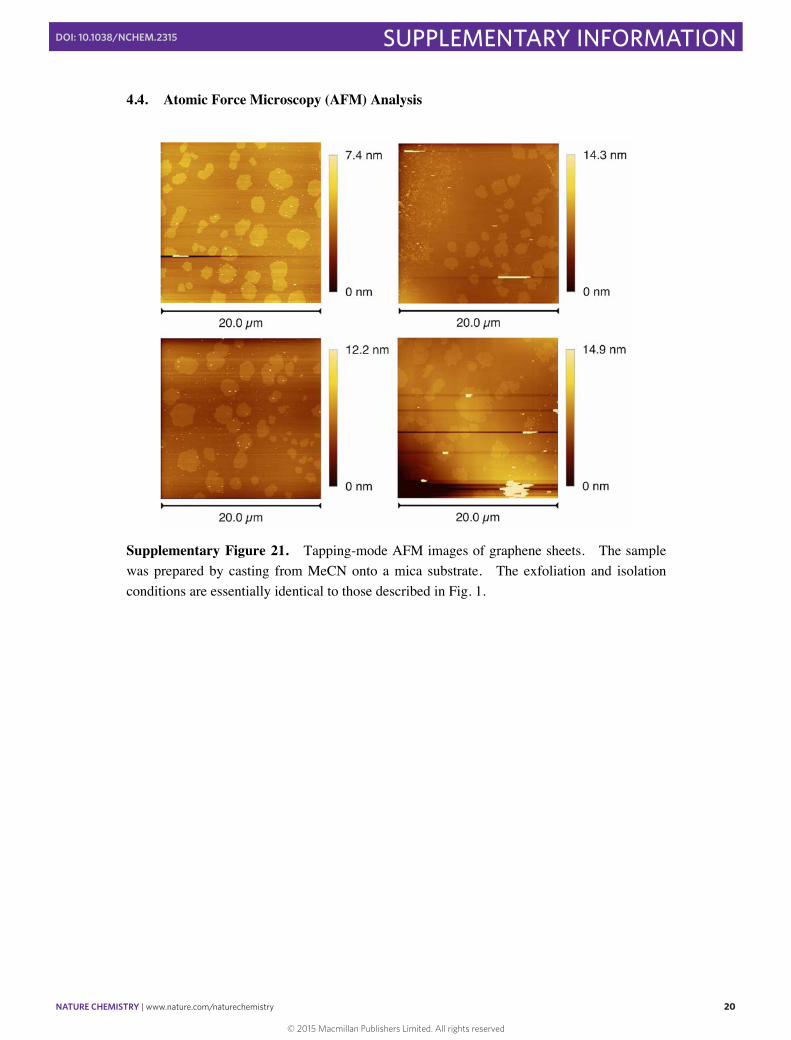
Supplementary Figure 21. Tapping-mode AFM images of graphene sheets. The sample was prepared by casting from MeCN onto a mica substrate. The exfoliation and isolation conditions are essentially identical to those described in Fig. 1.
© 2015 Macmillan Publishers Limited. All rights reserved
NATURE CHEMISTRY | www.nature.com/naturechemistry 21
SUPPLEMENTARY INFORMATIONDOI: 10.1038/NCHEM.2315
S21
4.5. Electronic Conductivity Analysis
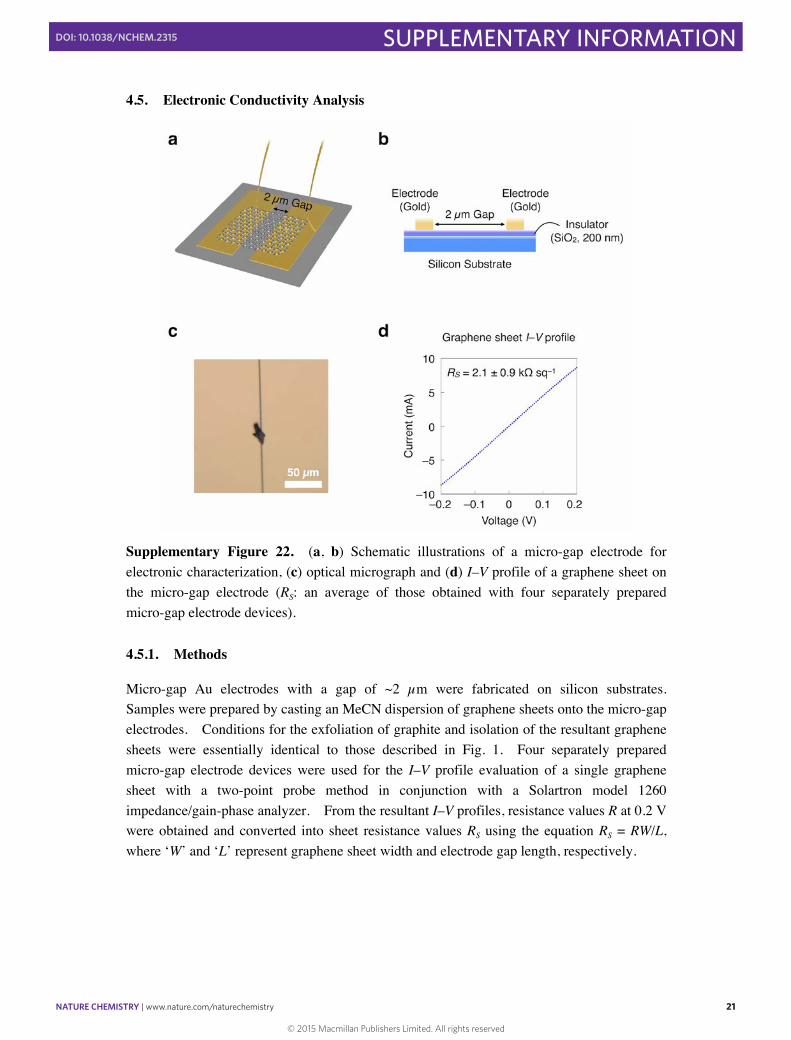
Supplementary Figure 22. (a, b) Schematic illustrations of a micro-gap electrode for electronic characterization, (c) optical micrograph and (d) I–V profile of a graphene sheet on the micro-gap electrode (RS: an average of those obtained with four separately prepared micro-gap electrode devices). 4.5.1. Methods
Micro-gap Au electrodes with a gap of ~2 µm were fabricated on silicon substrates. Samples were prepared by casting an MeCN dispersion of graphene sheets onto the micro-gap electrodes. Conditions for the exfoliation of graphite and isolation of the resultant graphene sheets were essentially identical to those described in Fig. 1. Four separately prepared micro-gap electrode devices were used for the I–V profile evaluation of a single graphene sheet with a two-point probe method in conjunction with a Solartron model 1260 impedance/gain-phase analyzer. From the resultant I–V profiles, resistance values R at 0.2 V were obtained and converted into sheet resistance values RS using the equation RS = RW/L, where ‘W’ and ‘L’ represent graphene sheet width and electrode gap length, respectively.
© 2015 Macmillan Publishers Limited. All rights reserved
NATURE CHEMISTRY | www.nature.com/naturechemistry 22
SUPPLEMENTARY INFORMATIONDOI: 10.1038/NCHEM.2315
S22
4.6. XPS Analysis
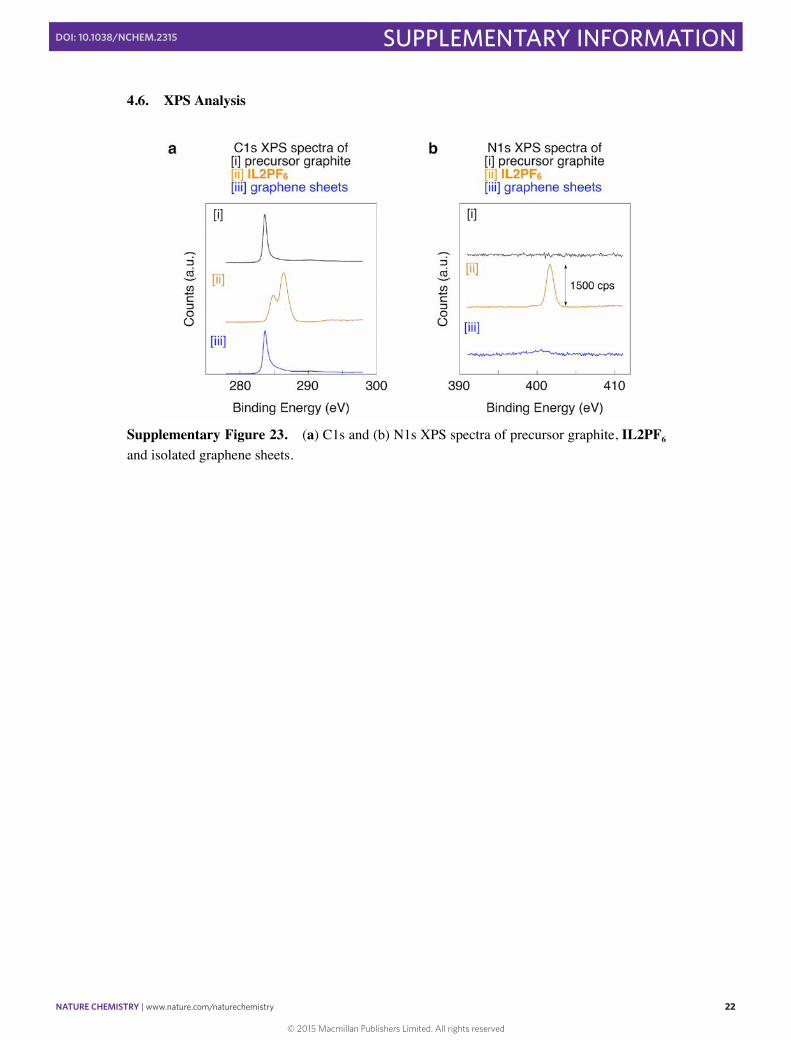
Supplementary Figure 23. (a) C1s and (b) N1s XPS spectra of precursor graphite, IL2PF6 and isolated graphene sheets.
© 2015 Macmillan Publishers Limited. All rights reserved
NATURE CHEMISTRY | www.nature.com/naturechemistry 23
SUPPLEMENTARY INFORMATIONDOI: 10.1038/NCHEM.2315
S23
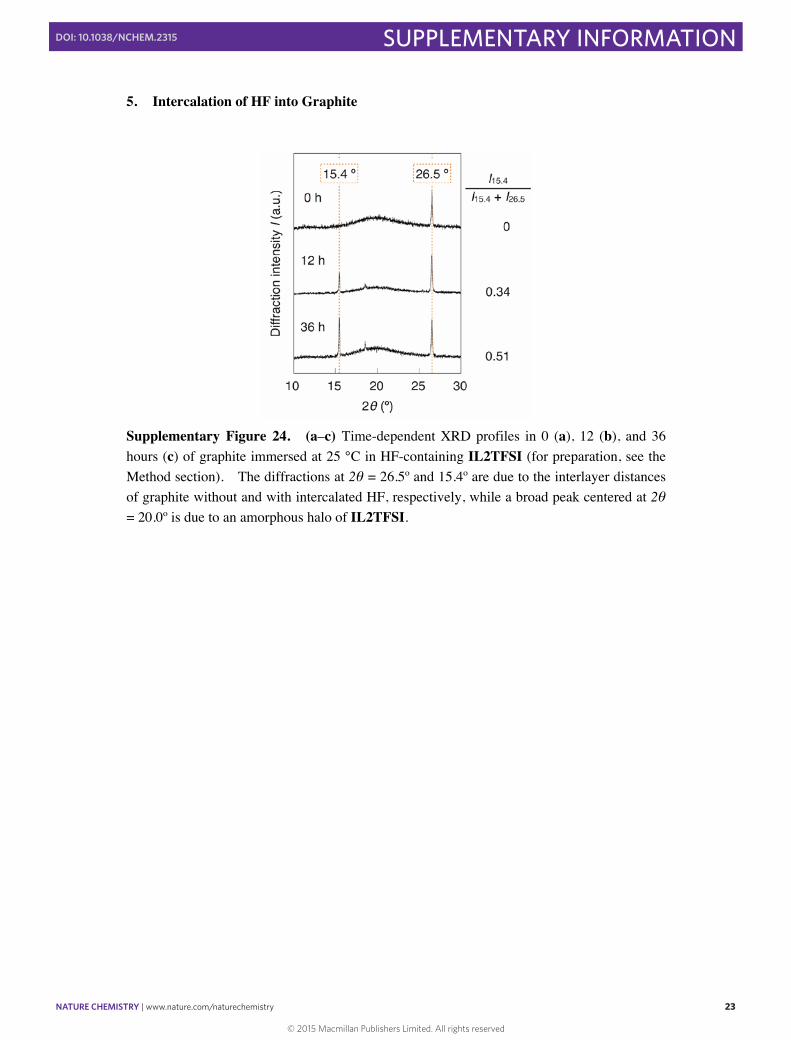
5. Intercalation of HF into Graphite
Supplementary Figure 24. (a–c) Time-dependent XRD profiles in 0 (a), 12 (b), and 36 hours (c) of graphite immersed at 25 °C in HF-containing IL2TFSI (for preparation, see the Method section). The diffractions at 2θ = 26.5º and 15.4º are due to the interlayer distances of graphite without and with intercalated HF, respectively, while a broad peak centered at 2θ = 20.0º is due to an amorphous halo of IL2TFSI.
© 2015 Macmillan Publishers Limited. All rights reserved
NATURE CHEMISTRY | www.nature.com/naturechemistry 24
SUPPLEMENTARY INFORMATIONDOI: 10.1038/NCHEM.2315
S24
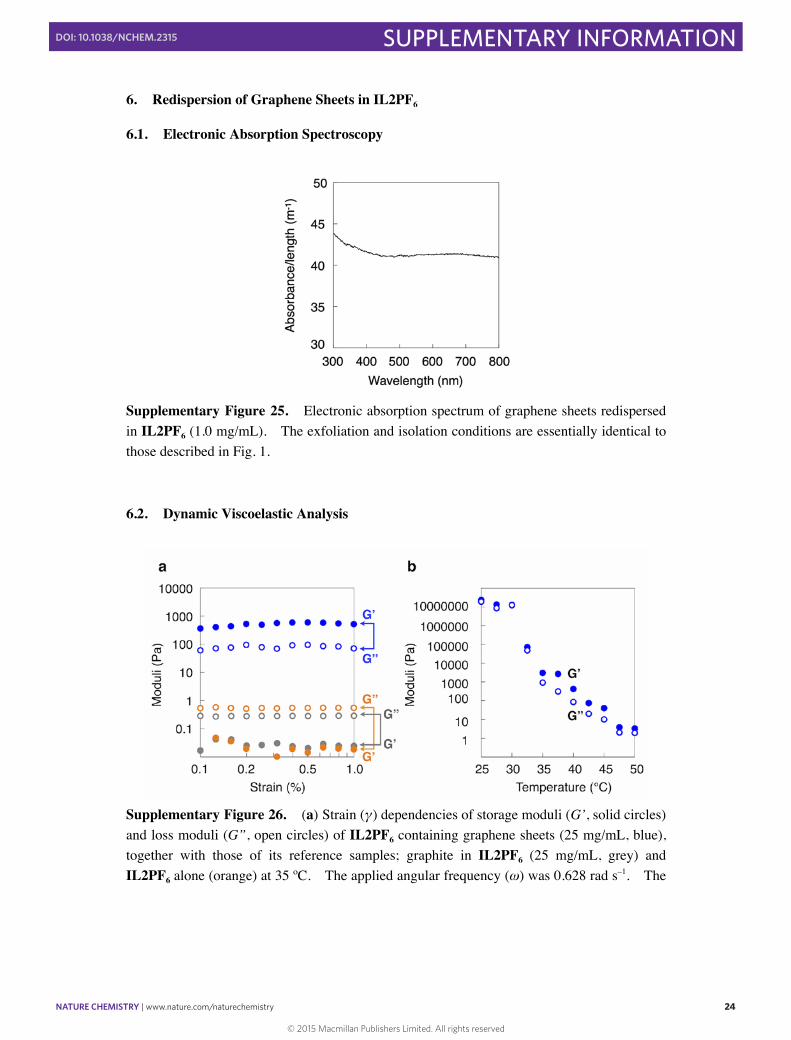
6. Redispersion of Graphene Sheets in IL2PF6
6.1. Electronic Absorption Spectroscopy
Supplementary Figure 25. Electronic absorption spectrum of graphene sheets redispersed in IL2PF6 (1.0 mg/mL). The exfoliation and isolation conditions are essentially identical to those described in Fig. 1. 6.2. Dynamic Viscoelastic Analysis
Supplementary Figure 26. (a) Strain (γ) dependencies of storage moduli (G’, solid circles) and loss moduli (G”, open circles) of IL2PF6 containing graphene sheets (25 mg/mL, blue), together with those of its reference samples; graphite in IL2PF6 (25 mg/mL, grey) and IL2PF6 alone (orange) at 35 ºC. The applied angular frequency (ω) was 0.628 rad s–1. The
© 2015 Macmillan Publishers Limited. All rights reserved
NATURE CHEMISTRY | www.nature.com/naturechemistry 25
SUPPLEMENTARY INFORMATIONDOI: 10.1038/NCHEM.2315
S25
γ sweep was made from lower to higher. (b) Storage moduli (G’, solid circles) and loss moduli (G”, open circles) of IL2PF6 containing graphene sheets (25 mg/mL) at different temperatures. Applied γ and ω were 0.1% and 0.628 rad s–1, respectively. The exfoliation and isolation conditions are essentially identical to those described in Fig. 1.
7. Supplementary References
S1. Gooding, J. J. et al., J. Am. Chem. Soc. 134, 844 (2012). S2. Bara, J. E. Ind. Eng. Chem. Res. 50, 13614 (2011). S3. Countinho, J. A. P. et al., J. Colloid Interface Sci. 314, 621 (2007).
© 2015 Macmillan Publishers Limited. All rights reserved


![molの話 [The Talk about "mol"]](https://img.pdfslide.tips/doc/110x75/548129feb379595e2b8b5cb5/mol-the-talk-about-mol.jpg)