Embed Size (px)
Citation preview

SWEDEN – THE GENDER EQUALITY DELUSION A feminist analysis of the Swedish Government’s 2009 Spring Budget
1
Contents What is gender budgeting?...................................................................................4
The gender order....................................................................................................................... 4 Gender budgeting – a tool ........................................................................................................ 5 Unpaid work ............................................................................................................................. 6 The central government budget ................................................................................................ 6 Our analysis .............................................................................................................................. 6
The 2009 Spring Fiscal Bill...................................................................................7 The Government’s own policy instruments.............................................................................. 7
The main economic policy tasks...........................................................................9 The initiatives presented by the Government ......................................................................... 10 Women don’t exist.................................................................................................................. 10
An “own goal” in gender mainstreaming efforts .............................................11 According to our calculations…............................................................................................. 11 … and what were the results?................................................................................................. 12
What does labour market policy have to do with gender equality?...............13 Inconsistency in Borg’s fortress? ........................................................................................... 13
The activation principle – behind the illusion ..................................................14 Labour market and labour force ............................................................................................. 14 The unemployed - who are they? ........................................................................................... 15 Who is not well established on the labour market? ................................................................ 19 Sickness benefit and activity compensation, to whom? ......................................................... 21
The activation principle – from the director’s chair .......................................23 In-work tax credits – to everyone who has shall more be given ............................................ 23 Effects of increased income distribution ................................................................................ 24 The part-time worker .............................................................................................................. 24 Lower benefit and compensation levels lead to pay flexibility for whom?............................ 25
Paid and unpaid work.........................................................................................25 “Gender equality bonus” as a driving-force ........................................................................... 26 Deductions for household-related services as the driving force............................................. 26 The childcare allowance – a way of valuing unpaid work?.................................................... 27
Summary ..............................................................................................................27
2
Foreword The Swedish Women’s Lobby is a politically and religiously independent umbrella organisation for the Swedish women’s movement. Its work is based on the commitments made by Sweden when it signed the UN Convention on the Elimination of all Forms of Discrimination Against Women (CEDAW) and the Beijing Declaration and Platform for Action from 1995, in which the principle of shared power and responsibility between women and men in all spheres of society is established. One highlighted way of achieving this is to mainstream a gender perspective into all budget decisions and the Platform for Action calls on all governments of the signatory countries to review and adjust their national budgets to ensure equality of access to public sector expenditures. An important task of the Swedish Women’s Lobby is therefore to examine Swedish central government budgets to see whether they have a consistent, visible and well-considered gender equality aware perspective. Behind every figure in a budget, goals and problems have been formulated, perspectives adopted, possible results analysed and measures prioritised. This is an extensive and lengthy task, normally referred to as the “budget process”. In 2004, a long-term plan was adopted in the Swedish Government Offices to drive the gender mainstreaming of, for example, the budget process forward. This plan has been extended and now applies until the end of 2010. The review of the 2009 spring budget discusses whether, in accordance with the plan, a clearly visible and consistent gender perspective has been taken throughout the budget process. A central part of this review procedure, called “gender budgeting”, is to show how resources are distributed between women and men. Particularly attention has therefore been paid to the section in the spring budget dealing with the main economic policy tasks, Chapter 5. With this report, the Swedish Women’s Lobby wishes to promote a fair distribution of society’s resources between women and men. We wish to initiate a discussion on the effects of the budget from a gender equality perspective and help raise awareness of the economic principles and values on which the budget process is based. Stockholm, 22 June 2009 Gertrud Åström President of the Swedish Women’s Lobby
3
What is gender budgeting? “A budget reflects the values of a country – who it values, whose work it values and who it rewards ... and who and what work it doesn’t.” Pregs Govender, ex MP, South Africa
The gender order The current financial crisis is affecting the world’s population. According to the Director-General of the Swedish International Development Cooperation Agency (Sida), Anders Nordström, the crisis is a dramatic setback for equality in the world. Women’s income is decreasing, prostitution and trafficking are on the rise, violence against women is escalating, unpaid work is increasing, and fewer girls are going to school. Nordström’s conclusion is that equal economic opportunities between men and women are crucial if women’s subordinate position is to be broken (www.dn.se). Sweden has concrete goals for its gender equality work. The overarching gender equality goal is for women and men to be equally empowered to shape society and their own lives. One of the four sub-goals is economic gender equality (www.regeringen.se). The reason why we are repeatedly able to establish that women are treated unfairly when resources are distributed can be found in what is known as the “gender order”. The gender order comprises socially constructed attitudes about gender and is built on two logics: the logic of segregation – due to the sex, men and women are positioned in different places and do different jobs; and the logic of hierarchy – the man constitutes the human norm and is therefore superior to the woman. An example of the man being the norm, taken from the education sector: The exam question was: What is the range of motion when the elbow joint is extended? The answer was that the range of motion is 0 degrees, but about 15 degrees overstretching in women and children. Source: “Vidgade perspektiv…” (Widened perspective…), Karolinska Institute, 2006. The gender order pervades the economic system, the family and the political system and constitutes a basic structure in society that affects how working tasks are shared between women and men (both paid and unpaid work) and what compensation women and men receive for the work they do. The result of the effects of the gender order on society is in part constituted by the economic and resource outcome for women and men respectively.
4

Gender budgeting – a tool Gender budgeting is a tool for highlighting gender both in official budgets as well as in the budget process itself. A conscious analysis clarifies not only how resources are allocated to women and men but also to what extent this resource allocation meets their respective needs and preferences. Gender budgeting is a complex analytical tool that enables the resource allocation between women and men to be highlighted in official budgets and in society as a whole. The analysis can be divided up into three different steps. The first step is an analysis of a single activity or budget to determine how the earmarked resources are distributed between women and men and meet their needs and preferences. The second step broadens the scope of the analysis to include complementary activities or resources that are relevant to the context (other budgets, other activities and/or unpaid work). The third step involves questioning basic economic assumptions and concepts. This is about being aware of the fact that the economic system and its definitions and theories have been developed by men for men for centuries. Why, for example, is education expenditure counted as public consumption instead of a public investment in the future? One precondition of being able to conduct gender budget analyses is that there are sufficient sex-disaggregated statistics. Using and analysing sex-disaggregated statistics consistently creates transparency in how public resources are distributed between women and men, girls and boys. “Budgets are never just the result of technical processes based on financial analyses.” Professor Diane Elson Gender budgeting has been carried out in about 60 countries across the globe. Work began in Australia as early as the 1980s. New Zealand, South Africa and Canada have also been pioneer countries. Sixteen paragraphs of the CEDAW Convention from 1979 establish that there shall be equality between women and men in all aspects of life. This implies indirectly that economic resources shall be fairly distributed between the sexes. Not until the establishment of the Platform for Action, the UN’s agenda for women’s empowerment, in 1995 was the decision taken to mainstreaming gender issues into all budgets: “A budget shall have a consistent, visible and well-considered gender perspective that makes it possible to ensure a development towards a gender-equal world.” Platform for Action, 1995 More recently, more and more interest has been shown in gender budgeting by politicians, researchers and NGOs. The European Commission and the Nordic Council of Ministers have both been tackling the issue. Work has also been ongoing within the Swedish Government Offices and the Swedish Association of Local Authorities and Regions (SALAR) is currently supporting gender budgeting initiatives in Sweden’s municipalities and county councils. The International Association for Feminist Economics (IAFFE) is working with the issue and a number of gender budgeting research networks have been formed, including the Nordic-Baltic Network on Gender Responsive Budgeting.
5
Unpaid work The Platform for Action also recommends that the value of unpaid work shall be assessed in quantitative terms in “satellite” or other official accounts that may be produced separately from, though be consistent with, GDP accounts. Throughout the world, women do a significantly greater proportion of unpaid work than men. Even in Sweden, time studies have shown that women do more unremunerated work (e.g. household work and caring for their own children) compared to men. Unpaid work is an important aspect in gender budgeting analyses since, in many areas, it constitutes a complementary resource mainly provided by women. Studies have, for example, shown that men with psoriasis receive their care at the dermatology clinic (paid for from public funds) whilst a greater number of women patients care for themselves in the home (unpaid, self-administered care).
The central government budget The central government budget is divided up into three components: income, expenditure and investment. The design, content and integral parts of the budget are decided on by people for people. There are no activities that do not ultimately affect people, i.e. women and/or men. Budgetary income comes primarily from taxes and charges. These affect women and men in different ways since women and men have different income levels, different levels of ownership and have diverse consumption patterns. Budgetary expenditure consists of, for example, costs for education and healthcare provision. Women and men also differ in these areas as they have different needs and patterns of behaviour. Expenditure also includes transfer payments, such as pensions, child benefit and unemployment benefit, which also demonstrate gender-specific patterns. Budgetary investment comprises, for example, investment in infrastructure and the construction of public facilities and buildings. How society chooses to design its infrastructure and what facilities it chooses to build reflect the priority allocated to people’s needs and preferences. For example, as groups, women and men demonstrate different transport behaviours, and therefore have divergent infrastructure needs.
Our analysis The aim of gender budgeting is to analyse all the different components of the central government budget. In this report, we have conducted a gender budget analysis on some of the Swedish Government’s spring budget. We go through the Government’s policy instruments and test the extent to which they fulfil the Government’s own objectives in Chapter 5 of the spring budget. This chapter is one of the most fundamental in the entire Spring Fiscal Policy Bill as it gives an account of the intended focus of economic policy in Sweden over the next three years. We try to show what we think is missing in the Government’s analyses and put forward proposals for how initiatives in labour market policy and adjacent areas can be analysed from a gender equality perspective. However, gender budgeting also includes analysing the budget process itself from a gender equality perspective. This report forms part of such an analysis.
6
The 2009 Spring Fiscal Bill In its 2009 Spring Fiscal Bill, the Government has established Sweden’s economic policy for the forthcoming years. The Spring Fiscal Bill also includes a supplementary budget with appropriation amendments for the current year, as a complement to the 2009 Budget Bill, which was published in the autumn of 2008. The Budget Bill included about 10 000 pages covering 27 expenditure areas. The 2009 Spring Fiscal Bill, A responsible policy to secure welfare, is much shorter - 199 pages plus four appendices.
The Government’s own policy instruments The Government has two new policy instruments, the Action Programme for gender mainstreaming in the Government Offices 2008 and 2009 (document registration number IJ2008/1048/JÄM) and Revised indicators in the Government’s plan for gender mainstreaming in the Government Offices (document registration number: IJ2009/108/JÄM). These establish how the Government intends to work with gender equlity mainstreaming in the Government Offices during the two years covered by the programme.
A. The action programme The action programme consists of five “performance targets” stating that: 1. The implications of proposals put forward in government bills shall be clarified for both
sexes. 2. Statistics presented in government bills shall be sex-disaggregated throughout. 3. The steering of government agencies, towards gender equality, shall be clearer. 4. Clearer directives specifying in what way a gender equality perspective shall be integrated
into government enquiries. 5. Sweden shall request gender equality impact assessments when negotiating in the EU
Council of Ministers. Responsibility: Cabinet ministers in the Government are responsible for gender equality in their respective policy areas. At each ministry, the top-ranking civil servant is responsible for integrating a gender equality perspective into all the background information produced as a basis for the Government’s decision-making.
B. Indicators The revised Government Offices gender equality mainstreaming indicators consist of four “impact goals” accompanied by measurable indicators. These impact goals are: 1. “Gender equality has an impact on decision-making processes by being integrated into
them in a concrete, consistent and congruent manner.” Four indicators are used to measure this goal.
2. “Administrators and managers at the Government Offices have good knowledge of what gender equality involves, of the gender equality policy goals and of the central gender equality policy issues within their own area.” Two indicators are used to measure this goal.
3. “Gender equality analyses based on, for example, sex-disaggregated statistics and the gender equality policy goals are included in the Government’s basis for decision-making.” One indicator is used to measure this goal.
7

4. “There is efficient coordination of gender equality issues in the Government Offices, which includes support for the co-worker and improvement in the gender mainstreaming efforts of the ministries.” Three indicators are used to measure this goal.
8
The main economic policy tasks A number of quotes from Chapter 5 – The main economic policy tasks are given below in order to highlight what these tasks are: “The task of economic policy is to contribute to high, sustainable growth and employment, general welfare and macroeconomic stability” (p 59) “Since the number of hours worked is central to the GDP level, one of the Government’s most important goals is to ensure that work is remunerative. A well-designed employment policy makes it possible to increase the employment level, which is consistent with stable inflation and economic balance.” (p. 60) “To combat the obstacle created by high marginal and threshold effects /so that the individual chooses to work more/ this is not just an issue of socioeconomic efficiency but also an important distribution issue.” (p. 61) “Between 2006 and 2008, participation in the workforce and employment have increased whilst unemployment and sickness absence have dramatically decreased. In-work tax credits and reforms in unemployment and sickness insurance help to combat long-term unemployment and sickness absence.” (p. 73) (…) “Thirdly, a sustained high level of unemployment is linked to the inflexibility of the pay structure” (p. 73) “The goal to increase employment in the long term remains in place.” (p. 74) “In an economic recession, the best way of safeguarding the activation principle is through an active labour market policy. The most important measures implemented by the Government are the in-work tax credits, amendments to unemployment and sickness insurance systems, the introduction of “new start jobs” and modifications to labour market policy.” (p. 76) “Government reforms, changes in attitude and demographic changes are all significant causes of reduced sickness absence. (p. 77) The chapter also describes the work being done to improve the quality of Sweden’s Labour-Force Surveys.
9
The initiatives presented by the Government According to the Government, most job losses are occurring in the manufacturing industry. Our analysis: This will affect a greater proportion of men than women and is the reason why men run a higher risk of being unemployed than women. The consequences of cuts in the manufacturing industry will, however, soon lead to a substantial reduction in tax income, which, in turn, may lead to further cutbacks in the public sector (similar to developments after the economic crisis of the early 1990s). This will have a substantially adverse effect on the female dominated labour market since women make up a large proportion of the public-sector workforce. In a slightly more long-term perspective, therefore, the risk of unemployment among women will probably be considerable. One of the initiatives taken by the Government to maintain employment and make use of free resources is the reduction in tax on house repair, rebuilding and refurbishment services, known as the “ROT deduction”. This is expected to cause a tax shortfall of SEK 3.5 billion (EUR 338 million) a year. The Government has also decided to invest a further SEK 1 billion (EUR 96.5 million) in road and rail operation and maintenance, in addition to the earlier initiative announced in the 2009 Budget Bill. (p. 75) Our analysis: These are initiatives that mostly support the male dominated labour market. The Government has also temporarily increased the state subsidy to municipalities by SEK 7 billion (EUR 676 million) for 2010 and permanently raised it by SEK 5 billion (EUR 483 million) as from 2011. Our analysis: How this money will be used is uncertain, but it may benefit women more as they constitute a greater proportion (about 79%) of the municipal workforce. It is too early to tell whether this will be the case, however.
Women don’t exist When reading Chapter 5, it appears that, according to the Government, the main economic policy tasks have very little to do with women and men, indeed nothing at all. Some of the sections and certain tables do however refer to the situation for young people, older people and foreign-born individuals, as well as people with a pre-secondary education. The statistics are, however, not broken down by sex and no gender equality analyses are performed.
10

An “own goal” in gender mainstreaming efforts The Government’s Action programme for gender mainstreaming in the Government Offices 2008 and 2009 covers the Offices’ central decision-making processes. The action programme is focused on intensifying and improving the efforts to mainstream gender equality into the budget and legislative process and begin gender equality mainstreaming in EU work. We have established that two of the performance goals in the Government’s action programme are relevant to the analysis of the spring budget. These are: Performance goal 1 “The consequences of proposals put forward in government bills shall, when it is relevant, be presented for each sex respectively. How the proposals affect implementation of the gender equality policy shall also be presented.” The goal in more detail: The goal relates to government bills that contain legislative proposals, appropriation allocations and guidelines. Bills based on international agreements and treaties, as well as on EC law, are exempted from this goal. (…) Performance goal 2 “Any statistics on the individual level in government bills shall be presented and analysed by gender, unless there is particular reason not to do so.” The goal in more detail: The goal applies to the use of statistics in tables and diagrams relating to individuals, i.e. statistics that directly or indirectly concern physical persons. (…) A table that is sex-disaggregated has sex as a constant and overarching basis for classification. (…) Indicators Furthermore, this goal is one of the impact goals included in the Government’s gender equality mainstreaming plan that are relevant to the analysis of the spring budget, namely: Impact goal 1 Gender equality has an impact on decision-making processes by being integrated into them in a concrete, consistent and congruent manner. Indicators Number and proportion of tables/diagrams in the budget bill where individual-based statistics are sex-disaggregated. (…)
According to our calculations… If we look for the term “gender equality” (in Swedish it is a single expression, all forms), it is not mentioned at all. Neither are the words “sex”, “girls” and “boys” (all forms). Women and men are mentioned in ONE sentence on page 70, in connection with the explanation that the unemployment risk is higher for men: “The risk of unemployment among gainfully employed persons was higher for men than for women (2.1% and 1.9 % respectively) in the fourth quarter of 2008. The risk of becoming unemployed is normally higher for young people (15-24 years) than for other age groups. The proportion of gainfully employed young people who became unemployed rose to 7.1% in the fourth quarter of 2008, from 5.1% in the same quarter of 2007.”
11
If we study the ten diagrams, the two tables and the figure, we find that none of them is sex-disaggregated. Two diagrams present the number of people being made redundant and situations vacant, and cannot therefore be broken down by sex but apart from these, the diagrams and tables present the number of people gainfully employed, those unemployed, persons receiving compensation from various social security systems, the number of cases of sickness absence as well as related variables. These are areas where we know the differences between women and men can be significant. Basically all the statistics upon which the diagrams and tables are based are available in sex-disaggregated form. The Ministry of Finance has, however, chosen not to present the data in this way, despite the goals specified in the action programme.
… and what were the results? We can ascertain that in Chapter 5 of its spring budget, the Government does not fulfil its own performance goals 1 and 2 in accordance with the action programme. We can also ascertain that impact goal 1 has not been fulfilled: Zero out of 8 diagrams present sex-disaggregated statistics. Zero out of 2 tables present sex-disaggregated statistics.
12
What does labour market policy have to do with gender equality? On 15 October 2007, Finance Minister Anders Borg gave a presentation in the city of Eskilstuna entitled “Greater gender equality – a prerequisite for growth”. Borg listed the differences in earnings between women and men as well as the significant differences in ownership. The Finance Minister also discussed the unequal distribution of unpaid work (household work, care of own children), most of which is done by women. After this review of the facts, the Finance Minister’s conclusions were that Sweden is not a gender equal country and that only by utilising everyone’s full potential can we create the best conditions for greater growth and a stronger economy. Borg ascertained that changes are required to be able to utilise everyone’s – both women’s and men’s – full potential: “If women’s actual paid work had been the same as men’s, GDP in 2008 would have been about 15% higher, the equivalent of about SEK 500 billion (EUR 48.4 billion).” But how do we promote gender equality for Sweden? According to Borg, this should be done by applying “work feminism”. This implies that we must enable women to work to the same extent as men: - Work shall always be encouraged: low tax on work and more stringent transfer payments - More specialisation in the service sector (e.g. higher deduction when purchasing services and lower employer contributions) - The “gender equality bonus” creates incentives for families to divide their parental leave equally - Accessible, high-quality childcare Furthermore, Borg emphasises how increased gender equality shall be achieved in the private and the public sector: - Employers must actively promote gender equality - More women must, to a greater extent than today, start, run and own companies. But Borg also believes that our personal choices are significant: - Be aware of the fact that our own “choices” are not always conscious ones, but often depend on socially constructed gender roles - Share the responsibility for the home and for the children
Inconsistency in Borg’s fortress? On the one hand, the Ministry of Finance, as is evident in Chapter 5 of the Budget Bill, does not feel that gender is important as regards the main economic policy tasks, including work, employment, the social security system, sickness absence, etc. On the other hand, the Finance Minister feels that an increase in women’s working hours is the key to growth, i.e. that one of the main economic policy tasks is to get women to work more, reduce their sickness absence and increase their labour supply.
13
The activation principle – behind the illusion In the following section, we have supplemented some of the Government’s “gender-blind” diagrams and tables in Chapter 5 by presenting some of the material in sex-disaggregated form. Above all, our aim here is to show how the material should be presented in accordance with the Government’s own guidelines. Sex-disaggregated statistics are a basic prerequisite for being able to perform gender equality analyses. Our figures are not entirely comparable with those of the Ministry of Finance, mostly because the Ministry has seasonally adjusted its calculations, something which we have been unable to emulate. Instead we use annual means throughout.1
The Government stimulates employment mostly by limiting the possibility of receiving compensation when people are looking for work, ill or for some other reason do not have a job. The Government also stimulates employment by giving tax deductions to those who work, in order to encourage them to increase their labour supply and consume more and the Government is investing in tax deductions for certain repair and maintenance work (e.g. the abovementioned ROT deduction), in infrastructure and in larger subsidies to municipalities.
Labour market and labour force Sweden’s salaried labour force, including the self-employed, amounts to 4.5 million people, with women making up 48 percent and men 52 percent of this figure. The income distribution between the gender groups is 40 percent to women and 60 percent to men (Budget Bill, 2008/09:1 Appendix 5, p. 14). In 2008, 66 percent of all employees were in the private sector and 34 percent were in the public sector. Half of the women worked in the private sector and half in the public sector. Substantially more men worked in the private sector (80 percent) than in the public sector (20 percent). The public sector is dominated by women, 74 percent of employees being female and 26 percent being male. The private sector is dominated by men, 62 percent of employees being male and 38 percent being female (www.scb.se). The Government’s Spring Budget presents the labour market without any sex-disaggregated figures.
1 Furthermore as regards diagrams and tables in general in all series as from 2005, a different unemployment concept is used leading to a major break in the series where the Labour Force Surveys are the source. Two major changes have taken place, affecting comparability: From 2005 onwards, the entire questionnaire was adjusted in line with international requirements, and in October 2007 the definition of unemployment was changed. The data is linked backwards so that the data from 2005 onwards is comparable. Please note also that both the scale division and the index year can differ.
14
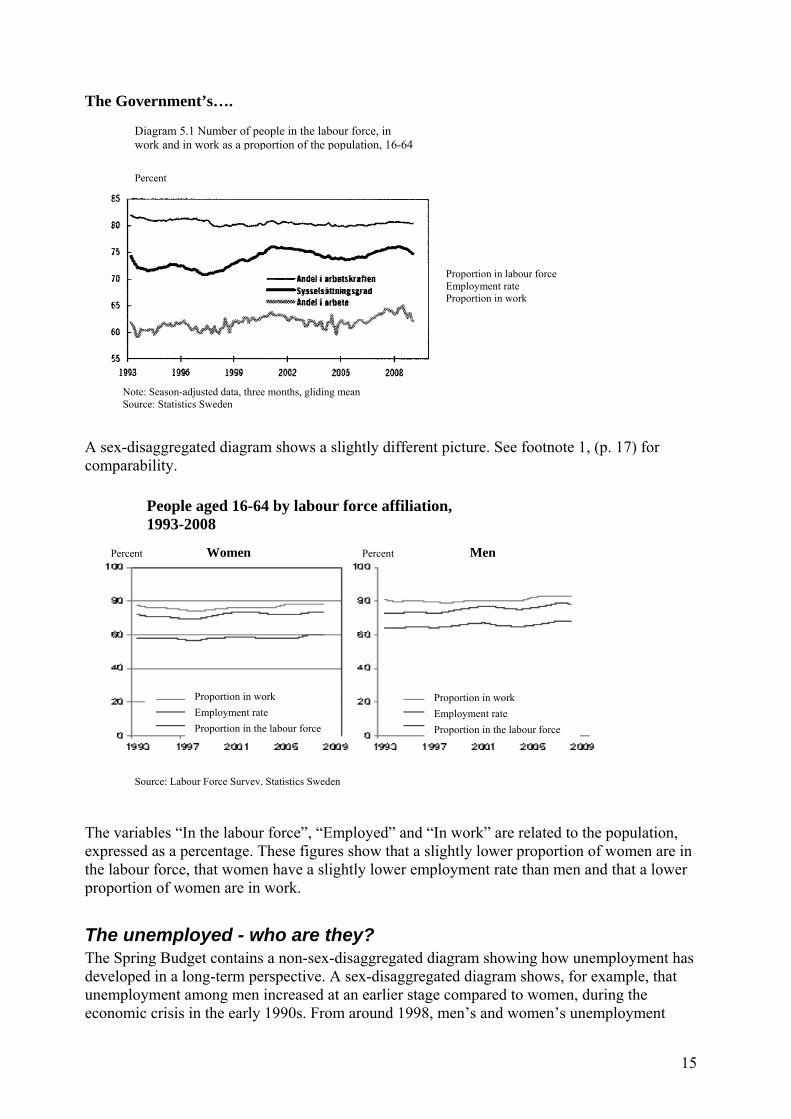
The Government’s….
Diagram 5.1 Number of people in the labour force, in work and in work as a proportion of the population, 16-64
Percent
Proportion in labour force Employment rate Proportion in work
Note: Season-adjusted data, three months, gliding mean Source: Statistics Sweden
A sex-disaggregated diagram shows a slightly different picture. See footnote 1, (p. 17) for comparability.
Percent PercentWomen
People aged 16-64 by labour force affiliation, 1993-2008
Men
Proportion in work Employment rate Proportion in the labour force
Proportion in work Employment rate Proportion in the labour force
Source: Labour Force Survey, Statistics Sweden
The variables “In the labour force”, “Employed” and “In work” are related to the population, expressed as a percentage. These figures show that a slightly lower proportion of women are in the labour force, that women have a slightly lower employment rate than men and that a lower proportion of women are in work.
The unemployed - who are they? The Spring Budget contains a non-sex-disaggregated diagram showing how unemployment has developed in a long-term perspective. A sex-disaggregated diagram shows, for example, that unemployment among men increased at an earlier stage compared to women, during the economic crisis in the early 1990s. From around 1998, men’s and women’s unemployment
15
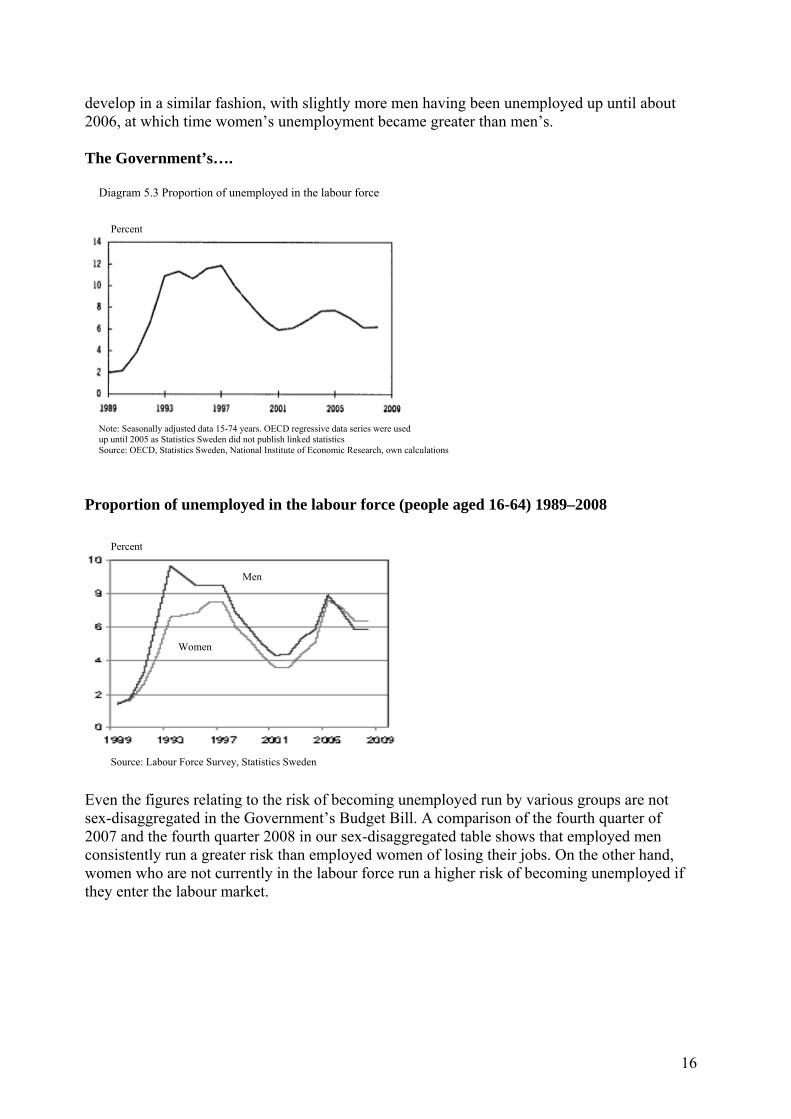
develop in a similar fashion, with slightly more men having been unemployed up until about 2006, at which time women’s unemployment became greater than men’s. The Government’s….
Diagram 5.3 Proportion of unemployed in the labour force
Percent
Note: Seasonally adjusted data 15-74 years. OECD regressive data series were used up until 2005 as Statistics Sweden did not publish linked statistics Source: OECD, Statistics Sweden, National Institute of Economic Research, own calculations
Proportion of unemployed in the labour force (people aged 16-64) 1989–2008
Percent
Men
Women
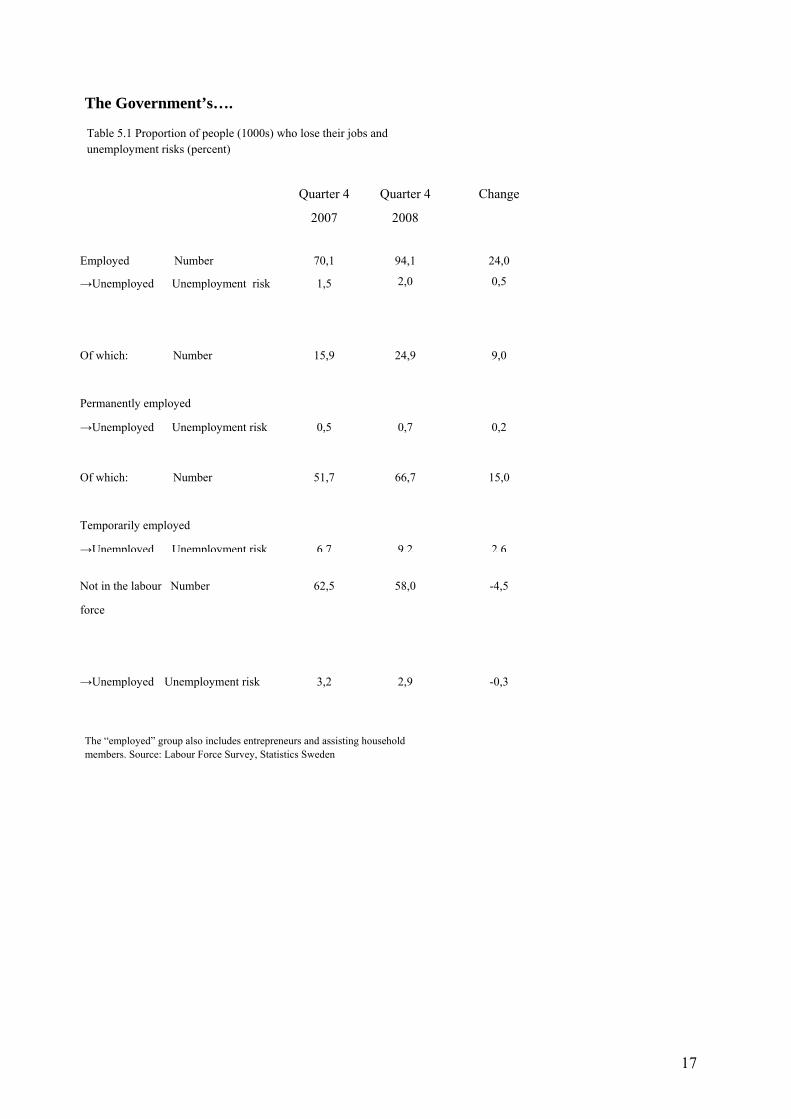
Source: Labour Force Survey, Statistics Sweden Even the figures relating to the risk of becoming unemployed run by various groups are not sex-disaggregated in the Government’s Budget Bill. A comparison of the fourth quarter of 2007 and the fourth quarter 2008 in our sex-disaggregated table shows that employed men consistently run a greater risk than employed women of losing their jobs. On the other hand, women who are not currently in the labour force run a higher risk of becoming unemployed if they enter the labour market.
16
The Government’s….
Table 5.1 Proportion of people (1000s) who lose their jobs and unemployment risks (percent)
Quarter 4
2007
Quarter 4
2008
Change
mployed Number
yment risk
70,1
94,1
2,0
24,0
0,5
f which: Number
Unemployed Unemployment risk
15,9
0,5
24,9
0,7
9,0
0,2
E
→Unemployed Unemplo
1,5
O
Permanently employed
→
Of which: Number
Temporarily employed
→ Unemployment risk
Unemployed
51,7
6,7
66,7
9,2
15,0
2,6
Not in the labour Number
force
ployed Unemployment risk
3,2
2,9
-0,3
he “employed” group also includes entrepreneurs and sisting householdtatistics Sw
→Unem
62,5
58,0
-4,5
T as members. Source: Labour Force Survey, S eden
17
…and a sex-disaggregated table gives the following figures.
roportion of people (1000s) who lose their jobs and unemployment risks (percent), sex-disaggregated.
Quarter 4
2007
Quarter 4
2008
Change
Employed Number
→Unemployed Unemployment risks
f which:
33
,5
42 ,9
1,9 2,1
,6 15,5
,4 0,6
26,7 25,0
33,0 33,7 3,3 8,7
ot in the labour force Number 37,7 24,8 34,4 23,6 -3,3 -1,2
P
W M W M W M
,6 36,4
1,5 1
,2 51
8
0
o Permanently employed Number →Unemployed Unemployment risk
6,5 9,4
0,4 0,5
8,3 16,5
0,5 0,9
1,8 7,1
0,1 0,4
Temporarily employed Number →Unemployed Unemployment risk
6,1 7,4
8,0 10,8
1,9 3,4
N
→Unemployed Unemploy ent riskm 3,6 2,8 3,2 2,6 -0,4 -0,2
The “employed” group also includes entrepreneurs and assisting household
embers. Source: Labour Force Survey, Statistics Sweden m
18
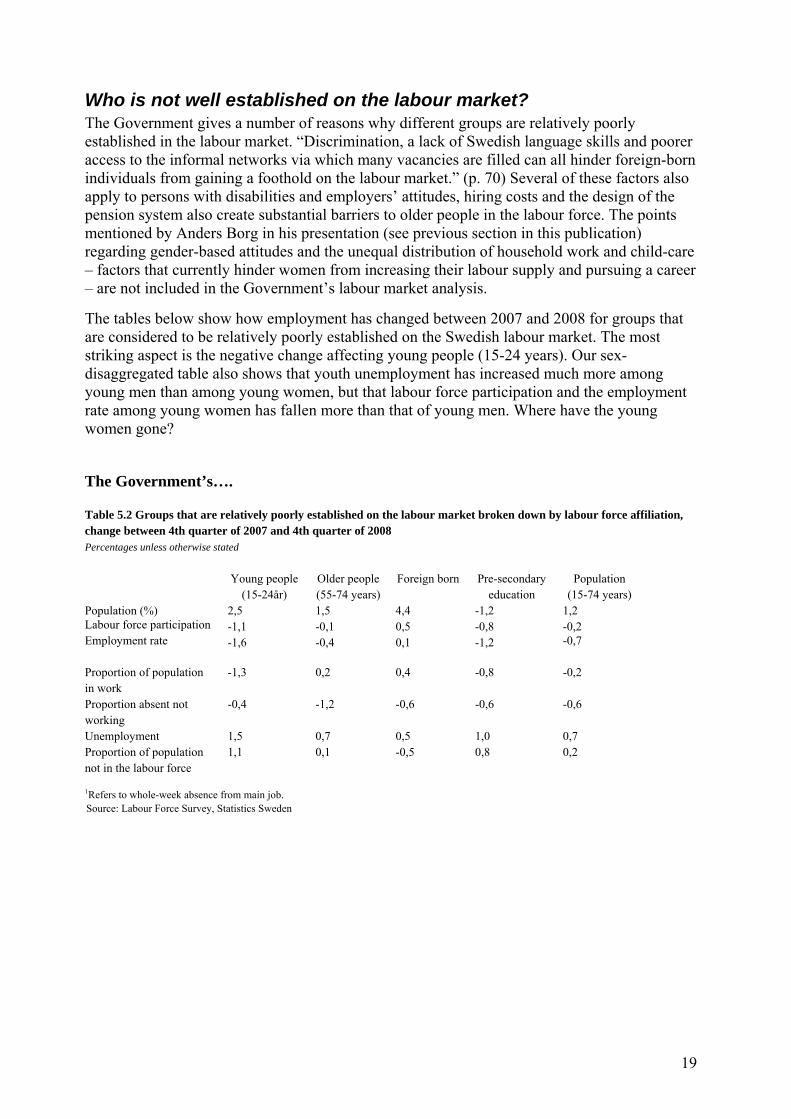
Who is not well established on the labour market? he Government gives a number of reasons why different groups are relatively poorly stablished in the labour market. “Discrimination, a lack of Swedish language skills and poorer ccess to the informal networks via which many vacancies are filled can all hinder foreign-born
rom gaining a foothold on the labour market.” (p. 70) Several of these factors also pply to persons with disabilities and employers’ attitudes, hiring costs and the design of the
also create substantial barriers to older people in the labour force. The points entioned by Anders Borg in his presentation (see previous section in this publication) garding gender-based attitudes and the unequal distribution of household work and child-care
factors that currently hinder women from increasing their labour supply and pursuing a career are not included in the Government’s labour market analysis.
he tables below show how employment has changed between 2007 and 2008 for groups that re considered to be relatively poorly established on the Swedish labour market. The most riking aspect is the negative change affecting young people (15-24 years). Our sex-isaggregated table also shows that youth unemployment has increased much more among
young men than among young women, but that labour force participation and the employment re have the young
ucation (15-74 years) Population (%) 2,5 1,5 4,4 -1,2 1,2
1,5 0,7 0,5 1,0 0,7 roportion of population ot in the labour force
1,1 0,1 -0,5 0,8 0,2
main job. urce: Labour Force Survey, Statistics Sweden
Teaindividuals fapension systemmre––
Tastd
rate among young women has fallen more than that of young men. Whewomen gone? The Government’s…. Table 5.2 Groups that are relatively poorly established on the labour market broken down by labour force affiliation, change between 4th quarter of 2007 and 4th quarter of 2008 Percentages unless otherwise stated Young people
(15-24år) Older people (55-74 years)
Foreign born Pre-secondary ed
Population
Labour force participation -1,1 -0,1 0,5 -0,8 -0,2 Employment rate -1,6 -0,4 0,1 -1,2 -0,7
Proportion of population in work
-1,3 0,2 0,4 -0,8 -0,2
Proportion absent not working
-0,4 -1,2 -0,6 -0,6 -0,6
Unemployment Pn
1 efers to whole-week absence fromRSo
19
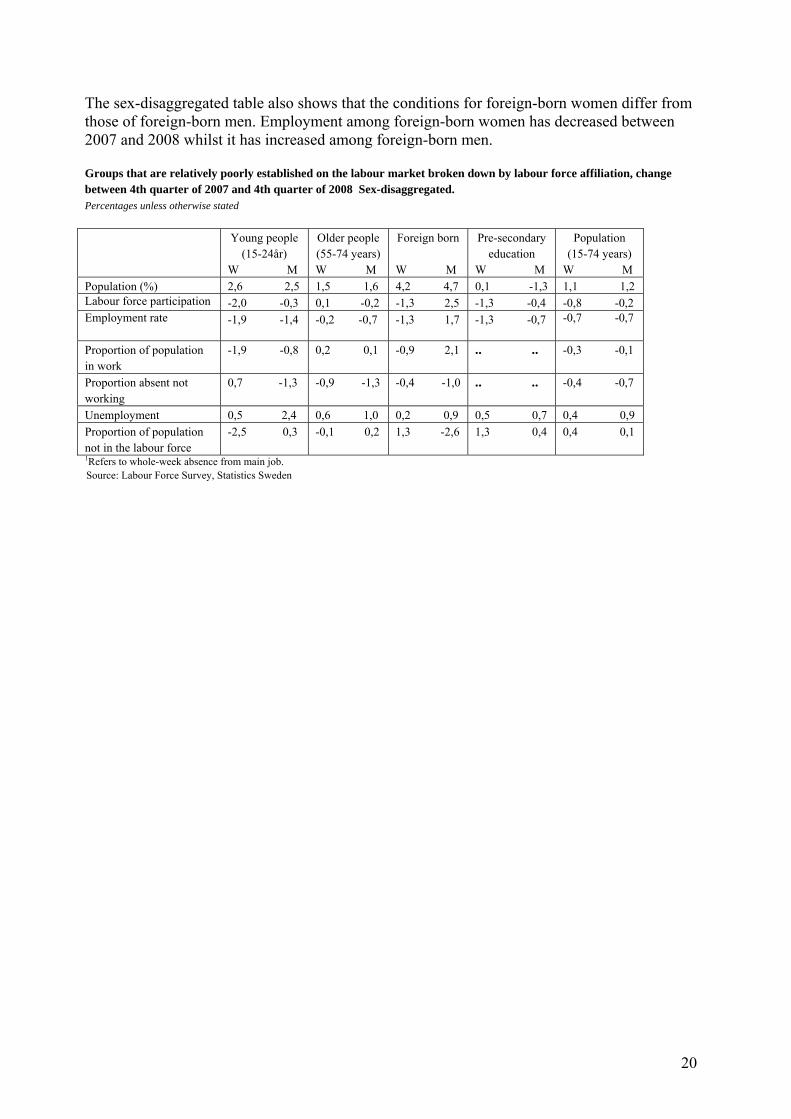
The sex-disaggregathose o
ted le also sh e conditions for foreign-born women differ from f foreign-born men. Employment among foreign-born women has decreased between
ong for
hat are relatively poorly established on the labour market broken down by labour fo e affiliation, change Sex-disaggregated.
otherwise sta
Young people (15-24år)
W M
Older people (55-74 years) W M
Foreign born W M
Pre-secondary education
W M
Population ears)
W M
tab ows that th
2007 and 2008 whilst it has increased am Groups t
eign-born men.
rcbetween 4th quarter of 2007Percentages unless
and 4th quarter ofted
2008
(15-74 y
Population (%) 2,6 2,5 1,5 1,6 4,2 4,7 0,1 -1,3 1,1 1,2 Labour force participation -2,0 -0,3 0,1 -0,2 -1,3 2,5 -1,3 -0,4 -0,8 -0,2 Employment rate -1,9 -1,4 -0,2 -0,7 -1,3 1,7 -1,3 -0,7 -0,7 -0,7
Proportion of population
work -1,9 -0,8 0,2 0,1 -0,9 2,1 .. .. -0,3 -0,1
inProportion absent not
orking 0,7 -1,3 -0,9 -1,3 -0,4 -1,0 .. .. -0,4 -0,7
wUnemployment 0,5 2,4 0,6 1,0 0,2 0,9 0,5 0,7 0,4 0,9 Proportion of population
ot in the labour force -2,5 0,3 -0,1 0,2 1,3 -2,6 1,3 0,4 0,4 0,1
n1Refers to whole-week absence from main job. Source: Labour Force Survey, Statistics Sweden
20
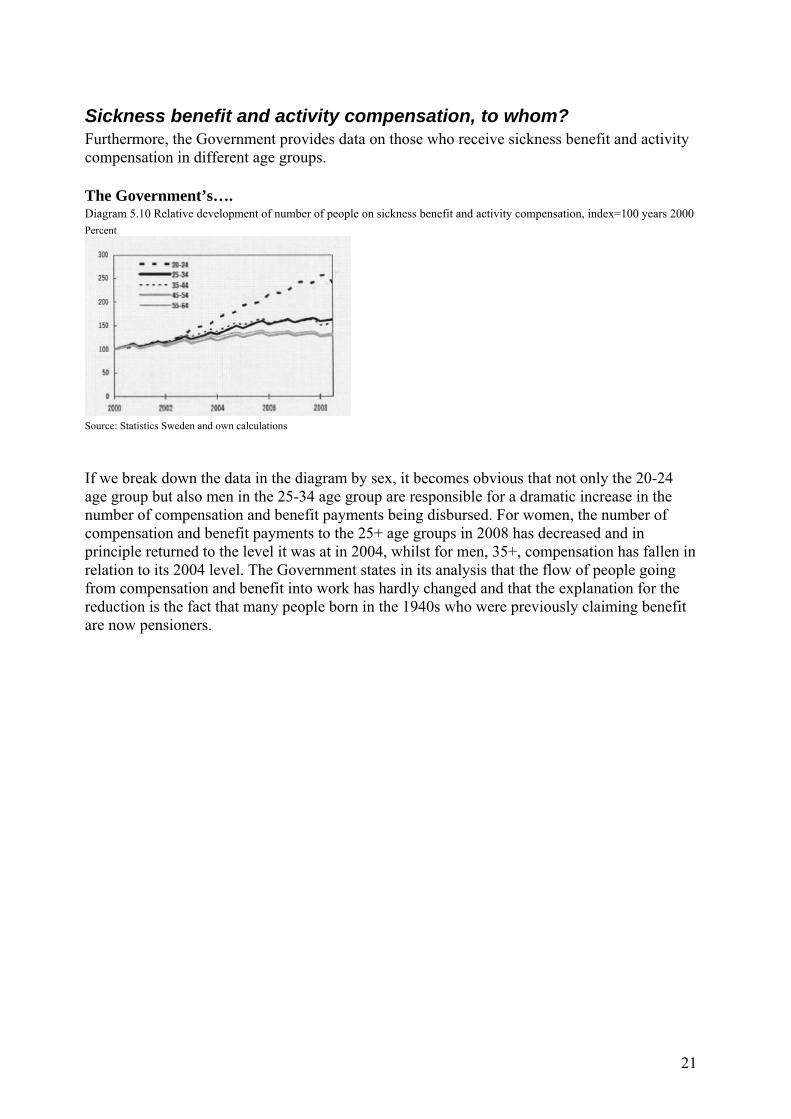
Sickness benefit and activity compensation, to whom? Furthermore, the Government provides data on those who receive sickness benefit and activity compensation in different age groups.
The Government’s…. Diagram 5.10 Relative development of number of people on sickness benefit and activity compensation, index=100 years 2000 Percent
Source: Statistics Sweden and own calculations If we break down the data in the diagram by sex, it becomes obvious that not only the 20-24 age group but also men in the 25-34 age group are responsible for a dramatic increase in the number of compensation and benefit payments being disbursed. For women, the number of compensation and benefit payments to the 25+ age groups in 2008 has decreased and in principle returned to the level it was at in 2004, whilst for men, 35+, compensation has fallen in relation to its 2004 level. The Government states in its analysis that the flow of people going from compensation and benefit into work has hardly changed and that the explanation for the reduction is the fact that many people born in the 1940s who were previously claiming benefit are now pensioners.
21
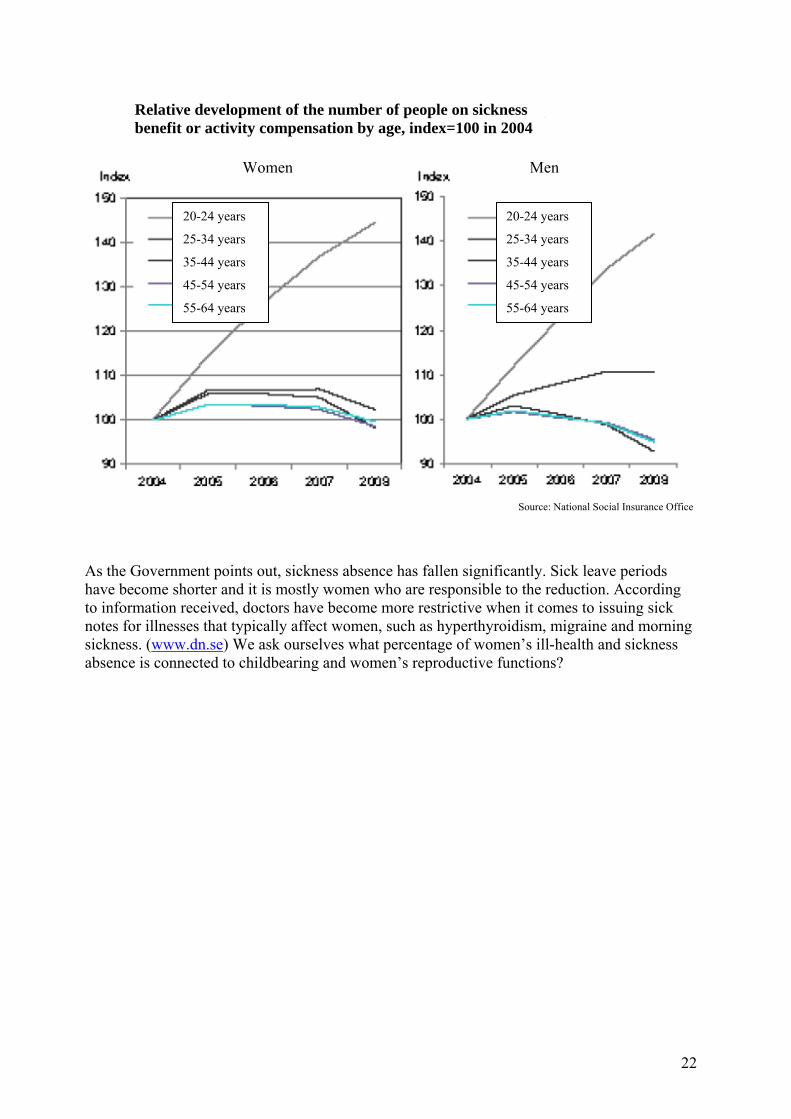
MenWomen
Relative development of the number of people on sickness benefit or activity compensation by age, index=100 in 2004
20-24 years
25-34 years
35-44 years
45-54 years
55-64 years
20-24 years
25-34 years
35-44 years
45-54 years
55-64 years
Source: National Social Insurance Office
As the Government points out, sickness absence has fallen significantly. Sick leave periods have become shorter and it is mostly women who are responsible to the reduction. According to information received, doctors have become more restrictive when it comes to issuing sick notes for illnesses that typically affect women, such as hyperthyroidism, migraine and morning sickness. (www.dn.se) We ask ourselves what percentage of women’s ill-health and sickness absence is connected to childbearing and women’s reproductive functions?
22
The activation principle – from the director’s chair Central government expenditure for labour market policy has changed markedly as a result of the economic crisis. After the change in government in 2006, the new government tightened its belt as regards labour market initiatives, by, for example, reducing compensation payments and educational programmes. But this area of expenditure has begun to rise again, by 47 percent between 2008 and 2009, and is now back at its 2005 level. Alongside infrastructure initiatives and ROT deductions, the Government also stresses the value of its new start jobs in the Spring Fiscal Bill. These have been introduced in two stages – in 2007, private companies were offered new start jobs, i.e. to hire a job-seeker and have the employer contributions paid for the same amount of time the job-seeker had been out of work. This resulted in about 70 percent of the jobs going to men. In 2008, new start jobs were also introduced to public-sector employers, in order to, for example, increase the opportunities for women. In May 2008, however, the Swedish Employment Agency stated that the majority of the jobs, 65 percent, were still going to men, and 35 percent to women, representing very little change at all.
In-work tax credits – to everyone who has shall more be given The Government’s three-step in-work tax credit scheme reduces tax on the gainfully employed by almost SEK 70 billion (EUR 6.8 billion) in total. The Government’s aim is to ensure that part-time workers have relatively speaking more money left in their wallets for every extra hour they work. The closer they get to full-time employment, the less the relative rise in tax, although when seen as a whole, the initiative is a tax reduction for all those gainfully employed. About 75 percent of part-time workers in Sweden are women and 25 percent are men (Statistics Sweden 2006), a fact the Government is aware of and draws the conclusion that the new system will therefore mostly benefit women. In August 2008, the Swedish Riksdag’s Research Service analysed proposals for tax and expenditure amendments put forward by the Government for 2009, the most substantial being the expenditure for the third step of in-work tax credit scheme. In total, proposals for reduced income, per year, for central government and municipalities of SEK 18.4 billion (EUR 1.78 billion) have been put forward. The amendments included in the analysis are: 1. Tax reduction, 3rd step of the in-work tax credit scheme 2. Increased basic deduction for pensioners 3. Increased limit for when travel costs between the home and workplace may be deducted
(from SEK 8 000 to SEK 9 000 [EUR 777 to EUR 873]) 4. Increase in self-financing of unemployment insurance 5. Increase in the norm for an adequate living standard in the elderly care support scheme and
special accommodation allowance for pensioners 6. Increase in the subsistence level when establishing elderly care fees
Of the total amendment amount, 56.5 percent goes to men and 43.5 percent to women. Men as a group receive SEK 10.2 billion (EUR 990 million) and women receive SEK 7.8 billion (EUR
23
758 million). Men as a group therefore receive SEK 2.4 billion (EUR 232 million) more than women as a group.
Every man receives an average of SEK 3 000 (EUR 291) more in net income and every woman an average of SEK 2 300 (EUR 223) more in net income. The amount is not distributed equally among the various income groups, however. There is also a marked difference in how the total change in income is distributed within the “women” group and “men” group respectively. The Research Service’s calculation shows that about 45 percent of the funds (SEK 18.4 billion [EUR 1.79 billion]) goes to the top 20 percent highest income-earning taxpayers. In addition, over 70 percent of this amount goes to men. The consequence of the tax reductions is therefore that a third of the SEK 18.4 billion (EUR 1.79 billion) goes to just under a tenth of the population that consists solely of men. Calculated per person, the 672 000 of the taxpaying men (equals 10 % of the group) with the highest incomes in Sweden receive SEK 8 800 (EUR 855) each per year, from the tax reduction and the 672 000 of the taxpaying women (equals 10 % of the group) with the highest incomes in Sweden receive SEK 3 600 (EUR 350) each per year, from the tax reduction. (Swedish Riksdag Research Service)
Since steps one and two of the in-work tax credit scheme are constructed according to the same principles as the proposed third step, a substantial shift in resources in accordance with the abovementioned principles already took place when steps two and three were implemented.
Effects of increased income distribution If we wish to stimulate consumption, it is sensible to increase disposable income for the lowest earners as they will consume a greater proportion of their disposable income. High-income earners tend, on the other hand, to save a greater proportion of any additional increase in income. As we have seen, a greater share of the extra disposable income has gone to men who are already on high incomes, leading to increased saving. The fact that 20 percent of the population’s highest earners have benefited from nearly half the increase in income, as a result of tax cuts, is extremely problematic as regards the prospect of stimulating the economy.
The part-time worker As the Government writes in its budget bill and the Finance Minister states in his presentations, part-time working women are a resource that the Government wishes to mobilise.
In 2006, 36 percent of the total number of employed women worked part-time (up to 34 hours a week). The majority of these part-time workers, 85 percent, worked between 20 and 34 hours a week. Four percent of women and two percent of men worked less than 20 hours a week in 2007. But among the approximately 248 000 who said they were underemployed in 2008, i.e. those who wished to work more, women were in the majority – 64 percent compared to 36 percent of men.
A great deal of part-time work is involuntary. The Government discusses this in its Spring Budget and ascertains that it is mostly women who state that they wish to work more.
There are many reasons why women work part-time. One is that women often perform more unpaid care work (take care of the home, family and close relatives). This is a huge responsibility, which according to stress researchers, demands a great deal of the women’s energy; indeed, when women come home, their stress levels rise whereas those of men fall. One cause for women’s involuntary part-time work lies in the way some businesses are structured. An explanation for this can be found in a report by Hartman Part-time welfare
24
(Hartman, L. 2008). As an effect of women previously asking for part-time work within certain female-dominated professions and industries (before public childcare, etc., became widely available), such industries may have adapted themselves to part-time work. In addition, employers who are in need of a very flexible workforce only offer hourly-paid or part-time work. The Government also refer to the abovementioned report in Appendix 5 of Government Bill 2008/09:1, albeit applying a slightly different interpretation: “There are signs indicating that the possibility of receiving part-time unemployment benefit makes it more difficult for those who work part-time to find a full-time job.” In light of this interpretation, the Government are introducing changes to part-time unemployment benefits: “In order to prevent mostly women ending up in long-term part-time unemployment, the right to part-time unemployment benefit is being restricted in the unemployment insurance system.” (p 14 Budget Bill 2008/09:1). In the same breath as the Government claims that it is mostly women who say they wish to work more, they are punished by receiving lower benefits and the responsibility for solving their structural problems is placed firmly on women’s shoulders.
Lower benefit and compensation levels lead to pay flexibility for whom? We wish to point out that lower unemployment benefit levels do not automatically lead to the creation of more jobs, but they do lead to an increase in labour supply. An increased labour supply, i.e. greater competition for existing jobs, will drive down salaries for the lowest educated (according to Lars Calmfors, Dagens Nyheter, 7 September 2005).
From a gender equality perspective, we strongly question the assumption that salaries will only be driven downwards for the lowest educated. As far as Sweden is concerned, this would mean that men would be more exposed to this increased competition and downward pay spiral as men constitute nearly 60 percent of the pre-secondary educated labour force (about 18 percent of men and 12 percent of women in the total labour force have only pre-secondary education, and 40 percent of women and 32 percent of men have post-secondary education). At the same time, we see that the general pay level is more dependent on the type of work men perform and within which sectors this work is done rather than on the level of education. Traditionally male working tasks and male-dominated professions are consistently valued more highly than traditionally female working tasks and female-dominated professions (Statistics Sweden, 2006). This is also confirmed by the fact that women are overrepresented among over-educated people doing low-qualified jobs and “men are overrepresented in the “undereducated” group, i.e. men tend to have jobs that require a higher level of education than they possess” (Nyberg 2005).
Paid and unpaid work Here lies part of the crux of the gender inequality issue. We differentiate in society between different types of work, and work classified as “gainful employment” has a value attached to it and provides a remunerative salary. Salary is then used as a basis to calculate different transfer payments such as unemployment benefit, sickness benefit and pensions. Time use studies show that women and men devote the same amount of time to work each day. But a greater proportion of women’s work is outside the framework for what society has defined as gainful employment and is hence not valued. The tasks and duties included by a government in its definition of gainful employment are not fixed. For example, Sweden has elected to define many childcare activities as gainful employment, whereas in other countries, many of these belong to the unsalaried sector.
25
In addition to pay discrimination, women in Sweden also receive lower income despite them devoting the same amount of time to work as men do. And since compensation payments within the social insurance system are based on earned income, women also get lower benefits and compensation in the transfer payment system.
A first step for the Government should be to highlight unpaid work, understand its value to society and create driving-forces that lead to women and men sharing unpaid work equally, in accordance with the Government’s own gender equality policy goals.
“Gender equality bonus” as a driving-force Women currently use nearly 80 percent of the parental leave entitlement, and men use just over 20 percent. 1995 saw the introduction of an individualisation of parental leave, so that 30 days were earmarked for each parent respectively. In 2002, this individual period was increased to 60 days. The National Social Insurance Office reports that this second “daddy/mummy month” has had an effect and the proportion of children whose fathers have claimed at least two months’ of parental allowance has increased from 30 percent to 52 percent (www.forsakringskassan.se).
The gender equality bonus was one of the Government’s major gender equality initiatives in the 2008 Budget Bill in order to get parents to share the parental leave equally between themselves. It was aimed at the person in the household who earned the least and who would therefore take out the majority of the parental allowance. The aim is to give this person the opportunity to reduce the tax on the income they earn during the period when their higher-earning partner is on parental leave.
The result of the gender equality bonus for 2008 showed that seven people had been approved for the bonus and received between SEK 100 and SEK 1 800 (EUR 9.71 and EUR 175) in bonus during 2008. An estimated 20 000 people will receive the bonus in 2009 rising to 40 000 the year after. When fully utilised, the system is expected to cost central government several hundred thousand kronor. (www.forsakringskassan.se)
Deductions for household-related services as the driving force One measure chosen by the Government to relieve the burden of women in the home and/or increase the labour supply of part-time working women is to subsidise certain household-related services. This constitutes an ideological issue in the general debate, but there is no question that it transfers a number of hours worked from the unpaid (and perhaps illegal) sector to paid hours, which would then be included in Sweden’s GDP. One hour of tax-subsidised household-related service corresponds to one hour’s work at a monthly salary of SEK 25 000 (EUR 2 430) (2007). In practice, however, the target group consists of only 25 percent of the working women, but about 50 percent of the working men (i.e. people with a registered salary of SEK 25 000 (EUR 2 430) per month or more). The question is whether this initiative will lead to men taking greater responsibility for household work, as prescribed by the gender equality policy goals.
The outcome of the deduction for household-related services in 2007 shows that it was utilised by 57 percent women and 43 percent men. A third of those who utilised the deduction were over 64 years of age. (www.scb.se)
26
A significant part of the tax subsidy for household-related services has therefore gone to individuals of retirement age, which means they have made no obvious contribution to increasing the labour supply of women. We call for figures showing how many single parents, both women and men, have utilised the deduction.
The childcare allowance – a way of valuing unpaid work? The childcare allowance was introduced in 2008 and gives parents who do not make use of municipal childcare services a tax-free, non-pensionable premium of SEK 3 000 (EUR 291). The childcare allowance is a municipal responsibility. As of summer 2009, no follow-up of how the childcare allowance has been designed or used by Sweden’s municipalities has been performed. In a recent bill, however, the Government has decided to task Statistics Sweden to survey and analyse the effects of the childcare allowance. This analysis is a matter of the utmost urgency.
Summary We have analysed Chapter 5 of the 2009 Spring Budget Bill, The main economic policy tasks, from a gender equality perspective. Our results show that the Government is not fulfilling its own goals. The relevant statistics are not sex-disaggregated and the consequences of the policies pursued have not been analysed from a gender equality perspective. Our analyse shows, for example, that the labour market policy pursued by the Government, reduced benefits and compensation as a driving force for work, might work for long-term unemployed men. On the other hand, many part-time working women state that they would like to work more and we therefore believe that economic incentives such as tax cuts and lower benefits do not solve this problem. The reasons for this lie in the structure of the labour market and of businesses. Another reason for women’s part-time work is that a major proportion of men do not do their allotted share of household and care work. This is not compatible with the gender equality policy goals. An analysis by the Swedish Riksdag’s Research Service shows how the Government’s tax cuts increase income gaps. The proposals for tax cuts for 2009 of SEK 18.4 billion (EUR 1.79 billion), presented by the Government in 2008, will lead to about a third of this sum (SEK 6.1 billion) ending up in the pockets of the top ten percent highest male income-earners in the population.
27
The Swedish Women’s Lobby is a politically and religiously independent umbrella organisation for the Swedish women’s movement. There are over 35 member organisations under this umbrella, all of whom work to strengthen women’s position in society.
The Swedish Women’s Lobby was founded in 1997, under the name the Joint Action Forum for Women in Sweden. The organisation was tasked with mustering the forces of the Swedish women’s movement to give it a stronger voice in the work to promote women’s democratic prerequisites and life conditions in society.
The Swedish Women’s Lobby is founded on a feminist platform and promotes women’s full human rights. Its activities are based on the UN Convention on the Elimination of All Forms of Discrimination Against Women (CEDAW) and the Beijing Platform for Action. The organisation works to ensure that a women’s perspective is mainstreamed into all political, social and economic contexts. The work is primarily aimed at decision-makers and those in power.
The Swedish Women’s Lobby is the Swedish branch of the European Women’s Lobby (EWL) and participates as an NGO representative in the Swedish Government Delegation to the UN Commission on the Status of Women (CSW).
Does you organisation wish to be a member or know more about us? Please contact the central office on +46 8 335247 or send an email to [email protected]
Read more at www.sverigeskvinnolobby.se
28
Brief presentation of the authors Ingrid Osika Ingrid is an economist by trade and is currently working for Västerbotten County Council analysing prioritisation processes from a gender perspective. Ingrid also works at Karolinska Institutet conducting research into gender equality in the Swedish health service. She has previously worked with these issues and with gender budgeting for Stockholm County Council. Ingrid was the author of the much-discussed research report “The laundry bag project – gender differences to the very skin” and was the editor of a handbook entitled “Women in the world’s most equal country” in 2008. Anna Klerby Anna is a PhD student of economics at Högskolan Dalarna and Örebro University and also works with operational analysis at Riksteatern. Anna previously performed gender equality analyses of publicly financed dramatic art both for the Swedish Arts Council and as part of a government inquiry into gender equality in dramatic art called “Plats på scen” (Now on stage) (SOU 2006:42). Anna began her career at Stockholm County Council where her task was to analyse the Council’s cultural grants activities from a gender equality perspective and carry out knowledge initiatives in the healthcare sector. Ingrid Osika and Anna Klerby have produced two previous reports for the Swedish Women’s Lobby on gender budgeting: The Swedish Government’s 2007 Spring Budget – a gender-aware analysis and Money now! A handbook on gender budgeting. © Swedish Women’s Lobby 2009 Authors: Ingrid Osika, Anna Klerby Graphic design: Fresh Design Printed by: Täbykopia AB ISBN: 978-91-978283-0-7
29