Embed Size (px)
Citation preview
TABLE OF CONTENTS
Abbreviations…….......……………………………………………..………………………………………………4-5Acknowledgements…...……………………………………………………………………………………………6Introduction & Highlights………….…………………………………………………………………………………7-11Surveillance and Laboratory Testing Methods…………….…………………………………………………… 12-14Interpretive Criteria…………………………………………………………………………………………………15-16
PREVALENCE DATA
Percent Positive SamplesSite and Bacterium, 2002-2012...……………....…………………………………………………………………17-20Bacterium and Meat Type, 2002-2012….……….......……………………………………………………………21Salmonella & Campylobacter by Meat Type, 2002-2012….….……………………………………………… 22 SALMONELLA DATA
Salmonella by Serotype and Meat Type, 2012………………………………………………………………… 23
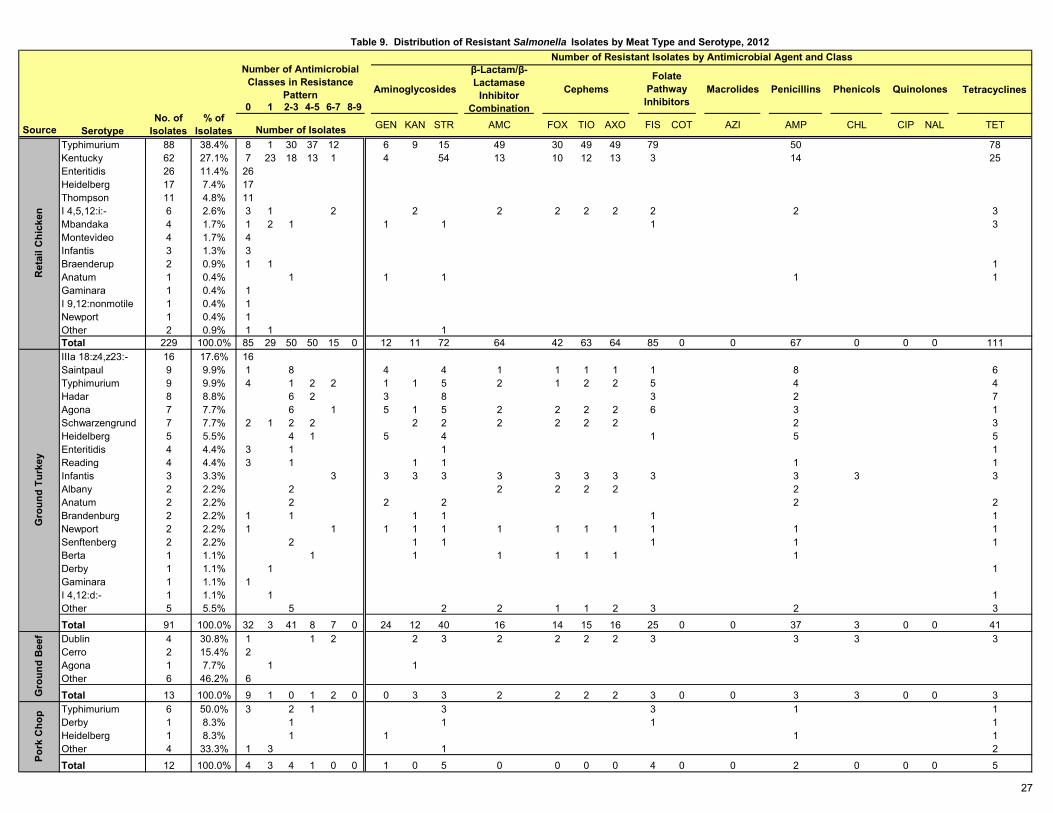
Trends in ResistanceSalmonella by Meat Type, 2002-2012…………………………………………………………………….. 24-26Distribution of Resistant Salmonella b y Top Serotypes, 2012..……………………………………………… 27
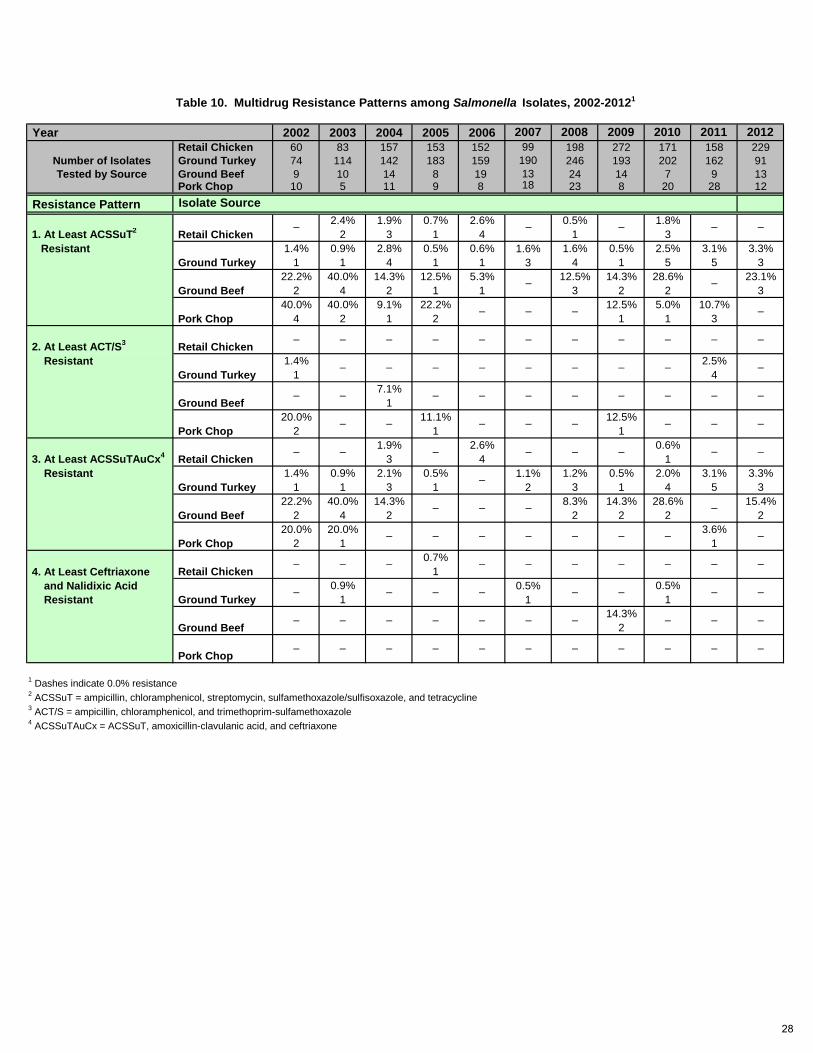
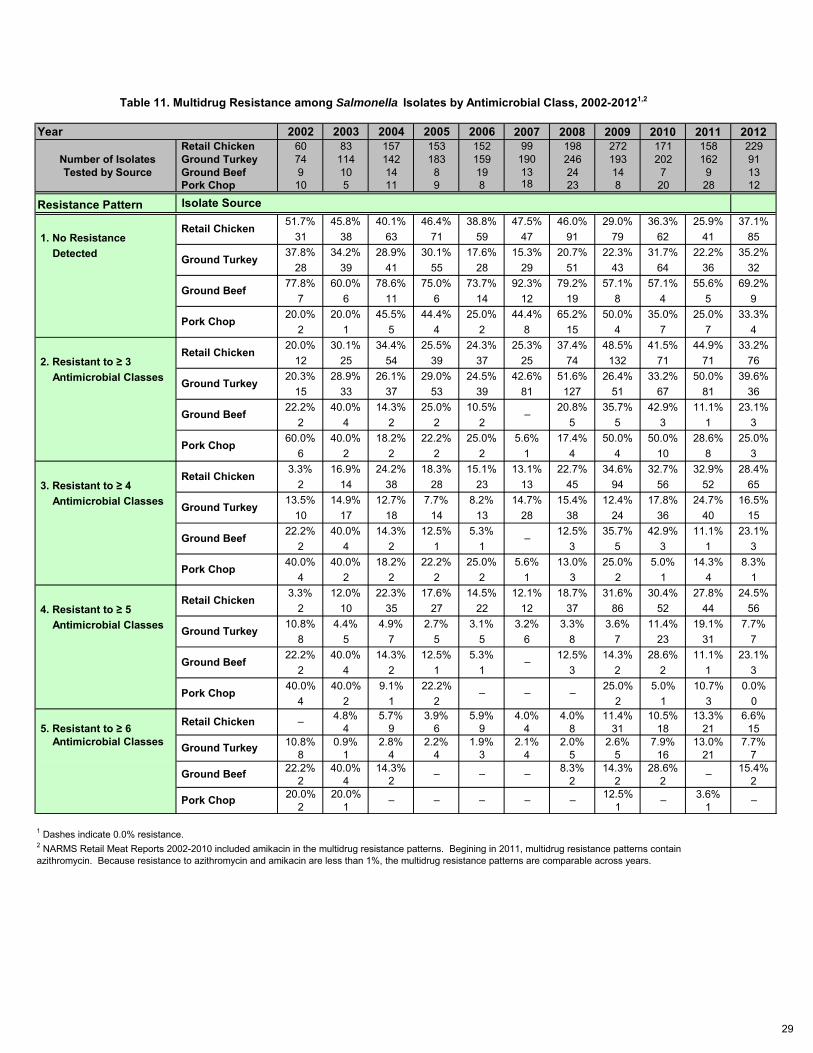
Resistance to Multiple Antimicrobial AgentsMultidrug Resistance Patterns, 2002-2012………………………………………………………………………28Resistance to Multiple Classes by Meat Type, 2002-2012………………………………………………………29
MIC Distributions Retail Chicken, 2002-2012….………………………………………………………………………………………30-31Ground Turkey, 2002-2012…………………………………………………………………………………………32-33Ground Beef, 2002-2012.………………………………………………………………………………………… 34-35Pork Chop, 2002-2012………………………………………………………………………………………………36-37
Other Beta Lactam Resistance………………...……………………………………………………………… 38
CAMPYLOBACTER DATA
Campylobacter Species by Meat Type, 2002-2012…………………………………………………………… 39Campylobacter jejuni and C. coli Isolated by Month from Retail Chicken, 2002-2012……………………. 40
Trends in ResistanceCampylobacter Species by Meat Type, 2002-2012……………………….…………………………………. 41Campylobacter jejuni and C. coli from Chicken Breast, 2002-2012………………………………………… 42-43
Resistance to Multiple Antimicrobial AgentsCampylobacter jejuni and C. coli Resistant to Multiple Classes by Meat Type, 2002-2012……..…………44
MIC Distributions in Retail ChickenCampylobacter jejuni , 2002-2012…………………………………………………………………………………45Campylobacter coli , 2002-2012……………………………………………………………………………………46
ENTEROCOCCUS DATA
Enterococcus Species by Meat Type, 2002-2012.………………………………………………………..……47
Trends in Resistance Enterococcus by Meat Type, 2002-2012…………………………………………………………………………48-50Enterococcus faecalis by Meat Type, 2002-2012……………………………………………………….……… 51Enterococcus faecium by Meat Type, 2002-2012………………………………………………………………52Enterococcus hirae by Meat Type, 2002-2012………………………………………………………………… 53
Resistance to Multiple Antimicrobial AgentsEnterococcus faecalis Resistant to Multiple Classes by Meat Type, 2002-2012……………………………54Enterococcus faecium Resistant to Multiple Classes by Meat Type, 2002-2012……………………………55
MIC Distributions by SpeciesRetail Chicken, 2012……………………………………………………………………………………...…………56Ground Turkey, 2012………………………………………………………………………………………...…..… 57Ground Beef, 2012……………………………………………………………….………………………..…..……58Pork Chop, 2012……………………………………………………………………………………....……………59
ESCHERICHIA COLI DATA
Escherichia coli Prevalence by Meat Type, 2002-2012………………………..………………………………60
Trends in Resistance Escherichia coli by Meat Type, 2002-2012………………………………………………………………………61-63
Resistance to Multiple Antimicrobial AgentsMultidrug Resistance Patterns, 2002-2012………………………………………………………………………64Resistance to Multiple Classes by Meat Type, 2002-2012………………………………………………………65
MIC DistributionsRetail Chicken, 2012……………………………………………………………………………………………… 66-67Ground Turkey, 2012……………………………………………………………………………………………… 68-69Ground Beef, 2012…………………………………………………………………………………………………70-71Pork Chop, 2012..……………………………………………………………………………………………………72-73
Other Beta Lactam Resistance……………….…………………………………………………………………74
APPENDICES
PFGE Profiles For Salmonella Isolates……………………………………………...………………………… 75-84Log Sheet Example………..…………………………………………………………………………………...……85Trend Analysis Description…………………………………………………………………………………………86Epidemiological Cut-off Values Description……………………………………………………………….. 87-88
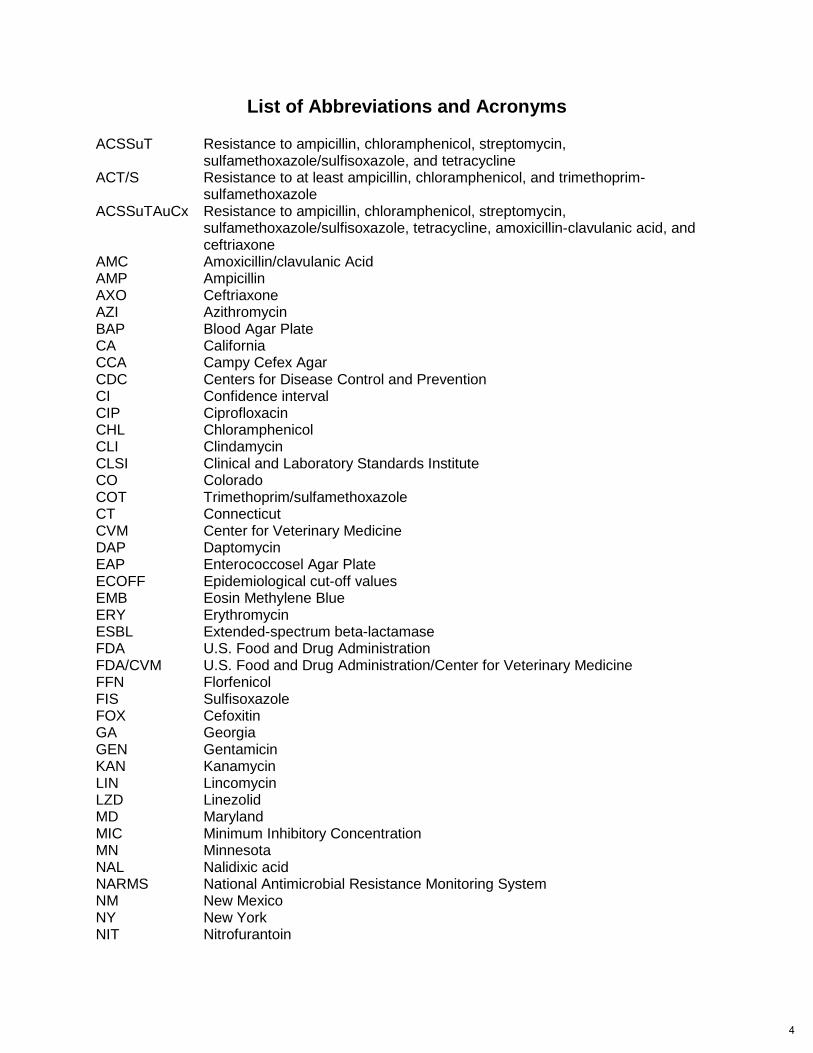
List of Abbreviations and Acronyms ACSSuT Resistance to ampicillin, chloramphenicol, streptomycin,
sulfamethoxazole/sulfisoxazole, and tetracycline ACT/S Resistance to at least ampicillin, chloramphenicol, and trimethoprim-
sulfamethoxazole ACSSuTAuCx Resistance to ampicillin, chloramphenicol, streptomycin,
sulfamethoxazole/sulfisoxazole, tetracycline, amoxicillin-clavulanic acid, and ceftriaxone
AMC Amoxicillin/clavulanic Acid AMP Ampicillin AXO Ceftriaxone AZI Azithromycin BAP Blood Agar Plate CA California CCA Campy Cefex Agar CDC Centers for Disease Control and Prevention CI Confidence interval CIP Ciprofloxacin CHL Chloramphenicol CLI Clindamycin CLSI Clinical and Laboratory Standards Institute CO Colorado COT Trimethoprim/sulfamethoxazole CT Connecticut CVM Center for Veterinary Medicine DAP Daptomycin EAP Enterococcosel Agar Plate ECOFF Epidemiological cut-off values EMB Eosin Methylene Blue ERY Erythromycin ESBL Extended-spectrum beta-lactamase FDA U.S. Food and Drug Administration FDA/CVM U.S. Food and Drug Administration/Center for Veterinary Medicine FFN Florfenicol FIS Sulfisoxazole FOX Cefoxitin GA Georgia GEN Gentamicin KAN Kanamycin LIN Lincomycin LZD Linezolid MD Maryland MIC Minimum Inhibitory Concentration MN Minnesota NAL Nalidixic acid NARMS National Antimicrobial Resistance Monitoring System NM New Mexico NY New York NIT Nitrofurantoin
4
OR Oregon PA Pennsylvania PCR Polymerase chain reaction PEN Penicillin PFGE Pulse-field gel electrophoresis QDA Quinupristin/dalfopristin RVR10 Rappaport-Vassiliadis Medium SDD Susceptible-dose dependent STR Streptomycin TEL Telithromycin TET Tetracycline TGC Tigecycline TIO Ceftiofur TN Tennessee TYL Tylosin VAN Vancomycin XLD Xylose Lysine Deoxycholate
5

U.S. Food and Drug Administration
Jason Abbott
Sherry Ayers
Sonya Bodeis-Jones
Emily Crarey
Sharon Friedman
Stuart Gaines
Michael Grabenstein
David Heller
Carol Henderson
Claudine Kabera
Claudia Lam
Patrick McDermott
Shawn McDermott
Sampa Mukherjee
Crystal Rice-Trujillo
Jonathan Sabo
Heather Tate
Thu Thuy-Tran
Melissa Warren
Shenia Young
Shaohua Zhao
Centers for Disease Control and Prevention Beth Karp
Felicita Medalla
Allison O’Donnell
Regan Rickert-Hartman
Special thanks to Denise
Benton, Mary
Bartholomew, and
Junshan Qiu for
providing outstanding
web support and
statistical consultation.
Participating State and Local Health Departments
California
Richard Alexander
Melody Hung-Fan
Maribel Rickard
Colorado
Dee Jae Dutton
Joe Gossack
Dave Heltzel
Hugh Maguire
Connecticut Diane Barden
Sharon Hurd
Aristea Kinney
Danyel Olson
Alla Zeygerman
Georgia
James Benson
Hope Dishman
Cherie Drenzek
Elizabeth Franko
Mary Hodel
Gladys Maldonado
Becky Meyer
Mahin Park
Lynett Poventud
Melissa Tobin-D’angelo
Maryland
David Blythe
Jordan Cahoon
Shenaz Dave
Beverly Jolbitado
Amanda Palmer
Jafar Razeq
Emily Ricotta
Heather Rutz
Patricia Ryan
Megan Young
Minnesota
Craig Braymen
Gary Horvath
Billie Juni
Fe Leano
Stephanie Meyer
David Read
Kirk Smith
Theresa Weber
New Mexico Adreiena Armijo
Lisa Butler
Nicole Espinoza
Frederick Gentry
Carlos Gonzales
Jennifer Hollander
Sarah Khanlian
Robert Mansmann
Cynthia Nicholson
Erica Swanson
Paul Torres
New York Charles MacGowan
Geetha Nattanmai
Timothy Root
Suzanne Solghan
Shelley Zansky
Oregon
Elizabeth Baldwin
Marianna Cavanaugh
Emilio DeBess
Vicki A. Hafits
Helen Packett
James Tanabe
Janie Tierheimer
Robert Vega
Veronica Williams
Pennsylvania
Lisa Dettinger
Susan Johnston
Nkuchia M. M’ikanatha
Barry Perry
Stanley Reynolds
Carol Sandt
Deepanker Tewari
Tennessee
Parvin Arjmandi
Henry Davis
Gail Dewberry
John Dunn
Stephanie Estes
Samir Hanna
Henrietta Hardin
Tim Jones
Ryan Mason
Kenneth Mitchell
Julie Montgomery
Bobby Price
Sheri Roberts
NARMS Retail Meat Working Group
6
INTRODUCTION
The primary purpose of the National Antimicrobial Resistance Monitoring System
(NARMS) retail meat surveillance program at the U.S. Food and Drug Administration’s Center
for Veterinary Medicine (FDA/CVM) is to monitor the prevalence and trends of antimicrobial
resistance among foodborne isolates of Salmonella, Campylobacter, Enterococcus and
Escherichia coli.
As a public health monitoring system, the primary objectives of NARMS are to:
1) Assist the FDA in making decisions related to the approval of safe and effective
antimicrobial drugs for animals;
2) Monitor trends in antimicrobial resistance among foodborne bacteria from humans, retail
meats, and animals;
3) Disseminate timely information on antimicrobial resistance to promote interventions that
reduce resistance among foodborne bacteria;
4) Conduct research to better understand the emergence, persistence, and spread of
antimicrobial resistance.
NARMS retail meat surveillance is a collaborative project between the FDA/CVM, the
Centers for Disease Control and Prevention (CDC), and state and local public health
departments in California, Colorado, Connecticut, Georgia, Maryland, Minnesota, New Mexico,
New York, Oregon, Pennsylvania, and Tennessee. Each site purchases approximately 40 food
samples per month, comprising of 10 samples each of chicken, ground turkey, ground beef, and
pork chops. All sites culture the meat and poultry samples for Salmonella while only poultry
samples are cultured for Campylobacter. In 2012, 4 of the 11 participating laboratories
(Georgia, Oregon, Maryland and Tennessee) also cultured meat and poultry samples for E. coli
and Enterococcus. Bacterial isolates are sent to FDA/CVM for serotyping, antimicrobial
susceptibility testing, and genetic analysis.
This annual report includes FDA/CVM’s surveillance data for 2012 for Salmonella,
Campylobacter, Enterococcus, and Escherichia coli. Surveillance data include the number of
isolates of each pathogen tested by NARMS and the number and percentage of isolates that
were resistant to each of the antimicrobial agents tested. Data from earlier years are presented
in tables and graphs where appropriate. Additional NARMS data and more information about
NARMS activities are available at www.fda.gov/narms .
7
WHAT’S NEW IN THE NARMS RETAIL MEAT REPORT
Unlike the other bacteria tested in NARMS, there are no formal clinical breakpoints
established for Campylobacter. Beginning in this 2012 report, NARMS will use a different
approach to interpret susceptible (S) and resistant (R) categories for Campylobacter, based on
epidemiological cut-off values (ECOFFs). ECOFFs are used to distinguish isolates with any
acquired resistance trait (non-wild type) from those without any acquired traits (wild type). For
the purposes of this report, non-wild-type Campylobacter isolates will be termed resistant. It is
important to emphasize that ECOFFs are distinct from clinical breakpoints where resistance is
defined using pharmacological parameters and data from clinical trial outcomes. This change to
Campylobacter reporting facilitates detection of emerging resistance and is a step toward
globally harmonized methods for Campylobacter surveillance. ECOFF interpretations were
applied to all Campylobacter analyses in this report and a more detailed description of how they
differ from clinical breakpoints can be found in Appendix 4.
In the 2014 M100-S24 document, the Clinical Laboratory and Standards Institute (CLSI)
revised cefepime breakpoints, an antimicrobial that is used for screening for the presence of
extended-spectrum beta-lactamase (ESBL) production. The cefepime resistance breakpoint
lowered from ≥ 32 µg/mL to ≥ 16 µg/mL. CLSI revised cefepime breakpoints to better correlate
with dosages used by clinicians and to optimize its activity against multidrug resistant Gram-
negative bacteria. Also included in the cefepime revision was the introduction of the susceptible-
dose dependent (SDD)1 category. When reporting cefepime results, CLSI recommends using
SDD instead of “intermediate” because there are multiple approved dosing options for cefepime
and SDD highlights the option of using higher doses to treat infections caused by isolates when
the cefepime minimum inhibitory concentration is 4 or 8 µg/mL. The revised cefepime
breakpoints and SDD categories were applied to Table 13 and Table 30 of this report.
In the 2011 NARMS retail meat report, revised ciprofloxacin breakpoints from the 2012
CLSI M100-S22 document were applied to only Salmonella analyses. Beginning with this report,
the revised ciprofloxacin breakpoints will also be applied to all Escherichia coli analyses. Since
E. coli is used in part to detect emerging trends in Salmonella resistance, the application of the
revised ciprofloxacin breakpoints to E. coli will ensure results are comparable.
1 Additional information on the definition and use of susceptible-dose dependent (SDD) category can be found at the following location http://community.clsi.org/micro/wp-content/uploads/sites/15/2013/07/Cefepime-BP-Change-for-Enterobacteriaceae_-Intro-of-SDD-For-Labs.pdf
8
Highlights of the 2012 NARMS Retail Meat Report Salmonella1 In Salmonella, antibiotic resistance varies by serotype. Overall changes in resistance among Salmonella isolated from each food source may reflect changes in resistance within serotypes, changes in serotype distribution, or both. Please note, the retail meat report does not describe antibiotic resistance trends by serotype. o Prevalence – In 2012, a total of 345 Salmonella isolates were tested. Salmonella was
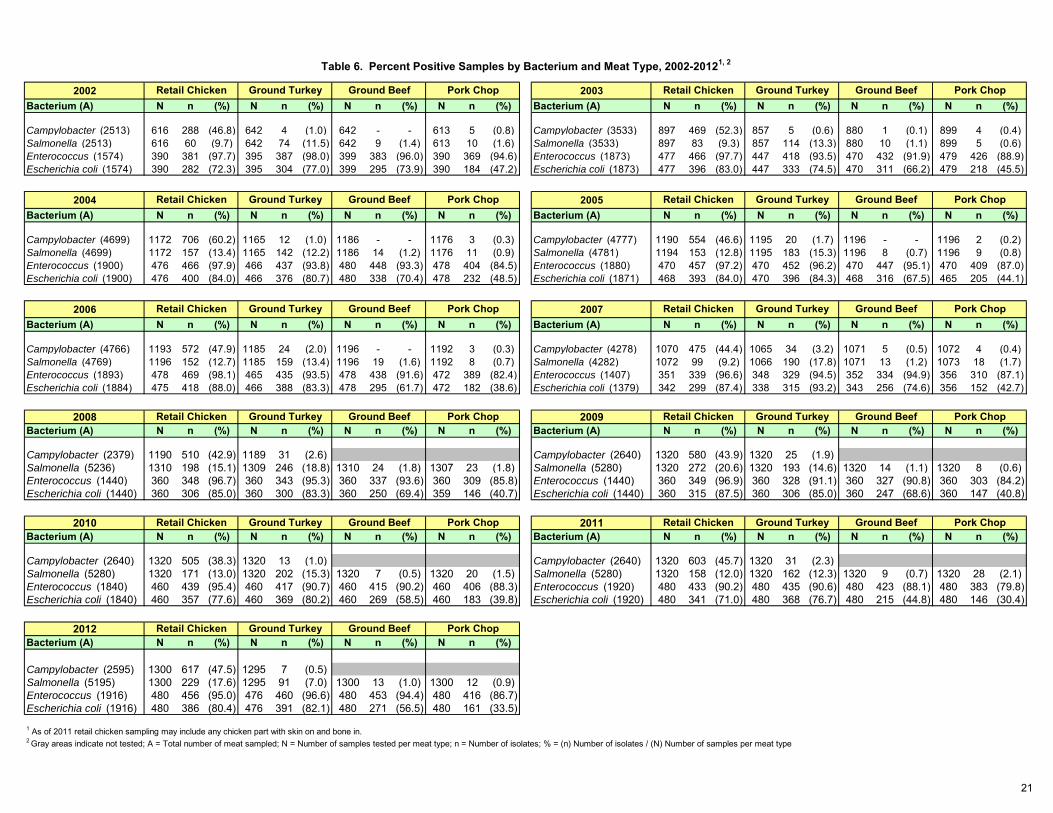
isolated from 18% of retail chicken, 7% of ground turkey, 1% of ground beef, and 1% of pork chop samples (Figure 1).
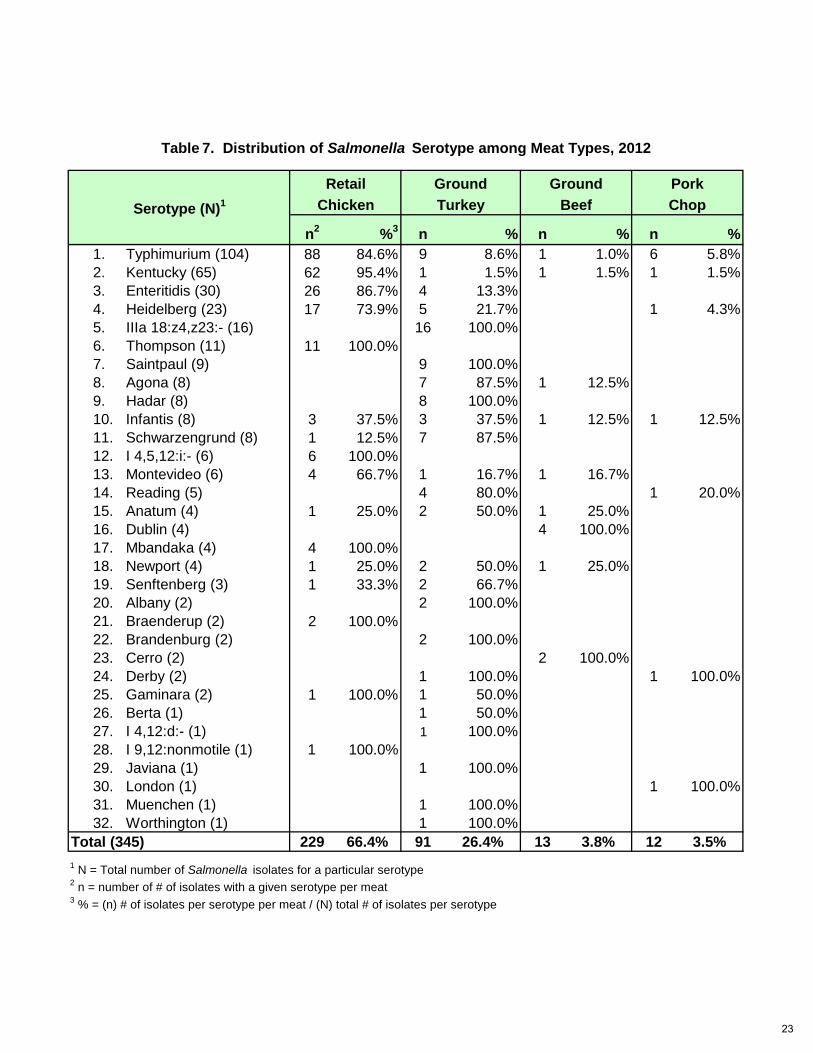
o Salmonella serotypes Typhimurium and Kentucky accounted for 49% of retail meat isolates (Table 7).
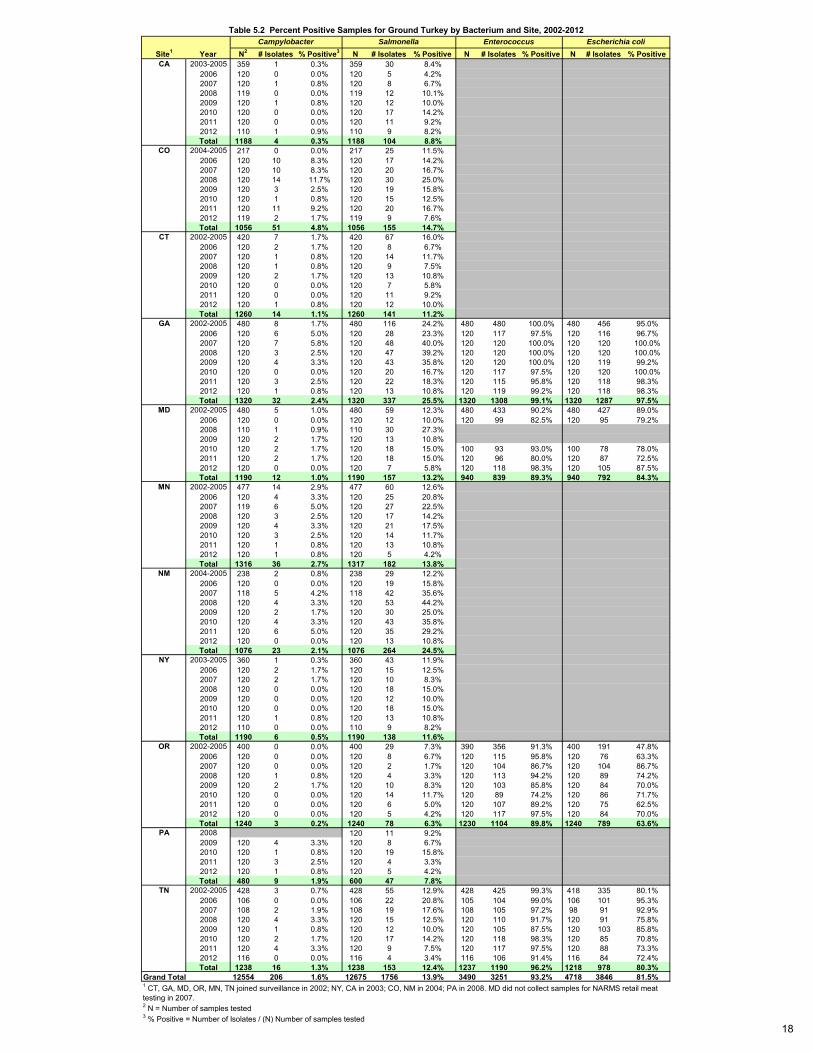
o This is the first year that Salmonella serotype IIIa 18:z4,z23:- became the top serotype in ground turkey (Table 7).
o S. Heidelberg prevalence among all retail meat continued to decrease, comprising only 7% of Salmonella isolates in 2012 (Table 7).
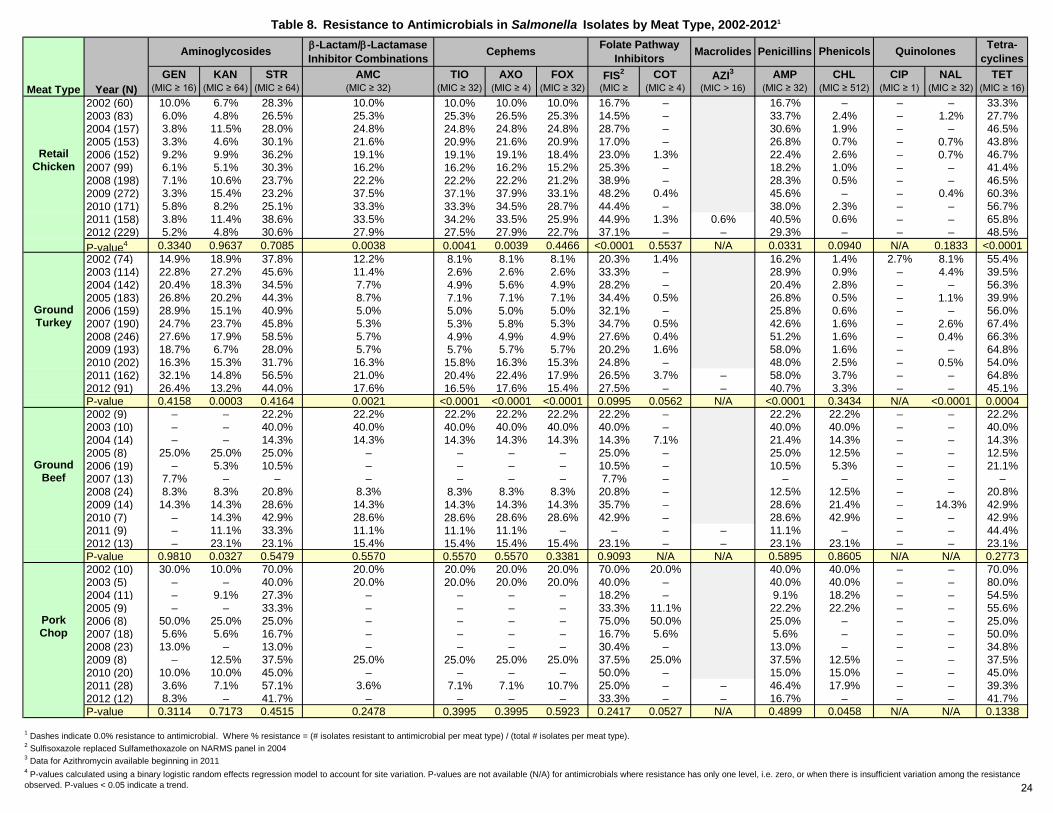
o Quinolones – In 2012, all Salmonella isolates were susceptible to nalidixic acid and ciprofloxacin (Table 8).
o Cephalosporins – Between 2002 and 2012, third-generation cephalosporin resistance in retail chicken rose from 10% to 28% and in ground turkey rose from 8% to 18% (p < 0.05, Table 8).
o Ampicillin – Between 2002 and 2012, ampicillin resistance in retail chicken rose significantly from 17% to 29% (p < 0.05) and in ground turkey isolates rose from 16% to 41% (p < 0.001, Table 8).
o Multidrug Resistance – The proportion of Salmonella with no detected resistance increased in 2012 compared to 2011. In 2012, 33% of retail chicken isolates were resistant to ≥ 3 antibiotic classes compared to 40% of ground turkey isolates. More than 24% of retail chicken isolates showed resistance to ≥ 5 classes (Table 11) with 2/3rd from serotype Typhimurium (Table 9).
Campylobacter2 C. jejuni and C. coli cause most campylobacteriosis. Many of these infections are foodborne and poultry is a major source of human C. jejuni infections. More than 90% of Campylobacter isolates are recovered from retail chicken each year and C. jejuni accounts for 2/3rd of them (Table 14). Macrolides and fluoroquinolones are used in the treatment of human Campylobacter infections. Both drugs are also authorized for use in food-producing animals (Animal Drugs @ FDA).
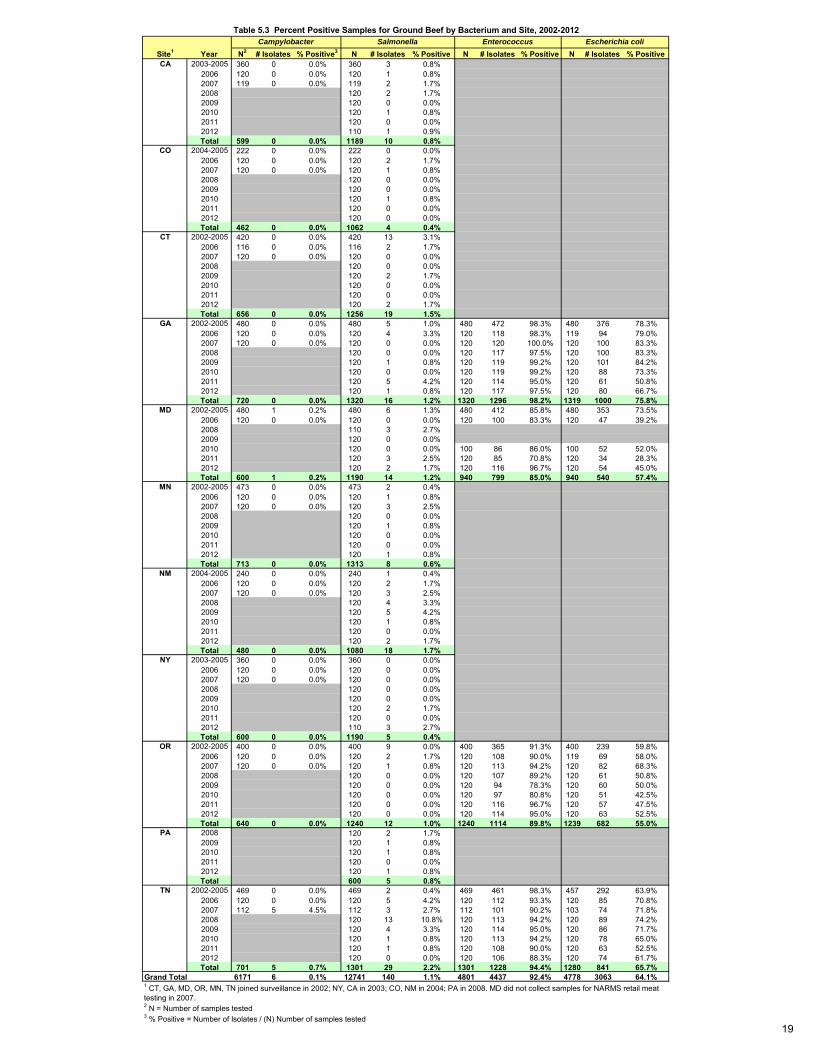
1 Nearly all salmonellae were recovered from poultry. Due to the low recovery from ground beef and pork chops (< 2%), statistical analysis of trends in resistance from these sources should be considered with caution. 2 Ground beef and pork chop samples are no longer cultured for Campylobacter, due to their low recovery (<0.5%) from 2002–2007.
9
o Prevalence – In 2012, a total of 944 Campylobacter isolates were tested. Campylobacter
was isolated from 47% of retail chicken and < 1% of ground turkey samples (Figure 2).
o Macrolide resistance in retail chicken isolates remained at 1% for C. jejuni, while macrolide resistance in C. coli rose to 12% compared to 5% in 2011 (Table 17).
o There have been no consistent changes in ciprofloxacin resistance among C. jejuni and C. coli from retail chicken since 2005 when fluoroquinolone use stopped in poultry production (Table 17).
o In 2012, nearly 50% of C. jejuni and C. coli from retail chicken were tetracycline resistant. Tetracycline resistance is the most common resistance among Campylobacter (Table 17).
o In 2012, gentamicin resistance in C. coli markedly decreased to 4% following a significantly steady increase from <1% when it first appeared in 2007 to 18% in 2011 (p < 0.001, Table 17).
o Multidrug resistance is rare in Campylobacter. There were 26 (of 620) Campylobacter isolates from poultry resistant to ≥ 3 antibiotic classes in 2012 (Table 18).
Enterococcus Enterococcus is used as a sentinel for antibiotic selection pressures by compounds with Gram-positive activity. This spectrum of activity is exhibited by many antibiotics used in food animal production and the same classes of antibiotics are also used to treat human infections. o Prevalence – In 2012, a total of 1,785 Enterococcus isolates were tested. Enterococcus was
isolated from 95% of retail chicken, 97% of ground turkey, 94% of ground beef, and 87% of pork chop samples (Table 6).
o No isolates were resistant to vancomycin or linezolid (Table 21). These classes of compounds are important in human medicine but are not used in food animal production.
o Streptogramin resistance has significantly decreased (p < 0.05) in all retail meat since 2002, however it remains above 50% in ground turkey isolates (Table 21).
o E. faecalis from poultry showed markedly higher aminoglycoside and macrolide resistance than E. faecium, with the exception of streptomycin. E. faecium from all sources had much higher resistance to nitrofurantoin, penicillin and ciprofloxacin compared to E. faecalis (Table 22.1-2).
o The proportion of poultry isolates from 2002 through 2012 that were multidrug resistant was higher for E. faecium than E. faecalis (Table 23.1-2).
Escherichia coli E. coli is used by NARMS as an indicator organism to detect both emerging resistance patterns and specific resistance genes that could potentially be transferred to other pathogenic gram negative bacteria (e.g. Salmonella). o Prevalence – In 2012, a total of 1,209 E. coli isolates were tested. E. coli was isolated from
80% of retail chicken, 82% of ground turkey, 56% of ground beef, and 34% of pork chop samples (Table 6).
10
o Quinolones – All E. coli isolates in 2012 continued showing little to no resistance to nalidixic acid (< 2%) and ciprofloxacin (< 1%, Table 26).
o Cephalosporins – Between 2002 to 2012 third-generation cephalosporin resistance rose in ground turkey isolates from 1% to 10% (p < 0.001, Table 26).
o Ampicillin – Between 2002 to 2012 ampicillin resistance increased significantly in ground turkey isolates from 31% to 56% (p < 0.001, Table 26).
o Multidrug Resistance – Among E. coli isolates from ground turkey, 68% were resistant to ≥ 3 antibiotic classes in 2012 (Table 28).
11
Surveillance and Laboratory Testing Methods
Sample Collection and Isolate Submission For 2012, retail meat samples were collected from 11 sites including California, Colorado, Connecticut, Georgia, Maryland, Minnesota, New Mexico, New York, Oregon, Pennsylvania, and Tennessee. Each site collected samples from a randomized list of area grocery stores derived from the Chain Store Guide ® (Tampa, FL). All 11 sites cultured the meat samples for non-typhoidal Salmonella and Campylobacter. In 2012, Georgia, Maryland, Oregon and Tennessee cultured the same samples for E. coli and Enterococcus. A single isolate from each culture-positive meat sample was submitted by the 11 sites to the FDA/CVM for serotype or species confirmation and antimicrobial susceptibility testing. Microbiological Analysis and Testing Methods at the NARMS Sites
Retail meat samples were stored at 4°C and processed within 96 hours of purchase. Meat packages were kept intact until they were aseptically opened in the laboratory. A sample is defined as a single retail chicken part (breast, wing, or thigh) or pork chop, or a 25 gram (g) aliquot of ground product (beef and turkey). Samples were placed in separate sterile plastic bags with 225 mL of buffered peptone water, and the bags were vigorously shaken. Fifty milliliters of the rinsate from each sample were transferred to individual sterile containers for bacterial isolation as outlined below. Salmonella Isolation Fifty milliliters of double strength lactose broth were added to the flasks containing 50 mL of rinsate. The contents were mixed thoroughly and incubated at 35°C for 24 hours. From each flask, 0.1 mL was transferred to 9.9 mL of RVR10 medium and incubated at 42°C for 16-20 hours. One milliliter of this enrichment was transferred to pre-warmed (35-37°C) 10 mL tubes of M Broth and incubated 35-37°C for 6-8 hours. From each M Broth culture, 1 mL was heated at 100°C for 15 minutes, and the remaining portion was refrigerated. The heated portion from each culture was screened using the TECRA Salmonella Visual Immunoassay kit (International BioProducts, Bothell, WA) or the VIDAS® Salmonella Immunoassay kit (bioMerieux, Hazelwood, MO) according to the manufacturers’ instructions. If the TECRA or VIDAS assay was negative, the sample was considered negative for Salmonella. If the TECRA or VIDAS assay was positive, a loopful of the corresponding unheated M Broth culture was streaked for isolation onto a Xylose Lysine Deoxycholate (XLD) agar plate and incubated at 35°C for 24 hours. Each XLD agar plate was examined for typical Salmonella colonies (pink colonies with or without black centers). If no Salmonella-like growth was observed on XLD agar, the sample was considered negative. A typical Salmonella colony was streaked for purity onto a trypticase soy agar plate supplemented with 5% defibrinated sheep blood (BAP). The BAP(s) were incubated at 35°C for 18-24 hours before sub-culturing an isolated colony for further biochemical identification and serotyping using the laboratory’s standard procedures. Salmonella isolates were subsequently frozen at -70 to -80°C in Brucella broth with 20% glycerol and shipped on dry ice to FDA/CVM. Upon arrival at FDA/CVM, each isolate was streaked for purity on a BAP before being confirmed as Salmonella using the Vitek 2 Compact microbial identification system (bioMérieux, Hazelwood, MO). These isolates were further serotyped for O and H antigens using either commercially available antisera (Difco-Becton Dickinson, Sparks, MD; Miravista Diagnostics, Indianapolis, IN) or antisera from the CDC.
12
Campylobacter Isolation Fifty milliliters of double-strength Bolton broth was added to the flasks containing 50 mL of rinsate, mixed gently to avoid aeration, and incubated at 42°C for 24 hours in a reduced oxygen atmosphere containing 85% nitrogen, 10% carbon dioxide, and 5% oxygen. The Bolton broth enrichment was inoculated onto Campy Cefex Agar (CCA) to obtain isolated colonies, and incubated at 42°C in the above atmosphere for 24 to 48 hours. If no Campylobacter-like growth was observed on a CCA plate, the sample was considered negative. When Campylobacter-like growth was observed, one typical well-isolated colony from each CCA plate was sub-cultured to a BAP and incubated as described above. Following incubation, the purified culture was gram stained and tested for its reaction to catalase, oxidase, hippurate and/or motility. All isolates presumptively identified as Campylobacter were frozen at -70 to -80°C in Brucella broth with 20% glycerol and shipped in cryo-vials on dry ice to FDA/CVM. Upon arrival at FDA/CVM, isolates were streaked for purity on a BAP before being identified to the species level using PCR assays previously described (2, 6). Escherichia coli Isolation (Georgia, Oregon, Maryland and Tennessee in 2012) Fifty milliliters of double strength MacConkey broth was added to flasks containing 50 mL of rinsate, mixed thoroughly and incubated at 35°C for 16-20 hours. One loopful from each flask was streaked onto an Eosin Methylene Blue (EMB) agar plate and incubated at 35°C for 16-20 hours. If no typical E. coli colonies were observed on an EMB agar plate, the sample was considered negative. When E. coli-like growth was present, one typical, well-isolated colony was subcultured onto a BAP. Indole positive and oxidase negative isolates were presumptively identified as E. coli. These isolates were frozen at -70 to -80°C in Brucella broth with 20% glycerol and shipped in cryo-vials on dry ice to FDA/CVM. Upon arrival at FDA/CVM, every isolate was streaked for purity on a BAP before being confirmed as E. coli using the Vitek 2 Compact microbial identification system (bioMérieux, Hazelwood, MO). Enterococcus Isolation (Georgia, Oregon, Maryland and Tennessee in 2012) Fifty milliliters of double-strength Enterococcosel broth was added 50 mL of rinsate, mixed thoroughly and incubated at 45°C for 18-24 hours. If no typical growth or blackening was observed in the flask, the sample was considered negative. If blackening of the broth was observed, a loopful was streaked for isolation onto an Enterococcosel Agar plate (EAP) and incubated at 35°C for 18-24 hours. If no typical growth was observed on the EA plate, the sample was considered negative. If Enterococcus-like growth was present, one well-isolated colony was streaked for isolation onto a BAP, and incubated at 35°C for 18-24 hours in ambient air. Presumptive Enterococcus isolates were subsequently frozen at -70 to -80°C in Brucella broth with 20% glycerol and shipped in cryo-vials on dry ice to FDA/CVM. Upon arrival at FDA/CVM, every isolate was streaked for purity on a BAP before being confirmed as Enterococcus using the Vitek 2 Compact microbial identification system (bioMérieux, Hazelwood, MO). Antimicrobial Susceptibility Testing Antimicrobial minimal inhibitory concentrations (MICs) were determined by broth microdilution according to the Clinical and Laboratory Standards Institute (CLSI) standards (3, 4, 5) using a 96-well microtiter plate (Sensititre, Trek Diagnostic Systems, Thermo Fisher Scientific Inc., Cleveland, OH). Salmonella and E. coli isolates were tested using a custom plate developed for
13
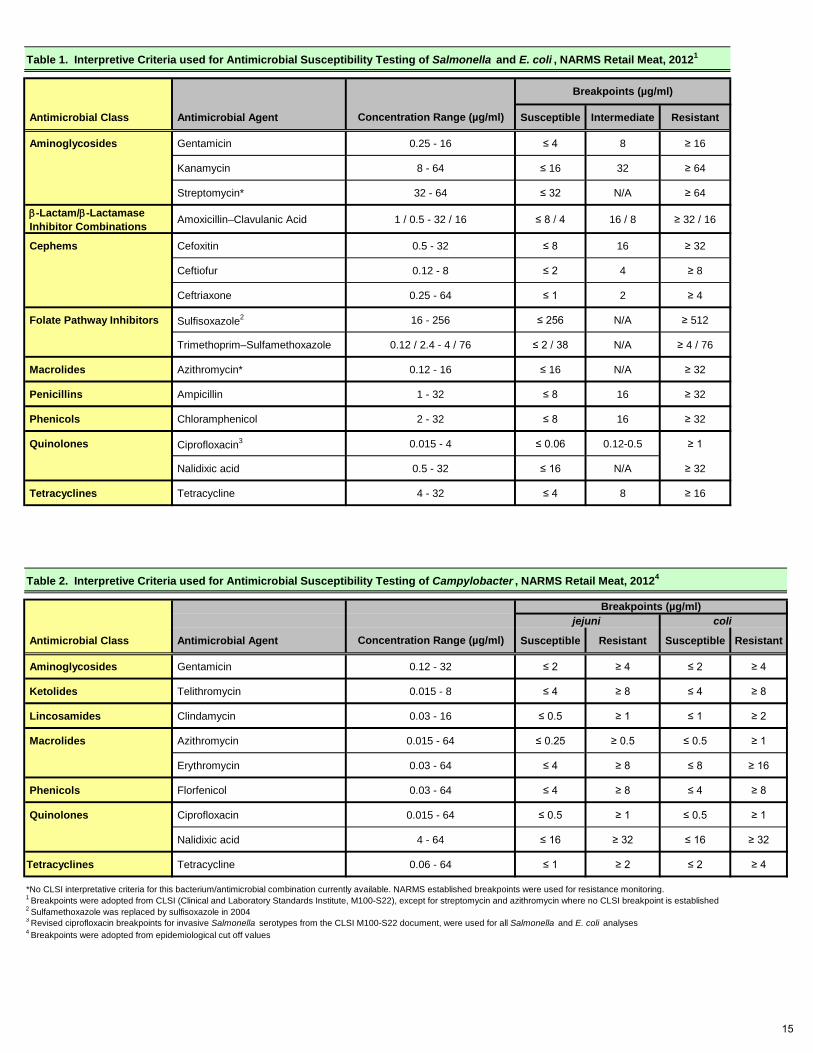
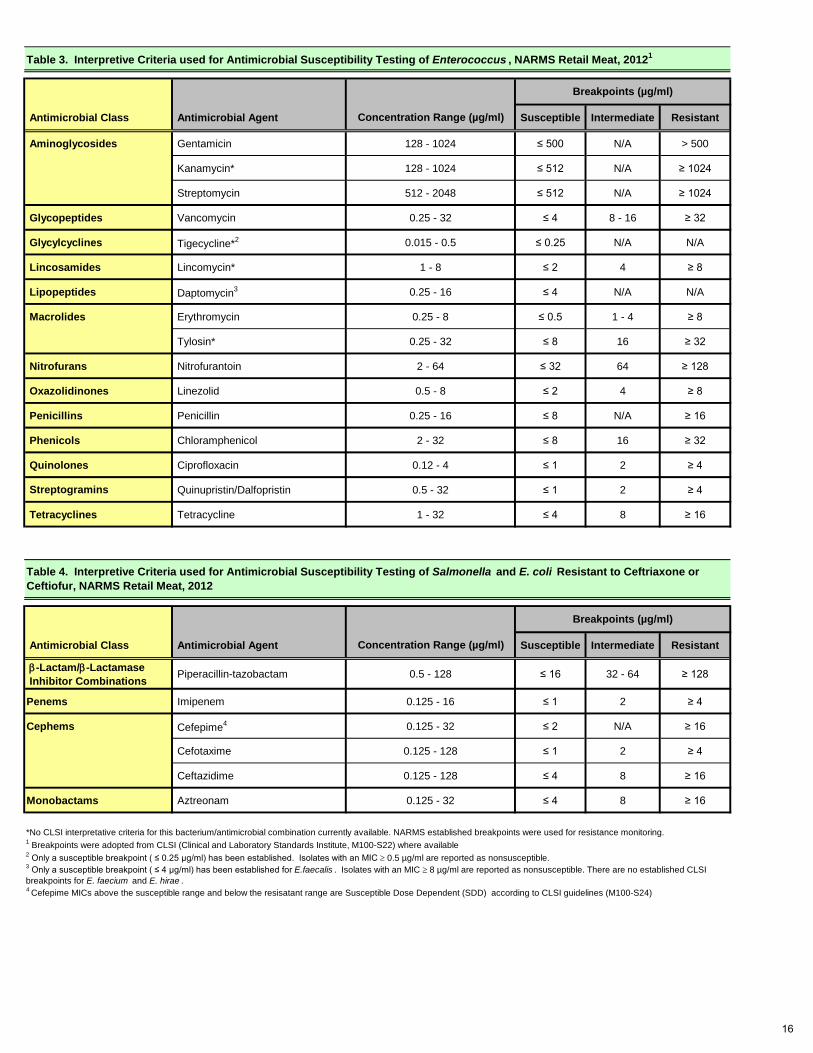
Gram-negative bacteria (catalog # CMV2AGNF) and suspect Extended Spectrum Beta-Lactamases (ESBL) that were resistant to ceftriaxone (AXO) and/or ceftiofur (TIO) were tested using a custom plate developed for ESBL testing (CMV2DW); Enterococcus isolates were tested using a custom plate developed for Gram-positive bacteria (catalog # CMV3AGPF); and Campylobacter isolates were tested using a custom plate developed for Campylobacter testing (catalog # CAMPY). The quality control organisms included Escherichia coli ATCC 25922, Enterococcus faecalis ATCC 29212, Enterococcus faecalis ATCC 51299 Staphylococcus aureus ATCC 29213, Pseudomonas aeruginosa ATCC 27853, and Campylobacter jejuni ATCC 33560 (3, 4, 5). CLSI approved interpretive criteria were used when available for all organisms except Campylobacter where established epidemiological cut off values were used. Provisional NARMS breakpoints were used when no CLSI approved interpretive criteria was available (Tables 1- 4). Pulsed-Field Gel Electrophoresis (PFGE)
Pulsed-field gel electrophoresis (PFGE) was used to assess genetic relatedness among all Salmonella and select Campylobacter isolates using protocols developed by CDC (1). All Campylobacter isolated from 2002 to 2005 were tested by PFGE. Since 2012, only those resistant to gentamycin have been examined by PFGE. Agarose-embedded DNA was digested with XbaI and BlnI for Salmonella isolates and SmaI and KpnI for Campylobacter isolates. DNA restriction fragments were separated by pulsed electrophoresis using the CHEF Mapper ® system (Bio-Rad, Hercules, CA). Genomic-DNA profiles were analyzed using BioNumerics software (Applied-Maths, Kortrijk, Belgium), and banding patterns were compared using Dice coefficients with a 1.5% band position tolerance.
References 1. Centers for Disease Control and Prevention. 2002. Standardized molecular subtyping of
foodborne bacterial pathogens by pulsed-field gel electrophoresis. Centers for Disease Control and Prevention. Atlanta, GA.
2. Linton, D., A. J. Lawson, R. J. Owen, and J. Stanley. 1997. PCR detection, identification
to species level, and fingerprinting of Campylobacter jejuni and Campylobacter coli direct from diarrheic samples. J. Clin. Microbiol. 35:2568-2572
3. Clinical and Laboratory Standards Institute. Performance Standards for Antimicrobial
Disk and Dilution Susceptibility Tests for Bacteria Isolated from Animals; Approved Standard – Second Edition (M31-A2). 2002. CLSI, Wayne, Pa.
4. Clinical and Laboratory Standards Institute. Performance Standards for Antimicrobial
Disk and Dilution Susceptibility Tests for Bacteria Isolated from Animals; Informational Supplement (M31-S1). 2004. CLSI, Wayne, Pa.
5. Clinical and Laboratory Standards Institute. Performance Standards for Antimicrobial
Susceptibility Testing; Twenty-Second Informational Supplement (M100-S22). 2012. CLSI, Wayne, Pa.
6. Zhao, C., B. Ge, J. De Villena, R. Sudler, E. Yeh, S. Zhao, D. G. White, D. Wagner, and
J. Meng. 2001. Prevalence of Campylobacter spp., Escherichia coli, and Salmonella serovars in retail chicken, turkey, pork, and beef from the Greater Washington, D.C., area. Appl.Environ.Microbiol. 67:5431-5436
14
Aminoglycosides Gentamicin 0.25 - 16 ≤ 4 8 ≥ 16
Kanamycin 8 - 64 ≤ 16 32 ≥ 64
Streptomycin* 32 - 64 ≤ 32 N/A ≥ 64
β-Lactam/β-Lactamase Inhibitor Combinations Amoxicillin–Clavulanic Acid 1 / 0.5 - 32 / 16 ≤ 8 / 4 16 / 8 ≥ 32 / 16
Cephems Cefoxitin 0.5 - 32 ≤ 8 16 ≥ 32
Ceftiofur 0.12 - 8 ≤ 2 4 ≥ 8
Ceftriaxone 0.25 - 64 ≤ 1 2 ≥ 4
Folate Pathway Inhibitors Sulfisoxazole2 16 - 256 ≤ 256 N/A ≥ 512
Trimethoprim–Sulfamethoxazole 0.12 / 2.4 - 4 / 76 ≤ 2 / 38 N/A ≥ 4 / 76
Macrolides Azithromycin* 0.12 - 16 ≤ 16 N/A ≥ 32
Penicillins Ampicillin 1 - 32 ≤ 8 16 ≥ 32
Phenicols Chloramphenicol 2 - 32 ≤ 8 16 ≥ 32
Quinolones Ciprofloxacin3 0.015 - 4 ≤ 0.06 0.12-0.5 ≥ 1
Nalidixic acid 0.5 - 32 ≤ 16 N/A ≥ 32
Tetracyclines Tetracycline 4 - 32 ≤ 4 8 ≥ 16
Aminoglycosides Gentamicin 0.12 - 32 ≤ 2 ≥ 4 ≤ 2 ≥ 4
Ketolides Telithromycin 0.015 - 8 ≤ 4 ≥ 8 ≤ 4 ≥ 8
Lincosamides Clindamycin 0.03 - 16 ≤ 0.5 ≥ 1 ≤ 1 ≥ 2
Macrolides Azithromycin 0.015 - 64 ≤ 0.25 ≥ 0.5 ≤ 0.5 ≥ 1
Erythromycin 0.03 - 64 ≤ 4 ≥ 8 ≤ 8 ≥ 16
Phenicols Florfenicol 0.03 - 64 ≤ 4 ≥ 8 ≤ 4 ≥ 8
Quinolones Ciprofloxacin 0.015 - 64 ≤ 0.5 ≥ 1 ≤ 0.5 ≥ 1
Nalidixic acid 4 - 64 ≤ 16 ≥ 32 ≤ 16 ≥ 32
Tetracyclines Tetracycline 0.06 - 64 ≤ 1 ≥ 2 ≤ 2 ≥ 4
*No CLSI interpretative criteria for this bacterium/antimicrobial combination currently available. NARMS established breakpoints were used for resistance monitoring.
3 Revised ciprofloxacin breakpoints for invasive Salmonella serotypes from the CLSI M100-S22 document, were used for all Salmonella and E. coli analyses
Intermediate
jejuni coli
Susceptible Resistant
Breakpoints (µg/ml)
Table 2. Interpretive Criteria used for Antimicrobial Susceptibility Testing of Campylobacter , NARMS Retail Meat, 20124
Antimicrobial Agent Antimicrobial Class
Antimicrobial Agent Antimicrobial Class
4 Breakpoints were adopted from epidemiological cut off values
2 Sulfamethoxazole was replaced by sulfisoxazole in 2004
Concentration Range (µg/ml)
Susceptible
Susceptible Resistant
1 Breakpoints were adopted from CLSI (Clinical and Laboratory Standards Institute, M100-S22), except for streptomycin and azithromycin where no CLSI breakpoint is established
Table 1. Interpretive Criteria used for Antimicrobial Susceptibility Testing of Salmonella and E. coli , NARMS Retail Meat, 20121
Breakpoints (µg/ml)
ResistantConcentration Range (µg/ml)
15
Aminoglycosides Gentamicin 128 - 1024 ≤ 500 N/A > 500
Kanamycin* 128 - 1024 ≤ 512 N/A ≥ 1024
Streptomycin 512 - 2048 ≤ 512 N/A ≥ 1024
Glycopeptides Vancomycin 0.25 - 32 ≤ 4 8 - 16 ≥ 32
Glycylcyclines Tigecycline*2 0.015 - 0.5 ≤ 0.25 N/A N/A
Lincosamides Lincomycin* 1 - 8 ≤ 2 4 ≥ 8
Lipopeptides Daptomycin3 0.25 - 16 ≤ 4 N/A N/A
Macrolides Erythromycin 0.25 - 8 ≤ 0.5 1 - 4 ≥ 8
Tylosin* 0.25 - 32 ≤ 8 16 ≥ 32
Nitrofurans Nitrofurantoin 2 - 64 ≤ 32 64 ≥ 128
Oxazolidinones Linezolid 0.5 - 8 ≤ 2 4 ≥ 8
Penicillins Penicillin 0.25 - 16 ≤ 8 N/A ≥ 16
Phenicols Chloramphenicol 2 - 32 ≤ 8 16 ≥ 32
Quinolones Ciprofloxacin 0.12 - 4 ≤ 1 2 ≥ 4
Streptogramins Quinupristin/Dalfopristin 0.5 - 32 ≤ 1 2 ≥ 4
Tetracyclines Tetracycline 1 - 32 ≤ 4 8 ≥ 16
β-Lactam/β-Lactamase Inhibitor Combinations Piperacillin-tazobactam 0.5 - 128 ≤ 16 32 - 64 ≥ 128
Penems Imipenem 0.125 - 16 ≤ 1 2 ≥ 4
Cephems Cefepime4 0.125 - 32 ≤ 2 N/A ≥ 16
Cefotaxime 0.125 - 128 ≤ 1 2 ≥ 4
Ceftazidime 0.125 - 128 ≤ 4 8 ≥ 16
Monobactams Aztreonam 0.125 - 32 ≤ 4 8 ≥ 16
*No CLSI interpretative criteria for this bacterium/antimicrobial combination currently available. NARMS established breakpoints were used for resistance monitoring.
4 Cefepime MICs above the susceptible range and below the resisatant range are Susceptible Dose Dependent (SDD) according to CLSI guidelines (M100-S24)
2 Only a susceptible breakpoint ( ≤ 0.25 µg/ml) has been established. Isolates with an MIC ≥ 0.5 µg/ml are reported as nonsusceptible.
Antimicrobial Agent Antimicrobial Class
Breakpoints (µg/ml)
Susceptible Intermediate ResistantConcentration Range (µg/ml)
1 Breakpoints were adopted from CLSI (Clinical and Laboratory Standards Institute, M100-S22) where available
Breakpoints (µg/ml)
Antimicrobial Class Antimicrobial Agent Concentration Range (µg/ml) Intermediate Resistant
Table 4. Interpretive Criteria used for Antimicrobial Susceptibility Testing of Salmonella and E. coli Resistant to Ceftriaxone or Ceftiofur, NARMS Retail Meat, 2012
Table 3. Interpretive Criteria used for Antimicrobial Susceptibility Testing of Enterococcus , NARMS Retail Meat, 20121
Susceptible
3 Only a susceptible breakpoint ( ≤ 4 µg/ml) has been established for E.faecalis . Isolates with an MIC ≥ 8 µg/ml are reported as nonsusceptible. There are no established CLSI breakpoints for E. faecium and E. hirae .
16
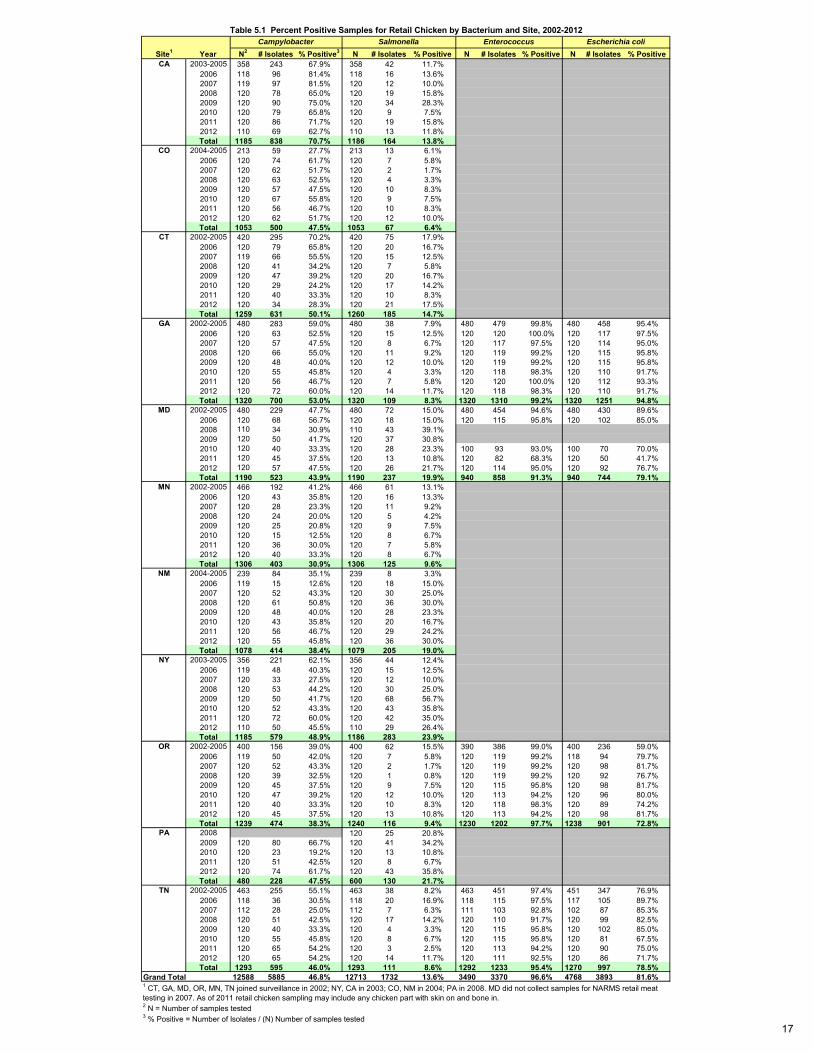
Site1 Year N2 # Isolates % Positive3 N # Isolates % Positive N # Isolates % Positive N # Isolates % PositiveCA 2003-2005 358 243 67.9% 358 42 11.7%
2006 118 96 81.4% 118 16 13.6%2007 119 97 81.5% 120 12 10.0%2008 120 78 65.0% 120 19 15.8%2009 120 90 75.0% 120 34 28.3%2010 120 79 65.8% 120 9 7.5%2011 120 86 71.7% 120 19 15.8%2012 110 69 62.7% 110 13 11.8%Total 1185 838 70.7% 1186 164 13.8%
CO 2004-2005 213 59 27.7% 213 13 6.1%2006 120 74 61.7% 120 7 5.8%2007 120 62 51.7% 120 2 1.7%2008 120 63 52.5% 120 4 3.3%2009 120 57 47.5% 120 10 8.3%2010 120 67 55.8% 120 9 7.5%2011 120 56 46.7% 120 10 8.3%2012 120 62 51.7% 120 12 10.0%Total 1053 500 47.5% 1053 67 6.4%
CT 2002-2005 420 295 70.2% 420 75 17.9%2006 120 79 65.8% 120 20 16.7%2007 119 66 55.5% 120 15 12.5%2008 120 41 34.2% 120 7 5.8%2009 120 47 39.2% 120 20 16.7%2010 120 29 24.2% 120 17 14.2%2011 120 40 33.3% 120 10 8.3%2012 120 34 28.3% 120 21 17.5%Total 1259 631 50.1% 1260 185 14.7%
GA 2002-2005 480 283 59.0% 480 38 7.9% 480 479 99.8% 480 458 95.4%2006 120 63 52.5% 120 15 12.5% 120 120 100.0% 120 117 97.5%2007 120 57 47.5% 120 8 6.7% 120 117 97.5% 120 114 95.0%2008 120 66 55.0% 120 11 9.2% 120 119 99.2% 120 115 95.8%2009 120 48 40.0% 120 12 10.0% 120 119 99.2% 120 115 95.8%2010 120 55 45.8% 120 4 3.3% 120 118 98.3% 120 110 91.7%2011 120 56 46.7% 120 7 5.8% 120 120 100.0% 120 112 93.3%2012 120 72 60.0% 120 14 11.7% 120 118 98.3% 120 110 91.7%Total 1320 700 53.0% 1320 109 8.3% 1320 1310 99.2% 1320 1251 94.8%
MD 2002-2005 480 229 47.7% 480 72 15.0% 480 454 94.6% 480 430 89.6%2006 120 68 56.7% 120 18 15.0% 120 115 95.8% 120 102 85.0%2008 110 34 30.9% 110 43 39.1%2009 120 50 41.7% 120 37 30.8%2010 120 40 33.3% 120 28 23.3% 100 93 93.0% 100 70 70.0%2011 120 45 37.5% 120 13 10.8% 120 82 68.3% 120 50 41.7%2012 120 57 47.5% 120 26 21.7% 120 114 95.0% 120 92 76.7%Total 1190 523 43.9% 1190 237 19.9% 940 858 91.3% 940 744 79.1%
MN 2002-2005 466 192 41.2% 466 61 13.1%2006 120 43 35.8% 120 16 13.3%2007 120 28 23.3% 120 11 9.2%2008 120 24 20.0% 120 5 4.2%2009 120 25 20.8% 120 9 7.5%2010 120 15 12.5% 120 8 6.7%2011 120 36 30.0% 120 7 5.8%2012 120 40 33.3% 120 8 6.7%Total 1306 403 30.9% 1306 125 9.6%
NM 2004-2005 239 84 35.1% 239 8 3.3%2006 119 15 12.6% 120 18 15.0%2007 120 52 43.3% 120 30 25.0%2008 120 61 50.8% 120 36 30.0%2009 120 48 40.0% 120 28 23.3%2010 120 43 35.8% 120 20 16.7%2011 120 56 46.7% 120 29 24.2%2012 120 55 45.8% 120 36 30.0%Total 1078 414 38.4% 1079 205 19.0%
NY 2003-2005 356 221 62.1% 356 44 12.4%2006 119 48 40.3% 120 15 12.5%2007 120 33 27.5% 120 12 10.0%2008 120 53 44.2% 120 30 25.0%2009 120 50 41.7% 120 68 56.7%2010 120 52 43.3% 120 43 35.8%2011 120 72 60.0% 120 42 35.0%2012 110 50 45.5% 110 29 26.4%Total 1185 579 48.9% 1186 283 23.9%
OR 2002-2005 400 156 39.0% 400 62 15.5% 390 386 99.0% 400 236 59.0%2006 119 50 42.0% 120 7 5.8% 120 119 99.2% 118 94 79.7%2007 120 52 43.3% 120 2 1.7% 120 119 99.2% 120 98 81.7%2008 120 39 32.5% 120 1 0.8% 120 119 99.2% 120 92 76.7%2009 120 45 37.5% 120 9 7.5% 120 115 95.8% 120 98 81.7%2010 120 47 39.2% 120 12 10.0% 120 113 94.2% 120 96 80.0%2011 120 40 33.3% 120 10 8.3% 120 118 98.3% 120 89 74.2%2012 120 45 37.5% 120 13 10.8% 120 113 94.2% 120 98 81.7%Total 1239 474 38.3% 1240 116 9.4% 1230 1202 97.7% 1238 901 72.8%
PA 2008 120 25 20.8%2009 120 80 66.7% 120 41 34.2%2010 120 23 19.2% 120 13 10.8%2011 120 51 42.5% 120 8 6.7%2012 120 74 61.7% 120 43 35.8%Total 480 228 47.5% 600 130 21.7%
TN 2002-2005 463 255 55.1% 463 38 8.2% 463 451 97.4% 451 347 76.9%2006 118 36 30.5% 118 20 16.9% 118 115 97.5% 117 105 89.7%2007 112 28 25.0% 112 7 6.3% 111 103 92.8% 102 87 85.3%2008 120 51 42.5% 120 17 14.2% 120 110 91.7% 120 99 82.5%2009 120 40 33.3% 120 4 3.3% 120 115 95.8% 120 102 85.0%2010 120 55 45.8% 120 8 6.7% 120 115 95.8% 120 81 67.5%2011 120 65 54.2% 120 3 2.5% 120 113 94.2% 120 90 75.0%2012 120 65 54.2% 120 14 11.7% 120 111 92.5% 120 86 71.7%Total 1293 595 46.0% 1293 111 8.6% 1292 1233 95.4% 1270 997 78.5%
12588 5885 46.8% 12713 1732 13.6% 3490 3370 96.6% 4768 3893 81.6%
2 N = Number of samples tested3 % Positive = Number of Isolates / (N) Number of samples tested
Grand Total1 CT, GA, MD, OR, MN, TN joined surveillance in 2002; NY, CA in 2003; CO, NM in 2004; PA in 2008. MD did not collect samples for NARMS retail meat testing in 2007. As of 2011 retail chicken sampling may include any chicken part with skin on and bone in.
Table 5.1 Percent Positive Samples for Retail Chicken by Bacterium and Site, 2002-2012Campylobacter Salmonella Enterococcus Escherichia coli
17
Site1 Year N2 # Isolates % Positive3 N # Isolates % Positive N # Isolates % Positive N # Isolates % PositiveCA 2003-2005 359 1 0.3% 359 30 8.4%
2006 120 0 0.0% 120 5 4.2%2007 120 1 0.8% 120 8 6.7%2008 119 0 0.0% 119 12 10.1%2009 120 1 0.8% 120 12 10.0%2010 120 0 0.0% 120 17 14.2%2011 120 0 0.0% 120 11 9.2%2012 110 1 0.9% 110 9 8.2%Total 1188 4 0.3% 1188 104 8.8%
CO 2004-2005 217 0 0.0% 217 25 11.5%2006 120 10 8.3% 120 17 14.2%2007 120 10 8.3% 120 20 16.7%2008 120 14 11.7% 120 30 25.0%2009 120 3 2.5% 120 19 15.8%2010 120 1 0.8% 120 15 12.5%2011 120 11 9.2% 120 20 16.7%2012 119 2 1.7% 119 9 7.6%Total 1056 51 4.8% 1056 155 14.7%
CT 2002-2005 420 7 1.7% 420 67 16.0%2006 120 2 1.7% 120 8 6.7%2007 120 1 0.8% 120 14 11.7%2008 120 1 0.8% 120 9 7.5%2009 120 2 1.7% 120 13 10.8%2010 120 0 0.0% 120 7 5.8%2011 120 0 0.0% 120 11 9.2%2012 120 1 0.8% 120 12 10.0%Total 1260 14 1.1% 1260 141 11.2%
GA 2002-2005 480 8 1.7% 480 116 24.2% 480 480 100.0% 480 456 95.0%2006 120 6 5.0% 120 28 23.3% 120 117 97.5% 120 116 96.7%2007 120 7 5.8% 120 48 40.0% 120 120 100.0% 120 120 100.0%2008 120 3 2.5% 120 47 39.2% 120 120 100.0% 120 120 100.0%2009 120 4 3.3% 120 43 35.8% 120 120 100.0% 120 119 99.2%2010 120 0 0.0% 120 20 16.7% 120 117 97.5% 120 120 100.0%2011 120 3 2.5% 120 22 18.3% 120 115 95.8% 120 118 98.3%2012 120 1 0.8% 120 13 10.8% 120 119 99.2% 120 118 98.3%Total 1320 32 2.4% 1320 337 25.5% 1320 1308 99.1% 1320 1287 97.5%
MD 2002-2005 480 5 1.0% 480 59 12.3% 480 433 90.2% 480 427 89.0%2006 120 0 0.0% 120 12 10.0% 120 99 82.5% 120 95 79.2%2008 110 1 0.9% 110 30 27.3%2009 120 2 1.7% 120 13 10.8%2010 120 2 1.7% 120 18 15.0% 100 93 93.0% 100 78 78.0%2011 120 2 1.7% 120 18 15.0% 120 96 80.0% 120 87 72.5%2012 120 0 0.0% 120 7 5.8% 120 118 98.3% 120 105 87.5%Total 1190 12 1.0% 1190 157 13.2% 940 839 89.3% 940 792 84.3%
MN 2002-2005 477 14 2.9% 477 60 12.6%2006 120 4 3.3% 120 25 20.8%2007 119 6 5.0% 120 27 22.5%2008 120 3 2.5% 120 17 14.2%2009 120 4 3.3% 120 21 17.5%2010 120 3 2.5% 120 14 11.7%2011 120 1 0.8% 120 13 10.8%2012 120 1 0.8% 120 5 4.2%Total 1316 36 2.7% 1317 182 13.8%
NM 2004-2005 238 2 0.8% 238 29 12.2%2006 120 0 0.0% 120 19 15.8%2007 118 5 4.2% 118 42 35.6%2008 120 4 3.3% 120 53 44.2%2009 120 2 1.7% 120 30 25.0%2010 120 4 3.3% 120 43 35.8%2011 120 6 5.0% 120 35 29.2%2012 120 0 0.0% 120 13 10.8%Total 1076 23 2.1% 1076 264 24.5%
NY 2003-2005 360 1 0.3% 360 43 11.9%2006 120 2 1.7% 120 15 12.5%2007 120 2 1.7% 120 10 8.3%2008 120 0 0.0% 120 18 15.0%2009 120 0 0.0% 120 12 10.0%2010 120 0 0.0% 120 18 15.0%2011 120 1 0.8% 120 13 10.8%2012 110 0 0.0% 110 9 8.2%Total 1190 6 0.5% 1190 138 11.6%
OR 2002-2005 400 0 0.0% 400 29 7.3% 390 356 91.3% 400 191 47.8%2006 120 0 0.0% 120 8 6.7% 120 115 95.8% 120 76 63.3%2007 120 0 0.0% 120 2 1.7% 120 104 86.7% 120 104 86.7%2008 120 1 0.8% 120 4 3.3% 120 113 94.2% 120 89 74.2%2009 120 2 1.7% 120 10 8.3% 120 103 85.8% 120 84 70.0%2010 120 0 0.0% 120 14 11.7% 120 89 74.2% 120 86 71.7%2011 120 0 0.0% 120 6 5.0% 120 107 89.2% 120 75 62.5%2012 120 0 0.0% 120 5 4.2% 120 117 97.5% 120 84 70.0%Total 1240 3 0.2% 1240 78 6.3% 1230 1104 89.8% 1240 789 63.6%
PA 2008 120 11 9.2%2009 120 4 3.3% 120 8 6.7%2010 120 1 0.8% 120 19 15.8%2011 120 3 2.5% 120 4 3.3%2012 120 1 0.8% 120 5 4.2%Total 480 9 1.9% 600 47 7.8%
TN 2002-2005 428 3 0.7% 428 55 12.9% 428 425 99.3% 418 335 80.1%2006 106 0 0.0% 106 22 20.8% 105 104 99.0% 106 101 95.3%2007 108 2 1.9% 108 19 17.6% 108 105 97.2% 98 91 92.9%2008 120 4 3.3% 120 15 12.5% 120 110 91.7% 120 91 75.8%2009 120 1 0.8% 120 12 10.0% 120 105 87.5% 120 103 85.8%2010 120 2 1.7% 120 17 14.2% 120 118 98.3% 120 85 70.8%2011 120 4 3.3% 120 9 7.5% 120 117 97.5% 120 88 73.3%2012 116 0 0.0% 116 4 3.4% 116 106 91.4% 116 84 72.4%Total 1238 16 1.3% 1238 153 12.4% 1237 1190 96.2% 1218 978 80.3%
12554 206 1.6% 12675 1756 13.9% 3490 3251 93.2% 4718 3846 81.5%
2 N = Number of samples tested3 % Positive = Number of Isolates / (N) Number of samples tested
Grand Total1 CT, GA, MD, OR, MN, TN joined surveillance in 2002; NY, CA in 2003; CO, NM in 2004; PA in 2008. MD did not collect samples for NARMS retail meat testing in 2007.
Table 5.2 Percent Positive Samples for Ground Turkey by Bacterium and Site, 2002-2012Campylobacter Salmonella Enterococcus Escherichia coli
18
Site1 Year N2 # Isolates % Positive3 N # Isolates % Positive N # Isolates % Positive N # Isolates % PositiveCA 2003-2005 360 0 0.0% 360 3 0.8%
2006 120 0 0.0% 120 1 0.8%2007 119 0 0.0% 119 2 1.7%2008 120 2 1.7%2009 120 0 0.0%2010 120 1 0.8%2011 120 0 0.0%2012 110 1 0.9%Total 599 0 0.0% 1189 10 0.8%
CO 2004-2005 222 0 0.0% 222 0 0.0%2006 120 0 0.0% 120 2 1.7%2007 120 0 0.0% 120 1 0.8%2008 120 0 0.0%2009 120 0 0.0%2010 120 1 0.8%2011 120 0 0.0%2012 120 0 0.0%Total 462 0 0.0% 1062 4 0.4%
CT 2002-2005 420 0 0.0% 420 13 3.1%2006 116 0 0.0% 116 2 1.7%2007 120 0 0.0% 120 0 0.0%2008 120 0 0.0%2009 120 2 1.7%2010 120 0 0.0%2011 120 0 0.0%2012 120 2 1.7%Total 656 0 0.0% 1256 19 1.5%
GA 2002-2005 480 0 0.0% 480 5 1.0% 480 472 98.3% 480 376 78.3%2006 120 0 0.0% 120 4 3.3% 120 118 98.3% 119 94 79.0%2007 120 0 0.0% 120 0 0.0% 120 120 100.0% 120 100 83.3%2008 120 0 0.0% 120 117 97.5% 120 100 83.3%2009 120 1 0.8% 120 119 99.2% 120 101 84.2%2010 120 0 0.0% 120 119 99.2% 120 88 73.3%2011 120 5 4.2% 120 114 95.0% 120 61 50.8%2012 120 1 0.8% 120 117 97.5% 120 80 66.7%Total 720 0 0.0% 1320 16 1.2% 1320 1296 98.2% 1319 1000 75.8%
MD 2002-2005 480 1 0.2% 480 6 1.3% 480 412 85.8% 480 353 73.5%2006 120 0 0.0% 120 0 0.0% 120 100 83.3% 120 47 39.2%2008 110 3 2.7%2009 120 0 0.0%2010 120 0 0.0% 100 86 86.0% 100 52 52.0%2011 120 3 2.5% 120 85 70.8% 120 34 28.3%2012 120 2 1.7% 120 116 96.7% 120 54 45.0%Total 600 1 0.2% 1190 14 1.2% 940 799 85.0% 940 540 57.4%
MN 2002-2005 473 0 0.0% 473 2 0.4%2006 120 0 0.0% 120 1 0.8%2007 120 0 0.0% 120 3 2.5%2008 120 0 0.0%2009 120 1 0.8%2010 120 0 0.0%2011 120 0 0.0%2012 120 1 0.8%Total 713 0 0.0% 1313 8 0.6%
NM 2004-2005 240 0 0.0% 240 1 0.4%2006 120 0 0.0% 120 2 1.7%2007 120 0 0.0% 120 3 2.5%2008 120 4 3.3%2009 120 5 4.2%2010 120 1 0.8%2011 120 0 0.0%2012 120 2 1.7%Total 480 0 0.0% 1080 18 1.7%
NY 2003-2005 360 0 0.0% 360 0 0.0%2006 120 0 0.0% 120 0 0.0%2007 120 0 0.0% 120 0 0.0%2008 120 0 0.0%2009 120 0 0.0%2010 120 2 1.7%2011 120 0 0.0%2012 110 3 2.7%Total 600 0 0.0% 1190 5 0.4%
OR 2002-2005 400 0 0.0% 400 9 0.0% 400 365 91.3% 400 239 59.8%2006 120 0 0.0% 120 2 1.7% 120 108 90.0% 119 69 58.0%2007 120 0 0.0% 120 1 0.8% 120 113 94.2% 120 82 68.3%2008 120 0 0.0% 120 107 89.2% 120 61 50.8%2009 120 0 0.0% 120 94 78.3% 120 60 50.0%2010 120 0 0.0% 120 97 80.8% 120 51 42.5%2011 120 0 0.0% 120 116 96.7% 120 57 47.5%2012 120 0 0.0% 120 114 95.0% 120 63 52.5%Total 640 0 0.0% 1240 12 1.0% 1240 1114 89.8% 1239 682 55.0%
PA 2008 120 2 1.7%2009 120 1 0.8%2010 120 1 0.8%2011 120 0 0.0%2012 120 1 0.8%Total 600 5 0.8%
TN 2002-2005 469 0 0.0% 469 2 0.4% 469 461 98.3% 457 292 63.9%2006 120 0 0.0% 120 5 4.2% 120 112 93.3% 120 85 70.8%2007 112 5 4.5% 112 3 2.7% 112 101 90.2% 103 74 71.8%2008 120 13 10.8% 120 113 94.2% 120 89 74.2%2009 120 4 3.3% 120 114 95.0% 120 86 71.7%2010 120 1 0.8% 120 113 94.2% 120 78 65.0%2011 120 1 0.8% 120 108 90.0% 120 63 52.5%2012 120 0 0.0% 120 106 88.3% 120 74 61.7%Total 701 5 0.7% 1301 29 2.2% 1301 1228 94.4% 1280 841 65.7%
6171 6 0.1% 12741 140 1.1% 4801 4437 92.4% 4778 3063 64.1%
2 N = Number of samples tested3 % Positive = Number of Isolates / (N) Number of samples tested
Grand Total1 CT, GA, MD, OR, MN, TN joined surveillance in 2002; NY, CA in 2003; CO, NM in 2004; PA in 2008. MD did not collect samples for NARMS retail meat testing in 2007.
Table 5.3 Percent Positive Samples for Ground Beef by Bacterium and Site, 2002-2012Campylobacter Salmonella Enterococcus Escherichia coli
19

Site1 Year N2 # Isolates % Positive3 N # Isolates % Positive N # Isolates % Positive N # Isolates % PositiveCA 2003-2005 360 3 0.8% 360 4 1.1%
2006 120 0 0.0% 120 0 0.0%2007 117 0 0.0% 117 1 0.9%2008 117 0 0.0%2009 120 3 2.5%2010 120 0 0.0%2011 120 0 0.0%2012 110 0 0.0%Total 597 3 0.5% 1184 8 0.7%
CO 2004-2005 215 0 0.0% 215 0 0.0%2006 116 0 0.0% 116 0 0.0%2007 120 2 1.7% 120 2 1.7%2008 120 1 0.8%2009 120 0 0.0%2010 120 0 0.0%2011 120 0 0.0%2012 120 0 0.0%Total 451 2 0.4% 1051 3 0.3%
CT 2002-2005 420 3 0.7% 420 7 1.7%2006 120 0 0.0% 120 1 0.8%2007 120 0 0.0% 120 0 0.0%2008 120 0 0.0%2009 120 2 1.7%2010 120 1 0.8%2011 120 0 0.0%2012 120 0 0.0%Total 660 3 0.5% 1260 11 0.9%
GA 2002-2005 480 0 0.0% 480 4 0.8% 480 468 97.5% 480 258 45.8%2006 120 0 0.0% 120 0 0.0% 120 115 95.8% 120 65 54.2%2007 120 0 0.0% 120 3 2.5% 120 118 98.3% 120 71 59.2%2008 120 2 1.7% 120 114 95.0% 120 61 50.8%2009 120 2 1.7% 120 117 97.5% 120 69 57.5%2010 120 3 2.5% 120 115 95.8% 120 60 50.0%2011 120 1 0.8% 120 112 93.3% 120 49 40.8%2012 120 1 0.8% 120 119 99.2% 120 56 46.7%Total 720 0 0.0% 1320 16 1.2% 1320 1278 96.8% 1320 689 52.2%
MD 2002-2005 480 2 0.4% 480 10 2.1% 480 354 73.8% 480 257 53.5%2006 120 0 0.0% 120 0 0.0% 120 78 65.0% 120 36 30.0%2008 110 2 1.8%2009 120 0 0.0%2010 120 4 3.3% 100 81 81.0% 100 29 29.0%2011 120 3 2.5% 120 65 54.2% 120 23 19.2%2012 120 2 1.7% 120 101 84.2% 120 41 34.2%Total 600 2 0.3% 1190 21 1.8% 940 679 72.2% 940 386 41.1%
MN 2002-2005 463 1 0.2% 463 0 0.0%2006 120 0 0.0% 120 0 0.0%2007 119 0 0.0% 120 0 0.0%2008 120 2 1.7%2009 120 0 0.0%2010 120 0 0.0%2011 120 0 0.0%2012 120 0 0.0%Total 702 1 0.1% 1303 2 0.2%
NM 2004-2005 239 1 0.4% 239 0 0.0%2006 120 1 0.8% 120 2 1.7%2007 120 0 0.0% 120 6 5.0%2008 120 3 2.5%2009 120 0 0.0%2010 120 6 5.0%2011 120 9 7.5%2012 120 2 1.7%Total 479 2 0.4% 1079 28 2.6%
NY 2003-2005 360 0 0.0% 360 6 1.7%2006 120 0 0.0% 120 1 0.8%2007 120 1 0.8% 120 0 0.0%2008 120 0 0.0%2009 120 0 0.0%2010 120 2 1.7%2011 120 3 2.5%2012 110 2 1.8%Total 600 1 0.2% 1190 14 1.2%
OR 2002-2005 400 1 0.3% 400 3 0.8% 390 345 88.5% 400 119 29.8%2006 120 2 1.7% 120 4 3.3% 120 93 77.5% 118 36 30.5%2007 120 1 0.8% 120 0 0.0% 120 101 84.2% 120 35 29.2%2008 120 3 2.5% 120 107 89.2% 119 48 40.3%2009 120 0 0.0% 120 89 74.2% 120 29 24.2%2010 120 0 0.0% 120 98 81.7% 120 44 36.7%2011 120 4 3.3% 120 101 84.2% 120 38 31.7%2012 120 4 3.3% 120 94 78.3% 120 36 30.0%Total 640 4 0.6% 1240 18 1.5% 1230 1028 83.6% 1237 385 31.1%
PA 2008 120 0 0.0%2009 120 1 0.8%2010 120 3 2.5%2011 120 1 0.8%2012 120 1 0.8%Total 600 6 1.0%
TN 2002-2005 467 3 0.6% 467 1 0.2% 467 441 94.4% 452 205 45.4%2006 116 0 0.0% 116 0 0.0% 112 103 92.0% 114 45 39.5%2007 116 0 0.0% 116 6 5.2% 116 91 78.4% 116 46 39.7%2008 120 10 8.3% 120 88 73.3% 120 37 30.8%2009 120 0 0.0% 120 97 80.8% 120 49 40.8%2010 120 1 0.8% 120 112 93.3% 120 50 41.7%2011 120 7 5.8% 120 105 87.5% 120 36 30.0%2012 120 0 0.0% 120 102 85.0% 120 28 23.3%Total 699 3 0.4% 1299 25 1.9% 1295 1139 88.0% 1282 496 38.7%
6148 21 0.3% 12716 152 1.2% 4785 4124 86.2% 4779 1956 40.9%
2 N = Number of samples tested3 % Positive = Number of Isolates / (N) Number of samples tested
Grand Total1 CT, GA, MD, OR, MN, TN joined surveillance in 2002; NY, CA in 2003; CO, NM in 2004; PA in 2008. MD did not collect samples for NARMS retail meat testing in 2007.
Table 5.4 Percent Positive Samples for Pork Chop by Bacterium and Site, 2002-2012Campylobacter Salmonella Enterococcus Escherichia coli
20
2002 2003Bacterium (A) N n (%) N n (%) N n (%) N n (%) Bacterium (A) N n (%) N n (%) N n (%) N n (%)
Campylobacter (2513) 616 288 (46.8) 642 4 (1.0) 642 - - 613 5 (0.8) Campylobacter (3533) 897 469 (52.3) 857 5 (0.6) 880 1 (0.1) 899 4 (0.4)Salmonella (2513) 616 60 (9.7) 642 74 (11.5) 642 9 (1.4) 613 10 (1.6) Salmonella (3533) 897 83 (9.3) 857 114 (13.3) 880 10 (1.1) 899 5 (0.6)Enterococcus (1574) 390 381 (97.7) 395 387 (98.0) 399 383 (96.0) 390 369 (94.6) Enterococcus (1873) 477 466 (97.7) 447 418 (93.5) 470 432 (91.9) 479 426 (88.9)Escherichia coli (1574) 390 282 (72.3) 395 304 (77.0) 399 295 (73.9) 390 184 (47.2) Escherichia coli (1873) 477 396 (83.0) 447 333 (74.5) 470 311 (66.2) 479 218 (45.5)
2004 2005Bacterium (A) N n (%) N n (%) N n (%) N n (%) Bacterium (A) N n (%) N n (%) N n (%) N n (%)
Campylobacter (4699) 1172 706 (60.2) 1165 12 (1.0) 1186 - - 1176 3 (0.3) Campylobacter (4777) 1190 554 (46.6) 1195 20 (1.7) 1196 - - 1196 2 (0.2)Salmonella (4699) 1172 157 (13.4) 1165 142 (12.2) 1186 14 (1.2) 1176 11 (0.9) Salmonella (4781) 1194 153 (12.8) 1195 183 (15.3) 1196 8 (0.7) 1196 9 (0.8)Enterococcus (1900) 476 466 (97.9) 466 437 (93.8) 480 448 (93.3) 478 404 (84.5) Enterococcus (1880) 470 457 (97.2) 470 452 (96.2) 470 447 (95.1) 470 409 (87.0)Escherichia coli (1900) 476 400 (84.0) 466 376 (80.7) 480 338 (70.4) 478 232 (48.5) Escherichia coli (1871) 468 393 (84.0) 470 396 (84.3) 468 316 (67.5) 465 205 (44.1)
2006 2007Bacterium (A) N n (%) N n (%) N n (%) N n (%) Bacterium (A) N n (%) N n (%) N n (%) N n (%)
Campylobacter (4766) 1193 572 (47.9) 1185 24 (2.0) 1196 - - 1192 3 (0.3) Campylobacter (4278) 1070 475 (44.4) 1065 34 (3.2) 1071 5 (0.5) 1072 4 (0.4)Salmonella (4769) 1196 152 (12.7) 1185 159 (13.4) 1196 19 (1.6) 1192 8 (0.7) Salmonella (4282) 1072 99 (9.2) 1066 190 (17.8) 1071 13 (1.2) 1073 18 (1.7)Enterococcus (1893) 478 469 (98.1) 465 435 (93.5) 478 438 (91.6) 472 389 (82.4) Enterococcus (1407) 351 339 (96.6) 348 329 (94.5) 352 334 (94.9) 356 310 (87.1)Escherichia coli (1884) 475 418 (88.0) 466 388 (83.3) 478 295 (61.7) 472 182 (38.6) Escherichia coli (1379) 342 299 (87.4) 338 315 (93.2) 343 256 (74.6) 356 152 (42.7)
2008 2009Bacterium (A) N n (%) N n (%) N n (%) N n (%) Bacterium (A) N n (%) N n (%) N n (%) N n (%)
Campylobacter (2379) 1190 510 (42.9) 1189 31 (2.6) Campylobacter (2640) 1320 580 (43.9) 1320 25 (1.9)Salmonella (5236) 1310 198 (15.1) 1309 246 (18.8) 1310 24 (1.8) 1307 23 (1.8) Salmonella (5280) 1320 272 (20.6) 1320 193 (14.6) 1320 14 (1.1) 1320 8 (0.6)Enterococcus (1440) 360 348 (96.7) 360 343 (95.3) 360 337 (93.6) 360 309 (85.8) Enterococcus (1440) 360 349 (96.9) 360 328 (91.1) 360 327 (90.8) 360 303 (84.2)Escherichia coli (1440) 360 306 (85.0) 360 300 (83.3) 360 250 (69.4) 359 146 (40.7) Escherichia coli (1440) 360 315 (87.5) 360 306 (85.0) 360 247 (68.6) 360 147 (40.8)
2010 2011Bacterium (A) N n (%) N n (%) N n (%) N n (%) Bacterium (A) N n (%) N n (%) N n (%) N n (%)
Campylobacter (2640) 1320 505 (38.3) 1320 13 (1.0) Campylobacter (2640) 1320 603 (45.7) 1320 31 (2.3)Salmonella (5280) 1320 171 (13.0) 1320 202 (15.3) 1320 7 (0.5) 1320 20 (1.5) Salmonella (5280) 1320 158 (12.0) 1320 162 (12.3) 1320 9 (0.7) 1320 28 (2.1)Enterococcus (1840) 460 439 (95.4) 460 417 (90.7) 460 415 (90.2) 460 406 (88.3) Enterococcus (1920) 480 433 (90.2) 480 435 (90.6) 480 423 (88.1) 480 383 (79.8)Escherichia coli (1840) 460 357 (77.6) 460 369 (80.2) 460 269 (58.5) 460 183 (39.8) Escherichia coli (1920) 480 341 (71.0) 480 368 (76.7) 480 215 (44.8) 480 146 (30.4)
2012Bacterium (A) N n (%) N n (%) N n (%) N n (%)
Campylobacter (2595) 1300 617 (47.5) 1295 7 (0.5)Salmonella (5195) 1300 229 (17.6) 1295 91 (7.0) 1300 13 (1.0) 1300 12 (0.9)Enterococcus (1916) 480 456 (95.0) 476 460 (96.6) 480 453 (94.4) 480 416 (86.7)Escherichia coli (1916) 480 386 (80.4) 476 391 (82.1) 480 271 (56.5) 480 161 (33.5)
1 As of 2011 retail chicken sampling may include any chicken part with skin on and bone in.2 Gray areas indicate not tested; A = Total number of meat sampled; N = Number of samples tested per meat type; n = Number of isolates; % = (n) Number of isolates / (N) Number of samples per meat type
Retail Chicken Ground Turkey Ground Beef Pork Chop
Ground Beef Pork Chop
Retail Chicken Ground Turkey Ground Beef Pork Chop Retail Chicken Ground Turkey Ground Beef Pork Chop
Retail Chicken Ground Turkey Ground Beef Pork Chop Retail Chicken Ground Turkey
Ground Beef Pork Chop
Retail Chicken Ground Turkey Ground Beef Pork Chop Retail Chicken Ground Turkey Ground Beef Pork Chop
Retail Chicken Ground Turkey Ground Beef Pork Chop Retail Chicken Ground Turkey
Table 6. Percent Positive Samples by Bacterium and Meat Type, 2002-20121, 2
Retail Chicken Ground Turkey Ground Beef Pork Chop Retail Chicken Ground Turkey Ground Beef Pork Chop
21
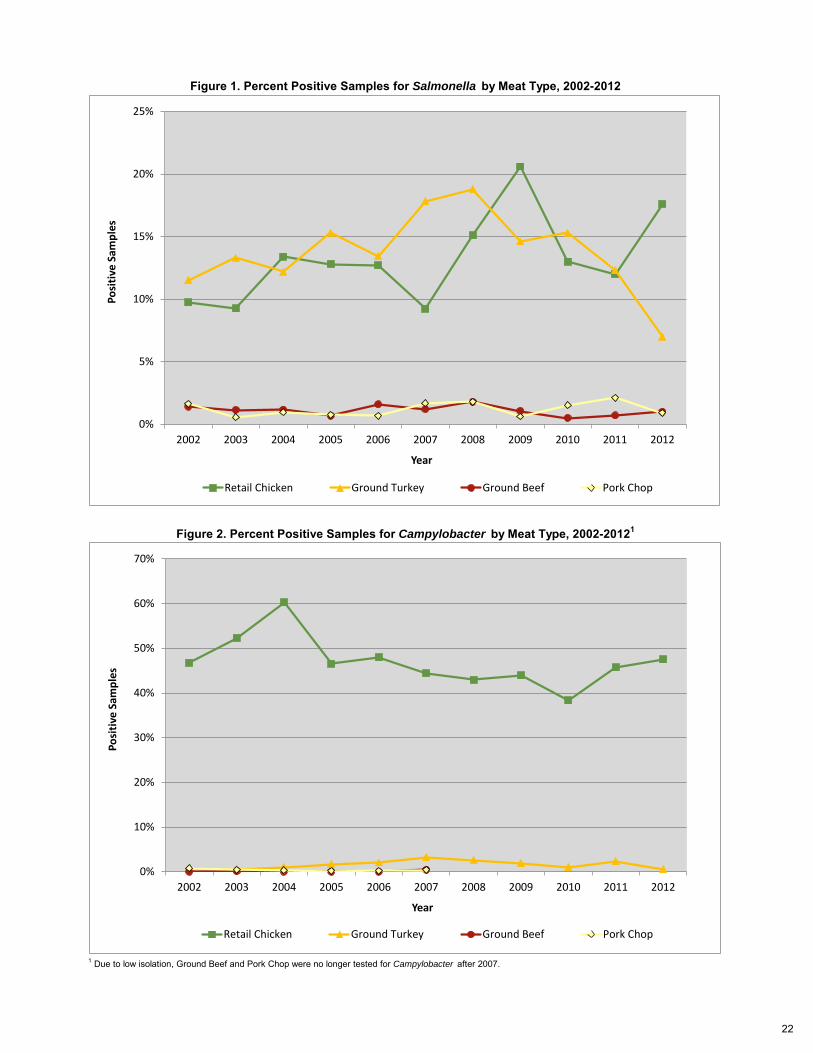
1 Due to low isolation, Ground Beef and Pork Chop were no longer tested for Campylobacter after 2007.
Figure 1. Percent Positive Samples for Salmonella by Meat Type, 2002-2012
Figure 2. Percent Positive Samples for Campylobacter by Meat Type, 2002-20121
0%
5%
10%
15%
20%
25%
2002 2003 2004 2005 2006 2007 2008 2009 2010 2011 2012
Posi
tive
Sam
ples
Year
Retail Chicken Ground Turkey Ground Beef Pork Chop
0%
10%
20%
30%
40%
50%
60%
70%
2002 2003 2004 2005 2006 2007 2008 2009 2010 2011 2012
Posi
tive
Sam
ples
Year
Retail Chicken Ground Turkey Ground Beef Pork Chop
22
n2 %3 n % n % n %1. Typhimurium (104) 88 84.6% 9 8.6% 1 1.0% 6 5.8%2. Kentucky (65) 62 95.4% 1 1.5% 1 1.5% 1 1.5%3. Enteritidis (30) 26 86.7% 4 13.3%4. Heidelberg (23) 17 73.9% 5 21.7% 1 4.3%5. IIIa 18:z4,z23:- (16) 16 100.0%6. Thompson (11) 11 100.0%7. Saintpaul (9) 9 100.0%8. Agona (8) 7 87.5% 1 12.5%9. Hadar (8) 8 100.0%10. Infantis (8) 3 37.5% 3 37.5% 1 12.5% 1 12.5%11. Schwarzengrund (8) 1 12.5% 7 87.5%12. I 4,5,12:i:- (6) 6 100.0%13. Montevideo (6) 4 66.7% 1 16.7% 1 16.7%14. Reading (5) 4 80.0% 1 20.0%15. Anatum (4) 1 25.0% 2 50.0% 1 25.0%16. Dublin (4) 4 100.0%17. Mbandaka (4) 4 100.0%18. Newport (4) 1 25.0% 2 50.0% 1 25.0%19. Senftenberg (3) 1 33.3% 2 66.7%20. Albany (2) 2 100.0%21. Braenderup (2) 2 100.0%22. Brandenburg (2) 2 100.0%23. Cerro (2) 2 100.0%24. Derby (2) 1 100.0% 1 100.0%25. Gaminara (2) 1 100.0% 1 50.0%26. Berta (1) 1 50.0%27. I 4,12:d:- (1) 1 100.0%28. I 9,12:nonmotile (1) 1 100.0%29. Javiana (1) 1 100.0%30. London (1) 1 100.0%31. Muenchen (1) 1 100.0%32. Worthington (1) 1 100.0%
Total (345) 229 66.4% 91 26.4% 13 3.8% 12 3.5%1 N = Total number of Salmonella isolates for a particular serotype2 n = number of # of isolates with a given serotype per meat3 % = (n) # of isolates per serotype per meat / (N) total # of isolates per serotype
Table 7. Distribution of Salmonella Serotype among Meat Types, 2012
Serotype (N)1
Retail Ground Ground Pork Chicken Turkey Beef Chop
23
GEN KAN STR AMC TIO AXO FOX FIS2 COT AZI3 AMP CHL CIP NAL TET(MIC ≥ 16) (MIC ≥ 64) (MIC ≥ 64) (MIC ≥ 32) (MIC ≥ 32) (MIC ≥ 4) (MIC ≥ 32) (MIC ≥ (MIC ≥ 4) (MIC > 16) (MIC ≥ 32) (MIC ≥ 512) (MIC ≥ 1) (MIC ≥ 32) (MIC ≥ 16)
2002 (60) 10.0% 6.7% 28.3% 10.0% 10.0% 10.0% 10.0% 16.7% – 16.7% – – – 33.3%2003 (83) 6.0% 4.8% 26.5% 25.3% 25.3% 26.5% 25.3% 14.5% – 33.7% 2.4% – 1.2% 27.7%2004 (157) 3.8% 11.5% 28.0% 24.8% 24.8% 24.8% 24.8% 28.7% – 30.6% 1.9% – – 46.5%2005 (153) 3.3% 4.6% 30.1% 21.6% 20.9% 21.6% 20.9% 17.0% – 26.8% 0.7% – 0.7% 43.8%
Retail 2006 (152) 9.2% 9.9% 36.2% 19.1% 19.1% 19.1% 18.4% 23.0% 1.3% 22.4% 2.6% – 0.7% 46.7%Chicken 2007 (99) 6.1% 5.1% 30.3% 16.2% 16.2% 16.2% 15.2% 25.3% – 18.2% 1.0% – – 41.4%
2008 (198) 7.1% 10.6% 23.7% 22.2% 22.2% 22.2% 21.2% 38.9% – 28.3% 0.5% – – 46.5%2009 (272) 3.3% 15.4% 23.2% 37.5% 37.1% 37.9% 33.1% 48.2% 0.4% 45.6% – – 0.4% 60.3%2010 (171) 5.8% 8.2% 25.1% 33.3% 33.3% 34.5% 28.7% 44.4% – 38.0% 2.3% – – 56.7%2011 (158) 3.8% 11.4% 38.6% 33.5% 34.2% 33.5% 25.9% 44.9% 1.3% 0.6% 40.5% 0.6% – – 65.8%2012 (229) 5.2% 4.8% 30.6% 27.9% 27.5% 27.9% 22.7% 37.1% – – 29.3% – – – 48.5%P-value4 0.3340 0.9637 0.7085 0.0038 0.0041 0.0039 0.4466 <0.0001 0.5537 N/A 0.0331 0.0940 N/A 0.1833 <0.00012002 (74) 14.9% 18.9% 37.8% 12.2% 8.1% 8.1% 8.1% 20.3% 1.4% 16.2% 1.4% 2.7% 8.1% 55.4%2003 (114) 22.8% 27.2% 45.6% 11.4% 2.6% 2.6% 2.6% 33.3% – 28.9% 0.9% – 4.4% 39.5%2004 (142) 20.4% 18.3% 34.5% 7.7% 4.9% 5.6% 4.9% 28.2% – 20.4% 2.8% – – 56.3%2005 (183) 26.8% 20.2% 44.3% 8.7% 7.1% 7.1% 7.1% 34.4% 0.5% 26.8% 0.5% – 1.1% 39.9%
Ground 2006 (159) 28.9% 15.1% 40.9% 5.0% 5.0% 5.0% 5.0% 32.1% – 25.8% 0.6% – – 56.0%Turkey 2007 (190) 24.7% 23.7% 45.8% 5.3% 5.3% 5.8% 5.3% 34.7% 0.5% 42.6% 1.6% – 2.6% 67.4%
2008 (246) 27.6% 17.9% 58.5% 5.7% 4.9% 4.9% 4.9% 27.6% 0.4% 51.2% 1.6% – 0.4% 66.3%2009 (193) 18.7% 6.7% 28.0% 5.7% 5.7% 5.7% 5.7% 20.2% 1.6% 58.0% 1.6% – – 64.8%2010 (202) 16.3% 15.3% 31.7% 16.3% 15.8% 16.3% 15.3% 24.8% – 48.0% 2.5% – 0.5% 54.0%2011 (162) 32.1% 14.8% 56.5% 21.0% 20.4% 22.4% 17.9% 26.5% 3.7% – 58.0% 3.7% – – 64.8%2012 (91) 26.4% 13.2% 44.0% 17.6% 16.5% 17.6% 15.4% 27.5% – – 40.7% 3.3% – – 45.1%P-value 0.4158 0.0003 0.4164 0.0021 <0.0001 <0.0001 <0.0001 0.0995 0.0562 N/A <0.0001 0.3434 N/A <0.0001 0.00042002 (9) – – 22.2% 22.2% 22.2% 22.2% 22.2% 22.2% – 22.2% 22.2% – – 22.2%2003 (10) – – 40.0% 40.0% 40.0% 40.0% 40.0% 40.0% – 40.0% 40.0% – – 40.0%2004 (14) – – 14.3% 14.3% 14.3% 14.3% 14.3% 14.3% 7.1% 21.4% 14.3% – – 14.3%2005 (8) 25.0% 25.0% 25.0% – – – – 25.0% – 25.0% 12.5% – – 12.5%
Ground 2006 (19) – 5.3% 10.5% – – – – 10.5% – 10.5% 5.3% – – 21.1%Beef 2007 (13) 7.7% – – – – – – 7.7% – – – – – –
2008 (24) 8.3% 8.3% 20.8% 8.3% 8.3% 8.3% 8.3% 20.8% – 12.5% 12.5% – – 20.8%2009 (14) 14.3% 14.3% 28.6% 14.3% 14.3% 14.3% 14.3% 35.7% – 28.6% 21.4% – 14.3% 42.9%2010 (7) – 14.3% 42.9% 28.6% 28.6% 28.6% 28.6% 42.9% – 28.6% 42.9% – – 42.9%2011 (9) – 11.1% 33.3% 11.1% 11.1% 11.1% – – – – 11.1% – – – 44.4%2012 (13) – 23.1% 23.1% 15.4% 15.4% 15.4% 15.4% 23.1% – – 23.1% 23.1% – – 23.1%P-value 0.9810 0.0327 0.5479 0.5570 0.5570 0.5570 0.3381 0.9093 N/A N/A 0.5895 0.8605 N/A N/A 0.27732002 (10) 30.0% 10.0% 70.0% 20.0% 20.0% 20.0% 20.0% 70.0% 20.0% 40.0% 40.0% – – 70.0%2003 (5) – – 40.0% 20.0% 20.0% 20.0% 20.0% 40.0% – 40.0% 40.0% – – 80.0%2004 (11) – 9.1% 27.3% – – – – 18.2% – 9.1% 18.2% – – 54.5%2005 (9) – – 33.3% – – – – 33.3% 11.1% 22.2% 22.2% – – 55.6%
Pork 2006 (8) 50.0% 25.0% 25.0% – – – – 75.0% 50.0% 25.0% – – – 25.0%Chop 2007 (18) 5.6% 5.6% 16.7% – – – – 16.7% 5.6% 5.6% – – – 50.0%
2008 (23) 13.0% – 13.0% – – – – 30.4% – 13.0% – – – 34.8%2009 (8) – 12.5% 37.5% 25.0% 25.0% 25.0% 25.0% 37.5% 25.0% 37.5% 12.5% – – 37.5%2010 (20) 10.0% 10.0% 45.0% – – – – 50.0% – 15.0% 15.0% – – 45.0%2011 (28) 3.6% 7.1% 57.1% 3.6% 7.1% 7.1% 10.7% 25.0% – – 46.4% 17.9% – – 39.3%2012 (12) 8.3% – 41.7% – – – – 33.3% – – 16.7% – – – 41.7%P-value 0.3114 0.7173 0.4515 0.2478 0.3995 0.3995 0.5923 0.2417 0.0527 N/A 0.4899 0.0458 N/A N/A 0.1338
1 Dashes indicate 0.0% resistance to antimicrobial. Where % resistance = (# isolates resistant to antimicrobial per meat type) / (total # isolates per meat type).2 Sulfisoxazole replaced Sulfamethoxazole on NARMS panel in 20043 Data for Azithromycin available beginning in 20114 P-values calculated using a binary logistic random effects regression model to account for site variation. P-values are not available (N/A) for antimicrobials where resistance has only one level, i.e. zero, or when there is insufficient variation among the resistance observed. P-values < 0.05 indicate a trend.
Tetra-cyclines
Table 8. Resistance to Antimicrobials in Salmonella Isolates by Meat Type, 2002-20121
Meat Type Year (N)
Penicillinsβ-Lactam/β-Lactamase Inhibitor Combinations Cephems Folate Pathway
Inhibitors Phenicols QuinolonesAminoglycosides Macrolides
24
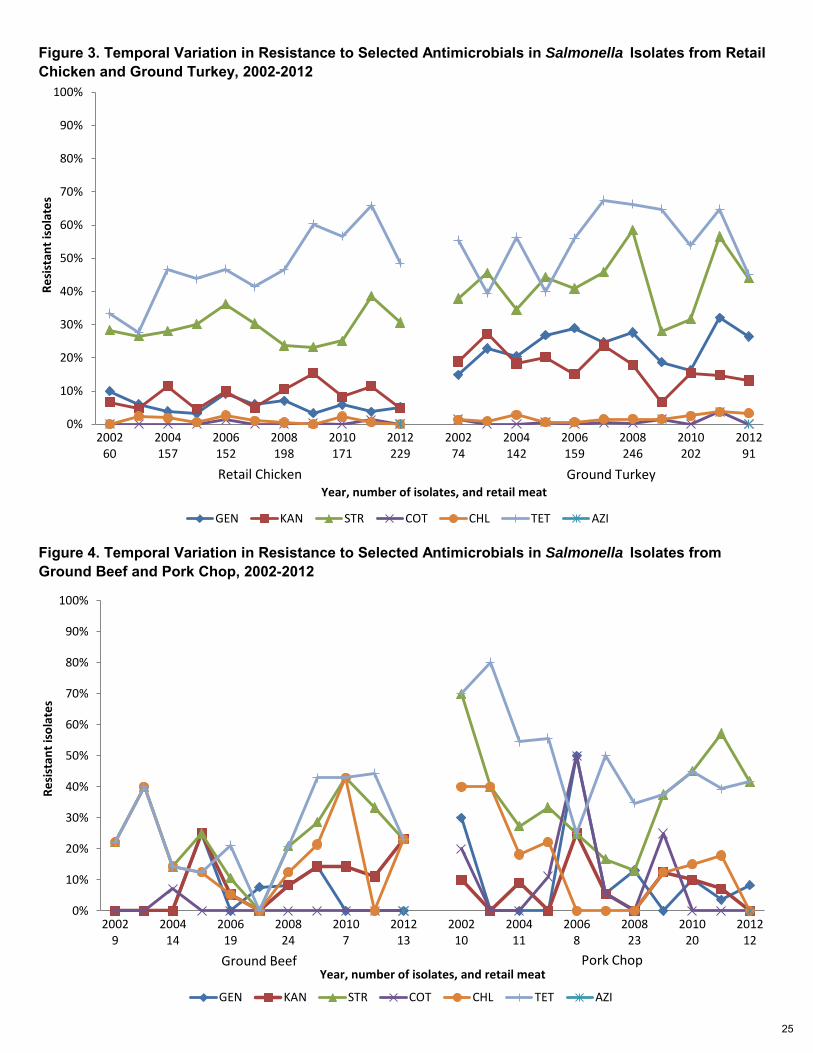
Figure 3. Temporal Variation in Resistance to Selected Antimicrobials in Salmonella Isolates from Retail Chicken and Ground Turkey, 2002-2012
Figure 4. Temporal Variation in Resistance to Selected Antimicrobials in Salmonella Isolates from Ground Beef and Pork Chop, 2002-2012
0%
10%
20%
30%
40%
50%
60%
70%
80%
90%
100%
200260
2004157
2006152
2008198
2010171
2012229
200274
2004142
2006159
2008246
2010202
201291
Resi
stan
t iso
late
s
Year, number of isolates, and retail meat
GEN KAN STR COT CHL TET AZI
Retail Chicken Ground Turkey
0%
10%
20%
30%
40%
50%
60%
70%
80%
90%
100%
20029
200414
200619
200824
20107
201213
200210
200411
20068
200823
201020
201212
Resi
stan
t iso
late
s
Year, number of isolates, and retail meat
GEN KAN STR COT CHL TET AZI
Ground Beef Pork Chop
25
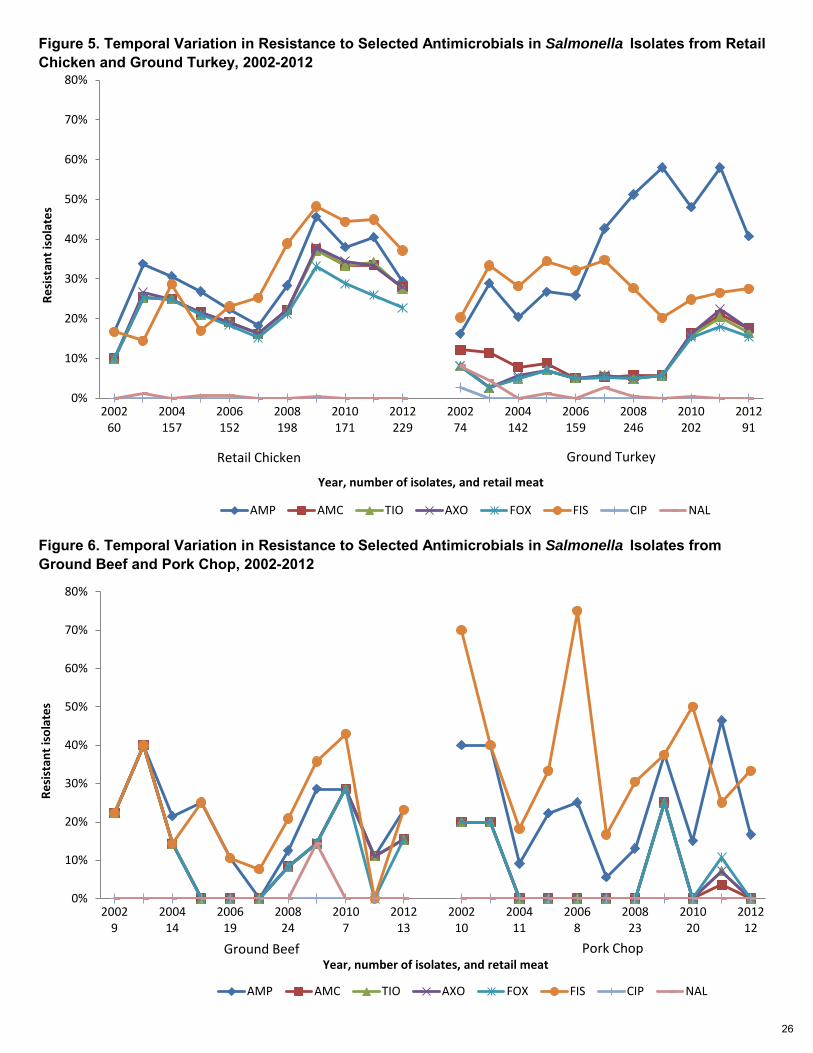
Figure 5. Temporal Variation in Resistance to Selected Antimicrobials in Salmonella Isolates from Retail Chicken and Ground Turkey, 2002-2012
Figure 6. Temporal Variation in Resistance to Selected Antimicrobials in Salmonella Isolates from Ground Beef and Pork Chop, 2002-2012
0%
10%
20%
30%
40%
50%
60%
70%
80%
200260
2004157
2006152
2008198
2010171
2012229
200274
2004142
2006159
2008246
2010202
201291
Resi
stan
t iso
late
s
Year, number of isolates, and retail meat
AMP AMC TIO AXO FOX FIS CIP NAL
Retail Chicken Ground Turkey
0%
10%
20%
30%
40%
50%
60%
70%
80%
20029
200414
200619
200824
20107
201213
200210
200411
20068
200823
201020
201212
Resi
stan
t iso
late
s
Year, number of isolates, and retail meat
AMP AMC TIO AXO FOX FIS CIP NAL
Ground Beef Pork Chop
26
0 1 2-3 4-5 6-7 8-9
SourceTyphimurium 88 38.4% 8 1 30 37 12 6 9 15 49 30 49 49 79 50 78Kentucky 62 27.1% 7 23 18 13 1 4 54 13 10 12 13 3 14 25Enteritidis 26 11.4% 26Heidelberg 17 7.4% 17Thompson 11 4.8% 11I 4,5,12:i:- 6 2.6% 3 1 2 2 2 2 2 2 2 2 3Mbandaka 4 1.7% 1 2 1 1 1 1 3Montevideo 4 1.7% 4Infantis 3 1.3% 3Braenderup 2 0.9% 1 1 1Anatum 1 0.4% 1 1 1 1 1Gaminara 1 0.4% 1I 9,12:nonmotile 1 0.4% 1Newport 1 0.4% 1Other 2 0.9% 1 1 1Total 229 100.0% 85 29 50 50 15 0 12 11 72 64 42 63 64 85 0 0 67 0 0 0 111IIIa 18:z4,z23:- 16 17.6% 16Saintpaul 9 9.9% 1 8 4 4 1 1 1 1 1 8 6Typhimurium 9 9.9% 4 1 2 2 1 1 5 2 1 2 2 5 4 4Hadar 8 8.8% 6 2 3 8 3 2 7Agona 7 7.7% 6 1 5 1 5 2 2 2 2 6 3 1Schwarzengrund 7 7.7% 2 1 2 2 2 2 2 2 2 2 2 3Heidelberg 5 5.5% 4 1 5 4 1 5 5Enteritidis 4 4.4% 3 1 1 1Reading 4 4.4% 3 1 1 1 1 1Infantis 3 3.3% 3 3 3 3 3 3 3 3 3 3 3 3Albany 2 2.2% 2 2 2 2 2 2Anatum 2 2.2% 2 2 2 2 2Brandenburg 2 2.2% 1 1 1 1 1 1Newport 2 2.2% 1 1 1 1 1 1 1 1 1 1 1 1Senftenberg 2 2.2% 2 1 1 1 1 1Berta 1 1.1% 1 1 1 1 1 1 1Derby 1 1.1% 1 1Gaminara 1 1.1% 1I 4,12:d:- 1 1.1% 1 1Other 5 5.5% 5 2 2 1 1 2 3 2 3Total 91 100.0% 32 3 41 8 7 0 24 12 40 16 14 15 16 25 0 0 37 3 0 0 41Dublin 4 30.8% 1 1 2 2 3 2 2 2 2 3 3 3 3Cerro 2 15.4% 2Agona 1 7.7% 1 1Other 6 46.2% 6Total 13 100.0% 9 1 0 1 2 0 0 3 3 2 2 2 2 3 0 0 3 3 0 0 3Typhimurium 6 50.0% 3 2 1 3 3 1 1Derby 1 8.3% 1 1 1 1Heidelberg 1 8.3% 1 1 1 1Other 4 33.3% 1 3 1 2Total 12 100.0% 4 3 4 1 0 0 1 0 5 0 0 0 0 4 0 0 2 0 0 0 5
Gro
und
Bee
f
Cephems
TIO
Ret
ail C
hick
en
Number of Isolates AXO
Gro
und
Turk
eyTable 9. Distribution of Resistant Salmonella Isolates by Meat Type and Serotype, 2012
Serotype
Number of Antimicrobial Classes in Resistance
Pattern
No. of Isolates
% of Isolates
Folate Pathway Inhibitors
Penicillins Phenicols
NALKAN STR
TetracyclinesQuinolones
β-Lactam/β-Lactamase
Inhibitor Combination
Pork
Cho
p
Macrolides
AZI
Number of Resistant Isolates by Antimicrobial Agent and Class
Aminoglycosides
TETAMPCOTFISAMC FOX CIPCHLGEN
27
Year 2002 2003 2004 2005 2006 2007 2008 2009 2010 2011 2012 Retail Chicken 60 83 157 153 152 99 198 272 171 158 229
Number of Isolates Ground Turkey 74 114 142 183 159 190 246 193 202 162 91 Tested by Source Ground Beef 9 10 14 8 19 13 24 14 7 9 13
Pork Chop 10 5 11 9 8 18 23 8 20 28 12
Resistance Pattern Isolate Source2.4% 1.9% 0.7% 2.6% 0.5% 1.8%
1. At Least ACSSuT2 2 3 1 4 1 3 Resistant 1.4% 0.9% 2.8% 0.5% 0.6% 1.6% 1.6% 0.5% 2.5% 3.1% 3.3%
1 1 4 1 1 3 4 1 5 5 322.2% 40.0% 14.3% 12.5% 5.3% 12.5% 14.3% 28.6% 23.1%
2 4 2 1 1 3 2 2 340.0% 40.0% 9.1% 22.2% 12.5% 5.0% 10.7%
4 2 1 2 1 1 3
2. At Least ACT/S3 Resistant 1.4% 2.5%
1 47.1%
120.0% 11.1% 12.5%
2 1 11.9% 2.6% 0.6%
3. At Least ACSSuTAuCx4 3 4 1 Resistant 1.4% 0.9% 2.1% 0.5% 1.1% 1.2% 0.5% 2.0% 3.1% 3.3%
1 1 3 1 2 3 1 4 5 322.2% 40.0% 14.3% 8.3% 14.3% 28.6% 15.4%
2 4 2 2 2 2 220.0% 20.0% 3.6%
2 1 10.7%
4. At Least Ceftriaxone 1 and Nalidixic Acid 0.9% 0.5% 0.5% Resistant 1 1 1
14.3%2
1 Dashes indicate 0.0% resistance2 ACSSuT = ampicillin, chloramphenicol, streptomycin, sulfamethoxazole/sulfisoxazole, and tetracycline3 ACT/S = ampicillin, chloramphenicol, and trimethoprim-sulfamethoxazole4 ACSSuTAuCx = ACSSuT, amoxicillin-clavulanic acid, and ceftriaxone
Ground Beef–
Pork Chop– – –
Retail Chicken– – – – – –
–
–
Ground Turkey
Retail Chicken– – –
– –
Ground Turkey– – – – – – –
–
–
– – –
Ground Turkey–
Ground Beef– – –
Retail Chicken– – – – – –
– – – – –
Ground Beef– – –
Pork Chop
– –
–
–– – – Pork Chop
– – – – –
Ground Beef– – – – – – –
–
– – – –
–
Retail Chicken– – – – – – –
Pork Chop– – – – – –
–
–
Table 10. Multidrug Resistance Patterns among Salmonella Isolates, 2002-20121
–
–
–
–
–
–
–
–
–
–
–
–
–
–
–
–
–
–
–
–
–
Ground Turkey–
28
Year 2002 2003 2004 2005 2006 2007 2008 2009 2010 2011 2012 Retail Chicken 60 83 157 153 152 99 198 272 171 158 229
Number of Isolates Ground Turkey 74 114 142 183 159 190 246 193 202 162 91 Tested by Source Ground Beef 9 10 14 8 19 13 24 14 7 9 13
Pork Chop 10 5 11 9 8 18 23 8 20 28 12
Resistance Pattern Isolate Source51.7% 45.8% 40.1% 46.4% 38.8% 47.5% 46.0% 29.0% 36.3% 25.9% 37.1%
1. No Resistance 31 38 63 71 59 47 91 79 62 41 85 Detected 37.8% 34.2% 28.9% 30.1% 17.6% 15.3% 20.7% 22.3% 31.7% 22.2% 35.2%
28 39 41 55 28 29 51 43 64 36 3277.8% 60.0% 78.6% 75.0% 73.7% 92.3% 79.2% 57.1% 57.1% 55.6% 69.2%
7 6 11 6 14 12 19 8 4 5 920.0% 20.0% 45.5% 44.4% 25.0% 44.4% 65.2% 50.0% 35.0% 25.0% 33.3%
2 1 5 4 2 8 15 4 7 7 420.0% 30.1% 34.4% 25.5% 24.3% 25.3% 37.4% 48.5% 41.5% 44.9% 33.2%
2. Resistant to ≥ 3 12 25 54 39 37 25 74 132 71 71 76 Antimicrobial Classes 20.3% 28.9% 26.1% 29.0% 24.5% 42.6% 51.6% 26.4% 33.2% 50.0% 39.6%
15 33 37 53 39 81 127 51 67 81 3622.2% 40.0% 14.3% 25.0% 10.5% 20.8% 35.7% 42.9% 11.1% 23.1%
2 4 2 2 2 5 5 3 1 360.0% 40.0% 18.2% 22.2% 25.0% 5.6% 17.4% 50.0% 50.0% 28.6% 25.0%
6 2 2 2 2 1 4 4 10 8 33.3% 16.9% 24.2% 18.3% 15.1% 13.1% 22.7% 34.6% 32.7% 32.9% 28.4%
3. Resistant to ≥ 4 2 14 38 28 23 13 45 94 56 52 65 Antimicrobial Classes 13.5% 14.9% 12.7% 7.7% 8.2% 14.7% 15.4% 12.4% 17.8% 24.7% 16.5%
10 17 18 14 13 28 38 24 36 40 1522.2% 40.0% 14.3% 12.5% 5.3% 12.5% 35.7% 42.9% 11.1% 23.1%
2 4 2 1 1 3 5 3 1 340.0% 40.0% 18.2% 22.2% 25.0% 5.6% 13.0% 25.0% 5.0% 14.3% 8.3%
4 2 2 2 2 1 3 2 1 4 13.3% 12.0% 22.3% 17.6% 14.5% 12.1% 18.7% 31.6% 30.4% 27.8% 24.5%
4. Resistant to ≥ 5 2 10 35 27 22 12 37 86 52 44 56 Antimicrobial Classes 10.8% 4.4% 4.9% 2.7% 3.1% 3.2% 3.3% 3.6% 11.4% 19.1% 7.7%
8 5 7 5 5 6 8 7 23 31 722.2% 40.0% 14.3% 12.5% 5.3% 12.5% 14.3% 28.6% 11.1% 23.1%
2 4 2 1 1 3 2 2 1 340.0% 40.0% 9.1% 22.2% 25.0% 5.0% 10.7% 0.0%
4 2 1 2 2 1 3 04.8% 5.7% 3.9% 5.9% 4.0% 4.0% 11.4% 10.5% 13.3% 6.6%
5. Resistant to ≥ 6 4 9 6 9 4 8 31 18 21 15 Antimicrobial Classes 10.8% 0.9% 2.8% 2.2% 1.9% 2.1% 2.0% 2.6% 7.9% 13.0% 7.7%
8 1 4 4 3 4 5 5 16 21 722.2% 40.0% 14.3% 8.3% 14.3% 28.6% 15.4%
2 4 2 2 2 2 220.0% 20.0% 12.5% 3.6%
2 1 1 1
Ground Turkey
Ground Beef –
2 NARMS Retail Meat Reports 2002-2010 included amikacin in the multidrug resistance patterns. Begining in 2011, multidrug resistance patterns contain azithromycin. Because resistance to azithromycin and amikacin are less than 1%, the multidrug resistance patterns are comparable across years.
–
–
1 Dashes indicate 0.0% resistance.
–
Pork Chop – – – –
–
–
–
Pork Chop – –
Retail Chicken –
Ground Beef –
Pork Chop
Table 11. Multidrug Resistance among Salmonella Isolates by Antimicrobial Class, 2002-20121,2
–
Retail Chicken
Retail Chicken
Ground Turkey
Ground Beef
Pork Chop
Retail Chicken
Ground Turkey
–
Ground Turkey
Ground Beef –
Pork Chop
Retail Chicken
Ground Turkey
Ground Beef
29
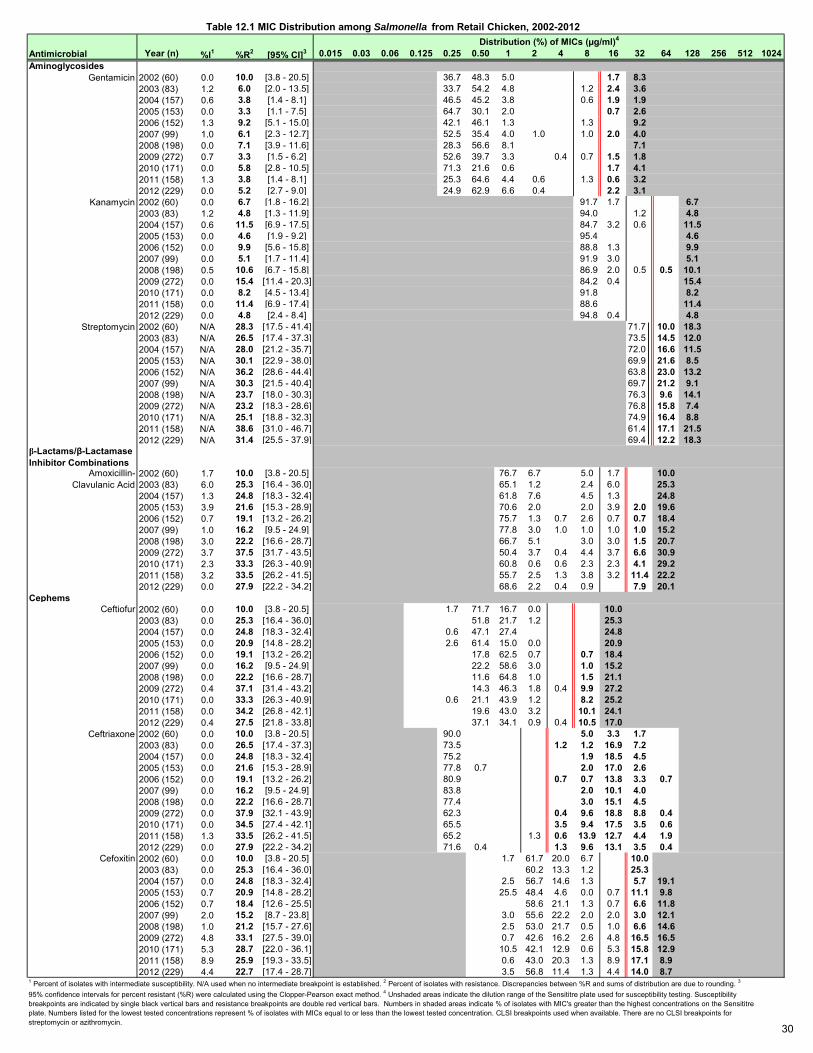
Antimicrobial Year (n) %I1 %R2 [95% CI]3 0.015 0.03 0.06 0.125 0.25 0.50 1 2 4 8 16 32 64 128 256 512 1024Aminoglycosides
Gentamicin 2002 (60) 0.0 10.0 [3.8 - 20.5] 36.7 48.3 5.0 1.7 8.32003 (83) 1.2 6.0 [2.0 - 13.5] 33.7 54.2 4.8 1.2 2.4 3.62004 (157) 0.6 3.8 [1.4 - 8.1] 46.5 45.2 3.8 0.6 1.9 1.92005 (153) 0.0 3.3 [1.1 - 7.5] 64.7 30.1 2.0 0.7 2.62006 (152) 1.3 9.2 [5.1 - 15.0] 42.1 46.1 1.3 1.3 9.22007 (99) 1.0 6.1 [2.3 - 12.7] 52.5 35.4 4.0 1.0 1.0 2.0 4.02008 (198) 0.0 7.1 [3.9 - 11.6] 28.3 56.6 8.1 7.12009 (272) 0.7 3.3 [1.5 - 6.2] 52.6 39.7 3.3 0.4 0.7 1.5 1.82010 (171) 0.0 5.8 [2.8 - 10.5] 71.3 21.6 0.6 1.7 4.12011 (158) 1.3 3.8 [1.4 - 8.1] 25.3 64.6 4.4 0.6 1.3 0.6 3.22012 (229) 0.0 5.2 [2.7 - 9.0] 24.9 62.9 6.6 0.4 2.2 3.1
Kanamycin 2002 (60) 0.0 6.7 [1.8 - 16.2] 91.7 1.7 6.72003 (83) 1.2 4.8 [1.3 - 11.9] 94.0 1.2 4.82004 (157) 0.6 11.5 [6.9 - 17.5] 84.7 3.2 0.6 11.52005 (153) 0.0 4.6 [1.9 - 9.2] 95.4 4.62006 (152) 0.0 9.9 [5.6 - 15.8] 88.8 1.3 9.92007 (99) 0.0 5.1 [1.7 - 11.4] 91.9 3.0 5.12008 (198) 0.5 10.6 [6.7 - 15.8] 86.9 2.0 0.5 0.5 10.12009 (272) 0.0 15.4 [11.4 - 20.3] 84.2 0.4 15.42010 (171) 0.0 8.2 [4.5 - 13.4] 91.8 8.22011 (158) 0.0 11.4 [6.9 - 17.4] 88.6 11.42012 (229) 0.0 4.8 [2.4 - 8.4] 94.8 0.4 4.8
Streptomycin 2002 (60) N/A 28.3 [17.5 - 41.4] 71.7 10.0 18.32003 (83) N/A 26.5 [17.4 - 37.3] 73.5 14.5 12.02004 (157) N/A 28.0 [21.2 - 35.7] 72.0 16.6 11.52005 (153) N/A 30.1 [22.9 - 38.0] 69.9 21.6 8.52006 (152) N/A 36.2 [28.6 - 44.4] 63.8 23.0 13.22007 (99) N/A 30.3 [21.5 - 40.4] 69.7 21.2 9.12008 (198) N/A 23.7 [18.0 - 30.3] 76.3 9.6 14.12009 (272) N/A 23.2 [18.3 - 28.6] 76.8 15.8 7.42010 (171) N/A 25.1 [18.8 - 32.3] 74.9 16.4 8.82011 (158) N/A 38.6 [31.0 - 46.7] 61.4 17.1 21.52012 (229) N/A 31.4 [25.5 - 37.9] 69.4 12.2 18.3
β-Lactams/β-Lactamase Inhibitor Combinations
Amoxicillin- 2002 (60) 1.7 10.0 [3.8 - 20.5] 76.7 6.7 5.0 1.7 10.0 Clavulanic Acid 2003 (83) 6.0 25.3 [16.4 - 36.0] 65.1 1.2 2.4 6.0 25.3
2004 (157) 1.3 24.8 [18.3 - 32.4] 61.8 7.6 4.5 1.3 24.82005 (153) 3.9 21.6 [15.3 - 28.9] 70.6 2.0 2.0 3.9 2.0 19.62006 (152) 0.7 19.1 [13.2 - 26.2] 75.7 1.3 0.7 2.6 0.7 0.7 18.42007 (99) 1.0 16.2 [9.5 - 24.9] 77.8 3.0 1.0 1.0 1.0 1.0 15.22008 (198) 3.0 22.2 [16.6 - 28.7] 66.7 5.1 3.0 3.0 1.5 20.72009 (272) 3.7 37.5 [31.7 - 43.5] 50.4 3.7 0.4 4.4 3.7 6.6 30.92010 (171) 2.3 33.3 [26.3 - 40.9] 60.8 0.6 0.6 2.3 2.3 4.1 29.22011 (158) 3.2 33.5 [26.2 - 41.5] 55.7 2.5 1.3 3.8 3.2 11.4 22.22012 (229) 0.0 27.9 [22.2 - 34.2] 68.6 2.2 0.4 0.9 7.9 20.1
Cephems Ceftiofur 2002 (60) 0.0 10.0 [3.8 - 20.5] 1.7 71.7 16.7 0.0 10.0
2003 (83) 0.0 25.3 [16.4 - 36.0] 51.8 21.7 1.2 25.32004 (157) 0.0 24.8 [18.3 - 32.4] 0.6 47.1 27.4 24.82005 (153) 0.0 20.9 [14.8 - 28.2] 2.6 61.4 15.0 0.0 20.92006 (152) 0.0 19.1 [13.2 - 26.2] 17.8 62.5 0.7 0.7 18.42007 (99) 0.0 16.2 [9.5 - 24.9] 22.2 58.6 3.0 1.0 15.22008 (198) 0.0 22.2 [16.6 - 28.7] 11.6 64.8 1.0 1.5 21.12009 (272) 0.4 37.1 [31.4 - 43.2] 14.3 46.3 1.8 0.4 9.9 27.22010 (171) 0.0 33.3 [26.3 - 40.9] 0.6 21.1 43.9 1.2 8.2 25.22011 (158) 0.0 34.2 [26.8 - 42.1] 19.6 43.0 3.2 10.1 24.12012 (229) 0.4 27.5 [21.8 - 33.8] 37.1 34.1 0.9 0.4 10.5 17.0
Ceftriaxone 2002 (60) 0.0 10.0 [3.8 - 20.5] 90.0 5.0 3.3 1.72003 (83) 0.0 26.5 [17.4 - 37.3] 73.5 1.2 1.2 16.9 7.22004 (157) 0.0 24.8 [18.3 - 32.4] 75.2 1.9 18.5 4.52005 (153) 0.0 21.6 [15.3 - 28.9] 77.8 0.7 2.0 17.0 2.62006 (152) 0.0 19.1 [13.2 - 26.2] 80.9 0.7 0.7 13.8 3.3 0.72007 (99) 0.0 16.2 [9.5 - 24.9] 83.8 2.0 10.1 4.02008 (198) 0.0 22.2 [16.6 - 28.7] 77.4 3.0 15.1 4.52009 (272) 0.0 37.9 [32.1 - 43.9] 62.3 0.4 9.6 18.8 8.8 0.42010 (171) 0.0 34.5 [27.4 - 42.1] 65.5 3.5 9.4 17.5 3.5 0.62011 (158) 1.3 33.5 [26.2 - 41.5] 65.2 1.3 0.6 13.9 12.7 4.4 1.92012 (229) 0.0 27.9 [22.2 - 34.2] 71.6 0.4 1.3 9.6 13.1 3.5 0.4
Cefoxitin 2002 (60) 0.0 10.0 [3.8 - 20.5] 1.7 61.7 20.0 6.7 10.02003 (83) 0.0 25.3 [16.4 - 36.0] 60.2 13.3 1.2 25.32004 (157) 0.0 24.8 [18.3 - 32.4] 2.5 56.7 14.6 1.3 5.7 19.12005 (153) 0.7 20.9 [14.8 - 28.2] 25.5 48.4 4.6 0.0 0.7 11.1 9.82006 (152) 0.7 18.4 [12.6 - 25.5] 58.6 21.1 1.3 0.7 6.6 11.82007 (99) 2.0 15.2 [8.7 - 23.8] 3.0 55.6 22.2 2.0 2.0 3.0 12.12008 (198) 1.0 21.2 [15.7 - 27.6] 2.5 53.0 21.7 0.5 1.0 6.6 14.62009 (272) 4.8 33.1 [27.5 - 39.0] 0.7 42.6 16.2 2.6 4.8 16.5 16.52010 (171) 5.3 28.7 [22.0 - 36.1] 10.5 42.1 12.9 0.6 5.3 15.8 12.92011 (158) 8.9 25.9 [19.3 - 33.5] 0.6 43.0 20.3 1.3 8.9 17.1 8.92012 (229) 4.4 22.7 [17.4 - 28.7] 3.5 56.8 11.4 1.3 4.4 14.0 8.7
Table 12.1 MIC Distribution among Salmonella from Retail Chicken, 2002-2012Distribution (%) of MICs (µg/ml)4
1 Percent of isolates with intermediate susceptibility. N/A used when no intermediate breakpoint is established. 2 Percent of isolates with resistance. Discrepancies between %R and sums of distribution are due to rounding. 3
95% confidence intervals for percent resistant (%R) were calculated using the Clopper-Pearson exact method. 4 Unshaded areas indicate the dilution range of the Sensititre plate used for susceptibility testing. Susceptibility breakpoints are indicated by single black vertical bars and resistance breakpoints are double red vertical bars. Numbers in shaded areas indicate % of isolates with MIC's greater than the highest concentrations on the Sensititre plate. Numbers listed for the lowest tested concentrations represent % of isolates with MICs equal to or less than the lowest tested concentration. CLSI breakpoints used when available. There are no CLSI breakpoints for streptomycin or azithromycin.
30
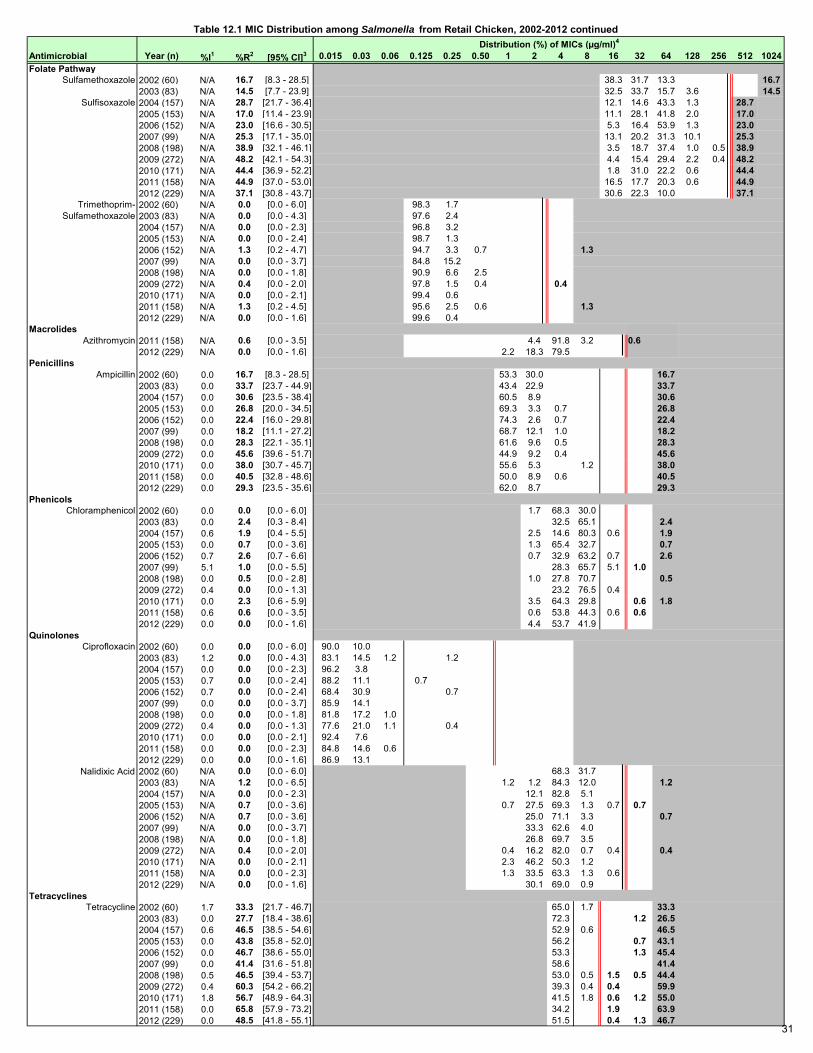
Antimicrobial Year (n) %I1 %R2 [95% CI]3 0.015 0.03 0.06 0.125 0.25 0.50 1 2 4 8 16 32 64 128 256 512 1024Folate Pathway
Sulfamethoxazole 2002 (60) N/A 16.7 [8.3 - 28.5] 38.3 31.7 13.3 16.72003 (83) N/A 14.5 [7.7 - 23.9] 32.5 33.7 15.7 3.6 14.5
Sulfisoxazole 2004 (157) N/A 28.7 [21.7 - 36.4] 12.1 14.6 43.3 1.3 28.72005 (153) N/A 17.0 [11.4 - 23.9] 11.1 28.1 41.8 2.0 17.02006 (152) N/A 23.0 [16.6 - 30.5] 5.3 16.4 53.9 1.3 23.02007 (99) N/A 25.3 [17.1 - 35.0] 13.1 20.2 31.3 10.1 25.32008 (198) N/A 38.9 [32.1 - 46.1] 3.5 18.7 37.4 1.0 0.5 38.92009 (272) N/A 48.2 [42.1 - 54.3] 4.4 15.4 29.4 2.2 0.4 48.22010 (171) N/A 44.4 [36.9 - 52.2] 1.8 31.0 22.2 0.6 44.42011 (158) N/A 44.9 [37.0 - 53.0] 16.5 17.7 20.3 0.6 44.92012 (229) N/A 37.1 [30.8 - 43.7] 30.6 22.3 10.0 37.1
Trimethoprim- 2002 (60) N/A 0.0 [0.0 - 6.0] 98.3 1.7 Sulfamethoxazole 2003 (83) N/A 0.0 [0.0 - 4.3] 97.6 2.4
2004 (157) N/A 0.0 [0.0 - 2.3] 96.8 3.22005 (153) N/A 0.0 [0.0 - 2.4] 98.7 1.32006 (152) N/A 1.3 [0.2 - 4.7] 94.7 3.3 0.7 1.32007 (99) N/A 0.0 [0.0 - 3.7] 84.8 15.22008 (198) N/A 0.0 [0.0 - 1.8] 90.9 6.6 2.52009 (272) N/A 0.4 [0.0 - 2.0] 97.8 1.5 0.4 0.42010 (171) N/A 0.0 [0.0 - 2.1] 99.4 0.62011 (158) N/A 1.3 [0.2 - 4.5] 95.6 2.5 0.6 1.32012 (229) N/A 0.0 [0.0 - 1.6] 99.6 0.4
Macrolides Azithromycin 2011 (158) N/A 0.6 [0.0 - 3.5] 4.4 91.8 3.2 0.6
2012 (229) N/A 0.0 [0.0 - 1.6] 2.2 18.3 79.5Penicillins
Ampicillin 2002 (60) 0.0 16.7 [8.3 - 28.5] 53.3 30.0 16.72003 (83) 0.0 33.7 [23.7 - 44.9] 43.4 22.9 33.72004 (157) 0.0 30.6 [23.5 - 38.4] 60.5 8.9 30.62005 (153) 0.0 26.8 [20.0 - 34.5] 69.3 3.3 0.7 26.82006 (152) 0.0 22.4 [16.0 - 29.8] 74.3 2.6 0.7 22.42007 (99) 0.0 18.2 [11.1 - 27.2] 68.7 12.1 1.0 18.22008 (198) 0.0 28.3 [22.1 - 35.1] 61.6 9.6 0.5 28.32009 (272) 0.0 45.6 [39.6 - 51.7] 44.9 9.2 0.4 45.62010 (171) 0.0 38.0 [30.7 - 45.7] 55.6 5.3 1.2 38.02011 (158) 0.0 40.5 [32.8 - 48.6] 50.0 8.9 0.6 40.52012 (229) 0.0 29.3 [23.5 - 35.6] 62.0 8.7 29.3
Phenicols Chloramphenicol 2002 (60) 0.0 0.0 [0.0 - 6.0] 1.7 68.3 30.0
2003 (83) 0.0 2.4 [0.3 - 8.4] 32.5 65.1 2.42004 (157) 0.6 1.9 [0.4 - 5.5] 2.5 14.6 80.3 0.6 1.92005 (153) 0.0 0.7 [0.0 - 3.6] 1.3 65.4 32.7 0.72006 (152) 0.7 2.6 [0.7 - 6.6] 0.7 32.9 63.2 0.7 2.62007 (99) 5.1 1.0 [0.0 - 5.5] 28.3 65.7 5.1 1.02008 (198) 0.0 0.5 [0.0 - 2.8] 1.0 27.8 70.7 0.52009 (272) 0.4 0.0 [0.0 - 1.3] 23.2 76.5 0.42010 (171) 0.0 2.3 [0.6 - 5.9] 3.5 64.3 29.8 0.6 1.82011 (158) 0.6 0.6 [0.0 - 3.5] 0.6 53.8 44.3 0.6 0.62012 (229) 0.0 0.0 [0.0 - 1.6] 4.4 53.7 41.9
Quinolones Ciprofloxacin 2002 (60) 0.0 0.0 [0.0 - 6.0] 90.0 10.0
2003 (83) 1.2 0.0 [0.0 - 4.3] 83.1 14.5 1.2 1.22004 (157) 0.0 0.0 [0.0 - 2.3] 96.2 3.82005 (153) 0.7 0.0 [0.0 - 2.4] 88.2 11.1 0.72006 (152) 0.7 0.0 [0.0 - 2.4] 68.4 30.9 0.72007 (99) 0.0 0.0 [0.0 - 3.7] 85.9 14.12008 (198) 0.0 0.0 [0.0 - 1.8] 81.8 17.2 1.02009 (272) 0.4 0.0 [0.0 - 1.3] 77.6 21.0 1.1 0.42010 (171) 0.0 0.0 [0.0 - 2.1] 92.4 7.62011 (158) 0.0 0.0 [0.0 - 2.3] 84.8 14.6 0.62012 (229) 0.0 0.0 [0.0 - 1.6] 86.9 13.1
Nalidixic Acid 2002 (60) N/A 0.0 [0.0 - 6.0] 68.3 31.72003 (83) N/A 1.2 [0.0 - 6.5] 1.2 1.2 84.3 12.0 1.22004 (157) N/A 0.0 [0.0 - 2.3] 12.1 82.8 5.12005 (153) N/A 0.7 [0.0 - 3.6] 0.7 27.5 69.3 1.3 0.7 0.72006 (152) N/A 0.7 [0.0 - 3.6] 25.0 71.1 3.3 0.72007 (99) N/A 0.0 [0.0 - 3.7] 33.3 62.6 4.02008 (198) N/A 0.0 [0.0 - 1.8] 26.8 69.7 3.52009 (272) N/A 0.4 [0.0 - 2.0] 0.4 16.2 82.0 0.7 0.4 0.42010 (171) N/A 0.0 [0.0 - 2.1] 2.3 46.2 50.3 1.22011 (158) N/A 0.0 [0.0 - 2.3] 1.3 33.5 63.3 1.3 0.62012 (229) N/A 0.0 [0.0 - 1.6] 30.1 69.0 0.9
Tetracyclines Tetracycline 2002 (60) 1.7 33.3 [21.7 - 46.7] 65.0 1.7 33.3
2003 (83) 0.0 27.7 [18.4 - 38.6] 72.3 1.2 26.52004 (157) 0.6 46.5 [38.5 - 54.6] 52.9 0.6 46.52005 (153) 0.0 43.8 [35.8 - 52.0] 56.2 0.7 43.12006 (152) 0.0 46.7 [38.6 - 55.0] 53.3 1.3 45.42007 (99) 0.0 41.4 [31.6 - 51.8] 58.6 41.42008 (198) 0.5 46.5 [39.4 - 53.7] 53.0 0.5 1.5 0.5 44.42009 (272) 0.4 60.3 [54.2 - 66.2] 39.3 0.4 0.4 59.92010 (171) 1.8 56.7 [48.9 - 64.3] 41.5 1.8 0.6 1.2 55.02011 (158) 0.0 65.8 [57.9 - 73.2] 34.2 1.9 63.92012 (229) 0.0 48.5 [41.8 - 55.1] 51.5 0.4 1.3 46.7
Table 12.1 MIC Distribution among Salmonella from Retail Chicken, 2002-2012 continuedDistribution (%) of MICs (µg/ml)4
31
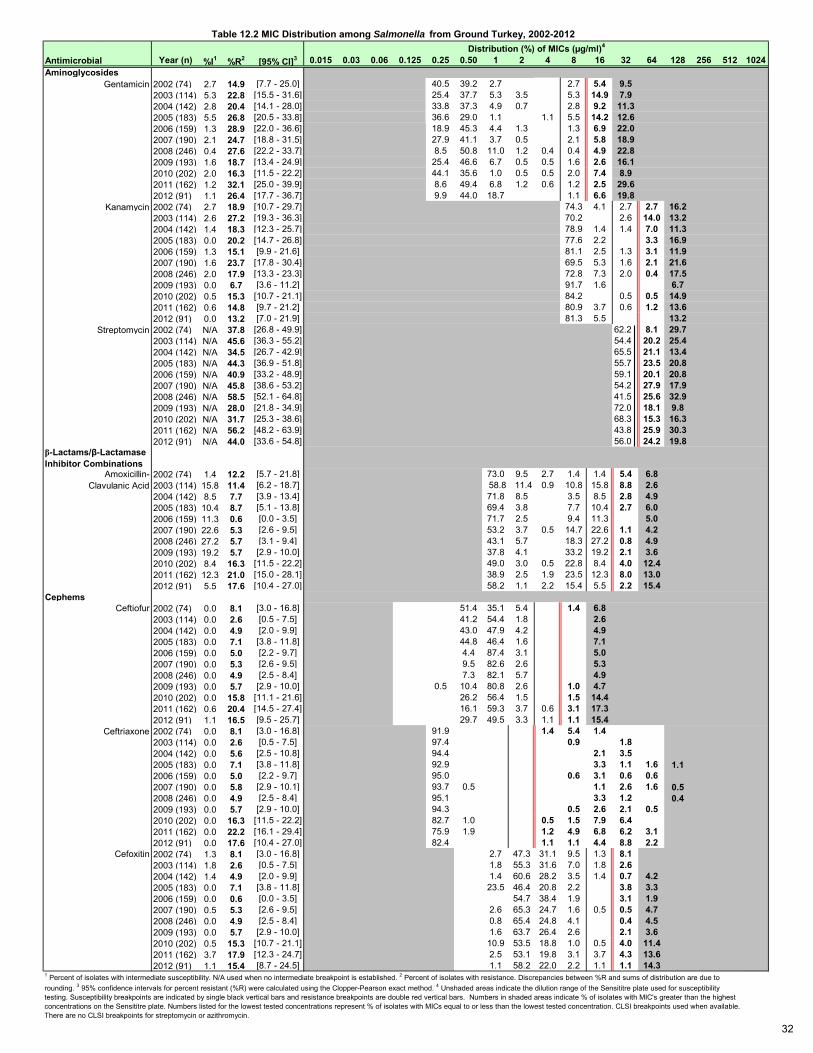
Antimicrobial Year (n) %I1 %R2 [95% CI]3 0.015 0.03 0.06 0.125 0.25 0.50 1 2 4 8 16 32 64 128 256 512 1024Aminoglycosides
Gentamicin 2002 (74) 2.7 14.9 [7.7 - 25.0] 40.5 39.2 2.7 2.7 5.4 9.52003 (114) 5.3 22.8 [15.5 - 31.6] 25.4 37.7 5.3 3.5 5.3 14.9 7.92004 (142) 2.8 20.4 [14.1 - 28.0] 33.8 37.3 4.9 0.7 2.8 9.2 11.32005 (183) 5.5 26.8 [20.5 - 33.8] 36.6 29.0 1.1 1.1 5.5 14.2 12.62006 (159) 1.3 28.9 [22.0 - 36.6] 18.9 45.3 4.4 1.3 1.3 6.9 22.02007 (190) 2.1 24.7 [18.8 - 31.5] 27.9 41.1 3.7 0.5 2.1 5.8 18.92008 (246) 0.4 27.6 [22.2 - 33.7] 8.5 50.8 11.0 1.2 0.4 0.4 4.9 22.82009 (193) 1.6 18.7 [13.4 - 24.9] 25.4 46.6 6.7 0.5 0.5 1.6 2.6 16.12010 (202) 2.0 16.3 [11.5 - 22.2] 44.1 35.6 1.0 0.5 0.5 2.0 7.4 8.92011 (162) 1.2 32.1 [25.0 - 39.9] 8.6 49.4 6.8 1.2 0.6 1.2 2.5 29.62012 (91) 1.1 26.4 [17.7 - 36.7] 9.9 44.0 18.7 1.1 6.6 19.8
Kanamycin 2002 (74) 2.7 18.9 [10.7 - 29.7] 74.3 4.1 2.7 2.7 16.22003 (114) 2.6 27.2 [19.3 - 36.3] 70.2 2.6 14.0 13.22004 (142) 1.4 18.3 [12.3 - 25.7] 78.9 1.4 1.4 7.0 11.32005 (183) 0.0 20.2 [14.7 - 26.8] 77.6 2.2 3.3 16.92006 (159) 1.3 15.1 [9.9 - 21.6] 81.1 2.5 1.3 3.1 11.92007 (190) 1.6 23.7 [17.8 - 30.4] 69.5 5.3 1.6 2.1 21.62008 (246) 2.0 17.9 [13.3 - 23.3] 72.8 7.3 2.0 0.4 17.52009 (193) 0.0 6.7 [3.6 - 11.2] 91.7 1.6 6.72010 (202) 0.5 15.3 [10.7 - 21.1] 84.2 0.5 0.5 14.92011 (162) 0.6 14.8 [9.7 - 21.2] 80.9 3.7 0.6 1.2 13.62012 (91) 0.0 13.2 [7.0 - 21.9] 81.3 5.5 13.2
Streptomycin 2002 (74) N/A 37.8 [26.8 - 49.9] 62.2 8.1 29.72003 (114) N/A 45.6 [36.3 - 55.2] 54.4 20.2 25.42004 (142) N/A 34.5 [26.7 - 42.9] 65.5 21.1 13.42005 (183) N/A 44.3 [36.9 - 51.8] 55.7 23.5 20.82006 (159) N/A 40.9 [33.2 - 48.9] 59.1 20.1 20.82007 (190) N/A 45.8 [38.6 - 53.2] 54.2 27.9 17.92008 (246) N/A 58.5 [52.1 - 64.8] 41.5 25.6 32.92009 (193) N/A 28.0 [21.8 - 34.9] 72.0 18.1 9.82010 (202) N/A 31.7 [25.3 - 38.6] 68.3 15.3 16.32011 (162) N/A 56.2 [48.2 - 63.9] 43.8 25.9 30.32012 (91) N/A 44.0 [33.6 - 54.8] 56.0 24.2 19.8
β-Lactams/β-Lactamase Inhibitor Combinations
Amoxicillin- 2002 (74) 1.4 12.2 [5.7 - 21.8] 73.0 9.5 2.7 1.4 1.4 5.4 6.8 Clavulanic Acid 2003 (114) 15.8 11.4 [6.2 - 18.7] 58.8 11.4 0.9 10.8 15.8 8.8 2.6
2004 (142) 8.5 7.7 [3.9 - 13.4] 71.8 8.5 3.5 8.5 2.8 4.92005 (183) 10.4 8.7 [5.1 - 13.8] 69.4 3.8 7.7 10.4 2.7 6.02006 (159) 11.3 0.6 [0.0 - 3.5] 71.7 2.5 9.4 11.3 5.02007 (190) 22.6 5.3 [2.6 - 9.5] 53.2 3.7 0.5 14.7 22.6 1.1 4.22008 (246) 27.2 5.7 [3.1 - 9.4] 43.1 5.7 18.3 27.2 0.8 4.92009 (193) 19.2 5.7 [2.9 - 10.0] 37.8 4.1 33.2 19.2 2.1 3.62010 (202) 8.4 16.3 [11.5 - 22.2] 49.0 3.0 0.5 22.8 8.4 4.0 12.42011 (162) 12.3 21.0 [15.0 - 28.1] 38.9 2.5 1.9 23.5 12.3 8.0 13.02012 (91) 5.5 17.6 [10.4 - 27.0] 58.2 1.1 2.2 15.4 5.5 2.2 15.4
Cephems Ceftiofur 2002 (74) 0.0 8.1 [3.0 - 16.8] 51.4 35.1 5.4 1.4 6.8
2003 (114) 0.0 2.6 [0.5 - 7.5] 41.2 54.4 1.8 2.62004 (142) 0.0 4.9 [2.0 - 9.9] 43.0 47.9 4.2 4.92005 (183) 0.0 7.1 [3.8 - 11.8] 44.8 46.4 1.6 7.12006 (159) 0.0 5.0 [2.2 - 9.7] 4.4 87.4 3.1 5.02007 (190) 0.0 5.3 [2.6 - 9.5] 9.5 82.6 2.6 5.32008 (246) 0.0 4.9 [2.5 - 8.4] 7.3 82.1 5.7 4.92009 (193) 0.0 5.7 [2.9 - 10.0] 0.5 10.4 80.8 2.6 1.0 4.72010 (202) 0.0 15.8 [11.1 - 21.6] 26.2 56.4 1.5 1.5 14.42011 (162) 0.6 20.4 [14.5 - 27.4] 16.1 59.3 3.7 0.6 3.1 17.32012 (91) 1.1 16.5 [9.5 - 25.7] 29.7 49.5 3.3 1.1 1.1 15.4
Ceftriaxone 2002 (74) 0.0 8.1 [3.0 - 16.8] 91.9 1.4 5.4 1.42003 (114) 0.0 2.6 [0.5 - 7.5] 97.4 0.9 1.82004 (142) 0.0 5.6 [2.5 - 10.8] 94.4 2.1 3.52005 (183) 0.0 7.1 [3.8 - 11.8] 92.9 3.3 1.1 1.6 1.12006 (159) 0.0 5.0 [2.2 - 9.7] 95.0 0.6 3.1 0.6 0.62007 (190) 0.0 5.8 [2.9 - 10.1] 93.7 0.5 1.1 2.6 1.6 0.52008 (246) 0.0 4.9 [2.5 - 8.4] 95.1 3.3 1.2 0.42009 (193) 0.0 5.7 [2.9 - 10.0] 94.3 0.5 2.6 2.1 0.52010 (202) 0.0 16.3 [11.5 - 22.2] 82.7 1.0 0.5 1.5 7.9 6.42011 (162) 0.0 22.2 [16.1 - 29.4] 75.9 1.9 1.2 4.9 6.8 6.2 3.12012 (91) 0.0 17.6 [10.4 - 27.0] 82.4 1.1 1.1 4.4 8.8 2.2
Cefoxitin 2002 (74) 1.3 8.1 [3.0 - 16.8] 2.7 47.3 31.1 9.5 1.3 8.12003 (114) 1.8 2.6 [0.5 - 7.5] 1.8 55.3 31.6 7.0 1.8 2.62004 (142) 1.4 4.9 [2.0 - 9.9] 1.4 60.6 28.2 3.5 1.4 0.7 4.22005 (183) 0.0 7.1 [3.8 - 11.8] 23.5 46.4 20.8 2.2 3.8 3.32006 (159) 0.0 0.6 [0.0 - 3.5] 54.7 38.4 1.9 3.1 1.92007 (190) 0.5 5.3 [2.6 - 9.5] 2.6 65.3 24.7 1.6 0.5 0.5 4.72008 (246) 0.0 4.9 [2.5 - 8.4] 0.8 65.4 24.8 4.1 0.4 4.52009 (193) 0.0 5.7 [2.9 - 10.0] 1.6 63.7 26.4 2.6 2.1 3.62010 (202) 0.5 15.3 [10.7 - 21.1] 10.9 53.5 18.8 1.0 0.5 4.0 11.42011 (162) 3.7 17.9 [12.3 - 24.7] 2.5 53.1 19.8 3.1 3.7 4.3 13.62012 (91) 1.1 15.4 [8.7 - 24.5] 1.1 58.2 22.0 2.2 1.1 1.1 14.3
Table 12.2 MIC Distribution among Salmonella from Ground Turkey, 2002-2012Distribution (%) of MICs (µg/ml)4
1 Percent of isolates with intermediate susceptibility. N/A used when no intermediate breakpoint is established. 2 Percent of isolates with resistance. Discrepancies between %R and sums of distribution are due to rounding. 3 95% confidence intervals for percent resistant (%R) were calculated using the Clopper-Pearson exact method. 4 Unshaded areas indicate the dilution range of the Sensititre plate used for susceptibility testing. Susceptibility breakpoints are indicated by single black vertical bars and resistance breakpoints are double red vertical bars. Numbers in shaded areas indicate % of isolates with MIC's greater than the highest concentrations on the Sensititre plate. Numbers listed for the lowest tested concentrations represent % of isolates with MICs equal to or less than the lowest tested concentration. CLSI breakpoints used when available. There are no CLSI breakpoints for streptomycin or azithromycin.
32
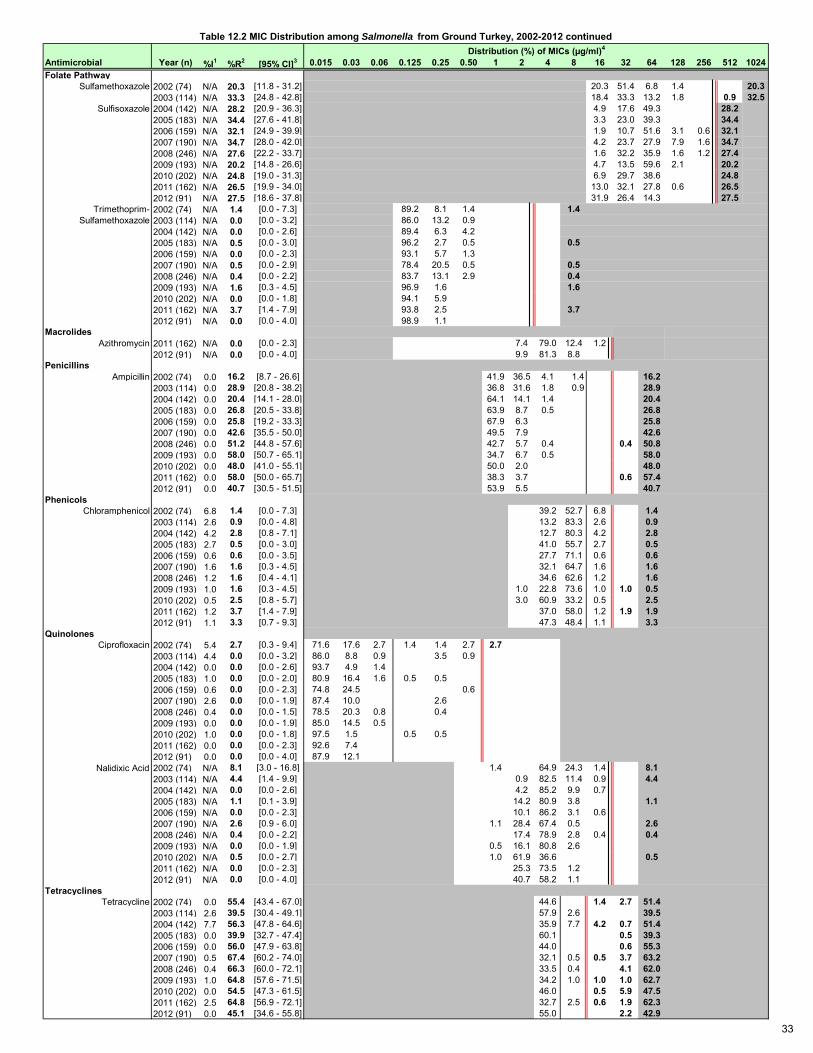
Antimicrobial Year (n) %I1 %R2 [95% CI]3 0.015 0.03 0.06 0.125 0.25 0.50 1 2 4 8 16 32 64 128 256 512 1024Folate Pathway
Sulfamethoxazole 2002 (74) N/A 20.3 [11.8 - 31.2] 20.3 51.4 6.8 1.4 20.32003 (114) N/A 33.3 [24.8 - 42.8] 18.4 33.3 13.2 1.8 0.9 32.5
Sulfisoxazole 2004 (142) N/A 28.2 [20.9 - 36.3] 4.9 17.6 49.3 28.22005 (183) N/A 34.4 [27.6 - 41.8] 3.3 23.0 39.3 34.42006 (159) N/A 32.1 [24.9 - 39.9] 1.9 10.7 51.6 3.1 0.6 32.12007 (190) N/A 34.7 [28.0 - 42.0] 4.2 23.7 27.9 7.9 1.6 34.72008 (246) N/A 27.6 [22.2 - 33.7] 1.6 32.2 35.9 1.6 1.2 27.42009 (193) N/A 20.2 [14.8 - 26.6] 4.7 13.5 59.6 2.1 20.22010 (202) N/A 24.8 [19.0 - 31.3] 6.9 29.7 38.6 24.82011 (162) N/A 26.5 [19.9 - 34.0] 13.0 32.1 27.8 0.6 26.52012 (91) N/A 27.5 [18.6 - 37.8] 31.9 26.4 14.3 27.5
Trimethoprim- 2002 (74) N/A 1.4 [0.0 - 7.3] 89.2 8.1 1.4 1.4 Sulfamethoxazole 2003 (114) N/A 0.0 [0.0 - 3.2] 86.0 13.2 0.9
2004 (142) N/A 0.0 [0.0 - 2.6] 89.4 6.3 4.22005 (183) N/A 0.5 [0.0 - 3.0] 96.2 2.7 0.5 0.52006 (159) N/A 0.0 [0.0 - 2.3] 93.1 5.7 1.32007 (190) N/A 0.5 [0.0 - 2.9] 78.4 20.5 0.5 0.52008 (246) N/A 0.4 [0.0 - 2.2] 83.7 13.1 2.9 0.42009 (193) N/A 1.6 [0.3 - 4.5] 96.9 1.6 1.62010 (202) N/A 0.0 [0.0 - 1.8] 94.1 5.92011 (162) N/A 3.7 [1.4 - 7.9] 93.8 2.5 3.72012 (91) N/A 0.0 [0.0 - 4.0] 98.9 1.1
Macrolides Azithromycin 2011 (162) N/A 0.0 [0.0 - 2.3] 7.4 79.0 12.4 1.2
2012 (91) N/A 0.0 [0.0 - 4.0] 9.9 81.3 8.8Penicillins
Ampicillin 2002 (74) 0.0 16.2 [8.7 - 26.6] 41.9 36.5 4.1 1.4 16.22003 (114) 0.0 28.9 [20.8 - 38.2] 36.8 31.6 1.8 0.9 28.92004 (142) 0.0 20.4 [14.1 - 28.0] 64.1 14.1 1.4 20.42005 (183) 0.0 26.8 [20.5 - 33.8] 63.9 8.7 0.5 26.82006 (159) 0.0 25.8 [19.2 - 33.3] 67.9 6.3 25.82007 (190) 0.0 42.6 [35.5 - 50.0] 49.5 7.9 42.62008 (246) 0.0 51.2 [44.8 - 57.6] 42.7 5.7 0.4 0.4 50.82009 (193) 0.0 58.0 [50.7 - 65.1] 34.7 6.7 0.5 58.02010 (202) 0.0 48.0 [41.0 - 55.1] 50.0 2.0 48.02011 (162) 0.0 58.0 [50.0 - 65.7] 38.3 3.7 0.6 57.42012 (91) 0.0 40.7 [30.5 - 51.5] 53.9 5.5 40.7
Phenicols Chloramphenicol 2002 (74) 6.8 1.4 [0.0 - 7.3] 39.2 52.7 6.8 1.4
2003 (114) 2.6 0.9 [0.0 - 4.8] 13.2 83.3 2.6 0.92004 (142) 4.2 2.8 [0.8 - 7.1] 12.7 80.3 4.2 2.82005 (183) 2.7 0.5 [0.0 - 3.0] 41.0 55.7 2.7 0.52006 (159) 0.6 0.6 [0.0 - 3.5] 27.7 71.1 0.6 0.62007 (190) 1.6 1.6 [0.3 - 4.5] 32.1 64.7 1.6 1.62008 (246) 1.2 1.6 [0.4 - 4.1] 34.6 62.6 1.2 1.62009 (193) 1.0 1.6 [0.3 - 4.5] 1.0 22.8 73.6 1.0 1.0 0.52010 (202) 0.5 2.5 [0.8 - 5.7] 3.0 60.9 33.2 0.5 2.52011 (162) 1.2 3.7 [1.4 - 7.9] 37.0 58.0 1.2 1.9 1.92012 (91) 1.1 3.3 [0.7 - 9.3] 47.3 48.4 1.1 3.3
Quinolones Ciprofloxacin 2002 (74) 5.4 2.7 [0.3 - 9.4] 71.6 17.6 2.7 1.4 1.4 2.7 2.7
2003 (114) 4.4 0.0 [0.0 - 3.2] 86.0 8.8 0.9 3.5 0.92004 (142) 0.0 0.0 [0.0 - 2.6] 93.7 4.9 1.42005 (183) 1.0 0.0 [0.0 - 2.0] 80.9 16.4 1.6 0.5 0.52006 (159) 0.6 0.0 [0.0 - 2.3] 74.8 24.5 0.62007 (190) 2.6 0.0 [0.0 - 1.9] 87.4 10.0 2.62008 (246) 0.4 0.0 [0.0 - 1.5] 78.5 20.3 0.8 0.42009 (193) 0.0 0.0 [0.0 - 1.9] 85.0 14.5 0.52010 (202) 1.0 0.0 [0.0 - 1.8] 97.5 1.5 0.5 0.52011 (162) 0.0 0.0 [0.0 - 2.3] 92.6 7.42012 (91) 0.0 0.0 [0.0 - 4.0] 87.9 12.1
Nalidixic Acid 2002 (74) N/A 8.1 [3.0 - 16.8] 1.4 64.9 24.3 1.4 8.12003 (114) N/A 4.4 [1.4 - 9.9] 0.9 82.5 11.4 0.9 4.42004 (142) N/A 0.0 [0.0 - 2.6] 4.2 85.2 9.9 0.72005 (183) N/A 1.1 [0.1 - 3.9] 14.2 80.9 3.8 1.12006 (159) N/A 0.0 [0.0 - 2.3] 10.1 86.2 3.1 0.62007 (190) N/A 2.6 [0.9 - 6.0] 1.1 28.4 67.4 0.5 2.62008 (246) N/A 0.4 [0.0 - 2.2] 17.4 78.9 2.8 0.4 0.42009 (193) N/A 0.0 [0.0 - 1.9] 0.5 16.1 80.8 2.62010 (202) N/A 0.5 [0.0 - 2.7] 1.0 61.9 36.6 0.52011 (162) N/A 0.0 [0.0 - 2.3] 25.3 73.5 1.22012 (91) N/A 0.0 [0.0 - 4.0] 40.7 58.2 1.1
Tetracyclines Tetracycline 2002 (74) 0.0 55.4 [43.4 - 67.0] 44.6 1.4 2.7 51.4
2003 (114) 2.6 39.5 [30.4 - 49.1] 57.9 2.6 39.52004 (142) 7.7 56.3 [47.8 - 64.6] 35.9 7.7 4.2 0.7 51.42005 (183) 0.0 39.9 [32.7 - 47.4] 60.1 0.5 39.32006 (159) 0.0 56.0 [47.9 - 63.8] 44.0 0.6 55.32007 (190) 0.5 67.4 [60.2 - 74.0] 32.1 0.5 0.5 3.7 63.22008 (246) 0.4 66.3 [60.0 - 72.1] 33.5 0.4 4.1 62.02009 (193) 1.0 64.8 [57.6 - 71.5] 34.2 1.0 1.0 1.0 62.72010 (202) 0.0 54.5 [47.3 - 61.5] 46.0 0.5 5.9 47.52011 (162) 2.5 64.8 [56.9 - 72.1] 32.7 2.5 0.6 1.9 62.32012 (91) 0.0 45.1 [34.6 - 55.8] 55.0 2.2 42.9
Table 12.2 MIC Distribution among Salmonella from Ground Turkey, 2002-2012 continuedDistribution (%) of MICs (µg/ml)4
33
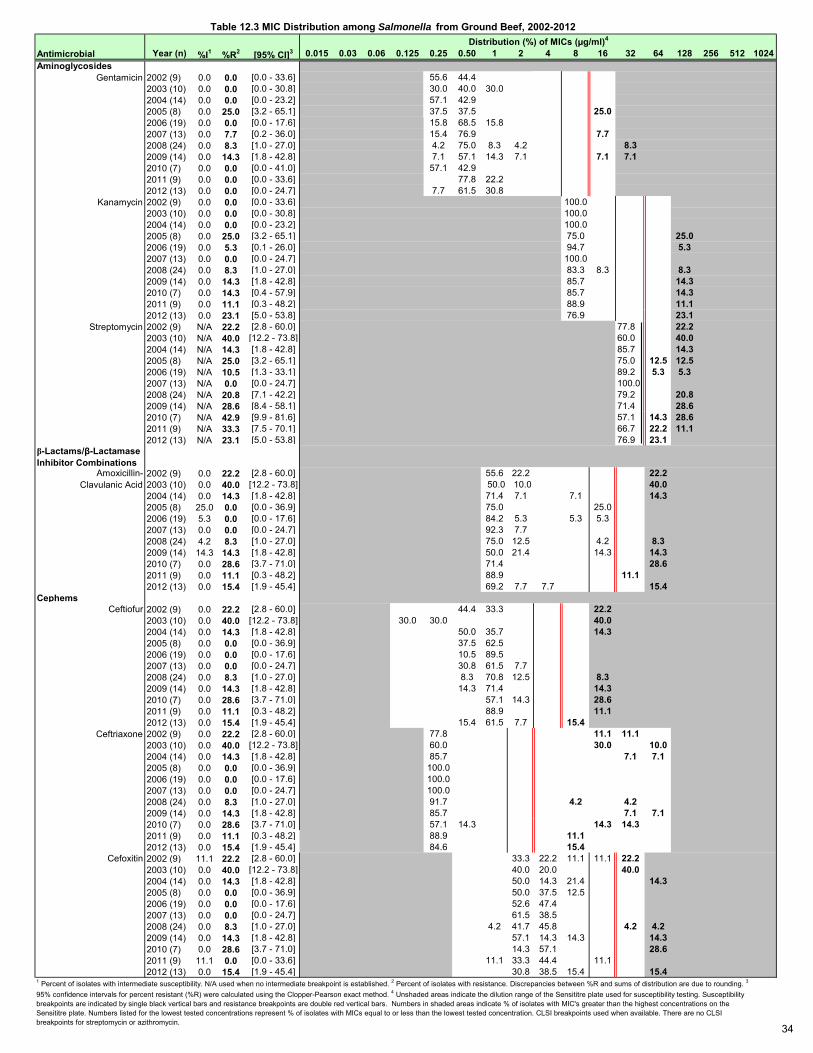
Antimicrobial Year (n) %I1 %R2 [95% CI]3 0.015 0.03 0.06 0.125 0.25 0.50 1 2 4 8 16 32 64 128 256 512 1024Aminoglycosides
Gentamicin 2002 (9) 0.0 0.0 [0.0 - 33.6] 55.6 44.42003 (10) 0.0 0.0 [0.0 - 30.8] 30.0 40.0 30.02004 (14) 0.0 0.0 [0.0 - 23.2] 57.1 42.92005 (8) 0.0 25.0 [3.2 - 65.1] 37.5 37.5 25.02006 (19) 0.0 0.0 [0.0 - 17.6] 15.8 68.5 15.82007 (13) 0.0 7.7 [0.2 - 36.0] 15.4 76.9 7.72008 (24) 0.0 8.3 [1.0 - 27.0] 4.2 75.0 8.3 4.2 8.32009 (14) 0.0 14.3 [1.8 - 42.8] 7.1 57.1 14.3 7.1 7.1 7.12010 (7) 0.0 0.0 [0.0 - 41.0] 57.1 42.92011 (9) 0.0 0.0 [0.0 - 33.6] 77.8 22.22012 (13) 0.0 0.0 [0.0 - 24.7] 7.7 61.5 30.8
Kanamycin 2002 (9) 0.0 0.0 [0.0 - 33.6] 100.02003 (10) 0.0 0.0 [0.0 - 30.8] 100.02004 (14) 0.0 0.0 [0.0 - 23.2] 100.02005 (8) 0.0 25.0 [3.2 - 65.1] 75.0 25.02006 (19) 0.0 5.3 [0.1 - 26.0] 94.7 5.32007 (13) 0.0 0.0 [0.0 - 24.7] 100.02008 (24) 0.0 8.3 [1.0 - 27.0] 83.3 8.3 8.32009 (14) 0.0 14.3 [1.8 - 42.8] 85.7 14.32010 (7) 0.0 14.3 [0.4 - 57.9] 85.7 14.32011 (9) 0.0 11.1 [0.3 - 48.2] 88.9 11.12012 (13) 0.0 23.1 [5.0 - 53.8] 76.9 23.1
Streptomycin 2002 (9) N/A 22.2 [2.8 - 60.0] 77.8 22.22003 (10) N/A 40.0 [12.2 - 73.8] 60.0 40.02004 (14) N/A 14.3 [1.8 - 42.8] 85.7 14.32005 (8) N/A 25.0 [3.2 - 65.1] 75.0 12.5 12.52006 (19) N/A 10.5 [1.3 - 33.1] 89.2 5.3 5.32007 (13) N/A 0.0 [0.0 - 24.7] 100.02008 (24) N/A 20.8 [7.1 - 42.2] 79.2 20.82009 (14) N/A 28.6 [8.4 - 58.1] 71.4 28.62010 (7) N/A 42.9 [9.9 - 81.6] 57.1 14.3 28.62011 (9) N/A 33.3 [7.5 - 70.1] 66.7 22.2 11.12012 (13) N/A 23.1 [5.0 - 53.8] 76.9 23.1
β-Lactams/β-Lactamase Inhibitor Combinations
Amoxicillin- 2002 (9) 0.0 22.2 [2.8 - 60.0] 55.6 22.2 22.2 Clavulanic Acid 2003 (10) 0.0 40.0 [12.2 - 73.8] 50.0 10.0 40.0
2004 (14) 0.0 14.3 [1.8 - 42.8] 71.4 7.1 7.1 14.32005 (8) 25.0 0.0 [0.0 - 36.9] 75.0 25.02006 (19) 5.3 0.0 [0.0 - 17.6] 84.2 5.3 5.3 5.32007 (13) 0.0 0.0 [0.0 - 24.7] 92.3 7.72008 (24) 4.2 8.3 [1.0 - 27.0] 75.0 12.5 4.2 8.32009 (14) 14.3 14.3 [1.8 - 42.8] 50.0 21.4 14.3 14.32010 (7) 0.0 28.6 [3.7 - 71.0] 71.4 28.62011 (9) 0.0 11.1 [0.3 - 48.2] 88.9 11.12012 (13) 0.0 15.4 [1.9 - 45.4] 69.2 7.7 7.7 15.4
Cephems Ceftiofur 2002 (9) 0.0 22.2 [2.8 - 60.0] 44.4 33.3 22.2
2003 (10) 0.0 40.0 [12.2 - 73.8] 30.0 30.0 40.02004 (14) 0.0 14.3 [1.8 - 42.8] 50.0 35.7 14.32005 (8) 0.0 0.0 [0.0 - 36.9] 37.5 62.52006 (19) 0.0 0.0 [0.0 - 17.6] 10.5 89.52007 (13) 0.0 0.0 [0.0 - 24.7] 30.8 61.5 7.72008 (24) 0.0 8.3 [1.0 - 27.0] 8.3 70.8 12.5 8.32009 (14) 0.0 14.3 [1.8 - 42.8] 14.3 71.4 14.32010 (7) 0.0 28.6 [3.7 - 71.0] 57.1 14.3 28.62011 (9) 0.0 11.1 [0.3 - 48.2] 88.9 11.12012 (13) 0.0 15.4 [1.9 - 45.4] 15.4 61.5 7.7 15.4
Ceftriaxone 2002 (9) 0.0 22.2 [2.8 - 60.0] 77.8 11.1 11.12003 (10) 0.0 40.0 [12.2 - 73.8] 60.0 30.0 10.02004 (14) 0.0 14.3 [1.8 - 42.8] 85.7 7.1 7.12005 (8) 0.0 0.0 [0.0 - 36.9] 100.02006 (19) 0.0 0.0 [0.0 - 17.6] 100.02007 (13) 0.0 0.0 [0.0 - 24.7] 100.02008 (24) 0.0 8.3 [1.0 - 27.0] 91.7 4.2 4.22009 (14) 0.0 14.3 [1.8 - 42.8] 85.7 7.1 7.12010 (7) 0.0 28.6 [3.7 - 71.0] 57.1 14.3 14.3 14.32011 (9) 0.0 11.1 [0.3 - 48.2] 88.9 11.12012 (13) 0.0 15.4 [1.9 - 45.4] 84.6 15.4
Cefoxitin 2002 (9) 11.1 22.2 [2.8 - 60.0] 33.3 22.2 11.1 11.1 22.22003 (10) 0.0 40.0 [12.2 - 73.8] 40.0 20.0 40.02004 (14) 0.0 14.3 [1.8 - 42.8] 50.0 14.3 21.4 14.32005 (8) 0.0 0.0 [0.0 - 36.9] 50.0 37.5 12.52006 (19) 0.0 0.0 [0.0 - 17.6] 52.6 47.42007 (13) 0.0 0.0 [0.0 - 24.7] 61.5 38.52008 (24) 0.0 8.3 [1.0 - 27.0] 4.2 41.7 45.8 4.2 4.22009 (14) 0.0 14.3 [1.8 - 42.8] 57.1 14.3 14.3 14.32010 (7) 0.0 28.6 [3.7 - 71.0] 14.3 57.1 28.62011 (9) 11.1 0.0 [0.0 - 33.6] 11.1 33.3 44.4 11.12012 (13) 0.0 15.4 [1.9 - 45.4] 30.8 38.5 15.4 15.4
Table 12.3 MIC Distribution among Salmonella from Ground Beef, 2002-2012Distribution (%) of MICs (µg/ml)4
1 Percent of isolates with intermediate susceptibility. N/A used when no intermediate breakpoint is established. 2 Percent of isolates with resistance. Discrepancies between %R and sums of distribution are due to rounding. 3
95% confidence intervals for percent resistant (%R) were calculated using the Clopper-Pearson exact method. 4 Unshaded areas indicate the dilution range of the Sensititre plate used for susceptibility testing. Susceptibility breakpoints are indicated by single black vertical bars and resistance breakpoints are double red vertical bars. Numbers in shaded areas indicate % of isolates with MIC's greater than the highest concentrations on the Sensititre plate. Numbers listed for the lowest tested concentrations represent % of isolates with MICs equal to or less than the lowest tested concentration. CLSI breakpoints used when available. There are no CLSI breakpoints for streptomycin or azithromycin.
34
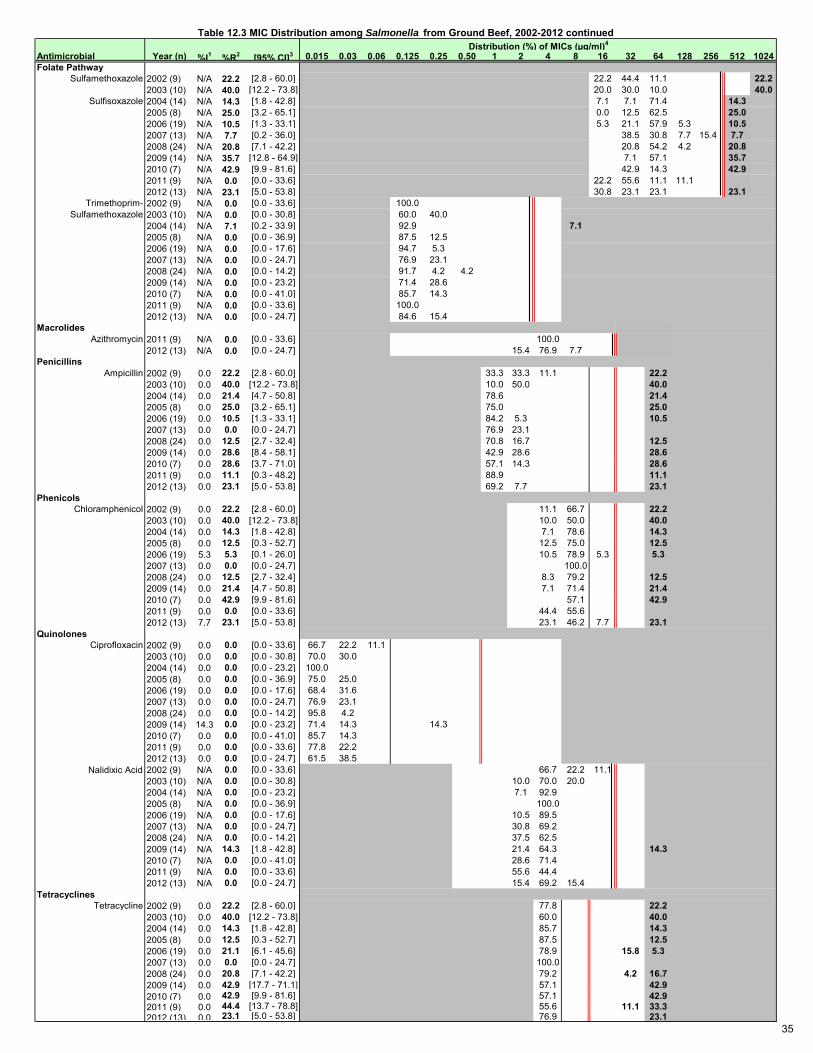
Antimicrobial Year (n) %I1 %R2 [95% CI]3 0.015 0.03 0.06 0.125 0.25 0.50 1 2 4 8 16 32 64 128 256 512 1024Folate Pathway
Sulfamethoxazole 2002 (9) N/A 22.2 [2.8 - 60.0] 22.2 44.4 11.1 22.22003 (10) N/A 40.0 [12.2 - 73.8] 20.0 30.0 10.0 40.0
Sulfisoxazole 2004 (14) N/A 14.3 [1.8 - 42.8] 7.1 7.1 71.4 14.32005 (8) N/A 25.0 [3.2 - 65.1] 0.0 12.5 62.5 25.02006 (19) N/A 10.5 [1.3 - 33.1] 5.3 21.1 57.9 5.3 10.52007 (13) N/A 7.7 [0.2 - 36.0] 38.5 30.8 7.7 15.4 7.72008 (24) N/A 20.8 [7.1 - 42.2] 20.8 54.2 4.2 20.82009 (14) N/A 35.7 [12.8 - 64.9] 7.1 57.1 35.72010 (7) N/A 42.9 [9.9 - 81.6] 42.9 14.3 42.92011 (9) N/A 0.0 [0.0 - 33.6] 22.2 55.6 11.1 11.12012 (13) N/A 23.1 [5.0 - 53.8] 30.8 23.1 23.1 23.1
Trimethoprim- 2002 (9) N/A 0.0 [0.0 - 33.6] 100.0 Sulfamethoxazole 2003 (10) N/A 0.0 [0.0 - 30.8] 60.0 40.0
2004 (14) N/A 7.1 [0.2 - 33.9] 92.9 7.12005 (8) N/A 0.0 [0.0 - 36.9] 87.5 12.52006 (19) N/A 0.0 [0.0 - 17.6] 94.7 5.32007 (13) N/A 0.0 [0.0 - 24.7] 76.9 23.12008 (24) N/A 0.0 [0.0 - 14.2] 91.7 4.2 4.22009 (14) N/A 0.0 [0.0 - 23.2] 71.4 28.62010 (7) N/A 0.0 [0.0 - 41.0] 85.7 14.32011 (9) N/A 0.0 [0.0 - 33.6] 100.02012 (13) N/A 0.0 [0.0 - 24.7] 84.6 15.4
Macrolides Azithromycin 2011 (9) N/A 0.0 [0.0 - 33.6] 100.0
2012 (13) N/A 0.0 [0.0 - 24.7] 15.4 76.9 7.7Penicillins
Ampicillin 2002 (9) 0.0 22.2 [2.8 - 60.0] 33.3 33.3 11.1 22.22003 (10) 0.0 40.0 [12.2 - 73.8] 10.0 50.0 40.02004 (14) 0.0 21.4 [4.7 - 50.8] 78.6 21.42005 (8) 0.0 25.0 [3.2 - 65.1] 75.0 25.02006 (19) 0.0 10.5 [1.3 - 33.1] 84.2 5.3 10.52007 (13) 0.0 0.0 [0.0 - 24.7] 76.9 23.12008 (24) 0.0 12.5 [2.7 - 32.4] 70.8 16.7 12.52009 (14) 0.0 28.6 [8.4 - 58.1] 42.9 28.6 28.62010 (7) 0.0 28.6 [3.7 - 71.0] 57.1 14.3 28.62011 (9) 0.0 11.1 [0.3 - 48.2] 88.9 11.12012 (13) 0.0 23.1 [5.0 - 53.8] 69.2 7.7 23.1
Phenicols Chloramphenicol 2002 (9) 0.0 22.2 [2.8 - 60.0] 11.1 66.7 22.2
2003 (10) 0.0 40.0 [12.2 - 73.8] 10.0 50.0 40.02004 (14) 0.0 14.3 [1.8 - 42.8] 7.1 78.6 14.32005 (8) 0.0 12.5 [0.3 - 52.7] 12.5 75.0 12.52006 (19) 5.3 5.3 [0.1 - 26.0] 10.5 78.9 5.3 5.32007 (13) 0.0 0.0 [0.0 - 24.7] 100.02008 (24) 0.0 12.5 [2.7 - 32.4] 8.3 79.2 12.52009 (14) 0.0 21.4 [4.7 - 50.8] 7.1 71.4 21.42010 (7) 0.0 42.9 [9.9 - 81.6] 57.1 42.92011 (9) 0.0 0.0 [0.0 - 33.6] 44.4 55.62012 (13) 7.7 23.1 [5.0 - 53.8] 23.1 46.2 7.7 23.1
Quinolones Ciprofloxacin 2002 (9) 0.0 0.0 [0.0 - 33.6] 66.7 22.2 11.1
2003 (10) 0.0 0.0 [0.0 - 30.8] 70.0 30.02004 (14) 0.0 0.0 [0.0 - 23.2] 100.02005 (8) 0.0 0.0 [0.0 - 36.9] 75.0 25.02006 (19) 0.0 0.0 [0.0 - 17.6] 68.4 31.62007 (13) 0.0 0.0 [0.0 - 24.7] 76.9 23.12008 (24) 0.0 0.0 [0.0 - 14.2] 95.8 4.22009 (14) 14.3 0.0 [0.0 - 23.2] 71.4 14.3 14.32010 (7) 0.0 0.0 [0.0 - 41.0] 85.7 14.32011 (9) 0.0 0.0 [0.0 - 33.6] 77.8 22.22012 (13) 0.0 0.0 [0.0 - 24.7] 61.5 38.5
Nalidixic Acid 2002 (9) N/A 0.0 [0.0 - 33.6] 66.7 22.2 11.12003 (10) N/A 0.0 [0.0 - 30.8] 10.0 70.0 20.02004 (14) N/A 0.0 [0.0 - 23.2] 7.1 92.92005 (8) N/A 0.0 [0.0 - 36.9] 100.02006 (19) N/A 0.0 [0.0 - 17.6] 10.5 89.52007 (13) N/A 0.0 [0.0 - 24.7] 30.8 69.22008 (24) N/A 0.0 [0.0 - 14.2] 37.5 62.52009 (14) N/A 14.3 [1.8 - 42.8] 21.4 64.3 14.32010 (7) N/A 0.0 [0.0 - 41.0] 28.6 71.42011 (9) N/A 0.0 [0.0 - 33.6] 55.6 44.42012 (13) N/A 0.0 [0.0 - 24.7] 15.4 69.2 15.4
Tetracyclines Tetracycline 2002 (9) 0.0 22.2 [2.8 - 60.0] 77.8 22.2
2003 (10) 0.0 40.0 [12.2 - 73.8] 60.0 40.02004 (14) 0.0 14.3 [1.8 - 42.8] 85.7 14.32005 (8) 0.0 12.5 [0.3 - 52.7] 87.5 12.52006 (19) 0.0 21.1 [6.1 - 45.6] 78.9 15.8 5.32007 (13) 0.0 0.0 [0.0 - 24.7] 100.02008 (24) 0.0 20.8 [7.1 - 42.2] 79.2 4.2 16.72009 (14) 0.0 42.9 [17.7 - 71.1] 57.1 42.92010 (7) 0.0 42.9 [9.9 - 81.6] 57.1 42.92011 (9) 0.0 44.4 [13.7 - 78.8] 55.6 11.1 33.32012 (13) 0.0 23.1 [5.0 - 53.8] 76.9 23.1
Table 12.3 MIC Distribution among Salmonella from Ground Beef, 2002-2012 continuedDistribution (%) of MICs (µg/ml)4
35
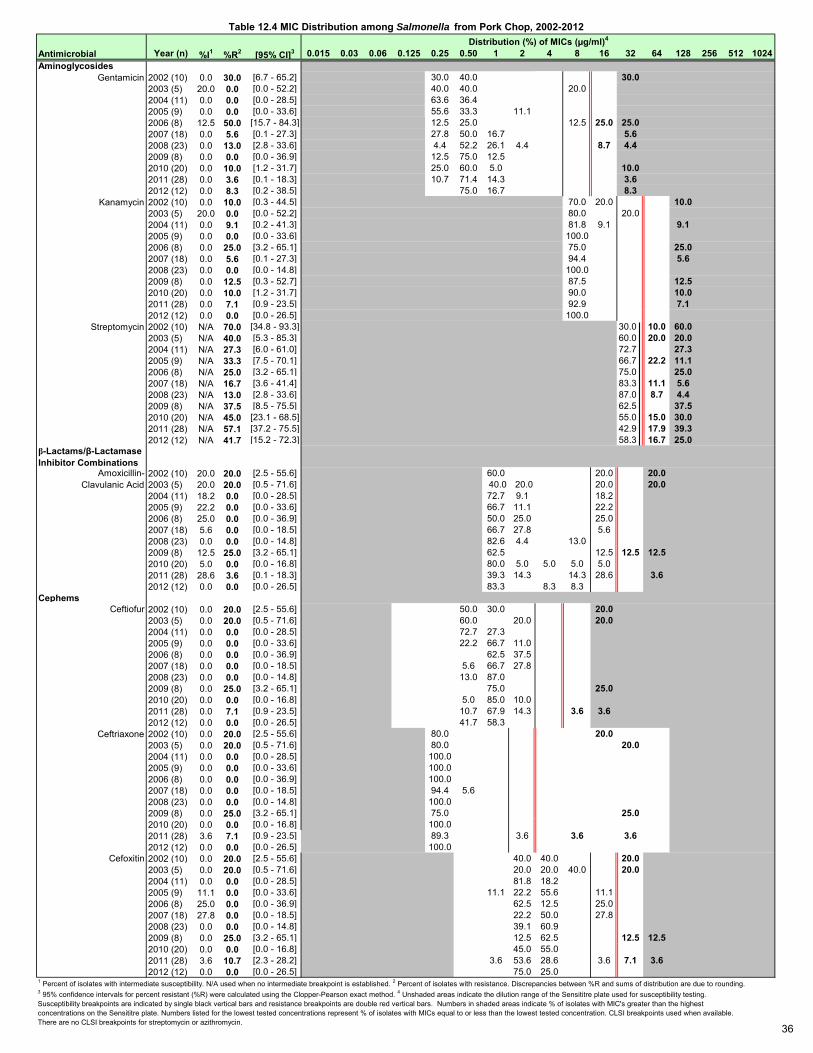
Antimicrobial Year (n) %I1 %R2 [95% CI]3 0.015 0.03 0.06 0.125 0.25 0.50 1 2 4 8 16 32 64 128 256 512 1024Aminoglycosides
Gentamicin 2002 (10) 0.0 30.0 [6.7 - 65.2] 30.0 40.0 30.02003 (5) 20.0 0.0 [0.0 - 52.2] 40.0 40.0 20.02004 (11) 0.0 0.0 [0.0 - 28.5] 63.6 36.42005 (9) 0.0 0.0 [0.0 - 33.6] 55.6 33.3 11.12006 (8) 12.5 50.0 [15.7 - 84.3] 12.5 25.0 12.5 25.0 25.02007 (18) 0.0 5.6 [0.1 - 27.3] 27.8 50.0 16.7 5.62008 (23) 0.0 13.0 [2.8 - 33.6] 4.4 52.2 26.1 4.4 8.7 4.42009 (8) 0.0 0.0 [0.0 - 36.9] 12.5 75.0 12.52010 (20) 0.0 10.0 [1.2 - 31.7] 25.0 60.0 5.0 10.02011 (28) 0.0 3.6 [0.1 - 18.3] 10.7 71.4 14.3 3.62012 (12) 0.0 8.3 [0.2 - 38.5] 75.0 16.7 8.3
Kanamycin 2002 (10) 0.0 10.0 [0.3 - 44.5] 70.0 20.0 10.02003 (5) 20.0 0.0 [0.0 - 52.2] 80.0 20.02004 (11) 0.0 9.1 [0.2 - 41.3] 81.8 9.1 9.12005 (9) 0.0 0.0 [0.0 - 33.6] 100.02006 (8) 0.0 25.0 [3.2 - 65.1] 75.0 25.02007 (18) 0.0 5.6 [0.1 - 27.3] 94.4 5.62008 (23) 0.0 0.0 [0.0 - 14.8] 100.02009 (8) 0.0 12.5 [0.3 - 52.7] 87.5 12.52010 (20) 0.0 10.0 [1.2 - 31.7] 90.0 10.02011 (28) 0.0 7.1 [0.9 - 23.5] 92.9 7.12012 (12) 0.0 0.0 [0.0 - 26.5] 100.0
Streptomycin 2002 (10) N/A 70.0 [34.8 - 93.3] 30.0 10.0 60.02003 (5) N/A 40.0 [5.3 - 85.3] 60.0 20.0 20.02004 (11) N/A 27.3 [6.0 - 61.0] 72.7 27.32005 (9) N/A 33.3 [7.5 - 70.1] 66.7 22.2 11.12006 (8) N/A 25.0 [3.2 - 65.1] 75.0 25.02007 (18) N/A 16.7 [3.6 - 41.4] 83.3 11.1 5.62008 (23) N/A 13.0 [2.8 - 33.6] 87.0 8.7 4.42009 (8) N/A 37.5 [8.5 - 75.5] 62.5 37.52010 (20) N/A 45.0 [23.1 - 68.5] 55.0 15.0 30.02011 (28) N/A 57.1 [37.2 - 75.5] 42.9 17.9 39.32012 (12) N/A 41.7 [15.2 - 72.3] 58.3 16.7 25.0
β-Lactams/β-Lactamase Inhibitor Combinations
Amoxicillin- 2002 (10) 20.0 20.0 [2.5 - 55.6] 60.0 20.0 20.0 Clavulanic Acid 2003 (5) 20.0 20.0 [0.5 - 71.6] 40.0 20.0 20.0 20.0
2004 (11) 18.2 0.0 [0.0 - 28.5] 72.7 9.1 18.22005 (9) 22.2 0.0 [0.0 - 33.6] 66.7 11.1 22.22006 (8) 25.0 0.0 [0.0 - 36.9] 50.0 25.0 25.02007 (18) 5.6 0.0 [0.0 - 18.5] 66.7 27.8 5.62008 (23) 0.0 0.0 [0.0 - 14.8] 82.6 4.4 13.02009 (8) 12.5 25.0 [3.2 - 65.1] 62.5 12.5 12.5 12.52010 (20) 5.0 0.0 [0.0 - 16.8] 80.0 5.0 5.0 5.0 5.02011 (28) 28.6 3.6 [0.1 - 18.3] 39.3 14.3 14.3 28.6 3.62012 (12) 0.0 0.0 [0.0 - 26.5] 83.3 8.3 8.3
Cephems Ceftiofur 2002 (10) 0.0 20.0 [2.5 - 55.6] 50.0 30.0 20.0
2003 (5) 0.0 20.0 [0.5 - 71.6] 60.0 20.0 20.02004 (11) 0.0 0.0 [0.0 - 28.5] 72.7 27.32005 (9) 0.0 0.0 [0.0 - 33.6] 22.2 66.7 11.02006 (8) 0.0 0.0 [0.0 - 36.9] 62.5 37.52007 (18) 0.0 0.0 [0.0 - 18.5] 5.6 66.7 27.82008 (23) 0.0 0.0 [0.0 - 14.8] 13.0 87.02009 (8) 0.0 25.0 [3.2 - 65.1] 75.0 25.02010 (20) 0.0 0.0 [0.0 - 16.8] 5.0 85.0 10.02011 (28) 0.0 7.1 [0.9 - 23.5] 10.7 67.9 14.3 3.6 3.62012 (12) 0.0 0.0 [0.0 - 26.5] 41.7 58.3
Ceftriaxone 2002 (10) 0.0 20.0 [2.5 - 55.6] 80.0 20.02003 (5) 0.0 20.0 [0.5 - 71.6] 80.0 20.02004 (11) 0.0 0.0 [0.0 - 28.5] 100.02005 (9) 0.0 0.0 [0.0 - 33.6] 100.02006 (8) 0.0 0.0 [0.0 - 36.9] 100.02007 (18) 0.0 0.0 [0.0 - 18.5] 94.4 5.62008 (23) 0.0 0.0 [0.0 - 14.8] 100.02009 (8) 0.0 25.0 [3.2 - 65.1] 75.0 25.02010 (20) 0.0 0.0 [0.0 - 16.8] 100.02011 (28) 3.6 7.1 [0.9 - 23.5] 89.3 3.6 3.6 3.62012 (12) 0.0 0.0 [0.0 - 26.5] 100.0
Cefoxitin 2002 (10) 0.0 20.0 [2.5 - 55.6] 40.0 40.0 20.02003 (5) 0.0 20.0 [0.5 - 71.6] 20.0 20.0 40.0 20.02004 (11) 0.0 0.0 [0.0 - 28.5] 81.8 18.22005 (9) 11.1 0.0 [0.0 - 33.6] 11.1 22.2 55.6 11.12006 (8) 25.0 0.0 [0.0 - 36.9] 62.5 12.5 25.02007 (18) 27.8 0.0 [0.0 - 18.5] 22.2 50.0 27.82008 (23) 0.0 0.0 [0.0 - 14.8] 39.1 60.92009 (8) 0.0 25.0 [3.2 - 65.1] 12.5 62.5 12.5 12.52010 (20) 0.0 0.0 [0.0 - 16.8] 45.0 55.02011 (28) 3.6 10.7 [2.3 - 28.2] 3.6 53.6 28.6 3.6 7.1 3.62012 (12) 0.0 0.0 [0.0 - 26.5] 75.0 25.0
Table 12.4 MIC Distribution among Salmonella from Pork Chop, 2002-2012Distribution (%) of MICs (µg/ml)4
1 Percent of isolates with intermediate susceptibility. N/A used when no intermediate breakpoint is established. 2 Percent of isolates with resistance. Discrepancies between %R and sums of distribution are due to rounding. 3 95% confidence intervals for percent resistant (%R) were calculated using the Clopper-Pearson exact method. 4 Unshaded areas indicate the dilution range of the Sensititre plate used for susceptibility testing. Susceptibility breakpoints are indicated by single black vertical bars and resistance breakpoints are double red vertical bars. Numbers in shaded areas indicate % of isolates with MIC's greater than the highest concentrations on the Sensititre plate. Numbers listed for the lowest tested concentrations represent % of isolates with MICs equal to or less than the lowest tested concentration. CLSI breakpoints used when available. There are no CLSI breakpoints for streptomycin or azithromycin.
36
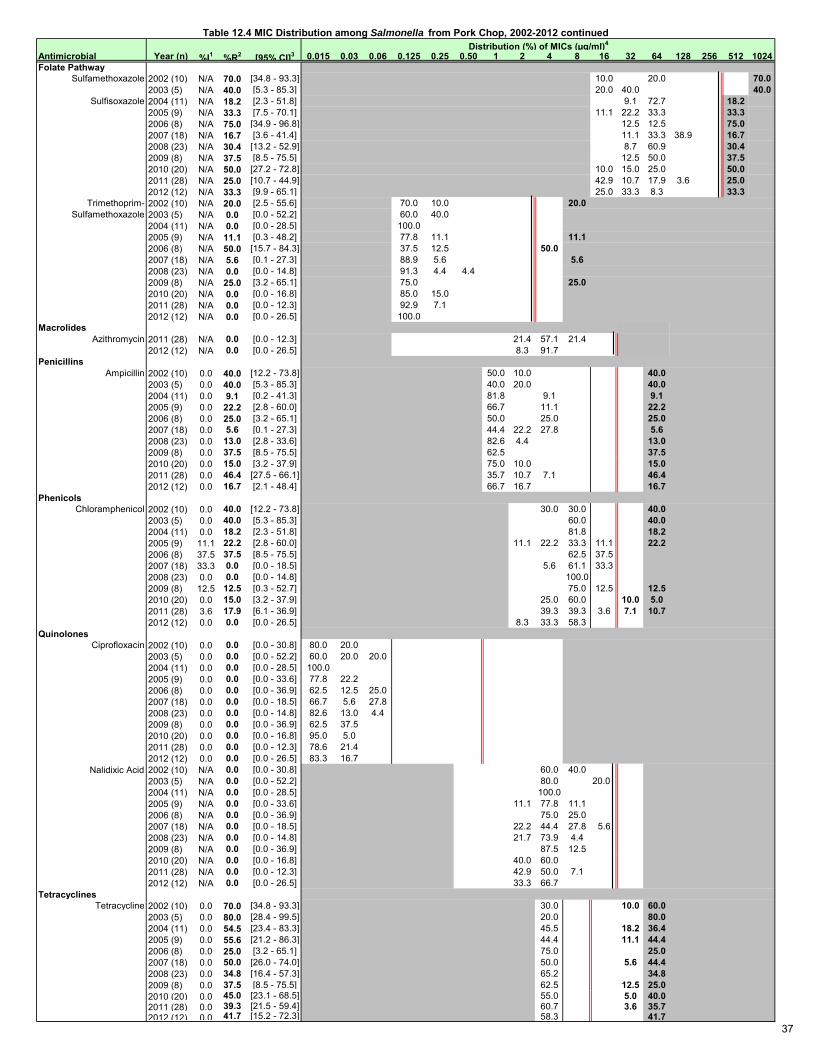
Antimicrobial Year (n) %I1 %R2 [95% CI]3 0.015 0.03 0.06 0.125 0.25 0.50 1 2 4 8 16 32 64 128 256 512 1024Folate Pathway
Sulfamethoxazole 2002 (10) N/A 70.0 [34.8 - 93.3] 10.0 20.0 70.02003 (5) N/A 40.0 [5.3 - 85.3] 20.0 40.0 40.0
Sulfisoxazole 2004 (11) N/A 18.2 [2.3 - 51.8] 9.1 72.7 18.22005 (9) N/A 33.3 [7.5 - 70.1] 11.1 22.2 33.3 33.32006 (8) N/A 75.0 [34.9 - 96.8] 12.5 12.5 75.02007 (18) N/A 16.7 [3.6 - 41.4] 11.1 33.3 38.9 16.72008 (23) N/A 30.4 [13.2 - 52.9] 8.7 60.9 30.42009 (8) N/A 37.5 [8.5 - 75.5] 12.5 50.0 37.52010 (20) N/A 50.0 [27.2 - 72.8] 10.0 15.0 25.0 50.02011 (28) N/A 25.0 [10.7 - 44.9] 42.9 10.7 17.9 3.6 25.02012 (12) N/A 33.3 [9.9 - 65.1] 25.0 33.3 8.3 33.3
Trimethoprim- 2002 (10) N/A 20.0 [2.5 - 55.6] 70.0 10.0 20.0 Sulfamethoxazole 2003 (5) N/A 0.0 [0.0 - 52.2] 60.0 40.0
2004 (11) N/A 0.0 [0.0 - 28.5] 100.02005 (9) N/A 11.1 [0.3 - 48.2] 77.8 11.1 11.12006 (8) N/A 50.0 [15.7 - 84.3] 37.5 12.5 50.02007 (18) N/A 5.6 [0.1 - 27.3] 88.9 5.6 5.62008 (23) N/A 0.0 [0.0 - 14.8] 91.3 4.4 4.42009 (8) N/A 25.0 [3.2 - 65.1] 75.0 25.02010 (20) N/A 0.0 [0.0 - 16.8] 85.0 15.02011 (28) N/A 0.0 [0.0 - 12.3] 92.9 7.12012 (12) N/A 0.0 [0.0 - 26.5] 100.0
Macrolides Azithromycin 2011 (28) N/A 0.0 [0.0 - 12.3] 21.4 57.1 21.4
2012 (12) N/A 0.0 [0.0 - 26.5] 8.3 91.7Penicillins
Ampicillin 2002 (10) 0.0 40.0 [12.2 - 73.8] 50.0 10.0 40.02003 (5) 0.0 40.0 [5.3 - 85.3] 40.0 20.0 40.02004 (11) 0.0 9.1 [0.2 - 41.3] 81.8 9.1 9.12005 (9) 0.0 22.2 [2.8 - 60.0] 66.7 11.1 22.22006 (8) 0.0 25.0 [3.2 - 65.1] 50.0 25.0 25.02007 (18) 0.0 5.6 [0.1 - 27.3] 44.4 22.2 27.8 5.62008 (23) 0.0 13.0 [2.8 - 33.6] 82.6 4.4 13.02009 (8) 0.0 37.5 [8.5 - 75.5] 62.5 37.52010 (20) 0.0 15.0 [3.2 - 37.9] 75.0 10.0 15.02011 (28) 0.0 46.4 [27.5 - 66.1] 35.7 10.7 7.1 46.42012 (12) 0.0 16.7 [2.1 - 48.4] 66.7 16.7 16.7
Phenicols Chloramphenicol 2002 (10) 0.0 40.0 [12.2 - 73.8] 30.0 30.0 40.0
2003 (5) 0.0 40.0 [5.3 - 85.3] 60.0 40.02004 (11) 0.0 18.2 [2.3 - 51.8] 81.8 18.22005 (9) 11.1 22.2 [2.8 - 60.0] 11.1 22.2 33.3 11.1 22.22006 (8) 37.5 37.5 [8.5 - 75.5] 62.5 37.52007 (18) 33.3 0.0 [0.0 - 18.5] 5.6 61.1 33.32008 (23) 0.0 0.0 [0.0 - 14.8] 100.02009 (8) 12.5 12.5 [0.3 - 52.7] 75.0 12.5 12.52010 (20) 0.0 15.0 [3.2 - 37.9] 25.0 60.0 10.0 5.02011 (28) 3.6 17.9 [6.1 - 36.9] 39.3 39.3 3.6 7.1 10.72012 (12) 0.0 0.0 [0.0 - 26.5] 8.3 33.3 58.3
Quinolones Ciprofloxacin 2002 (10) 0.0 0.0 [0.0 - 30.8] 80.0 20.0
2003 (5) 0.0 0.0 [0.0 - 52.2] 60.0 20.0 20.02004 (11) 0.0 0.0 [0.0 - 28.5] 100.02005 (9) 0.0 0.0 [0.0 - 33.6] 77.8 22.22006 (8) 0.0 0.0 [0.0 - 36.9] 62.5 12.5 25.02007 (18) 0.0 0.0 [0.0 - 18.5] 66.7 5.6 27.82008 (23) 0.0 0.0 [0.0 - 14.8] 82.6 13.0 4.42009 (8) 0.0 0.0 [0.0 - 36.9] 62.5 37.52010 (20) 0.0 0.0 [0.0 - 16.8] 95.0 5.02011 (28) 0.0 0.0 [0.0 - 12.3] 78.6 21.42012 (12) 0.0 0.0 [0.0 - 26.5] 83.3 16.7
Nalidixic Acid 2002 (10) N/A 0.0 [0.0 - 30.8] 60.0 40.02003 (5) N/A 0.0 [0.0 - 52.2] 80.0 20.02004 (11) N/A 0.0 [0.0 - 28.5] 100.02005 (9) N/A 0.0 [0.0 - 33.6] 11.1 77.8 11.12006 (8) N/A 0.0 [0.0 - 36.9] 75.0 25.02007 (18) N/A 0.0 [0.0 - 18.5] 22.2 44.4 27.8 5.62008 (23) N/A 0.0 [0.0 - 14.8] 21.7 73.9 4.42009 (8) N/A 0.0 [0.0 - 36.9] 87.5 12.52010 (20) N/A 0.0 [0.0 - 16.8] 40.0 60.02011 (28) N/A 0.0 [0.0 - 12.3] 42.9 50.0 7.12012 (12) N/A 0.0 [0.0 - 26.5] 33.3 66.7
Tetracyclines Tetracycline 2002 (10) 0.0 70.0 [34.8 - 93.3] 30.0 10.0 60.0
2003 (5) 0.0 80.0 [28.4 - 99.5] 20.0 80.02004 (11) 0.0 54.5 [23.4 - 83.3] 45.5 18.2 36.42005 (9) 0.0 55.6 [21.2 - 86.3] 44.4 11.1 44.42006 (8) 0.0 25.0 [3.2 - 65.1] 75.0 25.02007 (18) 0.0 50.0 [26.0 - 74.0] 50.0 5.6 44.42008 (23) 0.0 34.8 [16.4 - 57.3] 65.2 34.82009 (8) 0.0 37.5 [8.5 - 75.5] 62.5 12.5 25.02010 (20) 0.0 45.0 [23.1 - 68.5] 55.0 5.0 40.02011 (28) 0.0 39.3 [21.5 - 59.4] 60.7 3.6 35.72012 (12) 0.0 41.7 [15.2 - 72.3] 58.3 41.7
Table 12.4 MIC Distribution among Salmonella from Pork Chop, 2002-2012 continuedDistribution (%) of MICs (µg/ml)4
37
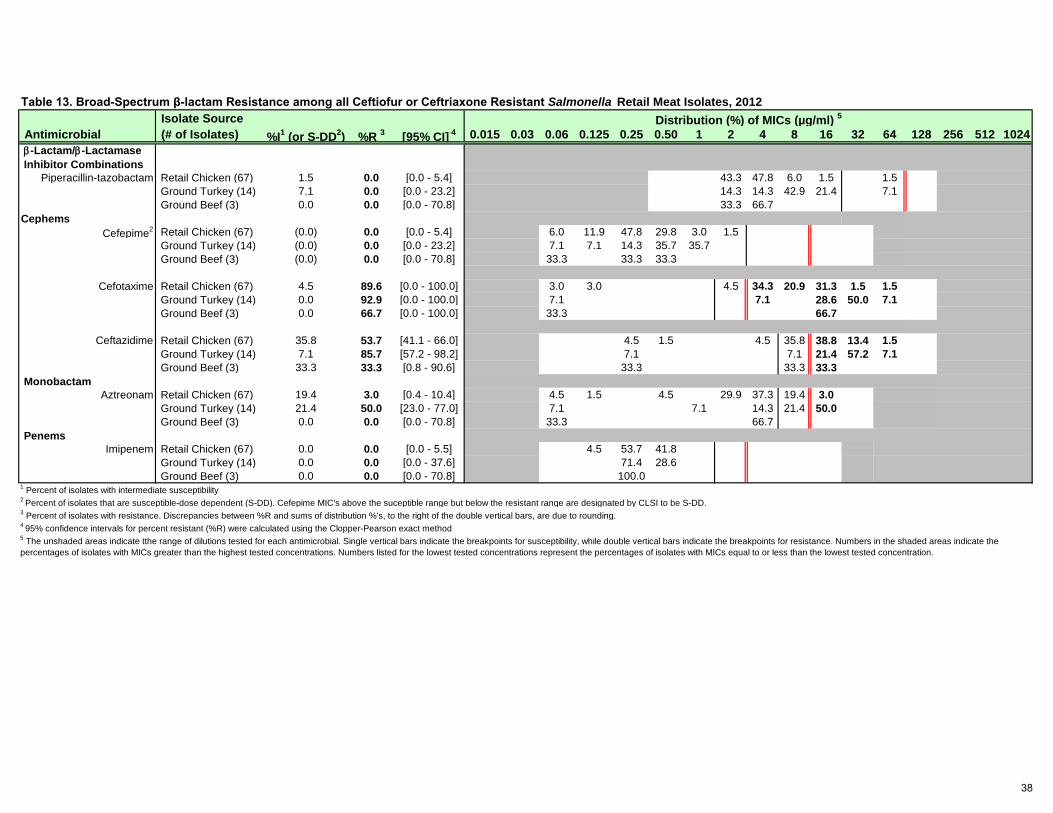
Isolate Source Antimicrobial (# of Isolates) %I1 (or S-DD2) %R 3 [95% CI] 4 0.015 0.03 0.06 0.125 0.25 0.50 1 2 4 8 16 32 64 128 256 512 1024 β-Lactam/β-Lactamase Inhibitor Combinations
Piperacillin-tazobactam Retail Chicken (67) 1.5 0.0 [0.0 - 5.4] 43.3 47.8 6.0 1.5 1.5 Ground Turkey (14) 7.1 0.0 [0.0 - 23.2] 14.3 14.3 42.9 21.4 7.1 Ground Beef (3) 0.0 0.0 [0.0 - 70.8] 33.3 66.7
Cephems Cefepime2 Retail Chicken (67) (0.0) 0.0 [0.0 - 5.4] 6.0 11.9 47.8 29.8 3.0 1.5
Ground Turkey (14) (0.0) 0.0 [0.0 - 23.2] 7.1 7.1 14.3 35.7 35.7 Ground Beef (3) (0.0) 0.0 [0.0 - 70.8] 33.3 33.3 33.3
Cefotaxime Retail Chicken (67) 4.5 89.6 [0.0 - 100.0] 3.0 3.0 4.5 34.3 20.9 31.3 1.5 1.5 Ground Turkey (14) 0.0 92.9 [0.0 - 100.0] 7.1 7.1 28.6 50.0 7.1 Ground Beef (3) 0.0 66.7 [0.0 - 100.0] 33.3 66.7
Ceftazidime Retail Chicken (67) 35.8 53.7 [41.1 - 66.0] 4.5 1.5 4.5 35.8 38.8 13.4 1.5 Ground Turkey (14) 7.1 85.7 [57.2 - 98.2] 7.1 7.1 21.4 57.2 7.1 Ground Beef (3) 33.3 33.3 [0.8 - 90.6] 33.3 33.3 33.3
Monobactam Aztreonam Retail Chicken (67) 19.4 3.0 [0.4 - 10.4] 4.5 1.5 4.5 29.9 37.3 19.4 3.0
Ground Turkey (14) 21.4 50.0 [23.0 - 77.0] 7.1 7.1 14.3 21.4 50.0 Ground Beef (3) 0.0 0.0 [0.0 - 70.8] 33.3 66.7
Penems Imipenem Retail Chicken (67) 0.0 0.0 [0.0 - 5.5] 4.5 53.7 41.8
Ground Turkey (14) 0.0 0.0 [0.0 - 37.6] 71.4 28.6 Ground Beef (3) 0.0 0.0 [0.0 - 70.8] 100.0
1 Percent of isolates with intermediate susceptibility2 Percent of isolates that are susceptible-dose dependent (S-DD). Cefepime MIC's above the suceptible range but below the resistant range are designated by CLSI to be S-DD.3 Percent of isolates with resistance. Discrepancies between %R and sums of distribution %'s, to the right of the double vertical bars, are due to rounding.4 95% confidence intervals for percent resistant (%R) were calculated using the Clopper-Pearson exact method
Table 13. Broad-Spectrum β-lactam Resistance among all Ceftiofur or Ceftriaxone Resistant Salmonella Retail Meat Isolates, 2012 Distribution (%) of MICs (µg/ml) 5
5 The unshaded areas indicate tthe range of dilutions tested for each antimicrobial. Single vertical bars indicate the breakpoints for susceptibility, while double vertical bars indicate the breakpoints for resistance. Numbers in the shaded areas indicate the percentages of isolates with MICs greater than the highest tested concentrations. Numbers listed for the lowest tested concentrations represent the percentages of isolates with MICs equal to or less than the lowest tested concentration.
38
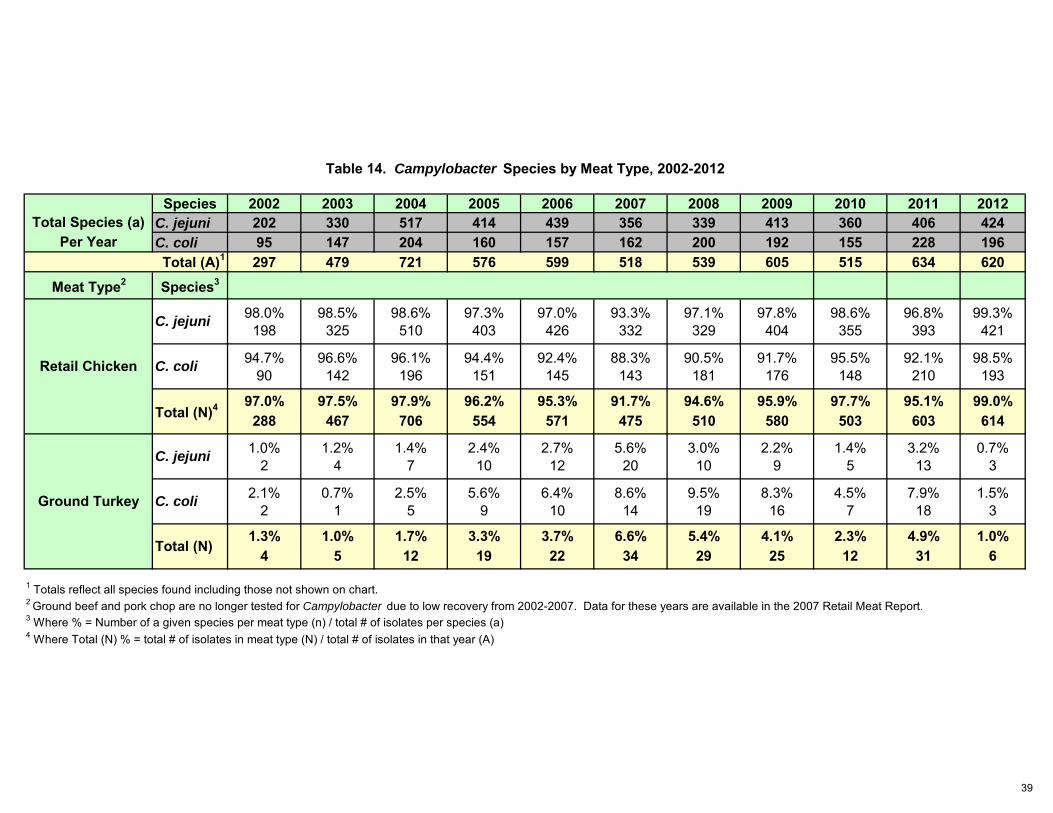
Species 2002 2003 2004 2005 2006 2007 2008 2009 2010 2011 2012Total Species (a) C. jejuni 202 330 517 414 439 356 339 413 360 406 424
Per Year C. coli 95 147 204 160 157 162 200 192 155 228 196297 479 721 576 599 518 539 605 515 634 620
Meat Type2 Species3
98.0% 98.5% 98.6% 97.3% 97.0% 93.3% 97.1% 97.8% 98.6% 96.8% 99.3%198 325 510 403 426 332 329 404 355 393 421
94.7% 96.6% 96.1% 94.4% 92.4% 88.3% 90.5% 91.7% 95.5% 92.1% 98.5%90 142 196 151 145 143 181 176 148 210 193
97.0% 97.5% 97.9% 96.2% 95.3% 91.7% 94.6% 95.9% 97.7% 95.1% 99.0%288 467 706 554 571 475 510 580 503 603 614
1.0% 1.2% 1.4% 2.4% 2.7% 5.6% 3.0% 2.2% 1.4% 3.2% 0.7%2 4 7 10 12 20 10 9 5 13 3
2.1% 0.7% 2.5% 5.6% 6.4% 8.6% 9.5% 8.3% 4.5% 7.9% 1.5%2 1 5 9 10 14 19 16 7 18 3
1.3% 1.0% 1.7% 3.3% 3.7% 6.6% 5.4% 4.1% 2.3% 4.9% 1.0%4 5 12 19 22 34 29 25 12 31 6
1 Totals reflect all species found including those not shown on chart.
3 Where % = Number of a given species per meat type (n) / total # of isolates per species (a)4 Where Total (N) % = total # of isolates in meat type (N) / total # of isolates in that year (A)
2 Ground beef and pork chop are no longer tested for Campylobacter due to low recovery from 2002-2007. Data for these years are available in the 2007 Retail Meat Report.
Total (N)
C. jejuni
C. coli
Table 14. Campylobacter Species by Meat Type, 2002-2012
Total (A)1
Total (N)4
C. jejuni
C. coli
Retail Chicken
Ground Turkey
39
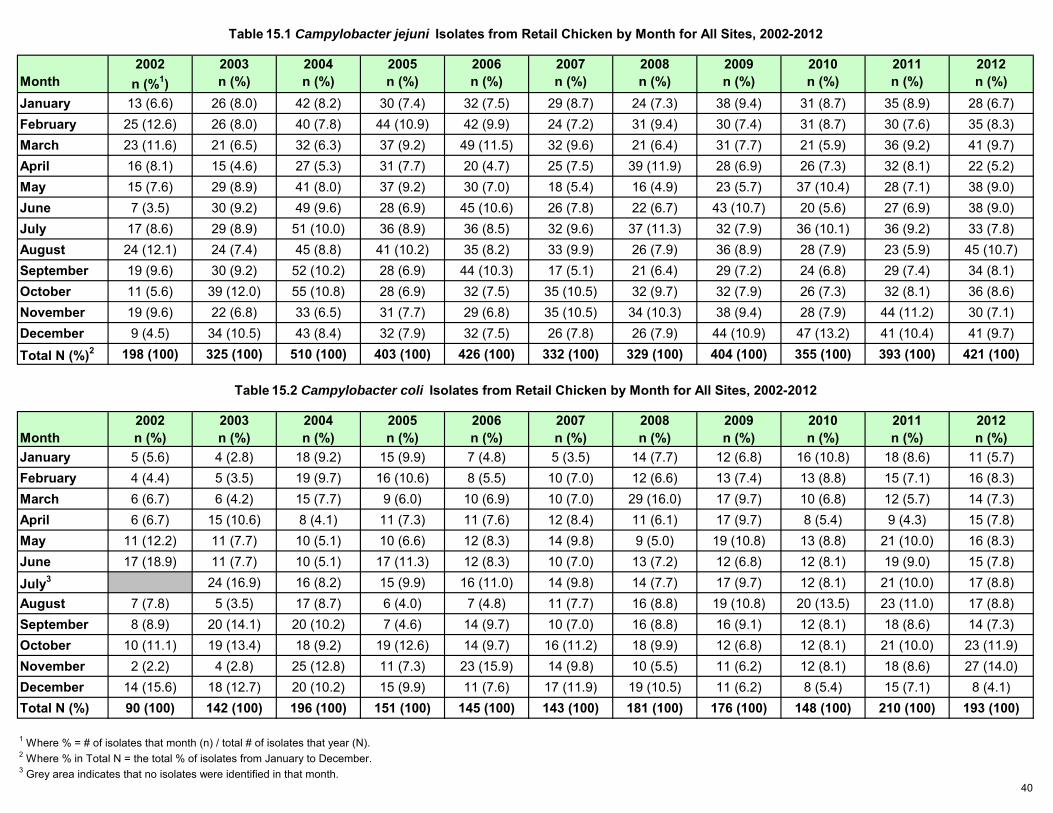
2002 2003 2004 2005 2006 2007 2008 2009 2010 2011 2012Month n (%1) n (%) n (%) n (%) n (%) n (%) n (%) n (%) n (%) n (%) n (%)January 13 (6.6) 26 (8.0) 42 (8.2) 30 (7.4) 32 (7.5) 29 (8.7) 24 (7.3) 38 (9.4) 31 (8.7) 35 (8.9) 28 (6.7)February 25 (12.6) 26 (8.0) 40 (7.8) 44 (10.9) 42 (9.9) 24 (7.2) 31 (9.4) 30 (7.4) 31 (8.7) 30 (7.6) 35 (8.3)March 23 (11.6) 21 (6.5) 32 (6.3) 37 (9.2) 49 (11.5) 32 (9.6) 21 (6.4) 31 (7.7) 21 (5.9) 36 (9.2) 41 (9.7)April 16 (8.1) 15 (4.6) 27 (5.3) 31 (7.7) 20 (4.7) 25 (7.5) 39 (11.9) 28 (6.9) 26 (7.3) 32 (8.1) 22 (5.2)May 15 (7.6) 29 (8.9) 41 (8.0) 37 (9.2) 30 (7.0) 18 (5.4) 16 (4.9) 23 (5.7) 37 (10.4) 28 (7.1) 38 (9.0)June 7 (3.5) 30 (9.2) 49 (9.6) 28 (6.9) 45 (10.6) 26 (7.8) 22 (6.7) 43 (10.7) 20 (5.6) 27 (6.9) 38 (9.0)July 17 (8.6) 29 (8.9) 51 (10.0) 36 (8.9) 36 (8.5) 32 (9.6) 37 (11.3) 32 (7.9) 36 (10.1) 36 (9.2) 33 (7.8)August 24 (12.1) 24 (7.4) 45 (8.8) 41 (10.2) 35 (8.2) 33 (9.9) 26 (7.9) 36 (8.9) 28 (7.9) 23 (5.9) 45 (10.7)September 19 (9.6) 30 (9.2) 52 (10.2) 28 (6.9) 44 (10.3) 17 (5.1) 21 (6.4) 29 (7.2) 24 (6.8) 29 (7.4) 34 (8.1)October 11 (5.6) 39 (12.0) 55 (10.8) 28 (6.9) 32 (7.5) 35 (10.5) 32 (9.7) 32 (7.9) 26 (7.3) 32 (8.1) 36 (8.6)November 19 (9.6) 22 (6.8) 33 (6.5) 31 (7.7) 29 (6.8) 35 (10.5) 34 (10.3) 38 (9.4) 28 (7.9) 44 (11.2) 30 (7.1)December 9 (4.5) 34 (10.5) 43 (8.4) 32 (7.9) 32 (7.5) 26 (7.8) 26 (7.9) 44 (10.9) 47 (13.2) 41 (10.4) 41 (9.7)
Total N (%)2 198 (100) 325 (100) 510 (100) 403 (100) 426 (100) 332 (100) 329 (100) 404 (100) 355 (100) 393 (100) 421 (100)
2002 2003 2004 2005 2006 2007 2008 2009 2010 2011 2012Month n (%) n (%) n (%) n (%) n (%) n (%) n (%) n (%) n (%) n (%) n (%)January 5 (5.6) 4 (2.8) 18 (9.2) 15 (9.9) 7 (4.8) 5 (3.5) 14 (7.7) 12 (6.8) 16 (10.8) 18 (8.6) 11 (5.7)February 4 (4.4) 5 (3.5) 19 (9.7) 16 (10.6) 8 (5.5) 10 (7.0) 12 (6.6) 13 (7.4) 13 (8.8) 15 (7.1) 16 (8.3)March 6 (6.7) 6 (4.2) 15 (7.7) 9 (6.0) 10 (6.9) 10 (7.0) 29 (16.0) 17 (9.7) 10 (6.8) 12 (5.7) 14 (7.3)April 6 (6.7) 15 (10.6) 8 (4.1) 11 (7.3) 11 (7.6) 12 (8.4) 11 (6.1) 17 (9.7) 8 (5.4) 9 (4.3) 15 (7.8)May 11 (12.2) 11 (7.7) 10 (5.1) 10 (6.6) 12 (8.3) 14 (9.8) 9 (5.0) 19 (10.8) 13 (8.8) 21 (10.0) 16 (8.3)June 17 (18.9) 11 (7.7) 10 (5.1) 17 (11.3) 12 (8.3) 10 (7.0) 13 (7.2) 12 (6.8) 12 (8.1) 19 (9.0) 15 (7.8)
July3 24 (16.9) 16 (8.2) 15 (9.9) 16 (11.0) 14 (9.8) 14 (7.7) 17 (9.7) 12 (8.1) 21 (10.0) 17 (8.8)August 7 (7.8) 5 (3.5) 17 (8.7) 6 (4.0) 7 (4.8) 11 (7.7) 16 (8.8) 19 (10.8) 20 (13.5) 23 (11.0) 17 (8.8)September 8 (8.9) 20 (14.1) 20 (10.2) 7 (4.6) 14 (9.7) 10 (7.0) 16 (8.8) 16 (9.1) 12 (8.1) 18 (8.6) 14 (7.3)October 10 (11.1) 19 (13.4) 18 (9.2) 19 (12.6) 14 (9.7) 16 (11.2) 18 (9.9) 12 (6.8) 12 (8.1) 21 (10.0) 23 (11.9)November 2 (2.2) 4 (2.8) 25 (12.8) 11 (7.3) 23 (15.9) 14 (9.8) 10 (5.5) 11 (6.2) 12 (8.1) 18 (8.6) 27 (14.0)December 14 (15.6) 18 (12.7) 20 (10.2) 15 (9.9) 11 (7.6) 17 (11.9) 19 (10.5) 11 (6.2) 8 (5.4) 15 (7.1) 8 (4.1)Total N (%) 90 (100) 142 (100) 196 (100) 151 (100) 145 (100) 143 (100) 181 (100) 176 (100) 148 (100) 210 (100) 193 (100)
1 Where % = # of isolates that month (n) / total # of isolates that year (N).2 Where % in Total N = the total % of isolates from January to December.3 Grey area indicates that no isolates were identified in that month.
Table 15.2 Campylobacter coli Isolates from Retail Chicken by Month for All Sites, 2002-2012
Table 15.1 Campylobacter jejuni Isolates from Retail Chicken by Month for All Sites, 2002-2012
40
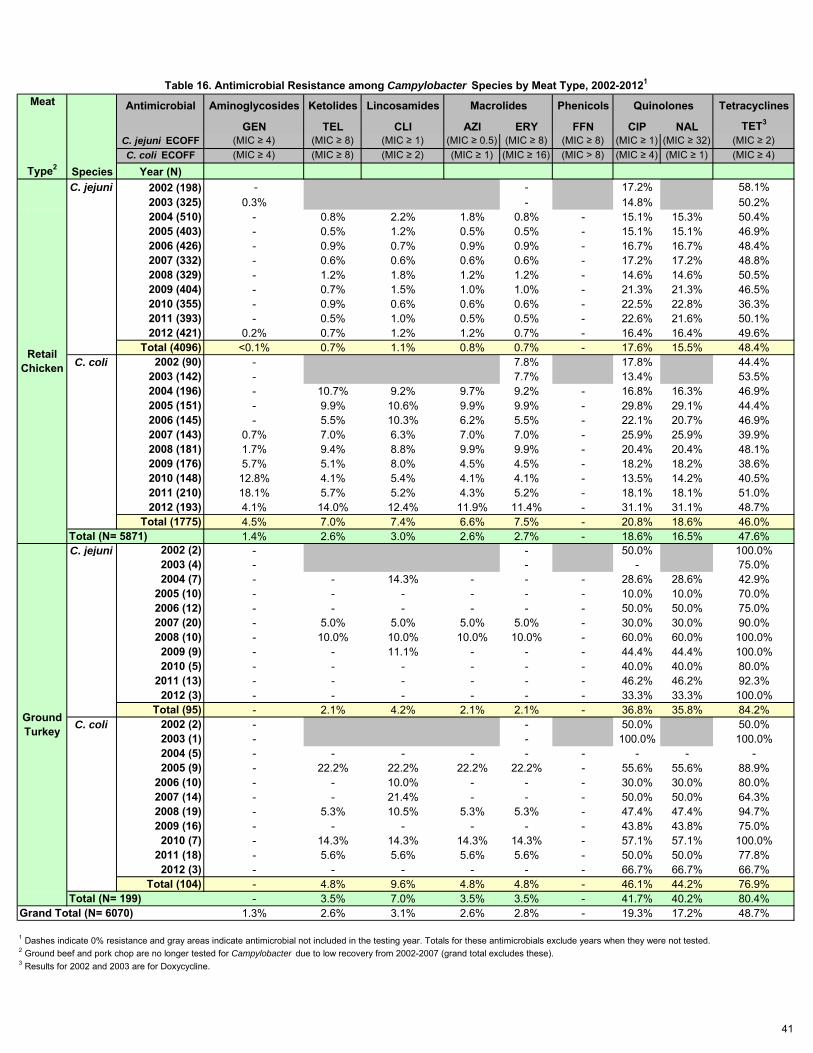
Meat
GEN TEL CLI AZI ERY FFN CIP NAL TET3
C. jejuni ECOFF (MIC ≥ 4) (MIC ≥ 8) (MIC ≥ 1) (MIC ≥ 0.5) (MIC ≥ 8) (MIC ≥ 8) (MIC ≥ 1) (MIC ≥ 32) (MIC ≥ 2)C. coli ECOFF (MIC ≥ 4) (MIC ≥ 8) (MIC ≥ 2) (MIC ≥ 1) (MIC ≥ 16) (MIC > 8) (MIC ≥ 4) (MIC ≥ 1) (MIC ≥ 4)
Type2 Species Year (N)C. jejuni 2002 (198) - - 17.2% 58.1%
2003 (325) 0.3% - 14.8% 50.2%2004 (510) - 0.8% 2.2% 1.8% 0.8% - 15.1% 15.3% 50.4%2005 (403) - 0.5% 1.2% 0.5% 0.5% - 15.1% 15.1% 46.9%2006 (426) - 0.9% 0.7% 0.9% 0.9% - 16.7% 16.7% 48.4%2007 (332) - 0.6% 0.6% 0.6% 0.6% - 17.2% 17.2% 48.8%2008 (329) - 1.2% 1.8% 1.2% 1.2% - 14.6% 14.6% 50.5%2009 (404) - 0.7% 1.5% 1.0% 1.0% - 21.3% 21.3% 46.5%2010 (355) - 0.9% 0.6% 0.6% 0.6% - 22.5% 22.8% 36.3%2011 (393) - 0.5% 1.0% 0.5% 0.5% - 22.6% 21.6% 50.1%2012 (421) 0.2% 0.7% 1.2% 1.2% 0.7% - 16.4% 16.4% 49.6%
Total (4096) <0.1% 0.7% 1.1% 0.8% 0.7% - 17.6% 15.5% 48.4%C. coli 2002 (90) - 7.8% 17.8% 44.4%
2003 (142) - 7.7% 13.4% 53.5%2004 (196) - 10.7% 9.2% 9.7% 9.2% - 16.8% 16.3% 46.9%2005 (151) - 9.9% 10.6% 9.9% 9.9% - 29.8% 29.1% 44.4%2006 (145) - 5.5% 10.3% 6.2% 5.5% - 22.1% 20.7% 46.9%2007 (143) 0.7% 7.0% 6.3% 7.0% 7.0% - 25.9% 25.9% 39.9%2008 (181) 1.7% 9.4% 8.8% 9.9% 9.9% - 20.4% 20.4% 48.1%2009 (176) 5.7% 5.1% 8.0% 4.5% 4.5% - 18.2% 18.2% 38.6%2010 (148) 12.8% 4.1% 5.4% 4.1% 4.1% - 13.5% 14.2% 40.5%2011 (210) 18.1% 5.7% 5.2% 4.3% 5.2% - 18.1% 18.1% 51.0%2012 (193) 4.1% 14.0% 12.4% 11.9% 11.4% - 31.1% 31.1% 48.7%
Total (1775) 4.5% 7.0% 7.4% 6.6% 7.5% - 20.8% 18.6% 46.0%Total (N= 5871) 1.4% 2.6% 3.0% 2.6% 2.7% - 18.6% 16.5% 47.6%C. jejuni 2002 (2) - - 50.0% 100.0%
2003 (4) - - - 75.0%2004 (7) - - 14.3% - - - 28.6% 28.6% 42.9%
2005 (10) - - - - - - 10.0% 10.0% 70.0%2006 (12) - - - - - - 50.0% 50.0% 75.0%2007 (20) - 5.0% 5.0% 5.0% 5.0% - 30.0% 30.0% 90.0%2008 (10) - 10.0% 10.0% 10.0% 10.0% - 60.0% 60.0% 100.0%2009 (9) - - 11.1% - - - 44.4% 44.4% 100.0%2010 (5) - - - - - - 40.0% 40.0% 80.0%
2011 (13) - - - - - - 46.2% 46.2% 92.3%2012 (3) - - - - - - 33.3% 33.3% 100.0%
Total (95) - 2.1% 4.2% 2.1% 2.1% - 36.8% 35.8% 84.2%C. coli 2002 (2) - - 50.0% 50.0%
2003 (1) - - 100.0% 100.0%2004 (5) - - - - - - - - -2005 (9) - 22.2% 22.2% 22.2% 22.2% - 55.6% 55.6% 88.9%
2006 (10) - - 10.0% - - - 30.0% 30.0% 80.0%2007 (14) - - 21.4% - - - 50.0% 50.0% 64.3%2008 (19) - 5.3% 10.5% 5.3% 5.3% - 47.4% 47.4% 94.7%2009 (16) - - - - - - 43.8% 43.8% 75.0%2010 (7) - 14.3% 14.3% 14.3% 14.3% - 57.1% 57.1% 100.0%
2011 (18) - 5.6% 5.6% 5.6% 5.6% - 50.0% 50.0% 77.8%2012 (3) - - - - - - 66.7% 66.7% 66.7%
Total (104) - 4.8% 9.6% 4.8% 4.8% - 46.1% 44.2% 76.9%Total (N= 199) - 3.5% 7.0% 3.5% 3.5% - 41.7% 40.2% 80.4%
Grand Total (N= 6070) 1.3% 2.6% 3.1% 2.6% 2.8% - 19.3% 17.2% 48.7%
2 Ground beef and pork chop are no longer tested for Campylobacter due to low recovery from 2002-2007 (grand total excludes these).3 Results for 2002 and 2003 are for Doxycycline.
1 Dashes indicate 0% resistance and gray areas indicate antimicrobial not included in the testing year. Totals for these antimicrobials exclude years when they were not tested.
Table 16. Antimicrobial Resistance among Campylobacter Species by Meat Type, 2002-20121
Retail Chicken
Ground Turkey
Antimicrobial Ketolides Macrolides QuinolonesAminoglycosides Lincosamides Phenicols Tetracyclines
41
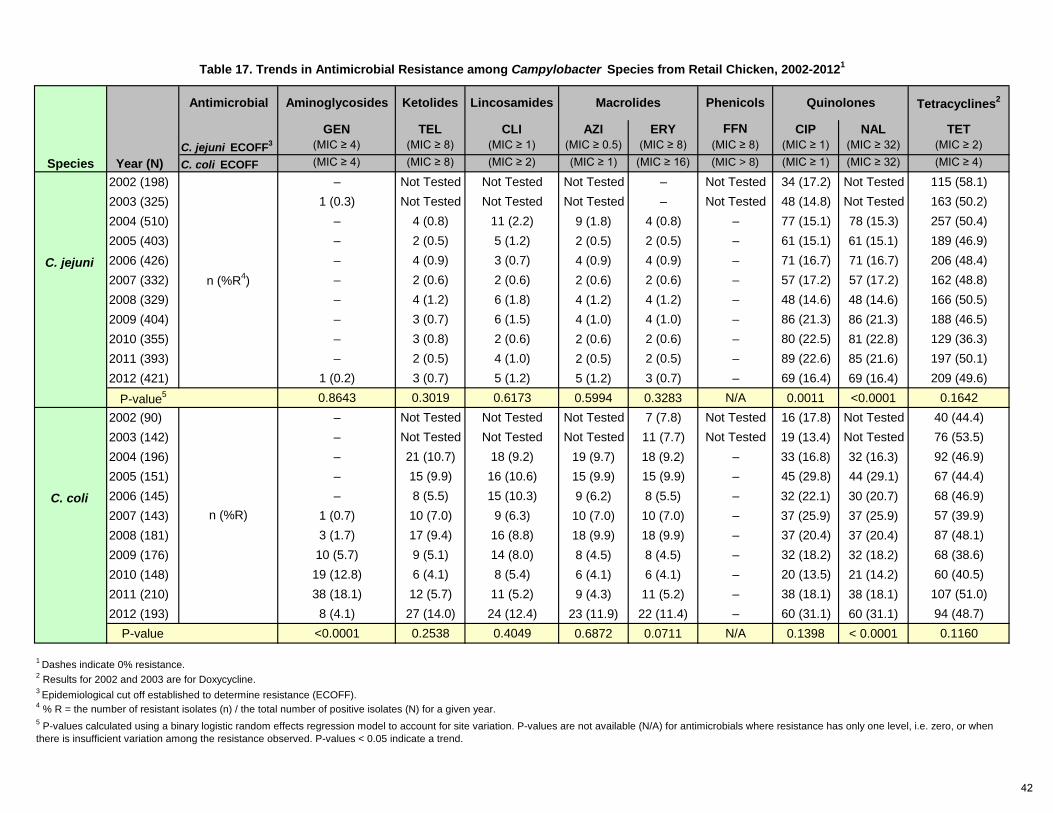
GEN TEL CLI AZI ERY FFN CIP NAL TETC. jejuni ECOFF3 (MIC ≥ 4) (MIC ≥ 8) (MIC ≥ 1) (MIC ≥ 0.5) (MIC ≥ 8) (MIC ≥ 8) (MIC ≥ 1) (MIC ≥ 32) (MIC ≥ 2)
Year (N) C. coli ECOFF (MIC ≥ 4) (MIC ≥ 8) (MIC ≥ 2) (MIC ≥ 1) (MIC ≥ 16) (MIC > 8) (MIC ≥ 1) (MIC ≥ 32) (MIC ≥ 4)
2002 (198) – Not Tested Not Tested Not Tested – Not Tested 34 (17.2) Not Tested 115 (58.1)2003 (325) 1 (0.3) Not Tested Not Tested Not Tested – Not Tested 48 (14.8) Not Tested 163 (50.2)2004 (510) – 4 (0.8) 11 (2.2) 9 (1.8) 4 (0.8) – 77 (15.1) 78 (15.3) 257 (50.4)2005 (403) – 2 (0.5) 5 (1.2) 2 (0.5) 2 (0.5) – 61 (15.1) 61 (15.1) 189 (46.9)
C. jejuni 2006 (426) – 4 (0.9) 3 (0.7) 4 (0.9) 4 (0.9) – 71 (16.7) 71 (16.7) 206 (48.4)2007 (332) – 2 (0.6) 2 (0.6) 2 (0.6) 2 (0.6) – 57 (17.2) 57 (17.2) 162 (48.8)2008 (329) – 4 (1.2) 6 (1.8) 4 (1.2) 4 (1.2) – 48 (14.6) 48 (14.6) 166 (50.5)2009 (404) – 3 (0.7) 6 (1.5) 4 (1.0) 4 (1.0) – 86 (21.3) 86 (21.3) 188 (46.5)2010 (355) – 3 (0.8) 2 (0.6) 2 (0.6) 2 (0.6) – 80 (22.5) 81 (22.8) 129 (36.3)2011 (393) – 2 (0.5) 4 (1.0) 2 (0.5) 2 (0.5) – 89 (22.6) 85 (21.6) 197 (50.1)2012 (421) 1 (0.2) 3 (0.7) 5 (1.2) 5 (1.2) 3 (0.7) – 69 (16.4) 69 (16.4) 209 (49.6)
P-value5 0.8643 0.3019 0.6173 0.5994 0.3283 N/A 0.0011 <0.0001 0.16422002 (90) – Not Tested Not Tested Not Tested 7 (7.8) Not Tested 16 (17.8) Not Tested 40 (44.4)2003 (142) – Not Tested Not Tested Not Tested 11 (7.7) Not Tested 19 (13.4) Not Tested 76 (53.5)2004 (196) – 21 (10.7) 18 (9.2) 19 (9.7) 18 (9.2) – 33 (16.8) 32 (16.3) 92 (46.9)2005 (151) – 15 (9.9) 16 (10.6) 15 (9.9) 15 (9.9) – 45 (29.8) 44 (29.1) 67 (44.4)
C. coli 2006 (145) – 8 (5.5) 15 (10.3) 9 (6.2) 8 (5.5) – 32 (22.1) 30 (20.7) 68 (46.9)2007 (143) 1 (0.7) 10 (7.0) 9 (6.3) 10 (7.0) 10 (7.0) – 37 (25.9) 37 (25.9) 57 (39.9)2008 (181) 3 (1.7) 17 (9.4) 16 (8.8) 18 (9.9) 18 (9.9) – 37 (20.4) 37 (20.4) 87 (48.1)2009 (176) 10 (5.7) 9 (5.1) 14 (8.0) 8 (4.5) 8 (4.5) – 32 (18.2) 32 (18.2) 68 (38.6)2010 (148) 19 (12.8) 6 (4.1) 8 (5.4) 6 (4.1) 6 (4.1) – 20 (13.5) 21 (14.2) 60 (40.5)2011 (210) 38 (18.1) 12 (5.7) 11 (5.2) 9 (4.3) 11 (5.2) – 38 (18.1) 38 (18.1) 107 (51.0)2012 (193) 8 (4.1) 27 (14.0) 24 (12.4) 23 (11.9) 22 (11.4) – 60 (31.1) 60 (31.1) 94 (48.7)
P-value <0.0001 0.2538 0.4049 0.6872 0.0711 N/A 0.1398 < 0.0001 0.1160
1 Dashes indicate 0% resistance.2 Results for 2002 and 2003 are for Doxycycline.
4 % R = the number of resistant isolates (n) / the total number of positive isolates (N) for a given year.
Table 17. Trends in Antimicrobial Resistance among Campylobacter Species from Retail Chicken, 2002-20121
Tetracyclines2
5 P-values calculated using a binary logistic random effects regression model to account for site variation. P-values are not available (N/A) for antimicrobials where resistance has only one level, i.e. zero, or when there is insufficient variation among the resistance observed. P-values < 0.05 indicate a trend.
3 Epidemiological cut off established to determine resistance (ECOFF).
PhenicolsAminoglycosides Ketolides Lincosamides Quinolones
Species
MacrolidesAntimicrobial
n (%R4)
n (%R)
42
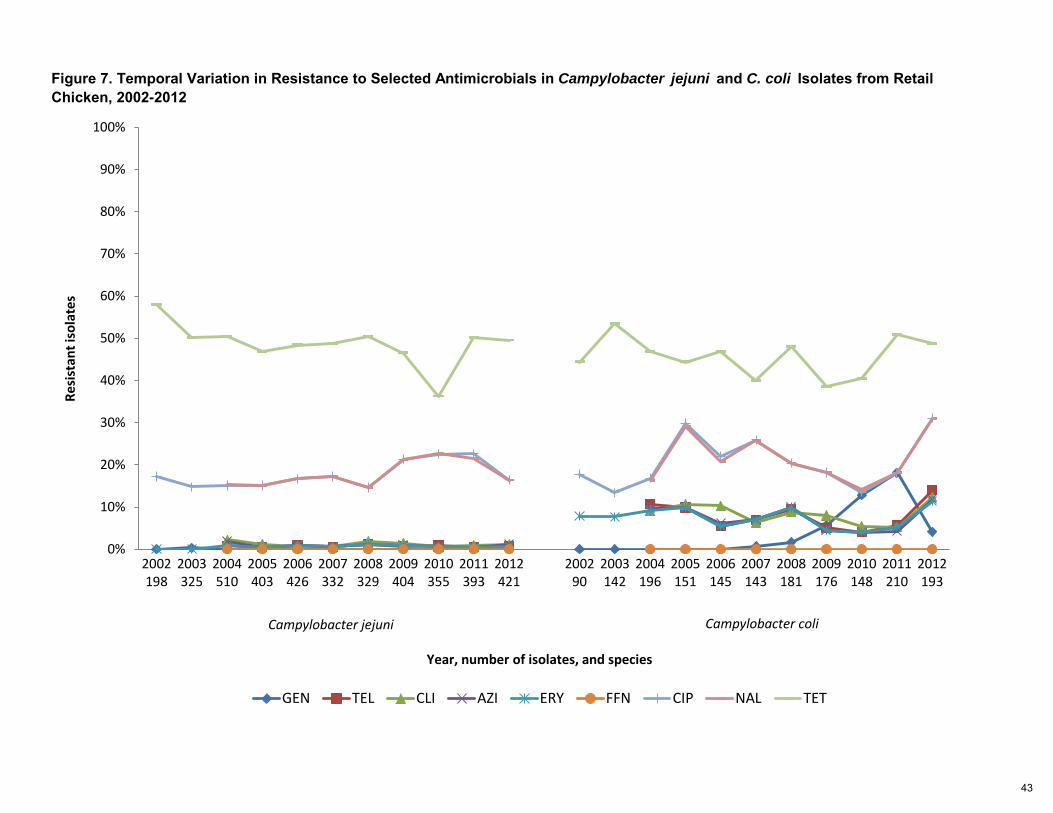
Figure 7. Temporal Variation in Resistance to Selected Antimicrobials in Campylobacter jejuni and C. coli Isolates from Retail Chicken, 2002-2012
0%
10%
20%
30%
40%
50%
60%
70%
80%
90%
100%
2002198
2003325
2004510
2005403
2006426
2007332
2008329
2009404
2010355
2011393
2012421
200290
2003142
2004196
2005151
2006145
2007143
2008181
2009176
2010148
2011210
2012193
Resi
stan
t iso
late
s
Year, number of isolates, and species
GEN TEL CLI AZI ERY FFN CIP NAL TET
Campylobacter jejuni Campylobacter coli
43
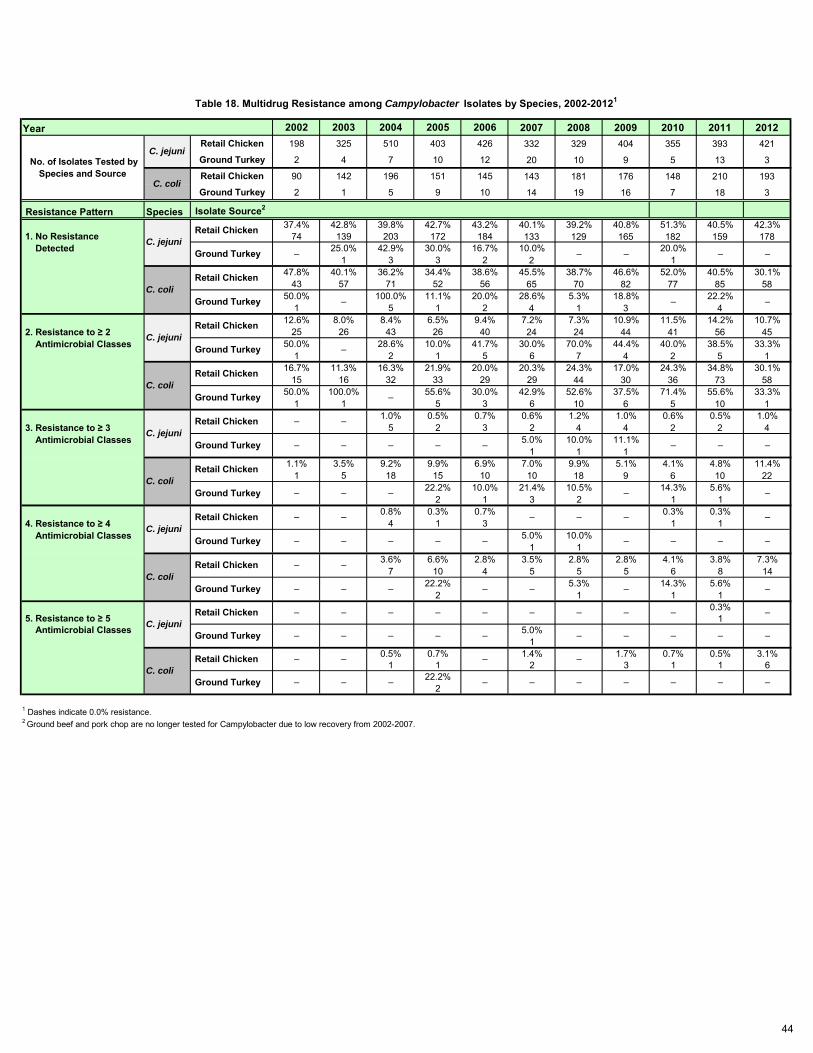
Year 2002 2003 2004 2005 2006 2007 2008 2009 2010 2011 2012Retail Chicken 198 325 510 403 426 332 329 404 355 393 421
Ground Turkey 2 4 7 10 12 20 10 9 5 13 3
Retail Chicken 90 142 196 151 145 143 181 176 148 210 193
Ground Turkey 2 1 5 9 10 14 19 16 7 18 3
Resistance Pattern Species Isolate Source2
37.4% 42.8% 39.8% 42.7% 43.2% 40.1% 39.2% 40.8% 51.3% 40.5% 42.3% 1. No Resistance 74 139 203 172 184 133 129 165 182 159 178 Detected 25.0% 42.9% 30.0% 16.7% 10.0% 20.0%
1 3 3 2 2 147.8% 40.1% 36.2% 34.4% 38.6% 45.5% 38.7% 46.6% 52.0% 40.5% 30.1%
43 57 71 52 56 65 70 82 77 85 5850.0% 100.0% 11.1% 20.0% 28.6% 5.3% 18.8% 22.2%
1 5 1 2 4 1 3 412.6% 8.0% 8.4% 6.5% 9.4% 7.2% 7.3% 10.9% 11.5% 14.2% 10.7%
2. Resistance to ≥ 2 25 26 43 26 40 24 24 44 41 56 45 Antimicrobial Classes 50.0% 28.6% 10.0% 41.7% 30.0% 70.0% 44.4% 40.0% 38.5% 33.3%
1 2 1 5 6 7 4 2 5 116.7% 11.3% 16.3% 21.9% 20.0% 20.3% 24.3% 17.0% 24.3% 34.8% 30.1%
15 16 32 33 29 29 44 30 36 73 5850.0% 100.0% 55.6% 30.0% 42.9% 52.6% 37.5% 71.4% 55.6% 33.3%
1 1 5 3 6 10 6 5 10 11.0% 0.5% 0.7% 0.6% 1.2% 1.0% 0.6% 0.5% 1.0%
3. Resistance to ≥ 3 5 2 3 2 4 4 2 2 4 Antimicrobial Classes 5.0% 10.0% 11.1% 1 1 1
1.1% 3.5% 9.2% 9.9% 6.9% 7.0% 9.9% 5.1% 4.1% 4.8% 11.4%1 5 18 15 10 10 18 9 6 10 22
22.2% 10.0% 21.4% 10.5% 14.3% 5.6%2 1 3 2 1 1
0.8% 0.3% 0.7% 0.3% 0.3% 4. Resistance to ≥ 4 4 1 3 1 1 Antimicrobial Classes 5.0% 10.0%
1 13.6% 6.6% 2.8% 3.5% 2.8% 2.8% 4.1% 3.8% 7.3%
7 10 4 5 5 5 6 8 1422.2% 5.3% 14.3% 5.6%
2 1 1 10.3%
5. Resistance to ≥ 5 1 Antimicrobial Classes 5.0%
10.5% 0.7% 1.4% 1.7% 0.7% 0.5% 3.1%
1 1 2 3 1 1 622.2%
2
1 Dashes indicate 0.0% resistance.2 Ground beef and pork chop are no longer tested for Campylobacter due to low recovery from 2002-2007.
–
–
–
–
–
–
–
–
–
–
–
–
–
–
–
–
–
–
–
–
–
–
–
–
– –
––
–
– –
C. coli Retail Chicken – –
Ground Turkey
Ground Turkey – –C. jejuni
Retail Chicken – –
– –
C. coli
–
–
–
Retail Chicken
Retail Chicken
Ground Turkey
Retail Chicken
Ground Turkey
Ground Turkey
C. jejuni
C. coli
C. coli
C. jejuni
C. coli
C. jejuni Retail Chicken
–
–
– –
C. jejuni
Retail Chicken
–
–
–
–
–
–
No. of Isolates Tested by Species and Source
Ground Turkey
Ground Turkey
Retail Chicken
Ground Turkey
Retail Chicken
–
– –
C. jejuni
C. coli
–
– –
–
– Ground Turkey
Retail Chicken
Ground Turkey
Table 18. Multidrug Resistance among Campylobacter Isolates by Species, 2002-20121
–
–
––
– –
–
–
–
– –
– –
–
––
–
–
–
–
–
–
–
44
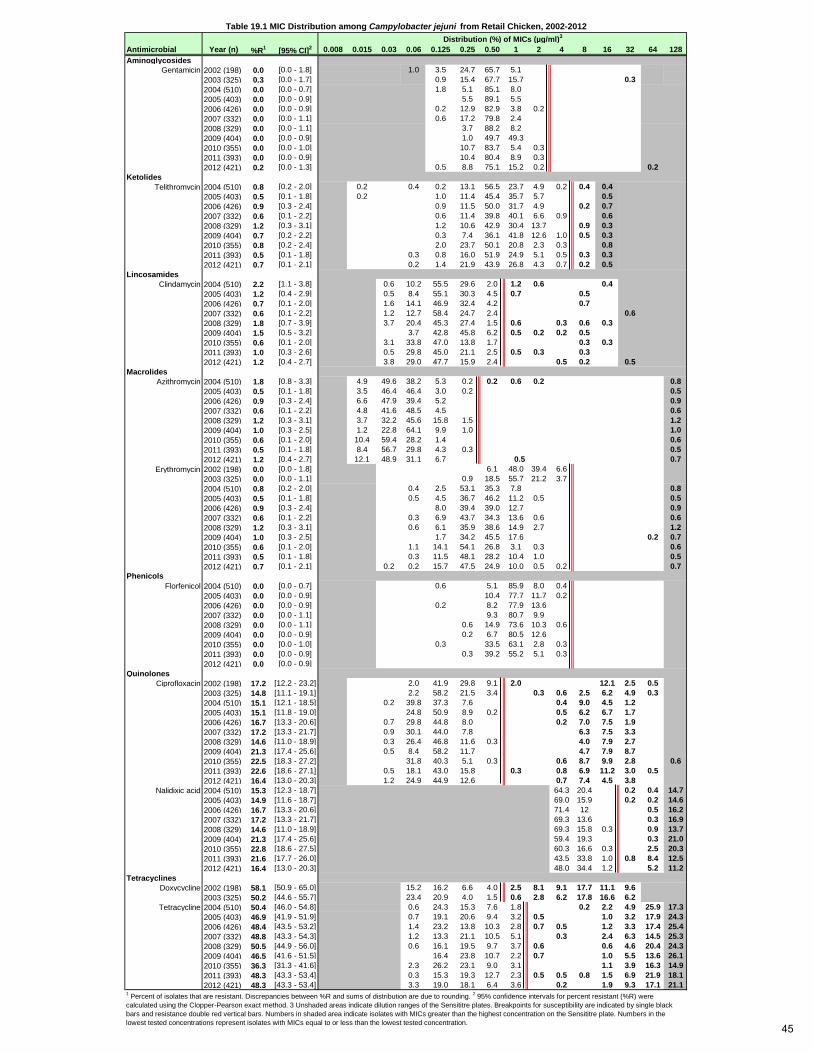
Antimicrobial Year (n) %R1 [95% CI]2 0.008 0.015 0.03 0.06 0.125 0.25 0.50 1 2 4 8 16 32 64 128Aminoglycosides
Gentamicin 2002 (198) 0.0 [0.0 - 1.8] 1.0 3.5 24.7 65.7 5.12003 (325) 0.3 [0.0 - 1.7] 0.9 15.4 67.7 15.7 0.32004 (510) 0.0 [0.0 - 0.7] 1.8 5.1 85.1 8.02005 (403) 0.0 [0.0 - 0.9] 5.5 89.1 5.52006 (426) 0.0 [0.0 - 0.9] 0.2 12.9 82.9 3.8 0.22007 (332) 0.0 [0.0 - 1.1] 0.6 17.2 79.8 2.42008 (329) 0.0 [0.0 - 1.1] 3.7 88.2 8.22009 (404) 0.0 [0.0 - 0.9] 1.0 49.7 49.32010 (355) 0.0 [0.0 - 1.0] 10.7 83.7 5.4 0.32011 (393) 0.0 [0.0 - 0.9] 10.4 80.4 8.9 0.32012 (421) 0.2 [0.0 - 1.3] 0.5 8.8 75.1 15.2 0.2 0.2
KetolidesTelithromycin 2004 (510) 0.8 [0.2 - 2.0] 0.2 0.4 0.2 13.1 56.5 23.7 4.9 0.2 0.4 0.4
2005 (403) 0.5 [0.1 - 1.8] 0.2 1.0 11.4 45.4 35.7 5.7 0.52006 (426) 0.9 [0.3 - 2.4] 0.9 11.5 50.0 31.7 4.9 0.2 0.72007 (332) 0.6 [0.1 - 2.2] 0.6 11.4 39.8 40.1 6.6 0.9 0.62008 (329) 1.2 [0.3 - 3.1] 1.2 10.6 42.9 30.4 13.7 0.9 0.32009 (404) 0.7 [0.2 - 2.2] 0.3 7.4 36.1 41.8 12.6 1.0 0.5 0.32010 (355) 0.8 [0.2 - 2.4] 2.0 23.7 50.1 20.8 2.3 0.3 0.82011 (393) 0.5 [0.1 - 1.8] 0.3 0.8 16.0 51.9 24.9 5.1 0.5 0.3 0.32012 (421) 0.7 [0.1 - 2.1] 0.2 1.4 21.9 43.9 26.8 4.3 0.7 0.2 0.5
LincosamidesClindamycin 2004 (510) 2.2 [1.1 - 3.8] 0.6 10.2 55.5 29.6 2.0 1.2 0.6 0.4
2005 (403) 1.2 [0.4 - 2.9] 0.5 8.4 55.1 30.3 4.5 0.7 0.52006 (426) 0.7 [0.1 - 2.0] 1.6 14.1 46.9 32.4 4.2 0.72007 (332) 0.6 [0.1 - 2.2] 1.2 12.7 58.4 24.7 2.4 0.62008 (329) 1.8 [0.7 - 3.9] 3.7 20.4 45.3 27.4 1.5 0.6 0.3 0.6 0.32009 (404) 1.5 [0.5 - 3.2] 3.7 42.8 45.8 6.2 0.5 0.2 0.2 0.52010 (355) 0.6 [0.1 - 2.0] 3.1 33.8 47.0 13.8 1.7 0.3 0.32011 (393) 1.0 [0.3 - 2.6] 0.5 29.8 45.0 21.1 2.5 0.5 0.3 0.32012 (421) 1.2 [0.4 - 2.7] 3.8 29.0 47.7 15.9 2.4 0.5 0.2 0.5
MacrolidesAzithromycin 2004 (510) 1.8 [0.8 - 3.3] 4.9 49.6 38.2 5.3 0.2 0.2 0.6 0.2 0.8
2005 (403) 0.5 [0.1 - 1.8] 3.5 46.4 46.4 3.0 0.2 0.52006 (426) 0.9 [0.3 - 2.4] 6.6 47.9 39.4 5.2 0.92007 (332) 0.6 [0.1 - 2.2] 4.8 41.6 48.5 4.5 0.62008 (329) 1.2 [0.3 - 3.1] 3.7 32.2 45.6 15.8 1.5 1.22009 (404) 1.0 [0.3 - 2.5] 1.2 22.8 64.1 9.9 1.0 1.02010 (355) 0.6 [0.1 - 2.0] 10.4 59.4 28.2 1.4 0.62011 (393) 0.5 [0.1 - 1.8] 8.4 56.7 29.8 4.3 0.3 0.52012 (421) 1.2 [0.4 - 2.7] 12.1 48.9 31.1 6.7 0.5 0.7
Erythromycin 2002 (198) 0.0 [0.0 - 1.8] 6.1 48.0 39.4 6.62003 (325) 0.0 [0.0 - 1.1] 0.9 18.5 55.7 21.2 3.72004 (510) 0.8 [0.2 - 2.0] 0.4 2.5 53.1 35.3 7.8 0.82005 (403) 0.5 [0.1 - 1.8] 0.5 4.5 36.7 46.2 11.2 0.5 0.52006 (426) 0.9 [0.3 - 2.4] 8.0 39.4 39.0 12.7 0.92007 (332) 0.6 [0.1 - 2.2] 0.3 6.9 43.7 34.3 13.6 0.6 0.62008 (329) 1.2 [0.3 - 3.1] 0.6 6.1 35.9 38.6 14.9 2.7 1.22009 (404) 1.0 [0.3 - 2.5] 1.7 34.2 45.5 17.6 0.2 0.72010 (355) 0.6 [0.1 - 2.0] 1.1 14.1 54.1 26.8 3.1 0.3 0.62011 (393) 0.5 [0.1 - 1.8] 0.3 11.5 48.1 28.2 10.4 1.0 0.52012 (421) 0.7 [0.1 - 2.1] 0.2 0.2 15.7 47.5 24.9 10.0 0.5 0.2 0.7
PhenicolsFlorfenicol 2004 (510) 0.0 [0.0 - 0.7] 0.6 5.1 85.9 8.0 0.4
2005 (403) 0.0 [0.0 - 0.9] 10.4 77.7 11.7 0.22006 (426) 0.0 [0.0 - 0.9] 0.2 8.2 77.9 13.62007 (332) 0.0 [0.0 - 1.1] 9.3 80.7 9.92008 (329) 0.0 [0.0 - 1.1] 0.6 14.9 73.6 10.3 0.62009 (404) 0.0 [0.0 - 0.9] 0.2 6.7 80.5 12.62010 (355) 0.0 [0.0 - 1.0] 0.3 33.5 63.1 2.8 0.32011 (393) 0.0 [0.0 - 0.9] 0.3 39.2 55.2 5.1 0.32012 (421) 0.0 [0.0 - 0.9]
QuinolonesCiprofloxacin 2002 (198) 17.2 [12.2 - 23.2] 2.0 41.9 29.8 9.1 2.0 12.1 2.5 0.5
2003 (325) 14.8 [11.1 - 19.1] 2.2 58.2 21.5 3.4 0.3 0.6 2.5 6.2 4.9 0.32004 (510) 15.1 [12.1 - 18.5] 0.2 39.8 37.3 7.6 0.4 9.0 4.5 1.22005 (403) 15.1 [11.8 - 19.0] 24.8 50.9 8.9 0.2 0.5 6.2 6.7 1.72006 (426) 16.7 [13.3 - 20.6] 0.7 29.8 44.8 8.0 0.2 7.0 7.5 1.92007 (332) 17.2 [13.3 - 21.7] 0.9 30.1 44.0 7.8 6.3 7.5 3.32008 (329) 14.6 [11.0 - 18.9] 0.3 26.4 46.8 11.6 0.3 4.0 7.9 2.72009 (404) 21.3 [17.4 - 25.6] 0.5 8.4 58.2 11.7 4.7 7.9 8.72010 (355) 22.5 [18.3 - 27.2] 31.8 40.3 5.1 0.3 0.6 8.7 9.9 2.8 0.62011 (393) 22.6 [18.6 - 27.1] 0.5 18.1 43.0 15.8 0.3 0.8 6.9 11.2 3.0 0.52012 (421) 16.4 [13.0 - 20.3] 1.2 24.9 44.9 12.6 0.7 7.4 4.5 3.8
Nalidixic acid 2004 (510) 15.3 [12.3 - 18.7] 64.3 20.4 0.2 0.4 14.72005 (403) 14.9 [11.6 - 18.7] 69.0 15.9 0.2 0.2 14.62006 (426) 16.7 [13.3 - 20.6] 71.4 12 0.5 16.22007 (332) 17.2 [13.3 - 21.7] 69.3 13.6 0.3 16.92008 (329) 14.6 [11.0 - 18.9] 69.3 15.8 0.3 0.9 13.72009 (404) 21.3 [17.4 - 25.6] 59.4 19.3 0.3 21.02010 (355) 22.8 [18.6 - 27.5] 60.3 16.6 0.3 2.5 20.32011 (393) 21.6 [17.7 - 26.0] 43.5 33.8 1.0 0.8 8.4 12.52012 (421) 16.4 [13.0 - 20.3] 48.0 34.4 1.2 5.2 11.2
TetracyclinesDoxycycline 2002 (198) 58.1 [50.9 - 65.0] 15.2 16.2 6.6 4.0 2.5 8.1 9.1 17.7 11.1 9.6
2003 (325) 50.2 [44.6 - 55.7] 23.4 20.9 4.0 1.5 0.6 2.8 6.2 17.8 16.6 6.2Tetracycline 2004 (510) 50.4 [46.0 - 54.8] 0.6 24.3 15.3 7.6 1.8 0.2 2.2 4.9 25.9 17.3
2005 (403) 46.9 [41.9 - 51.9] 0.7 19.1 20.6 9.4 3.2 0.5 1.0 3.2 17.9 24.32006 (426) 48.4 [43.5 - 53.2] 1.4 23.2 13.8 10.3 2.8 0.7 0.5 1.2 3.3 17.4 25.42007 (332) 48.8 [43.3 - 54.3] 1.2 13.3 21.1 10.5 5.1 0.3 2.4 6.3 14.5 25.32008 (329) 50.5 [44.9 - 56.0] 0.6 16.1 19.5 9.7 3.7 0.6 0.6 4.6 20.4 24.32009 (404) 46.5 [41.6 - 51.5] 16.4 23.8 10.7 2.2 0.7 1.0 5.5 13.6 26.12010 (355) 36.3 [31.3 - 41.6] 2.3 26.2 23.1 9.0 3.1 1.1 3.9 16.3 14.92011 (393) 48.3 [43.3 - 53.4] 0.3 15.3 19.3 12.7 2.3 0.5 0.5 0.8 1.5 6.9 21.9 18.12012 (421) 48.3 [43.3 - 53.4] 3.3 19.0 18.1 6.4 3.6 0.2 1.9 9.3 17.1 21.1
Distribution (%) of MICs (µg/ml)3Table 19.1 MIC Distribution among Campylobacter jejuni from Retail Chicken, 2002-2012
1 Percent of isolates that are resistant. Discrepancies between %R and sums of distribution are due to rounding. 2 95% confidence intervals for percent resistant (%R) were calculated using the Clopper-Pearson exact method. 3 Unshaded areas indicate dilution ranges of the Sensititre plates. Breakpoints for susceptibility are indicated by single black bars and resistance double red vertical bars. Numbers in shaded area indicate isolates with MICs greater than the highest concentration on the Sensititre plate. Numbers in the lowest tested concentrations represent isolates with MICs equal to or less than the lowest tested concentration.
45
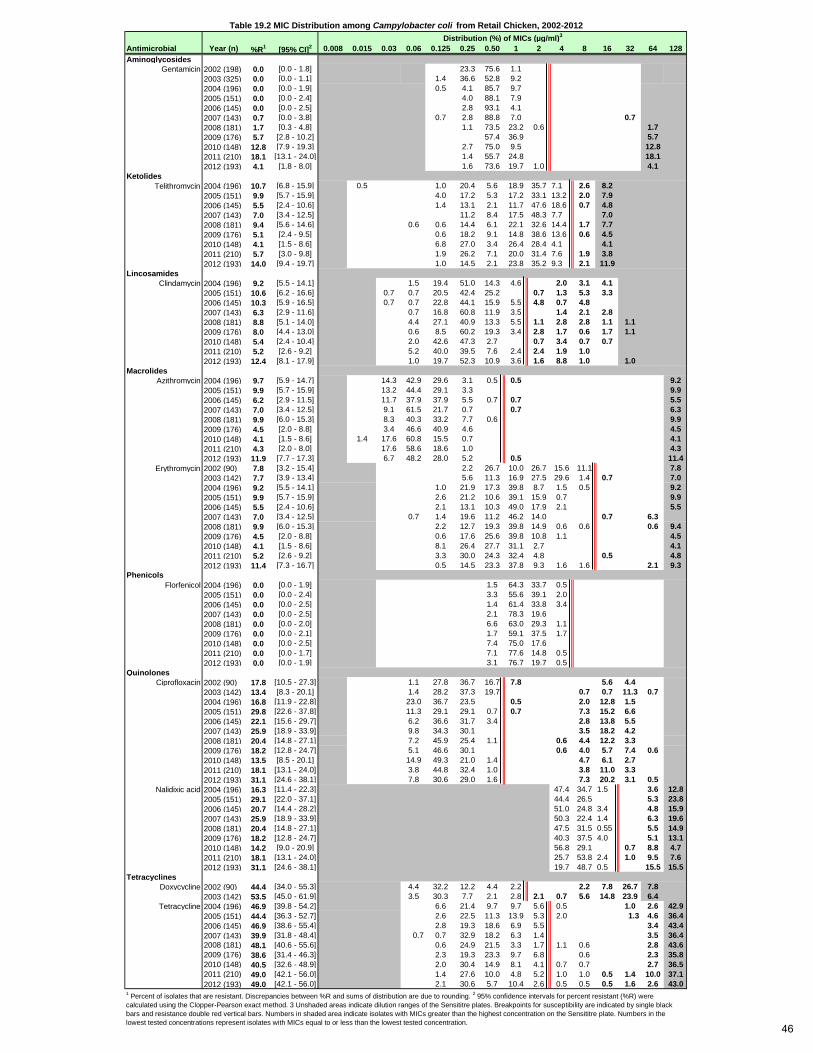
Antimicrobial Year (n) %R1 [95% CI]2 0.008 0.015 0.03 0.06 0.125 0.25 0.50 1 2 4 8 16 32 64 128Aminoglycosides
Gentamicin 2002 (198) 0.0 [0.0 - 1.8] 23.3 75.6 1.12003 (325) 0.0 [0.0 - 1.1] 1.4 36.6 52.8 9.22004 (196) 0.0 [0.0 - 1.9] 0.5 4.1 85.7 9.72005 (151) 0.0 [0.0 - 2.4] 4.0 88.1 7.92006 (145) 0.0 [0.0 - 2.5] 2.8 93.1 4.12007 (143) 0.7 [0.0 - 3.8] 0.7 2.8 88.8 7.0 0.72008 (181) 1.7 [0.3 - 4.8] 1.1 73.5 23.2 0.6 1.72009 (176) 5.7 [2.8 - 10.2] 57.4 36.9 5.72010 (148) 12.8 [7.9 - 19.3] 2.7 75.0 9.5 12.82011 (210) 18.1 [13.1 - 24.0] 1.4 55.7 24.8 18.12012 (193) 4.1 [1.8 - 8.0] 1.6 73.6 19.7 1.0 4.1
KetolidesTelithromycin 2004 (196) 10.7 [6.8 - 15.9] 0.5 1.0 20.4 5.6 18.9 35.7 7.1 2.6 8.2
2005 (151) 9.9 [5.7 - 15.9] 4.0 17.2 5.3 17.2 33.1 13.2 2.0 7.92006 (145) 5.5 [2.4 - 10.6] 1.4 13.1 2.1 11.7 47.6 18.6 0.7 4.82007 (143) 7.0 [3.4 - 12.5] 11.2 8.4 17.5 48.3 7.7 7.02008 (181) 9.4 [5.6 - 14.6] 0.6 0.6 14.4 6.1 22.1 32.6 14.4 1.7 7.72009 (176) 5.1 [2.4 - 9.5] 0.6 18.2 9.1 14.8 38.6 13.6 0.6 4.52010 (148) 4.1 [1.5 - 8.6] 6.8 27.0 3.4 26.4 28.4 4.1 4.12011 (210) 5.7 [3.0 - 9.8] 1.9 26.2 7.1 20.0 31.4 7.6 1.9 3.82012 (193) 14.0 [9.4 - 19.7] 1.0 14.5 2.1 23.8 35.2 9.3 2.1 11.9
LincosamidesClindamycin 2004 (196) 9.2 [5.5 - 14.1] 1.5 19.4 51.0 14.3 4.6 2.0 3.1 4.1
2005 (151) 10.6 [6.2 - 16.6] 0.7 0.7 20.5 42.4 25.2 0.7 1.3 5.3 3.32006 (145) 10.3 [5.9 - 16.5] 0.7 0.7 22.8 44.1 15.9 5.5 4.8 0.7 4.82007 (143) 6.3 [2.9 - 11.6] 0.7 16.8 60.8 11.9 3.5 1.4 2.1 2.82008 (181) 8.8 [5.1 - 14.0] 4.4 27.1 40.9 13.3 5.5 1.1 2.8 2.8 1.1 1.12009 (176) 8.0 [4.4 - 13.0] 0.6 8.5 60.2 19.3 3.4 2.8 1.7 0.6 1.7 1.12010 (148) 5.4 [2.4 - 10.4] 2.0 42.6 47.3 2.7 0.7 3.4 0.7 0.72011 (210) 5.2 [2.6 - 9.2] 5.2 40.0 39.5 7.6 2.4 2.4 1.9 1.02012 (193) 12.4 [8.1 - 17.9] 1.0 19.7 52.3 10.9 3.6 1.6 8.8 1.0 1.0
MacrolidesAzithromycin 2004 (196) 9.7 [5.9 - 14.7] 14.3 42.9 29.6 3.1 0.5 0.5 9.2
2005 (151) 9.9 [5.7 - 15.9] 13.2 44.4 29.1 3.3 9.92006 (145) 6.2 [2.9 - 11.5] 11.7 37.9 37.9 5.5 0.7 0.7 5.52007 (143) 7.0 [3.4 - 12.5] 9.1 61.5 21.7 0.7 0.7 6.32008 (181) 9.9 [6.0 - 15.3] 8.3 40.3 33.2 7.7 0.6 9.92009 (176) 4.5 [2.0 - 8.8] 3.4 46.6 40.9 4.6 4.52010 (148) 4.1 [1.5 - 8.6] 1.4 17.6 60.8 15.5 0.7 4.12011 (210) 4.3 [2.0 - 8.0] 17.6 58.6 18.6 1.0 4.32012 (193) 11.9 [7.7 - 17.3] 6.7 48.2 28.0 5.2 0.5 11.4
Erythromycin 2002 (90) 7.8 [3.2 - 15.4] 2.2 26.7 10.0 26.7 15.6 11.1 7.82003 (142) 7.7 [3.9 - 13.4] 5.6 11.3 16.9 27.5 29.6 1.4 0.7 7.02004 (196) 9.2 [5.5 - 14.1] 1.0 21.9 17.3 39.8 8.7 1.5 0.5 9.22005 (151) 9.9 [5.7 - 15.9] 2.6 21.2 10.6 39.1 15.9 0.7 9.92006 (145) 5.5 [2.4 - 10.6] 2.1 13.1 10.3 49.0 17.9 2.1 5.52007 (143) 7.0 [3.4 - 12.5] 0.7 1.4 19.6 11.2 46.2 14.0 0.7 6.32008 (181) 9.9 [6.0 - 15.3] 2.2 12.7 19.3 39.8 14.9 0.6 0.6 0.6 9.42009 (176) 4.5 [2.0 - 8.8] 0.6 17.6 25.6 39.8 10.8 1.1 4.52010 (148) 4.1 [1.5 - 8.6] 8.1 26.4 27.7 31.1 2.7 4.12011 (210) 5.2 [2.6 - 9.2] 3.3 30.0 24.3 32.4 4.8 0.5 4.82012 (193) 11.4 [7.3 - 16.7] 0.5 14.5 23.3 37.8 9.3 1.6 1.6 2.1 9.3
PhenicolsFlorfenicol 2004 (196) 0.0 [0.0 - 1.9] 1.5 64.3 33.7 0.5
2005 (151) 0.0 [0.0 - 2.4] 3.3 55.6 39.1 2.02006 (145) 0.0 [0.0 - 2.5] 1.4 61.4 33.8 3.42007 (143) 0.0 [0.0 - 2.5] 2.1 78.3 19.62008 (181) 0.0 [0.0 - 2.0] 6.6 63.0 29.3 1.12009 (176) 0.0 [0.0 - 2.1] 1.7 59.1 37.5 1.72010 (148) 0.0 [0.0 - 2.5] 7.4 75.0 17.62011 (210) 0.0 [0.0 - 1.7] 7.1 77.6 14.8 0.52012 (193) 0.0 [0.0 - 1.9] 3.1 76.7 19.7 0.5
QuinolonesCiprofloxacin 2002 (90) 17.8 [10.5 - 27.3] 1.1 27.8 36.7 16.7 7.8 5.6 4.4
2003 (142) 13.4 [8.3 - 20.1] 1.4 28.2 37.3 19.7 0.7 0.7 11.3 0.72004 (196) 16.8 [11.9 - 22.8] 23.0 36.7 23.5 0.5 2.0 12.8 1.52005 (151) 29.8 [22.6 - 37.8] 11.3 29.1 29.1 0.7 0.7 7.3 15.2 6.62006 (145) 22.1 [15.6 - 29.7] 6.2 36.6 31.7 3.4 2.8 13.8 5.52007 (143) 25.9 [18.9 - 33.9] 9.8 34.3 30.1 3.5 18.2 4.22008 (181) 20.4 [14.8 - 27.1] 7.2 45.9 25.4 1.1 0.6 4.4 12.2 3.32009 (176) 18.2 [12.8 - 24.7] 5.1 46.6 30.1 0.6 4.0 5.7 7.4 0.62010 (148) 13.5 [8.5 - 20.1] 14.9 49.3 21.0 1.4 4.7 6.1 2.72011 (210) 18.1 [13.1 - 24.0] 3.8 44.8 32.4 1.0 3.8 11.0 3.32012 (193) 31.1 [24.6 - 38.1] 7.8 30.6 29.0 1.6 7.3 20.2 3.1 0.5
Nalidixic acid 2004 (196) 16.3 [11.4 - 22.3] 47.4 34.7 1.5 3.6 12.82005 (151) 29.1 [22.0 - 37.1] 44.4 26.5 5.3 23.82006 (145) 20.7 [14.4 - 28.2] 51.0 24.8 3.4 4.8 15.92007 (143) 25.9 [18.9 - 33.9] 50.3 22.4 1.4 6.3 19.62008 (181) 20.4 [14.8 - 27.1] 47.5 31.5 0.55 5.5 14.92009 (176) 18.2 [12.8 - 24.7] 40.3 37.5 4.0 5.1 13.12010 (148) 14.2 [9.0 - 20.9] 56.8 29.1 0.7 8.8 4.72011 (210) 18.1 [13.1 - 24.0] 25.7 53.8 2.4 1.0 9.5 7.62012 (193) 31.1 [24.6 - 38.1] 19.7 48.7 0.5 15.5 15.5
TetracyclinesDoxycycline 2002 (90) 44.4 [34.0 - 55.3] 4.4 32.2 12.2 4.4 2.2 2.2 7.8 26.7 7.8
2003 (142) 53.5 [45.0 - 61.9] 3.5 30.3 7.7 2.1 2.8 2.1 0.7 5.6 14.8 23.9 6.4Tetracycline 2004 (196) 46.9 [39.8 - 54.2] 6.6 21.4 9.7 9.7 5.6 0.5 1.0 2.6 42.9
2005 (151) 44.4 [36.3 - 52.7] 2.6 22.5 11.3 13.9 5.3 2.0 1.3 4.6 36.42006 (145) 46.9 [38.6 - 55.4] 2.8 19.3 18.6 6.9 5.5 3.4 43.42007 (143) 39.9 [31.8 - 48.4] 0.7 0.7 32.9 18.2 6.3 1.4 3.5 36.42008 (181) 48.1 [40.6 - 55.6] 0.6 24.9 21.5 3.3 1.7 1.1 0.6 2.8 43.62009 (176) 38.6 [31.4 - 46.3] 2.3 19.3 23.3 9.7 6.8 0.6 2.3 35.82010 (148) 40.5 [32.6 - 48.9] 2.0 30.4 14.9 8.1 4.1 0.7 0.7 2.7 36.52011 (210) 49.0 [42.1 - 56.0] 1.4 27.6 10.0 4.8 5.2 1.0 1.0 0.5 1.4 10.0 37.12012 (193) 49.0 [42.1 - 56.0] 2.1 30.6 5.7 10.4 2.6 0.5 0.5 0.5 1.6 2.6 43.0
Distribution (%) of MICs (µg/ml)3Table 19.2 MIC Distribution among Campylobacter coli from Retail Chicken, 2002-2012
1 Percent of isolates that are resistant. Discrepancies between %R and sums of distribution are due to rounding. 2 95% confidence intervals for percent resistant (%R) were calculated using the Clopper-Pearson exact method. 3 Unshaded areas indicate dilution ranges of the Sensititre plates. Breakpoints for susceptibility are indicated by single black bars and resistance double red vertical bars. Numbers in shaded area indicate isolates with MICs greater than the highest concentration on the Sensititre plate. Numbers in the lowest tested concentrations represent isolates with MICs equal to or less than the lowest tested concentration.
46
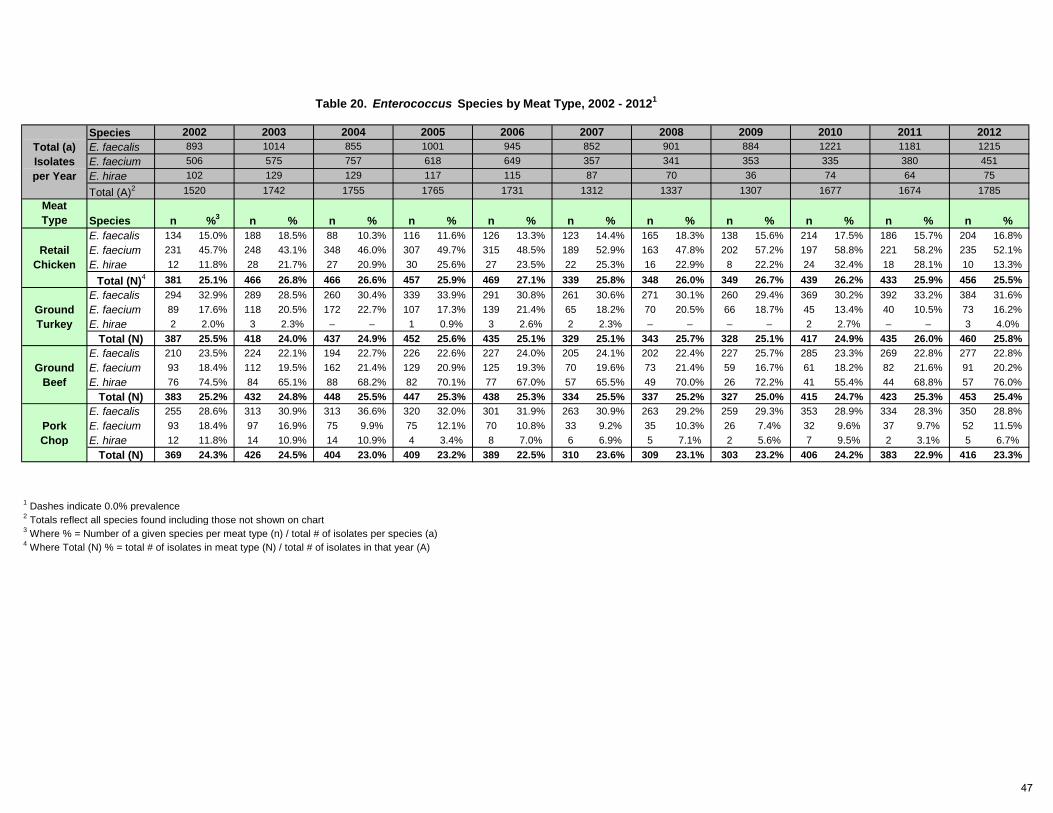
SpeciesTotal (a) E. faecalisIsolates E. faeciumper Year E. hirae
Total (A)2
MeatType
E. faecalis 134 15.0% 188 18.5% 88 10.3% 116 11.6% 126 13.3% 123 14.4% 165 18.3% 138 15.6% 214 17.5% 186 15.7% 204 16.8%Retail E. faecium 231 45.7% 248 43.1% 348 46.0% 307 49.7% 315 48.5% 189 52.9% 163 47.8% 202 57.2% 197 58.8% 221 58.2% 235 52.1%
Chicken E. hirae 12 11.8% 28 21.7% 27 20.9% 30 25.6% 27 23.5% 22 25.3% 16 22.9% 8 22.2% 24 32.4% 18 28.1% 10 13.3%
Total (N)4 381 25.1% 466 26.8% 466 26.6% 457 25.9% 469 27.1% 339 25.8% 348 26.0% 349 26.7% 439 26.2% 433 25.9% 456 25.5%E. faecalis 294 32.9% 289 28.5% 260 30.4% 339 33.9% 291 30.8% 261 30.6% 271 30.1% 260 29.4% 369 30.2% 392 33.2% 384 31.6%
Ground E. faecium 89 17.6% 118 20.5% 172 22.7% 107 17.3% 139 21.4% 65 18.2% 70 20.5% 66 18.7% 45 13.4% 40 10.5% 73 16.2%Turkey E. hirae 2 2.0% 3 2.3% – – 1 0.9% 3 2.6% 2 2.3% – – – – 2 2.7% – – 3 4.0%
Total (N) 387 25.5% 418 24.0% 437 24.9% 452 25.6% 435 25.1% 329 25.1% 343 25.7% 328 25.1% 417 24.9% 435 26.0% 460 25.8%E. faecalis 210 23.5% 224 22.1% 194 22.7% 226 22.6% 227 24.0% 205 24.1% 202 22.4% 227 25.7% 285 23.3% 269 22.8% 277 22.8%
Ground E. faecium 93 18.4% 112 19.5% 162 21.4% 129 20.9% 125 19.3% 70 19.6% 73 21.4% 59 16.7% 61 18.2% 82 21.6% 91 20.2%Beef E. hirae 76 74.5% 84 65.1% 88 68.2% 82 70.1% 77 67.0% 57 65.5% 49 70.0% 26 72.2% 41 55.4% 44 68.8% 57 76.0%
Total (N) 383 25.2% 432 24.8% 448 25.5% 447 25.3% 438 25.3% 334 25.5% 337 25.2% 327 25.0% 415 24.7% 423 25.3% 453 25.4%E. faecalis 255 28.6% 313 30.9% 313 36.6% 320 32.0% 301 31.9% 263 30.9% 263 29.2% 259 29.3% 353 28.9% 334 28.3% 350 28.8%
Pork E. faecium 93 18.4% 97 16.9% 75 9.9% 75 12.1% 70 10.8% 33 9.2% 35 10.3% 26 7.4% 32 9.6% 37 9.7% 52 11.5%Chop E. hirae 12 11.8% 14 10.9% 14 10.9% 4 3.4% 8 7.0% 6 6.9% 5 7.1% 2 5.6% 7 9.5% 2 3.1% 5 6.7%
Total (N) 369 24.3% 426 24.5% 404 23.0% 409 23.2% 389 22.5% 310 23.6% 309 23.1% 303 23.2% 406 24.2% 383 22.9% 416 23.3%
1 Dashes indicate 0.0% prevalence2 Totals reflect all species found including those not shown on chart3 Where % = Number of a given species per meat type (n) / total # of isolates per species (a)4 Where Total (N) % = total # of isolates in meat type (N) / total # of isolates in that year (A)
n %
2012121545175
17851312 1307
Species n
2010122133574
1677
n % n %
1731
n %n % n %%3 n % n %
1520 1742 1755 1765
649575 757 618 357 353102 129 129 117 115 87 36506
852 8842002 2003 2004 2005 2006 2007893 1014 855 1001 945
n %
Table 20. Enterococcus Species by Meat Type, 2002 - 20121
2011118138064
16741337
n %
200890134170
2009
47
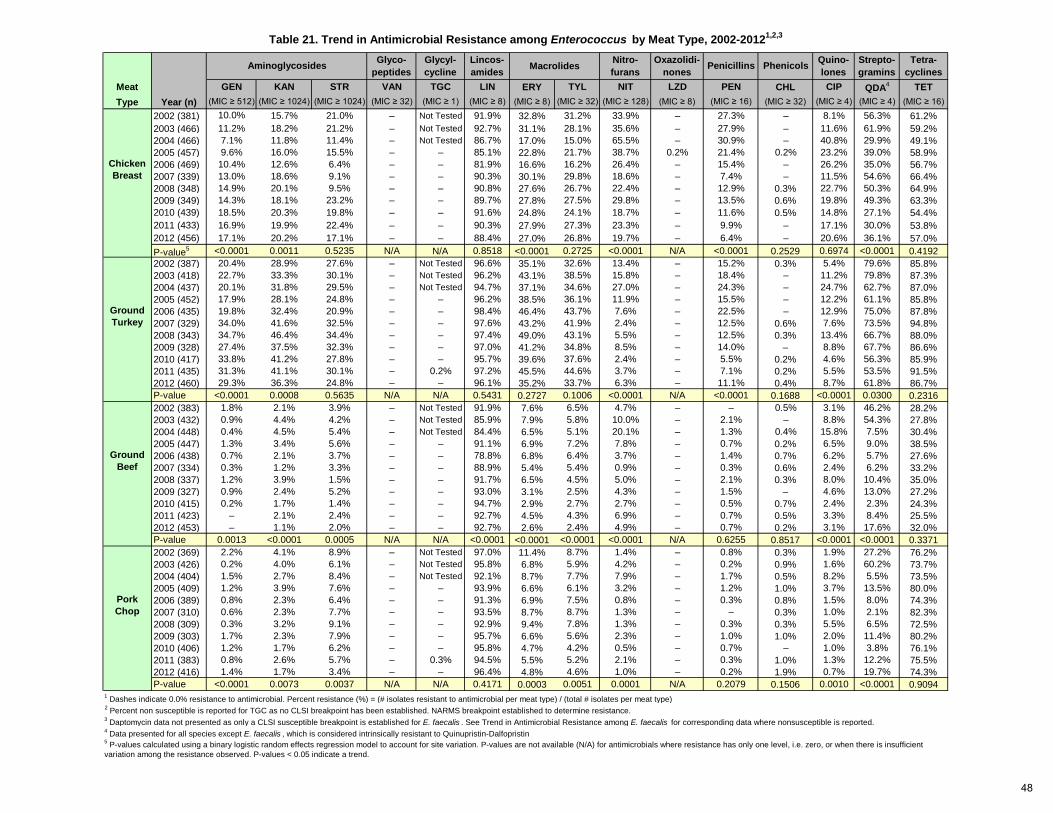
Meat GEN KAN STR VAN TGC LIN ERY TYL NIT LZD PEN CHL CIP QDA4 TETType Year (n) (MIC ≥ 512) (MIC ≥ 1024) (MIC ≥ 1024) (MIC ≥ 32) (MIC ≥ 1) (MIC ≥ 8) (MIC ≥ 8) (MIC ≥ 32) (MIC ≥ 128) (MIC ≥ 8) (MIC ≥ 16) (MIC ≥ 32) (MIC ≥ 4) (MIC ≥ 4) (MIC ≥ 16)
2002 (381) 10.0% 15.7% 21.0% – Not Tested 91.9% 32.8% 31.2% 33.9% – 27.3% – 8.1% 56.3% 61.2%2003 (466) 11.2% 18.2% 21.2% – Not Tested 92.7% 31.1% 28.1% 35.6% – 27.9% – 11.6% 61.9% 59.2%2004 (466) 7.1% 11.8% 11.4% – Not Tested 86.7% 17.0% 15.0% 65.5% – 30.9% – 40.8% 29.9% 49.1%2005 (457) 9.6% 16.0% 15.5% – – 85.1% 22.8% 21.7% 38.7% 0.2% 21.4% 0.2% 23.2% 39.0% 58.9%
Chicken 2006 (469) 10.4% 12.6% 6.4% – – 81.9% 16.6% 16.2% 26.4% – 15.4% – 26.2% 35.0% 56.7%Breast 2007 (339) 13.0% 18.6% 9.1% – – 90.3% 30.1% 29.8% 18.6% – 7.4% – 11.5% 54.6% 66.4%
2008 (348) 14.9% 20.1% 9.5% – – 90.8% 27.6% 26.7% 22.4% – 12.9% 0.3% 22.7% 50.3% 64.9%2009 (349) 14.3% 18.1% 23.2% – – 89.7% 27.8% 27.5% 29.8% – 13.5% 0.6% 19.8% 49.3% 63.3%2010 (439) 18.5% 20.3% 19.8% – – 91.6% 24.8% 24.1% 18.7% – 11.6% 0.5% 14.8% 27.1% 54.4%2011 (433) 16.9% 19.9% 22.4% – – 90.3% 27.9% 27.3% 23.3% – 9.9% – 17.1% 30.0% 53.8%2012 (456) 17.1% 20.2% 17.1% – – 88.4% 27.0% 26.8% 19.7% – 6.4% – 20.6% 36.1% 57.0%P-value5 <0.0001 0.0011 0.5235 N/A N/A 0.8518 <0.0001 0.2725 <0.0001 N/A <0.0001 0.2529 0.6974 <0.0001 0.41922002 (387) 20.4% 28.9% 27.6% – Not Tested 96.6% 35.1% 32.6% 13.4% – 15.2% 0.3% 5.4% 79.6% 85.8%2003 (418) 22.7% 33.3% 30.1% – Not Tested 96.2% 43.1% 38.5% 15.8% – 18.4% – 11.2% 79.8% 87.3%2004 (437) 20.1% 31.8% 29.5% – Not Tested 94.7% 37.1% 34.6% 27.0% – 24.3% – 24.7% 62.7% 87.0%2005 (452) 17.9% 28.1% 24.8% – – 96.2% 38.5% 36.1% 11.9% – 15.5% – 12.2% 61.1% 85.8%
Ground 2006 (435) 19.8% 32.4% 20.9% – – 98.4% 46.4% 43.7% 7.6% – 22.5% – 12.9% 75.0% 87.8%Turkey 2007 (329) 34.0% 41.6% 32.5% – – 97.6% 43.2% 41.9% 2.4% – 12.5% 0.6% 7.6% 73.5% 94.8%
2008 (343) 34.7% 46.4% 34.4% – – 97.4% 49.0% 43.1% 5.5% – 12.5% 0.3% 13.4% 66.7% 88.0%2009 (328) 27.4% 37.5% 32.3% – – 97.0% 41.2% 34.8% 8.5% – 14.0% – 8.8% 67.7% 86.6%2010 (417) 33.8% 41.2% 27.8% – – 95.7% 39.6% 37.6% 2.4% – 5.5% 0.2% 4.6% 56.3% 85.9%2011 (435) 31.3% 41.1% 30.1% – 0.2% 97.2% 45.5% 44.6% 3.7% – 7.1% 0.2% 5.5% 53.5% 91.5%2012 (460) 29.3% 36.3% 24.8% – – 96.1% 35.2% 33.7% 6.3% – 11.1% 0.4% 8.7% 61.8% 86.7%P-value <0.0001 0.0008 0.5635 N/A N/A 0.5431 0.2727 0.1006 <0.0001 N/A <0.0001 0.1688 <0.0001 0.0300 0.23162002 (383) 1.8% 2.1% 3.9% – Not Tested 91.9% 7.6% 6.5% 4.7% – – 0.5% 3.1% 46.2% 28.2%2003 (432) 0.9% 4.4% 4.2% – Not Tested 85.9% 7.9% 5.8% 10.0% – 2.1% – 8.8% 54.3% 27.8%2004 (448) 0.4% 4.5% 5.4% – Not Tested 84.4% 6.5% 5.1% 20.1% – 1.3% 0.4% 15.8% 7.5% 30.4%2005 (447) 1.3% 3.4% 5.6% – – 91.1% 6.9% 7.2% 7.8% – 0.7% 0.2% 6.5% 9.0% 38.5%
Ground 2006 (438) 0.7% 2.1% 3.7% – – 78.8% 6.8% 6.4% 3.7% – 1.4% 0.7% 6.2% 5.7% 27.6%Beef 2007 (334) 0.3% 1.2% 3.3% – – 88.9% 5.4% 5.4% 0.9% – 0.3% 0.6% 2.4% 6.2% 33.2%
2008 (337) 1.2% 3.9% 1.5% – – 91.7% 6.5% 4.5% 5.0% – 2.1% 0.3% 8.0% 10.4% 35.0%2009 (327) 0.9% 2.4% 5.2% – – 93.0% 3.1% 2.5% 4.3% – 1.5% – 4.6% 13.0% 27.2%2010 (415) 0.2% 1.7% 1.4% – – 94.7% 2.9% 2.7% 2.7% – 0.5% 0.7% 2.4% 2.3% 24.3%2011 (423) – 2.1% 2.4% – – 92.7% 4.5% 4.3% 6.9% – 0.7% 0.5% 3.3% 8.4% 25.5%2012 (453) – 1.1% 2.0% – – 92.7% 2.6% 2.4% 4.9% – 0.7% 0.2% 3.1% 17.6% 32.0%P-value 0.0013 <0.0001 0.0005 N/A N/A <0.0001 <0.0001 <0.0001 <0.0001 N/A 0.6255 0.8517 <0.0001 <0.0001 0.33712002 (369) 2.2% 4.1% 8.9% – Not Tested 97.0% 11.4% 8.7% 1.4% – 0.8% 0.3% 1.9% 27.2% 76.2%2003 (426) 0.2% 4.0% 6.1% – Not Tested 95.8% 6.8% 5.9% 4.2% – 0.2% 0.9% 1.6% 60.2% 73.7%2004 (404) 1.5% 2.7% 8.4% – Not Tested 92.1% 8.7% 7.7% 7.9% – 1.7% 0.5% 8.2% 5.5% 73.5%2005 (409) 1.2% 3.9% 7.6% – – 93.9% 6.6% 6.1% 3.2% – 1.2% 1.0% 3.7% 13.5% 80.0%
Pork 2006 (389) 0.8% 2.3% 6.4% – – 91.3% 6.9% 7.5% 0.8% – 0.3% 0.8% 1.5% 8.0% 74.3%Chop 2007 (310) 0.6% 2.3% 7.7% – – 93.5% 8.7% 8.7% 1.3% – – 0.3% 1.0% 2.1% 82.3%
2008 (309) 0.3% 3.2% 9.1% – – 92.9% 9.4% 7.8% 1.3% – 0.3% 0.3% 5.5% 6.5% 72.5%2009 (303) 1.7% 2.3% 7.9% – – 95.7% 6.6% 5.6% 2.3% – 1.0% 1.0% 2.0% 11.4% 80.2%2010 (406) 1.2% 1.7% 6.2% – – 95.8% 4.7% 4.2% 0.5% – 0.7% – 1.0% 3.8% 76.1%2011 (383) 0.8% 2.6% 5.7% – 0.3% 94.5% 5.5% 5.2% 2.1% – 0.3% 1.0% 1.3% 12.2% 75.5%2012 (416) 1.4% 1.7% 3.4% – – 96.4% 4.8% 4.6% 1.0% – 0.2% 1.9% 0.7% 19.7% 74.3%P-value <0.0001 0.0073 0.0037 N/A N/A 0.4171 0.0003 0.0051 0.0001 N/A 0.2079 0.1506 0.0010 <0.0001 0.9094
1 Dashes indicate 0.0% resistance to antimicrobial. Percent resistance (%) = (# isolates resistant to antimicrobial per meat type) / (total # isolates per meat type)2 Percent non susceptible is reported for TGC as no CLSI breakpoint has been established. NARMS breakpoint established to determine resistance.3 Daptomycin data not presented as only a CLSI susceptible breakpoint is established for E. faecalis . See Trend in Antimicrobial Resistance among E. faecalis for corresponding data where nonsusceptible is reported.4 Data presented for all species except E. faecalis , which is considered intrinsically resistant to Quinupristin-Dalfopristin5 P-values calculated using a binary logistic random effects regression model to account for site variation. P-values are not available (N/A) for antimicrobials where resistance has only one level, i.e. zero, or when there is insufficient variation among the resistance observed. P-values < 0.05 indicate a trend.
Table 21. Trend in Antimicrobial Resistance among Enterococcus by Meat Type, 2002-20121,2,3
Quino-lones
Strepto-gramins
Tetra-cyclinesPenicillins PhenicolsGlyco-
peptidesGlycyl-cycline
Lincos-amides
Nitro-furans
Oxazolidi-nonesAminoglycosides Macrolides
48
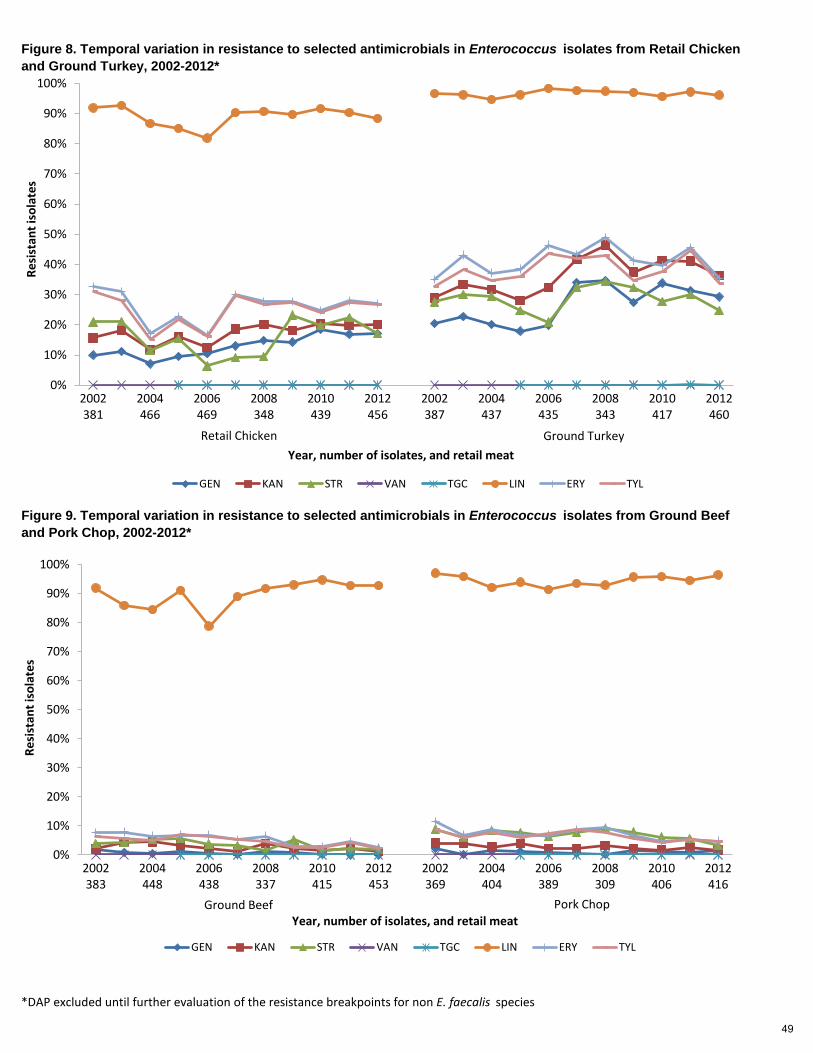
*DAP excluded until further evaluation of the resistance breakpoints for non E. faecalis species
Figure 8. Temporal variation in resistance to selected antimicrobials in Enterococcus isolates from Retail Chicken and Ground Turkey, 2002-2012*
Figure 9. Temporal variation in resistance to selected antimicrobials in Enterococcus isolates from Ground Beef and Pork Chop, 2002-2012*
0%
10%
20%
30%
40%
50%
60%
70%
80%
90%
100%
2002381
2004466
2006469
2008348
2010439
2012456
2002387
2004437
2006435
2008343
2010417
2012460
Resi
stan
t iso
late
s
Year, number of isolates, and retail meat
GEN KAN STR VAN TGC LIN ERY TYL
Retail Chicken Ground Turkey
0%
10%
20%
30%
40%
50%
60%
70%
80%
90%
100%
2002383
2004448
2006438
2008337
2010415
2012453
2002369
2004404
2006389
2008309
2010406
2012416
Resi
stan
t iso
late
s
Year, number of isolates, and retail meat
GEN KAN STR VAN TGC LIN ERY TYL
Ground Beef Pork Chop
49
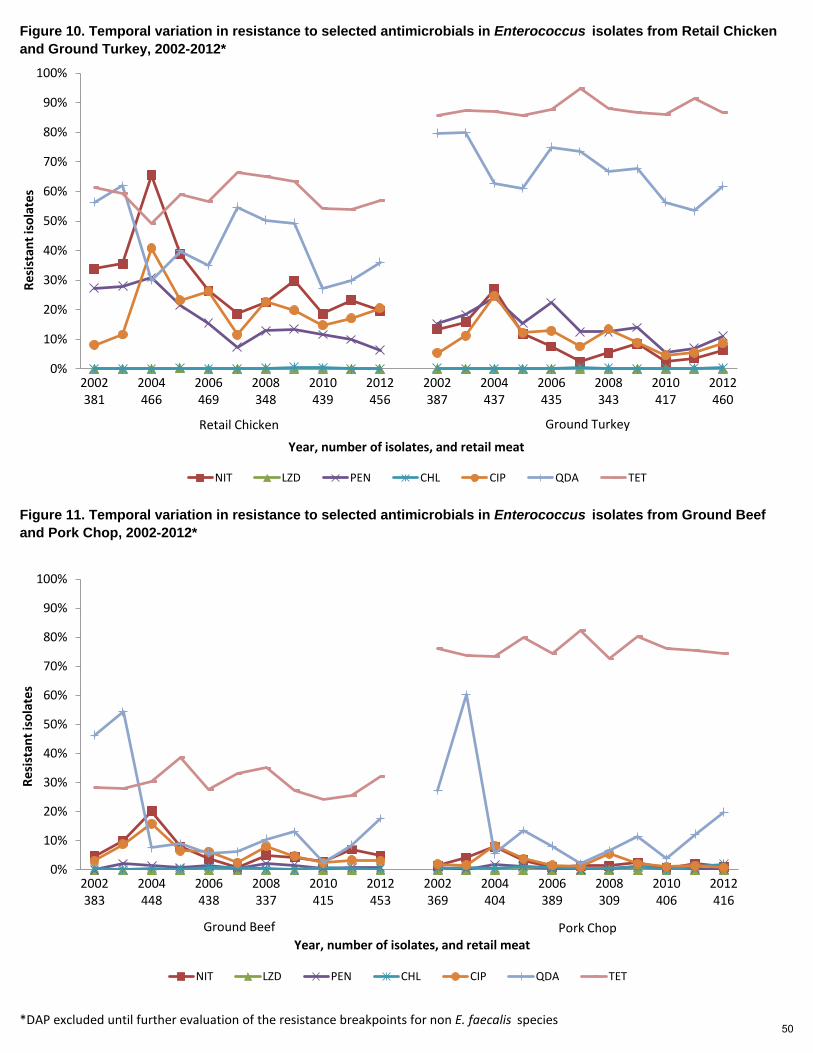
*DAP excluded until further evaluation of the resistance breakpoints for non E. faecalis species
Figure 10. Temporal variation in resistance to selected antimicrobials in Enterococcus isolates from Retail Chicken and Ground Turkey, 2002-2012*
Figure 11. Temporal variation in resistance to selected antimicrobials in Enterococcus isolates from Ground Beef and Pork Chop, 2002-2012*
0%
10%
20%
30%
40%
50%
60%
70%
80%
90%
100%
2002381
2004466
2006469
2008348
2010439
2012456
2002387
2004437
2006435
2008343
2010417
2012460
Resi
stan
t iso
late
s
Year, number of isolates, and retail meat
NIT LZD PEN CHL CIP QDA TET
Retail Chicken Ground Turkey
0%
10%
20%
30%
40%
50%
60%
70%
80%
90%
100%
2002383
2004448
2006438
2008337
2010415
2012453
2002369
2004404
2006389
2008309
2010406
2012416
Resi
stan
t iso
late
s
Year, number of isolates, and retail meat
NIT LZD PEN CHL CIP QDA TET
Ground Beef Pork Chop
50
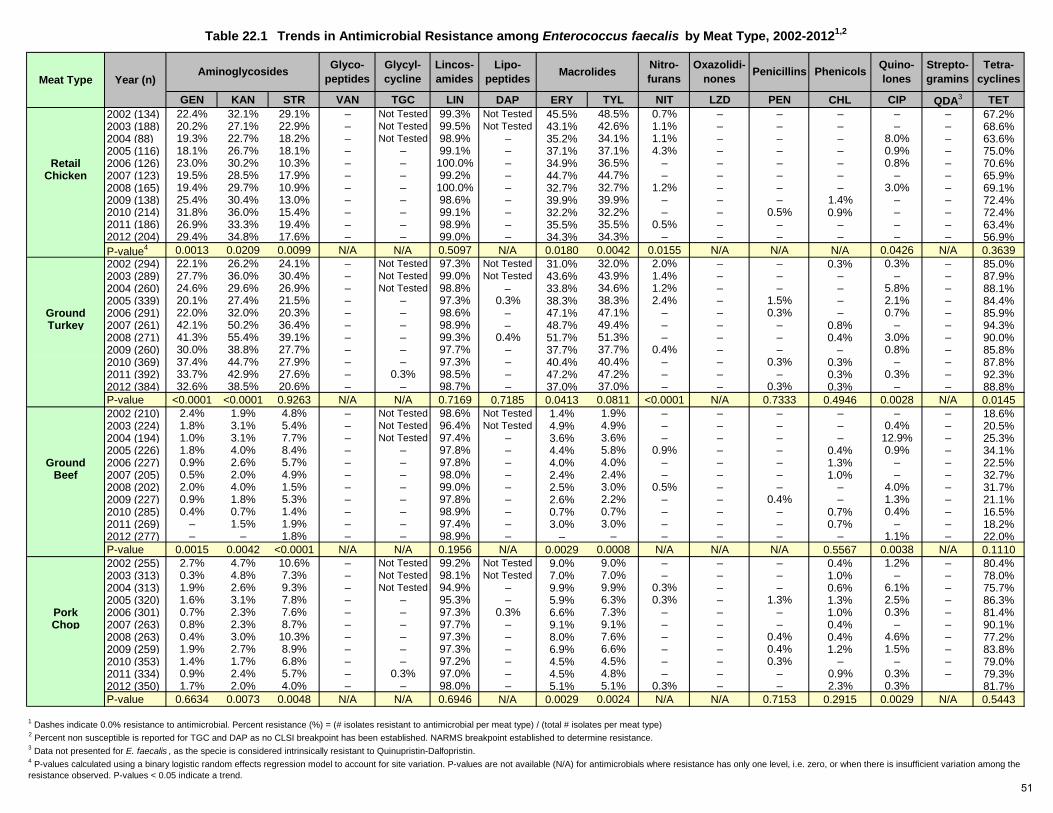
GEN KAN STR VAN TGC LIN DAP ERY TYL NIT LZD PEN CHL CIP QDA3 TET2002 (134) 22.4% 32.1% 29.1% – Not Tested 99.3% Not Tested 45.5% 48.5% 0.7% – – – – – 67.2%2003 (188) 20.2% 27.1% 22.9% – Not Tested 99.5% Not Tested 43.1% 42.6% 1.1% – – – – – 68.6%2004 (88) 19.3% 22.7% 18.2% – Not Tested 98.9% – 35.2% 34.1% 1.1% – – – 8.0% – 63.6%2005 (116) 18.1% 26.7% 18.1% – – 99.1% – 37.1% 37.1% 4.3% – – – 0.9% – 75.0%
Retail 2006 (126) 23.0% 30.2% 10.3% – – 100.0% – 34.9% 36.5% – – – – 0.8% – 70.6%Chicken 2007 (123) 19.5% 28.5% 17.9% – – 99.2% – 44.7% 44.7% – – – – – – 65.9%
2008 (165) 19.4% 29.7% 10.9% – – 100.0% – 32.7% 32.7% 1.2% – – – 3.0% – 69.1%2009 (138) 25.4% 30.4% 13.0% – – 98.6% – 39.9% 39.9% – – – 1.4% – – 72.4%2010 (214) 31.8% 36.0% 15.4% – – 99.1% – 32.2% 32.2% – – 0.5% 0.9% – – 72.4%2011 (186) 26.9% 33.3% 19.4% – – 98.9% – 35.5% 35.5% 0.5% – – – – – 63.4%2012 (204) 29.4% 34.8% 17.6% – – 99.0% – 34.3% 34.3% – – – – – – 56.9%P-value4 0.0013 0.0209 0.0099 N/A N/A 0.5097 N/A 0.0180 0.0042 0.0155 N/A N/A N/A 0.0426 N/A 0.36392002 (294) 22.1% 26.2% 24.1% – Not Tested 97.3% Not Tested 31.0% 32.0% 2.0% – – 0.3% 0.3% – 85.0%2003 (289) 27.7% 36.0% 30.4% – Not Tested 99.0% Not Tested 43.6% 43.9% 1.4% – – – – – 87.9%2004 (260) 24.6% 29.6% 26.9% – Not Tested 98.8% – 33.8% 34.6% 1.2% – – – 5.8% – 88.1%2005 (339) 20.1% 27.4% 21.5% – – 97.3% 0.3% 38.3% 38.3% 2.4% – 1.5% – 2.1% – 84.4%
Ground 2006 (291) 22.0% 32.0% 20.3% – – 98.6% – 47.1% 47.1% – – 0.3% – 0.7% – 85.9%Turkey 2007 (261) 42.1% 50.2% 36.4% – – 98.9% – 48.7% 49.4% – – – 0.8% – – 94.3%
2008 (271) 41.3% 55.4% 39.1% – – 99.3% 0.4% 51.7% 51.3% – – – 0.4% 3.0% – 90.0%2009 (260) 30.0% 38.8% 27.7% – – 97.7% – 37.7% 37.7% 0.4% – – – 0.8% – 85.8%2010 (369) 37.4% 44.7% 27.9% – – 97.3% – 40.4% 40.4% – – 0.3% 0.3% – – 87.8%2011 (392) 33.7% 42.9% 27.6% – 0.3% 98.5% – 47.2% 47.2% – – – 0.3% 0.3% – 92.3%2012 (384) 32.6% 38.5% 20.6% – – 98.7% – 37.0% 37.0% – – 0.3% 0.3% – – 88.8%P-value <0.0001 <0.0001 0.9263 N/A N/A 0.7169 0.7185 0.0413 0.0811 <0.0001 N/A 0.7333 0.4946 0.0028 N/A 0.01452002 (210) 2.4% 1.9% 4.8% – Not Tested 98.6% Not Tested 1.4% 1.9% – – – – – – 18.6%2003 (224) 1.8% 3.1% 5.4% – Not Tested 96.4% Not Tested 4.9% 4.9% – – – – 0.4% – 20.5%2004 (194) 1.0% 3.1% 7.7% – Not Tested 97.4% – 3.6% 3.6% – – – – 12.9% – 25.3%2005 (226) 1.8% 4.0% 8.4% – – 97.8% – 4.4% 5.8% 0.9% – – 0.4% 0.9% – 34.1%
Ground 2006 (227) 0.9% 2.6% 5.7% – – 97.8% – 4.0% 4.0% – – – 1.3% – – 22.5%Beef 2007 (205) 0.5% 2.0% 4.9% – – 98.0% – 2.4% 2.4% – – – 1.0% – – 32.7%
2008 (202) 2.0% 4.0% 1.5% – – 99.0% – 2.5% 3.0% 0.5% – – – 4.0% – 31.7%2009 (227) 0.9% 1.8% 5.3% – – 97.8% – 2.6% 2.2% – – 0.4% – 1.3% – 21.1%2010 (285) 0.4% 0.7% 1.4% – – 98.9% – 0.7% 0.7% – – – 0.7% 0.4% – 16.5%2011 (269) – 1.5% 1.9% – – 97.4% – 3.0% 3.0% – – – 0.7% – – 18.2%2012 (277) – – 1.8% – – 98.9% – – – – – – – 1.1% – 22.0%P-value 0.0015 0.0042 <0.0001 N/A N/A 0.1956 N/A 0.0029 0.0008 N/A N/A N/A 0.5567 0.0038 N/A 0.11102002 (255) 2.7% 4.7% 10.6% – Not Tested 99.2% Not Tested 9.0% 9.0% – – – 0.4% 1.2% – 80.4%2003 (313) 0.3% 4.8% 7.3% – Not Tested 98.1% Not Tested 7.0% 7.0% – – – 1.0% – – 78.0%2004 (313) 1.9% 2.6% 9.3% – Not Tested 94.9% – 9.9% 9.9% 0.3% – – 0.6% 6.1% – 75.7%2005 (320) 1.6% 3.1% 7.8% – – 95.3% – 5.9% 6.3% 0.3% – 1.3% 1.3% 2.5% – 86.3%
Pork 2006 (301) 0.7% 2.3% 7.6% – – 97.3% 0.3% 6.6% 7.3% – – – 1.0% 0.3% – 81.4%Chop 2007 (263) 0.8% 2.3% 8.7% – – 97.7% – 9.1% 9.1% – – – 0.4% – – 90.1%
2008 (263) 0.4% 3.0% 10.3% – – 97.3% – 8.0% 7.6% – – 0.4% 0.4% 4.6% – 77.2%2009 (259) 1.9% 2.7% 8.9% – – 97.3% – 6.9% 6.6% – – 0.4% 1.2% 1.5% – 83.8%2010 (353) 1.4% 1.7% 6.8% – – 97.2% – 4.5% 4.5% – – 0.3% – – – 79.0%2011 (334) 0.9% 2.4% 5.7% – 0.3% 97.0% – 4.5% 4.8% – – – 0.9% 0.3% – 79.3%2012 (350) 1.7% 2.0% 4.0% – – 98.0% – 5.1% 5.1% 0.3% – – 2.3% 0.3% 81.7%P-value 0.6634 0.0073 0.0048 N/A N/A 0.6946 N/A 0.0029 0.0024 N/A N/A 0.7153 0.2915 0.0029 N/A 0.5443
1 Dashes indicate 0.0% resistance to antimicrobial. Percent resistance (%) = (# isolates resistant to antimicrobial per meat type) / (total # isolates per meat type)2 Percent non susceptible is reported for TGC and DAP as no CLSI breakpoint has been established. NARMS breakpoint established to determine resistance.3 Data not presented for E. faecalis , as the specie is considered intrinsically resistant to Quinupristin-Dalfopristin.4 P-values calculated using a binary logistic random effects regression model to account for site variation. P-values are not available (N/A) for antimicrobials where resistance has only one level, i.e. zero, or when there is insufficient variation among the resistance observed. P-values < 0.05 indicate a trend.
Oxazolidi-nonesAminoglycosides Macrolides
Table 22.1 Trends in Antimicrobial Resistance among Enterococcus faecalis by Meat Type, 2002-20121,2
Quino-lones
Strepto-gramins
Tetra-cyclinesPenicillins Phenicols
Meat Type Year (n)Lipo-
peptidesNitro-furans
Glyco-peptides
Glycyl-cycline
Lincos-amides
51
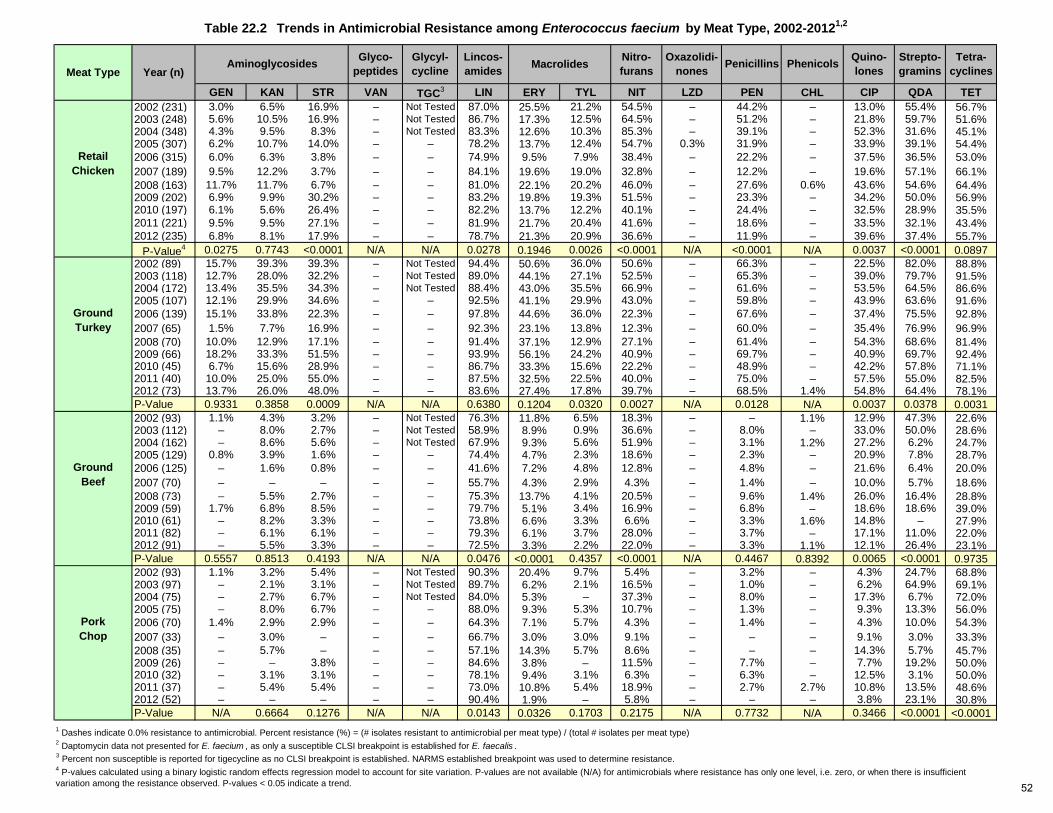
GEN KAN STR VAN TGC3 LIN ERY TYL NIT LZD PEN CHL CIP QDA TET2002 (231) 3.0% 6.5% 16.9% – Not Tested 87.0% 25.5% 21.2% 54.5% – 44.2% – 13.0% 55.4% 56.7%2003 (248) 5.6% 10.5% 16.9% – Not Tested 86.7% 17.3% 12.5% 64.5% – 51.2% – 21.8% 59.7% 51.6%2004 (348) 4.3% 9.5% 8.3% – Not Tested 83.3% 12.6% 10.3% 85.3% – 39.1% – 52.3% 31.6% 45.1%2005 (307) 6.2% 10.7% 14.0% – – 78.2% 13.7% 12.4% 54.7% 0.3% 31.9% – 33.9% 39.1% 54.4%
Retail 2006 (315) 6.0% 6.3% 3.8% – – 74.9% 9.5% 7.9% 38.4% – 22.2% – 37.5% 36.5% 53.0%Chicken 2007 (189) 9.5% 12.2% 3.7% – – 84.1% 19.6% 19.0% 32.8% – 12.2% – 19.6% 57.1% 66.1%
2008 (163) 11.7% 11.7% 6.7% – – 81.0% 22.1% 20.2% 46.0% – 27.6% 0.6% 43.6% 54.6% 64.4%2009 (202) 6.9% 9.9% 30.2% – – 83.2% 19.8% 19.3% 51.5% – 23.3% – 34.2% 50.0% 56.9%2010 (197) 6.1% 5.6% 26.4% – – 82.2% 13.7% 12.2% 40.1% – 24.4% – 32.5% 28.9% 35.5%2011 (221) 9.5% 9.5% 27.1% – – 81.9% 21.7% 20.4% 41.6% – 18.6% – 33.5% 32.1% 43.4%2012 (235) 6.8% 8.1% 17.9% – – 78.7% 21.3% 20.9% 36.6% – 11.9% – 39.6% 37.4% 55.7%
P-Value4 0.0275 0.7743 <0.0001 N/A N/A 0.0278 0.1946 0.0026 <0.0001 N/A <0.0001 N/A 0.0037 <0.0001 0.08972002 (89) 15.7% 39.3% 39.3% – Not Tested 94.4% 50.6% 36.0% 50.6% – 66.3% – 22.5% 82.0% 88.8%2003 (118) 12.7% 28.0% 32.2% – Not Tested 89.0% 44.1% 27.1% 52.5% – 65.3% – 39.0% 79.7% 91.5%2004 (172) 13.4% 35.5% 34.3% – Not Tested 88.4% 43.0% 35.5% 66.9% – 61.6% – 53.5% 64.5% 86.6%2005 (107) 12.1% 29.9% 34.6% – – 92.5% 41.1% 29.9% 43.0% – 59.8% – 43.9% 63.6% 91.6%
Ground 2006 (139) 15.1% 33.8% 22.3% – – 97.8% 44.6% 36.0% 22.3% – 67.6% – 37.4% 75.5% 92.8%Turkey 2007 (65) 1.5% 7.7% 16.9% – – 92.3% 23.1% 13.8% 12.3% – 60.0% – 35.4% 76.9% 96.9%
2008 (70) 10.0% 12.9% 17.1% – – 91.4% 37.1% 12.9% 27.1% – 61.4% – 54.3% 68.6% 81.4%2009 (66) 18.2% 33.3% 51.5% – – 93.9% 56.1% 24.2% 40.9% – 69.7% – 40.9% 69.7% 92.4%2010 (45) 6.7% 15.6% 28.9% – – 86.7% 33.3% 15.6% 22.2% – 48.9% – 42.2% 57.8% 71.1%2011 (40) 10.0% 25.0% 55.0% – – 87.5% 32.5% 22.5% 40.0% – 75.0% – 57.5% 55.0% 82.5%2012 (73) 13.7% 26.0% 48.0% – – 83.6% 27.4% 17.8% 39.7% – 68.5% 1.4% 54.8% 64.4% 78.1%P-Value 0.9331 0.3858 0.0009 N/A N/A 0.6380 0.1204 0.0320 0.0027 N/A 0.0128 N/A 0.0037 0.0378 0.00312002 (93) 1.1% 4.3% 3.2% – Not Tested 76.3% 11.8% 6.5% 18.3% – – 1.1% 12.9% 47.3% 22.6%2003 (112) – 8.0% 2.7% – Not Tested 58.9% 8.9% 0.9% 36.6% – 8.0% – 33.0% 50.0% 28.6%2004 (162) – 8.6% 5.6% – Not Tested 67.9% 9.3% 5.6% 51.9% – 3.1% 1.2% 27.2% 6.2% 24.7%2005 (129) 0.8% 3.9% 1.6% – – 74.4% 4.7% 2.3% 18.6% – 2.3% – 20.9% 7.8% 28.7%
Ground 2006 (125) – 1.6% 0.8% – – 41.6% 7.2% 4.8% 12.8% – 4.8% – 21.6% 6.4% 20.0%Beef 2007 (70) – – – – – 55.7% 4.3% 2.9% 4.3% – 1.4% – 10.0% 5.7% 18.6%
2008 (73) – 5.5% 2.7% – – 75.3% 13.7% 4.1% 20.5% – 9.6% 1.4% 26.0% 16.4% 28.8%2009 (59) 1.7% 6.8% 8.5% – – 79.7% 5.1% 3.4% 16.9% – 6.8% – 18.6% 18.6% 39.0%2010 (61) – 8.2% 3.3% – – 73.8% 6.6% 3.3% 6.6% – 3.3% 1.6% 14.8% – 27.9%2011 (82) – 6.1% 6.1% – – 79.3% 6.1% 3.7% 28.0% – 3.7% – 17.1% 11.0% 22.0%2012 (91) – 5.5% 3.3% – – 72.5% 3.3% 2.2% 22.0% – 3.3% 1.1% 12.1% 26.4% 23.1%P-Value 0.5557 0.8513 0.4193 N/A N/A 0.0476 <0.0001 0.4357 <0.0001 N/A 0.4467 0.8392 0.0065 <0.0001 0.97352002 (93) 1.1% 3.2% 5.4% – Not Tested 90.3% 20.4% 9.7% 5.4% – 3.2% – 4.3% 24.7% 68.8%2003 (97) – 2.1% 3.1% – Not Tested 89.7% 6.2% 2.1% 16.5% – 1.0% – 6.2% 64.9% 69.1%2004 (75) – 2.7% 6.7% – Not Tested 84.0% 5.3% – 37.3% – 8.0% – 17.3% 6.7% 72.0%2005 (75) – 8.0% 6.7% – – 88.0% 9.3% 5.3% 10.7% – 1.3% – 9.3% 13.3% 56.0%
Pork 2006 (70) 1.4% 2.9% 2.9% – – 64.3% 7.1% 5.7% 4.3% – 1.4% – 4.3% 10.0% 54.3%Chop 2007 (33) – 3.0% – – – 66.7% 3.0% 3.0% 9.1% – – – 9.1% 3.0% 33.3%
2008 (35) – 5.7% – – – 57.1% 14.3% 5.7% 8.6% – – – 14.3% 5.7% 45.7%2009 (26) – – 3.8% – – 84.6% 3.8% – 11.5% – 7.7% – 7.7% 19.2% 50.0%2010 (32) – 3.1% 3.1% – – 78.1% 9.4% 3.1% 6.3% – 6.3% – 12.5% 3.1% 50.0%2011 (37) – 5.4% 5.4% – – 73.0% 10.8% 5.4% 18.9% – 2.7% 2.7% 10.8% 13.5% 48.6%2012 (52) – – – – – 90.4% 1.9% – 5.8% – – – 3.8% 23.1% 30.8%P-Value N/A 0.6664 0.1276 N/A N/A 0.0143 0.0326 0.1703 0.2175 N/A 0.7732 N/A 0.3466 <0.0001 <0.0001
1 Dashes indicate 0.0% resistance to antimicrobial. Percent resistance (%) = (# isolates resistant to antimicrobial per meat type) / (total # isolates per meat type)2 Daptomycin data not presented for E. faecium , as only a susceptible CLSI breakpoint is established for E. faecalis . 3 Percent non susceptible is reported for tigecycline as no CLSI breakpoint is established. NARMS established breakpoint was used to determine resistance.
Table 22.2 Trends in Antimicrobial Resistance among Enterococcus faecium by Meat Type, 2002-20121,2
Nitro-furans
Oxazolidi-nones
Quino-lonesPenicillins Phenicols
Meat Type Year (n)Aminoglycosides MacrolidesGlyco-
peptidesGlycyl-cycline
Lincos-amides
4 P-values calculated using a binary logistic random effects regression model to account for site variation. P-values are not available (N/A) for antimicrobials where resistance has only one level, i.e. zero, or when there is insufficient variation among the resistance observed. P-values < 0.05 indicate a trend.
Strepto-gramins
Tetra-cyclines
52
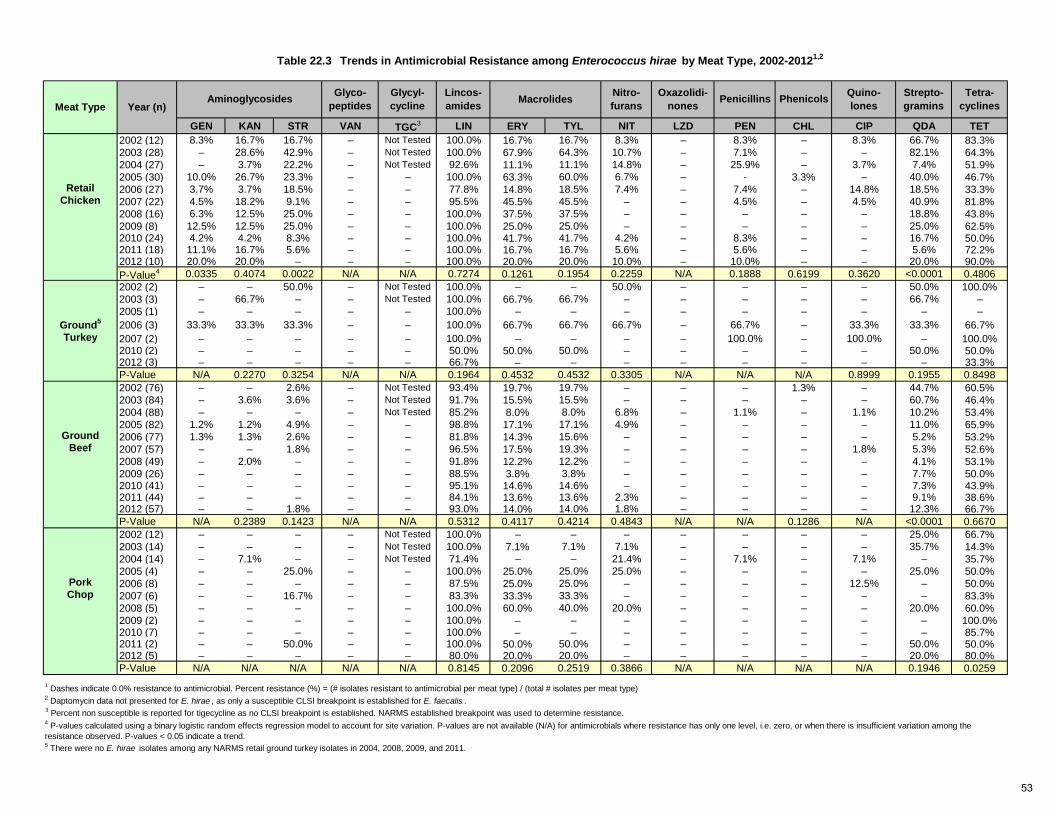
GEN KAN STR VAN TGC3 LIN ERY TYL NIT LZD PEN CHL CIP QDA TET2002 (12) 8.3% 16.7% 16.7% – Not Tested 100.0% 16.7% 16.7% 8.3% – 8.3% – 8.3% 66.7% 83.3%2003 (28) – 28.6% 42.9% – Not Tested 100.0% 67.9% 64.3% 10.7% – 7.1% – – 82.1% 64.3%2004 (27) – 3.7% 22.2% – Not Tested 92.6% 11.1% 11.1% 14.8% – 25.9% – 3.7% 7.4% 51.9%2005 (30) 10.0% 26.7% 23.3% – – 100.0% 63.3% 60.0% 6.7% – - 3.3% – 40.0% 46.7%
Retail 2006 (27) 3.7% 3.7% 18.5% – – 77.8% 14.8% 18.5% 7.4% – 7.4% – 14.8% 18.5% 33.3%Chicken 2007 (22) 4.5% 18.2% 9.1% – – 95.5% 45.5% 45.5% – – 4.5% – 4.5% 40.9% 81.8%
2008 (16) 6.3% 12.5% 25.0% – – 100.0% 37.5% 37.5% – – – – – 18.8% 43.8%2009 (8) 12.5% 12.5% 25.0% – – 100.0% 25.0% 25.0% – – – – – 25.0% 62.5%2010 (24) 4.2% 4.2% 8.3% – – 100.0% 41.7% 41.7% 4.2% – 8.3% – – 16.7% 50.0%2011 (18) 11.1% 16.7% 5.6% – – 100.0% 16.7% 16.7% 5.6% – 5.6% – – 5.6% 72.2%2012 (10) 20.0% 20.0% – – – 100.0% 20.0% 20.0% 10.0% – 10.0% – – 20.0% 90.0%P-Value4 0.0335 0.4074 0.0022 N/A N/A 0.7274 0.1261 0.1954 0.2259 N/A 0.1888 0.6199 0.3620 <0.0001 0.48062002 (2) – – 50.0% – Not Tested 100.0% – – 50.0% – – – – 50.0% 100.0%2003 (3) – 66.7% – – Not Tested 100.0% 66.7% 66.7% – – – – – 66.7% –2005 (1) – – – – – 100.0% – – – – – – – – –
Ground5 2006 (3) 33.3% 33.3% 33.3% – – 100.0% 66.7% 66.7% 66.7% – 66.7% – 33.3% 33.3% 66.7%Turkey 2007 (2) – – – – – 100.0% – – – – 100.0% – 100.0% – 100.0%
2010 (2) – – – – – 50.0% 50.0% 50.0% – – – – – 50.0% 50.0%2012 (3) – – – – – 66.7% – – – – – – – – 33.3%P-Value N/A 0.2270 0.3254 N/A N/A 0.1964 0.4532 0.4532 0.3305 N/A N/A N/A 0.8999 0.1955 0.84982002 (76) – – 2.6% – Not Tested 93.4% 19.7% 19.7% – – – 1.3% – 44.7% 60.5%2003 (84) – 3.6% 3.6% – Not Tested 91.7% 15.5% 15.5% – – – – – 60.7% 46.4%2004 (88) – – – – Not Tested 85.2% 8.0% 8.0% 6.8% – 1.1% – 1.1% 10.2% 53.4%2005 (82) 1.2% 1.2% 4.9% – – 98.8% 17.1% 17.1% 4.9% – – – – 11.0% 65.9%
Ground 2006 (77) 1.3% 1.3% 2.6% – – 81.8% 14.3% 15.6% – – – – – 5.2% 53.2%Beef 2007 (57) – – 1.8% – – 96.5% 17.5% 19.3% – – – – 1.8% 5.3% 52.6%
2008 (49) – 2.0% – – – 91.8% 12.2% 12.2% – – – – – 4.1% 53.1%2009 (26) – – – – – 88.5% 3.8% 3.8% – – – – – 7.7% 50.0%2010 (41) – – – – – 95.1% 14.6% 14.6% – – – – – 7.3% 43.9%2011 (44) – – – – – 84.1% 13.6% 13.6% 2.3% – – – – 9.1% 38.6%2012 (57) – – 1.8% – – 93.0% 14.0% 14.0% 1.8% – – – – 12.3% 66.7%P-Value N/A 0.2389 0.1423 N/A N/A 0.5312 0.4117 0.4214 0.4843 N/A N/A 0.1286 N/A <0.0001 0.66702002 (12) – – – – Not Tested 100.0% – – – – – – – 25.0% 66.7%2003 (14) – – – – Not Tested 100.0% 7.1% 7.1% 7.1% – – – – 35.7% 14.3%2004 (14) – 7.1% – – Not Tested 71.4% – – 21.4% – 7.1% – 7.1% – 35.7%2005 (4) – – 25.0% – – 100.0% 25.0% 25.0% 25.0% – – – – 25.0% 50.0%
Pork 2006 (8) – – – – – 87.5% 25.0% 25.0% – – – – 12.5% – 50.0%Chop 2007 (6) – – 16.7% – – 83.3% 33.3% 33.3% – – – – – – 83.3%
2008 (5) – – – – – 100.0% 60.0% 40.0% 20.0% – – – – 20.0% 60.0%2009 (2) – – – – – 100.0% – – – – – – – – 100.0%2010 (7) – – – – – 100.0% – – – – – – – – 85.7%2011 (2) – – 50.0% – – 100.0% 50.0% 50.0% – – – – – 50.0% 50.0%2012 (5) – – – – – 80.0% 20.0% 20.0% – – – – – 20.0% 80.0%P-Value N/A N/A N/A N/A N/A 0.8145 0.2096 0.2519 0.3866 N/A N/A N/A N/A 0.1946 0.0259
1 Dashes indicate 0.0% resistance to antimicrobial. Percent resistance (%) = (# isolates resistant to antimicrobial per meat type) / (total # isolates per meat type)2 Daptomycin data not presented for E. hirae , as only a susceptible CLSI breakpoint is established for E. faecalis .3 Percent non susceptible is reported for tigecycline as no CLSI breakpoint is established. NARMS established breakpoint was used to determine resistance.
5 There were no E. hirae isolates among any NARMS retail ground turkey isolates in 2004, 2008, 2009, and 2011.
4 P-values calculated using a binary logistic random effects regression model to account for site variation. P-values are not available (N/A) for antimicrobials where resistance has only one level, i.e. zero, or when there is insufficient variation among the resistance observed. P-values < 0.05 indicate a trend.
Lincos-amides
Strepto-gramins
Tetra-cyclines
Table 22.3 Trends in Antimicrobial Resistance among Enterococcus hirae by Meat Type, 2002-20121,2
Nitro-furans
Oxazolidi-nones
Quino-lonesPenicillins Phenicols
Meat Type Year (n)Aminoglycosides MacrolidesGlyco-
peptidesGlycyl-cycline
53
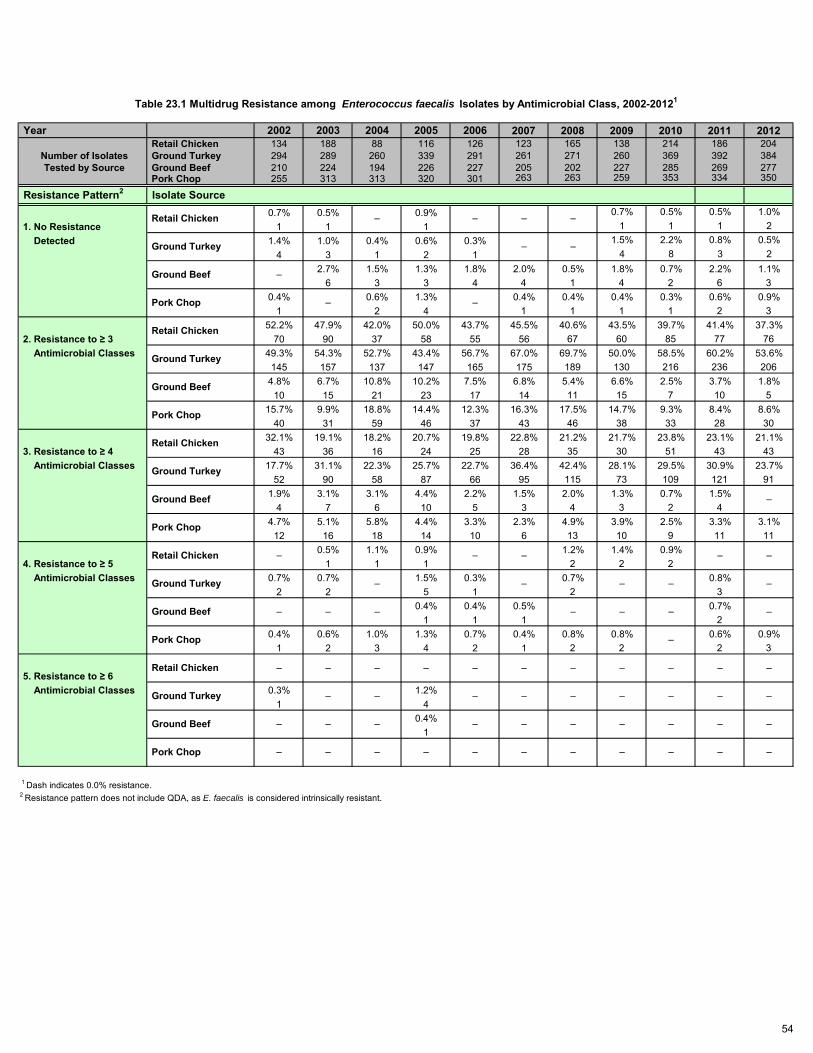
Year 2002 2003 2004 2005 2006 2007 2008 2009 2010 2011 2012 Retail Chicken 134 188 88 116 126 123 165 138 214 186 204
Number of Isolates Ground Turkey 294 289 260 339 291 261 271 260 369 392 384 Tested by Source Ground Beef 210 224 194 226 227 205 202 227 285 269 277
Pork Chop 255 313 313 320 301 263 263 259 353 334 350
Resistance Pattern2 Isolate Source0.7% 0.5% 0.9% 0.7% 0.5% 0.5% 1.0%
1. No Resistance 1 1 1 1 1 1 2 Detected 1.4% 1.0% 0.4% 0.6% 0.3% 1.5% 2.2% 0.8% 0.5%
4 3 1 2 1 4 8 3 22.7% 1.5% 1.3% 1.8% 2.0% 0.5% 1.8% 0.7% 2.2% 1.1%
6 3 3 4 4 1 4 2 6 30.4% 0.6% 1.3% 0.4% 0.4% 0.4% 0.3% 0.6% 0.9%
1 2 4 1 1 1 1 2 352.2% 47.9% 42.0% 50.0% 43.7% 45.5% 40.6% 43.5% 39.7% 41.4% 37.3%
2. Resistance to ≥ 3 70 90 37 58 55 56 67 60 85 77 76 Antimicrobial Classes 49.3% 54.3% 52.7% 43.4% 56.7% 67.0% 69.7% 50.0% 58.5% 60.2% 53.6%
145 157 137 147 165 175 189 130 216 236 2064.8% 6.7% 10.8% 10.2% 7.5% 6.8% 5.4% 6.6% 2.5% 3.7% 1.8%
10 15 21 23 17 14 11 15 7 10 515.7% 9.9% 18.8% 14.4% 12.3% 16.3% 17.5% 14.7% 9.3% 8.4% 8.6%
40 31 59 46 37 43 46 38 33 28 3032.1% 19.1% 18.2% 20.7% 19.8% 22.8% 21.2% 21.7% 23.8% 23.1% 21.1%
3. Resistance to ≥ 4 43 36 16 24 25 28 35 30 51 43 43 Antimicrobial Classes 17.7% 31.1% 22.3% 25.7% 22.7% 36.4% 42.4% 28.1% 29.5% 30.9% 23.7%
52 90 58 87 66 95 115 73 109 121 911.9% 3.1% 3.1% 4.4% 2.2% 1.5% 2.0% 1.3% 0.7% 1.5%
4 7 6 10 5 3 4 3 2 44.7% 5.1% 5.8% 4.4% 3.3% 2.3% 4.9% 3.9% 2.5% 3.3% 3.1%
12 16 18 14 10 6 13 10 9 11 110.5% 1.1% 0.9% 1.2% 1.4% 0.9%
4. Resistance to ≥ 5 1 1 1 2 2 2 Antimicrobial Classes 0.7% 0.7% 1.5% 0.3% 0.7% 0.8%
2 2 5 1 2 30.4% 0.4% 0.5% 0.7%
1 1 1 20.4% 0.6% 1.0% 1.3% 0.7% 0.4% 0.8% 0.8% 0.6% 0.9%
1 2 3 4 2 1 2 2 2 3
5. Resistance to ≥ 6 Antimicrobial Classes 0.3% 1.2%
1 40.4%
1
1 Dash indicates 0.0% resistance.2 Resistance pattern does not include QDA, as E. faecalis is considered intrinsically resistant.
–
–
–
–
–
––
–
–
–
–
–
–
–
–
–
–
–
– –
– – – – – – –
–
––
– – –
–
– – –
–
–
– –
–
–
– – – – –
–
– –
– – –
Ground Beef
Pork Chop
Retail Chicken
–
–
Pork Chop
Retail Chicken
Ground Turkey
Ground Beef
Pork Chop
Retail Chicken
Ground Turkey
Ground Beef
Ground Turkey
Ground Beef
–
– –
– –
Pork Chop
Table 23.1 Multidrug Resistance among Enterococcus faecalis Isolates by Antimicrobial Class, 2002-20121
–
–
–
–
Retail Chicken
Ground Turkey
Ground Beef
Pork Chop
Retail Chicken
Ground Turkey
– –
–
–
54
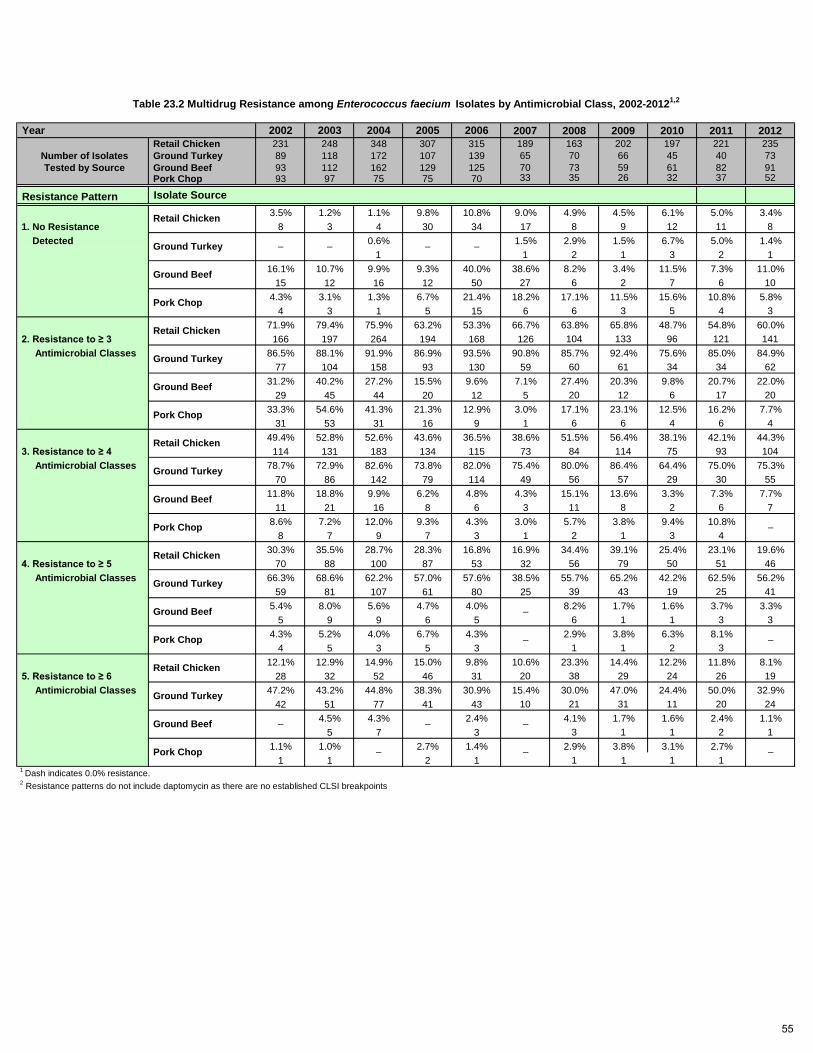
Year 2002 2003 2004 2005 2006 2007 2008 2009 2010 2011 2012 Retail Chicken 231 248 348 307 315 189 163 202 197 221 235
Number of Isolates Ground Turkey 89 118 172 107 139 65 70 66 45 40 73 Tested by Source Ground Beef 93 112 162 129 125 70 73 59 61 82 91
Pork Chop 93 97 75 75 70 33 35 26 32 37 52
Resistance Pattern Isolate Source3.5% 1.2% 1.1% 9.8% 10.8% 9.0% 4.9% 4.5% 6.1% 5.0% 3.4%
1. No Resistance 8 3 4 30 34 17 8 9 12 11 8 Detected 0.6% 1.5% 2.9% 1.5% 6.7% 5.0% 1.4%
1 1 2 1 3 2 116.1% 10.7% 9.9% 9.3% 40.0% 38.6% 8.2% 3.4% 11.5% 7.3% 11.0%
15 12 16 12 50 27 6 2 7 6 104.3% 3.1% 1.3% 6.7% 21.4% 18.2% 17.1% 11.5% 15.6% 10.8% 5.8%
4 3 1 5 15 6 6 3 5 4 371.9% 79.4% 75.9% 63.2% 53.3% 66.7% 63.8% 65.8% 48.7% 54.8% 60.0%
2. Resistance to ≥ 3 166 197 264 194 168 126 104 133 96 121 141 Antimicrobial Classes 86.5% 88.1% 91.9% 86.9% 93.5% 90.8% 85.7% 92.4% 75.6% 85.0% 84.9%
77 104 158 93 130 59 60 61 34 34 6231.2% 40.2% 27.2% 15.5% 9.6% 7.1% 27.4% 20.3% 9.8% 20.7% 22.0%
29 45 44 20 12 5 20 12 6 17 2033.3% 54.6% 41.3% 21.3% 12.9% 3.0% 17.1% 23.1% 12.5% 16.2% 7.7%
31 53 31 16 9 1 6 6 4 6 449.4% 52.8% 52.6% 43.6% 36.5% 38.6% 51.5% 56.4% 38.1% 42.1% 44.3%
3. Resistance to ≥ 4 114 131 183 134 115 73 84 114 75 93 104 Antimicrobial Classes 78.7% 72.9% 82.6% 73.8% 82.0% 75.4% 80.0% 86.4% 64.4% 75.0% 75.3%
70 86 142 79 114 49 56 57 29 30 5511.8% 18.8% 9.9% 6.2% 4.8% 4.3% 15.1% 13.6% 3.3% 7.3% 7.7%
11 21 16 8 6 3 11 8 2 6 78.6% 7.2% 12.0% 9.3% 4.3% 3.0% 5.7% 3.8% 9.4% 10.8%
8 7 9 7 3 1 2 1 3 430.3% 35.5% 28.7% 28.3% 16.8% 16.9% 34.4% 39.1% 25.4% 23.1% 19.6%
4. Resistance to ≥ 5 70 88 100 87 53 32 56 79 50 51 46 Antimicrobial Classes 66.3% 68.6% 62.2% 57.0% 57.6% 38.5% 55.7% 65.2% 42.2% 62.5% 56.2%
59 81 107 61 80 25 39 43 19 25 415.4% 8.0% 5.6% 4.7% 4.0% 8.2% 1.7% 1.6% 3.7% 3.3%
5 9 9 6 5 6 1 1 3 34.3% 5.2% 4.0% 6.7% 4.3% 2.9% 3.8% 6.3% 8.1%
4 5 3 5 3 1 1 2 312.1% 12.9% 14.9% 15.0% 9.8% 10.6% 23.3% 14.4% 12.2% 11.8% 8.1%
5. Resistance to ≥ 6 28 32 52 46 31 20 38 29 24 26 19 Antimicrobial Classes 47.2% 43.2% 44.8% 38.3% 30.9% 15.4% 30.0% 47.0% 24.4% 50.0% 32.9%
42 51 77 41 43 10 21 31 11 20 244.5% 4.3% 2.4% 4.1% 1.7% 1.6% 2.4% 1.1%
5 7 3 3 1 1 2 11.1% 1.0% 2.7% 1.4% 2.9% 3.8% 3.1% 2.7%
1 1 2 1 1 1 1 1 1 Dash indicates 0.0% resistance. 2 Resistance patterns do not include daptomycin as there are no established CLSI breakpoints
–
–
–
–
–––
– –
–
Pork Chop
– – – –
Pork Chop
Pork Chop
Retail Chicken
Ground Turkey
Ground Beef
Table 23.2 Multidrug Resistance among Enterococcus faecium Isolates by Antimicrobial Class, 2002-20121,2
Pork Chop
Retail Chicken
Ground Turkey
Ground Beef
Pork Chop
Retail Chicken
Ground Turkey
Ground Beef
Retail Chicken
Ground Turkey
Ground Beef
Retail Chicken
Ground Turkey
Ground Beef
55
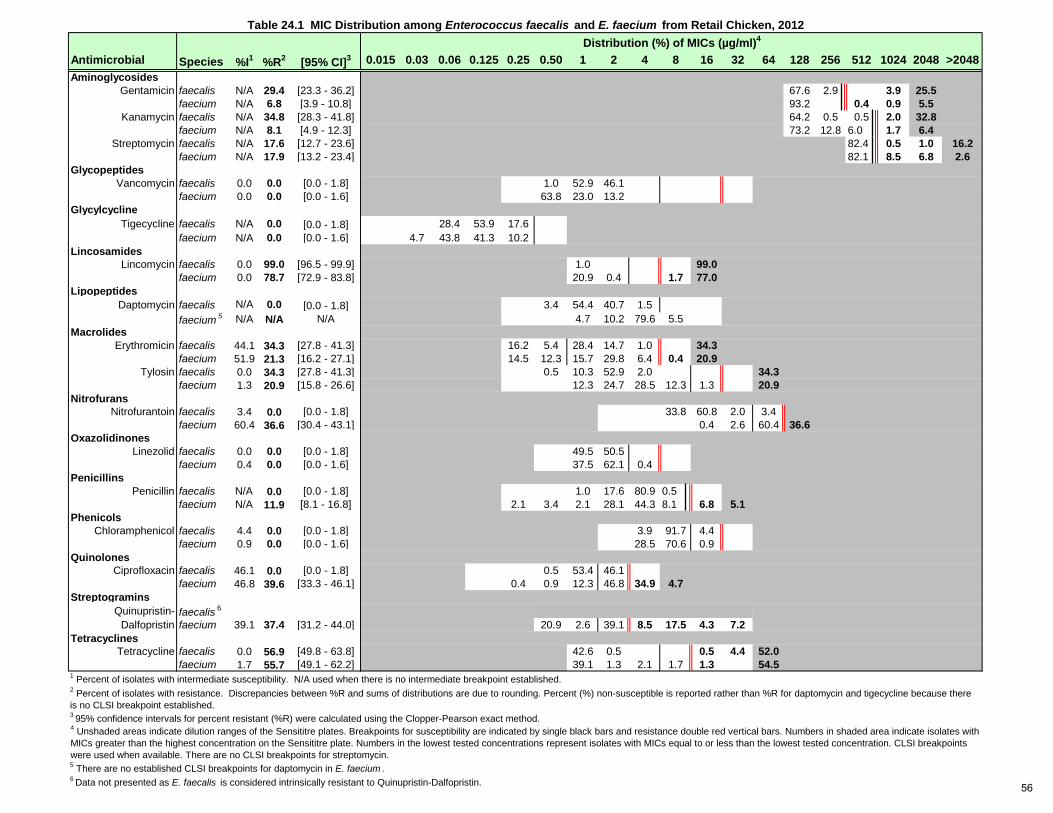
Antimicrobial Species %I1 %R2 [95% CI]3 0.015 0.03 0.06 0.125 0.25 0.50 1 2 4 8 16 32 64 128 256 512 1024 2048 >2048Aminoglycosides
Gentamicin faecalis N/A 29.4 [23.3 - 36.2] 67.6 2.9 3.9 25.5faecium N/A 6.8 [3.9 - 10.8] 93.2 0.4 0.9 5.5
Kanamycin faecalis N/A 34.8 [28.3 - 41.8] 64.2 0.5 0.5 2.0 32.8faecium N/A 8.1 [4.9 - 12.3] 73.2 12.8 6.0 1.7 6.4
Streptomycin faecalis N/A 17.6 [12.7 - 23.6] 82.4 0.5 1.0 16.2faecium N/A 17.9 [13.2 - 23.4] 82.1 8.5 6.8 2.6
GlycopeptidesVancomycin faecalis 0.0 0.0 [0.0 - 1.8] 1.0 52.9 46.1
faecium 0.0 0.0 [0.0 - 1.6] 63.8 23.0 13.2Glycylcycline
Tigecycline faecalis N/A 0.0 [0.0 - 1.8] 28.4 53.9 17.6faecium N/A 0.0 [0.0 - 1.6] 4.7 43.8 41.3 10.2
LincosamidesLincomycin faecalis 0.0 99.0 [96.5 - 99.9] 1.0 99.0
faecium 0.0 78.7 [72.9 - 83.8] 20.9 0.4 1.7 77.0Lipopeptides
Daptomycin faecalis N/A 0.0 [0.0 - 1.8] 3.4 54.4 40.7 1.5faecium 5 N/A N/A N/A 4.7 10.2 79.6 5.5
MacrolidesErythromicin faecalis 44.1 34.3 [27.8 - 41.3] 16.2 5.4 28.4 14.7 1.0 34.3
faecium 51.9 21.3 [16.2 - 27.1] 14.5 12.3 15.7 29.8 6.4 0.4 20.9Tylosin faecalis 0.0 34.3 [27.8 - 41.3] 0.5 10.3 52.9 2.0 34.3
faecium 1.3 20.9 [15.8 - 26.6] 12.3 24.7 28.5 12.3 1.3 20.9Nitrofurans
Nitrofurantoin faecalis 3.4 0.0 [0.0 - 1.8] 33.8 60.8 2.0 3.4faecium 60.4 36.6 [30.4 - 43.1] 0.4 2.6 60.4 36.6
OxazolidinonesLinezolid faecalis 0.0 0.0 [0.0 - 1.8] 49.5 50.5
faecium 0.4 0.0 [0.0 - 1.6] 37.5 62.1 0.4Penicillins
Penicillin faecalis N/A 0.0 [0.0 - 1.8] 1.0 17.6 80.9 0.5faecium N/A 11.9 [8.1 - 16.8] 2.1 3.4 2.1 28.1 44.3 8.1 6.8 5.1
PhenicolsChloramphenicol faecalis 4.4 0.0 [0.0 - 1.8] 3.9 91.7 4.4
faecium 0.9 0.0 [0.0 - 1.6] 28.5 70.6 0.9Quinolones
Ciprofloxacin faecalis 46.1 0.0 [0.0 - 1.8] 0.5 53.4 46.1faecium 46.8 39.6 [33.3 - 46.1] 0.4 0.9 12.3 46.8 34.9 4.7
StreptograminsQuinupristin- faecalis 6
Dalfopristin faecium 39.1 37.4 [31.2 - 44.0] 20.9 2.6 39.1 8.5 17.5 4.3 7.2Tetracyclines
Tetracycline faecalis 0.0 56.9 [49.8 - 63.8] 42.6 0.5 0.5 4.4 52.0faecium 1.7 55.7 [49.1 - 62.2] 39.1 1.3 2.1 1.7 1.3 54.5
5 There are no established CLSI breakpoints for daptomycin in E. faecium .6 Data not presented as E. faecalis is considered intrinsically resistant to Quinupristin-Dalfopristin.
Table 24.1 MIC Distribution among Enterococcus faecalis and E. faecium from Retail Chicken, 2012
4 Unshaded areas indicate dilution ranges of the Sensititre plates. Breakpoints for susceptibility are indicated by single black bars and resistance double red vertical bars. Numbers in shaded area indicate isolates with MICs greater than the highest concentration on the Sensititre plate. Numbers in the lowest tested concentrations represent isolates with MICs equal to or less than the lowest tested concentration. CLSI breakpoints were used when available. There are no CLSI breakpoints for streptomycin.
1 Percent of isolates with intermediate susceptibility. N/A used when there is no intermediate breakpoint established. 2 Percent of isolates with resistance. Discrepancies between %R and sums of distributions are due to rounding. Percent (%) non-susceptible is reported rather than %R for daptomycin and tigecycline because there is no CLSI breakpoint established.3 95% confidence intervals for percent resistant (%R) were calculated using the Clopper-Pearson exact method.
Distribution (%) of MICs (µg/ml)4
56
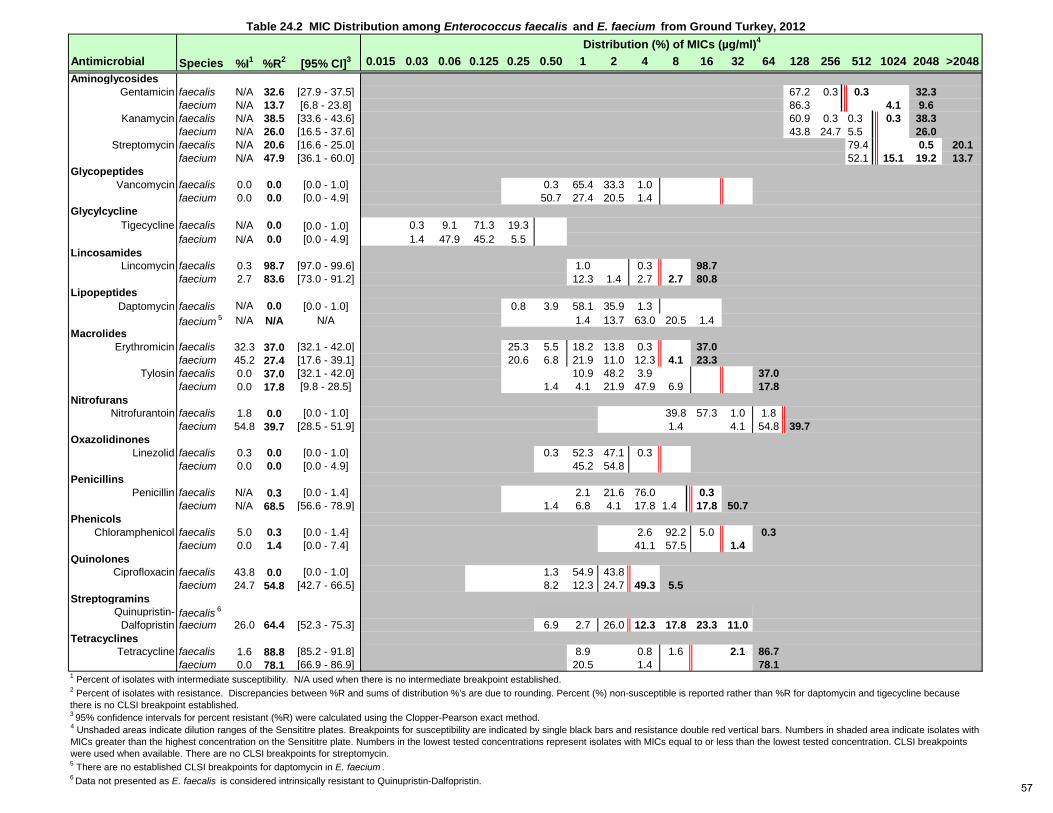
Antimicrobial Species %I1 %R2 [95% CI]3 0.015 0.03 0.06 0.125 0.25 0.50 1 2 4 8 16 32 64 128 256 512 1024 2048 >2048Aminoglycosides
Gentamicin faecalis N/A 32.6 [27.9 - 37.5] 67.2 0.3 0.3 32.3faecium N/A 13.7 [6.8 - 23.8] 86.3 4.1 9.6
Kanamycin faecalis N/A 38.5 [33.6 - 43.6] 60.9 0.3 0.3 0.3 38.3faecium N/A 26.0 [16.5 - 37.6] 43.8 24.7 5.5 26.0
Streptomycin faecalis N/A 20.6 [16.6 - 25.0] 79.4 0.5 20.1faecium N/A 47.9 [36.1 - 60.0] 52.1 15.1 19.2 13.7
GlycopeptidesVancomycin faecalis 0.0 0.0 [0.0 - 1.0] 0.3 65.4 33.3 1.0
faecium 0.0 0.0 [0.0 - 4.9] 50.7 27.4 20.5 1.4Glycylcycline
Tigecycline faecalis N/A 0.0 [0.0 - 1.0] 0.3 9.1 71.3 19.3faecium N/A 0.0 [0.0 - 4.9] 1.4 47.9 45.2 5.5
LincosamidesLincomycin faecalis 0.3 98.7 [97.0 - 99.6] 1.0 0.3 98.7
faecium 2.7 83.6 [73.0 - 91.2] 12.3 1.4 2.7 2.7 80.8Lipopeptides
Daptomycin faecalis N/A 0.0 [0.0 - 1.0] 0.8 3.9 58.1 35.9 1.3faecium 5 N/A N/A N/A 1.4 13.7 63.0 20.5 1.4
MacrolidesErythromicin faecalis 32.3 37.0 [32.1 - 42.0] 25.3 5.5 18.2 13.8 0.3 37.0
faecium 45.2 27.4 [17.6 - 39.1] 20.6 6.8 21.9 11.0 12.3 4.1 23.3Tylosin faecalis 0.0 37.0 [32.1 - 42.0] 10.9 48.2 3.9 37.0
faecium 0.0 17.8 [9.8 - 28.5] 1.4 4.1 21.9 47.9 6.9 17.8Nitrofurans
Nitrofurantoin faecalis 1.8 0.0 [0.0 - 1.0] 39.8 57.3 1.0 1.8faecium 54.8 39.7 [28.5 - 51.9] 1.4 4.1 54.8 39.7
OxazolidinonesLinezolid faecalis 0.3 0.0 [0.0 - 1.0] 0.3 52.3 47.1 0.3
faecium 0.0 0.0 [0.0 - 4.9] 45.2 54.8Penicillins
Penicillin faecalis N/A 0.3 [0.0 - 1.4] 2.1 21.6 76.0 0.3faecium N/A 68.5 [56.6 - 78.9] 1.4 6.8 4.1 17.8 1.4 17.8 50.7
PhenicolsChloramphenicol faecalis 5.0 0.3 [0.0 - 1.4] 2.6 92.2 5.0 0.3
faecium 0.0 1.4 [0.0 - 7.4] 41.1 57.5 1.4Quinolones
Ciprofloxacin faecalis 43.8 0.0 [0.0 - 1.0] 1.3 54.9 43.8faecium 24.7 54.8 [42.7 - 66.5] 8.2 12.3 24.7 49.3 5.5
StreptograminsQuinupristin- faecalis 6
Dalfopristin faecium 26.0 64.4 [52.3 - 75.3] 6.9 2.7 26.0 12.3 17.8 23.3 11.0Tetracyclines
Tetracycline faecalis 1.6 88.8 [85.2 - 91.8] 8.9 0.8 1.6 2.1 86.7faecium 0.0 78.1 [66.9 - 86.9] 20.5 1.4 78.1
5 There are no established CLSI breakpoints for daptomycin in E. faecium .6 Data not presented as E. faecalis is considered intrinsically resistant to Quinupristin-Dalfopristin.
Table 24.2 MIC Distribution among Enterococcus faecalis and E. faecium from Ground Turkey, 2012
4 Unshaded areas indicate dilution ranges of the Sensititre plates. Breakpoints for susceptibility are indicated by single black bars and resistance double red vertical bars. Numbers in shaded area indicate isolates with MICs greater than the highest concentration on the Sensititre plate. Numbers in the lowest tested concentrations represent isolates with MICs equal to or less than the lowest tested concentration. CLSI breakpoints were used when available. There are no CLSI breakpoints for streptomycin.
1 Percent of isolates with intermediate susceptibility. N/A used when there is no intermediate breakpoint established. 2 Percent of isolates with resistance. Discrepancies between %R and sums of distribution %'s are due to rounding. Percent (%) non-susceptible is reported rather than %R for daptomycin and tigecycline because there is no CLSI breakpoint established.3 95% confidence intervals for percent resistant (%R) were calculated using the Clopper-Pearson exact method.
Distribution (%) of MICs (µg/ml)4
57

Antimicrobial Species %I1 %R2 [95% CI]3 0.015 0.03 0.06 0.125 0.25 0.50 1 2 4 8 16 32 64 128 256 512 1024 2048 >2048Aminoglycosides
Gentamicin faecalis N/A 0.0 [0.0 - 1.3] 100.0faecium N/A 0.0 [0.0 - 4.0] 100.0
Kanamycin faecalis N/A 0.0 [0.0 - 1.3] 100.0faecium N/A 5.5 [1.8 - 12.4] 64.8 25.3 4.4 2.2 3.3
Streptomycin faecalis N/A 1.8 [0.6 - 4.2] 98.2 1.1 0.7faecium N/A 3.3 [0.7 - 9.3] 96.7 3.3
GlycopeptidesVancomycin faecalis 0.0 0.0 [0.0 - 1.3] 0.4 54.5 44.4 0.7
faecium 0.0 0.0 [0.0 - 4.0] 2.2 82.4 7.7 7.7Glycylcycline
Tigecycline faecalis N/A 0.0 [0.0 - 1.3] 1.1 42.2 36.5 20.2faecium N/A 0.0 [0.0 - 4.0] 2.2 63.7 22.0 12.1
LincosamidesLincomycin faecalis 0.0 98.9 [96.9 - 99.8] 1.1 98.9
faecium 1.1 72.5 [62.2 - 81.4] 23.1 3.3 1.1 14.3 58.2Lipopeptides
Daptomycin faecalis N/A 0.0 [0.0 - 1.3] 0.4 2.5 49.1 45.8 2.2faecium 5 N/A N/A N/A 1.1 31.9 65.9 1.1
MacrolidesErythromicin faecalis 72.5 0.0 [0.0 - 1.3] 17.0 10.5 46.9 23.8 1.8
faecium 80.3 3.3 [0.7 - 9.3] 15.4 1.1 20.9 29.7 29.7 1.1 2.2Tylosin faecalis 0.0 0.0 [0.0 - 1.3] 0.4 7.2 91.3 1.1
faecium 9.9 2.2 [0.3 - 7.7] 7.7 27.5 33.0 19.8 9.9 2.2Nitrofurans
Nitrofurantoin faecalis 0.0 0.0 [0.0 - 1.3] 0.4 25.6 73.6 0.4faecium 73.6 22.0 [14.0 - 31.9] 1.1 3.3 73.6 22.0
OxazolidinonesLinezolid faecalis 0.0 0.0 [0.0 - 1.3] 0.7 30.7 68.6
faecium 1.1 0.0 [0.0 - 4.0] 16.5 82.4 1.1Penicillins
Penicillin faecalis N/A 0.0 [0.0 - 1.3] 22.7 76.9 0.4faecium N/A 3.3 [0.7 - 9.3] 18.7 3.3 5.5 12.1 45.1 12.1 3.3
PhenicolsChloramphenicol faecalis 0.0 0.0 [0.0 - 1.3] 3.6 96.4
faecium 0.0 1.1 [0.0 - 6.0] 11.0 87.9 1.1Quinolones
Ciprofloxacin faecalis 50.9 1.1 [0.2 - 3.1] 1.1 46.9 50.9 1.1faecium 26.4 12.1 [6.2 - 20.6] 16.5 45.0 26.4 12.1
StreptograminsQuinupristin- faecalis 6
Dalfopristin faecium 44.0 26.4 [17.7 - 36.7] 22.0 7.7 44.0 25.3 1.1Tetracyclines
Tetracycline faecalis 0.0 21.7 [17.0 - 27.0] 77.6 0.4 0.4 1.8 19.9faecium 0.0 23.1 [14.9 - 33.1] 76.9 23.1
5 There are no established CLSI breakpoints for daptomycin in E. faecium .6 Data not presented as E. faecalis is considered intrinsically resistant to Quinupristin-Dalfopristin.
Table 24.3 MIC Distribution among Enterococcus faecalis and E. faecium from Ground Beef, 2012
4 Unshaded areas indicate dilution ranges of the Sensititre plates. Breakpoints for susceptibility are indicated by single black bars and resistance double red vertical bars. Numbers in shaded area indicate isolates with MICs greater than the highest concentration on the Sensititre plate. Numbers in the lowest tested concentrations represent isolates with MICs equal to or less than the lowest tested concentration. CLSI breakpoints were used when available. There are no CLSI breakpoints for streptomycin.
1 Percent of isolates with intermediate susceptibility. N/A used when there is no intermediate breakpoint established. 2 Percent of isolates with resistance. Discrepancies between %R and sums of distribution %'s are due to rounding. Percent (%) non-susceptible is reported rather than %R for daptomycin and tigecycline because there is no CLSI breakpoint established.3 95% confidence intervals for percent resistant (%R) were calculated using the Clopper-Pearson exact method.
Distribution (%) of MICs (µg/ml)4
58
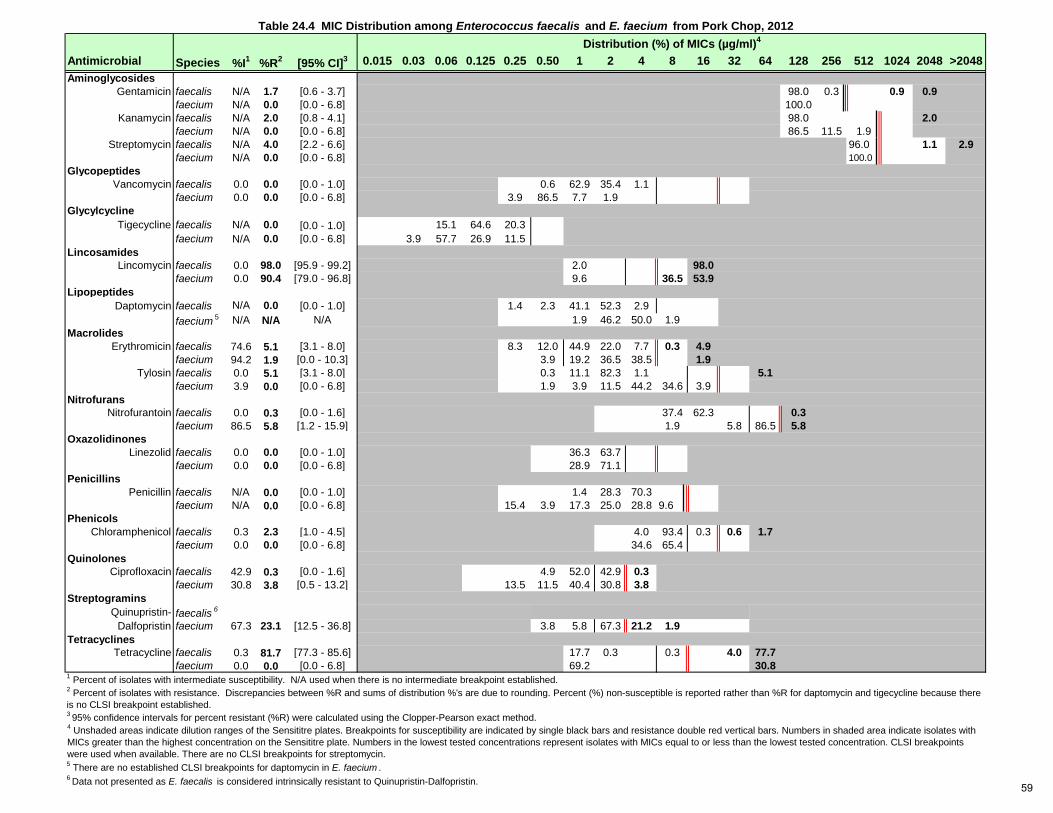
Antimicrobial Species %I1 %R2 [95% CI]3 0.015 0.03 0.06 0.125 0.25 0.50 1 2 4 8 16 32 64 128 256 512 1024 2048 >2048Aminoglycosides
Gentamicin faecalis N/A 1.7 [0.6 - 3.7] 98.0 0.3 0.9 0.9faecium N/A 0.0 [0.0 - 6.8] 100.0
Kanamycin faecalis N/A 2.0 [0.8 - 4.1] 98.0 2.0faecium N/A 0.0 [0.0 - 6.8] 86.5 11.5 1.9
Streptomycin faecalis N/A 4.0 [2.2 - 6.6] 96.0 1.1 2.9faecium N/A 0.0 [0.0 - 6.8] 100.0
GlycopeptidesVancomycin faecalis 0.0 0.0 [0.0 - 1.0] 0.6 62.9 35.4 1.1
faecium 0.0 0.0 [0.0 - 6.8] 3.9 86.5 7.7 1.9Glycylcycline
Tigecycline faecalis N/A 0.0 [0.0 - 1.0] 15.1 64.6 20.3faecium N/A 0.0 [0.0 - 6.8] 3.9 57.7 26.9 11.5
LincosamidesLincomycin faecalis 0.0 98.0 [95.9 - 99.2] 2.0 98.0
faecium 0.0 90.4 [79.0 - 96.8] 9.6 36.5 53.9Lipopeptides
Daptomycin faecalis N/A 0.0 [0.0 - 1.0] 1.4 2.3 41.1 52.3 2.9faecium 5 N/A N/A N/A 1.9 46.2 50.0 1.9
MacrolidesErythromicin faecalis 74.6 5.1 [3.1 - 8.0] 8.3 12.0 44.9 22.0 7.7 0.3 4.9
faecium 94.2 1.9 [0.0 - 10.3] 3.9 19.2 36.5 38.5 1.9Tylosin faecalis 0.0 5.1 [3.1 - 8.0] 0.3 11.1 82.3 1.1 5.1
faecium 3.9 0.0 [0.0 - 6.8] 1.9 3.9 11.5 44.2 34.6 3.9Nitrofurans
Nitrofurantoin faecalis 0.0 0.3 [0.0 - 1.6] 37.4 62.3 0.3faecium 86.5 5.8 [1.2 - 15.9] 1.9 5.8 86.5 5.8
OxazolidinonesLinezolid faecalis 0.0 0.0 [0.0 - 1.0] 36.3 63.7
faecium 0.0 0.0 [0.0 - 6.8] 28.9 71.1Penicillins
Penicillin faecalis N/A 0.0 [0.0 - 1.0] 1.4 28.3 70.3faecium N/A 0.0 [0.0 - 6.8] 15.4 3.9 17.3 25.0 28.8 9.6
PhenicolsChloramphenicol faecalis 0.3 2.3 [1.0 - 4.5] 4.0 93.4 0.3 0.6 1.7
faecium 0.0 0.0 [0.0 - 6.8] 34.6 65.4Quinolones
Ciprofloxacin faecalis 42.9 0.3 [0.0 - 1.6] 4.9 52.0 42.9 0.3faecium 30.8 3.8 [0.5 - 13.2] 13.5 11.5 40.4 30.8 3.8
StreptograminsQuinupristin- faecalis 6
Dalfopristin faecium 67.3 23.1 [12.5 - 36.8] 3.8 5.8 67.3 21.2 1.9Tetracyclines
Tetracycline faecalis 0.3 81.7 [77.3 - 85.6] 17.7 0.3 0.3 4.0 77.7faecium 0.0 0.0 [0.0 - 6.8] 69.2 30.8
5 There are no established CLSI breakpoints for daptomycin in E. faecium .6 Data not presented as E. faecalis is considered intrinsically resistant to Quinupristin-Dalfopristin.
Table 24.4 MIC Distribution among Enterococcus faecalis and E. faecium from Pork Chop, 2012
4 Unshaded areas indicate dilution ranges of the Sensititre plates. Breakpoints for susceptibility are indicated by single black bars and resistance double red vertical bars. Numbers in shaded area indicate isolates with MICs greater than the highest concentration on the Sensititre plate. Numbers in the lowest tested concentrations represent isolates with MICs equal to or less than the lowest tested concentration. CLSI breakpoints were used when available. There are no CLSI breakpoints for streptomycin.
1 Percent of isolates with intermediate susceptibility. N/A used when there is no intermediate breakpoint established. 2 Percent of isolates with resistance. Discrepancies between %R and sums of distribution %'s are due to rounding. Percent (%) non-susceptible is reported rather than %R for daptomycin and tigecycline because there is no CLSI breakpoint established.3 95% confidence intervals for percent resistant (%R) were calculated using the Clopper-Pearson exact method.
Distribution (%) of MICs (µg/ml)4
59
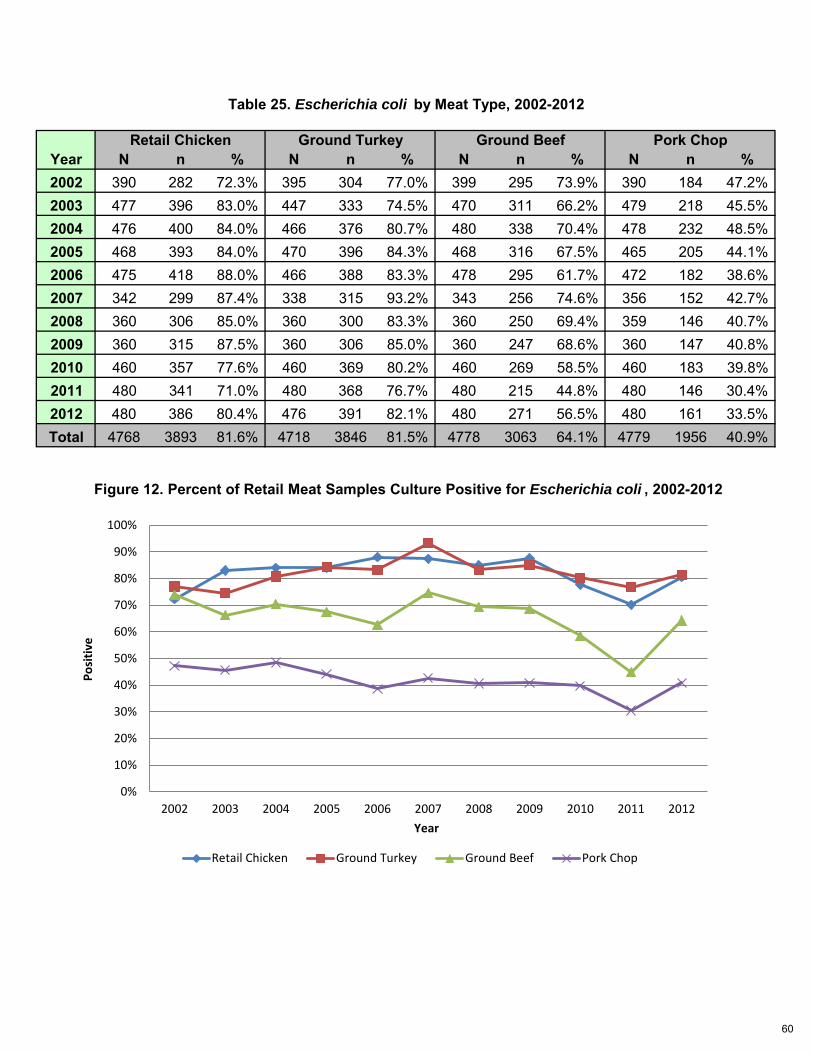
N n % N n % N n % N n %2002 390 282 72.3% 395 304 77.0% 399 295 73.9% 390 184 47.2%2003 477 396 83.0% 447 333 74.5% 470 311 66.2% 479 218 45.5%2004 476 400 84.0% 466 376 80.7% 480 338 70.4% 478 232 48.5%2005 468 393 84.0% 470 396 84.3% 468 316 67.5% 465 205 44.1%2006 475 418 88.0% 466 388 83.3% 478 295 61.7% 472 182 38.6%2007 342 299 87.4% 338 315 93.2% 343 256 74.6% 356 152 42.7%2008 360 306 85.0% 360 300 83.3% 360 250 69.4% 359 146 40.7%2009 360 315 87.5% 360 306 85.0% 360 247 68.6% 360 147 40.8%2010 460 357 77.6% 460 369 80.2% 460 269 58.5% 460 183 39.8%2011 480 341 71.0% 480 368 76.7% 480 215 44.8% 480 146 30.4%2012 480 386 80.4% 476 391 82.1% 480 271 56.5% 480 161 33.5%Total 4768 3893 81.6% 4718 3846 81.5% 4778 3063 64.1% 4779 1956 40.9%
Table 25. Escherichia coli by Meat Type, 2002-2012
Pork ChopYear
Retail Chicken Ground Turkey Ground Beef
Figure 12. Percent of Retail Meat Samples Culture Positive for Escherichia coli , 2002-2012
0%
10%
20%
30%
40%
50%
60%
70%
80%
90%
100%
2002 2003 2004 2005 2006 2007 2008 2009 2010 2011 2012
Posi
tive
Year
Retail Chicken Ground Turkey Ground Beef Pork Chop
60
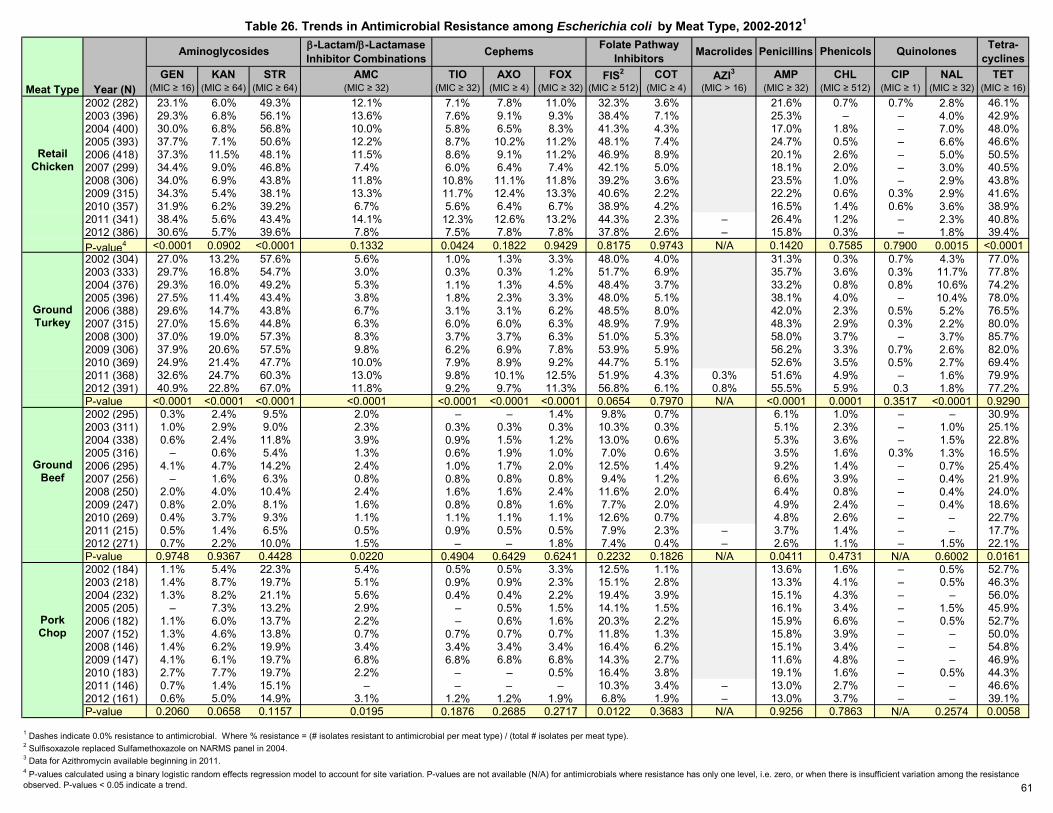
GEN KAN STR AMC TIO AXO FOX FIS2 COT AZI3 AMP CHL CIP NAL TET(MIC ≥ 16) (MIC ≥ 64) (MIC ≥ 64) (MIC ≥ 32) (MIC ≥ 32) (MIC ≥ 4) (MIC ≥ 32) (MIC ≥ 512) (MIC ≥ 4) (MIC > 16) (MIC ≥ 32) (MIC ≥ 512) (MIC ≥ 1) (MIC ≥ 32) (MIC ≥ 16)
2002 (282) 23.1% 6.0% 49.3% 12.1% 7.1% 7.8% 11.0% 32.3% 3.6% 21.6% 0.7% 0.7% 2.8% 46.1%2003 (396) 29.3% 6.8% 56.1% 13.6% 7.6% 9.1% 9.3% 38.4% 7.1% 25.3% – – 4.0% 42.9%2004 (400) 30.0% 6.8% 56.8% 10.0% 5.8% 6.5% 8.3% 41.3% 4.3% 17.0% 1.8% – 7.0% 48.0%2005 (393) 37.7% 7.1% 50.6% 12.2% 8.7% 10.2% 11.2% 48.1% 7.4% 24.7% 0.5% – 6.6% 46.6%
Retail 2006 (418) 37.3% 11.5% 48.1% 11.5% 8.6% 9.1% 11.2% 46.9% 8.9% 20.1% 2.6% – 5.0% 50.5%Chicken 2007 (299) 34.4% 9.0% 46.8% 7.4% 6.0% 6.4% 7.4% 42.1% 5.0% 18.1% 2.0% – 3.0% 40.5%
2008 (306) 34.0% 6.9% 43.8% 11.8% 10.8% 11.1% 11.8% 39.2% 3.6% 23.5% 1.0% – 2.9% 43.8%2009 (315) 34.3% 5.4% 38.1% 13.3% 11.7% 12.4% 13.3% 40.6% 2.2% 22.2% 0.6% 0.3% 2.9% 41.6%2010 (357) 31.9% 6.2% 39.2% 6.7% 5.6% 6.4% 6.7% 38.9% 4.2% 16.5% 1.4% 0.6% 3.6% 38.9%2011 (341) 38.4% 5.6% 43.4% 14.1% 12.3% 12.6% 13.2% 44.3% 2.3% – 26.4% 1.2% – 2.3% 40.8%2012 (386) 30.6% 5.7% 39.6% 7.8% 7.5% 7.8% 7.8% 37.8% 2.6% – 15.8% 0.3% – 1.8% 39.4%P-value4 <0.0001 0.0902 <0.0001 0.1332 0.0424 0.1822 0.9429 0.8175 0.9743 N/A 0.1420 0.7585 0.7900 0.0015 <0.00012002 (304) 27.0% 13.2% 57.6% 5.6% 1.0% 1.3% 3.3% 48.0% 4.0% 31.3% 0.3% 0.7% 4.3% 77.0%2003 (333) 29.7% 16.8% 54.7% 3.0% 0.3% 0.3% 1.2% 51.7% 6.9% 35.7% 3.6% 0.3% 11.7% 77.8%2004 (376) 29.3% 16.0% 49.2% 5.3% 1.1% 1.3% 4.5% 48.4% 3.7% 33.2% 0.8% 0.8% 10.6% 74.2%2005 (396) 27.5% 11.4% 43.4% 3.8% 1.8% 2.3% 3.3% 48.0% 5.1% 38.1% 4.0% – 10.4% 78.0%
Ground 2006 (388) 29.6% 14.7% 43.8% 6.7% 3.1% 3.1% 6.2% 48.5% 8.0% 42.0% 2.3% 0.5% 5.2% 76.5%Turkey 2007 (315) 27.0% 15.6% 44.8% 6.3% 6.0% 6.0% 6.3% 48.9% 7.9% 48.3% 2.9% 0.3% 2.2% 80.0%
2008 (300) 37.0% 19.0% 57.3% 8.3% 3.7% 3.7% 6.3% 51.0% 5.3% 58.0% 3.7% – 3.7% 85.7%2009 (306) 37.9% 20.6% 57.5% 9.8% 6.2% 6.9% 7.8% 53.9% 5.9% 56.2% 3.3% 0.7% 2.6% 82.0%2010 (369) 24.9% 21.4% 47.7% 10.0% 7.9% 8.9% 9.2% 44.7% 5.1% 52.6% 3.5% 0.5% 2.7% 69.4%2011 (368) 32.6% 24.7% 60.3% 13.0% 9.8% 10.1% 12.5% 51.9% 4.3% 0.3% 51.6% 4.9% – 1.6% 79.9%2012 (391) 40.9% 22.8% 67.0% 11.8% 9.2% 9.7% 11.3% 56.8% 6.1% 0.8% 55.5% 5.9% 0.3 1.8% 77.2%P-value <0.0001 <0.0001 <0.0001 <0.0001 <0.0001 <0.0001 <0.0001 0.0654 0.7970 N/A <0.0001 0.0001 0.3517 <0.0001 0.92902002 (295) 0.3% 2.4% 9.5% 2.0% – – 1.4% 9.8% 0.7% 6.1% 1.0% – – 30.9%2003 (311) 1.0% 2.9% 9.0% 2.3% 0.3% 0.3% 0.3% 10.3% 0.3% 5.1% 2.3% – 1.0% 25.1%2004 (338) 0.6% 2.4% 11.8% 3.9% 0.9% 1.5% 1.2% 13.0% 0.6% 5.3% 3.6% – 1.5% 22.8%2005 (316) – 0.6% 5.4% 1.3% 0.6% 1.9% 1.0% 7.0% 0.6% 3.5% 1.6% 0.3% 1.3% 16.5%
Ground 2006 (295) 4.1% 4.7% 14.2% 2.4% 1.0% 1.7% 2.0% 12.5% 1.4% 9.2% 1.4% – 0.7% 25.4%Beef 2007 (256) – 1.6% 6.3% 0.8% 0.8% 0.8% 0.8% 9.4% 1.2% 6.6% 3.9% – 0.4% 21.9%
2008 (250) 2.0% 4.0% 10.4% 2.4% 1.6% 1.6% 2.4% 11.6% 2.0% 6.4% 0.8% – 0.4% 24.0%2009 (247) 0.8% 2.0% 8.1% 1.6% 0.8% 0.8% 1.6% 7.7% 2.0% 4.9% 2.4% – 0.4% 18.6%2010 (269) 0.4% 3.7% 9.3% 1.1% 1.1% 1.1% 1.1% 12.6% 0.7% 4.8% 2.6% – – 22.7%2011 (215) 0.5% 1.4% 6.5% 0.5% 0.9% 0.5% 0.5% 7.9% 2.3% – 3.7% 1.4% – – 17.7%2012 (271) 0.7% 2.2% 10.0% 1.5% – – 1.8% 7.4% 0.4% – 2.6% 1.1% – 1.5% 22.1%P-value 0.9748 0.9367 0.4428 0.0220 0.4904 0.6429 0.6241 0.2232 0.1826 N/A 0.0411 0.4731 N/A 0.6002 0.01612002 (184) 1.1% 5.4% 22.3% 5.4% 0.5% 0.5% 3.3% 12.5% 1.1% 13.6% 1.6% – 0.5% 52.7%2003 (218) 1.4% 8.7% 19.7% 5.1% 0.9% 0.9% 2.3% 15.1% 2.8% 13.3% 4.1% – 0.5% 46.3%2004 (232) 1.3% 8.2% 21.1% 5.6% 0.4% 0.4% 2.2% 19.4% 3.9% 15.1% 4.3% – – 56.0%2005 (205) – 7.3% 13.2% 2.9% – 0.5% 1.5% 14.1% 1.5% 16.1% 3.4% – 1.5% 45.9%
Pork 2006 (182) 1.1% 6.0% 13.7% 2.2% – 0.6% 1.6% 20.3% 2.2% 15.9% 6.6% – 0.5% 52.7%Chop 2007 (152) 1.3% 4.6% 13.8% 0.7% 0.7% 0.7% 0.7% 11.8% 1.3% 15.8% 3.9% – – 50.0%
2008 (146) 1.4% 6.2% 19.9% 3.4% 3.4% 3.4% 3.4% 16.4% 6.2% 15.1% 3.4% – – 54.8%2009 (147) 4.1% 6.1% 19.7% 6.8% 6.8% 6.8% 6.8% 14.3% 2.7% 11.6% 4.8% – – 46.9%2010 (183) 2.7% 7.7% 19.7% 2.2% – – 0.5% 16.4% 3.8% 19.1% 1.6% – 0.5% 44.3%2011 (146) 0.7% 1.4% 15.1% – – – – 10.3% 3.4% – 13.0% 2.7% – – 46.6%2012 (161) 0.6% 5.0% 14.9% 3.1% 1.2% 1.2% 1.9% 6.8% 1.9% – 13.0% 3.7% – – 39.1%P-value 0.2060 0.0658 0.1157 0.0195 0.1876 0.2685 0.2717 0.0122 0.3683 N/A 0.9256 0.7863 N/A 0.2574 0.0058
1 Dashes indicate 0.0% resistance to antimicrobial. Where % resistance = (# isolates resistant to antimicrobial per meat type) / (total # isolates per meat type).2 Sulfisoxazole replaced Sulfamethoxazole on NARMS panel in 2004.3 Data for Azithromycin available beginning in 2011.
Quinolones Tetra-cyclines
4 P-values calculated using a binary logistic random effects regression model to account for site variation. P-values are not available (N/A) for antimicrobials where resistance has only one level, i.e. zero, or when there is insufficient variation among the resistance observed. P-values < 0.05 indicate a trend.
Table 26. Trends in Antimicrobial Resistance among Escherichia coli by Meat Type, 2002-20121
Meat Type Year (N)
Aminoglycosides β-Lactam/β-Lactamase Inhibitor Combinations Cephems Folate Pathway
Inhibitors Macrolides Penicillins Phenicols
61
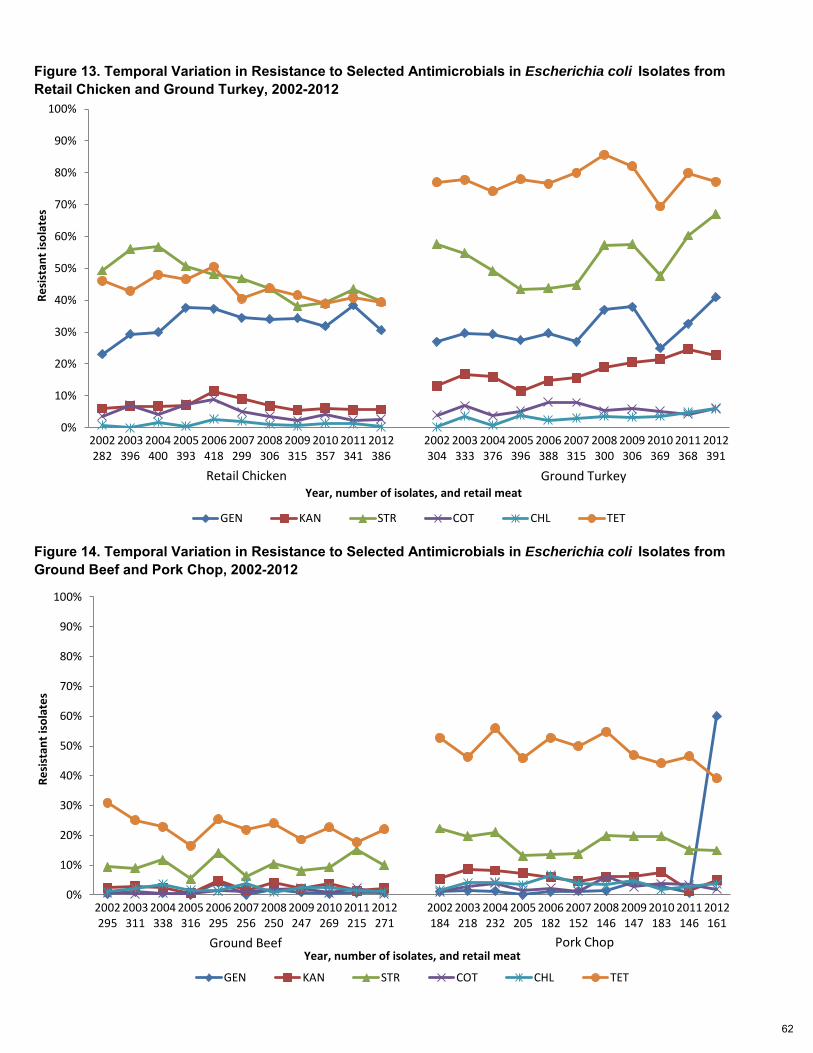
Figure 13. Temporal Variation in Resistance to Selected Antimicrobials in Escherichia coli Isolates from Retail Chicken and Ground Turkey, 2002-2012
Figure 14. Temporal Variation in Resistance to Selected Antimicrobials in Escherichia coli Isolates from Ground Beef and Pork Chop, 2002-2012
0%
10%
20%
30%
40%
50%
60%
70%
80%
90%
100%
2002282
2003396
2004400
2005393
2006418
2007299
2008306
2009315
2010357
2011341
2012386
2002304
2003333
2004376
2005396
2006388
2007315
2008300
2009306
2010369
2011368
2012391
Resi
stan
t iso
late
s
Year, number of isolates, and retail meat
GEN KAN STR COT CHL TET
Retail Chicken Ground Turkey
0%
10%
20%
30%
40%
50%
60%
70%
80%
90%
100%
2002295
2003311
2004338
2005316
2006295
2007256
2008250
2009247
2010269
2011215
2012271
2002184
2003218
2004232
2005205
2006182
2007152
2008146
2009147
2010183
2011146
2012161
Resi
stan
t iso
late
s
Year, number of isolates, and retail meat
GEN KAN STR COT CHL TET
Ground Beef Pork Chop
62
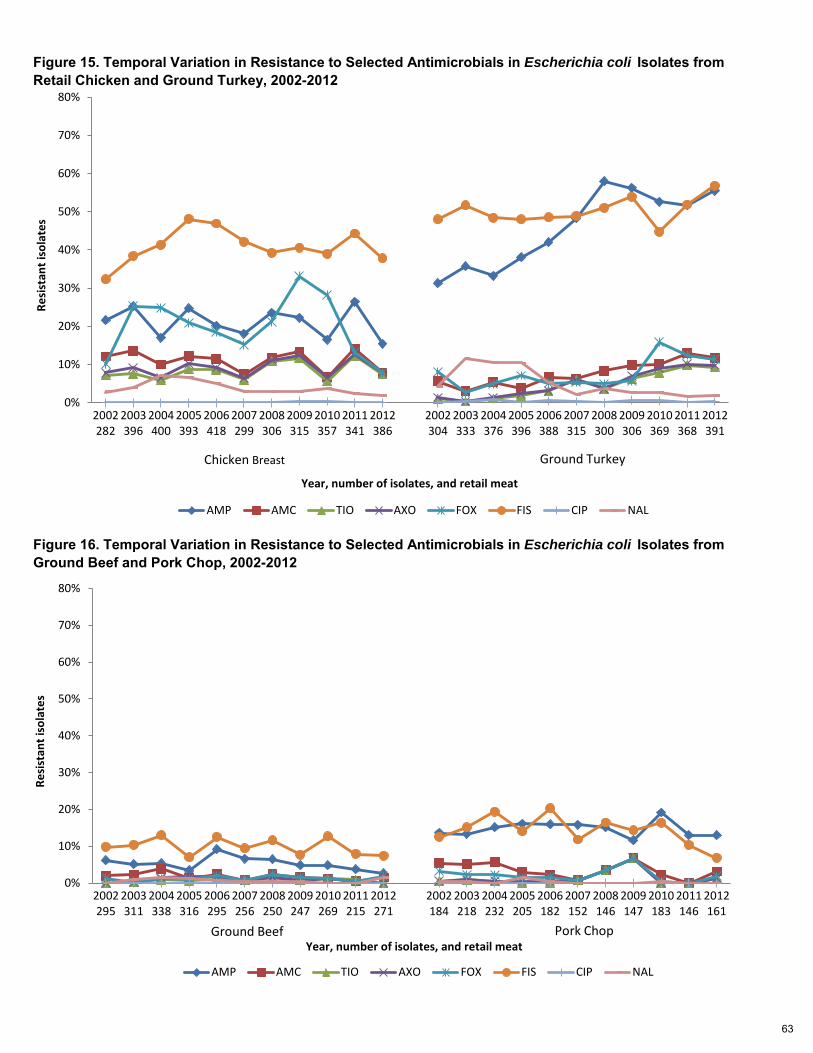
Figure 15. Temporal Variation in Resistance to Selected Antimicrobials in Escherichia coli Isolates from Retail Chicken and Ground Turkey, 2002-2012
Figure 16. Temporal Variation in Resistance to Selected Antimicrobials in Escherichia coli Isolates from Ground Beef and Pork Chop, 2002-2012
0%
10%
20%
30%
40%
50%
60%
70%
80%
2002282
2003396
2004400
2005393
2006418
2007299
2008306
2009315
2010357
2011341
2012386
2002304
2003333
2004376
2005396
2006388
2007315
2008300
2009306
2010369
2011368
2012391
Resi
stan
t iso
late
s
Year, number of isolates, and retail meat
AMP AMC TIO AXO FOX FIS CIP NAL
Chicken Breast Ground Turkey
0%
10%
20%
30%
40%
50%
60%
70%
80%
2002295
2003311
2004338
2005316
2006295
2007256
2008250
2009247
2010269
2011215
2012271
2002184
2003218
2004232
2005205
2006182
2007152
2008146
2009147
2010183
2011146
2012161
Resi
stan
t iso
late
s
Year, number of isolates, and retail meat
AMP AMC TIO AXO FOX FIS CIP NAL
Ground Beef Pork Chop
63
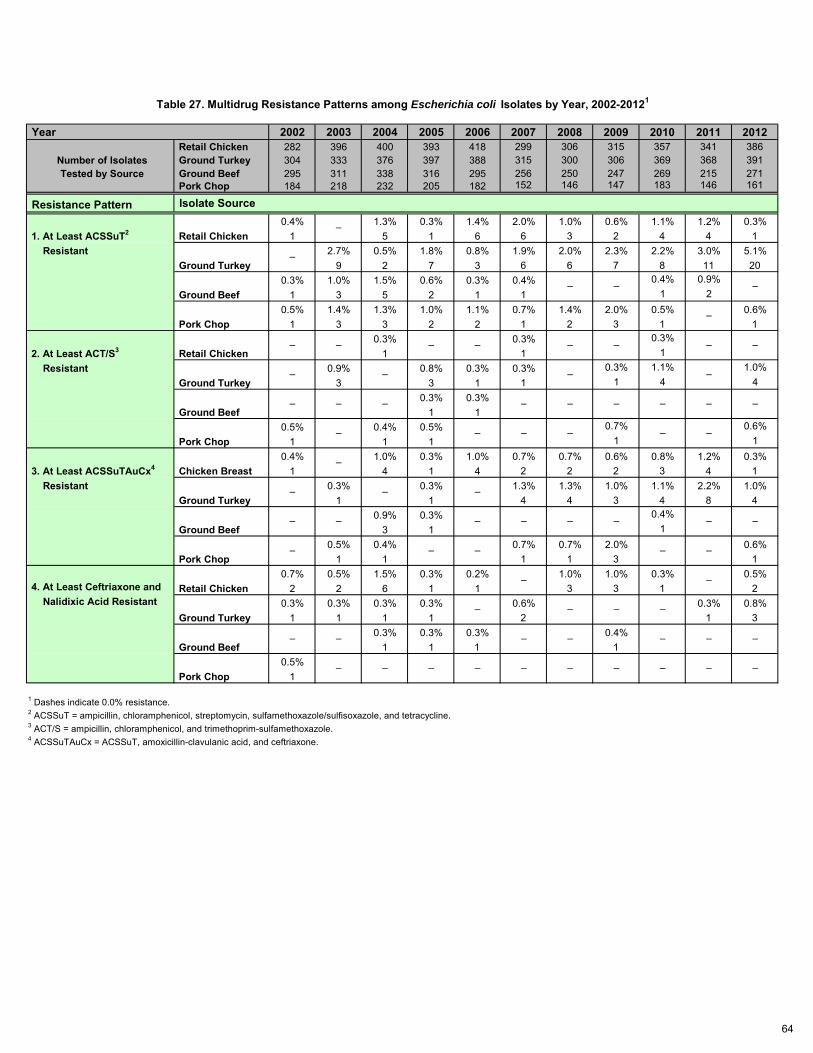
Year 2002 2003 2004 2005 2006 2007 2008 2009 2010 2011 2012 Retail Chicken 282 396 400 393 418 299 306 315 357 341 386
Number of Isolates Ground Turkey 304 333 376 397 388 315 300 306 369 368 391 Tested by Source Ground Beef 295 311 338 316 295 256 250 247 269 215 271
Pork Chop 184 218 232 205 182 152 146 147 183 146 161
Resistance Pattern Isolate Source0.4% 1.3% 0.3% 1.4% 2.0% 1.0% 0.6% 1.1% 1.2% 0.3%
1. At Least ACSSuT2 1 5 1 6 6 3 2 4 4 1 Resistant 2.7% 0.5% 1.8% 0.8% 1.9% 2.0% 2.3% 2.2% 3.0% 5.1%
9 2 7 3 6 6 7 8 11 200.3% 1.0% 1.5% 0.6% 0.3% 0.4% 0.4% 0.9%
1 3 5 2 1 1 1 20.5% 1.4% 1.3% 1.0% 1.1% 0.7% 1.4% 2.0% 0.5% 0.6%
1 3 3 2 2 1 2 3 1 10.3% 0.3% 0.3%
2. At Least ACT/S3 1 1 1 Resistant 0.9% 0.8% 0.3% 0.3% 0.3% 1.1% 1.0%
3 3 1 1 1 4 40.3% 0.3%
1 10.5% 0.4% 0.5% 0.7% 0.6%
1 1 1 1 10.4% 1.0% 0.3% 1.0% 0.7% 0.7% 0.6% 0.8% 1.2% 0.3%
3. At Least ACSSuTAuCx4 1 4 1 4 2 2 2 3 4 1 Resistant 0.3% 0.3% 1.3% 1.3% 1.0% 1.1% 2.2% 1.0%
1 1 4 4 3 4 8 40.9% 0.3% 0.4%
3 1 10.5% 0.4% 0.7% 0.7% 2.0% 0.6%
1 1 1 1 3 10.7% 0.5% 1.5% 0.3% 0.2% 1.0% 1.0% 0.3% 0.5%
4. At Least Ceftriaxone and 2 2 6 1 1 3 3 1 2 Nalidixic Acid Resistant 0.3% 0.3% 0.3% 0.3% 0.6% 0.3% 0.8%
1 1 1 1 2 1 30.3% 0.3% 0.3% 0.4%
1 1 1 10.5%
1
1 Dashes indicate 0.0% resistance.2 ACSSuT = ampicillin, chloramphenicol, streptomycin, sulfamethoxazole/sulfisoxazole, and tetracycline.3 ACT/S = ampicillin, chloramphenicol, and trimethoprim-sulfamethoxazole.4 ACSSuTAuCx = ACSSuT, amoxicillin-clavulanic acid, and ceftriaxone.
Table 27. Multidrug Resistance Patterns among Escherichia coli Isolates by Year, 2002-20121
–
–
–
–
–
–
–
–
–
–
– –
–
–
–
–
–
–
–
–
–
–
Pork Chop
Retail Chicken
Ground Turkey
Ground Beef
Pork Chop
Chicken Breast
Ground Turkey
Ground Beef
–
–
Ground Turkey
Ground Beef
Retail Chicken
Ground Turkey
Pork Chop
–
–
–
–
– –
–
– –
–
–
–
Ground Beef
–
––––
Pork Chop
Retail Chicken– –
–
–
–
–
–
– –
–
–
–
–
–
–––
–
–
–
–
–
–
–
–
–
–
–
–
–
–
–
64
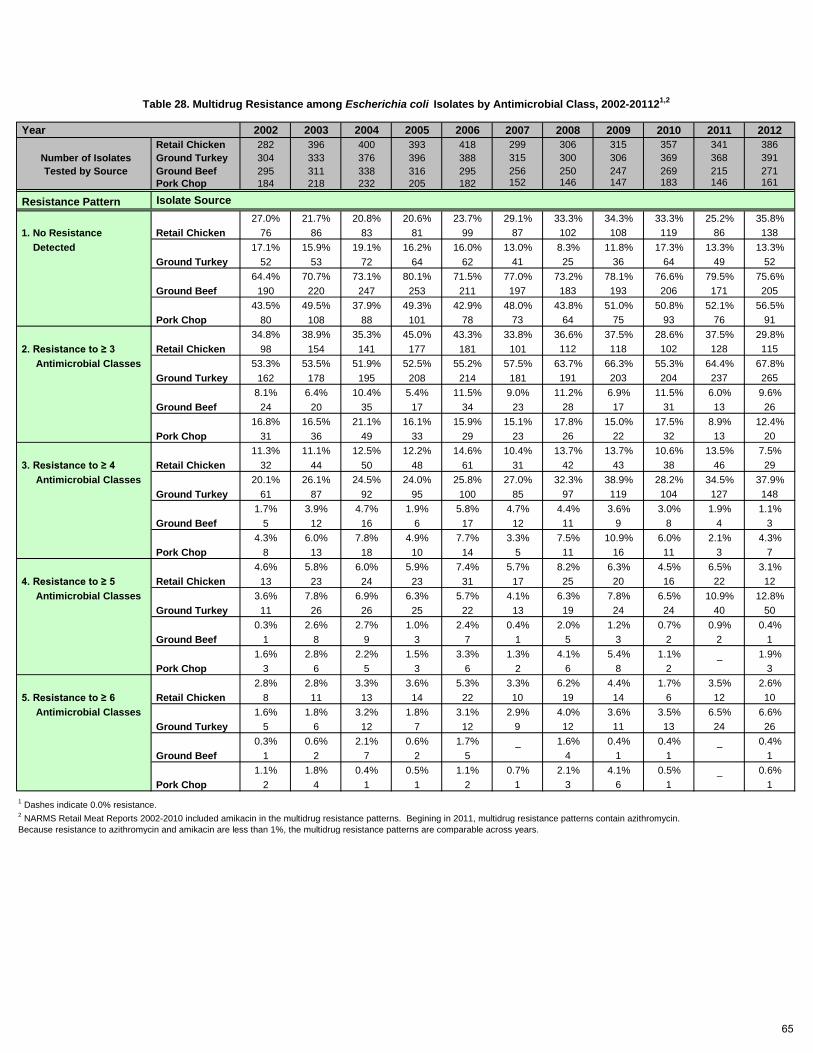
Year 2002 2003 2004 2005 2006 2007 2008 2009 2010 2011 2012 Retail Chicken 282 396 400 393 418 299 306 315 357 341 386
Number of Isolates Ground Turkey 304 333 376 396 388 315 300 306 369 368 391 Tested by Source Ground Beef 295 311 338 316 295 256 250 247 269 215 271
Pork Chop 184 218 232 205 182 152 146 147 183 146 161
Resistance Pattern Isolate Source27.0% 21.7% 20.8% 20.6% 23.7% 29.1% 33.3% 34.3% 33.3% 25.2% 35.8%
1. No Resistance 76 86 83 81 99 87 102 108 119 86 138 Detected 17.1% 15.9% 19.1% 16.2% 16.0% 13.0% 8.3% 11.8% 17.3% 13.3% 13.3%
52 53 72 64 62 41 25 36 64 49 5264.4% 70.7% 73.1% 80.1% 71.5% 77.0% 73.2% 78.1% 76.6% 79.5% 75.6%
190 220 247 253 211 197 183 193 206 171 20543.5% 49.5% 37.9% 49.3% 42.9% 48.0% 43.8% 51.0% 50.8% 52.1% 56.5%
80 108 88 101 78 73 64 75 93 76 9134.8% 38.9% 35.3% 45.0% 43.3% 33.8% 36.6% 37.5% 28.6% 37.5% 29.8%
2. Resistance to ≥ 3 98 154 141 177 181 101 112 118 102 128 115 Antimicrobial Classes 53.3% 53.5% 51.9% 52.5% 55.2% 57.5% 63.7% 66.3% 55.3% 64.4% 67.8%
162 178 195 208 214 181 191 203 204 237 2658.1% 6.4% 10.4% 5.4% 11.5% 9.0% 11.2% 6.9% 11.5% 6.0% 9.6%
24 20 35 17 34 23 28 17 31 13 2616.8% 16.5% 21.1% 16.1% 15.9% 15.1% 17.8% 15.0% 17.5% 8.9% 12.4%
31 36 49 33 29 23 26 22 32 13 2011.3% 11.1% 12.5% 12.2% 14.6% 10.4% 13.7% 13.7% 10.6% 13.5% 7.5%
3. Resistance to ≥ 4 32 44 50 48 61 31 42 43 38 46 29 Antimicrobial Classes 20.1% 26.1% 24.5% 24.0% 25.8% 27.0% 32.3% 38.9% 28.2% 34.5% 37.9%
61 87 92 95 100 85 97 119 104 127 1481.7% 3.9% 4.7% 1.9% 5.8% 4.7% 4.4% 3.6% 3.0% 1.9% 1.1%
5 12 16 6 17 12 11 9 8 4 34.3% 6.0% 7.8% 4.9% 7.7% 3.3% 7.5% 10.9% 6.0% 2.1% 4.3%
8 13 18 10 14 5 11 16 11 3 74.6% 5.8% 6.0% 5.9% 7.4% 5.7% 8.2% 6.3% 4.5% 6.5% 3.1%
4. Resistance to ≥ 5 13 23 24 23 31 17 25 20 16 22 12 Antimicrobial Classes 3.6% 7.8% 6.9% 6.3% 5.7% 4.1% 6.3% 7.8% 6.5% 10.9% 12.8%
11 26 26 25 22 13 19 24 24 40 500.3% 2.6% 2.7% 1.0% 2.4% 0.4% 2.0% 1.2% 0.7% 0.9% 0.4%
1 8 9 3 7 1 5 3 2 2 11.6% 2.8% 2.2% 1.5% 3.3% 1.3% 4.1% 5.4% 1.1% 1.9%
3 6 5 3 6 2 6 8 2 32.8% 2.8% 3.3% 3.6% 5.3% 3.3% 6.2% 4.4% 1.7% 3.5% 2.6%
5. Resistance to ≥ 6 8 11 13 14 22 10 19 14 6 12 10 Antimicrobial Classes 1.6% 1.8% 3.2% 1.8% 3.1% 2.9% 4.0% 3.6% 3.5% 6.5% 6.6%
5 6 12 7 12 9 12 11 13 24 260.3% 0.6% 2.1% 0.6% 1.7% 1.6% 0.4% 0.4% 0.4%
1 2 7 2 5 4 1 1 11.1% 1.8% 0.4% 0.5% 1.1% 0.7% 2.1% 4.1% 0.5% 0.6%
2 4 1 1 2 1 3 6 1 1
–
–
–
Ground Turkey
Ground Beef
Retail Chicken
Ground Turkey
Pork Chop
Retail Chicken
Ground Turkey
Ground Beef
Pork Chop
Retail Chicken
Ground Turkey
Pork Chop
Retail Chicken
Ground Beef
Retail Chicken
Ground Turkey
Ground Beef
Pork Chop
Table 28. Multidrug Resistance among Escherichia coli Isolates by Antimicrobial Class, 2002-201121,2
2 NARMS Retail Meat Reports 2002-2010 included amikacin in the multidrug resistance patterns. Begining in 2011, multidrug resistance patterns contain azithromycin. Because resistance to azithromycin and amikacin are less than 1%, the multidrug resistance patterns are comparable across years.
–
1 Dashes indicate 0.0% resistance.
Pork Chop
Ground Beef
65
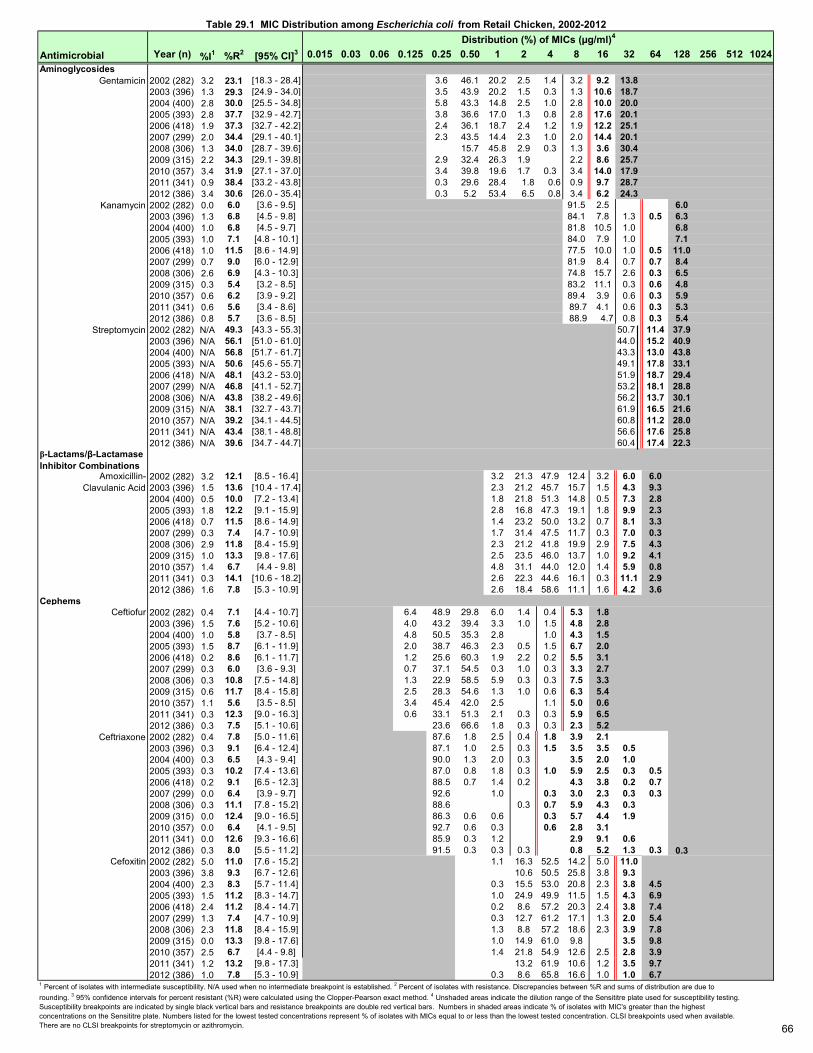
Antimicrobial Year (n) %I1 %R2 [95% CI]3 0.015 0.03 0.06 0.125 0.25 0.50 1 2 4 8 16 32 64 128 256 512 1024Aminoglycosides
Gentamicin 2002 (282) 3.2 23.1 [18.3 - 28.4] 3.6 46.1 20.2 2.5 1.4 3.2 9.2 13.82003 (396) 1.3 29.3 [24.9 - 34.0] 3.5 43.9 20.2 1.5 0.3 1.3 10.6 18.72004 (400) 2.8 30.0 [25.5 - 34.8] 5.8 43.3 14.8 2.5 1.0 2.8 10.0 20.02005 (393) 2.8 37.7 [32.9 - 42.7] 3.8 36.6 17.0 1.3 0.8 2.8 17.6 20.12006 (418) 1.9 37.3 [32.7 - 42.2] 2.4 36.1 18.7 2.4 1.2 1.9 12.2 25.12007 (299) 2.0 34.4 [29.1 - 40.1] 2.3 43.5 14.4 2.3 1.0 2.0 14.4 20.12008 (306) 1.3 34.0 [28.7 - 39.6] 15.7 45.8 2.9 0.3 1.3 3.6 30.42009 (315) 2.2 34.3 [29.1 - 39.8] 2.9 32.4 26.3 1.9 2.2 8.6 25.72010 (357) 3.4 31.9 [27.1 - 37.0] 3.4 39.8 19.6 1.7 0.3 3.4 14.0 17.92011 (341) 0.9 38.4 [33.2 - 43.8] 0.3 29.6 28.4 1.8 0.6 0.9 9.7 28.72012 (386) 3.4 30.6 [26.0 - 35.4] 0.3 5.2 53.4 6.5 0.8 3.4 6.2 24.3
Kanamycin 2002 (282) 0.0 6.0 [3.6 - 9.5] 91.5 2.5 6.02003 (396) 1.3 6.8 [4.5 - 9.8] 84.1 7.8 1.3 0.5 6.32004 (400) 1.0 6.8 [4.5 - 9.7] 81.8 10.5 1.0 6.82005 (393) 1.0 7.1 [4.8 - 10.1] 84.0 7.9 1.0 7.12006 (418) 1.0 11.5 [8.6 - 14.9] 77.5 10.0 1.0 0.5 11.02007 (299) 0.7 9.0 [6.0 - 12.9] 81.9 8.4 0.7 0.7 8.42008 (306) 2.6 6.9 [4.3 - 10.3] 74.8 15.7 2.6 0.3 6.52009 (315) 0.3 5.4 [3.2 - 8.5] 83.2 11.1 0.3 0.6 4.82010 (357) 0.6 6.2 [3.9 - 9.2] 89.4 3.9 0.6 0.3 5.92011 (341) 0.6 5.6 [3.4 - 8.6] 89.7 4.1 0.6 0.3 5.32012 (386) 0.8 5.7 [3.6 - 8.5] 88.9 4.7 0.8 0.3 5.4
Streptomycin 2002 (282) N/A 49.3 [43.3 - 55.3] 50.7 11.4 37.92003 (396) N/A 56.1 [51.0 - 61.0] 44.0 15.2 40.92004 (400) N/A 56.8 [51.7 - 61.7] 43.3 13.0 43.82005 (393) N/A 50.6 [45.6 - 55.7] 49.1 17.8 33.12006 (418) N/A 48.1 [43.2 - 53.0] 51.9 18.7 29.42007 (299) N/A 46.8 [41.1 - 52.7] 53.2 18.1 28.82008 (306) N/A 43.8 [38.2 - 49.6] 56.2 13.7 30.12009 (315) N/A 38.1 [32.7 - 43.7] 61.9 16.5 21.62010 (357) N/A 39.2 [34.1 - 44.5] 60.8 11.2 28.02011 (341) N/A 43.4 [38.1 - 48.8] 56.6 17.6 25.82012 (386) N/A 39.6 [34.7 - 44.7] 60.4 17.4 22.3
β-Lactams/β-Lactamase Inhibitor Combinations
Amoxicillin- 2002 (282) 3.2 12.1 [8.5 - 16.4] 3.2 21.3 47.9 12.4 3.2 6.0 6.0 Clavulanic Acid 2003 (396) 1.5 13.6 [10.4 - 17.4] 2.3 21.2 45.7 15.7 1.5 4.3 9.3
2004 (400) 0.5 10.0 [7.2 - 13.4] 1.8 21.8 51.3 14.8 0.5 7.3 2.82005 (393) 1.8 12.2 [9.1 - 15.9] 2.8 16.8 47.3 19.1 1.8 9.9 2.32006 (418) 0.7 11.5 [8.6 - 14.9] 1.4 23.2 50.0 13.2 0.7 8.1 3.32007 (299) 0.3 7.4 [4.7 - 10.9] 1.7 31.4 47.5 11.7 0.3 7.0 0.32008 (306) 2.9 11.8 [8.4 - 15.9] 2.3 21.2 41.8 19.9 2.9 7.5 4.32009 (315) 1.0 13.3 [9.8 - 17.6] 2.5 23.5 46.0 13.7 1.0 9.2 4.12010 (357) 1.4 6.7 [4.4 - 9.8] 4.8 31.1 44.0 12.0 1.4 5.9 0.82011 (341) 0.3 14.1 [10.6 - 18.2] 2.6 22.3 44.6 16.1 0.3 11.1 2.92012 (386) 1.6 7.8 [5.3 - 10.9] 2.6 18.4 58.6 11.1 1.6 4.2 3.6
Cephems Ceftiofur 2002 (282) 0.4 7.1 [4.4 - 10.7] 6.4 48.9 29.8 6.0 1.4 0.4 5.3 1.8
2003 (396) 1.5 7.6 [5.2 - 10.6] 4.0 43.2 39.4 3.3 1.0 1.5 4.8 2.82004 (400) 1.0 5.8 [3.7 - 8.5] 4.8 50.5 35.3 2.8 1.0 4.3 1.52005 (393) 1.5 8.7 [6.1 - 11.9] 2.0 38.7 46.3 2.3 0.5 1.5 6.7 2.02006 (418) 0.2 8.6 [6.1 - 11.7] 1.2 25.6 60.3 1.9 2.2 0.2 5.5 3.12007 (299) 0.3 6.0 [3.6 - 9.3] 0.7 37.1 54.5 0.3 1.0 0.3 3.3 2.72008 (306) 0.3 10.8 [7.5 - 14.8] 1.3 22.9 58.5 5.9 0.3 0.3 7.5 3.32009 (315) 0.6 11.7 [8.4 - 15.8] 2.5 28.3 54.6 1.3 1.0 0.6 6.3 5.42010 (357) 1.1 5.6 [3.5 - 8.5] 3.4 45.4 42.0 2.5 1.1 5.0 0.62011 (341) 0.3 12.3 [9.0 - 16.3] 0.6 33.1 51.3 2.1 0.3 0.3 5.9 6.52012 (386) 0.3 7.5 [5.1 - 10.6] 23.6 66.6 1.8 0.3 0.3 2.3 5.2
Ceftriaxone 2002 (282) 0.4 7.8 [5.0 - 11.6] 87.6 1.8 2.5 0.4 1.8 3.9 2.12003 (396) 0.3 9.1 [6.4 - 12.4] 87.1 1.0 2.5 0.3 1.5 3.5 3.5 0.52004 (400) 0.3 6.5 [4.3 - 9.4] 90.0 1.3 2.0 0.3 3.5 2.0 1.02005 (393) 0.3 10.2 [7.4 - 13.6] 87.0 0.8 1.8 0.3 1.0 5.9 2.5 0.3 0.52006 (418) 0.2 9.1 [6.5 - 12.3] 88.5 0.7 1.4 0.2 4.3 3.8 0.2 0.72007 (299) 0.0 6.4 [3.9 - 9.7] 92.6 1.0 0.3 3.0 2.3 0.3 0.32008 (306) 0.3 11.1 [7.8 - 15.2] 88.6 0.3 0.7 5.9 4.3 0.32009 (315) 0.0 12.4 [9.0 - 16.5] 86.3 0.6 0.6 0.3 5.7 4.4 1.92010 (357) 0.0 6.4 [4.1 - 9.5] 92.7 0.6 0.3 0.6 2.8 3.12011 (341) 0.0 12.6 [9.3 - 16.6] 85.9 0.3 1.2 2.9 9.1 0.62012 (386) 0.3 8.0 [5.5 - 11.2] 91.5 0.3 0.3 0.3 0.8 5.2 1.3 0.3 0.3
Cefoxitin 2002 (282) 5.0 11.0 [7.6 - 15.2] 1.1 16.3 52.5 14.2 5.0 11.02003 (396) 3.8 9.3 [6.7 - 12.6] 10.6 50.5 25.8 3.8 9.32004 (400) 2.3 8.3 [5.7 - 11.4] 0.3 15.5 53.0 20.8 2.3 3.8 4.52005 (393) 1.5 11.2 [8.3 - 14.7] 1.0 24.9 49.9 11.5 1.5 4.3 6.92006 (418) 2.4 11.2 [8.4 - 14.7] 0.2 8.6 57.2 20.3 2.4 3.8 7.42007 (299) 1.3 7.4 [4.7 - 10.9] 0.3 12.7 61.2 17.1 1.3 2.0 5.42008 (306) 2.3 11.8 [8.4 - 15.9] 1.3 8.8 57.2 18.6 2.3 3.9 7.82009 (315) 0.0 13.3 [9.8 - 17.6] 1.0 14.9 61.0 9.8 3.5 9.82010 (357) 2.5 6.7 [4.4 - 9.8] 1.4 21.8 54.9 12.6 2.5 2.8 3.92011 (341) 1.2 13.2 [9.8 - 17.3] 13.2 61.9 10.6 1.2 3.5 9.72012 (386) 1.0 7.8 [5.3 - 10.9] 0.3 8.6 65.8 16.6 1.0 1.0 6.7
Table 29.1 MIC Distribution among Escherichia coli from Retail Chicken, 2002-2012Distribution (%) of MICs (µg/ml)4
1 Percent of isolates with intermediate susceptibility. N/A used when no intermediate breakpoint is established. 2 Percent of isolates with resistance. Discrepancies between %R and sums of distribution are due to rounding. 3 95% confidence intervals for percent resistant (%R) were calculated using the Clopper-Pearson exact method. 4 Unshaded areas indicate the dilution range of the Sensititre plate used for susceptibility testing. Susceptibility breakpoints are indicated by single black vertical bars and resistance breakpoints are double red vertical bars. Numbers in shaded areas indicate % of isolates with MIC's greater than the highest concentrations on the Sensititre plate. Numbers listed for the lowest tested concentrations represent % of isolates with MICs equal to or less than the lowest tested concentration. CLSI breakpoints used when available. There are no CLSI breakpoints for streptomycin or azithromycin. 66

Antimicrobial Year (n) %I1 %R2 [95% CI]3 0.015 0.03 0.06 0.125 0.25 0.50 1 2 4 8 16 32 64 128 256 512 1024Folate Pathway
Sulfamethoxazole 2002 (282) N/A 32.3 [26.8 - 38.1] 66.0 1.42 0.35 32.32003 (396) N/A 38.4 [33.6 - 43.4] 59.8 1.3 0.5 38.4
Sulfisoxazole 2004 (400) N/A 41.3 [36.4 - 46.2] 48.5 6.3 4.0 41.32005 (393) N/A 48.1 [43.1 - 53.2] 39.4 9.2 2.8 0.3 0.3 48.12006 (418) N/A 46.9 [42.0 - 51.8] 33.0 18.2 1.9 46.92007 (299) N/A 42.1 [36.5 - 48.0] 41.8 14.7 1.3 42.12008 (306) N/A 39.2 [33.7 - 44.9] 47.1 13.4 0.3 39.22009 (315) N/A 40.6 [35.2 - 46.3] 41.0 16.5 1.9 40.62010 (357) N/A 38.9 [33.8 - 44.2] 34.5 25.2 0.8 0.6 38.92011 (341) N/A 44.3 [38.9 - 49.7] 39.9 14.1 1.5 0.3 44.32012 (386) N/A 37.8 [33.0 - 42.9] 45.3 15.5 1.3 37.8
Trimethoprim- 2002 (282) N/A 3.5 [1.7 - 6.4] 82.6 6.4 6.0 0.4 1.1 3.6 Sulfamethoxazole 2003 (396) N/A 7.1 [4.7 - 10.1] 83.6 5.3 2.3 1.3 0.5 7.1
2004 (400) N/A 4.3 [2.5 - 6.7] 85.5 7.0 2.5 0.5 0.3 4.32005 (393) N/A 7.4 [5.0 - 10.4] 66.2 17.3 6.4 2.5 0.3 0.5 6.92006 (418) N/A 8.9 [6.3 - 12.0] 58.1 18.9 9.8 3.3 1.0 1.0 7.92007 (299) N/A 5.0 [2.8 - 8.1] 51.8 28.4 9.7 4.7 0.3 0.3 4.72008 (306) N/A 3.6 [1.8 - 6.3] 69.0 20.6 4.6 1.6 0.7 3.62009 (315) N/A 2.2 [0.9 - 4.5] 78.1 13.0 4.1 1.6 1.0 2.22010 (357) N/A 4.2 [2.4 - 6.8] 77.6 10.4 5.6 1.1 1.1 0.6 3.62011 (341) N/A 2.3 [1.0 - 4.6] 77.4 15.0 3.5 1.2 0.6 2.32012 (386) N/A 2.6 [1.2 - 4.7] 80.1 9.8 5.7 1.8 2.6
Macrolides Azithromycin 2011 (341) N/A 0.0 [0.0 - 1.1] 0.3 0.9 22.0 71.0 5.9
2012 (386) N/A 0.0 [0.0 - 1.0] 1.0 17.6 74.1 7.0 0.3Penicillins
Ampicillin 2002 (282) 0.4 21.6 [17.0 - 26.9] 6.0 27.7 39.0 5.3 0.4 0.4 21.32003 (396) 0.3 25.3 [21.0 - 29.8] 1.5 24.5 43.9 4.5 0.3 0.5 24.72004 (400) 0.3 17.0 [13.4 - 21.0] 6.7 40.2 34.0 1.7 0.3 0.3 16.82005 (393) 0.8 24.7 [20.5 - 29.3] 5.9 35.4 31.8 1.5 0.8 0.3 24.42006 (418) 0.5 20.1 [16.4 - 24.3] 8.1 39.7 30.1 1.4 0.5 20.12007 (299) 0.0 18.1 [13.9 - 22.9] 6.4 46.8 28.4 0.3 0.3 17.72008 (306) 0.0 23.5 [18.9 - 28.7] 5.9 35.6 33.3 1.6 0.3 23.22009 (315) 0.0 22.2 [17.8 - 27.2] 9.2 41.9 25.7 1.0 22.22010 (357) 0.3 16.5 [12.8 - 20.8] 13.4 48.2 21.3 0.3 0.3 16.52011 (341) 0.0 26.4 [21.8 - 31.4] 8.5 43.1 21.4 0.6 26.42012 (386) 0.0 15.8 [12.3 - 19.8] 6.0 39.9 37.3 1.0 0.3 15.5
Phenicols Chloramphenicol 2002 (282) 1.8 0.7 [0.1 - 2.5] 3.9 41.5 52.1 1.8 0.7
2003 (396) 3.5 0.0 [0.0 - 0.9] 1.5 25.5 69.4 3.52004 (400) 2.5 1.8 [0.7 - 3.6] 3.3 34.5 58.0 2.5 0.3 1.52005 (393) 2.0 0.5 [0.1 - 1.8] 2.5 41.2 53.7 2.0 0.52006 (418) 1.0 2.6 [1.3 - 4.7] 1.0 39.5 56.0 1.0 0.2 2.42007 (299) 1.3 2.0 [0.7 - 4.3] 1.0 35.8 59.9 1.3 0.7 1.32008 (306) 1.0 1.0 [0.2 - 2.8] 1.6 42.5 53.9 1.0 1.02009 (315) 1.0 0.6 [0.1 - 2.3] 7.3 57.5 33.7 1.0 0.62010 (357) 0.6 1.4 [0.5 - 3.2] 5.0 56.0 37.0 0.6 1.42011 (341) 0.0 1.2 [0.3 - 3.0] 5.9 59.2 33.7 1.22012 (386) 1.8 0.3 [0.0 - 1.4] 1.6 43.3 53.1 1.8 0.3
Quinolones Ciprofloxacin 2002 (282) 2.1 0.7 [0.1 - 2.5] 90.4 6.4 0.4 0.4 1.4 0.4 0.4 0.4
2003 (396) 4.1 0.0 [0.0 - 0.9] 92.9 3.0 2.3 1.5 0.32004 (400) 6.9 0.0 [0.0 - 0.9] 90.3 2.3 0.5 1.7 4.0 1.22005 (393) 8.7 0.0 [0.0 - 0.9] 84.2 4.8 2.3 3.8 4.6 0.32006 (418) 4.8 0.0 [0.0 - 0.9] 93.3 1.7 0.2 1.2 2.9 0.72007 (299) 3.0 0.0 [0.0 - 1.2] 96.7 0.3 1.0 1.7 0.32008 (306) 3.3 0.0 [0.0 - 1.2] 93.8 2.9 0.3 2.6 0.32009 (315) 2.5 0.3 [0.0 - 1.8] 96.5 0.3 0.3 0.3 2.2 0.32010 (357) 3.1 0.6 [0.1 - 2.0] 95.0 1.4 0.6 2.5 0.3 0.32011 (341) 2.7 0.0 [0.0 - 1.1] 96.8 0.6 1.2 1.52012 (386) 1.6 0.0 [0.0 - 1.0] 93.5 4.4 0.5 0.3 1.0 0.3
Nalidixic Acid 2002 (282) N/A 2.8 [1.2 - 5.5] 1.1 17.7 72.3 5.7 0.4 2.82003 (396) N/A 4.0 [2.3 - 6.5] 4.0 47.5 43.2 1.3 0.3 3.82004 (400) N/A 7.0 [4.7 - 10.0] 6.5 63.0 23.2 0.3 0.3 6.82005 (393) N/A 6.6 [4.4 - 9.5] 8.1 66.4 15.8 2.0 1.0 0.5 6.12006 (418) N/A 5.0 [3.1 - 7.6] 0.5 6.9 72.5 14.8 0.2 5.02007 (299) N/A 3.0 [1.4 - 5.6] 11.0 78.6 7.4 3.02008 (306) N/A 2.9 [1.4 - 5.5] 1.0 13.1 70.3 12.4 0.3 0.3 2.62009 (315) N/A 2.9 [1.3 - 5.4] 1.0 17.5 74.0 4.4 0.3 0.3 2.52010 (357) N/A 3.6 [2.0 - 6.1] 1.7 17.1 70.6 7.0 3.62011 (341) N/A 2.3 [1.0 - 4.6] 19.1 71.9 6.4 0.3 0.3 2.12012 (386) N/A 1.8 [0.7 - 3.7] 14.8 67.4 15.8 0.3 0.3 1.6
Tetracyclines Tetracycline 2002 (282) 1.1 46.1 [40.2 - 52.1] 52.8 1.1 1.1 1.4 43.6
2003 (396) 1.5 42.9 [38.0 - 48.0] 55.6 1.5 0.8 1.0 41.22004 (400) 0.8 48.0 [43.0 - 53.0] 51.2 0.8 0.5 3.3 44.32005 (393) 2.0 46.6 [41.5 - 51.6] 51.4 2.0 2.8 43.82006 (418) 2.2 50.5 [45.6 - 55.4] 47.4 2.2 1.2 4.8 44.52007 (299) 2.3 40.5 [34.9 - 46.3] 57.2 2.3 2.3 38.12008 (306) 0.7 43.8 [38.2 - 49.6] 55.6 0.7 1.0 2.3 40.52009 (315) 1.3 41.6 [36.1 - 47.2] 57.1 1.3 1.0 2.2 38.42010 (357) 1.1 38.9 [33.8 - 44.2] 59.9 1.1 0.3 0.8 37.82011 (341) 1.2 40.8 [35.5 - 46.2] 58.1 1.2 2.1 38.72012 (386) 1.6 39.4 [34.5 - 44.4] 59.1 1.6 0.3 2.9 36.3
Table 29.1 MIC Distribution among Escherichia coli from Retail Chicken, 2002-2012 continuedDistribution (%) of MICs (µg/ml)4
67
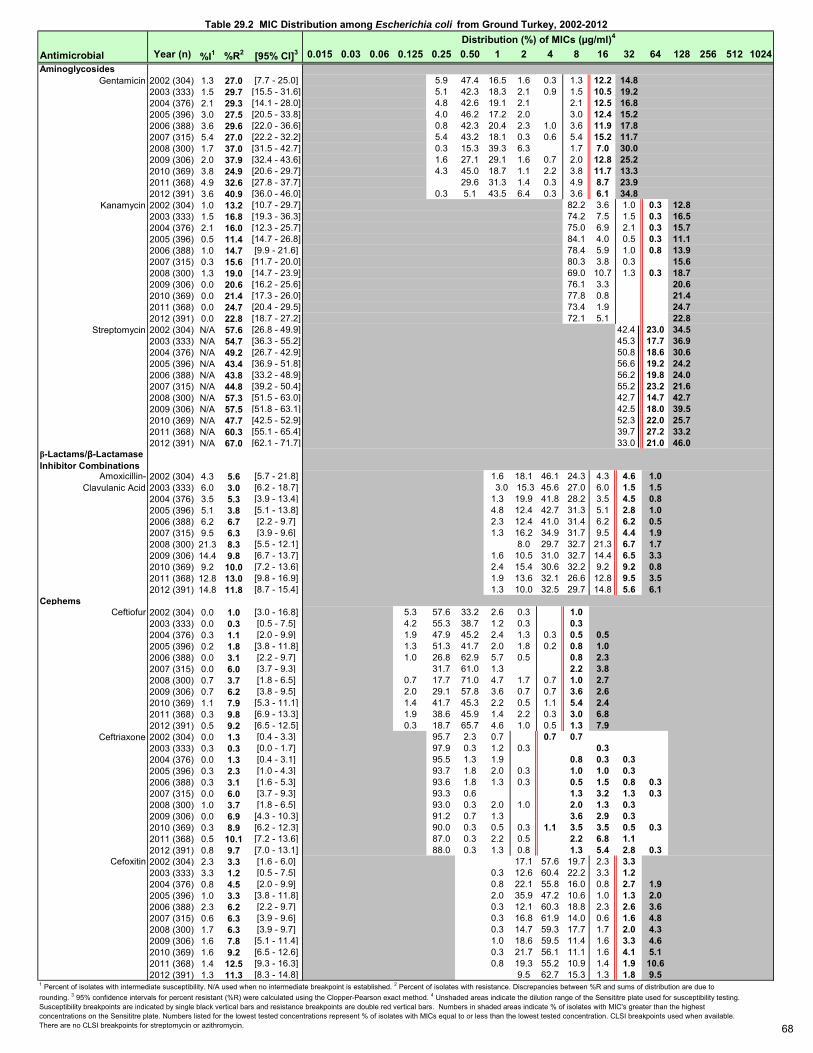
Antimicrobial Year (n) %I1 %R2 [95% CI]3 0.015 0.03 0.06 0.125 0.25 0.50 1 2 4 8 16 32 64 128 256 512 1024Aminoglycosides
Gentamicin 2002 (304) 1.3 27.0 [7.7 - 25.0] 5.9 47.4 16.5 1.6 0.3 1.3 12.2 14.82003 (333) 1.5 29.7 [15.5 - 31.6] 5.1 42.3 18.3 2.1 0.9 1.5 10.5 19.22004 (376) 2.1 29.3 [14.1 - 28.0] 4.8 42.6 19.1 2.1 2.1 12.5 16.82005 (396) 3.0 27.5 [20.5 - 33.8] 4.0 46.2 17.2 2.0 3.0 12.4 15.22006 (388) 3.6 29.6 [22.0 - 36.6] 0.8 42.3 20.4 2.3 1.0 3.6 11.9 17.82007 (315) 5.4 27.0 [22.2 - 32.2] 5.4 43.2 18.1 0.3 0.6 5.4 15.2 11.72008 (300) 1.7 37.0 [31.5 - 42.7] 0.3 15.3 39.3 6.3 1.7 7.0 30.02009 (306) 2.0 37.9 [32.4 - 43.6] 1.6 27.1 29.1 1.6 0.7 2.0 12.8 25.22010 (369) 3.8 24.9 [20.6 - 29.7] 4.3 45.0 18.7 1.1 2.2 3.8 11.7 13.32011 (368) 4.9 32.6 [27.8 - 37.7] 29.6 31.3 1.4 0.3 4.9 8.7 23.92012 (391) 3.6 40.9 [36.0 - 46.0] 0.3 5.1 43.5 6.4 0.3 3.6 6.1 34.8
Kanamycin 2002 (304) 1.0 13.2 [10.7 - 29.7] 82.2 3.6 1.0 0.3 12.82003 (333) 1.5 16.8 [19.3 - 36.3] 74.2 7.5 1.5 0.3 16.52004 (376) 2.1 16.0 [12.3 - 25.7] 75.0 6.9 2.1 0.3 15.72005 (396) 0.5 11.4 [14.7 - 26.8] 84.1 4.0 0.5 0.3 11.12006 (388) 1.0 14.7 [9.9 - 21.6] 78.4 5.9 1.0 0.8 13.92007 (315) 0.3 15.6 [11.7 - 20.0] 80.3 3.8 0.3 15.62008 (300) 1.3 19.0 [14.7 - 23.9] 69.0 10.7 1.3 0.3 18.72009 (306) 0.0 20.6 [16.2 - 25.6] 76.1 3.3 20.62010 (369) 0.0 21.4 [17.3 - 26.0] 77.8 0.8 21.42011 (368) 0.0 24.7 [20.4 - 29.5] 73.4 1.9 24.72012 (391) 0.0 22.8 [18.7 - 27.2] 72.1 5.1 22.8
Streptomycin 2002 (304) N/A 57.6 [26.8 - 49.9] 42.4 23.0 34.52003 (333) N/A 54.7 [36.3 - 55.2] 45.3 17.7 36.92004 (376) N/A 49.2 [26.7 - 42.9] 50.8 18.6 30.62005 (396) N/A 43.4 [36.9 - 51.8] 56.6 19.2 24.22006 (388) N/A 43.8 [33.2 - 48.9] 56.2 19.8 24.02007 (315) N/A 44.8 [39.2 - 50.4] 55.2 23.2 21.62008 (300) N/A 57.3 [51.5 - 63.0] 42.7 14.7 42.72009 (306) N/A 57.5 [51.8 - 63.1] 42.5 18.0 39.52010 (369) N/A 47.7 [42.5 - 52.9] 52.3 22.0 25.72011 (368) N/A 60.3 [55.1 - 65.4] 39.7 27.2 33.22012 (391) N/A 67.0 [62.1 - 71.7] 33.0 21.0 46.0
β-Lactams/β-Lactamase Inhibitor Combinations
Amoxicillin- 2002 (304) 4.3 5.6 [5.7 - 21.8] 1.6 18.1 46.1 24.3 4.3 4.6 1.0 Clavulanic Acid 2003 (333) 6.0 3.0 [6.2 - 18.7] 3.0 15.3 45.6 27.0 6.0 1.5 1.5
2004 (376) 3.5 5.3 [3.9 - 13.4] 1.3 19.9 41.8 28.2 3.5 4.5 0.82005 (396) 5.1 3.8 [5.1 - 13.8] 4.8 12.4 42.7 31.3 5.1 2.8 1.02006 (388) 6.2 6.7 [2.2 - 9.7] 2.3 12.4 41.0 31.4 6.2 6.2 0.52007 (315) 9.5 6.3 [3.9 - 9.6] 1.3 16.2 34.9 31.7 9.5 4.4 1.92008 (300) 21.3 8.3 [5.5 - 12.1] 8.0 29.7 32.7 21.3 6.7 1.72009 (306) 14.4 9.8 [6.7 - 13.7] 1.6 10.5 31.0 32.7 14.4 6.5 3.32010 (369) 9.2 10.0 [7.2 - 13.6] 2.4 15.4 30.6 32.2 9.2 9.2 0.82011 (368) 12.8 13.0 [9.8 - 16.9] 1.9 13.6 32.1 26.6 12.8 9.5 3.52012 (391) 14.8 11.8 [8.7 - 15.4] 1.3 10.0 32.5 29.7 14.8 5.6 6.1
Cephems Ceftiofur 2002 (304) 0.0 1.0 [3.0 - 16.8] 5.3 57.6 33.2 2.6 0.3 1.0
2003 (333) 0.0 0.3 [0.5 - 7.5] 4.2 55.3 38.7 1.2 0.3 0.32004 (376) 0.3 1.1 [2.0 - 9.9] 1.9 47.9 45.2 2.4 1.3 0.3 0.5 0.52005 (396) 0.2 1.8 [3.8 - 11.8] 1.3 51.3 41.7 2.0 1.8 0.2 0.8 1.02006 (388) 0.0 3.1 [2.2 - 9.7] 1.0 26.8 62.9 5.7 0.5 0.8 2.32007 (315) 0.0 6.0 [3.7 - 9.3] 31.7 61.0 1.3 2.2 3.82008 (300) 0.7 3.7 [1.8 - 6.5] 0.7 17.7 71.0 4.7 1.7 0.7 1.0 2.72009 (306) 0.7 6.2 [3.8 - 9.5] 2.0 29.1 57.8 3.6 0.7 0.7 3.6 2.62010 (369) 1.1 7.9 [5.3 - 11.1] 1.4 41.7 45.3 2.2 0.5 1.1 5.4 2.42011 (368) 0.3 9.8 [6.9 - 13.3] 1.9 38.6 45.9 1.4 2.2 0.3 3.0 6.82012 (391) 0.5 9.2 [6.5 - 12.5] 0.3 18.7 65.7 4.6 1.0 0.5 1.3 7.9
Ceftriaxone 2002 (304) 0.0 1.3 [0.4 - 3.3] 95.7 2.3 0.7 0.7 0.72003 (333) 0.3 0.3 [0.0 - 1.7] 97.9 0.3 1.2 0.3 0.32004 (376) 0.0 1.3 [0.4 - 3.1] 95.5 1.3 1.9 0.8 0.3 0.32005 (396) 0.3 2.3 [1.0 - 4.3] 93.7 1.8 2.0 0.3 1.0 1.0 0.32006 (388) 0.3 3.1 [1.6 - 5.3] 93.6 1.8 1.3 0.3 0.5 1.5 0.8 0.32007 (315) 0.0 6.0 [3.7 - 9.3] 93.3 0.6 1.3 3.2 1.3 0.32008 (300) 1.0 3.7 [1.8 - 6.5] 93.0 0.3 2.0 1.0 2.0 1.3 0.32009 (306) 0.0 6.9 [4.3 - 10.3] 91.2 0.7 1.3 3.6 2.9 0.32010 (369) 0.3 8.9 [6.2 - 12.3] 90.0 0.3 0.5 0.3 1.1 3.5 3.5 0.5 0.32011 (368) 0.5 10.1 [7.2 - 13.6] 87.0 0.3 2.2 0.5 2.2 6.8 1.12012 (391) 0.8 9.7 [7.0 - 13.1] 88.0 0.3 1.3 0.8 1.3 5.4 2.8 0.3
Cefoxitin 2002 (304) 2.3 3.3 [1.6 - 6.0] 17.1 57.6 19.7 2.3 3.32003 (333) 3.3 1.2 [0.5 - 7.5] 0.3 12.6 60.4 22.2 3.3 1.22004 (376) 0.8 4.5 [2.0 - 9.9] 0.8 22.1 55.8 16.0 0.8 2.7 1.92005 (396) 1.0 3.3 [3.8 - 11.8] 2.0 35.9 47.2 10.6 1.0 1.3 2.02006 (388) 2.3 6.2 [2.2 - 9.7] 0.3 12.1 60.3 18.8 2.3 2.6 3.62007 (315) 0.6 6.3 [3.9 - 9.6] 0.3 16.8 61.9 14.0 0.6 1.6 4.82008 (300) 1.7 6.3 [3.9 - 9.7] 0.3 14.7 59.3 17.7 1.7 2.0 4.32009 (306) 1.6 7.8 [5.1 - 11.4] 1.0 18.6 59.5 11.4 1.6 3.3 4.62010 (369) 1.6 9.2 [6.5 - 12.6] 0.3 21.7 56.1 11.1 1.6 4.1 5.12011 (368) 1.4 12.5 [9.3 - 16.3] 0.8 19.3 55.2 10.9 1.4 1.9 10.62012 (391) 1.3 11.3 [8.3 - 14.8] 9.5 62.7 15.3 1.3 1.8 9.5
Table 29.2 MIC Distribution among Escherichia coli from Ground Turkey, 2002-2012Distribution (%) of MICs (µg/ml)4
1 Percent of isolates with intermediate susceptibility. N/A used when no intermediate breakpoint is established. 2 Percent of isolates with resistance. Discrepancies between %R and sums of distribution are due to rounding. 3 95% confidence intervals for percent resistant (%R) were calculated using the Clopper-Pearson exact method. 4 Unshaded areas indicate the dilution range of the Sensititre plate used for susceptibility testing. Susceptibility breakpoints are indicated by single black vertical bars and resistance breakpoints are double red vertical bars. Numbers in shaded areas indicate % of isolates with MIC's greater than the highest concentrations on the Sensititre plate. Numbers listed for the lowest tested concentrations represent % of isolates with MICs equal to or less than the lowest tested concentration. CLSI breakpoints used when available. There are no CLSI breakpoints for streptomycin or azithromycin. 68
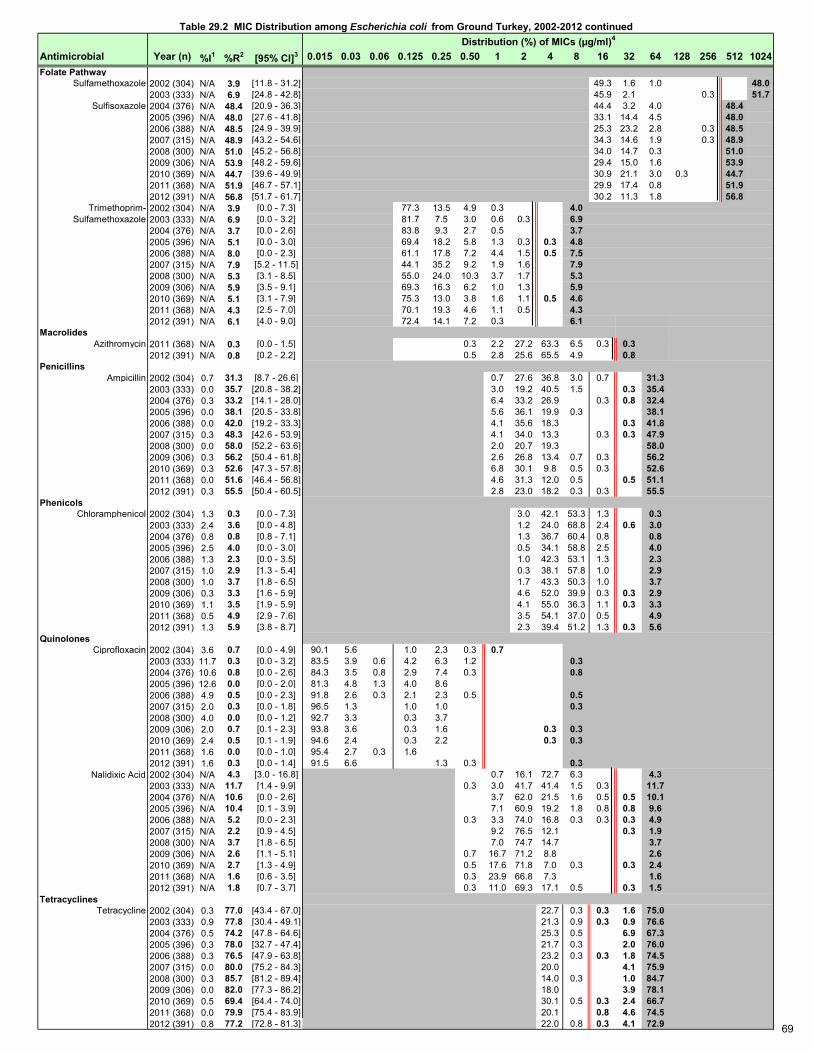
Antimicrobial Year (n) %I1 %R2 [95% CI]3 0.015 0.03 0.06 0.125 0.25 0.50 1 2 4 8 16 32 64 128 256 512 1024Folate Pathway
Sulfamethoxazole 2002 (304) N/A 3.9 [11.8 - 31.2] 49.3 1.6 1.0 48.02003 (333) N/A 6.9 [24.8 - 42.8] 45.9 2.1 0.3 51.7
Sulfisoxazole 2004 (376) N/A 48.4 [20.9 - 36.3] 44.4 3.2 4.0 48.42005 (396) N/A 48.0 [27.6 - 41.8] 33.1 14.4 4.5 48.02006 (388) N/A 48.5 [24.9 - 39.9] 25.3 23.2 2.8 0.3 48.52007 (315) N/A 48.9 [43.2 - 54.6] 34.3 14.6 1.9 0.3 48.92008 (300) N/A 51.0 [45.2 - 56.8] 34.0 14.7 0.3 51.02009 (306) N/A 53.9 [48.2 - 59.6] 29.4 15.0 1.6 53.92010 (369) N/A 44.7 [39.6 - 49.9] 30.9 21.1 3.0 0.3 44.72011 (368) N/A 51.9 [46.7 - 57.1] 29.9 17.4 0.8 51.92012 (391) N/A 56.8 [51.7 - 61.7] 30.2 11.3 1.8 56.8
Trimethoprim- 2002 (304) N/A 3.9 [0.0 - 7.3] 77.3 13.5 4.9 0.3 4.0 Sulfamethoxazole 2003 (333) N/A 6.9 [0.0 - 3.2] 81.7 7.5 3.0 0.6 0.3 6.9
2004 (376) N/A 3.7 [0.0 - 2.6] 83.8 9.3 2.7 0.5 3.72005 (396) N/A 5.1 [0.0 - 3.0] 69.4 18.2 5.8 1.3 0.3 0.3 4.82006 (388) N/A 8.0 [0.0 - 2.3] 61.1 17.8 7.2 4.4 1.5 0.5 7.52007 (315) N/A 7.9 [5.2 - 11.5] 44.1 35.2 9.2 1.9 1.6 7.92008 (300) N/A 5.3 [3.1 - 8.5] 55.0 24.0 10.3 3.7 1.7 5.32009 (306) N/A 5.9 [3.5 - 9.1] 69.3 16.3 6.2 1.0 1.3 5.92010 (369) N/A 5.1 [3.1 - 7.9] 75.3 13.0 3.8 1.6 1.1 0.5 4.62011 (368) N/A 4.3 [2.5 - 7.0] 70.1 19.3 4.6 1.1 0.5 4.32012 (391) N/A 6.1 [4.0 - 9.0] 72.4 14.1 7.2 0.3 6.1
Macrolides Azithromycin 2011 (368) N/A 0.3 [0.0 - 1.5] 0.3 2.2 27.2 63.3 6.5 0.3 0.3
2012 (391) N/A 0.8 [0.2 - 2.2] 0.5 2.8 25.6 65.5 4.9 0.8Penicillins
Ampicillin 2002 (304) 0.7 31.3 [8.7 - 26.6] 0.7 27.6 36.8 3.0 0.7 31.32003 (333) 0.0 35.7 [20.8 - 38.2] 3.0 19.2 40.5 1.5 0.3 35.42004 (376) 0.3 33.2 [14.1 - 28.0] 6.4 33.2 26.9 0.3 0.8 32.42005 (396) 0.0 38.1 [20.5 - 33.8] 5.6 36.1 19.9 0.3 38.12006 (388) 0.0 42.0 [19.2 - 33.3] 4.1 35.6 18.3 0.3 41.82007 (315) 0.3 48.3 [42.6 - 53.9] 4.1 34.0 13.3 0.3 0.3 47.92008 (300) 0.0 58.0 [52.2 - 63.6] 2.0 20.7 19.3 58.02009 (306) 0.3 56.2 [50.4 - 61.8] 2.6 26.8 13.4 0.7 0.3 56.22010 (369) 0.3 52.6 [47.3 - 57.8] 6.8 30.1 9.8 0.5 0.3 52.62011 (368) 0.0 51.6 [46.4 - 56.8] 4.6 31.3 12.0 0.5 0.5 51.12012 (391) 0.3 55.5 [50.4 - 60.5] 2.8 23.0 18.2 0.3 0.3 55.5
Phenicols Chloramphenicol 2002 (304) 1.3 0.3 [0.0 - 7.3] 3.0 42.1 53.3 1.3 0.3
2003 (333) 2.4 3.6 [0.0 - 4.8] 1.2 24.0 68.8 2.4 0.6 3.02004 (376) 0.8 0.8 [0.8 - 7.1] 1.3 36.7 60.4 0.8 0.82005 (396) 2.5 4.0 [0.0 - 3.0] 0.5 34.1 58.8 2.5 4.02006 (388) 1.3 2.3 [0.0 - 3.5] 1.0 42.3 53.1 1.3 2.32007 (315) 1.0 2.9 [1.3 - 5.4] 0.3 38.1 57.8 1.0 2.92008 (300) 1.0 3.7 [1.8 - 6.5] 1.7 43.3 50.3 1.0 3.72009 (306) 0.3 3.3 [1.6 - 5.9] 4.6 52.0 39.9 0.3 0.3 2.92010 (369) 1.1 3.5 [1.9 - 5.9] 4.1 55.0 36.3 1.1 0.3 3.32011 (368) 0.5 4.9 [2.9 - 7.6] 3.5 54.1 37.0 0.5 4.92012 (391) 1.3 5.9 [3.8 - 8.7] 2.3 39.4 51.2 1.3 0.3 5.6
Quinolones Ciprofloxacin 2002 (304) 3.6 0.7 [0.0 - 4.9] 90.1 5.6 1.0 2.3 0.3 0.7
2003 (333) 11.7 0.3 [0.0 - 3.2] 83.5 3.9 0.6 4.2 6.3 1.2 0.32004 (376) 10.6 0.8 [0.0 - 2.6] 84.3 3.5 0.8 2.9 7.4 0.3 0.82005 (396) 12.6 0.0 [0.0 - 2.0] 81.3 4.8 1.3 4.0 8.62006 (388) 4.9 0.5 [0.0 - 2.3] 91.8 2.6 0.3 2.1 2.3 0.5 0.52007 (315) 2.0 0.3 [0.0 - 1.8] 96.5 1.3 1.0 1.0 0.32008 (300) 4.0 0.0 [0.0 - 1.2] 92.7 3.3 0.3 3.72009 (306) 2.0 0.7 [0.1 - 2.3] 93.8 3.6 0.3 1.6 0.3 0.32010 (369) 2.4 0.5 [0.1 - 1.9] 94.6 2.4 0.3 2.2 0.3 0.32011 (368) 1.6 0.0 [0.0 - 1.0] 95.4 2.7 0.3 1.62012 (391) 1.6 0.3 [0.0 - 1.4] 91.5 6.6 1.3 0.3 0.3
Nalidixic Acid 2002 (304) N/A 4.3 [3.0 - 16.8] 0.7 16.1 72.7 6.3 4.32003 (333) N/A 11.7 [1.4 - 9.9] 0.3 3.0 41.7 41.4 1.5 0.3 11.72004 (376) N/A 10.6 [0.0 - 2.6] 3.7 62.0 21.5 1.6 0.5 0.5 10.12005 (396) N/A 10.4 [0.1 - 3.9] 7.1 60.9 19.2 1.8 0.8 0.8 9.62006 (388) N/A 5.2 [0.0 - 2.3] 0.3 3.3 74.0 16.8 0.3 0.3 0.3 4.92007 (315) N/A 2.2 [0.9 - 4.5] 9.2 76.5 12.1 0.3 1.92008 (300) N/A 3.7 [1.8 - 6.5] 7.0 74.7 14.7 3.72009 (306) N/A 2.6 [1.1 - 5.1] 0.7 16.7 71.2 8.8 2.62010 (369) N/A 2.7 [1.3 - 4.9] 0.5 17.6 71.8 7.0 0.3 0.3 2.42011 (368) N/A 1.6 [0.6 - 3.5] 0.3 23.9 66.8 7.3 1.62012 (391) N/A 1.8 [0.7 - 3.7] 0.3 11.0 69.3 17.1 0.5 0.3 1.5
Tetracyclines Tetracycline 2002 (304) 0.3 77.0 [43.4 - 67.0] 22.7 0.3 0.3 1.6 75.0
2003 (333) 0.9 77.8 [30.4 - 49.1] 21.3 0.9 0.3 0.9 76.62004 (376) 0.5 74.2 [47.8 - 64.6] 25.3 0.5 6.9 67.32005 (396) 0.3 78.0 [32.7 - 47.4] 21.7 0.3 2.0 76.02006 (388) 0.3 76.5 [47.9 - 63.8] 23.2 0.3 0.3 1.8 74.52007 (315) 0.0 80.0 [75.2 - 84.3] 20.0 4.1 75.92008 (300) 0.3 85.7 [81.2 - 89.4] 14.0 0.3 1.0 84.72009 (306) 0.0 82.0 [77.3 - 86.2] 18.0 3.9 78.12010 (369) 0.5 69.4 [64.4 - 74.0] 30.1 0.5 0.3 2.4 66.72011 (368) 0.0 79.9 [75.4 - 83.9] 20.1 0.8 4.6 74.52012 (391) 0.8 77.2 [72.8 - 81.3] 22.0 0.8 0.3 4.1 72.9
Table 29.2 MIC Distribution among Escherichia coli from Ground Turkey, 2002-2012 continuedDistribution (%) of MICs (µg/ml)4
69
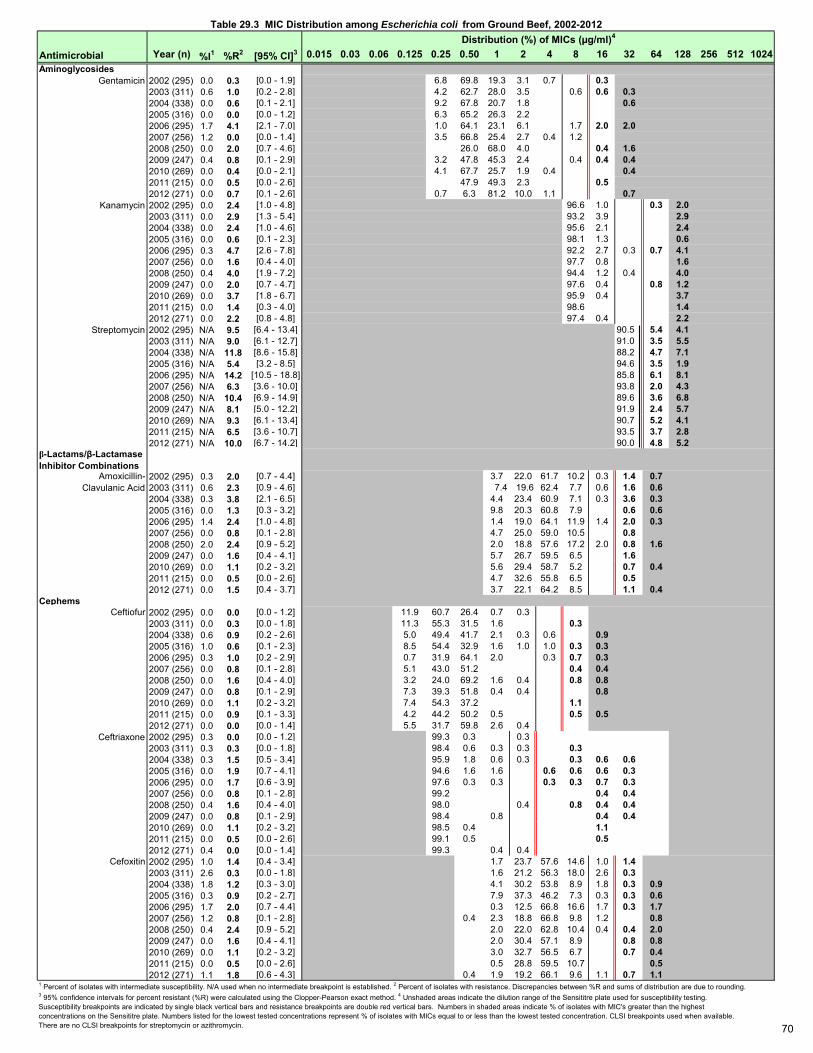
Antimicrobial Year (n) %I1 %R2 [95% CI]3 0.015 0.03 0.06 0.125 0.25 0.50 1 2 4 8 16 32 64 128 256 512 1024Aminoglycosides
Gentamicin 2002 (295) 0.0 0.3 [0.0 - 1.9] 6.8 69.8 19.3 3.1 0.7 0.32003 (311) 0.6 1.0 [0.2 - 2.8] 4.2 62.7 28.0 3.5 0.6 0.6 0.32004 (338) 0.0 0.6 [0.1 - 2.1] 9.2 67.8 20.7 1.8 0.62005 (316) 0.0 0.0 [0.0 - 1.2] 6.3 65.2 26.3 2.22006 (295) 1.7 4.1 [2.1 - 7.0] 1.0 64.1 23.1 6.1 1.7 2.0 2.02007 (256) 1.2 0.0 [0.0 - 1.4] 3.5 66.8 25.4 2.7 0.4 1.22008 (250) 0.0 2.0 [0.7 - 4.6] 26.0 68.0 4.0 0.4 1.62009 (247) 0.4 0.8 [0.1 - 2.9] 3.2 47.8 45.3 2.4 0.4 0.4 0.42010 (269) 0.0 0.4 [0.0 - 2.1] 4.1 67.7 25.7 1.9 0.4 0.42011 (215) 0.0 0.5 [0.0 - 2.6] 47.9 49.3 2.3 0.52012 (271) 0.0 0.7 [0.1 - 2.6] 0.7 6.3 81.2 10.0 1.1 0.7
Kanamycin 2002 (295) 0.0 2.4 [1.0 - 4.8] 96.6 1.0 0.3 2.02003 (311) 0.0 2.9 [1.3 - 5.4] 93.2 3.9 2.92004 (338) 0.0 2.4 [1.0 - 4.6] 95.6 2.1 2.42005 (316) 0.0 0.6 [0.1 - 2.3] 98.1 1.3 0.62006 (295) 0.3 4.7 [2.6 - 7.8] 92.2 2.7 0.3 0.7 4.12007 (256) 0.0 1.6 [0.4 - 4.0] 97.7 0.8 1.62008 (250) 0.4 4.0 [1.9 - 7.2] 94.4 1.2 0.4 4.02009 (247) 0.0 2.0 [0.7 - 4.7] 97.6 0.4 0.8 1.22010 (269) 0.0 3.7 [1.8 - 6.7] 95.9 0.4 3.72011 (215) 0.0 1.4 [0.3 - 4.0] 98.6 1.42012 (271) 0.0 2.2 [0.8 - 4.8] 97.4 0.4 2.2
Streptomycin 2002 (295) N/A 9.5 [6.4 - 13.4] 90.5 5.4 4.12003 (311) N/A 9.0 [6.1 - 12.7] 91.0 3.5 5.52004 (338) N/A 11.8 [8.6 - 15.8] 88.2 4.7 7.12005 (316) N/A 5.4 [3.2 - 8.5] 94.6 3.5 1.92006 (295) N/A 14.2 [10.5 - 18.8] 85.8 6.1 8.12007 (256) N/A 6.3 [3.6 - 10.0] 93.8 2.0 4.32008 (250) N/A 10.4 [6.9 - 14.9] 89.6 3.6 6.82009 (247) N/A 8.1 [5.0 - 12.2] 91.9 2.4 5.72010 (269) N/A 9.3 [6.1 - 13.4] 90.7 5.2 4.12011 (215) N/A 6.5 [3.6 - 10.7] 93.5 3.7 2.82012 (271) N/A 10.0 [6.7 - 14.2] 90.0 4.8 5.2
β-Lactams/β-Lactamase Inhibitor Combinations
Amoxicillin- 2002 (295) 0.3 2.0 [0.7 - 4.4] 3.7 22.0 61.7 10.2 0.3 1.4 0.7 Clavulanic Acid 2003 (311) 0.6 2.3 [0.9 - 4.6] 7.4 19.6 62.4 7.7 0.6 1.6 0.6
2004 (338) 0.3 3.8 [2.1 - 6.5] 4.4 23.4 60.9 7.1 0.3 3.6 0.32005 (316) 0.0 1.3 [0.3 - 3.2] 9.8 20.3 60.8 7.9 0.6 0.62006 (295) 1.4 2.4 [1.0 - 4.8] 1.4 19.0 64.1 11.9 1.4 2.0 0.32007 (256) 0.0 0.8 [0.1 - 2.8] 4.7 25.0 59.0 10.5 0.82008 (250) 2.0 2.4 [0.9 - 5.2] 2.0 18.8 57.6 17.2 2.0 0.8 1.62009 (247) 0.0 1.6 [0.4 - 4.1] 5.7 26.7 59.5 6.5 1.62010 (269) 0.0 1.1 [0.2 - 3.2] 5.6 29.4 58.7 5.2 0.7 0.42011 (215) 0.0 0.5 [0.0 - 2.6] 4.7 32.6 55.8 6.5 0.52012 (271) 0.0 1.5 [0.4 - 3.7] 3.7 22.1 64.2 8.5 1.1 0.4
Cephems Ceftiofur 2002 (295) 0.0 0.0 [0.0 - 1.2] 11.9 60.7 26.4 0.7 0.3
2003 (311) 0.0 0.3 [0.0 - 1.8] 11.3 55.3 31.5 1.6 0.32004 (338) 0.6 0.9 [0.2 - 2.6] 5.0 49.4 41.7 2.1 0.3 0.6 0.92005 (316) 1.0 0.6 [0.1 - 2.3] 8.5 54.4 32.9 1.6 1.0 1.0 0.3 0.32006 (295) 0.3 1.0 [0.2 - 2.9] 0.7 31.9 64.1 2.0 0.3 0.7 0.32007 (256) 0.0 0.8 [0.1 - 2.8] 5.1 43.0 51.2 0.4 0.42008 (250) 0.0 1.6 [0.4 - 4.0] 3.2 24.0 69.2 1.6 0.4 0.8 0.82009 (247) 0.0 0.8 [0.1 - 2.9] 7.3 39.3 51.8 0.4 0.4 0.82010 (269) 0.0 1.1 [0.2 - 3.2] 7.4 54.3 37.2 1.12011 (215) 0.0 0.9 [0.1 - 3.3] 4.2 44.2 50.2 0.5 0.5 0.52012 (271) 0.0 0.0 [0.0 - 1.4] 5.5 31.7 59.8 2.6 0.4
Ceftriaxone 2002 (295) 0.3 0.0 [0.0 - 1.2] 99.3 0.3 0.32003 (311) 0.3 0.3 [0.0 - 1.8] 98.4 0.6 0.3 0.3 0.32004 (338) 0.3 1.5 [0.5 - 3.4] 95.9 1.8 0.6 0.3 0.3 0.6 0.62005 (316) 0.0 1.9 [0.7 - 4.1] 94.6 1.6 1.6 0.6 0.6 0.6 0.32006 (295) 0.0 1.7 [0.6 - 3.9] 97.6 0.3 0.3 0.3 0.3 0.7 0.32007 (256) 0.0 0.8 [0.1 - 2.8] 99.2 0.4 0.42008 (250) 0.4 1.6 [0.4 - 4.0] 98.0 0.4 0.8 0.4 0.42009 (247) 0.0 0.8 [0.1 - 2.9] 98.4 0.8 0.4 0.42010 (269) 0.0 1.1 [0.2 - 3.2] 98.5 0.4 1.12011 (215) 0.0 0.5 [0.0 - 2.6] 99.1 0.5 0.52012 (271) 0.4 0.0 [0.0 - 1.4] 99.3 0.4 0.4
Cefoxitin 2002 (295) 1.0 1.4 [0.4 - 3.4] 1.7 23.7 57.6 14.6 1.0 1.42003 (311) 2.6 0.3 [0.0 - 1.8] 1.6 21.2 56.3 18.0 2.6 0.32004 (338) 1.8 1.2 [0.3 - 3.0] 4.1 30.2 53.8 8.9 1.8 0.3 0.92005 (316) 0.3 0.9 [0.2 - 2.7] 7.9 37.3 46.2 7.3 0.3 0.3 0.62006 (295) 1.7 2.0 [0.7 - 4.4] 0.3 12.5 66.8 16.6 1.7 0.3 1.72007 (256) 1.2 0.8 [0.1 - 2.8] 0.4 2.3 18.8 66.8 9.8 1.2 0.82008 (250) 0.4 2.4 [0.9 - 5.2] 2.0 22.0 62.8 10.4 0.4 0.4 2.02009 (247) 0.0 1.6 [0.4 - 4.1] 2.0 30.4 57.1 8.9 0.8 0.82010 (269) 0.0 1.1 [0.2 - 3.2] 3.0 32.7 56.5 6.7 0.7 0.42011 (215) 0.0 0.5 [0.0 - 2.6] 0.5 28.8 59.5 10.7 0.52012 (271) 1.1 1.8 [0.6 - 4.3] 0.4 1.9 19.2 66.1 9.6 1.1 0.7 1.1
Table 29.3 MIC Distribution among Escherichia coli from Ground Beef, 2002-2012Distribution (%) of MICs (µg/ml)4
1 Percent of isolates with intermediate susceptibility. N/A used when no intermediate breakpoint is established. 2 Percent of isolates with resistance. Discrepancies between %R and sums of distribution are due to rounding. 3 95% confidence intervals for percent resistant (%R) were calculated using the Clopper-Pearson exact method. 4 Unshaded areas indicate the dilution range of the Sensititre plate used for susceptibility testing. Susceptibility breakpoints are indicated by single black vertical bars and resistance breakpoints are double red vertical bars. Numbers in shaded areas indicate % of isolates with MIC's greater than the highest concentrations on the Sensititre plate. Numbers listed for the lowest tested concentrations represent % of isolates with MICs equal to or less than the lowest tested concentration. CLSI breakpoints used when available. There are no CLSI breakpoints for streptomycin or azithromycin. 70
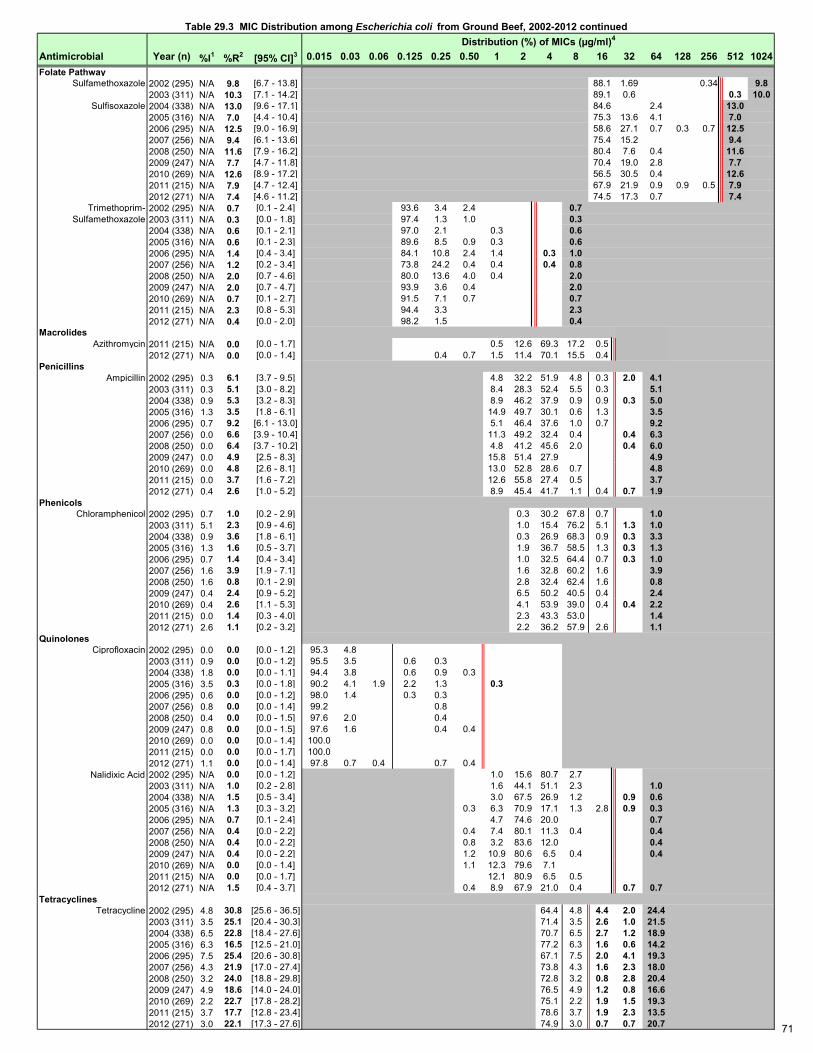
Antimicrobial Year (n) %I1 %R2 [95% CI]3 0.015 0.03 0.06 0.125 0.25 0.50 1 2 4 8 16 32 64 128 256 512 1024Folate Pathway
Sulfamethoxazole 2002 (295) N/A 9.8 [6.7 - 13.8] 88.1 1.69 0.34 9.82003 (311) N/A 10.3 [7.1 - 14.2] 89.1 0.6 0.3 10.0
Sulfisoxazole 2004 (338) N/A 13.0 [9.6 - 17.1] 84.6 2.4 13.02005 (316) N/A 7.0 [4.4 - 10.4] 75.3 13.6 4.1 7.02006 (295) N/A 12.5 [9.0 - 16.9] 58.6 27.1 0.7 0.3 0.7 12.52007 (256) N/A 9.4 [6.1 - 13.6] 75.4 15.2 9.42008 (250) N/A 11.6 [7.9 - 16.2] 80.4 7.6 0.4 11.62009 (247) N/A 7.7 [4.7 - 11.8] 70.4 19.0 2.8 7.72010 (269) N/A 12.6 [8.9 - 17.2] 56.5 30.5 0.4 12.62011 (215) N/A 7.9 [4.7 - 12.4] 67.9 21.9 0.9 0.9 0.5 7.92012 (271) N/A 7.4 [4.6 - 11.2] 74.5 17.3 0.7 7.4
Trimethoprim- 2002 (295) N/A 0.7 [0.1 - 2.4] 93.6 3.4 2.4 0.7 Sulfamethoxazole 2003 (311) N/A 0.3 [0.0 - 1.8] 97.4 1.3 1.0 0.3
2004 (338) N/A 0.6 [0.1 - 2.1] 97.0 2.1 0.3 0.62005 (316) N/A 0.6 [0.1 - 2.3] 89.6 8.5 0.9 0.3 0.62006 (295) N/A 1.4 [0.4 - 3.4] 84.1 10.8 2.4 1.4 0.3 1.02007 (256) N/A 1.2 [0.2 - 3.4] 73.8 24.2 0.4 0.4 0.4 0.82008 (250) N/A 2.0 [0.7 - 4.6] 80.0 13.6 4.0 0.4 2.02009 (247) N/A 2.0 [0.7 - 4.7] 93.9 3.6 0.4 2.02010 (269) N/A 0.7 [0.1 - 2.7] 91.5 7.1 0.7 0.72011 (215) N/A 2.3 [0.8 - 5.3] 94.4 3.3 2.32012 (271) N/A 0.4 [0.0 - 2.0] 98.2 1.5 0.4
Macrolides Azithromycin 2011 (215) N/A 0.0 [0.0 - 1.7] 0.5 12.6 69.3 17.2 0.5
2012 (271) N/A 0.0 [0.0 - 1.4] 0.4 0.7 1.5 11.4 70.1 15.5 0.4Penicillins
Ampicillin 2002 (295) 0.3 6.1 [3.7 - 9.5] 4.8 32.2 51.9 4.8 0.3 2.0 4.12003 (311) 0.3 5.1 [3.0 - 8.2] 8.4 28.3 52.4 5.5 0.3 5.12004 (338) 0.9 5.3 [3.2 - 8.3] 8.9 46.2 37.9 0.9 0.9 0.3 5.02005 (316) 1.3 3.5 [1.8 - 6.1] 14.9 49.7 30.1 0.6 1.3 3.52006 (295) 0.7 9.2 [6.1 - 13.0] 5.1 46.4 37.6 1.0 0.7 9.22007 (256) 0.0 6.6 [3.9 - 10.4] 11.3 49.2 32.4 0.4 0.4 6.32008 (250) 0.0 6.4 [3.7 - 10.2] 4.8 41.2 45.6 2.0 0.4 6.02009 (247) 0.0 4.9 [2.5 - 8.3] 15.8 51.4 27.9 4.92010 (269) 0.0 4.8 [2.6 - 8.1] 13.0 52.8 28.6 0.7 4.82011 (215) 0.0 3.7 [1.6 - 7.2] 12.6 55.8 27.4 0.5 3.72012 (271) 0.4 2.6 [1.0 - 5.2] 8.9 45.4 41.7 1.1 0.4 0.7 1.9
Phenicols Chloramphenicol 2002 (295) 0.7 1.0 [0.2 - 2.9] 0.3 30.2 67.8 0.7 1.0
2003 (311) 5.1 2.3 [0.9 - 4.6] 1.0 15.4 76.2 5.1 1.3 1.02004 (338) 0.9 3.6 [1.8 - 6.1] 0.3 26.9 68.3 0.9 0.3 3.32005 (316) 1.3 1.6 [0.5 - 3.7] 1.9 36.7 58.5 1.3 0.3 1.32006 (295) 0.7 1.4 [0.4 - 3.4] 1.0 32.5 64.4 0.7 0.3 1.02007 (256) 1.6 3.9 [1.9 - 7.1] 1.6 32.8 60.2 1.6 3.92008 (250) 1.6 0.8 [0.1 - 2.9] 2.8 32.4 62.4 1.6 0.82009 (247) 0.4 2.4 [0.9 - 5.2] 6.5 50.2 40.5 0.4 2.42010 (269) 0.4 2.6 [1.1 - 5.3] 4.1 53.9 39.0 0.4 0.4 2.22011 (215) 0.0 1.4 [0.3 - 4.0] 2.3 43.3 53.0 1.42012 (271) 2.6 1.1 [0.2 - 3.2] 2.2 36.2 57.9 2.6 1.1
Quinolones Ciprofloxacin 2002 (295) 0.0 0.0 [0.0 - 1.2] 95.3 4.8
2003 (311) 0.9 0.0 [0.0 - 1.2] 95.5 3.5 0.6 0.32004 (338) 1.8 0.0 [0.0 - 1.1] 94.4 3.8 0.6 0.9 0.32005 (316) 3.5 0.3 [0.0 - 1.8] 90.2 4.1 1.9 2.2 1.3 0.32006 (295) 0.6 0.0 [0.0 - 1.2] 98.0 1.4 0.3 0.32007 (256) 0.8 0.0 [0.0 - 1.4] 99.2 0.82008 (250) 0.4 0.0 [0.0 - 1.5] 97.6 2.0 0.42009 (247) 0.8 0.0 [0.0 - 1.5] 97.6 1.6 0.4 0.42010 (269) 0.0 0.0 [0.0 - 1.4] 100.02011 (215) 0.0 0.0 [0.0 - 1.7] 100.02012 (271) 1.1 0.0 [0.0 - 1.4] 97.8 0.7 0.4 0.7 0.4
Nalidixic Acid 2002 (295) N/A 0.0 [0.0 - 1.2] 1.0 15.6 80.7 2.72003 (311) N/A 1.0 [0.2 - 2.8] 1.6 44.1 51.1 2.3 1.02004 (338) N/A 1.5 [0.5 - 3.4] 3.0 67.5 26.9 1.2 0.9 0.62005 (316) N/A 1.3 [0.3 - 3.2] 0.3 6.3 70.9 17.1 1.3 2.8 0.9 0.32006 (295) N/A 0.7 [0.1 - 2.4] 4.7 74.6 20.0 0.72007 (256) N/A 0.4 [0.0 - 2.2] 0.4 7.4 80.1 11.3 0.4 0.42008 (250) N/A 0.4 [0.0 - 2.2] 0.8 3.2 83.6 12.0 0.42009 (247) N/A 0.4 [0.0 - 2.2] 1.2 10.9 80.6 6.5 0.4 0.42010 (269) N/A 0.0 [0.0 - 1.4] 1.1 12.3 79.6 7.12011 (215) N/A 0.0 [0.0 - 1.7] 12.1 80.9 6.5 0.52012 (271) N/A 1.5 [0.4 - 3.7] 0.4 8.9 67.9 21.0 0.4 0.7 0.7
Tetracyclines Tetracycline 2002 (295) 4.8 30.8 [25.6 - 36.5] 64.4 4.8 4.4 2.0 24.4
2003 (311) 3.5 25.1 [20.4 - 30.3] 71.4 3.5 2.6 1.0 21.52004 (338) 6.5 22.8 [18.4 - 27.6] 70.7 6.5 2.7 1.2 18.92005 (316) 6.3 16.5 [12.5 - 21.0] 77.2 6.3 1.6 0.6 14.22006 (295) 7.5 25.4 [20.6 - 30.8] 67.1 7.5 2.0 4.1 19.32007 (256) 4.3 21.9 [17.0 - 27.4] 73.8 4.3 1.6 2.3 18.02008 (250) 3.2 24.0 [18.8 - 29.8] 72.8 3.2 0.8 2.8 20.42009 (247) 4.9 18.6 [14.0 - 24.0] 76.5 4.9 1.2 0.8 16.62010 (269) 2.2 22.7 [17.8 - 28.2] 75.1 2.2 1.9 1.5 19.32011 (215) 3.7 17.7 [12.8 - 23.4] 78.6 3.7 1.9 2.3 13.52012 (271) 3.0 22.1 [17.3 - 27.6] 74.9 3.0 0.7 0.7 20.7
Table 29.3 MIC Distribution among Escherichia coli from Ground Beef, 2002-2012 continuedDistribution (%) of MICs (µg/ml)4
71
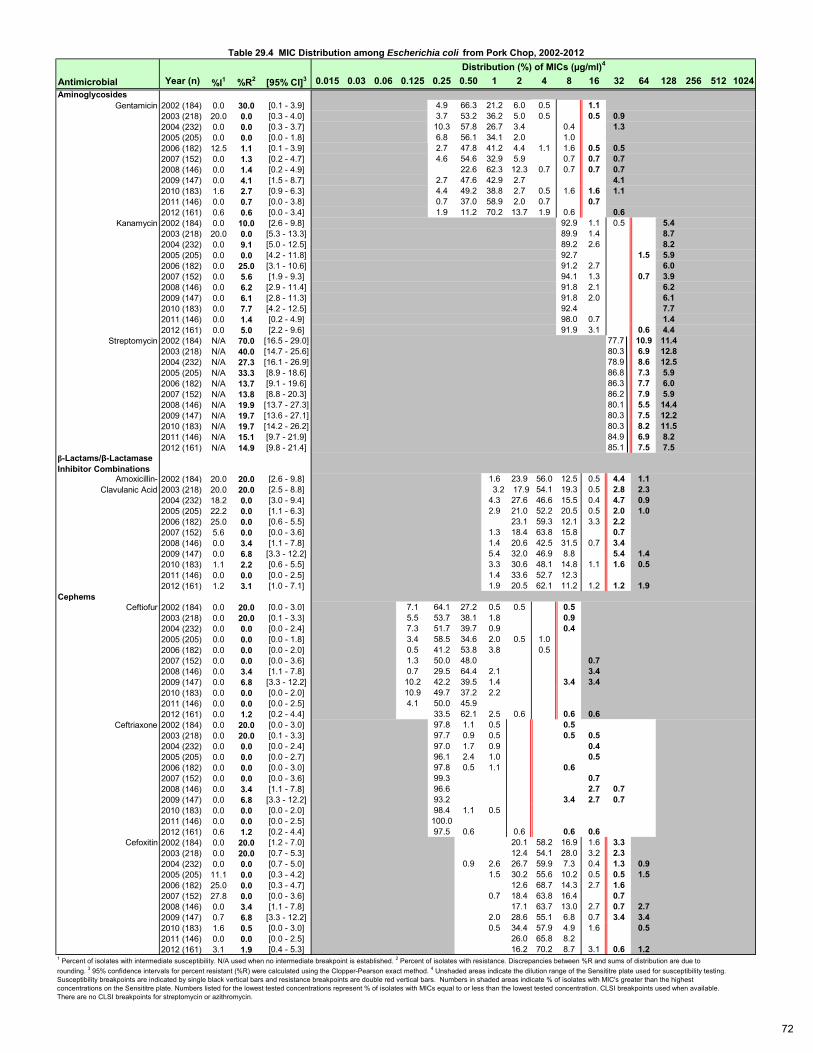
Antimicrobial Year (n) %I1 %R2 [95% CI]3 0.015 0.03 0.06 0.125 0.25 0.50 1 2 4 8 16 32 64 128 256 512 1024Aminoglycosides
Gentamicin 2002 (184) 0.0 30.0 [0.1 - 3.9] 4.9 66.3 21.2 6.0 0.5 1.12003 (218) 20.0 0.0 [0.3 - 4.0] 3.7 53.2 36.2 5.0 0.5 0.5 0.92004 (232) 0.0 0.0 [0.3 - 3.7] 10.3 57.8 26.7 3.4 0.4 1.32005 (205) 0.0 0.0 [0.0 - 1.8] 6.8 56.1 34.1 2.0 1.02006 (182) 12.5 1.1 [0.1 - 3.9] 2.7 47.8 41.2 4.4 1.1 1.6 0.5 0.52007 (152) 0.0 1.3 [0.2 - 4.7] 4.6 54.6 32.9 5.9 0.7 0.7 0.72008 (146) 0.0 1.4 [0.2 - 4.9] 22.6 62.3 12.3 0.7 0.7 0.7 0.72009 (147) 0.0 4.1 [1.5 - 8.7] 2.7 47.6 42.9 2.7 4.12010 (183) 1.6 2.7 [0.9 - 6.3] 4.4 49.2 38.8 2.7 0.5 1.6 1.6 1.12011 (146) 0.0 0.7 [0.0 - 3.8] 0.7 37.0 58.9 2.0 0.7 0.72012 (161) 0.6 0.6 [0.0 - 3.4] 1.9 11.2 70.2 13.7 1.9 0.6 0.6
Kanamycin 2002 (184) 0.0 10.0 [2.6 - 9.8] 92.9 1.1 0.5 5.42003 (218) 20.0 0.0 [5.3 - 13.3] 89.9 1.4 8.72004 (232) 0.0 9.1 [5.0 - 12.5] 89.2 2.6 8.22005 (205) 0.0 0.0 [4.2 - 11.8] 92.7 1.5 5.92006 (182) 0.0 25.0 [3.1 - 10.6] 91.2 2.7 6.02007 (152) 0.0 5.6 [1.9 - 9.3] 94.1 1.3 0.7 3.92008 (146) 0.0 6.2 [2.9 - 11.4] 91.8 2.1 6.22009 (147) 0.0 6.1 [2.8 - 11.3] 91.8 2.0 6.12010 (183) 0.0 7.7 [4.2 - 12.5] 92.4 7.72011 (146) 0.0 1.4 [0.2 - 4.9] 98.0 0.7 1.42012 (161) 0.0 5.0 [2.2 - 9.6] 91.9 3.1 0.6 4.4
Streptomycin 2002 (184) N/A 70.0 [16.5 - 29.0] 77.7 10.9 11.42003 (218) N/A 40.0 [14.7 - 25.6] 80.3 6.9 12.82004 (232) N/A 27.3 [16.1 - 26.9] 78.9 8.6 12.52005 (205) N/A 33.3 [8.9 - 18.6] 86.8 7.3 5.92006 (182) N/A 13.7 [9.1 - 19.6] 86.3 7.7 6.02007 (152) N/A 13.8 [8.8 - 20.3] 86.2 7.9 5.92008 (146) N/A 19.9 [13.7 - 27.3] 80.1 5.5 14.42009 (147) N/A 19.7 [13.6 - 27.1] 80.3 7.5 12.22010 (183) N/A 19.7 [14.2 - 26.2] 80.3 8.2 11.52011 (146) N/A 15.1 [9.7 - 21.9] 84.9 6.9 8.22012 (161) N/A 14.9 [9.8 - 21.4] 85.1 7.5 7.5
β-Lactams/β-Lactamase Inhibitor Combinations
Amoxicillin- 2002 (184) 20.0 20.0 [2.6 - 9.8] 1.6 23.9 56.0 12.5 0.5 4.4 1.1 Clavulanic Acid 2003 (218) 20.0 20.0 [2.5 - 8.8] 3.2 17.9 54.1 19.3 0.5 2.8 2.3
2004 (232) 18.2 0.0 [3.0 - 9.4] 4.3 27.6 46.6 15.5 0.4 4.7 0.92005 (205) 22.2 0.0 [1.1 - 6.3] 2.9 21.0 52.2 20.5 0.5 2.0 1.02006 (182) 25.0 0.0 [0.6 - 5.5] 23.1 59.3 12.1 3.3 2.22007 (152) 5.6 0.0 [0.0 - 3.6] 1.3 18.4 63.8 15.8 0.72008 (146) 0.0 3.4 [1.1 - 7.8] 1.4 20.6 42.5 31.5 0.7 3.42009 (147) 0.0 6.8 [3.3 - 12.2] 5.4 32.0 46.9 8.8 5.4 1.42010 (183) 1.1 2.2 [0.6 - 5.5] 3.3 30.6 48.1 14.8 1.1 1.6 0.52011 (146) 0.0 0.0 [0.0 - 2.5] 1.4 33.6 52.7 12.32012 (161) 1.2 3.1 [1.0 - 7.1] 1.9 20.5 62.1 11.2 1.2 1.2 1.9
Cephems Ceftiofur 2002 (184) 0.0 20.0 [0.0 - 3.0] 7.1 64.1 27.2 0.5 0.5 0.5
2003 (218) 0.0 20.0 [0.1 - 3.3] 5.5 53.7 38.1 1.8 0.92004 (232) 0.0 0.0 [0.0 - 2.4] 7.3 51.7 39.7 0.9 0.42005 (205) 0.0 0.0 [0.0 - 1.8] 3.4 58.5 34.6 2.0 0.5 1.02006 (182) 0.0 0.0 [0.0 - 2.0] 0.5 41.2 53.8 3.8 0.52007 (152) 0.0 0.0 [0.0 - 3.6] 1.3 50.0 48.0 0.72008 (146) 0.0 3.4 [1.1 - 7.8] 0.7 29.5 64.4 2.1 3.42009 (147) 0.0 6.8 [3.3 - 12.2] 10.2 42.2 39.5 1.4 3.4 3.42010 (183) 0.0 0.0 [0.0 - 2.0] 10.9 49.7 37.2 2.22011 (146) 0.0 0.0 [0.0 - 2.5] 4.1 50.0 45.92012 (161) 0.0 1.2 [0.2 - 4.4] 33.5 62.1 2.5 0.6 0.6 0.6
Ceftriaxone 2002 (184) 0.0 20.0 [0.0 - 3.0] 97.8 1.1 0.5 0.52003 (218) 0.0 20.0 [0.1 - 3.3] 97.7 0.9 0.5 0.5 0.52004 (232) 0.0 0.0 [0.0 - 2.4] 97.0 1.7 0.9 0.42005 (205) 0.0 0.0 [0.0 - 2.7] 96.1 2.4 1.0 0.52006 (182) 0.0 0.0 [0.0 - 3.0] 97.8 0.5 1.1 0.62007 (152) 0.0 0.0 [0.0 - 3.6] 99.3 0.72008 (146) 0.0 3.4 [1.1 - 7.8] 96.6 2.7 0.72009 (147) 0.0 6.8 [3.3 - 12.2] 93.2 3.4 2.7 0.72010 (183) 0.0 0.0 [0.0 - 2.0] 98.4 1.1 0.52011 (146) 0.0 0.0 [0.0 - 2.5] 100.02012 (161) 0.6 1.2 [0.2 - 4.4] 97.5 0.6 0.6 0.6 0.6
Cefoxitin 2002 (184) 0.0 20.0 [1.2 - 7.0] 20.1 58.2 16.9 1.6 3.32003 (218) 0.0 20.0 [0.7 - 5.3] 12.4 54.1 28.0 3.2 2.32004 (232) 0.0 0.0 [0.7 - 5.0] 0.9 2.6 26.7 59.9 7.3 0.4 1.3 0.92005 (205) 11.1 0.0 [0.3 - 4.2] 1.5 30.2 55.6 10.2 0.5 0.5 1.52006 (182) 25.0 0.0 [0.3 - 4.7] 12.6 68.7 14.3 2.7 1.62007 (152) 27.8 0.0 [0.0 - 3.6] 0.7 18.4 63.8 16.4 0.72008 (146) 0.0 3.4 [1.1 - 7.8] 17.1 63.7 13.0 2.7 0.7 2.72009 (147) 0.7 6.8 [3.3 - 12.2] 2.0 28.6 55.1 6.8 0.7 3.4 3.42010 (183) 1.6 0.5 [0.0 - 3.0] 0.5 34.4 57.9 4.9 1.6 0.52011 (146) 0.0 0.0 [0.0 - 2.5] 26.0 65.8 8.22012 (161) 3.1 1.9 [0.4 - 5.3] 16.2 70.2 8.7 3.1 0.6 1.2
Table 29.4 MIC Distribution among Escherichia coli from Pork Chop, 2002-2012Distribution (%) of MICs (µg/ml)4
1 Percent of isolates with intermediate susceptibility. N/A used when no intermediate breakpoint is established. 2 Percent of isolates with resistance. Discrepancies between %R and sums of distribution are due to rounding. 3 95% confidence intervals for percent resistant (%R) were calculated using the Clopper-Pearson exact method. 4 Unshaded areas indicate the dilution range of the Sensititre plate used for susceptibility testing. Susceptibility breakpoints are indicated by single black vertical bars and resistance breakpoints are double red vertical bars. Numbers in shaded areas indicate % of isolates with MIC's greater than the highest concentrations on the Sensititre plate. Numbers listed for the lowest tested concentrations represent % of isolates with MICs equal to or less than the lowest tested concentration. CLSI breakpoints used when available. There are no CLSI breakpoints for streptomycin or azithromycin.
72
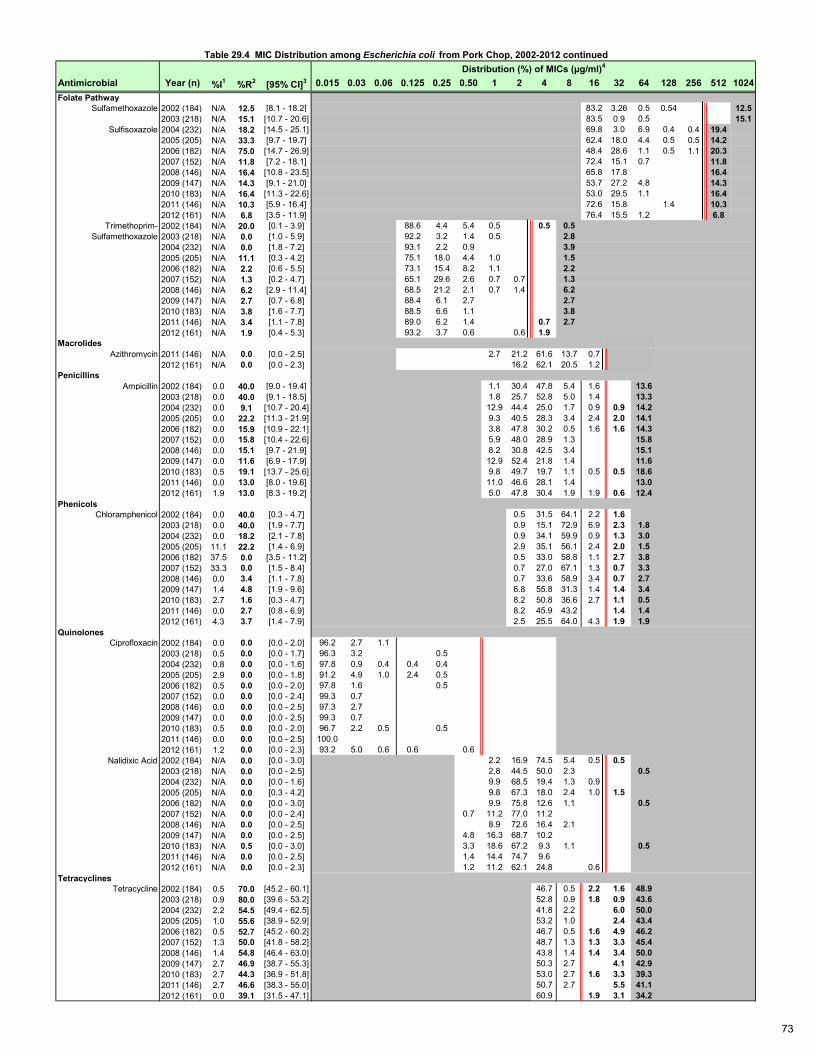
Antimicrobial Year (n) %I1 %R2 [95% CI]3 0.015 0.03 0.06 0.125 0.25 0.50 1 2 4 8 16 32 64 128 256 512 1024Folate Pathway
Sulfamethoxazole 2002 (184) N/A 12.5 [8.1 - 18.2] 83.2 3.26 0.5 0.54 12.52003 (218) N/A 15.1 [10.7 - 20.6] 83.5 0.9 0.5 15.1
Sulfisoxazole 2004 (232) N/A 18.2 [14.5 - 25.1] 69.8 3.0 6.9 0.4 0.4 19.42005 (205) N/A 33.3 [9.7 - 19.7] 62.4 18.0 4.4 0.5 0.5 14.22006 (182) N/A 75.0 [14.7 - 26.9] 48.4 28.6 1.1 0.5 1.1 20.32007 (152) N/A 11.8 [7.2 - 18.1] 72.4 15.1 0.7 11.82008 (146) N/A 16.4 [10.8 - 23.5] 65.8 17.8 16.42009 (147) N/A 14.3 [9.1 - 21.0] 53.7 27.2 4.8 14.32010 (183) N/A 16.4 [11.3 - 22.6] 53.0 29.5 1.1 16.42011 (146) N/A 10.3 [5.9 - 16.4] 72.6 15.8 1.4 10.32012 (161) N/A 6.8 [3.5 - 11.9] 76.4 15.5 1.2 6.8
Trimethoprim- 2002 (184) N/A 20.0 [0.1 - 3.9] 88.6 4.4 5.4 0.5 0.5 0.5 Sulfamethoxazole 2003 (218) N/A 0.0 [1.0 - 5.9] 92.2 3.2 1.4 0.5 2.8
2004 (232) N/A 0.0 [1.8 - 7.2] 93.1 2.2 0.9 3.92005 (205) N/A 11.1 [0.3 - 4.2] 75.1 18.0 4.4 1.0 1.52006 (182) N/A 2.2 [0.6 - 5.5] 73.1 15.4 8.2 1.1 2.22007 (152) N/A 1.3 [0.2 - 4.7] 65.1 29.6 2.6 0.7 0.7 1.32008 (146) N/A 6.2 [2.9 - 11.4] 68.5 21.2 2.1 0.7 1.4 6.22009 (147) N/A 2.7 [0.7 - 6.8] 88.4 6.1 2.7 2.72010 (183) N/A 3.8 [1.6 - 7.7] 88.5 6.6 1.1 3.82011 (146) N/A 3.4 [1.1 - 7.8] 89.0 6.2 1.4 0.7 2.72012 (161) N/A 1.9 [0.4 - 5.3] 93.2 3.7 0.6 0.6 1.9
Macrolides Azithromycin 2011 (146) N/A 0.0 [0.0 - 2.5] 2.7 21.2 61.6 13.7 0.7
2012 (161) N/A 0.0 [0.0 - 2.3] 16.2 62.1 20.5 1.2Penicillins
Ampicillin 2002 (184) 0.0 40.0 [9.0 - 19.4] 1.1 30.4 47.8 5.4 1.6 13.62003 (218) 0.0 40.0 [9.1 - 18.5] 1.8 25.7 52.8 5.0 1.4 13.32004 (232) 0.0 9.1 [10.7 - 20.4] 12.9 44.4 25.0 1.7 0.9 0.9 14.22005 (205) 0.0 22.2 [11.3 - 21.9] 9.3 40.5 28.3 3.4 2.4 2.0 14.12006 (182) 0.0 15.9 [10.9 - 22.1] 3.8 47.8 30.2 0.5 1.6 1.6 14.32007 (152) 0.0 15.8 [10.4 - 22.6] 5.9 48.0 28.9 1.3 15.82008 (146) 0.0 15.1 [9.7 - 21.9] 8.2 30.8 42.5 3.4 15.12009 (147) 0.0 11.6 [6.9 - 17.9] 12.9 52.4 21.8 1.4 11.62010 (183) 0.5 19.1 [13.7 - 25.6] 9.8 49.7 19.7 1.1 0.5 0.5 18.62011 (146) 0.0 13.0 [8.0 - 19.6] 11.0 46.6 28.1 1.4 13.02012 (161) 1.9 13.0 [8.3 - 19.2] 5.0 47.8 30.4 1.9 1.9 0.6 12.4
Phenicols Chloramphenicol 2002 (184) 0.0 40.0 [0.3 - 4.7] 0.5 31.5 64.1 2.2 1.6
2003 (218) 0.0 40.0 [1.9 - 7.7] 0.9 15.1 72.9 6.9 2.3 1.82004 (232) 0.0 18.2 [2.1 - 7.8] 0.9 34.1 59.9 0.9 1.3 3.02005 (205) 11.1 22.2 [1.4 - 6.9] 2.9 35.1 56.1 2.4 2.0 1.52006 (182) 37.5 0.0 [3.5 - 11.2] 0.5 33.0 58.8 1.1 2.7 3.82007 (152) 33.3 0.0 [1.5 - 8.4] 0.7 27.0 67.1 1.3 0.7 3.32008 (146) 0.0 3.4 [1.1 - 7.8] 0.7 33.6 58.9 3.4 0.7 2.72009 (147) 1.4 4.8 [1.9 - 9.6] 6.8 55.8 31.3 1.4 1.4 3.42010 (183) 2.7 1.6 [0.3 - 4.7] 8.2 50.8 36.6 2.7 1.1 0.52011 (146) 0.0 2.7 [0.8 - 6.9] 8.2 45.9 43.2 1.4 1.42012 (161) 4.3 3.7 [1.4 - 7.9] 2.5 25.5 64.0 4.3 1.9 1.9
Quinolones Ciprofloxacin 2002 (184) 0.0 0.0 [0.0 - 2.0] 96.2 2.7 1.1
2003 (218) 0.5 0.0 [0.0 - 1.7] 96.3 3.2 0.52004 (232) 0.8 0.0 [0.0 - 1.6] 97.8 0.9 0.4 0.4 0.42005 (205) 2.9 0.0 [0.0 - 1.8] 91.2 4.9 1.0 2.4 0.52006 (182) 0.5 0.0 [0.0 - 2.0] 97.8 1.6 0.52007 (152) 0.0 0.0 [0.0 - 2.4] 99.3 0.72008 (146) 0.0 0.0 [0.0 - 2.5] 97.3 2.72009 (147) 0.0 0.0 [0.0 - 2.5] 99.3 0.72010 (183) 0.5 0.0 [0.0 - 2.0] 96.7 2.2 0.5 0.52011 (146) 0.0 0.0 [0.0 - 2.5] 100.02012 (161) 1.2 0.0 [0.0 - 2.3] 93.2 5.0 0.6 0.6 0.6
Nalidixic Acid 2002 (184) N/A 0.0 [0.0 - 3.0] 2.2 16.9 74.5 5.4 0.5 0.52003 (218) N/A 0.0 [0.0 - 2.5] 2.8 44.5 50.0 2.3 0.52004 (232) N/A 0.0 [0.0 - 1.6] 9.9 68.5 19.4 1.3 0.92005 (205) N/A 0.0 [0.3 - 4.2] 9.8 67.3 18.0 2.4 1.0 1.52006 (182) N/A 0.0 [0.0 - 3.0] 9.9 75.8 12.6 1.1 0.52007 (152) N/A 0.0 [0.0 - 2.4] 0.7 11.2 77.0 11.22008 (146) N/A 0.0 [0.0 - 2.5] 8.9 72.6 16.4 2.12009 (147) N/A 0.0 [0.0 - 2.5] 4.8 16.3 68.7 10.22010 (183) N/A 0.5 [0.0 - 3.0] 3.3 18.6 67.2 9.3 1.1 0.52011 (146) N/A 0.0 [0.0 - 2.5] 1.4 14.4 74.7 9.62012 (161) N/A 0.0 [0.0 - 2.3] 1.2 11.2 62.1 24.8 0.6
Tetracyclines Tetracycline 2002 (184) 0.5 70.0 [45.2 - 60.1] 46.7 0.5 2.2 1.6 48.9
2003 (218) 0.9 80.0 [39.6 - 53.2] 52.8 0.9 1.8 0.9 43.62004 (232) 2.2 54.5 [49.4 - 62.5] 41.8 2.2 6.0 50.02005 (205) 1.0 55.6 [38.9 - 52.9] 53.2 1.0 2.4 43.42006 (182) 0.5 52.7 [45.2 - 60.2] 46.7 0.5 1.6 4.9 46.22007 (152) 1.3 50.0 [41.8 - 58.2] 48.7 1.3 1.3 3.3 45.42008 (146) 1.4 54.8 [46.4 - 63.0] 43.8 1.4 1.4 3.4 50.02009 (147) 2.7 46.9 [38.7 - 55.3] 50.3 2.7 4.1 42.92010 (183) 2.7 44.3 [36.9 - 51.8] 53.0 2.7 1.6 3.3 39.32011 (146) 2.7 46.6 [38.3 - 55.0] 50.7 2.7 5.5 41.12012 (161) 0.0 39.1 [31.5 - 47.1] 60.9 1.9 3.1 34.2
Table 29.4 MIC Distribution among Escherichia coli from Pork Chop, 2002-2012 continuedDistribution (%) of MICs (µg/ml)4
73
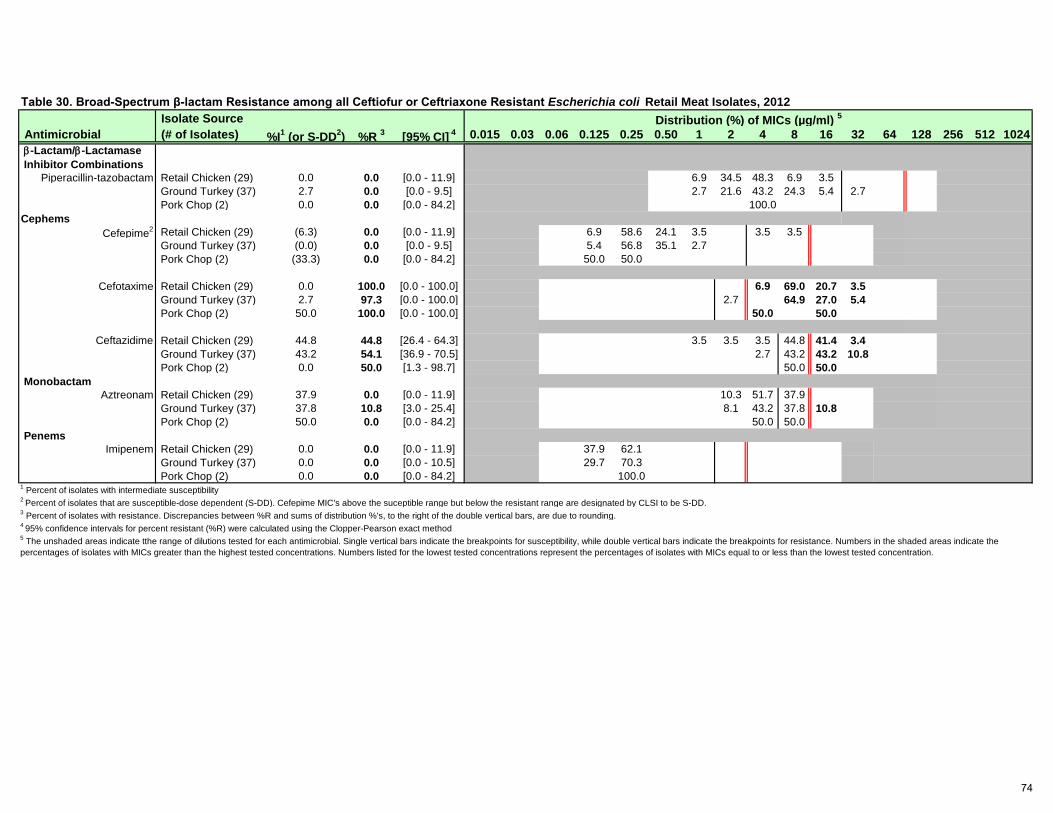
Isolate Source Antimicrobial (# of Isolates) %I1 (or S-DD2) %R 3 [95% CI] 4 0.015 0.03 0.06 0.125 0.25 0.50 1 2 4 8 16 32 64 128 256 512 1024 β-Lactam/β-Lactamase Inhibitor Combinations
Piperacillin-tazobactam Retail Chicken (29) 0.0 0.0 [0.0 - 11.9] 6.9 34.5 48.3 6.9 3.5 Ground Turkey (37) 2.7 0.0 [0.0 - 9.5] 2.7 21.6 43.2 24.3 5.4 2.7 Pork Chop (2) 0.0 0.0 [0.0 - 84.2] 100.0
Cephems Cefepime2 Retail Chicken (29) (6.3) 0.0 [0.0 - 11.9] 6.9 58.6 24.1 3.5 3.5 3.5
Ground Turkey (37) (0.0) 0.0 [0.0 - 9.5] 5.4 56.8 35.1 2.7 Pork Chop (2) (33.3) 0.0 [0.0 - 84.2] 50.0 50.0
Cefotaxime Retail Chicken (29) 0.0 100.0 [0.0 - 100.0] 6.9 69.0 20.7 3.5 Ground Turkey (37) 2.7 97.3 [0.0 - 100.0] 2.7 64.9 27.0 5.4 Pork Chop (2) 50.0 100.0 [0.0 - 100.0] 50.0 50.0
Ceftazidime Retail Chicken (29) 44.8 44.8 [26.4 - 64.3] 3.5 3.5 3.5 44.8 41.4 3.4 Ground Turkey (37) 43.2 54.1 [36.9 - 70.5] 2.7 43.2 43.2 10.8 Pork Chop (2) 0.0 50.0 [1.3 - 98.7] 50.0 50.0
Monobactam Aztreonam Retail Chicken (29) 37.9 0.0 [0.0 - 11.9] 10.3 51.7 37.9
Ground Turkey (37) 37.8 10.8 [3.0 - 25.4] 8.1 43.2 37.8 10.8 Pork Chop (2) 50.0 0.0 [0.0 - 84.2] 50.0 50.0
Penems Imipenem Retail Chicken (29) 0.0 0.0 [0.0 - 11.9] 37.9 62.1
Ground Turkey (37) 0.0 0.0 [0.0 - 10.5] 29.7 70.3 Pork Chop (2) 0.0 0.0 [0.0 - 84.2] 100.0
1 Percent of isolates with intermediate susceptibility2 Percent of isolates that are susceptible-dose dependent (S-DD). Cefepime MIC's above the suceptible range but below the resistant range are designated by CLSI to be S-DD.3 Percent of isolates with resistance. Discrepancies between %R and sums of distribution %'s, to the right of the double vertical bars, are due to rounding.4 95% confidence intervals for percent resistant (%R) were calculated using the Clopper-Pearson exact method
Table 30. Broad-Spectrum β-lactam Resistance among all Ceftiofur or Ceftriaxone Resistant Escherichia coli Retail Meat Isolates, 2012 Distribution (%) of MICs (µg/ml) 5
5 The unshaded areas indicate tthe range of dilutions tested for each antimicrobial. Single vertical bars indicate the breakpoints for susceptibility, while double vertical bars indicate the breakpoints for resistance. Numbers in the shaded areas indicate the percentages of isolates with MICs greater than the highest tested concentrations. Numbers listed for the lowest tested concentrations represent the percentages of isolates with MICs equal to or less than the lowest tested concentration.
74
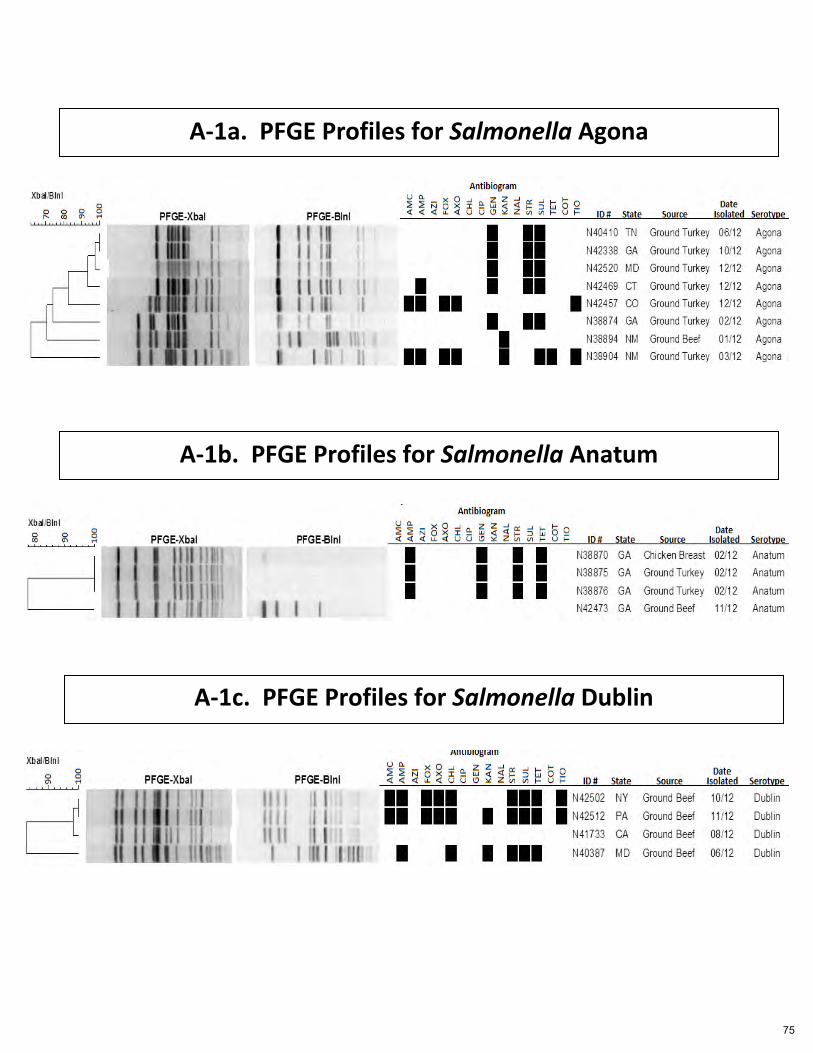
A-1a. PFGE Profiles for Salmonella Agona
A-1b. PFGE Profiles for Salmonella Anatum
A-1c. PFGE Profiles for Salmonella Dublin
75
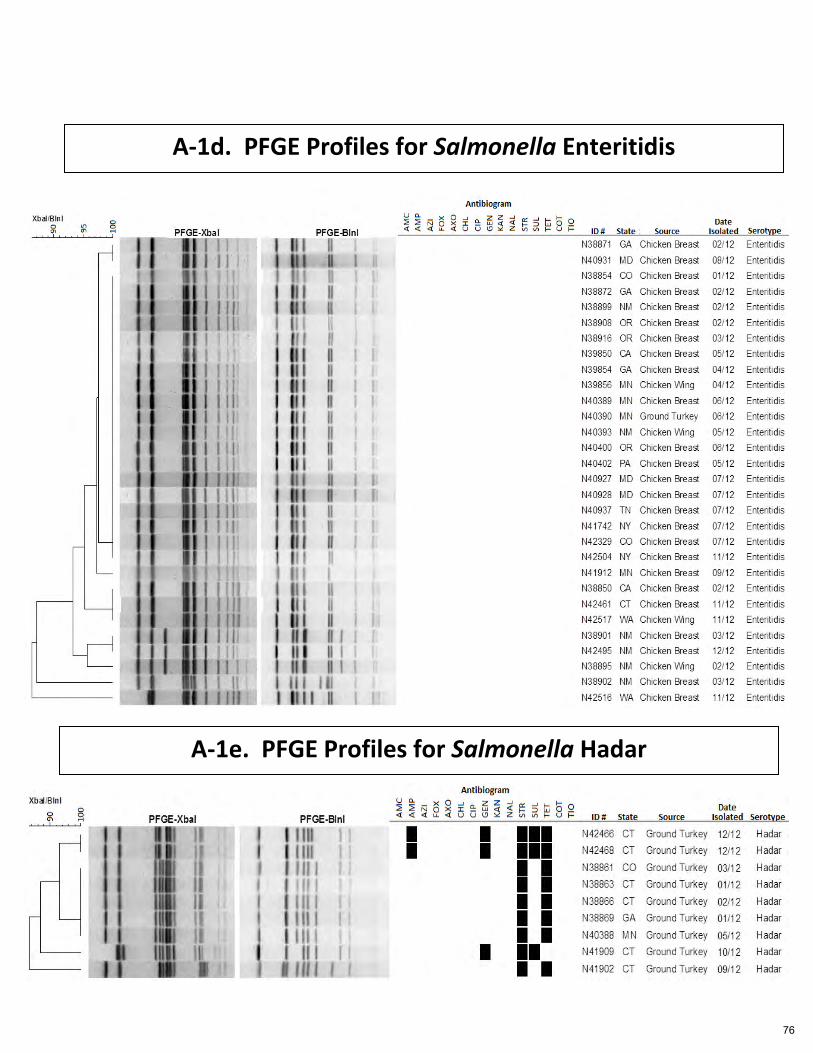
A-1d. PFGE Profiles for Salmonella Enteritidis
A-1e. PFGE Profiles for Salmonella Hadar
76
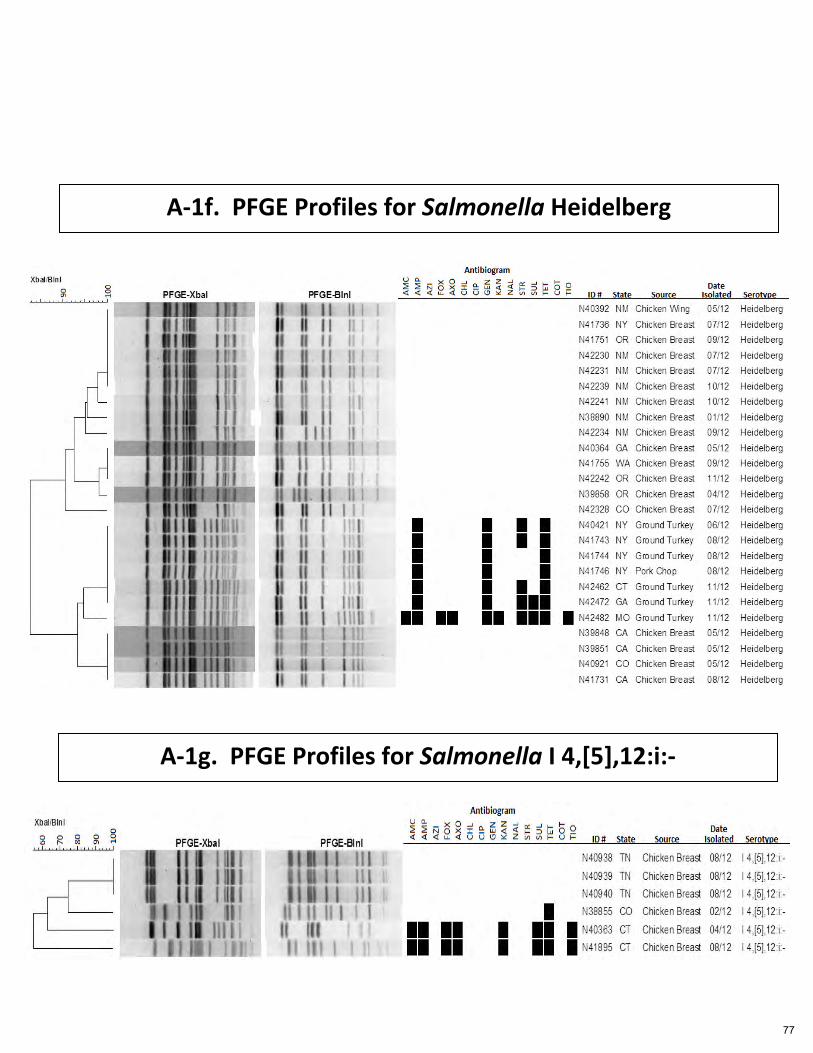
A-1f. PFGE Profiles for Salmonella Heidelberg
A-1g. PFGE Profiles for Salmonella I 4,[5],12:i:-
77
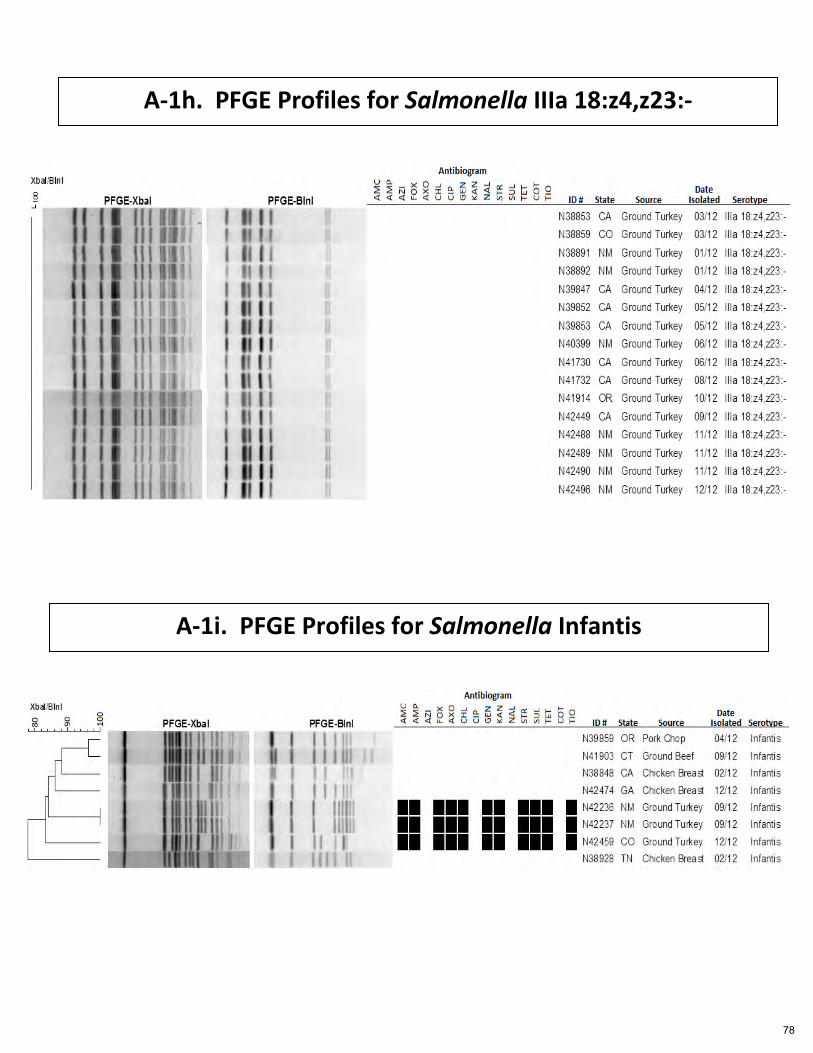
A-1h. PFGE Profiles for Salmonella IIIa 18:z4,z23:-
A-1i. PFGE Profiles for Salmonella Infantis
78
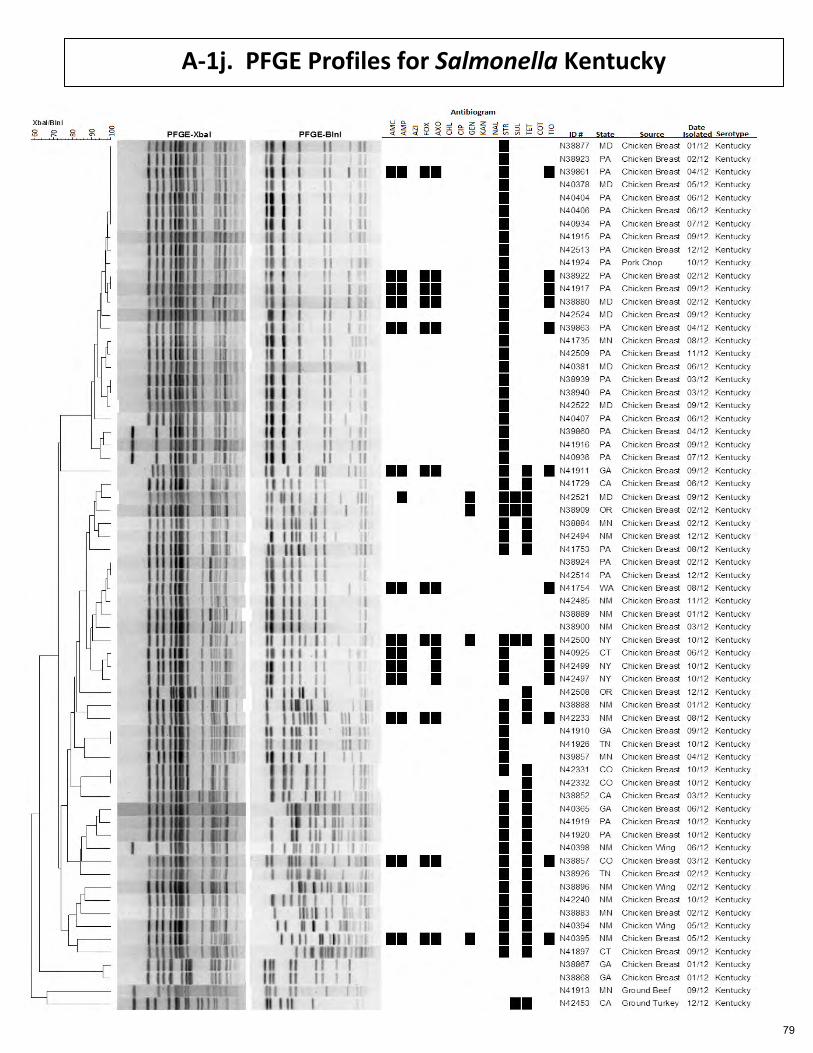
A-1j. PFGE Profiles for Salmonella Kentucky
79
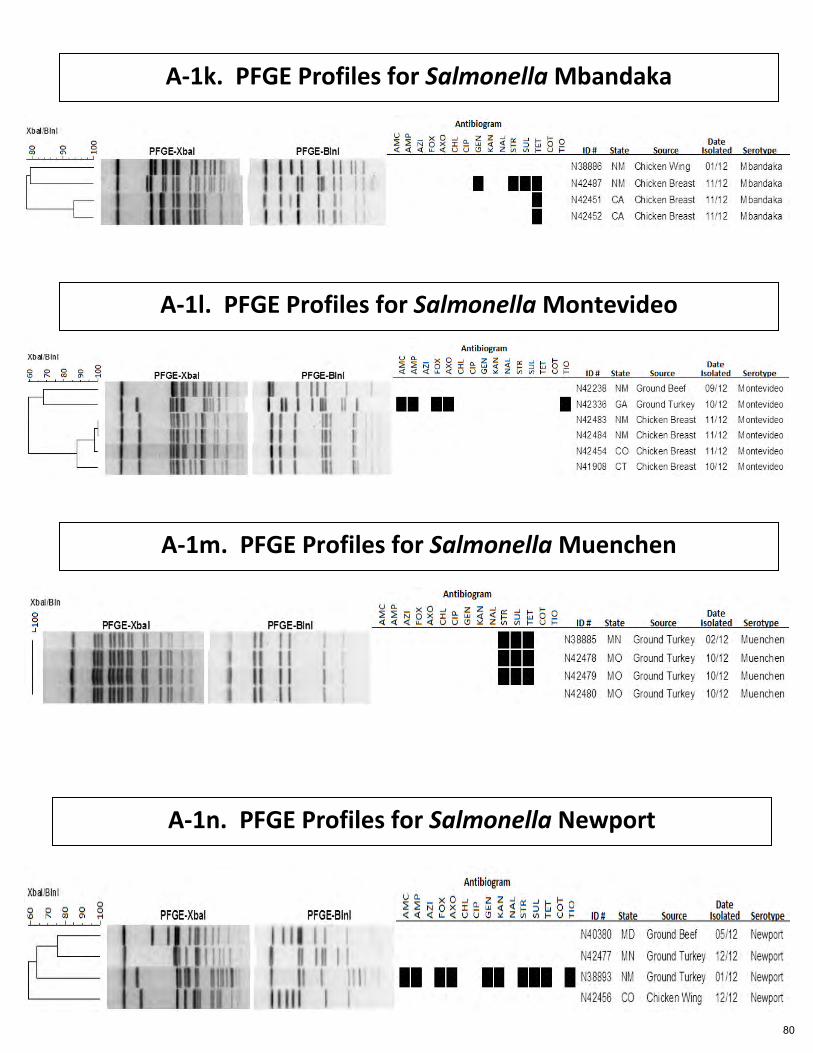
A-1k. PFGE Profiles for Salmonella Mbandaka
A-1l. PFGE Profiles for Salmonella Montevideo
A-1m. PFGE Profiles for Salmonella Muenchen
A-1n. PFGE Profiles for Salmonella Newport
80
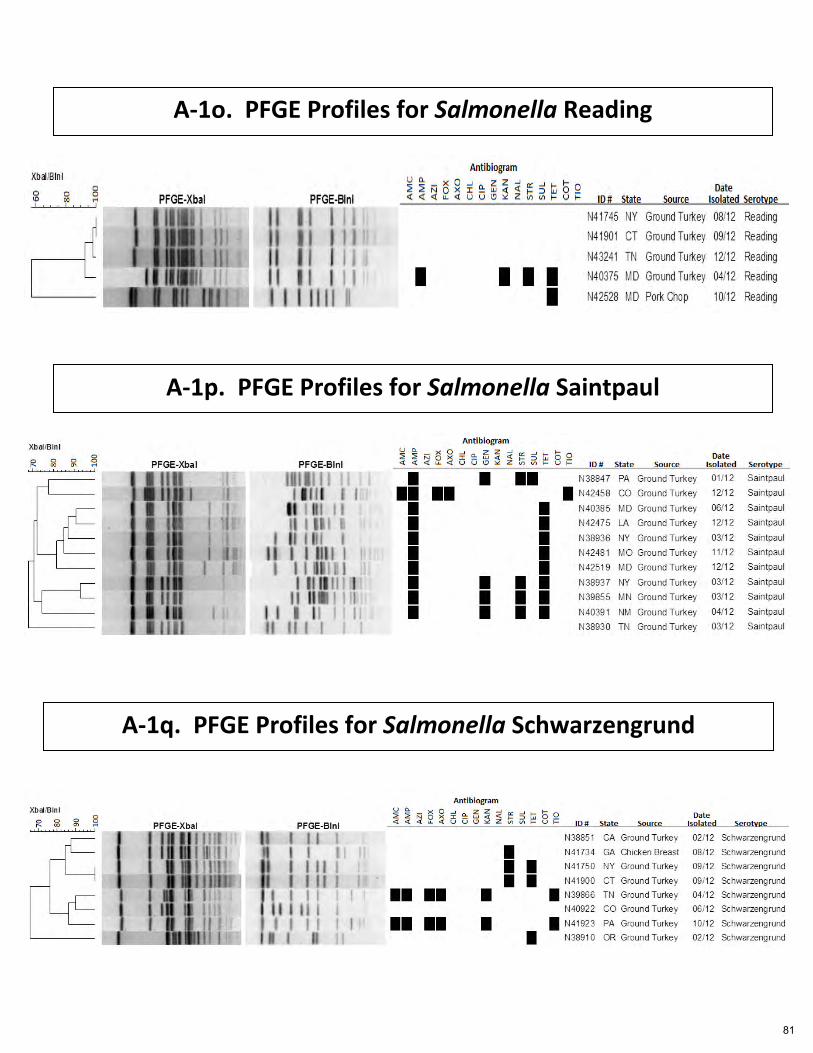
A-1o. PFGE Profiles for Salmonella Reading
A-1p. PFGE Profiles for Salmonella Saintpaul
A-1q. PFGE Profiles for Salmonella Schwarzengrund
81
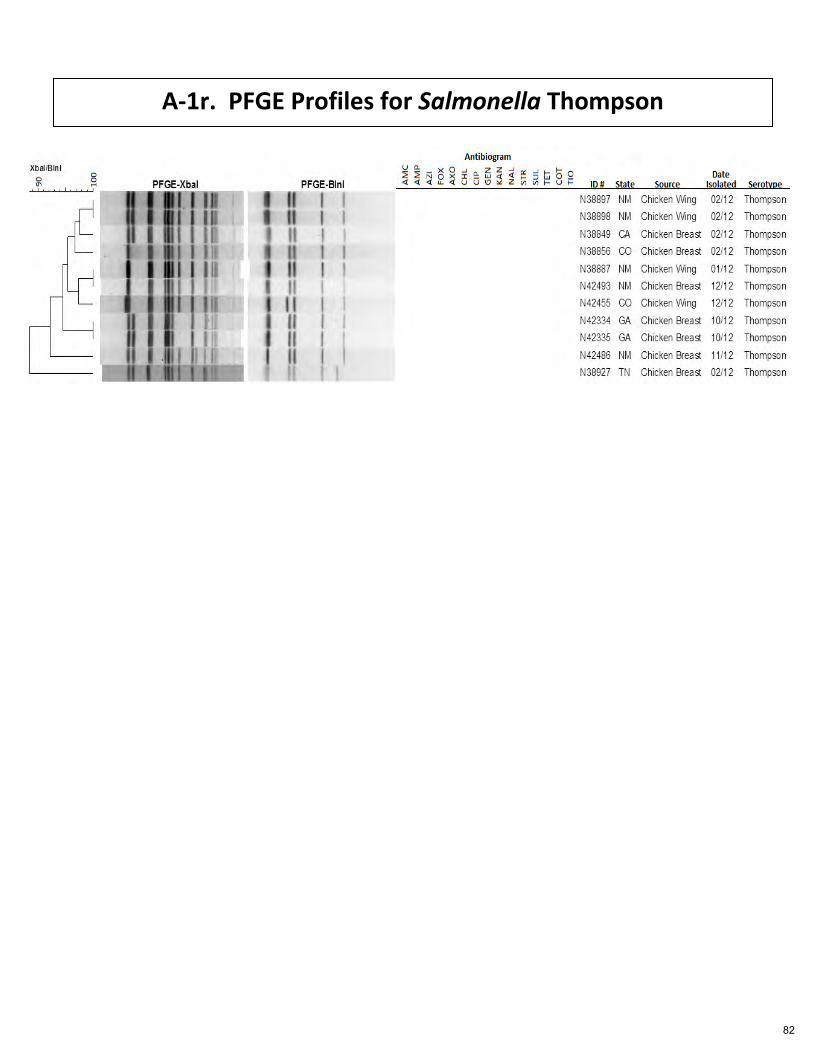
A-1r. PFGE Profiles for Salmonella Thompson
82
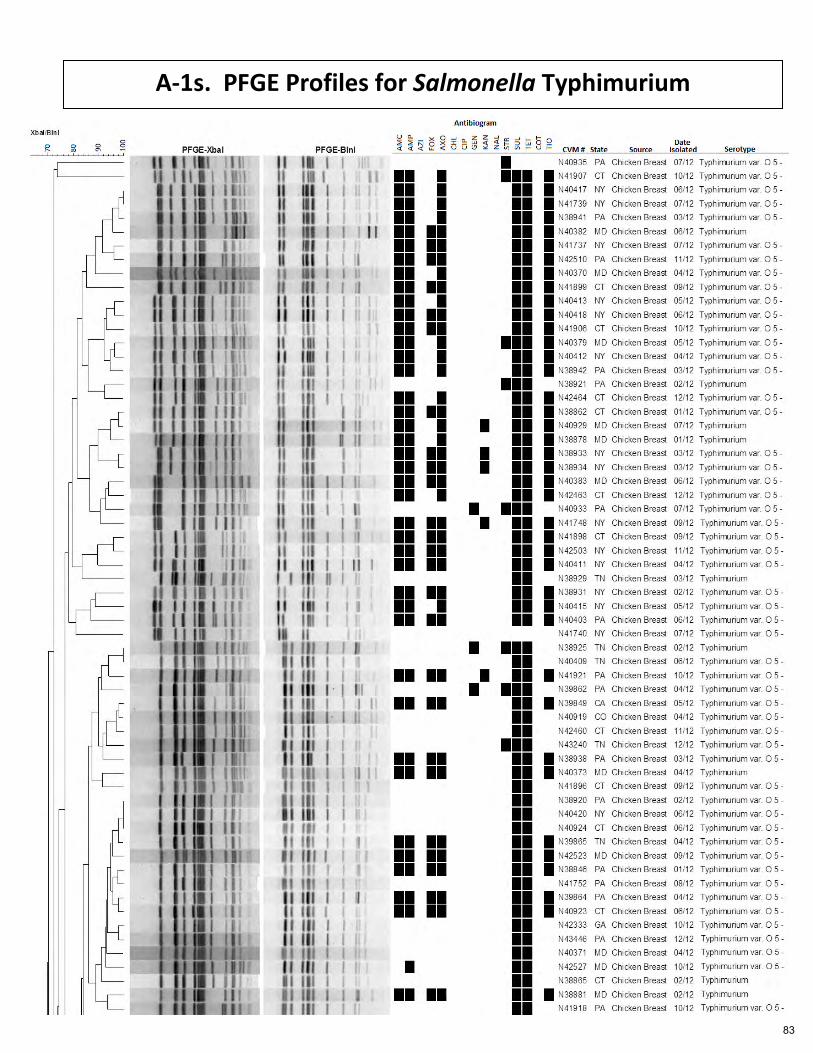
A-1s. PFGE Profiles for Salmonella Typhimurium
83
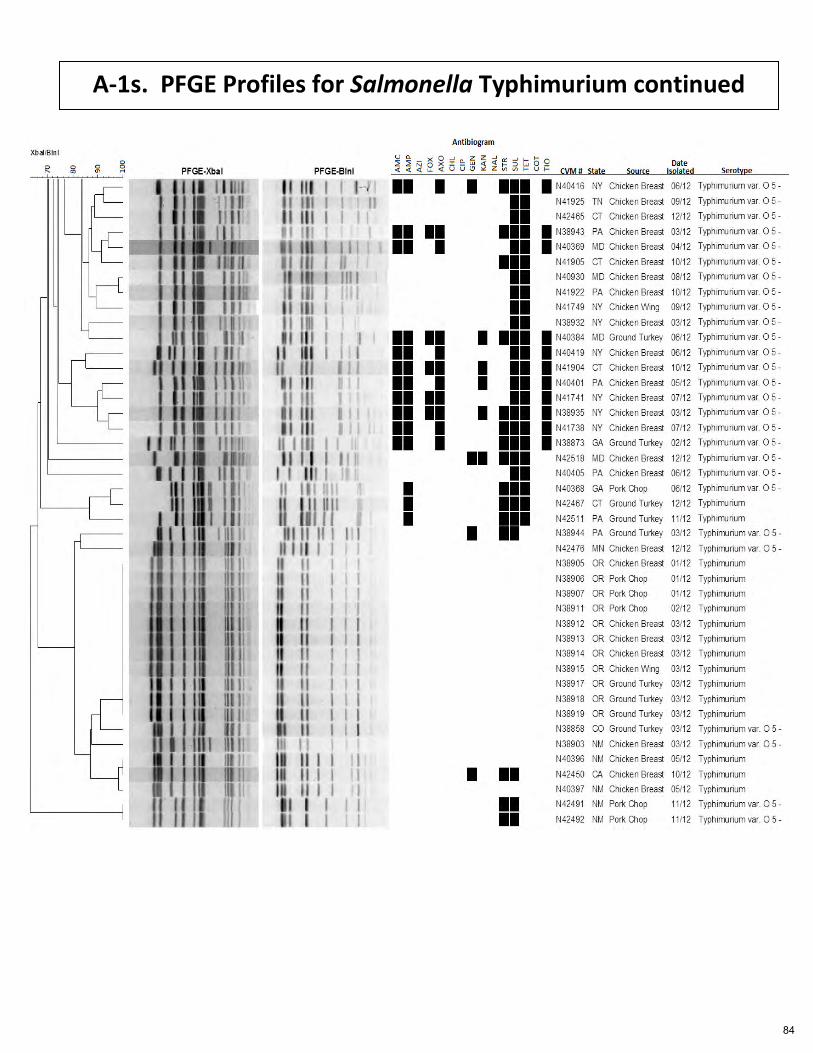
A-1s. PFGE Profiles for Salmonella Typhimurium continued
84
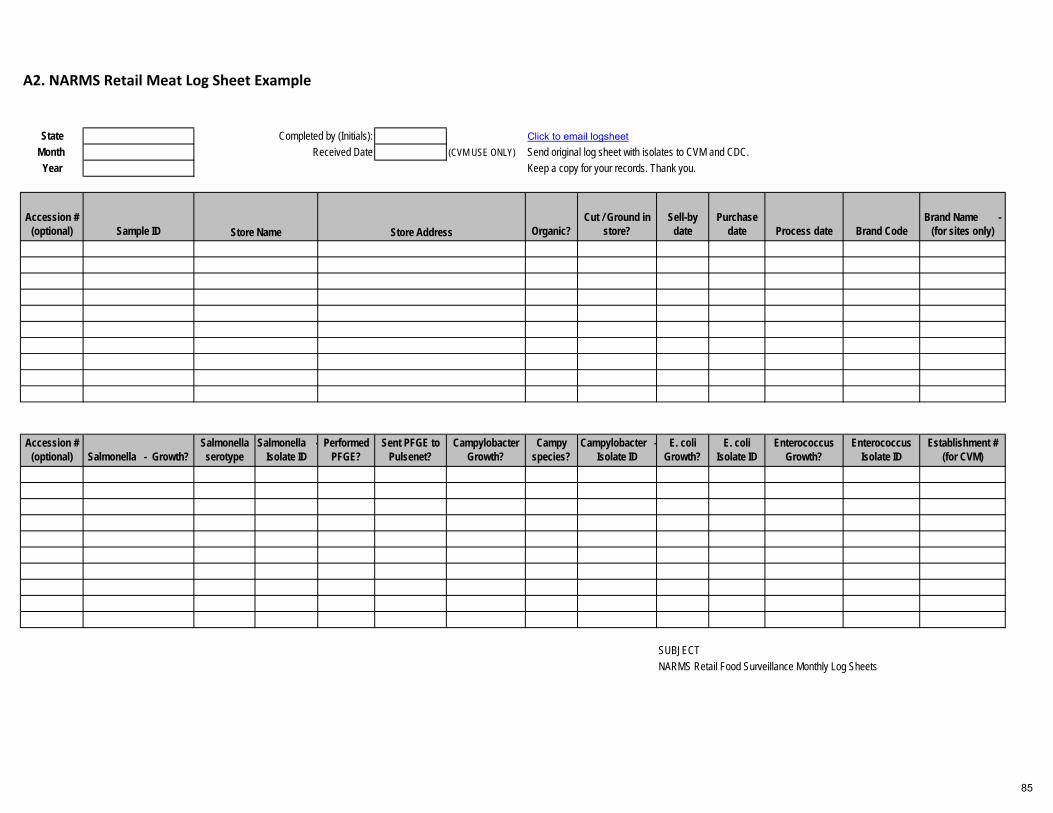
State Completed by (Initials): Click to email logsheetMonth Received Date (CVM USE ONLY) Send original log sheet with isolates to CVM and CDC.
Year Keep a copy for your records. Thank you.
Accession # (optional) Sample ID Organic?
Cut / Ground in store?
Sell-by date
Purchase date Process date Brand Code
Brand Name - (for sites only)
Accession # (optional) Salmonella - Growth?
Salmonella serotype
Salmonella - Isolate ID
Performed PFGE?
Sent PFGE to Pulsenet?
Campylobacter Growth?
Campy species?
Campylobacter - Isolate ID
E. coli Growth?
E. coli Isolate ID
Enterococcus Growth?
Enterococcus Isolate ID
Establishment # (for CVM)
SUBJECTNARMS Retail Food Surveillance Monthly Log Sheets
Store Name Store Address
A2. NARMS Retail Meat Log Sheet Example
85
A3. Antimicrobial Resistance Trend Analysis
The purpose of the trend statistic is to model the association between antimicrobial
resistances across the study years for all drugs tested. Beginning with the 2010 NARMS Retail
Meat Report, the Cochran-Armitage trend statistic was replaced by trend statistics calculated
from a binary logistic random effects regression model. As a result, the antimicrobial resistance
(binary: resistant vs. not resistant) of tested isolates for a particular source (retail chicken,
ground turkey, ground beef or pork chop) was analyzed using a logistic random effect model
with year (2002 through 2012) as a fixed effect to detect trend and laboratory site as a random
effect. Logistic random effects models not only provide equivalent trend test statistics to the
Cochran-Armitage method, but also increase the validity of the model by accounting for any
sampling differences that may occur among the 11 participating public health laboratories.
86
A4. Introducing Epidemiological Cut-Off Values (ECOFFs) for the Interpretation of Campylobacter spp. Susceptibility Data
An integral part of antimicrobial susceptibility testing is interpreting the results in order to categorize
bacteria as susceptible or resistant. The most commonly used criteria for interpreting lab results are the clinical
breakpoints. These are used to guide the selection of antibiotics most likely to successfully treat the infections.
Several standards organizations determine clinical breakpoints. In the United States, clinical breakpoints are set
by the Food and Drug Administration (FDA) and the Clinical and Laboratory Standards Institute (CLSI). In Europe,
this role is played by the European Committee on Antimicrobial Susceptibility Testing (EUCAST).
When determining clinical breakpoints, three major kinds of data are considered: 1) minimum inhibitory
concentration (MIC) data for susceptible clinical isolates; 2) clinical outcome data; 3) pharmacological properties
of the drug at the site of infection, and how different dosing regimens may affect outcome. Since the primary
purpose of clinical breakpoints is to guide therapy and predict clinical efficacy, they can have limitations for
other purposes, such as detecting emerging resistance in laboratory based surveillance programs.
In contrast to clinical breakpoints, ECOFFs distinguish bacteria without resistance mechanisms (“wild
type; (WT)”) from those with an acquired resistance mechanism (“non-wild type; NWT”). It is based on the
testing of large numbers of strains from different institutions to determine the MIC range of WT populations.
The ECOFF is defined as the highest MIC value of the susceptible population. The ECOFF value for a certain
organism/drug combination is expressed as WT ≤ X mg/L. Thus, while the clinical breakpoint is set to guide
therapy, ECOFFs are useful for detecting isolates with acquired resistance. ECOFFS do not take into
consideration any data on dosages or clinical efficacy. Therefore, an isolate that is considered non-wild type
using ECOFFs may still be considered susceptible using clinical breakpoints (Figure A). ECOFFs have been
determined for a large number of organisms and drugs. Information on ECOFFs can be found on the EUCAST
webpage (http://www.eucast.org/).
In this report NARMS has adopted ECOFFs to interpret results for Campylobacter. To highlight the fact that wild
type isolates are “microbiologically susceptible” and non-wild type isolates “microbiologically resistant”, isolates
are being reported as “susceptible” or “resistant” (rather than “wild type” or “non-wild type”) in the present
report. Thus, tables in this report that describe number and percentage resistant, resistance patterns and MIC
distributions for Campylobacter all reflect the use of ECOFFs.
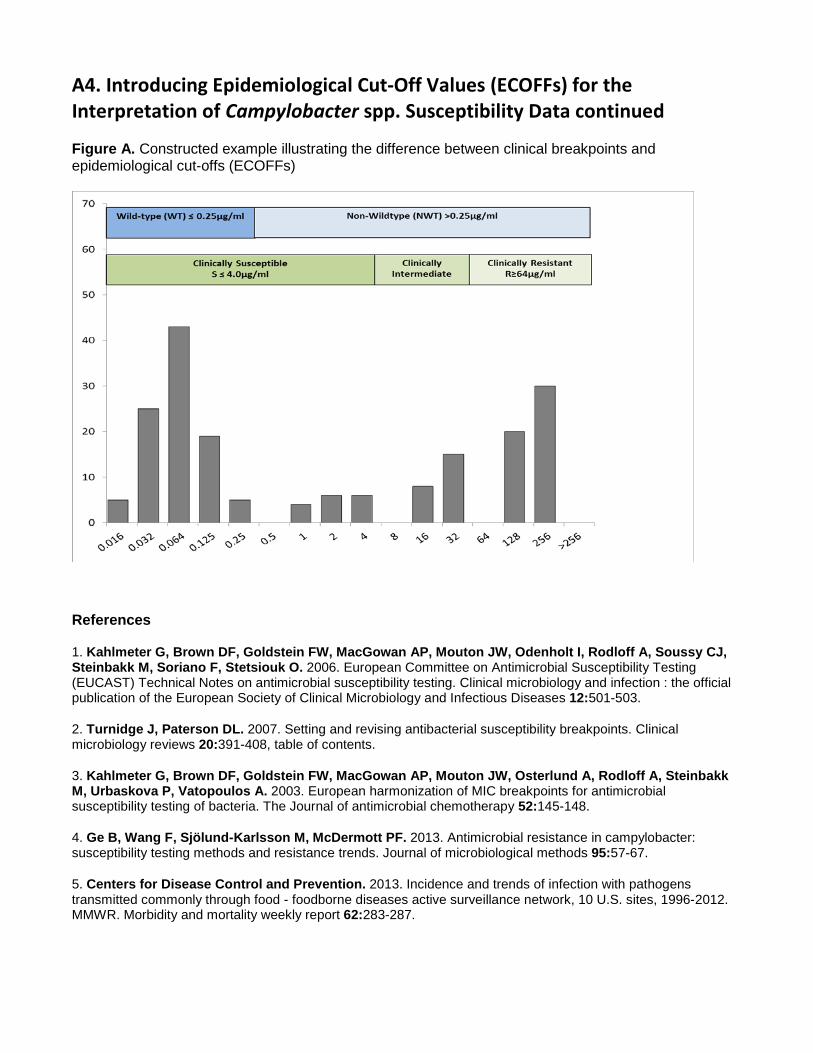
A4. Introducing Epidemiological Cut-Off Values (ECOFFs) for the Interpretation of Campylobacter spp. Susceptibility Data continued Figure A. Constructed example illustrating the difference between clinical breakpoints and epidemiological cut-offs (ECOFFs)
References
1. Kahlmeter G, Brown DF, Goldstein FW, MacGowan AP, Mouton JW, Odenholt I, Rodloff A, Soussy CJ, Steinbakk M, Soriano F, Stetsiouk O. 2006. European Committee on Antimicrobial Susceptibility Testing (EUCAST) Technical Notes on antimicrobial susceptibility testing. Clinical microbiology and infection : the official publication of the European Society of Clinical Microbiology and Infectious Diseases 12:501-503.
2. Turnidge J, Paterson DL. 2007. Setting and revising antibacterial susceptibility breakpoints. Clinical microbiology reviews 20:391-408, table of contents.
3. Kahlmeter G, Brown DF, Goldstein FW, MacGowan AP, Mouton JW, Osterlund A, Rodloff A, Steinbakk M, Urbaskova P, Vatopoulos A. 2003. European harmonization of MIC breakpoints for antimicrobial susceptibility testing of bacteria. The Journal of antimicrobial chemotherapy 52:145-148.
4. Ge B, Wang F, Sjölund-Karlsson M, McDermott PF. 2013. Antimicrobial resistance in campylobacter: susceptibility testing methods and resistance trends. Journal of microbiological methods 95:57-67.
5. Centers for Disease Control and Prevention. 2013. Incidence and trends of infection with pathogens transmitted commonly through food - foodborne diseases active surveillance network, 10 U.S. sites, 1996-2012. MMWR. Morbidity and mortality weekly report 62:283-287.