Embed Size (px)
Citation preview
Technical Advancement
A Device for Ribbon Collection for Array Tomography with Scanning ElectronMicroscopy
Taro Koike1, Yosky Kataoka2,3, Mitsuyo Maeda2, Yuji Hasebe2, Yuuki Yamaguchi2,Mitsuo Suga2, Akira Saito4 and Hisao Yamada1
1Department of Anatomy and Cell Science, Kansai Medical University, Hirakata City, Osaka, Japan, 2Multi-ModalMicrostructure Analysis Unit, RIKEN CLST-JEOL Collaboration Center, Kobe City, Hyogo, Japan, 3Cellular FunctionImaging Team, Division of Bio-function Dynamics Imaging, RIKEN Center for Life Science Technologies, Kobe City, Hyogo,Japan and 4Institute of Biomedical Science Central Research Center, Kansai Medical University, Hirakata City, Osaka, Japan
Received March 13, 2017; accepted September 21, 2017; published online October 19, 2017
“Array tomography” is a method used to observe the fine structure of cells and tissues in athree-dimensional view. In this method, serial ultrathin sections in the ribbon state (ribbons)are mounted on a solid substrate and observed by scanning electron microscopy (SEM).The method may also be used in conjunction with post-embedding immunocytochemistry.However, it is difficult to mount many serial ribbons on a substrate manually. We developedan inexpensive laboratory-made device that mounts ribbons by pulling a nylon fishing lineand lifting the substrate up from the water in a knife boat. Using this device, we succeededin mounting several ribbons consisting a mean of 205.6 (SD: 37.7) serial ultrathin sectionson 1.25 (SD: 0.06) × 1.25 (SD: 0.06)-cm silicon substrates. Furthermore, it was confirmedthat our method is suitable for ribbons derived from water-soluble resin blocks. We were alsoable to stain the specimens by post-embedding immunocytochemistry. Thus, our method isuseful in mounting numerus sections on a substrate for array tomography with SEM.
Key words: array tomography, three-dimensional observation, serial ultrathin section, post-embedding labeling, scanning electron microscopy
The three-dimensional (3D) structure of tissues oftenreflects their biological nature. Currently, 3D observationof tissues is performed by scanning electron microscopy(SEM) and some other established methods [1, 11]. Thesetechniques are roughly classified into two types. One typeadopts a repeating process that involves removing the sur-face of a resin block in which the tissue has been em-bedded, followed by capturing backscattered electronsfrom the surface of the block. To remove the block surface,a diamond knife or focused ion beam (FIB) is used;thus, these approaches are called serial block face/SEMor FIB/SEM, respectively [2, 5, 12]. These methods easilygenerate 3D images, but obtaining images at various mag-
Correspondence to: Taro Koike, Department of Anatomy and CellScience, Kansai Medical University, Hirakata City, Osaka, Japan. E-mail: [email protected]
nifications is difficult because the specimen changes eachtime the surface of the block is removed. Moreover, only arestricted area of the surface can be targeted by the FIB/SEM. Finally, these approaches are not suitable for specificstaining, i.e., post-embedding immunocytochemistry. Thesecond type of imaging technique is array tomography [8].In this method, ribbons of serial sections floating on aknife boat are mounted on a solid substrate, such as a sili-con substrate, a glass slide, or a coverslip. Backscatteredelectrons from each section are then observed by SEM.Array tomography includes several manual procedures, suchas preparing the specimen, capturing sections, and adjustingthe axis of each image. Despite this, array tomography hastechnical merits; for instance, this method does not requirean expensive specific machine. Additionally, the sizes ofthe sections can be chosen by researchers based on the pur-pose of study and specimens can be observed repeatedly
Acta Histochem. Cytochem. 50 (5): 135–140, 2017doi: 10.1267/ahc.17013
© 2017 The Japan Society of Histochemistry and Cytochemistry
because they can be stored semi-permanently. Finally,various specific histochemical techniques, including post-embedding immunocytochemistry, can be used with arraytomography [8]. Observation of the 3D ultrastructure ofcells with post-embedding immunocytochemistry helps usunderstand their functional aspects.
Previous reports have described methods of ribboncollection for array tomography. An automated tape-collecting ultramicrotome (ATUM) was developed for theautomated pick-up of sections onto a support tape [3, 9].However, the machine used in the ATUM method is expen-sive. Horstmann et al. [4] and Wacker et al. [10] have alsoreported a device for silicon substrate positioning. In theirapproach, the silicon substrate is clipped using forcepsattached to a custom-built manipulator and a long ribbon ispulled out in a longitudinal direction from the water. Withthis approach, the diamond knife has a large knife boatbecause a 3 cm-long substrate or a glass slide is used tomount more than 250 sections. Koga et al. [6] used ironrings to transport ribbons from the knife boat to the slideglass. Although this method does not need expensive tools,the iron ring can transfer only about 50 sections onto asubstrate. Thus, it is difficult to prepare a large number ofsections using this method.
In the present study, our aim was to collect approxi-mately 200 sections on a piece of substrate without highcosts. For this goal, we proposed a device for ribbon collec-tion with a lab-made substrate-lifting device.
A silicon wafer was divided into 1.25 (SD: 0.06, n =4) × 1.25 (SD: 0.06, n = 4)-cm squares and cleaned with100% ethanol followed by distilled water in an ultrasonicbath. After the wash, the silicon substrates were hydro-philized with 28% ammonia solution and 30% hydrogenperoxide (1:1) at 25°C for 30 min and then washed withdistilled water three times.
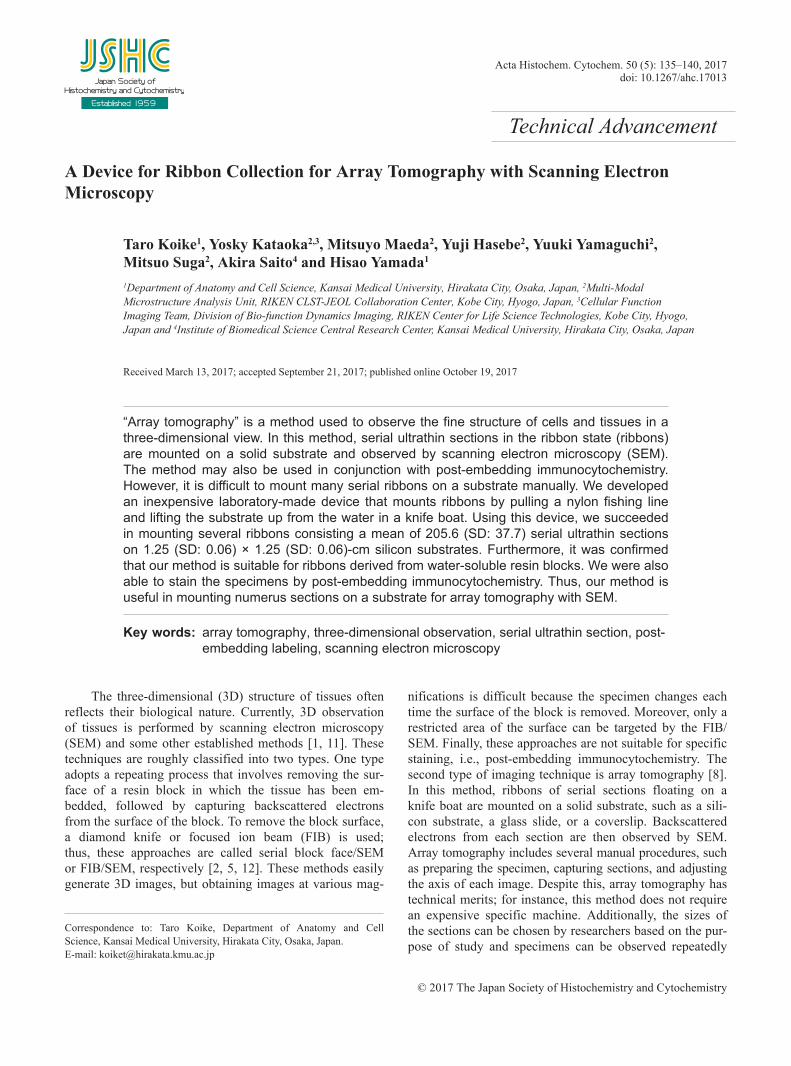
To lift up the silicon substrate, we prepared a crane-like device without expensive materials. The structuralmain points of the device are as follows: the silicon sub-strate is chained to a handle that works smoothly with afishing line; the fishing line is hung on a fulcrum near thediamond knife boat; the substrate is lifted up and down byturning the handle and reel or by feeding the fishing line. Inthe present study, a scrap manipulator was used for the han-dle, and a crane arm made from screwed metal plates wasused for the fulcrum. The length of the arm was approxi-mately 20 cm. Joints were made on the arm to allow theposition of the fulcrum to be changed according to the posi-tion of the knife-boat. A 0.13-mm-diameter nylon fishingline was used (Fig. 1). The metal plates, screw, and fishingline costed approximately 20 US dollars in total. Themanipulator was placed beside an Ultracut S ultramicro-tome (Reichert-Nissei, Tokyo, Japan), and the tip of thearm was positioned by the boat of the diamond knife. Asilicon substrate was leaned on the side wall of the boatof the diamond knife. The angle between the substrate andsurface of the water in the knife boat was set smaller than
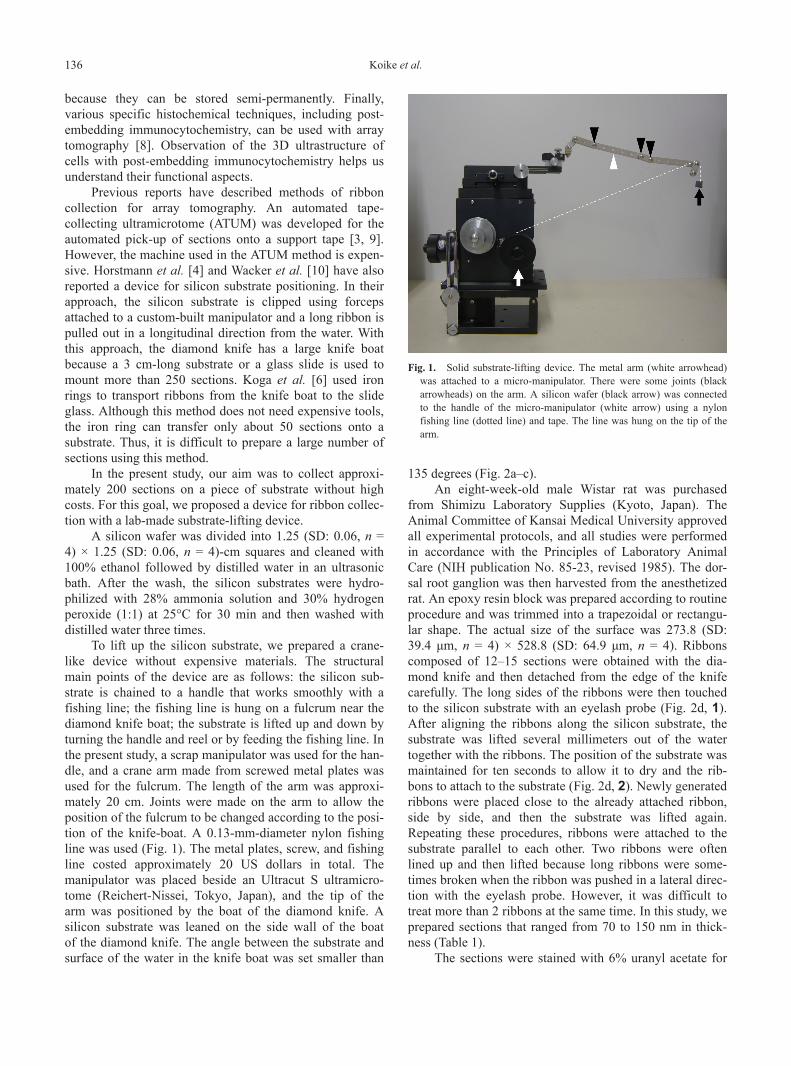
135 degrees (Fig. 2a–c).An eight-week-old male Wistar rat was purchased
from Shimizu Laboratory Supplies (Kyoto, Japan). TheAnimal Committee of Kansai Medical University approvedall experimental protocols, and all studies were performedin accordance with the Principles of Laboratory AnimalCare (NIH publication No. 85-23, revised 1985). The dor-sal root ganglion was then harvested from the anesthetizedrat. An epoxy resin block was prepared according to routineprocedure and was trimmed into a trapezoidal or rectangu-lar shape. The actual size of the surface was 273.8 (SD:39.4 μm, n = 4) × 528.8 (SD: 64.9 μm, n = 4). Ribbonscomposed of 12–15 sections were obtained with the dia-mond knife and then detached from the edge of the knifecarefully. The long sides of the ribbons were then touchedto the silicon substrate with an eyelash probe (Fig. 2d, 1).After aligning the ribbons along the silicon substrate, thesubstrate was lifted several millimeters out of the watertogether with the ribbons. The position of the substrate wasmaintained for ten seconds to allow it to dry and the rib-bons to attach to the substrate (Fig. 2d, 2). Newly generatedribbons were placed close to the already attached ribbon,side by side, and then the substrate was lifted again.Repeating these procedures, ribbons were attached to thesubstrate parallel to each other. Two ribbons were oftenlined up and then lifted because long ribbons were some-times broken when the ribbon was pushed in a lateral direc-tion with the eyelash probe. However, it was difficult totreat more than 2 ribbons at the same time. In this study, weprepared sections that ranged from 70 to 150 nm in thick-ness (Table 1).
The sections were stained with 6% uranyl acetate for
Solid substrate-lifting device. The metal arm (white arrowhead)was attached to a micro-manipulator. There were some joints (blackarrowheads) on the arm. A silicon wafer (black arrow) was connectedto the handle of the micro-manipulator (white arrow) using a nylonfishing line (dotted line) and tape. The line was hung on the tip of thearm.
Fig. 1.
136 Koike et al.
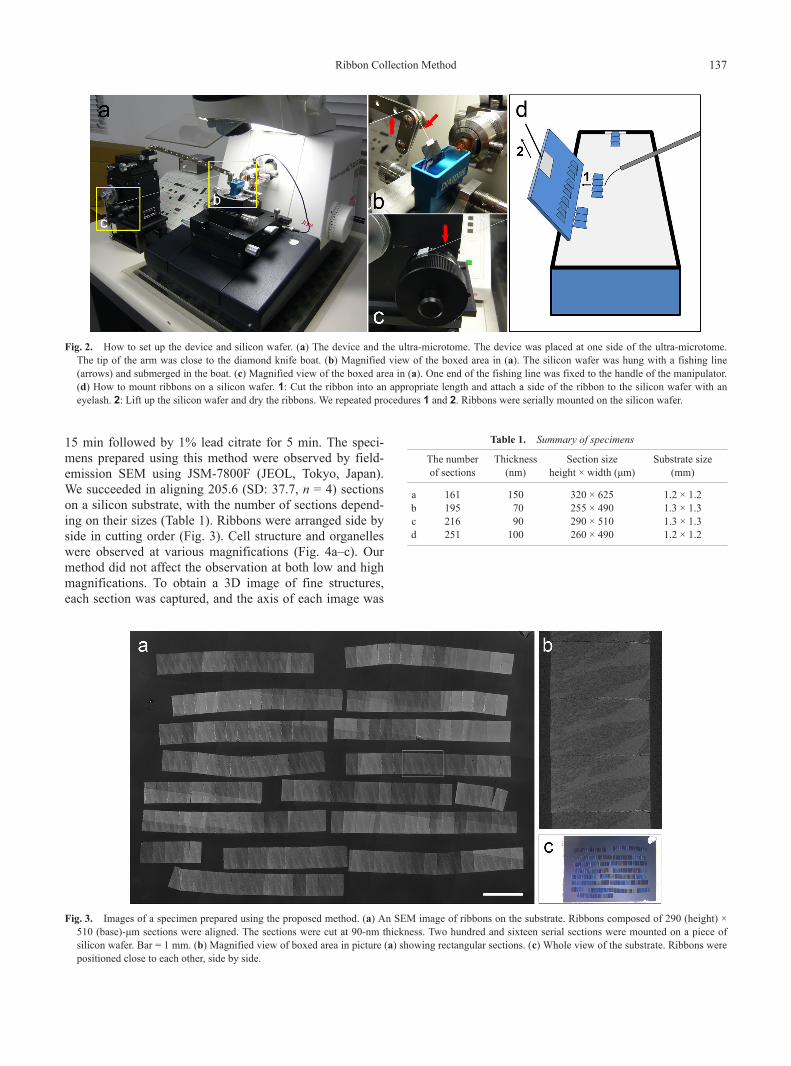
15 min followed by 1% lead citrate for 5 min. The speci-mens prepared using this method were observed by field-emission SEM using JSM-7800F (JEOL, Tokyo, Japan).We succeeded in aligning 205.6 (SD: 37.7, n = 4) sectionson a silicon substrate, with the number of sections depend-ing on their sizes (Table 1). Ribbons were arranged side byside in cutting order (Fig. 3). Cell structure and organelleswere observed at various magnifications (Fig. 4a–c). Ourmethod did not affect the observation at both low and highmagnifications. To obtain a 3D image of fine structures,each section was captured, and the axis of each image was
Table 1. Summary of specimens
The numberof sections
Thickness(nm)
Section sizeheight × width (μm)
Substrate size(mm)
a 161 150 320 × 625 1.2 × 1.2b 195 70 255 × 490 1.3 × 1.3c 216 90 290 × 510 1.3 × 1.3d 251 100 260 × 490 1.2 × 1.2
How to set up the device and silicon wafer. (a) The device and the ultra-microtome. The device was placed at one side of the ultra-microtome.The tip of the arm was close to the diamond knife boat. (b) Magnified view of the boxed area in (a). The silicon wafer was hung with a fishing line(arrows) and submerged in the boat. (c) Magnified view of the boxed area in (a). One end of the fishing line was fixed to the handle of the manipulator.(d) How to mount ribbons on a silicon wafer. 1: Cut the ribbon into an appropriate length and attach a side of the ribbon to the silicon wafer with aneyelash. 2: Lift up the silicon wafer and dry the ribbons. We repeated procedures 1 and 2. Ribbons were serially mounted on the silicon wafer.
Fig. 2.
Images of a specimen prepared using the proposed method. (a) An SEM image of ribbons on the substrate. Ribbons composed of 290 (height) ×510 (base)-μm sections were aligned. The sections were cut at 90-nm thickness. Two hundred and sixteen serial sections were mounted on a piece ofsilicon wafer. Bar = 1 mm. (b) Magnified view of boxed area in picture (a) showing rectangular sections. (c) Whole view of the substrate. Ribbons werepositioned close to each other, side by side.
Fig. 3.
Ribbon Collection Method 137
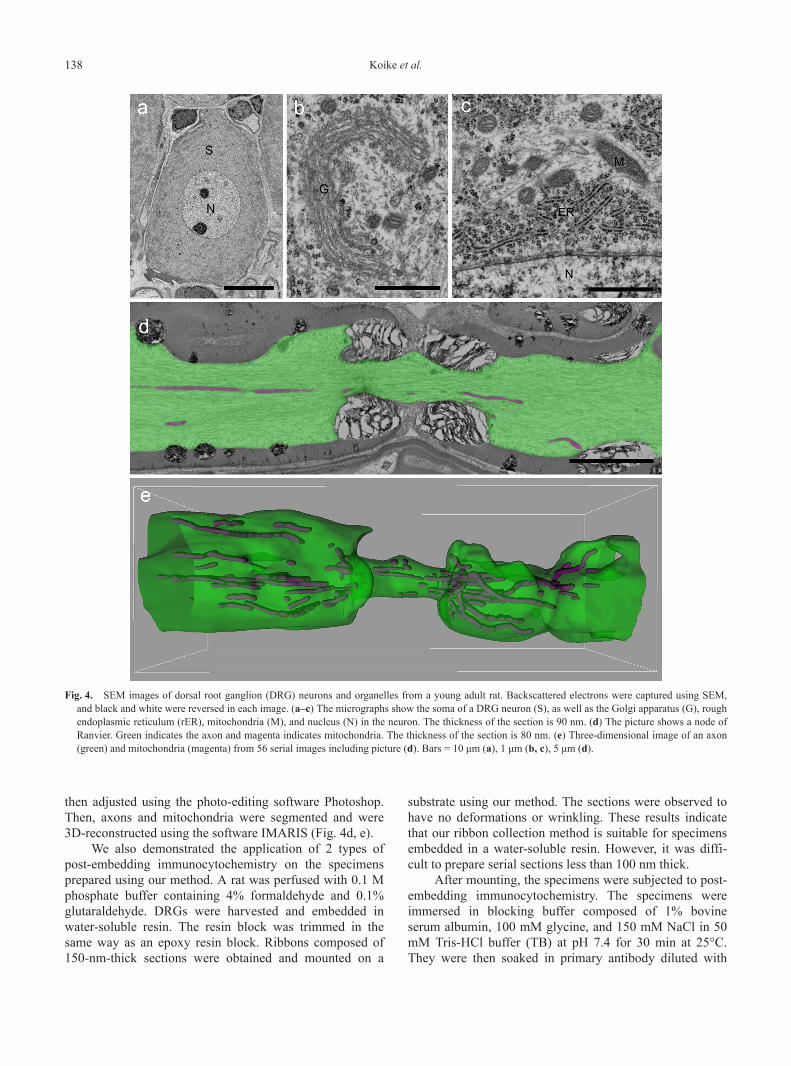
then adjusted using the photo-editing software Photoshop.Then, axons and mitochondria were segmented and were3D-reconstructed using the software IMARIS (Fig. 4d, e).
We also demonstrated the application of 2 types ofpost-embedding immunocytochemistry on the specimensprepared using our method. A rat was perfused with 0.1 Mphosphate buffer containing 4% formaldehyde and 0.1%glutaraldehyde. DRGs were harvested and embedded inwater-soluble resin. The resin block was trimmed in thesame way as an epoxy resin block. Ribbons composed of150-nm-thick sections were obtained and mounted on a
substrate using our method. The sections were observed tohave no deformations or wrinkling. These results indicatethat our ribbon collection method is suitable for specimensembedded in a water-soluble resin. However, it was diffi-cult to prepare serial sections less than 100 nm thick.
After mounting, the specimens were subjected to post-embedding immunocytochemistry. The specimens wereimmersed in blocking buffer composed of 1% bovineserum albumin, 100 mM glycine, and 150 mM NaCl in 50mM Tris-HCl buffer (TB) at pH 7.4 for 30 min at 25°C.They were then soaked in primary antibody diluted with
SEM images of dorsal root ganglion (DRG) neurons and organelles from a young adult rat. Backscattered electrons were captured using SEM,and black and white were reversed in each image. (a–c) The micrographs show the soma of a DRG neuron (S), as well as the Golgi apparatus (G), roughendoplasmic reticulum (rER), mitochondria (M), and nucleus (N) in the neuron. The thickness of the section is 90 nm. (d) The picture shows a node ofRanvier. Green indicates the axon and magenta indicates mitochondria. The thickness of the section is 80 nm. (e) Three-dimensional image of an axon(green) and mitochondria (magenta) from 56 serial images including picture (d). Bars = 10 μm (a), 1 μm (b, c), 5 μm (d).
Fig. 4.
138 Koike et al.
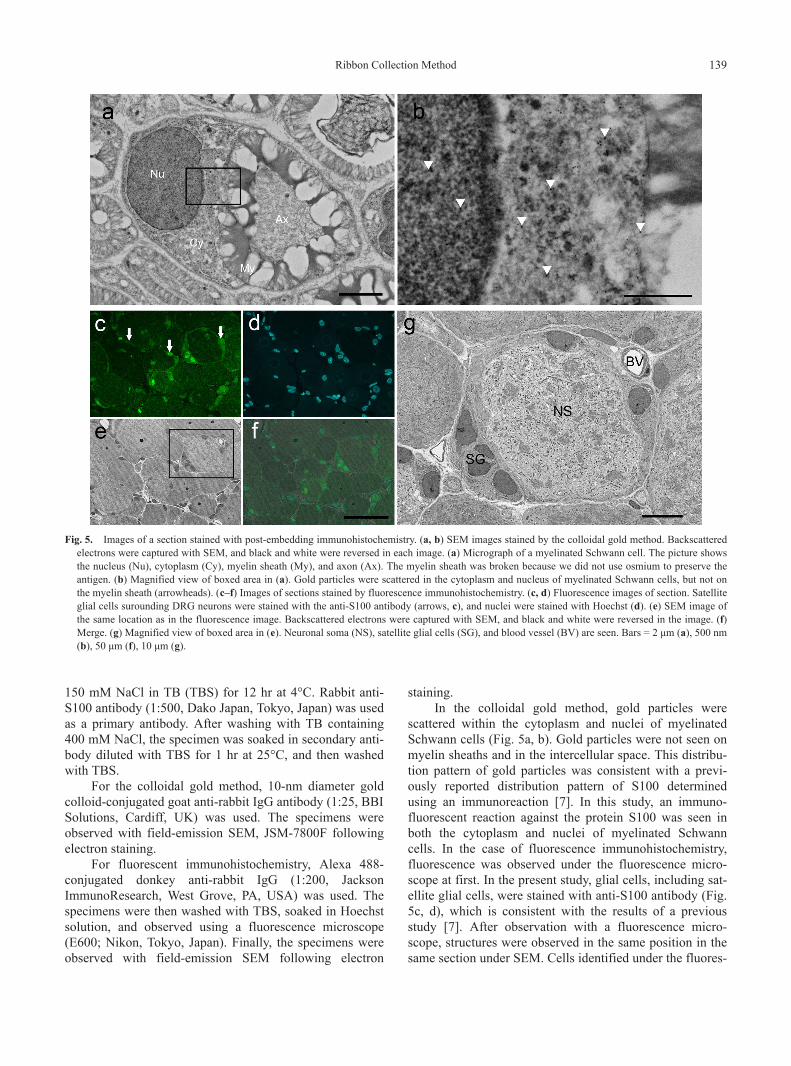
150 mM NaCl in TB (TBS) for 12 hr at 4°C. Rabbit anti-S100 antibody (1:500, Dako Japan, Tokyo, Japan) was usedas a primary antibody. After washing with TB containing400 mM NaCl, the specimen was soaked in secondary anti-body diluted with TBS for 1 hr at 25°C, and then washedwith TBS.
For the colloidal gold method, 10-nm diameter goldcolloid-conjugated goat anti-rabbit IgG antibody (1:25, BBISolutions, Cardiff, UK) was used. The specimens wereobserved with field-emission SEM, JSM-7800F followingelectron staining.
For fluorescent immunohistochemistry, Alexa 488-conjugated donkey anti-rabbit IgG (1:200, JacksonImmunoResearch, West Grove, PA, USA) was used. Thespecimens were then washed with TBS, soaked in Hoechstsolution, and observed using a fluorescence microscope(E600; Nikon, Tokyo, Japan). Finally, the specimens wereobserved with field-emission SEM following electron
staining.In the colloidal gold method, gold particles were
scattered within the cytoplasm and nuclei of myelinatedSchwann cells (Fig. 5a, b). Gold particles were not seen onmyelin sheaths and in the intercellular space. This distribu-tion pattern of gold particles was consistent with a previ-ously reported distribution pattern of S100 determinedusing an immunoreaction [7]. In this study, an immuno-fluorescent reaction against the protein S100 was seen inboth the cytoplasm and nuclei of myelinated Schwanncells. In the case of fluorescence immunohistochemistry,fluorescence was observed under the fluorescence micro-scope at first. In the present study, glial cells, including sat-ellite glial cells, were stained with anti-S100 antibody (Fig.5c, d), which is consistent with the results of a previousstudy [7]. After observation with a fluorescence micro-scope, structures were observed in the same position in thesame section under SEM. Cells identified under the fluores-
Images of a section stained with post-embedding immunohistochemistry. (a, b) SEM images stained by the colloidal gold method. Backscatteredelectrons were captured with SEM, and black and white were reversed in each image. (a) Micrograph of a myelinated Schwann cell. The picture showsthe nucleus (Nu), cytoplasm (Cy), myelin sheath (My), and axon (Ax). The myelin sheath was broken because we did not use osmium to preserve theantigen. (b) Magnified view of boxed area in (a). Gold particles were scattered in the cytoplasm and nucleus of myelinated Schwann cells, but not onthe myelin sheath (arrowheads). (c–f) Images of sections stained by fluorescence immunohistochemistry. (c, d) Fluorescence images of section. Satelliteglial cells surounding DRG neurons were stained with the anti-S100 antibody (arrows, c), and nuclei were stained with Hoechst (d). (e) SEM image ofthe same location as in the fluorescence image. Backscattered electrons were captured with SEM, and black and white were reversed in the image. (f)Merge. (g) Magnified view of boxed area in (e). Neuronal soma (NS), satellite glial cells (SG), and blood vessel (BV) are seen. Bars = 2 μm (a), 500 nm(b), 50 μm (f), 10 μm (g).
Fig. 5.
Ribbon Collection Method 139
cence microscope were easily identified under SEM (Fig.5f, g). The section was able to be observed at high magnifi-cation under SEM (Fig. 5g).
In the present study, we prepared a substrate-liftingdevice similar to a crane. The device was composed of 2important elements: a handle that worked smoothly and afulcrum near the knife-boat. These 2 structural main pointsallowed smooth and stable movement of the substrate. Inthe present study, we employed a manipulator for the han-dle, but anything with a handle that moves smoothly couldbe utilized. For instance, the fine focus adjustor of an oldmicroscope could be used. A metal arm was prepared andused as a fulcrum, from which the fishing line could behung and positioned near the knife boat. Anything thatmeets this requirement can be used. Thus, researchers willbe able to prepare the device with material available in theirlaboratories.
In our method, ribbons composed of several sectionswere prepared and then were pulled out transversely usingthe lab-made device. This approach provides the followingadvantages: 1) we can continue to cut the block if the rib-bon is not completely straight; 2) a large boat is not needed;and 3) it does not require high costs because the device canbe built from scrap equipment. As a result, many serial sec-tions could be mounted on a single piece of silicon sub-strate at a reasonable cost. Moreover, ribbons obtained byour method were available for both colloidal gold stainingand fluorescence immunocytochemistry. This techniquewill help in understanding the function of cellular ultra-structures.
Although our method is useful in collecting approxi-mately 200 sections, it is difficult to mount more sectionson a substrate because the area of the substrate is restrictedby depth of the knife boat. When more sections are needed,the size of the sections can be decreased, the substrate canbe changed, or a deeper knife boat and a larger substratecan be used.
In conclusion, in order to collect 200 ultrathin sectionsat a reasonable cost, we developed a lab-made substrate-lifting device and mounted ribbons on a substrate with thisdevice. As a result, we could mount more than 200 sectionson a piece of silicon wafer. Furthermore, ribbons obtainedby this method, which were made from water-soluble resinblock, were found to be suitable for post-embeddingimmunocytochemistry. Our method will thus be helpful forarray tomography with SEM.
AcknowledgmentWe express appreciation to Biomedical Science Cen-
tral Research Center of Kansai Medical University for theuse of an ultramicrotome.
Funding
This study was supported in part by Grants-in-Aid forScientific Research (C) from the Japan Society for the Pro-motion of Science [16k08480 to H.Y.] and The ScienceResearch Promotion Fund from the Proportion and MutualAid Corporation for Private Schools of Japan [to T.K.].
References 1. Briggman, K. L. and Bock, D. D. (2012) Volume electron
microscopy for neuronal circuit reconstruction. Curr. Opin.Neurobiol. 22; 154–161.
2. Denk, W. and Horstmann, H. (2004) Serial block-face scanningelectron microscopy to reconstruct three-dimensional tissuenanostructure. PLoS Biol. 2; e329.
3. Hayworth, K. J., Morgan, J. L., Schalek, R., Berger, D. R.,Hildebrand, D. G. and Lichtman, J. W. (2014) Imaging ATUMultrathin section libraries with Wafer Mapper: a multi-scaleapproach to EM reconstruction of neural circuits. Front. NeuralCircuits 8; 68.
4. Horstmann, H., Körber, C., Sätzler, K., Aydin, D. and Kuner, T.(2012) Serial section scanning electron microscopy (S3EM) onsilicon wafers for ultra-structural volume imaging of cells andtissues. PLoS One 7; e35172.
5. Knott, G., Marchman, H., Wall, D. and Lich, B. (2008) Serialsection scanning electron microscopy of adult brain tissue usingfocused ion beam milling. J. Neurosci. 28; 2959–2964.
6. Koga, D., Kusumi, S. and Ushiki, T. (2015) Three-dimensionalshape of the Golgi apparatus in different cell types: serial sectionscanning electron microscopy of the osmium-impregnated Golgiapparatus. Microscopy (Oxf) 65; 145–157.
7. Koike, T., Wakabayashi, T., Mori, T., Takamori, Y., Hirahara, Y.and Yamada, H. (2014) Sox2 in the adult rat sensory nervoussystem. Histochem. Cell Biol. 141; 301–309.
8. Micheva, K. D. and Smith, S. J. (2007) Array tomography: a newtool for imaging the molecular architecture and ultrastructure ofneural circuits. Neuron 55; 25–36.
9. Terasaki, M., Shemesh, T., Kasthuri, N., Klemm, R. W., Schalek,R., Hayworth, K. J., Hand, A. R., Yankova, M., Huber, G.,Lichtman, J. W., Rapoport, T. A. and Kozlov, M. M. (2013)Stacked endoplasmic reticulum sheets are connected byhelicoidal membrane motifs. Cell 154; 285–296.
10. Wacker, I., Spomer, W., Hofmann, A., Thaler, M., Hillmer, S.,Gengenbach, U. and Schröder, R. R. (2016) Hierarchicalimaging: a new concept for targeted imaging of large volumesfrom cells to tissues. BMC Cell Biol. 17; 38.
11. Wergin, W. P., Yaklich, R. W., Roy, S., Joy, D. C., Erbe, E. F.,Murphy, C. A. and Pooley, C. D. (1997) Imaging thin and thicksections of biological tissue with the secondary electron detectorin a field-emission scanning electron microscope. Scanning 19;386–395.
12. Wilke, S. A., Antonios, J. K., Bushong, E. A., Badkoobehi, A.,Malek, E., Hwang, M., Terada, M., Ellisman, M. H. and Ghosh,A. (2013) Deconstructing complexity: serial block-face electronmicroscopic analysis of the hippocampal mossy fiber synapse. J.Neurosci. 33; 507–522.
This is an open access article distributed under the Creative CommonsAttribution License, which permits unrestricted use, distribution, andreproduction in any medium, provided the original work is properly cited.
140 Koike et al.