Embed Size (px)
Citation preview
Buletin Pos dan Telekomunikasi Vol. 14 No.1 (2016): 39-50
39
Telecommunication Costs Incurred Expenses Society Effect of Technology
Adoption
Beban Biaya Telekomunikasi yang Dikeluarkan Masyarakat Pengaruh dari
Adopsi Teknologi
Sri Ariyanti Puslitbang Sumber Daya, Perangkat dan Penyelenggaraan Pos dan Informatika
Jl. Medan Merdeka Barat No.9 Jakarta 10110, Indonesia
e-mail:[email protected]
I N F O R M AT I O N AR T I C L E A B S T R A K
Manuscript received June 6, 2016
Revised June 19, 2016
Accepted June 20, 2016
Kata kunci :
teknologi
biaya
ARPU
Salah satu target Rencana Pita Lebar Indonesia tahun 2014-2019 adalah memberikan
akses bergerak kepada 52% populasi di wilayah pedesaan dengan data rate hingga
1Mbps. Target harga layanan pita lebar tertinggi adalah 5% dari rata-rata
pendapatan bulanan pada akhir tahun 2019 agar layanan pita lebar dapat terjangkau
oleh masyarakat luas. Rencana pita lebar dengan target harga dan minimal data rate
tersebut tidak akan tercapai tanpa adanya perubahan teknologi. Teknologi yang
mendukung terpenuhinya t tersebut antara lain teknologi 3.5G dan 4G LTE. Dalam
rangka upgrade teknologi tersebut, operator mengeluarkan biaya yang cukup besar. ,
perlu adanya biaya yang cukup besar yang dikeluarkan oleh operator. Biaya tersebut
sangat berpengaruh pada besar biaya yang akan dibebankan kepada pelanggan. Oleh
karena itu, perlu dikaji seberapa besar biaya yang ditanggung pelanggan seluler
setelah adanya teknologi baru. Penelitian ini bertujuan untuk mengetahui apakah
biaya yang dibebankan kepada masyarakat sudah sesuai dengan yang ditetapkan oleh
pemerintah dalam Rencana Pita Lebar Indonesia. Teknik penelitian menggunakan
pendekatan data kuantitatif yang dianalisis dengan ekonometrika. Hasil penelitian
menunjukkan bahwa berdasarkan data pengeluaran telekomunikasi rumah tangga
maupun data ARPU, biaya yang dibebankan kepada pelanggan sudah memenuhi
persyaratan yang telah ditetapkan dalam Rencana Pita Lebar Indonesia yaitu kurang
dari 5%.
A B S T R A C T Keywords:
technology
cost
ARPU
One of the Indonesia Broadband Plan in 2014 – 2019 is that it can be provided mobile
data reaching 52% rural areas with data rate up to 1 Mbps. In order to be affordable, so
that maximum price is 5% of the average monthly income at the end of 2019. That
data rate cannot be achieved without upgrading the technology. The technology of
3.5G and 4G are among others technology that can support high data rate. In order to
upgrade technology, it needs a considerable cost from mobile operators, while it can
influence the cost that will be charged to the customer. Therefore, this paper studied
how much the cost for data users after adopt new technology. This study aimed to
know whether social cost is appropriate to Indonesia Broadband Plan. This research
used a quantitative approach with econometrics analysis. The result showed that based
on data of Household Expenditure with Budget for Telecommunications and ARPU,
the cost charged to the customer has been complied with Indonesia Broadband Plan is
less than 5 %.
1. Introduction
Technology continues to change from year to year. Such changes cannot be separated from customers‘
demand in using the service. The users today are more likely to use data services than voice service. Data
services offer the use of a variety of applications, such as games, chat, e-mail, and so forth.
DOI: 10.17933/bpostel.2016.14010
4
Buletin Pos dan Telekomunikasi Vol. 14 No.1 (2016): 39-50
40
The data service could first be met with the presence of General Packet Radio Service (GPRS) technology,
the technology of 2.5G generation with data speeds up to 144.4 kbps (Smith, 2003). Furthermore there was 3G
technology i.e. Wideband Code Division Multiple Access (WCDMA) with characteristic data speeds up to 2
Mbps for users with a speed of 0 km / h, and 384 kbps for walkers, and 144 kbps for users moving at high
speed (Smith, 2003). Then the fourth-generation technology with higher data speeds than the previous one
came, reached 150 Mbps for downlink (Qualqomm, 2014). The application of new technology will increase the
burden on the infrastructure side of the mobile operator. Operators must build new infrastructure or upgrade the
system so that new technology can be applied. Based on data from Telkomsel, the costs required to implement
the 4G technology is ± 500 million for the first e-NodeB (Research SDPPI, 2015). The increasing cost for
building new infrastructure will certainly affect the costs charged to the customer. Based on the document of
Indonesia Broadband Plan in 2014-2019, in 2019 national broadband development target was planned to
provide fixed access in urban areas as much as 71% households and 30% population with a data rate up to 20
Mbps, as well as mobile access to entire population with data rate up to 1 Mbps. As for rural areas, broadband
can reach 49% households and 6% population with a data rate up to 10 Mbps as well as mobile access to 52%
of population with a data rate up to 1 Mbps (Bappenas, 2014). The price of broadband services is targeted at
maximum of 5% of the average monthly income at the end of 2019 in order to be affordable by the public
(Bappenas, 2014).
Broadband plan with a minimum target of 10 Mbps data rate will not be achieved without significant
changes in technology. One of technologies that supports the fulfillment of the data rate is the 4G LTE
technology. For Development of new technologies, substantial costs should be incurred by the operator. These
costs affect the costs that will be charged to the customer. Therefore, this study examines how much cost is
charged to mobile customers after their new technology. This study aims to determine whether the costs
imposed on users is in conformity with what set by the government in Indonesia Broadband Plan.
2. Literature review
2.1. Definition of econometrics
Econometrics consists of two words, namely economic and metrika. Economics is an economic activity,
i.e. human activities to meet their needs through the efforts, sacrificing resources as efficiently and effectively
as possible to get a goal as optimally as possible. While Metrika is a measurement activities. So that
econometrics is a measuring activity of economic activities (Rini Handayani, SE., 2013). Econometrics can
also be interpreted by applying statistical methods to measure and assess the economic hypothesis that is
related data (Dougherty, 2014). Econometric model is used in business, finance, economics, administration,
consulting and other fields. Econometric model used routinely for tasks ranging from description to analysis of
policies and ultimately take important decisions (Diebold, 2016).
Econometrics is much more than a statistic that uses economic data, although it is closely associated with
the statistics.
Econometrics should realize that economic data could not be obtained from well designed
experiment. Whereas, econometric generally takes observational data given.
Econometrics should deal with special issue and something that arises regularly on economic
data such as trends, cycles and seasonal.
Econometrics is sometimes prone to non-causal predictive modeling, which requires
correlation or rather a conditional expectation, and sometimes evaluates the impact that
involves causational issues deeper.
Telecommunication Costs Incurred Expenses Society Effect of Technology Adoption (Sri Ariyanti)
41
2.2. Methodology of econometrics
Econometrics is used to analyze economic problems. Prior to the analysis, the correct methodology is
needed. The process includes (Gujarati, 2004):
1) Determine the theories and hypotheses
2) Determine the mathematical models and theories
3) Determine the statistical or econometric models
4) Get the data
5) Estimate the parameters of econometric models
6) Test the hypothesis
7) Forecast or predict
8) Use the model for controlling or policy purposes
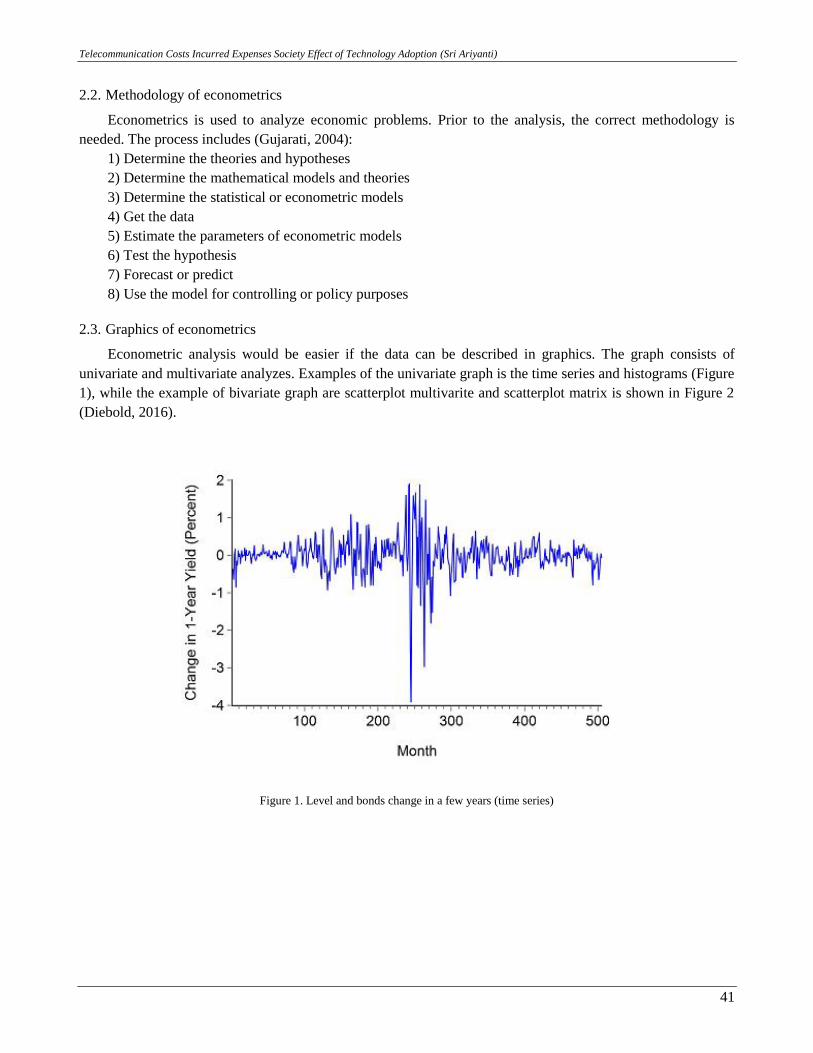
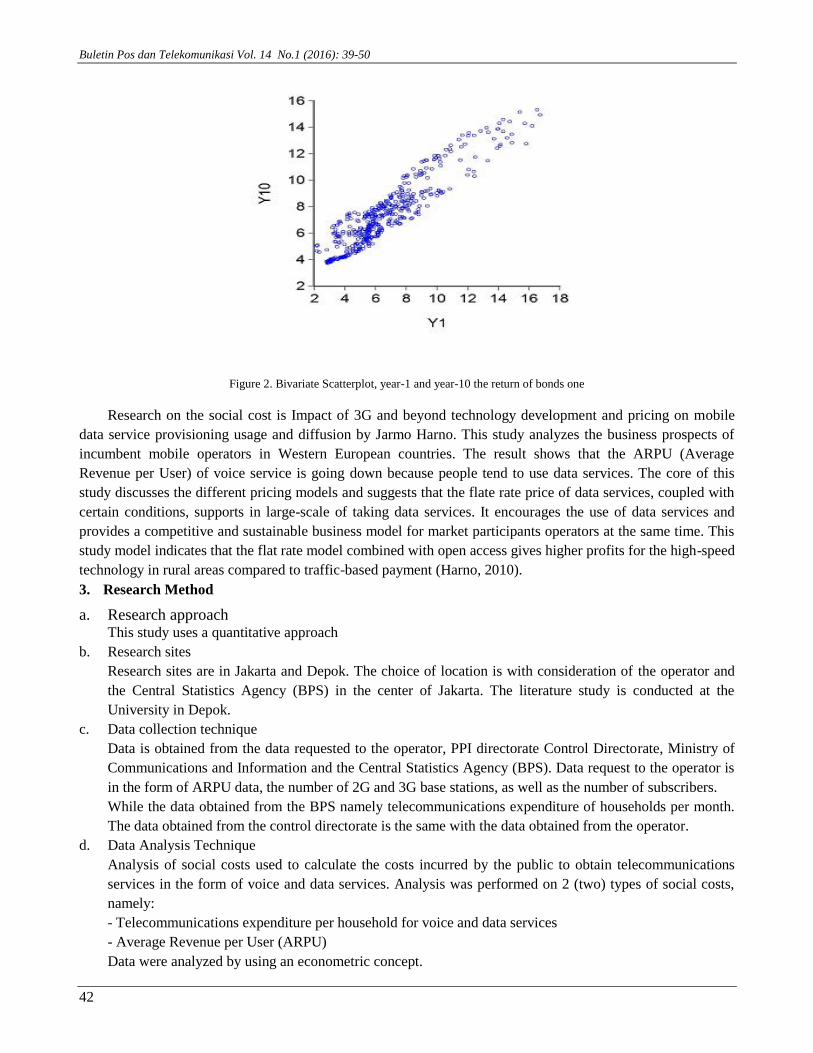
2.3. Graphics of econometrics
Econometric analysis would be easier if the data can be described in graphics. The graph consists of
univariate and multivariate analyzes. Examples of the univariate graph is the time series and histograms (Figure
1), while the example of bivariate graph are scatterplot multivarite and scatterplot matrix is shown in Figure 2
(Diebold, 2016).
Figure 1. Level and bonds change in a few years (time series)
Buletin Pos dan Telekomunikasi Vol. 14 No.1 (2016): 39-50
42
Figure 2. Bivariate Scatterplot, year-1 and year-10 the return of bonds one
Research on the social cost is Impact of 3G and beyond technology development and pricing on mobile
data service provisioning usage and diffusion by Jarmo Harno. This study analyzes the business prospects of
incumbent mobile operators in Western European countries. The result shows that the ARPU (Average
Revenue per User) of voice service is going down because people tend to use data services. The core of this
study discusses the different pricing models and suggests that the flate rate price of data services, coupled with
certain conditions, supports in large-scale of taking data services. It encourages the use of data services and
provides a competitive and sustainable business model for market participants operators at the same time. This
study model indicates that the flat rate model combined with open access gives higher profits for the high-speed
technology in rural areas compared to traffic-based payment (Harno, 2010).
3. Research Method
a. Research approach This study uses a quantitative approach
b. Research sites
Research sites are in Jakarta and Depok. The choice of location is with consideration of the operator and
the Central Statistics Agency (BPS) in the center of Jakarta. The literature study is conducted at the
University in Depok.
c. Data collection technique
Data is obtained from the data requested to the operator, PPI directorate Control Directorate, Ministry of
Communications and Information and the Central Statistics Agency (BPS). Data request to the operator is
in the form of ARPU data, the number of 2G and 3G base stations, as well as the number of subscribers.
While the data obtained from the BPS namely telecommunications expenditure of households per month.
The data obtained from the control directorate is the same with the data obtained from the operator.
d. Data Analysis Technique
Analysis of social costs used to calculate the costs incurred by the public to obtain telecommunications
services in the form of voice and data services. Analysis was performed on 2 (two) types of social costs,
namely:
- Telecommunications expenditure per household for voice and data services
- Average Revenue per User (ARPU)
Data were analyzed by using an econometric concept.
Telecommunication Costs Incurred Expenses Society Effect of Technology Adoption (Sri Ariyanti)
43
4. Result and Discussion
The social cost of this research is limited to telecom expense per month and ARPU. The social costs with
adoption of 4G technology could not be analyzed yet because the implementation of these new technologies
began in early 2015 so that the necessary data could not be obtained. Therefore, the social costs was obtained
by using data of 2G technology (in this case is voice service) and 3G (data). The analysis in this study uses
econometrics to obtain fees charged to customers. The software used for the simulation is Eviews.
4.1. Analysis of Social Costs from Telecommunications Expense View
The cost of the social viewed from telecom expense is influenced by the price of voice services, the price of
the data, the capacity of 2G and 3G technology. Telecommunications expenditure data is obtained from data on
average household consumption for telecommunications by province from the year 2011 - 2013
(telecommunications statistics, 2013). The capacity of 2G and 3G technology is obtained from the following
equation:
2G capacity x = the number of 2G BTS x 2G data rate (9.6 kbps) ...............................................................(1)
3G capacity x = the number of 3G BTS x 3G data rate (384 kbps) .............................................................(2)
The number of 2G and 3G BTS as well as the price of voice or data services is obtained from mobile
operators and control Directorate, DG Implementation of Post and Information Technology, Ministry of
Communications and Information Technology.
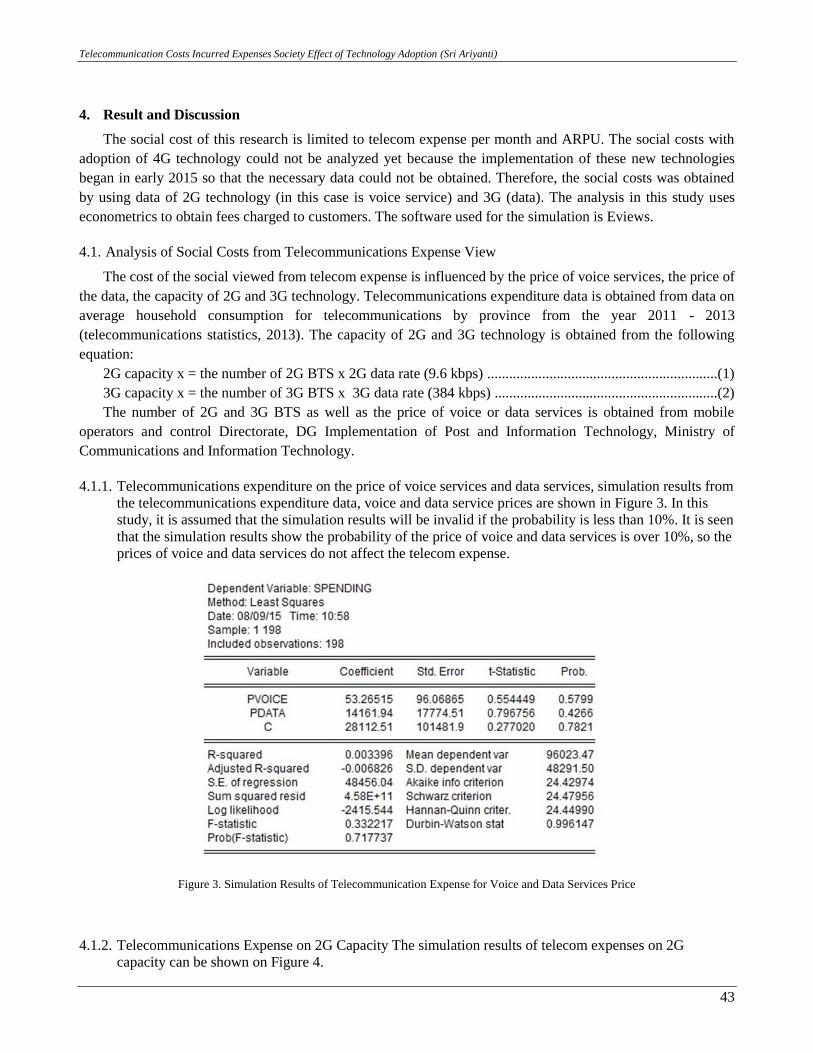
4.1.1. Telecommunications expenditure on the price of voice services and data services, simulation results from
the telecommunications expenditure data, voice and data service prices are shown in Figure 3. In this
study, it is assumed that the simulation results will be invalid if the probability is less than 10%. It is seen
that the simulation results show the probability of the price of voice and data services is over 10%, so the
prices of voice and data services do not affect the telecom expense.
Figure 3. Simulation Results of Telecommunication Expense for Voice and Data Services Price
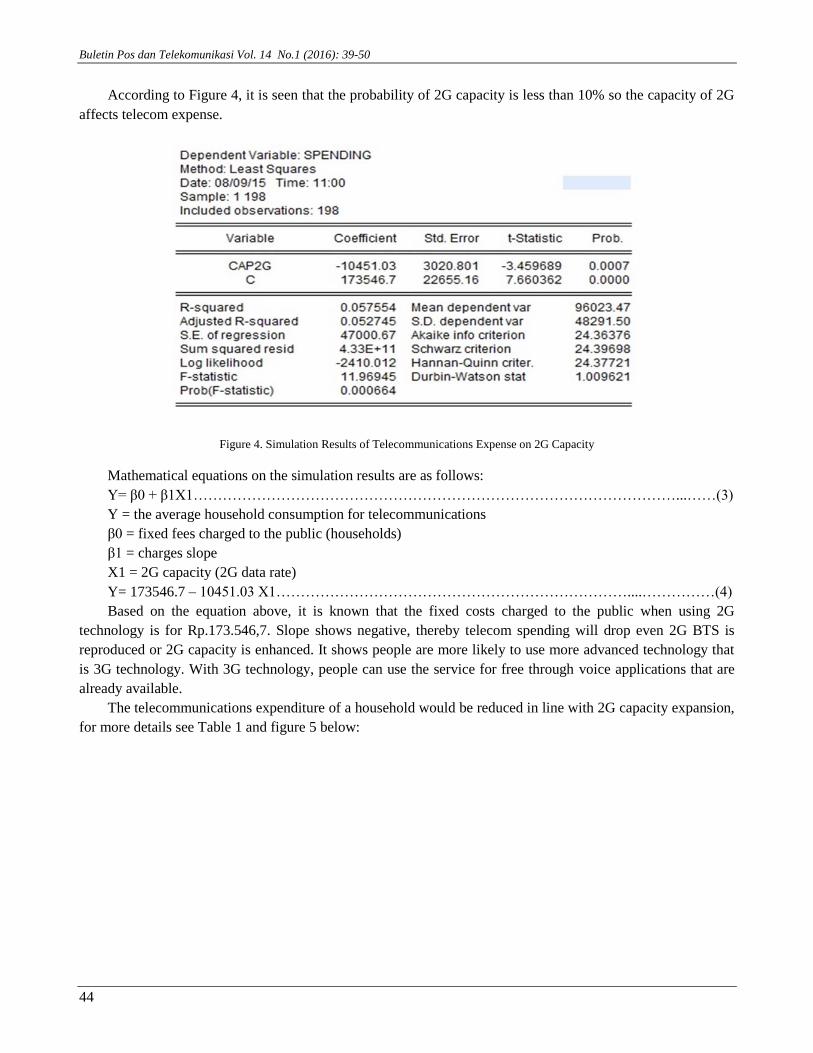
4.1.2. Telecommunications Expense on 2G Capacity The simulation results of telecom expenses on 2G
capacity can be shown on Figure 4.
Buletin Pos dan Telekomunikasi Vol. 14 No.1 (2016): 39-50
44
According to Figure 4, it is seen that the probability of 2G capacity is less than 10% so the capacity of 2G
affects telecom expense.
Figure 4. Simulation Results of Telecommunications Expense on 2G Capacity
Mathematical equations on the simulation results are as follows:
Y= β0 + β1X1………………………………………………………………………………………...……(3)
Y = the average household consumption for telecommunications
β0 = fixed fees charged to the public (households)
β1 = charges slope
X1 = 2G capacity (2G data rate)
Y= 173546.7 – 10451.03 X1………………………………………………………………....……………(4)
Based on the equation above, it is known that the fixed costs charged to the public when using 2G
technology is for Rp.173.546,7. Slope shows negative, thereby telecom spending will drop even 2G BTS is
reproduced or 2G capacity is enhanced. It shows people are more likely to use more advanced technology that
is 3G technology. With 3G technology, people can use the service for free through voice applications that are
already available.
The telecommunications expenditure of a household would be reduced in line with 2G capacity expansion,
for more details see Table 1 and figure 5 below:
Telecommunication Costs Incurred Expenses Society Effect of Technology Adoption (Sri Ariyanti)
45
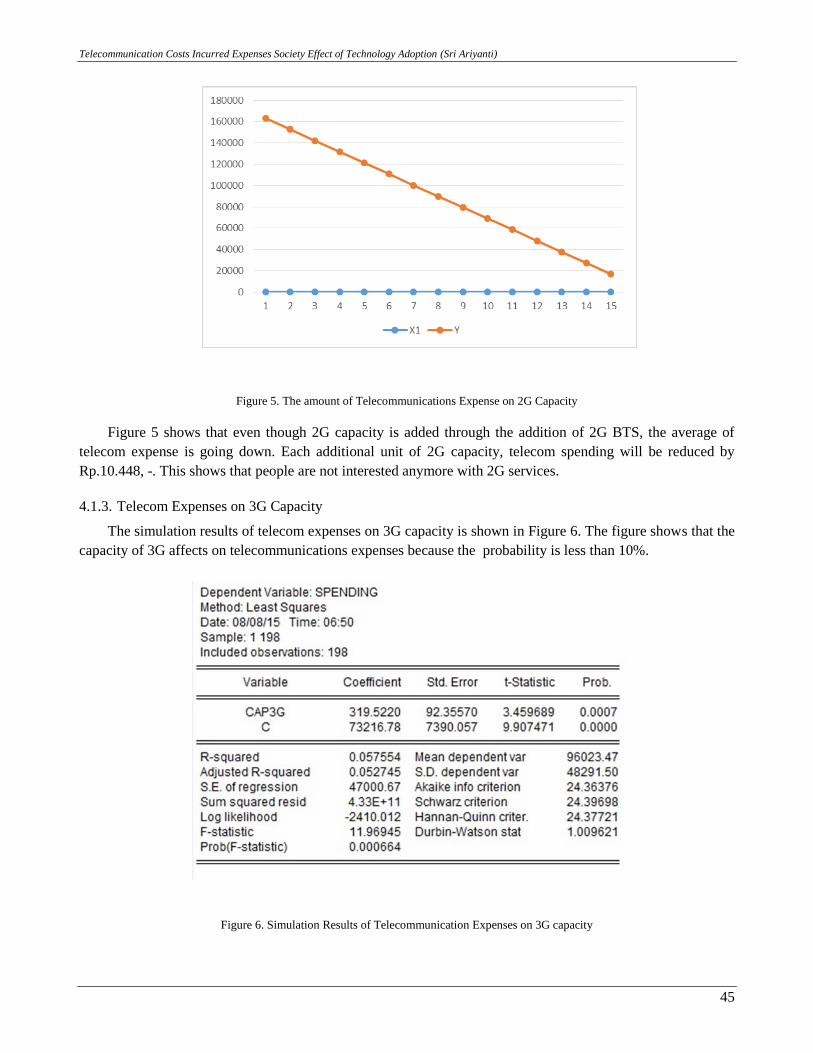
Figure 5. The amount of Telecommunications Expense on 2G Capacity
Figure 5 shows that even though 2G capacity is added through the addition of 2G BTS, the average of
telecom expense is going down. Each additional unit of 2G capacity, telecom spending will be reduced by
Rp.10.448, -. This shows that people are not interested anymore with 2G services.
4.1.3. Telecom Expenses on 3G Capacity
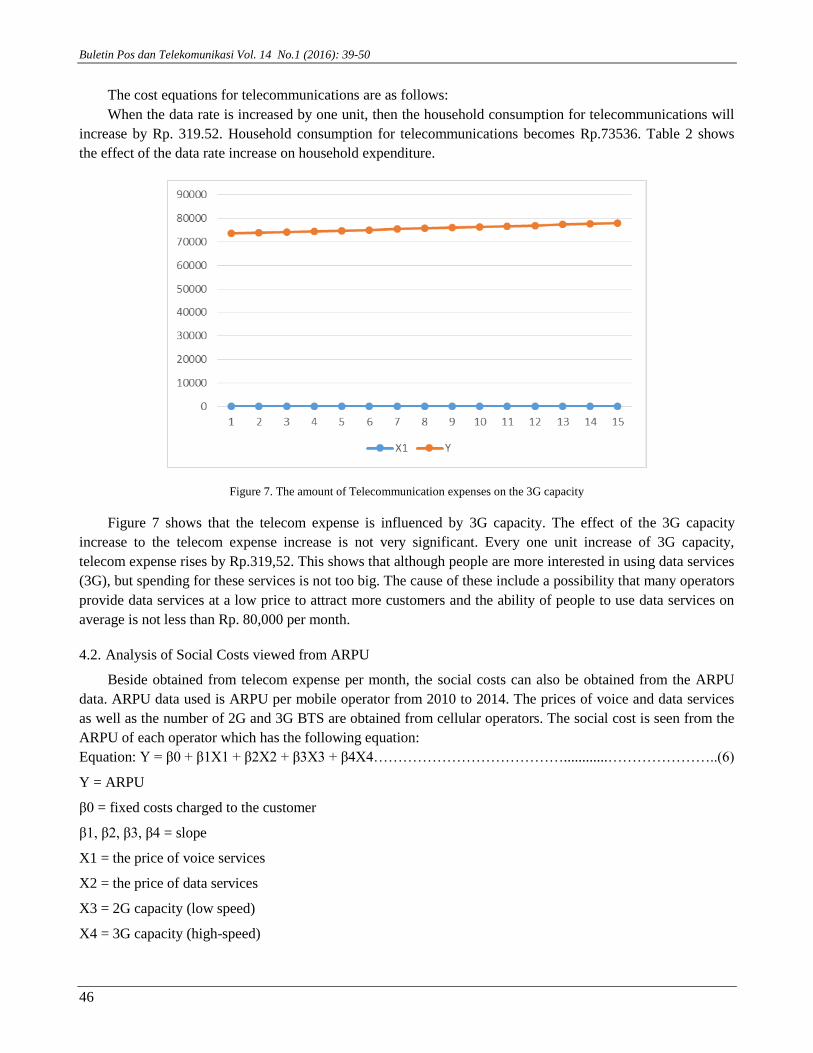
The simulation results of telecom expenses on 3G capacity is shown in Figure 6. The figure shows that the
capacity of 3G affects on telecommunications expenses because the probability is less than 10%.
Figure 6. Simulation Results of Telecommunication Expenses on 3G capacity
Buletin Pos dan Telekomunikasi Vol. 14 No.1 (2016): 39-50
46
The cost equations for telecommunications are as follows:
When the data rate is increased by one unit, then the household consumption for telecommunications will
increase by Rp. 319.52. Household consumption for telecommunications becomes Rp.73536. Table 2 shows
the effect of the data rate increase on household expenditure.
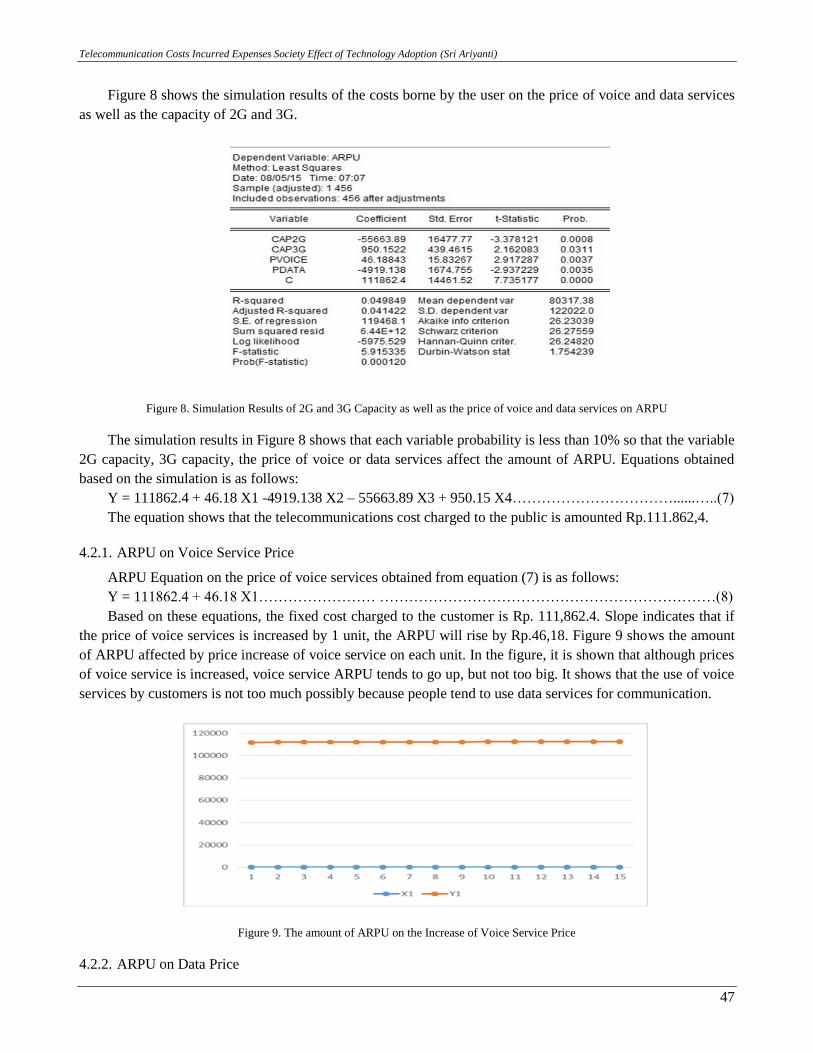
Figure 7. The amount of Telecommunication expenses on the 3G capacity
Figure 7 shows that the telecom expense is influenced by 3G capacity. The effect of the 3G capacity
increase to the telecom expense increase is not very significant. Every one unit increase of 3G capacity,
telecom expense rises by Rp.319,52. This shows that although people are more interested in using data services
(3G), but spending for these services is not too big. The cause of these include a possibility that many operators
provide data services at a low price to attract more customers and the ability of people to use data services on
average is not less than Rp. 80,000 per month.
4.2. Analysis of Social Costs viewed from ARPU
Beside obtained from telecom expense per month, the social costs can also be obtained from the ARPU
data. ARPU data used is ARPU per mobile operator from 2010 to 2014. The prices of voice and data services
as well as the number of 2G and 3G BTS are obtained from cellular operators. The social cost is seen from the
ARPU of each operator which has the following equation:
Equation: Y = β0 + β1X1 + β2X2 + β3X3 + β4X4…………………………………............…………………..(6)
Y = ARPU
β0 = fixed costs charged to the customer
β1, β2, β3, β4 = slope
X1 = the price of voice services
X2 = the price of data services
X3 = 2G capacity (low speed)
X4 = 3G capacity (high-speed)
Telecommunication Costs Incurred Expenses Society Effect of Technology Adoption (Sri Ariyanti)
47
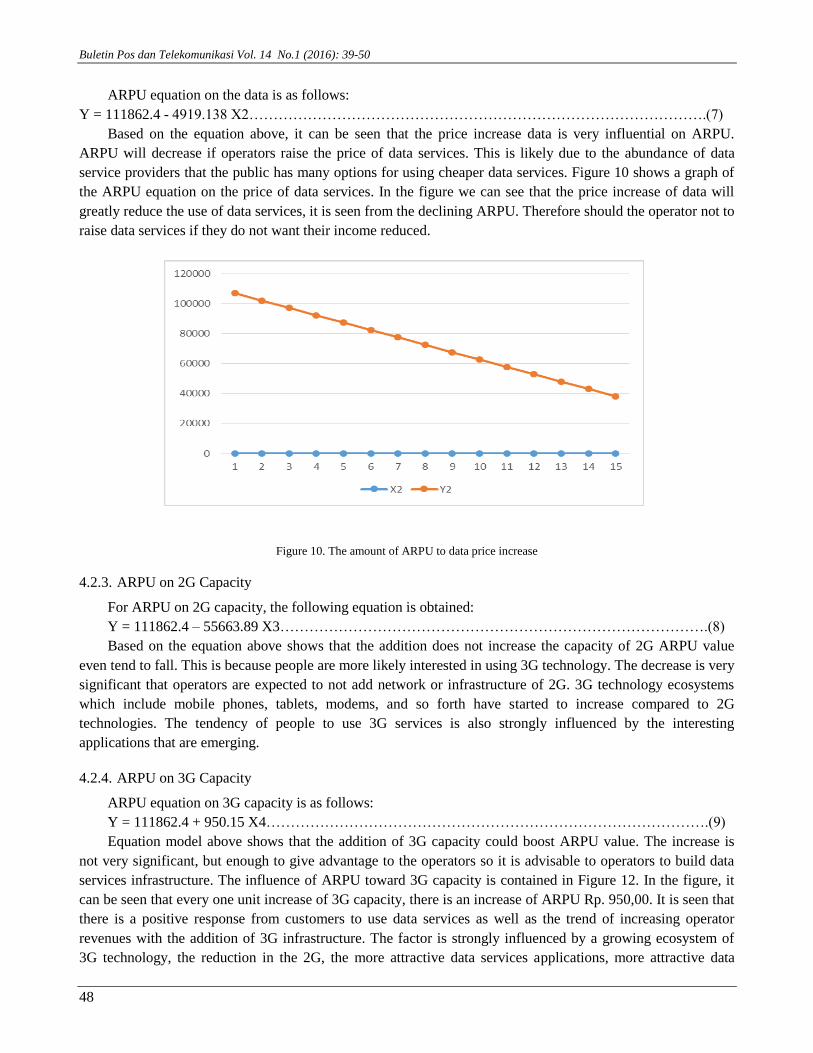
Figure 8 shows the simulation results of the costs borne by the user on the price of voice and data services
as well as the capacity of 2G and 3G.
Figure 8. Simulation Results of 2G and 3G Capacity as well as the price of voice and data services on ARPU
The simulation results in Figure 8 shows that each variable probability is less than 10% so that the variable
2G capacity, 3G capacity, the price of voice or data services affect the amount of ARPU. Equations obtained
based on the simulation is as follows:
Y = 111862.4 + 46.18 X1 -4919.138 X2 – 55663.89 X3 + 950.15 X4……………………………......…..(7)
The equation shows that the telecommunications cost charged to the public is amounted Rp.111.862,4.
4.2.1. ARPU on Voice Service Price
ARPU Equation on the price of voice services obtained from equation (7) is as follows:
Y = 111862.4 + 46.18 X1…………………… ……………………………………………………………(8)
Based on these equations, the fixed cost charged to the customer is Rp. 111,862.4. Slope indicates that if
the price of voice services is increased by 1 unit, the ARPU will rise by Rp.46,18. Figure 9 shows the amount
of ARPU affected by price increase of voice service on each unit. In the figure, it is shown that although prices
of voice service is increased, voice service ARPU tends to go up, but not too big. It shows that the use of voice
services by customers is not too much possibly because people tend to use data services for communication.
Figure 9. The amount of ARPU on the Increase of Voice Service Price
4.2.2. ARPU on Data Price
Buletin Pos dan Telekomunikasi Vol. 14 No.1 (2016): 39-50
48
ARPU equation on the data is as follows:
Y = 111862.4 - 4919.138 X2………………………………………………………………………………….(7)
Based on the equation above, it can be seen that the price increase data is very influential on ARPU.
ARPU will decrease if operators raise the price of data services. This is likely due to the abundance of data
service providers that the public has many options for using cheaper data services. Figure 10 shows a graph of
the ARPU equation on the price of data services. In the figure we can see that the price increase of data will
greatly reduce the use of data services, it is seen from the declining ARPU. Therefore should the operator not to
raise data services if they do not want their income reduced.
Figure 10. The amount of ARPU to data price increase
4.2.3. ARPU on 2G Capacity
For ARPU on 2G capacity, the following equation is obtained:
Y = 111862.4 – 55663.89 X3…………………………………………………………………………….(8)
Based on the equation above shows that the addition does not increase the capacity of 2G ARPU value
even tend to fall. This is because people are more likely interested in using 3G technology. The decrease is very
significant that operators are expected to not add network or infrastructure of 2G. 3G technology ecosystems
which include mobile phones, tablets, modems, and so forth have started to increase compared to 2G
technologies. The tendency of people to use 3G services is also strongly influenced by the interesting
applications that are emerging.
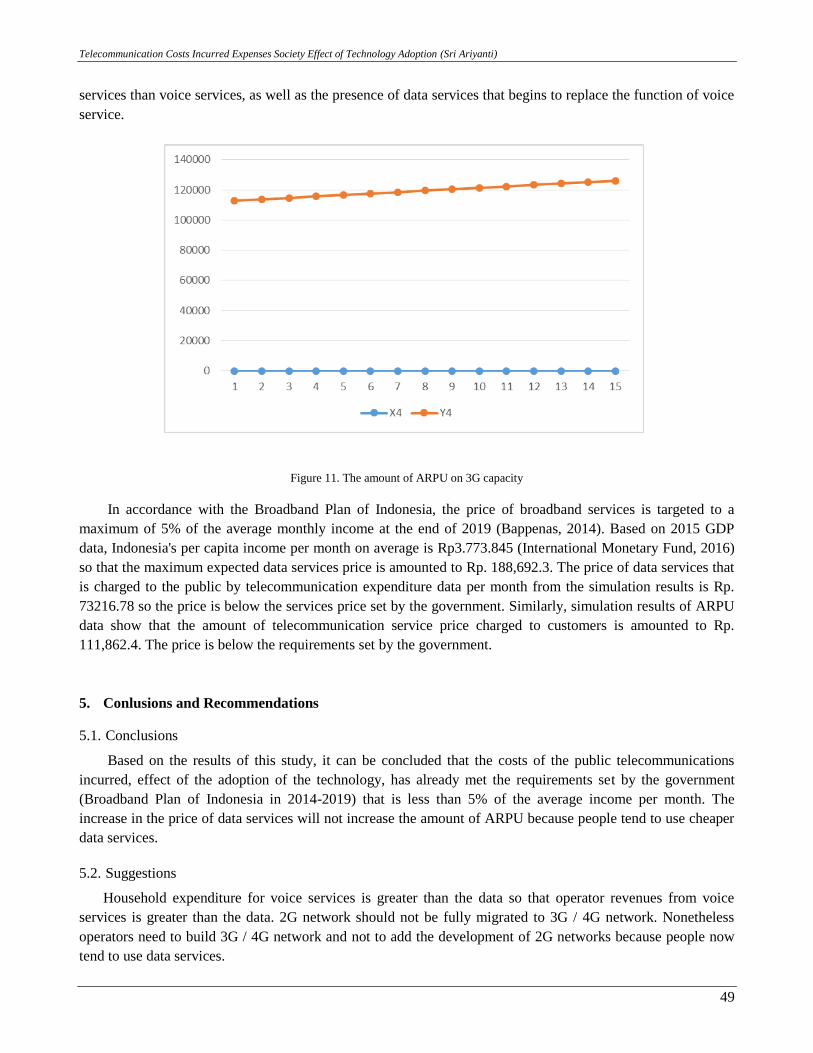
4.2.4. ARPU on 3G Capacity
ARPU equation on 3G capacity is as follows:
Y = 111862.4 + 950.15 X4……………………………………………………………………………….(9)
Equation model above shows that the addition of 3G capacity could boost ARPU value. The increase is
not very significant, but enough to give advantage to the operators so it is advisable to operators to build data
services infrastructure. The influence of ARPU toward 3G capacity is contained in Figure 12. In the figure, it
can be seen that every one unit increase of 3G capacity, there is an increase of ARPU Rp. 950,00. It is seen that
there is a positive response from customers to use data services as well as the trend of increasing operator
revenues with the addition of 3G infrastructure. The factor is strongly influenced by a growing ecosystem of
3G technology, the reduction in the 2G, the more attractive data services applications, more attractive data
Telecommunication Costs Incurred Expenses Society Effect of Technology Adoption (Sri Ariyanti)
49
services than voice services, as well as the presence of data services that begins to replace the function of voice
service.
Figure 11. The amount of ARPU on 3G capacity
In accordance with the Broadband Plan of Indonesia, the price of broadband services is targeted to a
maximum of 5% of the average monthly income at the end of 2019 (Bappenas, 2014). Based on 2015 GDP
data, Indonesia's per capita income per month on average is Rp3.773.845 (International Monetary Fund, 2016)
so that the maximum expected data services price is amounted to Rp. 188,692.3. The price of data services that
is charged to the public by telecommunication expenditure data per month from the simulation results is Rp.
73216.78 so the price is below the services price set by the government. Similarly, simulation results of ARPU
data show that the amount of telecommunication service price charged to customers is amounted to Rp.
111,862.4. The price is below the requirements set by the government.
5. Conlusions and Recommendations
5.1. Conclusions
Based on the results of this study, it can be concluded that the costs of the public telecommunications
incurred, effect of the adoption of the technology, has already met the requirements set by the government
(Broadband Plan of Indonesia in 2014-2019) that is less than 5% of the average income per month. The
increase in the price of data services will not increase the amount of ARPU because people tend to use cheaper
data services.
5.2. Suggestions
Household expenditure for voice services is greater than the data so that operator revenues from voice
services is greater than the data. 2G network should not be fully migrated to 3G / 4G network. Nonetheless
operators need to build 3G / 4G network and not to add the development of 2G networks because people now
tend to use data services.
Buletin Pos dan Telekomunikasi Vol. 14 No.1 (2016): 39-50
50
6. Acknowledgements
Praise be to Allah so that I can complete this research. I Also would like to thank the head of the research
and development of human resources, communications and Informatics ministry that has provided support and
guidance in this study. In addition, I thank the head SDPPI Research Center along with other officials at the
SDPPI who has provided facilities and infrastructure for the completion of this study.
References
Bappenas. (2014). Rencana PitaLebar Indonesia (Indonesia Broadband Plan) 2014 - 2019. Jakarta.
Diebold, F. X. (2016). Econometrics Streamlined , Applied and e-Aware (2016th ed.). University of Pennsylvania.
Dougherty, C. (2014). Elements of econometrics. London: University of London.
Gujarati, D. N. (2004). Basic Econometrics. New York: Mc Graw Hill.
Harno, J. (2010). Impact of 3G and beyond technology development and pricing on mobile data service provisioning, usage and
diffusion. Telematics and Informatics, 27(3), 269–282. doi:10.1016/j.tele.2009.10.001
International Monetary Fund. (2016). Report for Selected Countries and Subjects. Retrieved June 6, 2016, from
http://www.imf.org/external/pubs/ft/weo/2016
Penabaena-Niebles, R., Cantillo, V., & Moura, J. L. (2015). Impact of transition between signal timing plans in social cost based in
delay, fuel consumption and air emissions. Transportation Research Part D: Transport and Environment, 41, 445–456.
doi:10.1016/j.trd.2015.10.018
Puslitbang SDPPI. (2015). Biaya Pembangunan Jaringan Pita Lebar Akses Bergerak di Indonesia: Kajian Biaya Sosial Ekonomi
Adopsi Teknologi.
Qualqomm. (2014). The Evolution of Mobile Technologies : The mobile experience is expanding everywhere Billions of Mobile
Connections Billions of Mobile Experiences.
Rini Handayani, SE., M. S. (2013). Pengantar Ekonometrika. STIE Atma Bhakti Surakarta.
Smith, C. (2003). 3G Wireless Networks. McGraw-Hill telecom.