Embed Size (px)
Citation preview

(TSE code: 8984)
Investor Presentation
The 23rd Period Ended Aug. 2017October 19, 2017

Table of Contents
1
1. Financial Results Page
Financial Highlights for August 2017 Period 4
Statement of Income for August 2017 Period 5
Balance Sheet for August 2017 Period 6
2. Operation Status
Overview of Acquisitions in April 2017 8
Property Replacement in July - August 2017 9
Overview of Acquisitions in August 2017 10
Portfolio Summary (as of August 31, 2017) 11
Operation Status of Logistics Properties 12
Operation Status of Residential Properties 13
Operation Status of Retail Properties 14
3. Financial Status
Financial Status 16-17
4. Initiatives to Pursue Growth
Growth Track Record and Asset Size Target 19
Future Growth Strategy 20
Pipeline of Daiwa House Group 21-22
5. Financial Forecasts
Financial Forecasts for Feb. 2018 and Aug. 2018 Periods 24
Appendix Page
Distribution Policy 26
Historical Financial Data 27
Historical Portfolio Data 28
Balance Sheets 29
Statements of Income 30
Market Environment for Logistics Properties 31
Market Environment for Residential Properties 32
Market Environment for Retail and Hotel Properties 33
Sustainability Initiatives 34
Portfolio List 35-37
Rent Revision Schedule of Logistics Properties 38-39
Rent Revision Schedule of Retail Properties 40
Appraisal Value Changes Comparison 41-47
Unit Price Performance 48
Unitholders 49
REIT Structure 50
Executive Summary

Executive Summary
2
Financial Results Aug. 2017 DPU 4,964 yen (forecast as of Apr. 2017: 4,800 yen)
Raised 46.4 Bn yen from the first equity offering after the merger
Operation Status
Acquired 15 properties for 67.9 Bn yen in Apr.
Replaced properties in Jul. and Aug.
(acquired 2 properties for 5.4 Bn yen and sold 7 properties for 10.1 Bn yen)
Aug. 2017 occupancy remained stable at a high level of 99.2 % (+0.2 p.p.)
Financial Status JCR credit rating upgraded to “AA (Stable)” from “AA- (Positive)” in Oct.
Further lengthening and diversifying debt maturities and fixing interest rates
Initiatives to
Pursue Growth
Acquired 24 properties for 96.1 Bn yen since the transition to a diversified
REIT upon the merger
Aim 800 Bn yen in asset size by leveraging Daiwa House Group pipeline
Financial Forecasts Feb. 2018 Forecast DPU 5,050 yen
Aug. 2018 Forecast DPU 4,900 yen

1. Financial Results

Financial Highlights for August 2017 Period
4
Asset classNOI
(mil yen)
Acquisition price
(mil yen)NOI yield
Logistics 6,361 260,119 4.9 %
Residential 6,828 250,448 5.4 %
Retail 1,522 55,730 5.4 %
Other 359 11,480 6.2 %
Portfolio 15,072 577,777 5.2 %
Asset class Feb. 2017 Aug. 2017 Change
Logistics 100.0 % 100.0 % -
Residential 97.0 % 97.3 % +0.3 p.p.
Retail 99.4 % 98.9 % -0.5 p.p.
Other 99.5 % 100.0 % +0.5 p.p.
Portfolio 99.0 % 99.2 % +0.2 p.p.
DPU External Growth Financial Status
NOI yield Period end occupancy
4,964 yen
Acquisition of
17 properties
73.3 Bn yen
Raised 46.4 Bn yen from equity offering
Retained gain on sale of properties of
1.5 Bn yen
Feb. 2017 Aug. 2017
Number of
properties189 properties 199 properties
AUM 513.7 Bn yen 577.7 Bn yen
Logistics 13 properties
Residential 1 property
Retail 2 properties
Other 1 property
Sale of 7 residential properties
NAV per unit 258,421 yen
(+9,959 yen vs Feb. 2017)
LTV (including goodwill) 41.4 %
(-0.5 p.p. vs Feb. 2017)
LTV (excluding goodwill) 46.5 %
(-1.6 p.p. vs Feb. 2017)
+164 yen vs Forecast
+164 yen vs Feb. 2017
(Note) Excluding the 7 residential properties sold during the period ended Aug. 2017.

Statement of Income for August 2017 Period
5
Increase in operating revenue 1,674 mil yen
・Favorable occupancy at residential properties
・Gain on sale of properties
Decrease in property operating expenses 22 mil yen
・Decrease in management fees
・Increase in repairs and maintenance expenses
Decrease in other operating expenses 25 mil yen
・Decrease in non-deductible consumption taxes
Increase in non-operating revenue 24 mil yen
・Recording of refunded consumption taxes
Decrease in non-operating expenses 80 mil yen
・Decrease in interest and borrowing related expenses
Decrease in extraordinary losses 10 mil yen
・Decrease in D Project Shin-Misato litigation expenses
Accumulation of reserve for distribution -1,559 mil yen
・Retained gain on sale of properties and refunded
consumption taxes as reserve for distribution
Major Variation Factors (vs Forecast)(mil yen)
Period ended
Feb. 2017Period ended Aug. 2017 Period ended Aug. 2017
Result ResultPeriod-on-
period changeForecast
as of 2017/4/19
Result vs
Forecast
Operating Revenue 17,531 21,015 3,484 19,341 1,674
Rental revenue 17,531 19,479 1,948 19,341 138
Gain on sale of properties - 1,536 1,536 - 1,536
Operating Expenses 11,963 11,623 -340 11,670 -47
Property operating expenses 7,493 7,906 412 7,928 -22
Property operating expenses
(excluding depreciation)4,132 4,193 60 4,214 -21
Depreciation 3,361 3,713 352 3,713 -0
Other operating expenses 4,465 3,716 -748 3,742 -25
Amortization of goodwill 1,982 1,982 - 1,982 -
Operating Income 5,567 9,392 3,825 7,670 1,722
Non-operating income 32 29 -2 4 24
Non-operating expenses 1,125 1,448 322 1,528 -80
Interest and borrowing related
expenses1,123 1,216 92 1,272 -56
Ordinary Income 4,474 7,974 3,500 6,146 1,828
Extraordinary losses 80 5 -74 15 -10
Net Income 4,393 7,968 3,574 6,129 1,838
Reversal of retained earnings for
temporary difference adjustment- 1,980 1,980 1,982 -1
Reversal (accumulation) of reserve
for distribution (Note) 2,899 -1,559 -4,459 - -1,559
Total distribution 7,292 8,389 1,096 8,112 277
DPU 4,800 yen 4,964 yen 164 yen 4,800 yen 164 yen
Favorable occupancy led to an operating revenue increase for 9 consecutive periods and 4,964 yen of DPU
Retained gain on sale of properties as reserve for distribution
(Note) Reversal of reserve for distribution for the period ended Feb. 2017: Netting the amount of reversal (2,920 mil yen) and accumulation (21 mil yen)
(mil yen)
Feb. 2017 Aug. 2017
Capex 843 865
Repairs and
maintenance expenses569 473
Restoration costs 293 305
Total 1,706 1,644
Capex, repairs, and restoration costs
[Contribution to income]

Balance Sheet for August 2017 Period
6
Unrealized Gain by Asset Class
Increase in total assets 78,216 mil yen
・Acquisition of 17 properties
・Sale of 7 properties
・Increase in cash and cash equivalents
Increase in interest-bearing debt 29,105 mil yen
・New loans
Increase in net assets 47,016 mil yen
・Equity raised from the equity offering
Major Variation Factors (period-on-period)(mil yen)
Period ended
Feb. 2017
Period ended
Aug. 2017
Period-on-period
change
Total Assets 604,142 682,359 78,216
Current assets 21,630 38,119 16,488
Non-current assets 582,418 644,154 61,735
Investment properties 494,701 557,708 63,007
Intangible assets 82,811 80,788 -2,022
Goodwill 77,306 75,324 -1,982
Total Liabilities 273,837 305,038 31,200
Current liabilities 57,428 21,274 -36,153
Interest-bearing debt 52,495 16,000 -36,495
Non-current liabilities 216,409 283,763 67,354
Interest-bearing debt 200,668 266,268 65,600
Net Assets 330,304 377,321 47,016
Retained earnings for temporary
difference adjustment (Note 1)- 14,748 14,748
Reserve for distribution (Note 2) 17,705 57 -17,647
LTV (including goodwill) 41.9 % 41.4 % -0.5 p.p.
LTV (excluding goodwill) 48.1 % 46.5 % -1.6 p.p.
Number of investment units issued 1,519,280 units 1,690,000 units 170,720 units
Net Assets per unit 217,408 yen 223,267 yen 5,859 yen
NAV per unit (Note 3) 248,462 yen 258,421 yen 9,959 yen
(mil yen)
Asset class Book value Appraisal value Unrealized gain
Logistics 258,948 270,276 11,327
Residential 236,982 281,828 44,845
Retail 55,705 57,980 2,274
Other 11,376 12,340 963
Total 563,013 622,424 59,410
(Note 1) Retained earnings for temporary difference adjustment for the period ended Aug. 2017 represents the amount before
reversal and the amount after reversal is 12,767 mil yen.
(Note 2) Reserve for distribution for the period ended Aug. 2017 represents the amount before accumulation and the amount
after accumulation is 1,617 mil yen.
(Note 3) NAV per unit: (Net Assets + unrealized gain or loss) / number of investment units issued
Raised 46.4 Bn yen of equity from the first global offering after the merger
Increase in appraisal value from the compression of the cap rate (+12.2 Bn yen vs Feb. 2017)
Trend of Unrealized Gain
Logistics
Residential
Retail
Other
0
10,000
20,000
30,000
40,000
50,000
60,000
70,000
Sep. 1, 2016(Merger)
Feb. 2017 Aug. 2017
(mil yen)
35,048
59,410
47,179

2. Operation Status

Overview of Acquisitions in April 2017
8
Property name Location Asset classAcquisition
date
Acquisition price
(mill yen)
Appraisal NOI
yield (Note)
Property age
(Note)Lessee
(Average)
lease term
(Average) remaining
lease term (Note)
DPL Misato Misato, Saitama Logistics Apr. 11, 2017 16,831 4.5% 3.8 yearsKokubu Group, ARATA, Kato
Sangyo, Nitori, etc.8.7 years 6.3 years
D Project Kawagoe III Kawagoe, Saitama Logistics Apr. 11, 2017 7,200 5.0% 2.8 years Hitachi Transport System Kanto 10.0 years 7.2 years
D Project Kazo Kazo, Saitama Logistics Apr. 11, 2017 3,300 5.1% 2.7 years Itochu Logistics 10.6 years 7.9 years
D Project Urayasu III Urayasu, Chiba Logistics Apr. 11, 2017 8,500 4.8% 11.4 years Daiwa Logistics 19.8 years 8.4 years
D Project Tomisato Tomisato, Chiba Logistics Apr. 11, 2017 5,000 5.1% 2.0 years Tokyo Nohin Daiko 10.8 years 8.8 years
D Project Kyotanabe Kyotanabe, Kyoto Logistics Apr. 11, 2017 3,520 5.8% 4.5 years Hutech norin 20.1 years 15.6 years
D Project Sendai Izumi Sendai, Miyagi Logistics Apr. 11, 2017 1,510 5.7% 3.0 years Mitsubishi Shokuhin Not disclosed Not disclosed
D Project Oyama Oyama, Tochigi Logistics Apr. 11, 2017 2,000 5.8% 7.1 years Mitsubishi Shokuhin Not disclosed Not disclosed
D Project Sano Sano, Tochigi Logistics Apr. 11, 2017 1,780 5.8% 2.9 years Toryusha 15.0 years 12.2 years
D Project Tatebayashi Tatebayashi, Gunma Logistics Apr. 11, 2017 3,100 5.7% 1.6 years Hitachi Transport System Kanto 15.0 years 13.4 years
D Project Kakegawa Kakegawa, Shizuoka Logistics Apr. 11, 2017 6,000 5.8% 2.7 years Hitachi Transport System Chubu 20.0 years 17.3 years
D Project Hiroshima Seifu Hiroshima, Hiroshima Logistics Apr. 11, 2017 3,820 5.8% 2.3 years MITSUI FOODS Not disclosed Not disclosed
D Project Tosu II Tosu, Saga Logistics Apr. 11, 2017 1,700 5.5% 0.3 years Marukyo Transportation 7.0 years 6.7 years
Logistics Sub-total / Average 64,261 5.1% 4.2 years - 13.5 years 9.7 years
Castalia Shinsakae II Nagoya, Aichi Residential Apr. 11, 2017 1,800 5.5% 1.2 years Daiwa Living Management - -
Sharp Hiroshima Building Hiroshima, Hiroshima Other Apr. 11, 2017 1,850 5.7% 1.2 years Sharp Not disclosed Not disclosed
Total / Average 67,911 5.1% 4.0 years - 13.7 years 10.0 years
(Note) Appraisal NOI yield, property age and (average) remaining lease term at the time of the acquisition of each property is indicated.
DPL Misato D Project Kawagoe III D Project Kazo D Project Urayasu III D Project Tomisato D Project Kyotanabe D Project Sendai Izumi D Project Oyama
D Project Sano D Project Tatebayashi D Project Kakegawa D Project Hiroshima Seifu D Project Tosu II Castalia Shinsakae IISharp Hiroshima
Building
Logistics Logistics
Logistics Logistics
Logistics
Logistics
Logistics
Logistics
Logistics
Logistics
Logistics Logistics
OtherResidential
Logistics

Property Replacement in July - August 2017
9
7 residential properties sold in July - August 2017
Total / Average
Sale priceFeb. 2017
NOI yield
Feb. 2017
NOI yield after
depreciation
Property
age
10,193 mil yen 5.2 % 3.6 % 13.0 years
2 retail properties acquired in August 2017
Total / Average
Acquisition priceAppraisal
NOI yield
NOI yield after
depreciation
Property
age
5,400 mil yen 5.2 % 4.5 % 0.3 years
Sold 7 residential properties and acquired 2 retail properties
Earmarking the remaining balance of cash reserves for future property acquisition, etc.
(Note 1) NOI yield and NOI yield after depreciation for the properties sold are based on actual NOI for the period ended Feb. 2017 and acquisition price.
(Note 2) Property age at the time of sale or acquisition of each property is indicated.
(Note 3) Appraisal NOI yield and NOI yield after depreciation for the properties acquired are based on appraisal NOI stated in the appraisal report at the time of the acquisition.
Property name LocationSale price
(mil yen)
Feb. 2017
NOI yield(Note 1)
Feb. 2017
NOI Yield after
depreciation(Note 1)
Property
age(Note 2)
Castalia MaihamaUrayasu City,
Chiba650 5.4% 4.2% 14.3 years
Castalia
Ichikawamyoden
Ichikawa City,
Chiba765 6.6% 5.6% 14.4 years
Castalia UrayasuIchikawa City,
Chiba578 6.1% 5.0% 14.4 years
Castalia
Minamigyotoku
Ichikawa City,
Chiba527 4.9% 3.7% 14.4 years
Castalia ShinsakaeNagoya City,
Aichi1,720 3.9% 1.9% 13.2 years
Aprile TarumiKobe City,
Hyogo1,502 6.2% 4.8% 14.5 years
Castalia Nipponbashi
Kouzu
Osaka City,
Osaka4,450 5.1% 3.4% 11.5 years
Property name Location
Acquisition
price
(mil yen)
Appraisal
NOI yield(Note 3)
NOI Yield after
depreciation(Note 3)
Property
age(Note 2)
ASOBOX (Land)Kitakyushu City,
Fukuoka1,600 5.0% 5.0% -
FOLEO
Ome Imai
Ome City,
Tokyo3,800 5.3% 4.3% 0.3 years
Gain on sale of properties
in the period ended Aug. 2017
1,536 mil yen
Retained gain as reserve for
distribution by utilizing tax
loss carryforwards

Location Ome City, Tokyo
Construction date May 15, 2017
Acquisition price 3,800 mil yen
Appraisal value 3,850 mil yen
Appraisal NOI yield 5.3 %
Average lease term 20.1 years
Average remaining
lease term19.8 years(as of August 29, 2017)
Total leasable area 8,637.91 m2
TenantBelc, Tsuruha,
Yamada Denki
Overview of Acquisitions in August 2017
10
Retail (Mall-type)
Location Kitakyushu City, Fukuoka
Acquisition price 1,600 mil yen
Appraisal value 1,830 mil yen
Appraisal NOI yield 5.0 %
Lease term 20.0 years
Remaining lease term20.0 years(as of August 29, 2017)
Total leasable area 11,207.90 m2
Tenant Daiwa Information Service
Retail (Mall-type)RM-008 FOLEO Ome Imai RM-007 ASOBOX (Land)
Located adjacent to Ome IC of Metropolitan Inter-City Expressway (Ken-O Expressway) and
surrounded by a mix of industrial area and residences where JR Ome Line runs on the west
side and JR Hachiko Line on the east side
Located in an area where large-scale retail facilities are concentrated, the property enjoys good
access
Retail complex with Belc (food supermarket) and Tsuruha (drugstore) on the first floor and
Yamada Denki (electronics retailer) on the second floor
Many young families live in this trade area
Located approx. 1km from JR Kokura Sta. and facing the Nakatsuguchi intersection on National
Route 3, the property enjoys high visibility and good accessibility by car
Being also close to the Adachi Entrance/Exit of No.4 Kitakyushu Urban Expressway, the location
has high potential for drawing customers visiting by car from across a wide area
Retail complex with Don Quijote, the core tenant, on the first and second floors, GEO (CD/DVD
rental store), Yoshinoya (beef bowl restaurant) and Onyasai (shabu shabu restaurant) on the first
floor, Kaikatsu Club (Internet café and karaoke), etc. on the second floor, and a bowling alley on
the third floor

Portfolio Logistics Residential Retail Other
Acquisition price 577,777 mil yen 260,119 mil yen 250,448 mil yen 55,730 mil yen 11,480 mil yen
Number of
properties 199 properties 47 properties 135 properties 13 properties 4 properties
NOI yield (Note) 5.2 % 4.9 % 5.4 % 5.4 % 6.2 %
Average property
age 9.2 years 7.2 years 11.6 years 8.9 years 5.9 years
Occupancy rate 99.2 % 100.0 % 97.3 % 98.9 % 100.0 %
Area breakdown
Greater Tokyo
Greater Nagoya
Greater Osaka
Other
71.8%
4.1%
8.5%
15.6%
Greater Tokyo
Greater Nagoya
Greater Osaka
Other
69.1%
5.3%
7.6%
18.0%
Greater Tokyo
Greater Nagoya
Greater Osaka
Other
82.4%
3.0%
9.9%
4.7%
Greater Tokyo
Greater Nagoya
Greater Osaka
Other
48.2%
4.3%
8.2%
39.3%
Greater Tokyo
Other
17.7%
82.3%
Portfolio Summary (as of August 31, 2017)
11
Greater Tokyo
area
71.8%
Greater Nagoya
area
4.1%
Greater Osaka
area
8.5%
Other areas
15.6%
Portfolio by Area (acquisition price basis)
Portfolio by Property Age(acquisition price basis)
Less than 5 years
18.2%
5 to less than 10
years
35.1%
10 years or more
46.7%
Three
major metropolitan
areas
84.4%
Less than
10 years
53.3%
Portfolio by Asset Class(acquisition price basis)
Logistics
260,119 mil yen
45.0%
Residential
250,448 mil yen
43.3%
Retail
55,730 mil yen
9.6%
Other
11,480 mil yen
2.0%
Core
Assets
98.0%
(Note) Excluding the 7 residential properties sold during the period ended Aug. 2017.

12
Operation Status of Logistics Properties
Remaining Lease Term (annual rent basis)
Lease Term (annual rent basis)
% of Top 10 Tenants (leased area basis)
10 years or more
86.2%
Less than 10 years
13.8%
Average
Remaining
Lease Term
10.0 years
15 years or more
11.2%
10 to less than 15 years
36.1%
5 to less than 10 years
42.0%
Less than 5 years
10.7%
Hitachi Capital
Mitsubishi Shokuhin
Daiwa Logistics
NAKANO SHOKAI
Hitachi Transport System Kanto
Sagawa Global Logistics
Seven & i Holdings
Hitachi Transport System
Takihyo
Vantec Corporation
Other
Average
Lease Term
16.2 years
Top 10 Tenants
56.4 %
10.3%9.7%6.4%6.0%4.5%4.3%4.3%4.0%3.7%3.3%
43.6%
Operation Status
100% occupancy since the acquisitions
< D Project Aikawa-Machi > Bought freezing and refrigeration facility on the first
floor, installed air-conditioning equipment, installed LED light, switched to a
direct contract with sub-lessee and concluded a new 15-year lease contract
Increased rent
< D Project Hachioji, D Project Noda and D Project Kawagoe I >
Installed LED light
< D Project Inuyama >
Installed solar power generation system
on roof for rent
Increased rental revenue
Rent Revision / Lease Contract Renewal
Rent revision: D Project Kuki V and D Project Matsudo
Revised rent on equal terms
< D Project Shin-Misato > in ongoing litigation
Taking into account the judgement and the current status, recorded provision for
loss on litigation of 5 mil yen in the period ended Aug. 2017
D Project Sapporo Minami
D Project Kakegawa
D Project Yashio
Installation of LED light
Increase rental revenue
D Project Aikawa-Machi
Installation of freezing and refrigeration facility
(part of the second floor)
Increase rental revenue
Future Plans for Internal Growth
Aim to increase revenue by investing in properties suited for tenant needs
D Project Inuyama
As of August 31, 2017

Net amount
(thousand yen)+1,580 +764 +1,421 +856 +1,667
51.5% 46.8% 37.2% 40.2% 43.2%
21.2% 26.7% 43.4% 33.1%39.5%
27.3% 26.6% 19.4% 26.7% 17.3%
0%
20%
40%
60%
80%
100%
Period endedAug. 2015
Period endedFeb. 2016
Period endedAug. 2016
Period endedFeb. 2017
Period endedAug. 2017
Rent increase No change Rent decrease
13
Operation Status of Residential Properties
Monthly Occupancy Rate
Monthly Rent at Tenant Replacement(Ratio of the number of tenant replacement)
Operation Status
Period average occupancy at 97.1%, above forecast of 95.0%
Performed major renovations for 3 properties
Rents
Monthly rents at tenant replacement increased for 5 consecutive
periods
Performed upgrade work for 15 residential units of 6 properties
Contracts were signed for 12 residential units at end of period
with 6.1% increase in rents
Performing Upgrade Work
96.4% 96.2% 96.2% 96.1%96.5%
97.0%97.3%
97.0% 96.9% 97.1% 97.0%97.3%
95%
96%
97%
98%
99%
100%
16/9 16/10 16/11 16/12 17/1 17/2 17/3 17/4 17/5 17/6 17/7 17/8
Residential Properties
Before After
Before After
Removing walls
between a kitchen and
a living room to open up
the kitchen
Remodeling from a
kitchen facing the wall
to a popular peninsula
kitchen

Remaining Lease Term (annual rent basis)
14
Operation Status of Retail Properties
Rent Type (leased area basis)
10 years or more
77.4%
Less than 10 years
22.6%
Fixed rent
95.1%
Fixed rent + variable rent
4.8%
Variable rent
0.2%
15 years or more
18.3%
10 to less than 15 years
26.6%
5 to less than 10 years
26.0%
Less than 5 years
29.1%
Ratio of
Fixed Rent
99.8%
Average
Remaining
Lease Term
8.4 years
Average
Lease Term
14.8 years
Lease Term (annual rent basis)
Monthly Occupancy Rate
Operation Status
Occupancy remained at a high level of 98.9%
・ Move-ins: 4 units
・ Move-outs: 5 units
< QiZ GATE URAWA >
・ Replaced tenant with a competitive
food supermarket
LOPIA opened on May 23, 2017
・ Currently leasing 5 vacant units
(Negotiating with 2 potential tenants)
< FOLEO Hirakata >
・ Performing renewal construction work such as refurbishing exterior wall
and layout change, etc.
Aim to attract more customers by introducing a discount supermarket
・ Currently leasing 2 vacant units
Rent Revision / Lease Contract Renewal of Major Tenants
Rent revision:
QiZ GATE URAWA (Core tenant B)
Revised rent on equal terms
99.6% 99.6% 99.6%
99.3%99.4% 99.4%
98.8% 98.8%98.9% 98.9% 98.9% 98.9%
98.0%
98.5%
99.0%
99.5%
100.0%
16/9 16/10 16/11 16/12 17/1 17/2 17/3 17/4 17/5 17/6 17/7 17/8
Retail Properties
QiZ GATE URAWA
As of August 31, 2017

3. Financial Status

16
Financial Status (1)
Financial Status Lender Formation(mil yen)
Sumitomo Mitsui Trust
Bank
49,059
Sumitomo Mitsui Banking
Corporation
47,050
Mizuho Bank 42,550
Bank of Tokyo-Mitsubishi
UFJ
42,477
Mitsubishi UFJ Trust and
Banking Corporation
15,927
Development Bank of
Japan
14,400
Aozora Bank 12,561
Norinchukin Bank 11,610
Resona Bank 9,500
Mizuho Trust & Banking 5,908
Nippon Life Insurance 3,500
Shinsei Bank 3,000
Shinkin Central Bank 2,500
Mitsui Sumitomo
Insurance
2,000
Bank of Fukuoka 2,000
Chiba Bank 1,465
Shizuoka Bank 760
Credit Rating
JCR R&I
AA (Stable) A+ (Stable)
Period ended
Feb. 2017
Period ended
Aug. 2017Change
Interest-bearing debt 253,163 mil yen 282,268 mil yen +29,105 mil yen
Loans 234,163 mil yen 266,268 mil yen +32,105 mil yen
Bonds 19,000 mil yen 16,000 mil yen -3,000 mil yen
LTV
(including goodwill)41.9 % 41.4 % -0.5 p.p.
LTV
(excluding goodwill)48.1 % 46.5 % -1.6 p.p.
Long-term interest-
bearing debt ratio79.3 % 94.3 % +15.0 p.p.
Fixed interest ratio 90.3 % 93.8 % +3.5 p.p.
Average interest rate 0.78 % 0.77 % -0.01 p.p.
Average remaining
maturity4.7 years 5.6 years +0.9 years
Commitment line 20,000 mil yen 20,000 mil yen -
266,268 mil yen
JCR credit rating upgraded to “AA (Stable)” from “AA- (Positive)”
DHR currently has 42.5 Bn yen of debt capacity for acquisition of up to 50% of LTV (excluding goodwill)

New Financing (as of procurement date) Repayment (as of repayment date) Refinancing (as of procurement date)
Financing amount 29,500 mil yen Repayment amount 36,495 mil yen Financing amount 36,100 mil yen
Average interest rate 0.73 % Average interest rate 0.77 % Average interest rate 0.73 %
Average maturity 8.1 years Average maturity 4.3 years Average maturity 8.3 years
0
5,000
10,000
15,000
20,000
25,000
30,000
Feb. Aug. Feb. Aug. Feb. Aug. Feb. Aug. Feb. Aug. Feb. Aug. Feb. Aug. Feb. Aug. Feb. Aug. Feb. Aug. Feb. Aug.
2018 2019 2020 2021 2022 2023 2024 2025 2026 2027 2028
Long-term loans Bonds
17
Financial Status (2)
(mil yen)
Debt Financing in the Period Ended August 2017
Diversified Maturity Ladder
Refinancing
LTV within 40% to 50% range and maintain stable financial operation
Further lengthening and diversifying debt maturities and fixing interest rates

4. Initiatives to Pursue Growth
32.0 51.1
192.6 210.2 212.6 256.3
114.5
206.3 327.2
462.7 491.3
513.7
577.7
0
100
200
300
400
500
600
700
800
End ofNov. 2006
End ofNov. 2009
End ofAug. 2010
End ofFeb. 2012
End ofFeb. 2013
End ofAug. 2016
Sep. 1,2016
End ofFeb. 2017
End ofAug. 2017
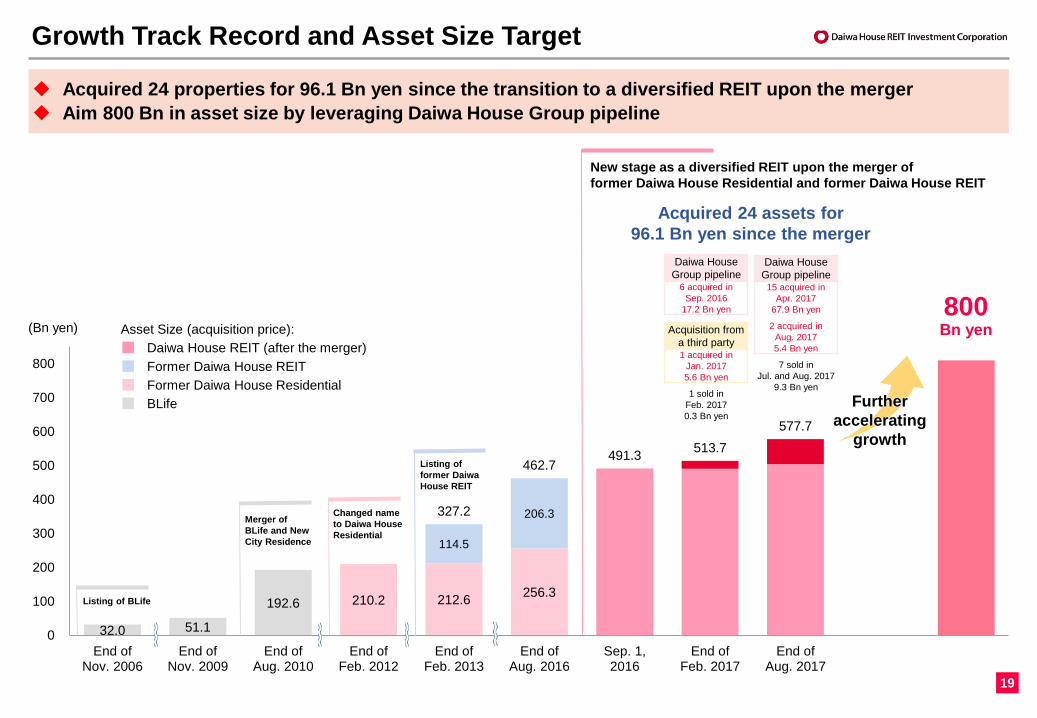
Growth Track Record and Asset Size Target
19
(Bn yen)
Acquired 24 properties for 96.1 Bn yen since the transition to a diversified REIT upon the merger
Aim 800 Bn in asset size by leveraging Daiwa House Group pipeline
800Bn yen
Further
accelerating
growth
Listing of BLife
Listing of
former Daiwa
House REIT
Merger of
BLife and New
City Residence
Changed name
to Daiwa House
Residential
New stage as a diversified REIT upon the merger of
former Daiwa House Residential and former Daiwa House REIT
Acquired 24 assets for
96.1 Bn yen since the merger
Daiwa House
Group pipeline6 acquired in
Sep. 2016
17.2 Bn yen
Acquisition from
a third party1 acquired in
Jan. 2017
5.6 Bn yen
1 sold in
Feb. 2017
0.3 Bn yen
Daiwa House
Group pipeline15 acquired in
Apr. 2017
67.9 Bn yen
2 acquired in
Aug. 2017
5.4 Bn yen
7 sold in
Jul. and Aug. 2017
9.3 Bn yen
Asset Size (acquisition price):
Daiwa House REIT (after the merger)
Former Daiwa House REIT
Former Daiwa House Residential
BLife

Future Growth Strategy
20
Accelerate growth by leveraging Daiwa House Group’s comprehensive and integrated capabilities
Acquire properties developed by Daiwa House Group based on the group’s pipeline support
Value Chain of Daiwa House Group 5th Medium-Term Management Plan of Daiwa House Group
(Source) Daiwa House Industry Co., Ltd.Same Boat Investment by Daiwa House
Comprehensive and integrated capabilities from acquisition of land,
design and construction, to management and operation
Daiwa House’s investment in
Daiwa House REIT (% of ownership)
185,200 units (11.0%)
Real Estates Available for Sale of Daiwa House Group
As of June 30, 2017 Being rented Not being rented Total
Logistics, business &
corporate facilities101.7 365.4 467.1
Rental housing 15.3 6.0 21.3
Commercial facilities 49.8 40.6 90.4
In order to align interests between our unitholders and Daiwa House,
Daiwa House intends to continue holding our units
(Source) Daiwa House Industry Co., Ltd.
(Bn yen)
Daiwa House Group intends to invest 700 Bn yen in aggregate in the property development
business according to its 5th Medium-Term Plan covering the fiscal year ending March 2017
through the fiscal year ending March 2019
0 100 200 300 400 500 600 700 800 900
3-year
Investment Plan
3-year
Capital Plan
Real Estate Development 700Capex
150
M&A
50Logistics, Business and
Corporate Facilities
360
Rental
Housing
100
Commercial
Facilities
140
Overseas
Business
100
Operating C/F
460
Real Estate Sales
300
Interest-
bearing Debt
140
Real Estate Development
340.3
Logistics, Business and
Corporate Facilities
211.5
Cumulative total
as of June 2017
Rental Housing
Commercial
Facilities
Overseas Business
M&A
32.3
Capex
94.6
24.154.9
49.6
(Bn yen)

Pipeline of Daiwa House Group (1)
21
Logistics Properties
DPL Ichikawa
DPL Sagamihara
DPL Yokohama Daikoku
DPL Fukuoka Kasuya
D Project Kitahachioji
Annex A, B and C
D Project Jonanjima
Property Name Type Location CompletionNo. of
Floors
Gross
Floor Area
D Project Kita Hachioji Annex A BTS Hachioji City, Tokyo Feb. 2011 5 15,352 m2
D Project Kita Hachioji Annex B BTS Hachioji City, Tokyo Nov. 2011 4 18,762 m2
D Project Kita Hachioji Annex C BTS Hachioji City, Tokyo Jun. 2014 4 26,310 m2
D Project Jonanjima BTS Ota Ward, Tokyo May 2014 8 49,739 m2
D Project Itabashi Shingashi BTS Itabashi Ward, Tokyo Dec. 2014 7 31,094 m2
D Project Sagamihara II BTS Sagamihara City, Kanagawa Apr. 2015 2 17,576 m2
D Project Kuki Shoubu I Annex B BTS Kuki City, Saitama Jan. 2010 1 2,940 m2
D Project Kuki III Annex K BTS Kuki City, Saitama Sep. 2016 5 29,090 m2
D Project Kawagoe Annex A BTS Kawagoe City, Saitama Jan. 2011 3 24,684 m2
D Project Wako Annex A BTS Wako City, Saitama Apr. 2015 6 57,198 m2
D Project Matsudo Annex A BTS Matsudo City, Chiba Apr. 2011 5 19,837 m2
D Project Chibakita BTS Chiba City, Chiba Jun. 2016 2 25,123 m2
D Project Tomisato II BTS Tomisato City, Chiba Mar. 2016 4 42,125 m2
D Project Inuyama Annex B BTS Inuyama City, Aichi Jan. 2012 3 9,900 m2
D Project Sendai Izumi II BTS Sendai City, Miyagi Oct. 2015 2 39,531 m2
D Project Kaminokawa BTS Kawachi District, Tochigi Dec. 2010 6 48,033 m2
D Project Ibaraki Ishioka BTS Ishioka City, Ibaraki Jul. 2015 2 24,524 m2
D Project Fuji BTS Fuji City, Shizuoka Oct. 2013 2 24,176 m2
D Project Shikoku Sakaide Annex A BTS Sakaide City, Kagawa Aug. 2015 1 27,995 m2
D Project Tosu III BTS Tosu City, Saga Mar. 2012 5 64,984 m2
DPL Sagamihara Multi-tenant Sagamihara City, Kanagawa Dec. 2013 5 82,685 m2
DPL Yokohama Daikoku Multi-tenant Yokohama City, Kanagawa Feb. 2014 6 121,818 m2
DPL Kawasaki Yakou Multi-tenant Kawasaki City, Kanagawa Mar. 2017 5 92,924 m2
DPL Ichikawa Multi-tenant Ichikawa City, Chiba Jun. 2016 5 88,050 m2
DPL Sendai Port Multi-tenant Sendai City, Miyagi Mar. 2017 2 63,098 m2
DPL Fukuoka Kasuya Multi-tenant Kasuya District, Fukuoka Apr. 2014 7 87,682 m2
D Project Itabashi Shingashi
D Project Wako Annex A
(Source) Daiwa House Industry Co., Ltd.
(Note) As of the date of this document, there are no planned acquisitions.

Pipeline of Daiwa House Group (2)
22
(Source) Daiwa House Industry Co., Ltd.
(Note) As of the date of this document, there are no planned acquisitions.
Royal Parks ER Sasashima
Shibuya Honmachi Project
FOLEO Otsu Ichiriyama
Nerima Takamatsu Project
iias Tsukuba
Property Name Type LocationCompletion
(Planned)No. of Residential Units
Royal Parks Ogikubo Compact/family Suginami Ward, Tokyo Mar. 2005 Condominium: 157 units
Royal Parks Riverside Compact/family Adachi Ward, Tokyo Dec. 2010 Condominium: 200 units
Royal Parks ER
Sasashima
Compact/family/
shared house/
pay nursing homes/
nursery school/retail
Nagoya City, Aichi Mar. 2015
Condominium: 430 units,
shared house: 136 units,
pay nursing homes: 66 units
(annexed by senior day service),
nursery school, retail: 2 sections
Roygent Higashi Kanda Compact Chiyoda Ward, Tokyo May 2018 Condominium: 134 units
Roygent Kudanshita Compact Chiyoda Ward, Tokyo Aug. 2017 Condominium: 48 units
Royal Parks ER BandaiCompact/family/
medical mallNiigata City, Niigata Feb. 2018
Condominium: 427 units,
medical mall
Property Name Type LocationCompletion
(Planned)No. of Floors
Gross Floor
Area
Daiwa Royal Ariake Project Hotel/retail/convention Koto Ward, Tokyo Mar. 2018 17 + 1 basement 22,500 m2
Daiwa Roynet Hotel
Yokohama KannaiHotel
Yokohama City,
KanagawaAug. 2009 10 + 1 basement 8,567 m2
Property Name Type LocationCompletion
(Planned)
Gross Floor Area/
No. of Floors
Hiroshima Futaba no Sato
ProjectOffice/hotel/retail Hiroshima City, Hiroshima Mar. 2019 47,123 m2
Nerima Takamatsu Project Assisted-living pay nursing homes Nerima Ward, TokyoFeb. 2015
Jan. 2017
100 units
40 units
Shibuya Honmachi Project Assisted-living pay nursing homes Shibuya Ward, Tokyo Oct. 2015 57 units
Utsunomiya Project Serviced senior housing Utsunomiya City, Tochigi Sep. 2015 77 units
Property Name Type Location Completion No. of FloorsGross Floor
Area
iias Takao Mall Hachioji City, Tokyo Jun. 2017 4 80,758 m2
FOLEO Shoubu Roadside Kuki City, Saitama Mar. 2010 1 19,089 m2
FOLEO Otsu Ichiriyama Mall Otsu City, Shiga Oct. 2008 2 + 1 basement 62,917 m2
iias Tsukuba Mall Tsukuba City, Ibaraki Sep. 2008 5 112,509 m2
COMBOX Mito Mall/hotel Mito City, Ibaraki Apr. 2006 13 18,497 m2
FOLEO Hakata Mall Fukuoka City, Fukuoka Jan. 2008 3 23,230 m2
Roygent Higashi KandaResidential Properties
Hotel Properties
Other Assets
Retail Properties
Daiwa Royal Ariake Project Hiroshima Futaba no Sato Project

5. Financial Forecasts

Financial Forecasts for February 2018 & August 2018 Periods
24
Increase in operating revenue 81 mil yen
・Increase in reimbursements for utility charges due to seasonal factors
Increase in operating expenses -307 mil yen
・Property taxes for acquisitions in 2017
・Increase in repairs and maintenance expenses
Increase in non-operating expenses -26 mil yen
・Increase in interest expenses
Major Variation Factors for
Feb. 2018 Forecast vs Aug. 2017 Result
Major Variation Factors for
Aug. 2018 Forecast vs Feb. 2018 Forecast
Decrease in operating revenue -1,475 mil yen
・Absence of gain on sale of properties
・Full period contribution of 17 properties acquired in Aug. 2017 period
・Decrease in revenue of 7 properties sold in Aug. 2017 period
Increase in operating expenses -124 mil yen
・Full period expenses for 17 properties acquired in Aug. 2017 period
・Decrease in expenses of 7 properties sold in Aug. 2017 period
・Increase in repairs and maintenance expenses
Decrease in non-operating expenses 207 mil yen
・Absence of investment unit issuance expenses
・Increase in interest expenses related to new loans
Feb. 2018 DPU Forecast 5,050 yen from earnings contribution of new acquisitions
Aug. 2018 DPU Forecast 4,900 yen (property taxes for 2017 acquisitions will be expensed)
(mil yen)
Period ended
Aug. 2017
Period ending
Feb. 2018
Period ending
Aug. 2018
Result ForecastPeriod-on-
period changeForecast
Period-on-
period change
Operating revenue 21,015 19,540 -1,475 19,621 81
Operating expenses 11,623 11,748 124 12,055 307
Amortization of goodwill 1,982 1,982 - 1,982 -
Property taxes 1,228 1,202 -26 1,446 244
Depreciation 3,713 3,737 24 3,752 14
Operating income 9,392 7,792 -1,600 7,566 -226
Interest and borrowing
related expenses1,216 1,238 22 1,264 26
Investment unit issuance
expenses229 - -229 - -
Ordinary income 7,974 6,556 -1,417 6,303 -252
Extraordinary losses 5 3 -2 4 0
Net income 7,968 6,552 -1,415 6,298 -253
Reversal of retained earnings for
temporary difference adjustment1,980 1,982 1 1,982 -
Reversal (accumulation) of reserve
for distribution -1,559 - 1,559 - -
Total distribution 8,389 8,534 145 8,281 -253
<Per unit information>
Net income 4,714 yen 3,877 yen -837 yen 3,727 yen -150 yen
DPU 4,964 yen 5,050 yen 86 yen 4,900 yen -150 yen
[Forecast as of April 19, 2017] [4,800 yen] [5,050 yen]
[Contribution to income]
[Contribution to income]

25
A p p e n d i x

Distribution Policy
26
Treatment of Goodwill
Goodwill is recorded as intangible non-current assets on B/S
Amortized over 20 years using the straight-line method
(1,982 mil yen per 6-month fiscal period)
Use of Retained Earnings
Distribution policy
Net income
Distributions
Reversal of retained earnings
Distribution in excess of earnings
Distribution in excess of
earnings as allowance for
temporary difference
adjustment
Utilizing retained earnings, the
portion equivalent to goodwill
amortization will be covered
and be distributed
Goodwill to be amortized over 20 years
After the merger After completion of reversal
of retained earnings
Distribution level will not be affected by
goodwill amortization
When gain on sale of property, etc. is
realized or other factors
Accumulate
retained earnings
Retained earnings14,384 mil yen(after distribution payment
for the period ended Aug. 2017)
Tax-loss carry-forwards 35,228 mil yen (Note)
Goodwill recognized
from the merger75,324 mil yen
(as of Aug. 31, 2017)
Realize stable distributions
(Note) 34,721 mil yen can be applied to offset taxable income through the period ending Aug. 2018 and
507 mil yen can be applied to offset taxable income through the period ending Feb. 2021.
After completion of
goodwill amortization
To pay distribution equivalent to
goodwill amortization
Reversal of
retained earnings
To cover loss on sale of property, etc.
Reversal of
retained earningsTo address dilution as a result of
issuance of units

27
Historical Financial Data
Aug. 2015 Feb. 2016 Aug. 2016 Feb. 2017
(A)
Aug. 2017
(B)
Change
(B-A)
Operating days 184 days 182 days 184 days 181 days 184 days 3 days
Operating Revenue 9,356 mil yen 9,662 mil yen 9,691 mil yen 17,531 mil yen 21,015 mil yen 3,484 mil yen
Operating Income 3,925 mil yen 3,947 mil yen 3,959 mil yen 5,567 mil yen 9,392 mil yen 3,825 mil yen
Gain (loss) on sale of properties ― ― ― -4 mil yen 1,536 mil yen 1,540 mil yen
Ordinary Income 3,146 mil yen 3,177 mil yen 3,214 mil yen 4,474 mil yen 7,974 mil yen 3,500 mil yen
Net Income 3,145 mil yen 3,177 mil yen 3,213 mil yen 4,393 mil yen 7,968 mil yen 3,574 mil yen
DPU 4,460 yen 4,501 yen 4,537 yen 4,800 yen 4,964 yen 164 yen
Number of investment units issued 747,740 units 747,740 units 747,740 units 1,519,280 units 1,690,000 units 170,720 units
Payout ratio 106.0 % 106.0 % 105.6 % 166.0 % 104.0 % -62.0 p.p.
Total Assets 258,400 mil yen 258,590 mil yen 258,266 mil yen 604,142 mil yen 682,359 mil yen 78,216 mil yen
Net Assets 111,352 mil yen 111,194 mil yen 111,042 mil yen 330,304 mil yen 377,321 mil yen 47,016 mil yen
Unitholders’ Capital 61,703 mil yen 61,703 mil yen 61,703 mil yen 61,703 mil yen 108,136 mil yen 46,432 mil yen
Capital Surplus 28,241 mil yen 28,241 mil yen 28,241 mil yen 247,667 mil yen 247,667 mil yen ―
Interest-bearing debt 141,663 mil yen 141,663 mil yen 141,663 mil yen 253,163 mil yen 282,268 mil yen 29,105 mil yen
LTV (Including goodwill) 54.8 % 54.8 % 54.9 % 41.9 % 41.4 % -0.5 p.p.
LTV (Excluding goodwill) ― ― ― 48.1 % 46.5 % -1.6 p.p.
Net Assets per unit 148,918 yen 148,707 yen 148,504 yen 217,408 yen 223,267 yen 5,859 yen
NAV per unit 185,450 yen 191,454 yen 195,377 yen 248,462 yen 258,421 yen 9,959 yen
FFO per unit (Note) 6,752 yen 6,948 yen 7,024 yen 6,469 yen 7,184 yen 715 yen
(Note) FFO per unit: (Net income + depreciation + amortization + amortization of investment corporation bond issuance costs + amortization of trademark rights + amortization of software +/- loss or gain on sale of properties
+/- extraordinary loss or gain) / number of investment units issued

Aug. 2015 Feb. 2016 Aug. 2016 Feb. 2017
(A)
Aug. 2017
(B)
Change
(B-A)
Number of properties 141 properties 142 properties 142 properties 189 properties 199 properties 10 properties
Total acquisition price 255,376 mil yen 256,349 mil yen 256,349 mil yen 513,772 mil yen 577,777 mil yen 64,005 mil yen
Ratio of logistics properties ― ― ― 38.1 % 45.0 % 6.9 p.p.
Ratio of residential properties 99.2 % 99.2 % 99.2 % 50.2 % 43.3 % -6.9 p.p.
Ratio of retail properties ― ― ― 9.8 % 9.6 % -0.2 p.p.
Ratio of hotel properties ― ― ― ― ― ―
Ratio of other assets 0.8 % 0.8 % 0.8 % 1.9 % 2.0 % 0.1 p.p.
Properties acquired during the period5
17,750
properties
mil yen
1
973
property
mil yen―
7
22,830
properties
mil yen
17
73,311
properties
mil yen
10
50,481
properties
mil yen
Properties sold during the period ― ― ―1
370
property
mil yen
7
10,193
properties
mil yen
6
9,823
properties
mil yen
Unrealized gain (loss) 27,316 mil yen 31,963 mil yen 35,048 mil yen 47,179 mil yen 59,410 mil yen 12,231 mil yen
Leasable area 503,899.79 m2 505,935.16 m2 505,935.16 m2 1,605,625.31 m2 1,934,669.61 m2 329,044.30 m2
Occupancy rate 95.9 % 96.0 % 96.1 % 99.0 % 99.2 % 0.2 p.p.
Real estate rental revenue 9,356 mil yen 9,662 mil yen 9,691 mil yen 17,531 mil yen 19,479 mil yen 1,948 mil yen
Real estate rental expenses 4,438 mil yen 4,688 mil yen 4,746 mil yen 7,493 mil yen 7,906 mil yen 412 mil yen
Real estate rental income 4,917 mil yen 4,974 mil yen 4,944 mil yen 10,037 mil yen 11,573 mil yen 1,535 mil yen
Depreciation 1,897 mil yen 2,012 mil yen 2,033 mil yen 3,361 mil yen 3,713 mil yen 352 mil yen
NOI (Note 1) 6,814 mil yen 6,986 mil yen 6,977 mil yen 13,398 mil yen 15,286 mil yen 1,888 mil yen
NOI yield (Note 2) 5.4 % 5.5 % 5.4 % 5.3 % 5.2 % -0.1 p.p.
28
Historical Portfolio Data
(Note 1) NOI: Real estate rental business revenue – real estate rental business expenses + depreciation
(Note 2) NOI yield is excluding the properties sold during the period.

29
Balance Sheets
科目Period ended
Feb. 2017
Period ended
Aug. 2017
Assets
Current assets
Cash and deposits 11,110,819 25,621,149
Cash and deposits in trust 9,416,246 9,736,167
Operating accounts receivable 169,018 179,814
Prepaid expenses 447,439 544,374
Consumption taxes receivable 487,928 2,040,334
Other 4,946 129
Allowance for doubtful accounts (5,521) (2,576)
Total current assets 21,630,877 38,119,394
Non-current assets
Property, plant and equipment
Buildings, net 25,199,993 22,682,208
Structures, net 219,669 206,073
Machinery and equipment, net 389,326 337,646
Tools, furniture and fixtures, net 375,707 328,195
Land 22,453,490 21,637,530
Buildings in trust, net 214,004,771 245,617,874
Structures in trust, net 3,389,114 4,763,769
Machinery and equipment in trust, net 1,631,215 1,511,315
Tools, furniture and fixtures in trust, net 369,510 392,100
Land in trust 226,663,386 260,076,467
Construction in progress in trust 5,022 155,088
Total property, plant and equipment 494,701,208 557,708,269
Intangible assets
Goodwill 77,306,836 75,324,610
Leasehold rights in trust 5,500,051 5,459,918
Software 1,448 1,155
Trademark rights 2,825 2,894
Total intangible assets 82,811,162 80,788,578
Investments and other assets
Investment securities 9,291 9,308
Long-term prepaid expenses 1,453,688 2,214,945
Guarantee deposits 10,261 261
Lease and guarantee deposits in trust 3,414,720 3,414,720
Other 42,488 42,488
Allowance for doubtful accounts (24,058) (24,058)
Total investments and other assets 4,906,390 5,657,664
Total non-current assets 582,418,762 644,154,512
Deferred assets
Investment corporation bond issuance costs 92,831 85,446
Total deferred assets 92,831 85,446
Total assets 604,142,471 682,359,354
科目Period ended
Feb. 2017
Period ended
Aug. 2017
Liabilities
Current liabilities
Operating accounts payable 1,210,266 1,127,768
Short-term loans 6,000,000 -
Current portion of investment corporation bonds 3,000,000 -Current portion of long-term loans 43,495,000 16,000,00
Accounts payable – other 75,311 128,535
Accrued expenses 1,089,119 1,205,841
Income taxes payable 605 605
Advances received 1,935,780 2,171,045
Unearned revenue 221,735 221,735
Deposits received 356,801 360,372
Other 43,852 58,852
Total current liabilities 57,428,471 21,274,756
Non-current liabilities
Investment corporation bonds 16,000,000 16,000,000
Long-term loans 184,668,000 250,268,000
Long-term unearned revenue 1,262,357 1,150,578
Tenant leasehold and security deposits 288,912 274,822
Tenant leasehold and security deposits in trust 12,515,805 14,293,230
Provision for loss in litigation 80,147 85,849
Asset retirement obligations 429,379 434,255
Derivatives liabilities 1,164,700 1,256,574
Total non-current liabilities 216,409,303 283,763,311
Total liabilities 273,837,775 305,038,068
Net assets
Unitholders' equity
Unitholders' capital 61,703,224 108,136,162
Surplus
Capital surplus 247,667,563 247,667,563
Voluntary retained earnings
Retained earnings for temporary
difference adjustment- 14,748,347
Reserve for distribution 17,705,349 57,717
Total voluntary retained earnings 17,705,349 14,806,064
Unappropriated retained earnings 4,393,259 7,968,070
Total surplus 269,766,172 270,441,698
Total unitholders' equity 331,469,396 378,577,860
Deferred gains or losses on hedges (1,164,700) (1,256,574)
Total net assets 330,304,696 377,321,286
Total liabilities and net assets 604,142,471 682,359,354
(thousand yen)

30
(thousand yen)
科目Period ended
Feb. 2017
Period ended
Aug. 2017
Operating revenue
Rental revenue 16,606,592 18,344,657
Other rental revenue 924,550 1,134,983
Gain on sale of real estate properties - 1,536,256
Total operating revenue 17,531,143 21,015,897
Operating expenses
Rental expenses 7,493,903 7,906,409
Loss on sale of real estate properties 4,207 -
Asset management fees 983,471 1,254,120
Asset custody fees 26,204 29,053
Administrative service fees 72,780 74,188
Directors' remuneration 6,600 6,600
Merger expenses 1,042,059 -
Amortization of goodwill 1,982,226 1,982,226
Provision of allowance for doubtful accounts 1,974 1,309
Other operating expenses 350,360 369,257
Total operating expenses 11,963,787 11,623,165
Operating Income 5,567,356 9,392,731
Non-operating income
Interest income 109 146
Gain on forfeiture of unclaimed distributions 5,180 4,441
Refunded consumption taxes 21,388 23,643
Gain on adjustment of liabilities 8 -
Gain on donation of non-current assets 5,433 -
Other 19 1,531
Total non-recurring income 32,138 29,762
Non-operating expenses
Interest expenses 827,814 909,040
Interest expenses on investment corporation bonds 45,953 41,157
Amortization of investment corporation bond
issuance costs7,898 7,384
Investment unit issuance expenses - 229,991
Borrowing related expenses 241,696 258,437
Other 2,119 2,105
Total non-recurring expenses 1,125,483 1,448,116
Ordinary Income 4,474,011 7,974,377
Extraordinary losses 80,147 5,702
Income before income taxes 4,393,864 7,968,675
Total income taxes 605 605
Net income 4,393,259 7,968,070
Unappropriated retained earnings 4,393,259 7,968,070
(yen)
Period ended
Feb. 2017
Period ended
Aug. 2017
I Unappropriated retained earnings 4,393,259,342 7,968,070,160
II Reversal of voluntary retained earnings
Reversal of retained earnings for temporary
difference adjustment- 1,980,989,899
Reversal of reserve for distribution 17,669,020,696 -III Distributions 7,292,544,000 8,389,160,000
[Distributions per unit] [4,800] [4,964]
IV Voluntary retained earnings
Accumulation of reserve for distribution 21,388,890 1,559,900,059
Accumulation of retained earnings for temporary
difference adjustment14,748,347,148 -
V Retained earnings carried forward - -
Rental Revenue and Expenses(thousand yen)
科目Period ended
Feb. 2017
Period ended
Aug. 2017
A. Real estate rental revenue
Rental revenue
Rent 16,184,156 17,907,732
Common area charges 422,436 436,924
Total rental revenue 16,606,592 18,344,657
Other rental revenue
Facility charges 338,545 353,388
Incidental revenue 253,928 276,697
Other 332,076 504,897
Total other rental revenue 924,550 1,134,983
Total real estate rental revenue 17,531,143 19,479,640
B. Real estate rental expenses
Rental expenses
Management fees 1,233,882 1,272,800
Utilities 285,590 299,764
Taxes and public dues 1,175,602 1,228,362
Repairs and maintenance expenses 569,404 473,270
Restoration costs 293,588 305,785
Insurance expenses 25,089 25,479
Custodian fees 61,639 67,476
Depreciation 3,361,190 3,713,302
Other operating expenses 487,914 520,167
Total real estate rental expenses 7,493,903 7,906,409
C. Income from real estate rental business (A-B) 10,037,240 11,573,231
Statements of Cash Distributions
Statements of Income

0
500
1,000
1,500
2,000
2,500
3,000
3,500
4,000
2010 2011 2012 2013 2014 2015 2016 2017 2018
Greater Tokyo area Greater Osaka area
Greater Nagoya area Other areas
31
Market Environment for Logistics Properties
Average Offered Rent for Logistics Properties
in the Three Major Metropolitan AreasProportion of Advanced Large-scale Logistics Properties
Supply and Demand of Logistics Properties for Lease
in the Three Major Metropolitan Areas
Source: CBRESource: CBRE
Source: CBRE
(yen/tsubo/per month)
(thousand m2)
Development of Medium-to-Large Scale Logistics Properties
(thousand m2)
Source: CBRE
Advanced large-scale
logistics properties
8.2%
Other logistics properties
91.8%
Japan Greater Tokyo area
Advanced large-scale
logistics properties
3.9%
Other logistics properties
96.1%
(planned) (planned)
0%
2%
4%
6%
8%
10%
0
500
1,000
1,500
2,000
2,500
2010 2011 2012 2013 2014 2015 2016 1Q-17 2Q-17
New supply (LHS) New demand (LHS) Vacancy rate (RHS)
2,000
3,000
4,000
5,000
2010 2011 2012 2013 2014 2015 2016 1Q-17 2Q-17
Greater Tokyo area Greater Osaka area
Greater Nagoya area Three major metropolitan areas

-20
0
20
40
60
80
100
2011 2012 2013 2014 2015 2016
0-19 years old 20-39 years old 40-59 years old 60 years old and over
34%
38%
42%
46%
50%
0
2
4
6
8
1995 2000 2005 2010 2015
Single households (LHS) Married couple households (LHS)
Other households (LHS) % of single households (RHS)
-20
0
20
40
60
80
100
2011 2012 2013 2014 2015 2016
Tokyo Tokyo 23 Wards Aichi Osaka
9,000
10,000
11,000
12,000
13,000
14,000
15,000
2H-12 1H-13 2H-13 1H-14 2H-14 1H-15 2H-15 1H-16 2H-16 1H-17
Tokyo 5 central wards(less than 40 m2)
Tokyo 5 central wards(40 to less than 80m2)
Tokyo 23 wards(less than 40m2)
Tokyo 23 wards(40 to less than 80m2)
32
Market Environment for Residential Properties
Number of Households in Tokyo Rent Per Tsubo for Apartments in Tokyo 23 Wards
Number of Net Migration
(million households)
Source: "Population Census“, Statistics Bureau, Ministry of Internal Affairs and Communications
Source: “Report on Internal Migration”, Statistics Bureau, Ministry of Internal Affairs and Communications
Number of Net Migration in Tokyo 23 Wards by Age Group
(thousand people)
Source: Compiled by the Asset Manager from data published by Japan
Real Estate Institute in “Housing Market Index, First Half 2017”.
(thousand people)
(yen/tsubo/per month)
Source: “Report on Internal Migration”, Statistics Bureau, Ministry of Internal Affairs and Communications
Tokyo 5 central wards
(less than 40 m2)
Tokyo 23 wards
(less than 40m2)
Tokyo 5 central wards
(40 to less than 80 m2)
Tokyo 23 wards
(40 to less than 80m2)

33
Market Environment for Retail and Hotel Properties
Retail Sales (YoY Change) Number of Overseas Visitors to Japan
Guest Room Occupancy Ratio of
Accommodation Facilities
(thousand visitors)
Source: Japan National Tourism Organization (JNTO)
Source: “Accommodation Survey”, Japan Tourism Agency
Note: Retail sales exclude sales of cars and fuel.
Source: “Monthly Report on the Current Survey of Commerce”, Ministry of Economy, Trade and Industry, or METI
6,219 8,358
10,364
13,413
19,737
24,040
13,757
0
5,000
10,000
15,000
20,000
25,000
30,000
2011 2012 2013 2014 2015 2016 1H-2017
Asia North America Europe Other
B to C (business-to-consumer) e-commerce Ratio
Source: “E-Commerce Market Survey”, Ministry of Economy, Trade and Industry, or METI
29.9%
24.5%
18.7%
10.9%
5.4%
2.3%
0%
10%
20%
30%
2013 2014 2015 2016
Home appliance, AV equipment,PC and peripherals
Books, video and music software
General merchandise, furnitureand interior
Apparel and fashion goods
Total of sale of goods
Food, beverage and alcohol
60%
70%
80%
90%
2013 2014 2015 2016 17/1 17/2 17/3 17/4 17/5 17/6 17/7 17/8
Business Hotel City Hotel
-4%
-2%
0%
2%
4%
6%
15/6 15/9 15/12 16/3 16/6 16/9 16/12 17/3 17/6
Retail sales
Supermarket sales
Supermarket sales (Food and beverages)

DHR has received the certification for logistics, residential and retail properties
Sustainability Initiatives
34
D Project Machida Royal Parks Toyosu ACROSSMALL ShinkamagayaD Project HachiojiPacific Royal Court
Minatomirai Urban Tower
DBJ Green Building Certification
Logistics ResidentialLogistics Residential Retail
1 Prevention of global warming
2 Harmony with the natural environment
3 Conservation of natural resources
4 Prevention of chemical pollution
5 Establishment of an internal framework and
initiatives for employees
6 Promotion of communication through
information disclosure
7 Promotion of communication through
information disclosure
8 Compliance with laws and regulations, and
risk management
The Daiwa House Group’s basic approach is “Creating Dreams, Building
Hearts.” As a group that co-creates value for individuals, communities
and people’s lifestyles, the group aims to build trust relationships with
stakeholders and contribute to society through its businesses, and to
realize a sustainable society by meeting the challenge of achieving “zero
environmental impacts.”
Daiwa House Asset Management Co., Ltd. shares the Daiwa House
Group’s basic approach as DHR’s asset manager, and considers that
including consideration for environment, society, and governance in its
real estate investment management operations contributes to DHR’s
basic policy of ensuring stable revenue and steady growth of assets
over the long term. Therefore, we have established the “Sustainability
Policy” to guide our real estate investment and management.
The Global Real Estate Benchmark
(GRESB) holds an annual benchmark
survey for evaluating environmental,
social and governance (ESG)
considerations in the real estate sector
DHR participated in the 2017 survey
Participation in GRESB
Real Estate AssessmentSustainability Policy

Portfolio List (1)
35
Property
numberProperty name Location
Acquisition
price
(mil yen)
Investment
ratio
Leasable
area (m2)
Occupan
cy rate
(Note)
LB-001 D Project Machida Machida City, Tokyo 9,200 1.6% 50,490.39 100.0%
LB-002 D Project Hachioji Hachioji City, Tokyo 15,400 2.7% 62,394.17 100.0%
LB-003 D Project Aikawa-Machi Aiko District, Kanagawa 3,390 0.6% 14,240.84 100.0%
LB-004 D Project Shin-Misato Misato City, Saitama 5,710 1.0% 11,289.91 100.0%
LB-005 D Project Urayasu I Urayasu City, Chiba 9,280 1.6% 36,515.81 100.0%
LB-006 D Project Urayasu II Urayasu City, Chiba 26,000 4.5% 72,320.01 100.0%
LB-007 D Project Akanehama Narashino City, Chiba 2,950 0.5% 11,663.39 100.0%
LB-008 D Project Noda Noda City, Chiba 6,210 1.1% 29,232.53 100.0%
LB-009 D Project Inuyama Inuyama City, Aichi 8,690 1.5% 43,723.70 100.0%
LB-010 D Project Gifu Anpachi District, Gifu 1,100 0.2% 7,669.91 100.0%
LB-011 D Project Neyagawa Neyagawa City, Osaka 5,980 1.0% 11,151.51 100.0%
LB-012 D Project Sapporo MinamiKitahiroshima City,
Hokkaido818 0.1% 6,749.10 100.0%
LB-013 D Project Morioka Takizawa City, Iwate 1,200 0.2% 9,558.32 100.0%
LB-014 D Project Sendai Minami Iwanuma City, Miyagi 1,530 0.3% 11,052.27 100.0%
LB-015 D Project Tsuchiura Tsuchiura City, Ibaraki 3,390 0.6% 17,448.86 100.0%
LB-016 D Project Gotenba Gotenba City, Shizuoka 1,140 0.2% 6,737.53 100.0%
LB-017 D Project Nishi-Hiroshima Hiroshima City, Hiroshima 1,210 0.2% 5,093.51 100.0%
LB-018 D Project Fukuoka Umi Kasuya District, Fukuoka 4,240 0.7% 24,729.56 100.0%
LB-019 D Project Tosu Tosu City, Saga 5,740 1.0% 17,858.01 100.0%
LB-020 D Project Kuki I Kuki City, Saitama 3,900 0.7% 22,708.72 100.0%
LB-021 D Project Kuki II Kuki City, Saitama 8,120 1.4% 50,490.00 100.0%
LB-022 D Project Kawagoe I Kawagoe City, Saitama 3,530 0.6% 16,150.88 100.0%
LB-023 D Project Kawagoe II Kawagoe City, Saitama 4,850 0.8% 19,872.00 100.0%
LB-024 DPL Inuyama Inuyama City, Aichi 3,940 0.7% 21,628.50 100.0%
LB-025 D Project Fukuoka Hakozaki Fukuoka City, Fukuoka 4,340 0.8% 34,710.80 100.0%
LB-026 D Project Kuki III Kuki City, Saitama 7,630 1.3% 26,937.41 100.0%
LB-027 D Project Kuki IV Kuki City, Saitama 5,520 1.0% 26,460.00 100.0%
LB-028 D Project Kuki V Kuki City, Saitama 8,280 1.4% 47,320.89 100.0%
LB-029 D Project Kuki VI Kuki City, Saitama 5,140 0.9% 29,244.66 100.0%
LB-030 D Project Yashio Yashio City, Saitama 6,400 1.1% 21,965.04 100.0%
LB-031 D Project Nishiyodogawa Osaka City, Osaka 10,300 1.8% 39,584.80 100.0%
LB-032 D Project Matsudo Matsudo City, Chiba 7,370 1.3% 26,776.67 100.0%
LB-033 D Project Hibiki Nada Kitakyushu City, Fukuoka 2,080 0.4% 23,933.75 100.0%
LB-034 D Project Morioka II Takizawa City, Iwate 1,280 0.2% 4,481.00 100.0%
LB-035 D Project Kawagoe III Kawagoe City, Saitama 7,200 1.2% 39,572.32 100.0%
LB-036 D Project Kazo Kazo City, Saitama 3,300 0.6% 18,371.10 100.0%
Property
numberProperty name Location
Acquisition
price
(mil yen)
Investment
ratio
Leasable
area (m2)
Occupan
cy rate
(Note)
LB-037 D Project Urayasu III Urayasu City, Chiba 8,500 1.5% 39,441.32 100.0%
LB-038 D Project Tomisato Tomisato City, Chiba 5,000 0.9% 36,113.25 100.0%
LB-039 D Project Kyotanabe Kyotanabe City, Kyoto 3,520 0.6% 10,965.68 100.0%
LB-040 D Project Sendai Izumi Sendai City, Miyagi 1,510 0.3% 10,764.05 100.0%
LB-041 D Project Oyama Oyama City, Tochigi 2,000 0.3% 14,106.91 100.0%
LB-042 D Project Sano Sano City, Tochigi 1,780 0.3% 15,668.44 100.0%
LB-043 D Project Tatebayashi Tatebayashi City, Gunma 3,100 0.5% 13,521.56 100.0%
LB-044 D Project Kakegawa Kakegawa City, Shizuoka 6,000 1.0% 39,341.44 100.0%
LB-045 D Project Hiroshima Seifu Hiroshima City, Hiroshima 3,820 0.7% 19,004.72 100.0%
LB-046 D Project Tosu II Tosu City, Saga 1,700 0.3% 13,012.50 100.0%
LM-001 DPL Misato Misato City, Saitama 16,831 2.9% 55,864.47 100.0%
RE-001 Qiz Ebisu Shibuya Ward, Tokyo 7,650 1.3% 5,230.39 95.5%
RE-002 Castalia Azabujuban Shichimenzaka Minato Ward, Tokyo 4,500 0.8% 3,492.93 99.2%
RE-003 Castalia Shibakoen Minato Ward, Tokyo 2,630 0.5% 2,707.51 98.6%
RE-004 Castalia Ginza Chuo Ward, Tokyo 2,520 0.4% 2,226.42 96.9%
RE-005 Castalia Hiroo Minato Ward, Tokyo 2,220 0.4% 1,621.59 100.0%
RE-006 Castalia Nihonbashi Chuo Ward, Tokyo 1,200 0.2% 1,458.73 96.4%
RE-007 Castalia Hacchobori Chuo Ward, Tokyo 2,300 0.4% 2,969.57 98.2%
RE-008 Castalia Azabujuban Minato Ward, Tokyo 2,910 0.5% 2,400.00 96.6%
RE-009 Castalia Azabujuban II Minato Ward, Tokyo 2,690 0.5% 2,094.58 98.5%
RE-010 Castalia Shinjuku Natsumezaka Shinjuku Ward, Tokyo 1,865 0.3% 1,917.62 100.0%
RE-011 Castalia Ginza II Chuo Ward, Tokyo 1,800 0.3% 1,817.56 97.4%
RE-012 Castalia Shibuya Sakuragaoka Shibuya Ward, Tokyo 1,400 0.2% 1,123.80 97.9%
RE-013 Castalia Nishi Azabu Kasumicho Minato Ward, Tokyo 2,143 0.4% 2,779.77 90.7%
RE-014 Castalia Ochanomizu Chiyoda Ward, Tokyo 1,770 0.3% 2,559.21 94.4%
RE-015 Castalia Sangubashi Shibuya Ward, Tokyo 1,393 0.2% 1,898.47 100.0%
RE-016 Castalia Suitengu Chuo Ward, Tokyo 1,279 0.2% 1,940.94 98.7%
RE-017 Castalia Suitengu II Chuo Ward, Tokyo 1,138 0.2% 1,858.34 100.0%
RE-018 Castalia Shintomicho Chuo Ward, Tokyo 932 0.2% 1,444.52 95.2%
RE-019 Castalia Shintomicho II Chuo Ward, Tokyo 825 0.1% 1,244.54 100.0%
RE-020 Castalia Harajuku Shibuya Ward, Tokyo 887 0.2% 1,225.26 100.0%
RE-021 Castalia Yoyogi Uehara Shibuya Ward, Tokyo 608 0.1% 811.95 100.0%
RE-022 Castalia Sendagaya Shibuya Ward, Tokyo 555 0.1% 803.03 100.0%
RE-023 Castalia Shinjuku 7 chome Shinjuku Ward, Tokyo 464 0.1% 957.60 100.0%
RE-024 Castalia Ningyocho Chuo Ward, Tokyo 947 0.2% 1,747.90 100.0%
RE-025 Castalia Ningyocho II Chuo Ward, Tokyo 1,070 0.2% 1,826.80 100.0%

Portfolio List (2)
36
Property
numberProperty name Location
Acquisition
price
(mil yen)
Investment
ratio
Leasable
area (m2)
Occupan
cy rate
(Note)
RE-026 Castalia Shin-Ochanomizu Chiyoda Ward, Tokyo 914 0.2% 1,308.38 100.0%
RE-027 Castalia Higashi Nihonbashi II Chuo Ward, Tokyo 1,370 0.2% 2,117.46 100.0%
RE-028 Castalia Jinbocho Chiyoda Ward, Tokyo 1,160 0.2% 1,628.80 100.0%
RE-029 Castalia Shintomicho III Chuo Ward, Tokyo 675 0.1% 972.51 95.4%
RE-030 Castalia Shinjuku Gyoen Shinjuku Ward, Tokyo 2,720 0.5% 3,594.16 100.0%
RE-031 Castalia Takanawadai Minato Ward, Tokyo 860 0.1% 1,147.44 100.0%
RE-032 Castalia Higashi Nihonbashi III Chuo Ward, Tokyo 666 0.1% 1,105.20 100.0%
RE-033 Castalia Shinjuku Gyoen II Shinjuku Ward, Tokyo 486 0.1% 668.79 100.0%
RE-034 Castalia Shintomicho IV Chuo Ward, Tokyo 400 0.1% 681.00 100.0%
RE-035 Castalia Takanawadai II Minato Ward, Tokyo 1,190 0.2% 1,567.84 100.0%
RE-036 Castalia Minami Azabu Minato Ward, Tokyo 642 0.1% 882.67 100.0%
RE-037 Castalia Ginza III Chuo Ward, Tokyo 2,880 0.5% 3,494.42 100.0%
RE-038 Castalia Kayabacho Chuo Ward, Tokyo 2,707 0.5% 4,602.95 99.0%
RE-039 Castalia Takanawa Minato Ward, Tokyo 7,430 1.3% 10,408.26 97.6%
RE-040 Castalia Higashi Nihonbashi Chuo Ward, Tokyo 3,520 0.6% 6,442.28 100.0%
RE-041 Castalia Shinjuku Shinjuku Ward, Tokyo 2,950 0.5% 3,150.80 100.0%
RE-042 Castalia Ichigaya Shinjuku Ward, Tokyo 940 0.2% 1,546.34 93.3%
RE-043 Shibaura Island Bloom Tower Minato Ward, Tokyo 7,580 1.3% 16,849.50 97.7%
RE-044 Castalia Hatsudai Shibuya Ward, Tokyo 2,030 0.4% 3,077.05 99.1%
RE-045 Castalia Hatsudai II Shibuya Ward, Tokyo 1,900 0.3% 2,339.42 100.0%
RE-046 Castalia Ebisu Shibuya Ward, Tokyo 1,420 0.2% 1,659.71 97.7%
RE-047 Castalia Meguro Kamurozaka Shinagawa Ward, Tokyo 4,500 0.8% 4,967.97 97.6%
RE-048 Castalia Toritsudaigaku Meguro Ward, Tokyo 648 0.1% 863.70 95.9%
RE-049 Castalia Yukigaya Ota Ward, Tokyo 1,110 0.2% 1,542.30 98.1%
RE-050 Castalia Yutenji Meguro Ward, Tokyo 1,450 0.3% 1,380.35 100.0%
RE-051 Castalia Otsuka Toshima Ward, Tokyo 1,480 0.3% 1,871.70 95.5%
RE-052 Castalia Kikukawa Sumida Ward, Tokyo 817 0.1% 1,168.18 97.8%
RE-053 Castalia Meguro Meguro Ward, Tokyo 844 0.1% 1,414.73 92.4%
RE-054 Castalia Otsuka II Toshima Ward, Tokyo 1,040 0.2% 1,784.50 97.9%
RE-055 Castalia Jiyugaoka Meguro Ward, Tokyo 1,200 0.2% 1,472.47 100.0%
RE-056 Castalia Mejiro Toshima Ward, Tokyo 988 0.2% 1,658.90 100.0%
RE-057 Castalia Ikebukuro Toshima Ward, Tokyo 2,570 0.4% 3,644.35 97.6%
RE-058 Castalia Kaname-cho Toshima Ward, Tokyo 1,140 0.2% 1,624.06 100.0%
RE-059 Castalia Tower Shinagawa Seaside Shinagawa Ward, Tokyo 7,380 1.3% 12,732.35 98.8%
RE-060 Castalia Yakumo Meguro Ward, Tokyo 857 0.1% 1,276.91 84.9%
RE-061 Castalia Togoshiekimae Shinagawa Ward, Tokyo 1,560 0.3% 2,014.12 100.0%
Property
numberProperty name Location
Acquisition
price
(mil yen)
Investment
ratio
Leasable
area (m2)
Occupan
cy rate
(Note)
RE-062 Castalia Honjo Azumabashi Sumida Ward, Tokyo 996 0.2% 2,255.88 100.0%
RE-063 Castalia Kitazawa Setagaya Ward, Tokyo 742 0.1% 1,220.16 87.0%
RE-064 Castalia Monzennakacho Koto Ward, Tokyo 503 0.1% 887.94 100.0%
RE-065 Castalia Kamiikedai Ota Ward, Tokyo 198 0.0% 414.45 100.0%
RE-066 Castalia Morishita Koto Ward, Tokyo 832 0.1% 1,383.90 95.6%
RE-067 Castalia Wakabayashikoen Setagaya Ward, Tokyo 776 0.1% 1,425.43 100.0%
RE-068 Castalia Asakusabashi Taito Ward, Tokyo 792 0.1% 1,537.84 100.0%
RE-069 Castalia Iriya Taito Ward, Tokyo 546 0.1% 1,415.15 100.0%
RE-070 Castalia Kita Ueno Taito Ward, Tokyo 2,641 0.5% 4,197.66 99.1%
RE-071 Castalia Morishita II Koto Ward, Tokyo 686 0.1% 1,275.60 95.0%
RE-072 Castalia Minowa Taito Ward, Tokyo 1,430 0.2% 2,406.41 95.8%
RE-073 Castalia Oyamadai Setagaya Ward, Tokyo 533 0.1% 857.32 100.0%
RE-074 Castalia Nakano Nakano Ward, Tokyo 1,060 0.2% 1,613.86 97.7%
RE-075 Castalia Yoga Setagaya Ward, Tokyo 923 0.2% 1,472.38 94.9%
RE-076 Castalia Sumiyoshi Koto Ward, Tokyo 948 0.2% 1,362.60 98.4%
RE-077 Castalia Monzennakacho II Koto Ward, Tokyo 2,160 0.4% 3,038.98 100.0%
RE-078 Castalia Oshiage Sumida Ward, Tokyo 1,100 0.2% 1,785.24 100.0%
RE-079 Castalia Kuramae Taito Ward, Tokyo 1,260 0.2% 1,994.93 100.0%
RE-080 Castalia Nakanobu Shinagawa Ward, Tokyo 1,790 0.3% 2,421.82 93.5%
RE-081 Royal Parks Toyosu Koto Ward, Tokyo 7,360 1.3% 18,112.03 100.0%
RE-082 Castalia Togoshi Shinagawa Ward, Tokyo 1,770 0.3% 2,629.59 95.8%
RE-083 Castalia Ooimachi Shinagawa Ward, Tokyo 1,181 0.2% 1,413.75 100.0%
RE-084 Castalia Omori Ota Ward, Tokyo 1,500 0.3% 2,046.36 96.9%
RE-085 Castalia Mishuku Setagaya Ward, Tokyo 1,900 0.3% 2,640.86 98.5%
RE-086 Castalia Arakawa Arakawa Ward, Tokyo 1,660 0.3% 3,797.92 96.1%
RE-087 Castalia Omori II Ota Ward, Tokyo 2,370 0.4% 2,818.70 96.3%
RE-088 Castalia Nakameguro Meguro Ward, Tokyo 3,800 0.7% 3,166.71 94.7%
RE-089 Castalia Meguro Chojyamaru Shinagawa Ward, Tokyo 2,030 0.4% 2,123.77 97.2%
RE-090 Castalia Meguro Takaban Meguro Ward, Tokyo 1,750 0.3% 1,961.52 98.4%
RE-091 Castalia Omori III Shinagawa Ward, Tokyo 1,520 0.3% 2,004.80 97.5%
RE-092 Morino Tonari Shinagawa Ward, Tokyo 1,020 0.2% 1,668.24 90.9%
RE-093 Castalia Meguro Tairamachi Meguro Ward, Tokyo 1,165 0.2% 1,278.52 100.0%
RE-094 Royal Parks SEASIR Adachi Ward, Tokyo 4,350 0.8% 17,269.74 100.0%
RE-095 Castalia Honkomagome Bunkyo Ward, Tokyo 1,520 0.3% 2,224.41 100.0%
RE-096 Cosmo Heim Musashikosugi Kawasaki City, Kanagawa 1,674 0.3% 4,208.83 100.0%
RE-097 Castalia TsurumiYokohama City,
Kanagawa666 0.1% 1,452.09 96.9%

Portfolio List (3)
37
Property
numberProperty name Location
Acquisition
price
(mil yen)
Investment
ratio
Leasable
area (m2)
Occupan
cy rate
(Note)
RE-098 Castalia Funabashi Funabashi City, Chiba 704 0.1% 1,552.01 97.8%
RE-099 Castalia Nishi Funabashi Funabashi City, Chiba 783 0.1% 1,597.32 98.8%
RE-105 Castalia NogeyamaYokohama City,
Kanagawa325 0.1% 744.90 100.0%
RE-106 Castalia Ichikawa Ichikawa City, Chiba 461 0.1% 876.89 100.0%
RE-107 Royal Parks Hanakoganei Kodaira City, Tokyo 5,300 0.9% 18,153.57 100.0%
RE-108 Castalia Musashikosugi Kawasaki City, Kanagawa 1,680 0.3% 2,179.80 95.4%
RE-109 Royal Parks Wakabadai Inagi City, Tokyo 4,360 0.8% 21,367.93 100.0%
RE-110Pacific Royal Court Minatomirai
Urban Tower
Yokohama City,
Kanagawa9,100 1.6% 26,294.49 100.0%
RE-111 L-Place ShinkoyasuYokohama City,
Kanagawa1,720 0.3% 3,009.74 100.0%
RE-112 Royal Parks Musashikosugi Kawasaki City, Kanagawa 1,060 0.2% 3,808.97 100.0%
RE-115 Crest Kusatsu Kusatsu City, Shiga 3,004 0.5% 13,452.80 99.4%
RE-116 Castalia Sakaisuji Honmachi Osaka City, Osaka 1,490 0.3% 3,471.39 99.1%
RE-117 Castalia Shin-Umeda Osaka City, Osaka 1,376 0.2% 3,279.90 99.2%
RE-118 Castalia Abeno Osaka City, Osaka 4,368 0.8% 10,920.75 99.4%
RE-119 Castalia Sakae Nagoya City, Aichi 1,010 0.2% 2,836.00 93.2%
RE-121 Castalia Maruyama Urasando Sapporo City, Hokkaido 411 0.1% 1,522.89 91.2%
RE-122 Castalia Maruyama Omotesando Sapporo City, Hokkaido 1,740 0.3% 6,100.31 93.7%
RE-123 Castalia Higashi Hie Fukuoka City, Fukuoka 960 0.2% 3,061.60 100.0%
RE-124 Castalia Tower Nagahoribashi Osaka City, Osaka 3,400 0.6% 8,747.40 95.8%
RE-125 Castalia Sannomiya Kobe City, Hyogo 1,230 0.2% 3,071.60 92.9%
RE-126 Castalia Kotodaikoen Sendai City, Miyagi 481 0.1% 1,684.10 95.2%
RE-127 Castalia Ichibancho Sendai City, Miyagi 783 0.1% 2,800.32 96.9%
RE-128 Castalia Omachi Sendai City, Miyagi 656 0.1% 2,149.08 97.2%
RE-129 Castalia Uemachidai Osaka City, Osaka 2,190 0.4% 5,415.39 100.0%
RE-130 Castalia Tower Higobashi Osaka City, Osaka 2,670 0.5% 6,230.20 97.5%
RE-131 Big Tower Minami Sanjo Sapporo City, Hokkaido 1,740 0.3% 8,661.19 93.8%
RE-132 Castalia Fushimi Nagoya City, Aichi 2,260 0.4% 7,022.69 93.5%
RE-133 Castalia Meieki Minami Nagoya City, Aichi 720 0.1% 1,822.10 95.8%
RE-134 Castalia Yakuin Fukuoka City, Fukuoka 930 0.2% 2,784.83 96.6%
RE-135 Castalia Mibu Koyto City, Kyoto 1,193 0.2% 2,828.39 98.8%
RE-136 Castalia Tsutsujigaoka Sendai City, Miyagi 1,208 0.2% 4,471.11 98.6%
RE-137 Castalia Ohori Bay Tower Fukuoka City, Fukuoka 2,910 0.5% 11,089.75 57.2%
RE-138 Royal Parks Namba Osaka City, Osaka 2,830 0.5% 10,354.15 100.0%
RE-139 Castalia Shigahondori Nagoya City, Aichi 1,730 0.3% 5,086.69 93.6%
RE-140 Castalia Kyoto Nishioji Kyoto City, Kyoto 973 0.2% 2,035.37 100.0%
RE-141 Castalia Ningyocho III Chuo Ward, Tokyo 2,000 0.3% 2,897.06 100.0%
Property
numberProperty name Location
Acquisition
price
(mil yen)
Investment
ratio
Leasable
area (m2)
Occupan
cy rate
(Note)
RE-142 Royal Parks Umejima Adachi Ward, Tokyo 2,020 0.3% 6,828.78 100.0%
RE-143 Castalia Shinsakae II Nagoya City, Aichi 1,800 0.3% 4,425.46 100.0%
RM-001 ACROSSMALL Shinkamagaya Kamagaya City, Chiba 7,770 1.3% 41,742.84 100.0%
RM-002 FOLEO Hirakata Hirakata City, Osaka 4,580 0.8% 16,381.42 94.7%
RM-003 QiZ GATE URAWA Saitama City, Saitama 4,270 0.7% 9,705.31 86.9%
RM-004 UNICUS Takasaki Takasaki City, Gunma 3,000 0.5% 9,277.08 100.0%
RM-005 ACROSSPLAZA Miyoshi (Land) Iruma District, Saitama 3,740 0.6% 24,018.00 100.0%
RM-006 DREAM TOWN ALi Aomori City, Aomori 8,100 1.4% 22,196.81 98.5%
RM-007 ASOBOX (Land) Kitakyushu City, Fukuoka 1,600 0.3% 11,207.90 100.0%
RM-008 FOLEO Ome Imai Ome City, Tokyo 3,800 0.7% 8,637.91 100.0%
RR-001 LIFE Sagamihara WakamatsuSagamihara City,
Kanagawa1,670 0.3% 2,973.44 100.0%
RR-002 FOLEO Sendai Miyanomori Sendai City, Miyagi 6,960 1.2% 19,845.72 100.0%
RR-003 ACROSSPLAZA Inazawa (Land) Inazawa City, Aichi 2,390 0.4% 31,981.70 100.0%
RR-004Sports Depo and GOLF5
Kokurahigashi IC StoreKitakyushu City, Fukuoka 2,230 0.4% 8,899.89 100.0%
RR-005 Hiratsuka Retail Property (Land) Hiratsuka City, Kanagawa 5,620 1.0% 28,002.92 100.0%
OT-001 Urban Living Inage Chiba City, Chiba 930 0.2% 4,177.52 100.0%
OT-002 Aburatsubo Marina HILLS Miura City, Kanagawa 1,100 0.2% 3,901.14 100.0%
OT-003Naha Shin-Toshin Center Building
(Daiwa Roynet Hotel
Naha-Omoromachi)
Naha City, Okinawa 7,600 1.3% 13,480.00 100.0%
OT-004 Sharp Hiroshima Building Hiroshima City, Hiroshima 1,850 0.3% 3,064.89 100.0%
Asset class Number of properties
Acquisition
price
(mil yen)
Investment
ratio
Leasable
area (m2)
Occupan
cy rate
(Note)
Logistics 47 properties 260,119 45.0% 1,187,932.21 100.0%
Residential 135 properties 250,448 43.3% 487,242.91 97.3%
Retail 13 properties 55,730 9.6% 234,870.94 98.9%
Other 4 properties 11,480 2.0% 24,623.55 100.0%
Portfolio Total 199 properties 577,777 100.0% 1,934,669.61 99.2%
(Note) Occupancy rate as of August 31, 2017 is indicated.
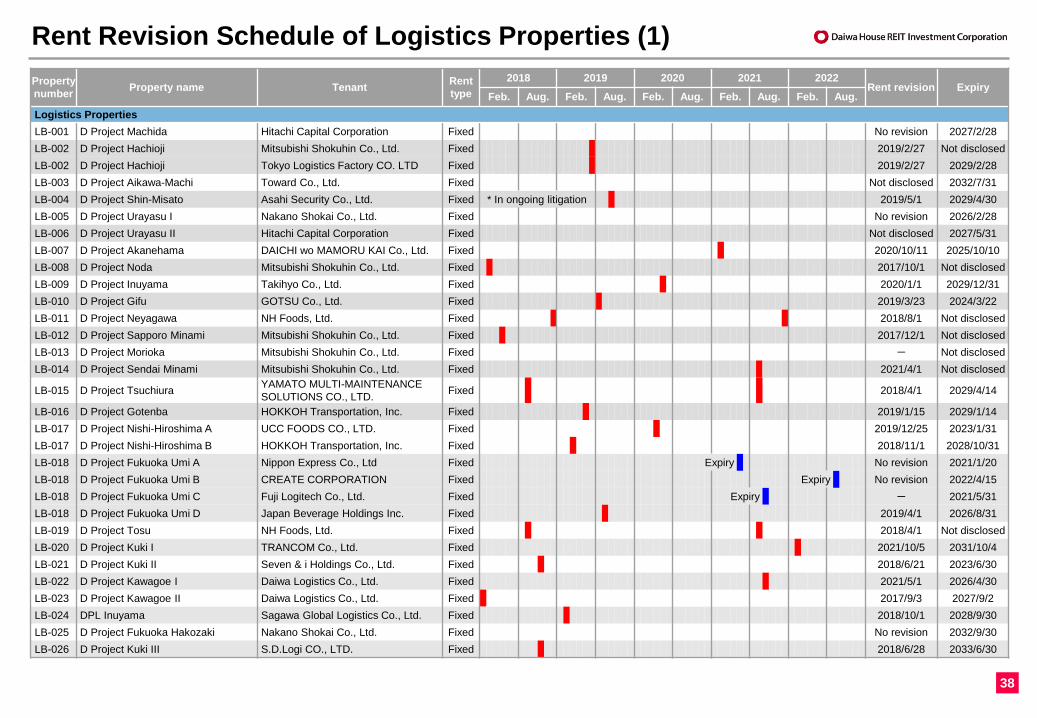
Rent Revision Schedule of Logistics Properties (1)
38
Property
numberProperty name Tenant
Rent
type
2018 2019 2020 2021 2022Rent revision Expiry
Feb. Aug. Feb. Aug. Feb. Aug. Feb. Aug. Feb. Aug.
Logistics Properties
LB-001 D Project Machida Hitachi Capital Corporation Fixed No revision 2027/2/28
LB-002 D Project Hachioji Mitsubishi Shokuhin Co., Ltd. Fixed 2019/2/27 Not disclosed
LB-002 D Project Hachioji Tokyo Logistics Factory CO. LTD Fixed 2019/2/27 2029/2/28
LB-003 D Project Aikawa-Machi Toward Co., Ltd. Fixed Not disclosed 2032/7/31
LB-004 D Project Shin-Misato Asahi Security Co., Ltd. Fixed * In ongoing litigation 2019/5/1 2029/4/30
LB-005 D Project Urayasu I Nakano Shokai Co., Ltd. Fixed No revision 2026/2/28
LB-006 D Project Urayasu II Hitachi Capital Corporation Fixed Not disclosed 2027/5/31
LB-007 D Project Akanehama DAICHI wo MAMORU KAI Co., Ltd. Fixed 2020/10/11 2025/10/10
LB-008 D Project Noda Mitsubishi Shokuhin Co., Ltd. Fixed 2017/10/1 Not disclosed
LB-009 D Project Inuyama Takihyo Co., Ltd. Fixed 2020/1/1 2029/12/31
LB-010 D Project Gifu GOTSU Co., Ltd. Fixed 2019/3/23 2024/3/22
LB-011 D Project Neyagawa NH Foods, Ltd. Fixed 2018/8/1 Not disclosed
LB-012 D Project Sapporo Minami Mitsubishi Shokuhin Co., Ltd. Fixed 2017/12/1 Not disclosed
LB-013 D Project Morioka Mitsubishi Shokuhin Co., Ltd. Fixed - Not disclosed
LB-014 D Project Sendai Minami Mitsubishi Shokuhin Co., Ltd. Fixed 2021/4/1 Not disclosed
LB-015 D Project TsuchiuraYAMATO MULTI-MAINTENANCE
SOLUTIONS CO., LTD.Fixed 2018/4/1 2029/4/14
LB-016 D Project Gotenba HOKKOH Transportation, Inc. Fixed 2019/1/15 2029/1/14
LB-017 D Project Nishi-Hiroshima A UCC FOODS CO., LTD. Fixed 2019/12/25 2023/1/31
LB-017 D Project Nishi-Hiroshima B HOKKOH Transportation, Inc. Fixed 2018/11/1 2028/10/31
LB-018 D Project Fukuoka Umi A Nippon Express Co., Ltd Fixed Expiry No revision 2021/1/20
LB-018 D Project Fukuoka Umi B CREATE CORPORATION Fixed Expiry No revision 2022/4/15
LB-018 D Project Fukuoka Umi C Fuji Logitech Co., Ltd. Fixed Expiry - 2021/5/31
LB-018 D Project Fukuoka Umi D Japan Beverage Holdings Inc. Fixed 2019/4/1 2026/8/31
LB-019 D Project Tosu NH Foods, Ltd. Fixed 2018/4/1 Not disclosed
LB-020 D Project Kuki I TRANCOM Co., Ltd. Fixed 2021/10/5 2031/10/4
LB-021 D Project Kuki II Seven & i Holdings Co., Ltd. Fixed 2018/6/21 2023/6/30
LB-022 D Project Kawagoe I Daiwa Logistics Co., Ltd. Fixed 2021/5/1 2026/4/30
LB-023 D Project Kawagoe II Daiwa Logistics Co., Ltd. Fixed 2017/9/3 2027/9/2
LB-024 DPL Inuyama Sagawa Global Logistics Co., Ltd. Fixed 2018/10/1 2028/9/30
LB-025 D Project Fukuoka Hakozaki Nakano Shokai Co., Ltd. Fixed No revision 2032/9/30
LB-026 D Project Kuki III S.D.Logi CO., LTD. Fixed 2018/6/28 2033/6/30

Rent Revision Schedule of Logistics Properties (2)
39
Rent Revision / Lease Contract Renewal of Logistics Properties
Period ending Feb. 2018 Period ending Aug. 2018
Rent revision of 4 tenants
3 tenants revised rent on equal termsRent revision of 6 tenants
Property
numberProperty name Tenant
Rent
type
2018 2019 2020 2021 2022Rent revision Expiry
Feb. Aug. Feb. Aug. Feb. Aug. Feb. Aug. Feb. Aug.
Logistics Properties
LB-027 D Project Kuki IV Chuo Bussan Corporation Fixed No revision 2029/6/30
LB-028 D Project Kuki V Hitachi Transport System, Ltd. Fixed Expiry - 2022/6/30
LB-029 D Project Kuki VI Sagawa Global Logistics Co., Ltd. Fixed 2018/8/9 2024/2/9
LB-030 D Project Yashio Tohto CO-OP Fixed 2022/8/1 2031/7/31
LB-030 D Project Yashio Ryutsu Service Co., Ltd. Fixed 2022/8/1 2031/7/31
LB-031 D Project Nishiyodogawa VANTEC CORPORATION Fixed 2021/4/15 2026/8/15
LB-032 D Project Matsudo Asahi Logistics Corp. Fixed 2020/4/9 2031/4/30
LB-033 D Project Hibiki Nada Nippon Express Co., Ltd Fixed Expiry No revision 2021/9/30
LB-034 D Project Morioka II Nichirei Logistics Group Inc. Fixed - 2035/10/31
LB-035 D Project Kawagoe IIIHitachi Transport System Kanto Co.,
Ltd.Fixed 2019/4/1 2024/6/30
LB-036 D Project Kazo Itochu Logistics Corp. Fixed 2020/3/1 2025/2/28
LB-037 D Project Urayasu III Daiwa Logistics Co., Ltd. Fixed 2022/6/1 2025/8/31
LB-038 D Project Tomisato Tokyo Nohin Daiko Co., Ltd. Fixed No revision 2026/1/31
LB-039 D Project Kyotanabe Hutech norin Co., Ltd. Fixed 2017/9/28 2032/10/31
LB-040 D Project Sendai Izumi Mitsubishi Shokuhin Co., Ltd. Fixed 2019/4/1 Not disclosed
LB-041 D Project Oyama Mitsubishi Shokuhin Co., Ltd. Fixed 2020/3/1 Not disclosed
LB-042 D Project Sano Toryusha Co., Ltd. Fixed No revision 2029/6/30
LB-043 D Project TatebayashiHitachi Transport System Kanto Co.,
Ltd.Fixed 2020/9/1 2030/8/31
LB-044 D Project KakegawaHitachi Transport System Central
Japan Co., Ltd.Fixed 2019/8/1 2034/7/31
LB-045 D Project Hiroshima Seifu MITSUI FOODS Co., Ltd. Fixed Not disclosed Not disclosed
LB-046 D Project Tosu II Marukyo Transportation Co., Ltd. Fixed - 2024/1/2
LM-001 DPL Misato Kokubu Group Corp. Fixed 2018/10/15 2033/11/14
LM-001 DPL Misato ARATA CORPORATION Fixed Expiry No revision 2020/12/31
LM-001 DPL Misato Kato Sangyo Co., Ltd. Fixed Not disclosed Not disclosed
LM-001 DPL Misato Nitori Co., Ltd. Fixed Expiry No revision 2018/10/31

Property
numberProperty name Tenant
Rent
type
2018 2019 2020 2021 2022Rent revision Expiry
Feb. Aug. Feb. Aug. Feb. Aug. Feb. Aug. Feb. Aug.
Retail Properties
RM-001 ACROSSMALL Shinkamagaya Daiwa Information Service Co., Ltd. Fixed Expiry - 2017/12/11
RM-002 FOLEO Hirakata Core tenant A Fixed 2019/1/1 2026/12/8
RM-002 FOLEO Hirakata Core tenant B Fixed 2019/1/1 2026/12/14
RM-003 QiZ GATE URAWA Core tenant A Fixed No revision 2027/5/31
RM-003 QiZ GATE URAWA Core tenant B Fixed 2020/3/27 2028/3/26
RM-004 UNICUS Takasaki P&D Consulting Co., Ltd. Fixed 2017/12/9 2028/11/19
RM-005 ACROSSPLAZA Miyoshi (Land) Daiwa Information Service Co., Ltd. Fixed 2017/10/1 2034/9/29
RM-006 DREAM TOWN ALi Core tenant AFixed +
VariableNo revision 2027/12/21
RM-006 DREAM TOWN ALi Core tenant B Fixed Expiry No revision 2017/11/1
RM-006 DREAM TOWN ALi Core tenant CFixed +
VariableExpiry No revision 2021/6/30
RM-007 ASOBOX (Land) Daiwa Information Service Co., Ltd. Fixed 2018/9/1 2037/8/31
RM-008 FOLEO Ome Imai Belc CO., LTD. Fixed Not disclosed Not disclosed
RM-008 FOLEO Ome Imai Yamada Denki Co., Ltd. Fixed Not disclosed 2037/6/8
RR-001 LIFE Sagamihara Wakamatsu LIFE CORPORATION Fixed 2019/5/22 2027/5/21
RR-002 FOLEO Sendai Miyanomori Daiwa House Industry Co., Ltd. Fixed No revision 2022/11/30
RR-003 ACROSSPLAZA Inazawa (Land) Daiwa Information Service Co., Ltd. Fixed No revision 2034/2/24
RR-004Sports Depo and GOLF5
Kokurahigashi IC Store Alpen Co., Ltd. Fixed Not disclosed 2027/11/28
RR-005 Hiratsuka Retail Property (Land) Not disclosedNot
disclosedNot disclosed Not disclosed
Rent Revision Schedule of Retail Properties
40
Rent Revision / Lease Contract Renewal of Retail Properties
Period ending Feb. 2018 Period ending Aug. 2018
Rent revision of 2 tenants
1 tenant revised rent on equal terms
Contract expiry of 2 tenants
Core tenant B of DREAM TOWN ALi
renewed a 10-year contract on equal terms
Rent revision - None
Contract expiry - None

41
(mil yen) (%)
Property
numberProperty name
Acquisition
price
Book value
Aug. 2017
Unrealized
gain (loss)
Appraisal value (Note 1) Feb. 2017 Aug. 2017 Change
Appraiser
(Note 2)Feb. 2017 Aug. 2017 ChangeDirect cap DCF Direct cap DCF Direct cap DCF
CR DR TCR CR DR TCR CR DR TCR
LB-001 D Project Machida 9,200 9,211 208 9,410 9,420 10 4.6 4.5/4.6 4.8 4.5 4.4/4.5 4.7 -0.1 -0.1 -0.1 Tanizawa
LB-002 D Project Hachioji 15,400 15,242 557 15,700 15,800 100 4.5 4.4/4.5 4.7 4.4 4.3/4.4 4.6 -0.1 -0.1 -0.1 Tanizawa
LB-003 D Project Aikawa-Machi 3,390 3,721 538 3,430 4,260 830 4.7 4.7 4.9 4.6 4.6 4.8 -0.1 -0.1 -0.1 Tanizawa
LB-004 D Project Shin-Misato 5,710 5,668 91 5,760 5,760 0 5.2 5.2 5.4 5.2 5.2 5.4 0.0 0.0 0.0 Tanizawa
LB-005 D Project Urayasu I 9,280 9,225 284 9,460 9,510 50 4.2 4.3 4.4 4.1 4.2 4.3 -0.1 -0.1 -0.1 Tanizawa
LB-006 D Project Urayasu II 26,000 25,844 855 26,200 26,700 500 4.1 4.1/4.2 4.3 4.0 4.0/4.1 4.2 -0.1 -0.1 -0.1 Tanizawa
LB-007 D Project Akanehama 2,950 2,927 102 2,980 3,030 50 4.6 4.7 4.8 4.5 4.6 4.7 -0.1 -0.1 -0.1 Tanizawa
LB-008 D Project Noda 6,210 6,178 271 6,340 6,450 110 4.8 4.7 5.0 4.7 4.6/4.7 4.9 -0.1 -0.1 -0.1 Tanizawa
LB-009 D Project Inuyama 8,690 8,583 416 8,820 9,000 180 5.0 4.9/5.0 5.2 4.9 4.8/4.9 5.1 -0.1 -0.1 -0.1 Tanizawa
LB-010 D Project Gifu 1,100 1,084 45 1,110 1,130 20 5.6 5.5/5.6 5.8 5.5 5.4/5.5 5.7 -0.1 -0.1 -0.1 Tanizawa
LB-011 D Project Neyagawa 5,980 5,932 267 6,080 6,200 120 4.7 4.7 4.9 4.6 4.6 4.8 -0.1 -0.1 -0.1 Tanizawa
LB-012 D Project Sapporo Minami 818 803 42 838 846 8 6.1 5.9/6.0 6.3 6.0 5.9 6.2 -0.1 -0.1 -0.1 Tanizawa
LB-013 D Project Morioka 1,200 1,181 28 1,220 1,210 -10 6.0 5.9 6.2 6.0 5.9 6.2 0.0 0.0 0.0 Tanizawa
LB-014 D Project Sendai Minami 1,530 1,505 44 1,550 1,550 0 5.3 5.1/5.2 5.5 5.3 5.1/5.2 5.5 0.0 0.0 0.0 Tanizawa
LB-015 D Project Tsuchiura 3,390 3,341 108 3,430 3,450 20 5.3 5.2 5.5 5.3 5.2 5.5 0.0 0.0 0.0 Tanizawa
LB-016 D Project Gotenba 1,140 1,126 23 1,160 1,150 -10 5.5 5.4 5.7 5.4 5.3 5.6 -0.1 -0.1 -0.1 Tanizawa
LB-017 D Project Nishi-Hiroshima 1,210 1,198 1 1,220 1,200 -20 5.5 5.5/5.6 5.7 5.5 5.5/5.6 5.7 0.0 0.0 0.0 Tanizawa
LB-018 D Project Fukuoka Umi 4,240 4,189 100 4,300 4,290 -10 5.24.9/5.0
/5.15.4 5.1
4.8/4.9
/5.05.3 -0.1 -0.1 -0.1 Tanizawa
LB-019 D Project Tosu 5,740 5,649 260 5,800 5,910 110 5.2 5.2/5.3 5.4 5.1 5.1/5.2 5.3 -0.1 -0.1 -0.1 Tanizawa
LB-020 D Project Kuki I 3,900 3,859 250 4,020 4,110 90 4.9 4.9/5.0 5.1 4.8 4.8/4.9 5.0 -0.1 -0.1 -0.1 Tanizawa
LB-021 D Project Kuki II 8,120 8,007 572 8,400 8,580 180 4.9 4.9/5.0 5.1 4.8 4.8/4.9 5.0 -0.1 -0.1 -0.1 Tanizawa
LB-022 D Project Kawagoe I 3,530 3,499 210 3,640 3,710 70 4.9 4.9/5.0 5.1 4.8 4.8/4.9 5.0 -0.1 -0.1 -0.1 Tanizawa
LB-023 D Project Kawagoe II 4,850 4,804 345 5,070 5,150 80 4.9 4.9 5.1 4.8 4.8/4.9 5.0 -0.1 -0.1 -0.1 Tanizawa
LB-024 DPL Inuyama 3,940 3,896 163 3,970 4,060 90 5.0 4.9 5.2 4.9 4.8 5.1 -0.1 -0.1 -0.1 Tanizawa
LB-025 D Project Fukuoka Hakozaki 4,340 4,292 227 4,430 4,520 90 4.9 4.8 5.1 4.8 4.7 5.0 -0.1 -0.1 -0.1 Tanizawa
LB-026 D Project Kuki III 7,630 7,540 589 7,890 8,130 240 4.9 4.9/5.0 5.1 4.8 4.8/4.9 5.0 -0.1 -0.1 -0.1 Tanizawa
LB-027 D Project Kuki IV 5,520 5,462 347 5,690 5,810 120 4.9 4.9/5.0 5.1 4.8 4.8/4.9 5.0 -0.1 -0.1 -0.1 Tanizawa
LB-028 D Project Kuki V 8,280 8,239 550 8,610 8,790 180 4.9 4.9/5.0 5.1 4.8 4.8/4.9 5.0 -0.1 -0.1 -0.1 Tanizawa
LB-029 D Project Kuki VI 5,140 5,071 348 5,300 5,420 120 4.9 4.9/5.0 5.1 4.8 4.8/4.9 5.0 -0.1 -0.1 -0.1 Tanizawa
LB-030 D Project Yashio 6,400 6,339 260 6,480 6,600 120 4.7 4.2 5.0 4.6 4.1 4.9 -0.1 -0.1 -0.1 JREI
LB-031 D Project Nishiyodogawa 10,300 10,178 521 10,500 10,700 200 4.9 4.6 5.1 4.8 4.5 5.0 -0.1 -0.1 -0.1 JREI
LB-032 D Project Matsudo 7,370 7,309 310 7,460 7,620 160 4.7 4.4 4.8 4.6 4.3 4.7 -0.1 -0.1 -0.1 JREI
Appraisal Value Changes Comparison (1)

Appraisal Value Changes Comparison (2)
42
(mil yen) (%)
Property
numberProperty name
Acquisition
price
Book value
Aug. 2017
Unrealized
gain (loss)
Appraisal value (Note 1) Feb. 2017 Aug. 2017 Change
Appraiser
(Note 2)Feb. 2017 Aug. 2017 ChangeDirect cap DCF Direct cap DCF Direct cap DCF
CR DR TCR CR DR TCR CR DR TCR
LB-033 D Project Hibiki Nada 2,080 2,063 66 2,150 2,130 -20 5.9 5.8/6.0 6.1 5.8 5.7/5.9 6.0 -0.1 -0.1 -0.1 Tanizawa
LB-034 D Project Morioka II 1,280 1,274 55 1,320 1,330 10 6.0 5.7/5.8 6.2 6.0 5.7/5.8 6.2 0.0 0.0 0.0 Tanizawa
LB-035 D Project Kawagoe III 7,200 7,227 232 7,260 7,460 200 4.8 4.8/4.9 5.0 4.7 4.7/4.8 4.9 -0.1 -0.1 -0.1 Tanizawa
LB-036 D Project Kazo 3,300 3,314 115 3,350 3,430 80 5.0 5.0/5.1 5.2 4.9 4.9/5.0 5.1 -0.1 -0.1 -0.1 Tanizawa
LB-037 D Project Urayasu III 8,500 8,526 813 8,880 9,340 460 4.34.2/4.3
/4.44.5 4.1
4.0/4.1
/4.24.3 -0.2 -0.2 -0.2 Tanizawa
LB-038 D Project Tomisato 5,000 5,015 24 5,030 5,040 10 5.0 5.0/5.1 5.2 5.0 5.0/5.1 5.2 0.0 0.0 0.0 Tanizawa
LB-039 D Project Kyotanabe 3,520 3,535 84 3,550 3,620 70 5.7 5.3 6.0 5.6 5.2 5.9 -0.1 -0.1 -0.1 JREI
LB-040 D Project Sendai Izumi 1,510 1,520 69 1,560 1,590 30 5.5 5.2 5.7 5.4 5.1 5.6 -0.1 -0.1 -0.1 JREI
LB-041 D Project Oyama 2,000 2,008 11 2,010 2,020 10 5.6 5.7 5.8 5.6 5.7 5.8 0.0 0.0 0.0 Tanizawa
LB-042 D Project Sano 1,780 1,791 -1 1,780 1,790 10 5.6 5.6 5.8 5.6 5.6 5.8 0.0 0.0 0.0 Tanizawa
LB-043 D Project Tatebayashi 3,100 3,111 38 3,120 3,150 30 5.6 5.6 5.8 5.6 5.6 5.8 0.0 0.0 0.0 Tanizawa
LB-044 D Project Kakegawa 6,000 6,023 116 6,070 6,140 70 5.7 5.5 5.9 5.7 5.5 5.9 0.0 0.0 0.0 JREI
LB-045 D Project Hiroshima Seifu 3,820 3,836 93 3,860 3,930 70 5.7 5.2 6.1 5.6 5.1 6.0 -0.1 -0.1 -0.1 JREI
LB-046 D Project Tosu II 1,700 1,709 130 1,740 1,840 100 5.3 5.3/5.4 5.5 5.2 5.2/5.3 5.4 -0.1 -0.1 -0.1 Tanizawa
LM-001 DPL Misato 16,831 16,875 524 16,900 17,400 500 4.3 4.3/4.4 4.5 4.2 4.2/4.3 4.4 -0.1 -0.1 -0.1 Tanizawa
Logistics Properties Total 260,119 258,948 11,327 264,848 270,276 5,428 - - - - - - - - - -
RE-001 Qiz Ebisu 7,650 7,238 1,281 8,290 8,520 230 4.0 4.2 4.2 3.9 4.1 4.1 -0.1 -0.1 -0.1 Tanizawa
RE-002Castalia Azabujuban
Shichimenzaka4,500 4,170 49 4,210 4,220 10 4.2 4.0 4.4 4.2 4.0 4.4 0.0 0.0 0.0 Chuo
RE-003 Castalia Shibakoen 2,630 2,410 -220 2,140 2,190 50 4.4 4.5 4.6 4.3 4.4 4.5 -0.1 -0.1 -0.1 Tanizawa
RE-004 Castalia Ginza 2,520 2,353 -133 2,170 2,220 50 4.3 4.4 4.5 4.2 4.3 4.4 -0.1 -0.1 -0.1 Tanizawa
RE-005 Castalia Hiroo 2,220 2,077 -247 1,800 1,830 30 4.2 4.3 4.4 4.1 4.2 4.3 -0.1 -0.1 -0.1 Tanizawa
RE-006 Castalia Nihonbashi 1,200 1,073 96 1,140 1,170 30 4.4 4.5 4.6 4.3 4.4 4.5 -0.1 -0.1 -0.1 Tanizawa
RE-007 Castalia Hacchobori 2,300 2,116 133 2,190 2,250 60 4.4 4.5 4.6 4.3 4.4 4.5 -0.1 -0.1 -0.1 Tanizawa
RE-008 Castalia Azabujuban 2,910 2,792 -132 2,650 2,660 10 4.2 4.0 4.4 4.2 4.0 4.4 0.0 0.0 0.0 Chuo
RE-009 Castalia Azabujuban II 2,690 2,530 -30 2,490 2,500 10 4.1 3.9 4.3 4.1 3.9 4.3 0.0 0.0 0.0 Chuo
RE-010 Castalia Shinjuku Natsumezaka 1,865 1,770 -160 1,670 1,610 -60 4.3 4.1 4.5 4.3 4.1 4.5 0.0 0.0 0.0 Chuo
RE-011 Castalia Ginza II 1,800 1,667 62 1,670 1,730 60 4.3 4.4 4.5 4.2 4.3 4.4 -0.1 -0.1 -0.1 Tanizawa
RE-012 Castalia Shibuya Sakuragaoka 1,400 1,340 -240 1,080 1,100 20 4.2 4.4 4.4 4.1 4.3 4.3 -0.1 -0.1 -0.1 Tanizawa
RE-013 Castalia Nishi Azabu Kasumicho 2,143 2,316 -56 2,210 2,260 50 4.3 4.4 4.5 4.2 4.3 4.4 -0.1 -0.1 -0.1 Tanizawa
RE-014 Castalia Ochanomizu 1,770 1,706 413 2,050 2,120 70 4.4 4.2 4.6 4.3 4.1 4.5 -0.1 -0.1 -0.1 JREI
RE-015 Castalia Sangubashi 1,393 1,470 49 1,520 1,520 0 4.3 4.5 4.5 4.2 4.4 4.4 -0.1 -0.1 -0.1 Tanizawa
RE-016 Castalia Suitengu 1,279 1,199 190 1,360 1,390 30 4.5 4.5 4.7 4.4 4.4 4.6 -0.1 -0.1 -0.1 Tanizawa

Appraisal Value Changes Comparison (3)
43
(mil yen) (%)
Property
numberProperty name
Acquisition
price
Book value
Aug. 2017
Unrealized
gain (loss)
Appraisal value (Note 1) Feb. 2017 Aug. 2017 Change
Appraiser
(Note 2)Feb. 2017 Aug. 2017 ChangeDirect cap DCF Direct cap DCF Direct cap DCF
CR DR TCR CR DR TCR CR DR TCR
RE-017 Castalia Suitengu II 1,138 1,101 158 1,220 1,260 40 4.4 4.5 4.6 4.3 4.4 4.5 -0.1 -0.1 -0.1 Tanizawa
RE-018 Castalia Shintomicho 932 914 115 998 1,030 32 4.5 4.5 4.7 4.4 4.4 4.6 -0.1 -0.1 -0.1 Tanizawa
RE-019 Castalia Shintomicho II 825 814 99 882 914 32 4.5 4.5 4.7 4.4 4.4 4.6 -0.1 -0.1 -0.1 Tanizawa
RE-020 Castalia Harajuku 887 859 80 910 940 30 4.2 4.0 4.4 4.1 3.9 4.3 -0.1 -0.1 -0.1 JREI
RE-021 Castalia Yoyogi Uehara 608 646 66 695 713 18 4.3 4.1 4.5 4.2 4.0 4.4 -0.1 -0.1 -0.1 JREI
RE-022 Castalia Sendagaya 555 558 53 596 612 16 4.3 4.1 4.5 4.2 4.0 4.4 -0.1 -0.1 -0.1 JREI
RE-023 Castalia Shinjuku 7 chome 464 441 87 518 529 11 4.6 4.4 4.8 4.5 4.3 4.7 -0.1 -0.1 -0.1 JREI
RE-024 Castalia Ningyocho 947 865 364 1,190 1,230 40 4.3 4.1 4.5 4.2 4.0 4.4 -0.1 -0.1 -0.1 JREI
RE-025 Castalia Ningyocho II 1,070 979 380 1,330 1,360 30 4.3 4.1 4.5 4.2 4.0 4.4 -0.1 -0.1 -0.1 JREI
RE-026 Castalia Shin-Ochanomizu 914 858 231 1,060 1,090 30 4.3 4.1 4.5 4.2 4.0 4.4 -0.1 -0.1 -0.1 JREI
RE-027 Castalia Higashi Nihonbashi II 1,370 1,265 414 1,660 1,680 20 4.3 4.1 4.5 4.2 4.0 4.4 -0.1 -0.1 -0.1 JREI
RE-028 Castalia Jinbocho 1,160 1,085 364 1,420 1,450 30 4.3 4.1 4.5 4.2 4.0 4.4 -0.1 -0.1 -0.1 JREI
RE-029 Castalia Shintomicho III 675 618 140 739 759 20 4.4 4.1 4.7 4.3 4.0 4.6 -0.1 -0.1 -0.1 JREI
RE-030 Castalia Shinjuku Gyoen 2,720 2,623 476 3,030 3,100 70 4.4 4.6 4.6 4.3 4.5 4.5 -0.1 -0.1 -0.1 Tanizawa
RE-031 Castalia Takanawadai 860 818 211 1,010 1,030 20 4.2 4.0 4.4 4.1 3.9 4.3 -0.1 -0.1 -0.1 JREI
RE-032 Castalia Higashi Nihonbashi III 666 612 194 791 807 16 4.3 4.1 4.5 4.2 4.0 4.4 -0.1 -0.1 -0.1 Daiwa
RE-033 Castalia Shinjuku Gyoen II 486 475 35 499 511 12 4.4 4.6 4.6 4.3 4.5 4.5 -0.1 -0.1 -0.1 Tanizawa
RE-034 Castalia Shintomicho IV 400 375 95 459 471 12 4.3 4.1 4.5 4.2 4.0 4.4 -0.1 -0.1 -0.1 Daiwa
RE-035 Castalia Takanawadai II 1,190 1,161 188 1,320 1,350 30 4.2 4.0 4.4 4.1 3.9 4.3 -0.1 -0.1 -0.1 JREI
RE-036 Castalia Minami Azabu 642 611 85 680 697 17 4.2 4.0 4.4 4.1 3.9 4.3 -0.1 -0.1 -0.1 JREI
RE-037 Castalia Ginza III 2,880 2,735 234 2,900 2,970 70 4.3 4.4 4.5 4.2 4.3 4.4 -0.1 -0.1 -0.1 Tanizawa
RE-038 Castalia Kayabacho 2,707 2,525 574 3,030 3,100 70 4.5 4.5 4.7 4.4 4.4 4.6 -0.1 -0.1 -0.1 Tanizawa
RE-039 Castalia Takanawa 7,430 7,143 656 7,610 7,800 190 4.4 4.7 4.6 4.3 4.6 4.5 -0.1 -0.1 -0.1 Tanizawa
RE-040 Castalia Higashi Nihonbashi 3,520 3,266 733 4,000 4,000 0 4.5 4.3 4.7 4.5 4.3 4.7 0.0 0.0 0.0 Chuo
RE-041 Castalia Shinjuku 2,950 2,851 518 3,370 3,370 0 4.3 4.5 4.5 4.3 4.5 4.5 0.0 0.0 0.0 Tanizawa
RE-042 Castalia Ichigaya 940 880 449 1,330 1,330 0 4.4 4.2 4.6 4.4 4.2 4.6 0.0 0.0 0.0 Chuo
RE-043 Shibaura Island Bloom Tower 7,580 6,910 1,869 8,760 8,780 20 - 4.0 6.1 - 4.0 6.1 - 0.0 0.0 JREI
RE-044 Castalia Hatsudai 2,030 1,988 361 2,300 2,350 50 4.3 4.1 4.5 4.2 4.0 4.4 -0.1 -0.1 -0.1 Daiwa
RE-045 Castalia Hatsudai II 1,900 1,882 157 2,070 2,040 -30 4.2 4.0 4.4 4.2 4.0 4.4 0.0 0.0 0.0 Morii
RE-046 Castalia Ebisu 1,420 1,418 131 1,600 1,550 -50 4.1 3.9 4.3 4.1 3.9 4.3 0.0 0.0 0.0 Morii
RE-047 Castalia Meguro Kamurozaka 4,500 4,059 290 4,230 4,350 120 4.2 4.0 4.4 4.1 3.9 4.3 -0.1 -0.1 -0.1 Daiwa
RE-048 Castalia Toritsudaigaku 648 596 -37 558 559 1 5.1 4.9 5.4 5.1 4.9 5.4 0.0 0.0 0.0 Chuo

Appraisal Value Changes Comparison (4)
44
(mil yen) (%)
Property
numberProperty name
Acquisition
price
Book value
Aug. 2017
Unrealized
gain (loss)
Appraisal value (Note 1) Feb. 2017 Aug. 2017 Change
Appraiser
(Note 2)Feb. 2017 Aug. 2017 ChangeDirect cap DCF Direct cap DCF Direct cap DCF
CR DR TCR CR DR TCR CR DR TCR
RE-049 Castalia Yukigaya 1,110 1,006 103 1,090 1,110 20 4.5 4.6 4.7 4.4 4.5 4.6 -0.1 -0.1 -0.1 Tanizawa
RE-050 Castalia Yutenji 1,450 1,332 -52 1,260 1,280 20 4.2 4.0 4.4 4.2 4.0 4.4 0.0 0.0 0.0 Chuo
RE-051 Castalia Otsuka 1,480 1,336 283 1,620 1,620 0 4.3 4.1 4.5 4.3 4.1 4.5 0.0 0.0 0.0 Chuo
RE-052 Castalia Kikukawa 817 731 46 755 778 23 4.6 4.7 4.8 4.5 4.6 4.7 -0.1 -0.1 -0.1 Tanizawa
RE-053 Castalia Meguro 844 845 146 972 992 20 4.5 4.2 4.7 4.4 4.1 4.6 -0.1 -0.1 -0.1 JREI
RE-054 Castalia Otsuka II 1,040 990 259 1,230 1,250 20 4.4 4.2 4.6 4.3 4.1 4.5 -0.1 -0.1 -0.1 JREI
RE-055 Castalia Jiyugaoka 1,200 1,166 223 1,370 1,390 20 4.2 4.0 4.4 4.1 3.9 4.3 -0.1 -0.1 -0.1 JREI
RE-056 Castalia Mejiro 988 937 132 1,070 1,070 0 4.6 4.4 4.8 4.6 4.4 4.8 0.0 0.0 0.0 Chuo
RE-057 Castalia Ikebukuro 2,570 2,461 348 2,750 2,810 60 4.3 4.1 4.5 4.2 4.0 4.4 -0.1 -0.1 -0.1 Daiwa
RE-058 Castalia Kaname-cho 1,140 1,065 164 1,220 1,230 10 4.5 4.7 4.7 4.4 4.6 4.6 -0.1 -0.1 -0.1 Tanizawa
RE-059 Castalia Tower Shinagawa Seaside 7,380 6,836 1,903 8,540 8,740 200 4.5 4.5 4.7 4.4 4.4 4.6 -0.1 -0.1 -0.1 Tanizawa
RE-060 Castalia Yakumo 857 833 -60 761 773 12 4.4 4.6 4.6 4.3 4.5 4.5 -0.1 -0.1 -0.1 Tanizawa
RE-061 Castalia Togoshiekimae 1,560 1,472 457 1,890 1,930 40 4.5 4.3 4.7 4.4 4.2 4.6 -0.1 -0.1 -0.1 JREI
RE-062 Castalia Honjo Azumabashi 996 990 129 1,090 1,120 30 4.7 4.8 4.9 4.6 4.7 4.8 -0.1 -0.1 -0.1 Tanizawa
RE-063 Castalia Kitazawa 742 762 49 797 812 15 4.4 4.2 4.6 4.3 4.1 4.5 -0.1 -0.1 -0.1 JREI
RE-064 Castalia Monzennakacho 503 459 87 525 547 22 4.8 4.9 5.0 4.6 4.7 4.8 -0.2 -0.2 -0.2 Tanizawa
RE-065 Castalia Kamiikedai 198 182 32 212 215 3 5.1 4.7 5.3 5.0 4.6 5.2 -0.1 -0.1 -0.1 JREI
RE-066 Castalia Morishita 832 805 214 998 1,020 22 4.4 4.2 4.6 4.3 4.1 4.5 -0.1 -0.1 -0.1 JREI
RE-067 Castalia Wakabayashikoen 776 748 98 830 847 17 4.3 4.1 4.5 4.2 4.0 4.4 -0.1 -0.1 -0.1 Daiwa
RE-068 Castalia Asakusabashi 792 739 204 932 944 12 4.5 4.3 4.7 4.5 4.3 4.7 0.0 0.0 0.0 Chuo
RE-069 Castalia Iriya 546 505 150 653 656 3 4.9 4.7 5.1 4.9 4.7 5.1 0.0 0.0 0.0 Chuo
RE-070 Castalia Kita Ueno 2,641 2,418 301 2,670 2,720 50 4.6 4.7 4.8 4.5 4.6 4.7 -0.1 -0.1 -0.1 Tanizawa
RE-071 Castalia Morishita II 686 623 164 774 788 14 4.6 4.7 4.8 4.5 4.6 4.7 -0.1 -0.1 -0.1 Tanizawa
RE-072 Castalia Minowa 1,430 1,306 243 1,510 1,550 40 4.6 4.7 4.8 4.5 4.6 4.7 -0.1 -0.1 -0.1 Tanizawa
RE-073 Castalia Oyamadai 533 502 99 583 602 19 4.5 4.6 4.7 4.4 4.5 4.6 -0.1 -0.1 -0.1 Tanizawa
RE-074 Castalia Nakano 1,060 978 251 1,200 1,230 30 4.4 4.2 4.6 4.3 4.1 4.5 -0.1 -0.1 -0.1 JREI
RE-075 Castalia Yoga 923 874 265 1,110 1,140 30 4.4 4.6 4.6 4.3 4.5 4.5 -0.1 -0.1 -0.1 Tanizawa
RE-076 Castalia Sumiyoshi 948 857 152 1,010 1,010 0 4.5 4.6 4.7 4.5 4.6 4.7 0.0 0.0 0.0 Tanizawa
RE-077 Castalia Monzennakacho II 2,160 2,002 667 2,610 2,670 60 4.4 4.2 4.6 4.3 4.1 4.5 -0.1 -0.1 -0.1 JREI
RE-078 Castalia Oshiage 1,100 996 123 1,100 1,120 20 4.7 5.0/4.8 4.9 4.6 4.9/4.7 4.8 -0.1 -0.1 -0.1 Tanizawa
RE-079 Castalia Kuramae 1,260 1,151 308 1,460 1,460 0 4.5 4.7/4.6 4.7 4.5 4.7/4.6 4.7 0.0 0.0 0.0 Tanizawa
RE-080 Castalia Nakanobu 1,790 1,673 906 2,580 2,580 0 4.3 4.1 4.5 4.3 4.1 4.5 0.0 0.0 0.0 Chuo

Appraisal Value Changes Comparison (5)
45
(mil yen) (%)
Property
numberProperty name
Acquisition
price
Book value
Aug. 2017
Unrealized
gain (loss)
Appraisal value (Note 1) Feb. 2017 Aug. 2017 Change
Appraiser
(Note 2)Feb. 2017 Aug. 2017 ChangeDirect cap DCF Direct cap DCF Direct cap DCF
CR DR TCR CR DR TCR CR DR TCR
RE-081 Royal Parks Toyosu 7,360 6,402 3,317 9,710 9,720 10 4.7 4.4 5.0 4.7 4.4 5.0 0.0 0.0 0.0 Chuo
RE-082 Castalia Togoshi 1,770 1,617 892 2,510 2,510 0 4.4 4.2 4.6 4.4 4.2 4.6 0.0 0.0 0.0 Chuo
RE-083 Castalia Ooimachi 1,181 1,170 309 1,450 1,480 30 4.2 4.1 4.4 4.1 4.0 4.3 -0.1 -0.1 -0.1 Morii
RE-084 Castalia Omori 1,500 1,450 329 1,780 1,780 0 4.4 4.2 4.6 4.4 4.2 4.6 0.0 0.0 0.0 Chuo
RE-085 Castalia Mishuku 1,900 1,864 425 2,290 2,290 0 4.4 4.2 4.6 4.4 4.2 4.6 0.0 0.0 0.0 Chuo
RE-086 Castalia Arakawa 1,660 1,574 565 2,140 2,140 0 4.6 4.4 4.8 4.6 4.4 4.8 0.0 0.0 0.0 Chuo
RE-087 Castalia Omori II 2,370 2,292 537 2,760 2,830 70 4.3 4.1 4.5 4.2 4.0 4.4 -0.1 -0.1 -0.1 Morii
RE-088 Castalia Nakameguro 3,800 3,787 482 4,270 4,270 0 4.1 3.9 4.3 4.1 3.9 4.3 0.0 0.0 0.0 Morii
RE-089 Castalia Meguro Chojyamaru 2,030 2,018 231 2,300 2,250 -50 4.1 3.9 4.3 4.1 3.9 4.3 0.0 0.0 0.0 Morii
RE-090 Castalia Meguro Takaban 1,750 1,760 59 1,880 1,820 -60 4.4 4.2 4.6 4.3 4.1 4.5 -0.1 -0.1 -0.1 Morii
RE-091 Castalia Omori III 1,520 1,494 155 1,690 1,650 -40 4.3 4.1 4.5 4.3 4.1 4.5 0.0 0.0 0.0 Morii
RE-092 Morino Tonari 1,020 1,056 113 1,170 1,170 0 4.3 4.1 4.5 4.2 4.0 4.4 -0.1 -0.1 -0.1 JREI
RE-093 Castalia Meguro Tairamachi 1,165 1,215 54 1,240 1,270 30 4.1 3.9 4.3 4.0 3.8 4.2 -0.1 -0.1 -0.1 Morii
RE-094 Royal Parks SEASIR 4,350 4,313 626 4,880 4,940 60 5.6 5.4/5.8 - 5.5 5.3/5.7 - -0.1 -0.1 - Morii
RE-095 Castalia Honkomagome 1,520 1,540 169 1,670 1,710 40 4.5 4.3 4.7 4.4 4.2 4.6 -0.1 -0.1 -0.1 Morii
RE-096 Cosmo Heim Musashikosugi 1,674 1,618 351 1,970 1,970 0 4.9 4.7 5.1 4.9 4.7 5.1 0.0 0.0 0.0 Chuo
RE-097 Castalia Tsurumi 666 601 129 730 731 1 5.2 5.0 5.4 5.2 5.0 5.4 0.0 0.0 0.0 Chuo
RE-098 Castalia Funabashi 704 710 72 775 783 8 5.1 5.1/4.9 5.3 5.0 5.0/4.8 5.2 -0.1 -0.1 -0.1 Tanizawa
RE-099 Castalia Nishi Funabashi 783 753 154 888 908 20 5.4 5.2 5.6 5.3 5.1 5.5 -0.1 -0.1 -0.1 JREI
RE-105 Castalia Nogeyama 325 300 27 318 328 10 5.3 5.1 5.5 5.2 5.0 5.4 -0.1 -0.1 -0.1 JREI
RE-106 Castalia Ichikawa 461 412 117 521 530 9 5.3 5.1 5.5 5.2 5.0 5.4 -0.1 -0.1 -0.1 JREI
RE-107 Royal Parks Hanakoganei 5,300 4,900 1,289 6,070 6,190 120 5.2 5.0/5.4 - 5.1 4.9/5.3 - -0.1 -0.1 - Daiwa
RE-108 Castalia Musashikosugi 1,680 1,662 177 1,900 1,840 -60 4.6 4.4 4.8 4.6 4.4 4.8 0.0 0.0 0.0 Morii
RE-109 Royal Parks Wakabadai 4,360 4,111 848 4,910 4,960 50 5.3 5.1/5.5 - 5.2 5.0/5.4 - -0.1 -0.1 - Daiwa
RE-110Pacific Royal Court Minatomirai
Urban Tower 9,100 8,971 1,928 10,700 10,900 200 5.1 4.9/5.3 - 5.0 4.8/5.2 - -0.1 -0.1 - Morii
RE-111 L-Place Shinkoyasu 1,720 1,752 257 1,970 2,010 40 5.1 4.9 5.3 5.0 4.8 5.2 -0.1 -0.1 -0.1 JREI
RE-112 Royal Parks Musashikosugi 1,060 1,046 233 1,270 1,280 10 5.1 4.9/5.3 - 5.0 4.8/5.2 - -0.1 -0.1 - Morii
RE-115 Crest Kusatsu 3,004 2,882 -922 1,960 1,960 0 7.0 7.1 7.2 6.8 6.9 7.0 -0.2 -0.2 -0.2 Tanizawa
RE-116 Castalia Sakaisuji Honmachi 1,490 1,339 360 1,670 1,700 30 4.9 5.0 5.1 4.8 4.9 5.0 -0.1 -0.1 -0.1 Tanizawa
RE-117 Castalia Shin-Umeda 1,376 1,229 290 1,490 1,520 30 5.0 5.1 5.2 4.9 5.0 5.1 -0.1 -0.1 -0.1 Tanizawa
RE-118 Castalia Abeno 4,368 4,060 879 4,810 4,940 130 4.9 5.0 5.1 4.8 4.9 5.0 -0.1 -0.1 -0.1 Tanizawa
RE-119 Castalia Sakae 1,010 926 283 1,210 1,210 0 4.9 4.7 5.1 4.9 4.7 5.1 0.0 0.0 0.0 Chuo

Appraisal Value Changes Comparison (6)
46
(mil yen) (%)
Property
numberProperty name
Acquisition
price
Book value
Aug. 2017
Unrealized
gain (loss)
Appraisal value (Note 1) Feb. 2017 Aug. 2017 Change
Appraiser
(Note 2)Feb. 2017 Aug. 2017 ChangeDirect cap DCF Direct cap DCF Direct cap DCF
CR DR TCR CR DR TCR CR DR TCR
RE-121 Castalia Maruyama Urasando 411 370 138 499 509 10 5.2 5.2 5.4 5.1 5.1 5.3 -0.1 -0.1 -0.1 Tanizawa
RE-122 Castalia Maruyama Omotesando 1,740 1,571 448 2,020 2,020 0 5.1 5.1 5.3 5.1 5.1 5.3 0.0 0.0 0.0 Tanizawa
RE-123 Castalia Higashi Hie 960 858 141 1,000 1,000 0 5.1 5.3 5.3 5.1 5.3 5.3 0.0 0.0 0.0 Tanizawa
RE-124 Castalia Tower Nagahoribashi 3,400 3,016 1,443 4,450 4,460 10 4.8 4.6 5.0 4.8 4.6 5.0 0.0 0.0 0.0 Chuo
RE-125 Castalia Sannomiya 1,230 1,093 426 1,490 1,520 30 5.1 4.9 5.3 5.0 4.8 5.2 -0.1 -0.1 -0.1 Daiwa
RE-126 Castalia Kotodaikoen 481 424 131 546 556 10 5.4 5.4 5.6 5.3 5.3 5.5 -0.1 -0.1 -0.1 Daiwa
RE-127 Castalia Ichibancho 783 707 240 932 948 16 5.4 5.4 5.6 5.3 5.3 5.5 -0.1 -0.1 -0.1 Daiwa
RE-128 Castalia Omachi 656 619 143 739 763 24 5.4 5.4 5.6 5.3 5.3 5.5 -0.1 -0.1 -0.1 Daiwa
RE-129 Castalia Uemachidai 2,190 1,986 693 2,630 2,680 50 4.8 4.6 5.0 4.7 4.5 4.9 -0.1 -0.1 -0.1 Daiwa
RE-130 Castalia Tower Higobashi 2,670 2,424 1,115 3,530 3,540 10 4.8 4.6 5.0 4.8 4.6 5.0 0.0 0.0 0.0 Chuo
RE-131 Big Tower Minami Sanjo 1,740 1,385 1,244 2,570 2,630 60 5.3 5.1 5.5 5.2 5.0 5.4 -0.1 -0.1 -0.1 Daiwa
RE-132 Castalia Fushimi 2,260 2,031 1,008 3,010 3,040 30 4.9 4.7 5.1 4.8 4.6 5.0 -0.1 -0.1 -0.1 JREI
RE-133 Castalia Meieki Minami 720 677 238 897 916 19 4.7 4.5 4.9 4.6 4.4 4.8 -0.1 -0.1 -0.1 Morii
RE-134 Castalia Yakuin 930 899 240 1,120 1,140 20 4.8 4.6 5.0 4.7 4.5 4.9 -0.1 -0.1 -0.1 Morii
RE-135 Castalia Mibu 1,193 1,134 315 1,440 1,450 10 5.0 4.8 5.2 4.9 4.7 5.1 -0.1 -0.1 -0.1 JREI
RE-136 Castalia Tsutsujigaoka 1,208 1,173 526 1,660 1,700 40 5.1 4.9 5.3 5.0 4.8 5.2 -0.1 -0.1 -0.1 Morii
RE-137 Castalia Ohori Bay Tower 2,910 2,716 1,093 3,750 3,810 60 5.3 5.1 5.5 5.2 5.0 5.4 -0.1 -0.1 -0.1 Morii
RE-138 Royal Parks Namba 2,830 2,628 341 2,930 2,970 40 5.6 5.5/5.9 - 5.5 5.4/5.8 - -0.1 -0.1 - Daiwa
RE-139 Castalia Shigahondori 1,730 1,647 432 2,070 2,080 10 5.1 4.9 5.3 5.0 4.8 5.2 -0.1 -0.1 -0.1 JREI
RE-140 Castalia Kyoto Nishioji 973 1,030 29 1,040 1,060 20 4.8 4.6 5.0 4.7 4.5 4.9 -0.1 -0.1 -0.1 Morii
RE-141 Castalia Ningyocho III 2,000 2,031 268 2,250 2,300 50 4.3 4.1 4.5 4.2 4.0 4.4 -0.1 -0.1 -0.1 JREI
RE-142 Royal Parks Umejima 2,020 2,058 121 2,160 2,180 20 5.6 5.4/5.8 - 5.5 5.3/5.7 - -0.1 -0.1 - Morii
RE-143 Castalia Shinsakae II 1,800 1,880 59 1,850 1,940 90 5.1 4.9 5.3 5.0 4.8 5.2 -0.1 -0.1 -0.1 Daiwa
Residential Properties Total 250,448 236,982 44,845 278,062 281,828 3,766 - - - - - - - - - -
RM-001 ACROSSMALL Shinkamagaya 7,770 7,662 287 7,810 7,950 140 5.9 5.6 6.1 5.8 5.5 6.0 -0.1 -0.1 -0.1 JREI
RM-002 FOLEO Hirakata 4,580 4,518 61 4,580 4,580 0 6.2 5.7 6.3 6.2 5.7 6.3 0.0 0.0 0.0 JREI
RM-003 QiZ GATE URAWA 4,270 4,292 57 4,270 4,350 80 5.5 5.1 5.6 5.4 5.0 5.5 -0.1 -0.1 -0.1 JREI
RM-004 UNICUS Takasaki 3,000 2,977 42 3,020 3,020 0 6.4 6.1 6.6 6.4 6.1 6.6 0.0 0.0 0.0 JREI
RM-005 ACROSSPLAZA Miyoshi (Land) 3,740 3,740 100 3,800 3,840 40 - 4.5 - - 4.4 - - -0.1 - Tanizawa
RM-006 DREAM TOWN ALi 8,100 8,026 243 8,100 8,270 170 5.9 5.7 6.2 5.8 5.6 6.1 -0.1 -0.1 -0.1 JREI
RM-007 ASOBOX (Land) 1,600 1,617 212 1,830 1,830 0 - 5.0 - - 5.0 - - 0.0 - JREI
RM-008 FOLEO Ome Imai 3,800 3,823 26 3,850 3,850 0 5.2 4.7 5.5 5.2 4.7 5.5 0.0 0.0 0.0 JREI

Appraisal Value Changes Comparison (7)
47
(Note 1) For the 17 properties acquired in the period ended Aug. 2017 (LB-035, LB-036, LB-037, LB-038, LB-039, LB-040, LB-041, LB-042, LB-043, LB-044, LB-045, LB-046, LM-001, RE-143, RM-007, RM-008 and OT-004), “Appraisal
value” as of the period ended Feb. 2017 is based on the appraisal value at the time of acquisition.
(Note 2) “Tanizawa”: The Tanizawa Sogo Appraisal Co., Ltd., “Chuo”: Chuo Real Estate Appraisal Co., Ltd., “JREI”: Japan Real Estate Institute, “Daiwa”: Daiwa Real Estate Appraisal Co., Ltd., “Morii”: Morii Appraisal & Investment
Consulting Inc.
(mil yen) (%)
Property
numberProperty name
Acquisition
price
Book value
Aug. 2017
Unrealized
gain (loss)
Appraisal value (Note 1) Feb. 2017 Aug. 2017 Change
Appraiser
(Note 2)Feb. 2017 Aug. 2017 ChangeDirect cap DCF Direct cap DCF Direct cap DCF
CR DR TCR CR DR TCR CR DR TCR
RR-001 LIFE Sagamihara Wakamatsu 1,670 1,664 55 1,690 1,720 30 5.1 4.7 5.2 5.0 4.6 5.1 -0.1 -0.1 -0.1 JREI
RR-002 FOLEO Sendai Miyanomori 6,960 6,917 242 7,040 7,160 120 5.9 5.6 6.1 5.8 5.5 6.0 -0.1 -0.1 -0.1 JREI
RR-003 ACROSSPLAZA Inazawa (Land) 2,390 2,390 50 2,410 2,440 30 - 5.4 - - 5.3 - - -0.1 - JREI
RR-004Sports Depo and GOLF5
Kokurahigashi IC Store2,230 2,218 121 2,300 2,340 40 6.3 6.3/6.4 6.5 6.2 6.3 6.4 -0.1 -0.1 -0.1 Tanizawa
RR-005 Hiratsuka Retail Property (Land) 5,620 5,857 772 6,630 6,630 0 - 4.0 - - 4.0 - - 0.0 - Tanizawa
Retail Properties Total 55,730 55,705 2,274 57,330 57,980 650 - - - - - - - - - -
OT-001 Urban Living Inage 930 884 415 1,280 1,300 20 5.3 5.1 5.5 5.2 5.0 5.4 -0.1 -0.1 -0.1 Daiwa
OT-002 Aburatsubo Marina HILLS 1,100 1,096 193 1,260 1,290 30 6.1 5.9 6.3 6.0 5.8 6.2 -0.1 -0.1 -0.1 JREI
OT-003Naha Shin-Toshin Center Building(Daiwa Roynet Hotel Naha-Omoromachi)
7,600 7,532 307 7,710 7,840 130 5.7 5.5 5.9 5.6 5.4 5.8 -0.1 -0.1 -0.1 Daiwa
OT-004 Sharp Hiroshima Building 1,850 1,861 48 1,890 1,910 20 5.5 5.3 5.7 5.4 5.2 5.6 -0.1 -0.1 -0.1 JREI
Other Assets Total 11,480 11,376 963 12,140 12,340 200 - - - - - - - - - -
Portfolio Total 577,777 563,013 59,410 612,380 622,424 10,044 - - - - - - - - - -

80
85
90
95
100
105
17/3/1 17/3/16 17/3/31 17/4/15 17/4/30 17/5/15 17/5/30 17/6/14 17/6/29 17/7/14 17/7/29 17/8/13 17/8/28 17/9/12 17/9/27 17/10/12
Daiwa House REIT TSE REIT Index
0
10,000
20,000
30,000
40,000
50,000
60,000
70,000
80,000
0
50,000
100,000
150,000
200,000
250,000
300,000
350,000
06/3 06/9 07/3 07/9 08/3 08/9 09/3 09/9 10/3 10/9 11/3 11/9 12/3 12/9 13/3 13/9 14/3 14/9 15/3 15/9 16/3 16/9 17/3 17/9
Trading volume (RHS) Investment unit (closing) price (LHS)
48
Unit Price Performance
(Note) Indexed with the March 1, 2017 (start of the period ended Aug. 2017) closing prices of DHR’s unit and TSE REIT Index.
Unit Price and Trading Volume
Relative Unit Price Performance
(yen) (units)
(Note) Adjusted to take into account two-for-one unit splits effective as of March 1, 2013 and March 1, 2015.

Unitholders
49
Unitholder type
Period ended Feb. 2017 Period ended Aug. 2017
Number of
unitholdersNumber of units
Number of
unitholdersNumber of units
Unitholders (%) Units (%) Unitholders (%) Units (%)
Individuals and others 10,077 92.9 77,264 5.1 12,901 93.6 87,612 5.2
Financial institutions 141 1.3 917,313 60.4 172 1.2 968,209 57.3
Banks / trust banks 63 0.6 823,499 54.2 63 0.5 861,496 51.0
City banks - - - - - - - -
Regional banks 48 0.4 130,805 8.6 48 0.3 138,250 8.2
Trust banks 15 0.1 692,694 45.6 15 0.1 723,246 42.8
Life insurance
companies7 0.1 31,950 2.1 9 0.1 36,465 2.2
Non-life insurance
companies3 0.0 23,395 1.5 2 0.0 23,180 1.4
Other financial
institutions68 0.6 38,469 2.5 98 0.7 47,068 2.8
Shinkin banks 45 0.4 22,374 1.5 55 0.4 24,398 1.4
Others 23 0.2 16,095 1.1 43 0.3 22,670 1.3
Other domestic
corporations232 2.1 199,103 13.1 278 2.0 216,993 12.8
Foreign corporations
and individuals382 3.5 293,557 19.3 410 3.0 386,135 22.8
Securities firms 19 0.2 32,043 2.1 18 0.1 31,051 1.8
Total 10,851 100.0 1,519,280 100.0 13,779 100.0 1,690,000 100.0
Number of Unitholders and Units by Unitholder Type Major Unitholders
Name
Period ended Aug. 2017
Number of
units owned
Ownership
(%)
Japan Trustee Services Bank, Ltd.
(Trust Account)329,674 19.5
Daiwa House Industry Co., Ltd. 185,200 11.0
The Master Trust Bank of Japan, Ltd.
(Trust Account)175,277 10.4
Trust & Custody Services Bank, Ltd.
(Securities Investment Trust Account)108,475 6.4
The Nomura Trust and Banking Co., Ltd.
(Investment Trust Account)57,760 3.4
State Street Bank West Client - Treaty
50523430,343 1.8
State Street Bank - West Pension Fund
Clients - Exempt 50523329,809 1.8
State Street Bank and Trust Company
50501225,162 1.5
Nomura Bank (Luxembourg) S.A. 23,112 1.4
The Fuji Fire and Marine Insurance Co., Ltd. 21,236 1.3
Total 986,048 58.3

REIT Structure
50
Daiwa House Industry Co., Ltd.
Sumitomo Mitsui Trust Bank, Limited
Asset Custodian,
General Administrator,
Transfer Agent and
Special Account Administrator
Pipeline Supporting Company
Sumitomo Mitsui Trust Bank, Limited
The Bank of Tokyo-Mitsubishi UFJ, Ltd.
Administrator of
Investment Corporation Bonds
(4)
(4)
Investment Corporation
Unitholders' Meeting
Board of Directors
Ernst & Young ShinNihon LLC
Independent Auditor
Daiwa House REIT
Investment Corporation
Daiwa House Asset
Management Co., Ltd.
Asset Manager
(1)
(2)
(3)
Parent Company of Asset Manager
Sponsor
Cosmos Initia Co., Ltd.
Daiwa Lease Co., Ltd.
Daiwa Information Service Co., Ltd.
Daiwa Royal Co., Ltd.
Fujita Corporation
Daiwa Logistics Co., Ltd.
(1) Asset management agreement
(2) Asset custody agreement / General administration
agreement / Transfer agency agreement /
Special account administration agreement
(3) Fiscal agent agreement
(4) Basic agreement on pipeline support, etc.
Executive Director :
Jiro Kawanishi
Supervisory Director :
Tetsuya Iwasaki
Supervisory Director :
Hiroshi Ishikawa
Disclaimer
This document is provided for information purposes only and is not intended as a solicitation to invest or a
recommendation to trade in a specific security. Please contact a financial product brokerage company if you are
interested in purchasing the investment units of Daiwa House REIT Investment Corporation (“DHR”) .
This document is not a disclosure document or investment report required under and made in accordance with the
Financial Instruments and Exchange Act, the Act on Investment Trusts and Investment Corporations and related
cabinet orders and cabinet office ordinances, or under the Tokyo Stock Exchange’s securities listing rules or any other
related rules.
The contents of this document include forward-looking statements based on certain assumptions and judgments using
information currently available to DHR. These forward-looking statements are not a guarantee of DHR’s future results,
business performance and financial position.
DHR endeavors to ensure the contents of this document are as accurate as possible. However, DHR cannot
guarantee the accuracy, reliability, adequacy or the accessibility of the information herein. DHR reserves the right to
change or delete information without prior notice.
Duplication or reproduction of any item presented as information herein without the prior consent of DHR is strictly
prohibited.