Embed Size (px)
Citation preview

90
Special Issue:
Fundamental Analyses of Accounting Information – Comparative Studies between the Chinese and US Capital Markets
2014 年 6 月 第 16 卷 第 2 期
中 国 会 计 与 财 务 研 究
C h i n a A c c o u n t i n g a n d F i n a n c e R e v i e w
Volume 16, Number 2 – June 2014
The Association between Earnings and Returns: A Comparative Study between the Chinese and US Stock Markets* Vincent Y. S. Chen and Yew Kee Ho1 Received 2nd of December 2013 Accepted 25th of March 2014 © The Author(s) 2014. This article is published with open access by The Hong Kong Polytechnic University
Abstract This study examines the earnings-return relation in the Chinese and US stock markets. We first examine whether the value relevance of earnings in the US stock market for the period 1968 to 1986 in Easton and Harris (1991) holds for the period 1998 to 2011. We find that the value relevance of earnings levels decreased significantly in the 1998-2011 period. We then examine the earnings-return relation between the Chinese and US stock markets in the 1998-2011 period. We find that the explanatory power of earnings levels differs between these two markets. Specifically, in the US market, the earnings level variable has a lower relative explanatory power than the earnings change variable and the earnings level variable has very limited incremental explanatory power in the presence of the earnings change variable. However, in the Chinese market, earnings levels and earnings changes have similar relative and incremental explanatory power. The disparity in the relevance of earnings levels between the two markets may be attributable to differences in institutional factors and firm characteristics. I. Introduction
Understanding the role of earnings in valuation is a fundamental issue in accounting and finance research (Ball and Brown, 1968). Earlier studies in the value relevance literature establish the theoretical link between earnings changes and stock returns (e.g. Beaver et al., 1980; Beaver et al., 1987) and between unexpected earnings and unexpected stock returns (e.g. Kormendi and Lipe, 1987; Collins and Kothari, 1989; Easton and Zmijewski, 1989). Easton and Harris (1991) (EH hereinafter) add to this line of research by showing that the earnings level variable is an explanatory variable in the
* We are grateful to Agnes Cheng, James Ohlson, Haifeng You (the discussant), and participants at the
CAFR Special Issue Conference for their very constructive and helpful comments. We also wish to thank Shuo Li for his excellent research assistance. Financial support from the National University of Singapore is gratefully acknowledged. The views expressed in this paper do not necessarily reflect the opinions or positions of the Singapore Accountancy Commission.
1 Vincent Chen, Department of Accounting, NUS Business School, National University of Singapore & Singapore Accountancy Commission; email: [email protected]. Yew Kee Ho, Department of Accounting, NUS Business School, National University of Singapore; email: [email protected].
DOI 10.7603/s40570-014-0008-0

The Association between Earnings and Returns 91
earnings-return relation. In this study, we extend EH to examine the earnings-return relation in the Chinese and US markets.
Our first set of analyses replicate EH. Consistent with EH, we find that for the period 1968-1986, the earnings level variable is significant in explaining stock returns and the relative explanatory power of earnings levels is greater than that of earnings changes for stock returns for the US market. In addition, the incremental explanatory power of earnings levels is higher than that of earnings changes for stock returns. We further document that both earnings levels and earnings changes are associated with unexpected stock returns. The findings replicate those of EH.
In our second set of analyses, we conduct a comparative study of the earnings-return relation for the US market between two time periods: 1968-1986 and 1998-2011. We find that although the level of earnings by itself is an explanatory variable for stock returns, the relative explanatory power of earnings levels is much lower than that of earnings changes, which is in contrast to the previous findings for the period 1968-1986. The decline in the value relevance of earnings may be attributable to the increasing frequency of loss and one-time items in earnings and the increasing number of firms in intangible-intensive industries (Collins et al., 1997; Francis and Schipper, 1999).
In the third set of analyses, we compare the earnings-return relation between the US and Chinese markets for the period 1998-2011. For Chinese firms, we find that the earnings level variable is significant in explaining stock returns and its relative explanatory power for stock returns is similar to that of earnings changes. Regarding the incremental explanatory power of earnings variables, for the US sample, we find that when we include both earnings levels and earnings changes in the stock return regression, the incremental explanatory power of earnings levels disappears. The results suggest that the explanatory power of earnings levels is subsumed by that of earnings changes. For the Chinese sample, we find that both earnings levels and earnings changes have incremental explanatory power contemporaneously.
We further test whether the level of earnings explains unexpected stock returns. For our samples of US and Chinese firms, we find that only change in earnings, not the level of earnings, is associated with unexpected returns.
Overall, our results show that the relevance of earnings levels in the earnings-return relation differs between the US and Chinese markets and that even for the US market, the relevance of the earnings level variable dropped significantly from 1968-1986 to 1998-2011. The difference in the relevance of earnings levels between the two markets can possibly be attributed to institutional factors, such as the state of development of the capital market, regulatory oversight, accounting standards, and investor sophistication (e.g. Bartov et al., 2005), and firm characteristics.
This study contributes to the value relevance literature in several ways. First, as the US and Chinese stock markets differ in several dimensions, such as regulatory environment, ownership structure, development of capital markets, and corporate economic behaviours (e.g. Djankov et al., 2007; Bae et al., 2008; Jiang et al., 2010), it is not appropriate to completely apply economic theories or findings from the US stock market to the Chinese stock market. Therefore, it is important for us to re-examine fundamental issues in the valuation literature in the context of the Chinese stock market. Our comparative study fills the gap by furthering our understanding of the earnings-return relation in the Chinese stock market and helps investors to make more informed decisions when investing in China.
Second, our findings on the change in the relevance of earnings levels over time in the US further our understanding of the role of earnings in equity valuation. Our study provides evidence that the US stock market may have been undergoing an evolutionary

92 Chen and Ho
path such that over time the earnings-return relation has changed and that it may be possible that the Chinese stock markets may face the same evolutionary pressures. This knowledge will be useful for practitioners and academics who continue to study the stock markets.
The remainder of the paper is organised as follows: Section II describes the sample and research design; Section III replicates Easton and Harris (1991); Section IV reports the empirical findings of the comparative analysis between the Chinese and US earnings-returns relation; and Section V concludes the study. II. Sample and Research Design
2.1 Data and Sample
The first part of our study is a replication of EH, and thus we thus follow their sampling procedure and research methodology strictly. To be consistent with EH, our first sample period covers 1968 to 1986. We require non-missing values for all the earnings and returns variables. The annual earnings per share and the factor to adjust for stock splits and stock dividends are obtained from the 2012 COMPUSTAT Annual Industrial File, and the security price and the factor to adjust for stock splits and stock dividends are collected from the CRSP Daily Return File for the first trading day of the ninth month prior to the fiscal year end. The security return data are obtained from the CRSP Monthly Returns File. For the purpose of estimating the market model to get the abnormal returns, we require the return data to be available for 69 months prior to and 3 months after the fiscal year end. In addition, we delete firm-year observations where earnings-related variables are not in the range of +1.5 to -1.5 to ensure that our results are not unduly affected by extreme outliers. These sample selection procedures result in a sample of 28,781 firm-year observations.
For our sample of Chinese firms, we collect firm information from the 2011 CSMAR China Market Financial Statement Database and Monthly Trading Database. We follow the same sample selection procedures as for the US sample with one exception, namely, we use earnings before extraordinary items scaled by the beginning market value of equity instead of using earnings per share scaled by beginning price per share as the construct of earnings to avoid potential measurement errors. The rationale behind this move is that CSMAR does not provide factors to adjust for stock splits and stock dividends. In addition, as there are less than 100 annual observations for Chinese firms prior to 1998, we start our sample period in 1998. Our final sample size for Chinese firms consists of 16,656 firm-year observations. Following the same sample selection procedures as those used for the Chinese firms, we construct another US sample that includes 45,913 firm-year observations from 1998 to 2011 for our comparative analyses between the Chinese and US markets.
2.2 Research Design
We follow EH to construct our research design and specify our models accordingly. For the univariate analysis, we regress stock returns on earnings levels or earnings changes:
Rjt = αt0 + αt1 Ajt/Pt-1 + ϵjt (1)
Rjt = φt0 + φt1 ΔAjt/Pt-1 + ϵjt (2)
Rjt is cumulative return for fiscal year t, as measured over the 12-month period from 9 months prior to the fiscal year end to 3 months after the fiscal year end. Ajt/Pt-1 is earnings
The Association between Earnings and Returns 93
per share for year t divided by stock price at year t-1. ΔAjt/Pt-1 is the difference between earnings per share for year t and that for year t-1, divided by stock price at year t-1. The earnings and prices variables are adjusted for stock splits and stock dividends.
For the prior earnings regression, we construct the following model:
Rjt = θt0 + θt1 Ajt-1/Pt-1 + ϵjt (3)
Ajt-1/Pt-1 is earnings per share for year t-1 divided by stock price at year t-1. For the multivariate analysis, we specify our model as follows:
Rjt = γt0 + γt1 Ajt/Pt-1 + γt2 ΔAjt/Pt-1 + ϵjt (4)
For the tests of the association between unexpected returns and variables of earnings, we construct the following model:
CARjt = ψt0 + ψt1 Ajt/Pt-1 + ψt2 ΔAjt/Pt-1 + ϵjt (5)
CARjt is cumulative abnormal return calculated over the 12-month period from 9 months prior to the fiscal year end to 3 months after the fiscal year end. The abnormal returns are measured as the monthly residuals from the monthly market model Rjt = βoj + β1jRmt + Zjt, where Rmt is the CRSP equally weighted market index for month t and the model is estimated over the 60 months prior to the month of the accumulation of returns. III. A Replication of Easton and Harris (1991)
We replicate EH’s Tables 1 to 4 to ensure that our sampling procedures and research design are consistent with EH for comparison purposes.
3.1 Univariate Analyses
Table R1 reports the results of simple regressions of stock returns on Ajt/Pt-1 and ΔAjt/Pt-1, respectively, which repeat the tests in EH Table 1. We find that αt1 and φt1 are significant in the pooled analysis and the R2s are 7.9% (EH: 7.5%) and 4.1% (EH: 4.0%) for earnings level and earnings change regressions, respectively.2 In the annual regressions, αt1 and φt1 are all significant at the 1% level. We also apply a Fama and MacBeth (1973) type approach to obtain the mean of αt1 and φt1 across all years, and the coefficients on αt1 and φt1 are all statistically significant, which suggests that cross-sectional correlation is not a concern. Comparing the results of EH Table 1 with our Table R1, we find that both sets of results are quantitatively and qualitatively similar.
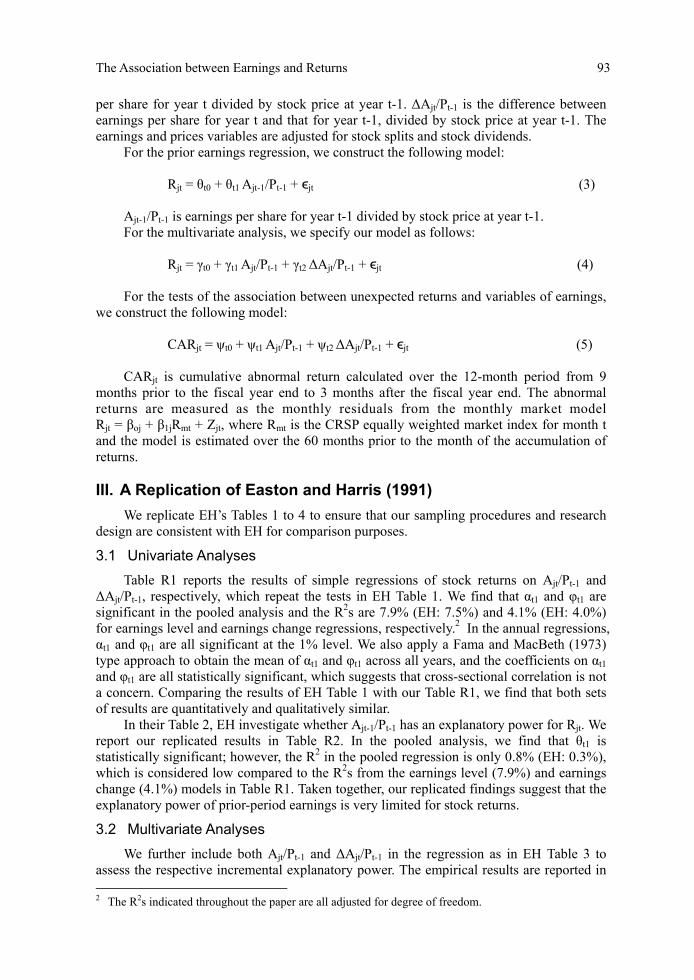
In their Table 2, EH investigate whether Ajt-1/Pt-1 has an explanatory power for Rjt. We report our replicated results in Table R2. In the pooled analysis, we find that θt1 is statistically significant; however, the R2 in the pooled regression is only 0.8% (EH: 0.3%), which is considered low compared to the R2s from the earnings level (7.9%) and earnings change (4.1%) models in Table R1. Taken together, our replicated findings suggest that the explanatory power of prior-period earnings is very limited for stock returns.
3.2 Multivariate Analyses
We further include both Ajt/Pt-1 and ΔAjt/Pt-1 in the regression as in EH Table 3 to assess the respective incremental explanatory power. The empirical results are reported in 2 The R2s indicated throughout the paper are all adjusted for degree of freedom.

94 Chen and Ho
Table R3. In the pooled regression, we find that both γt1 and γt2 are statistically significant and the R2 is 8.2%. Comparing the R2s from the earnings level and earnings change models in Table R1, we find that the R2s increased by 0.3% and 4.1% by including ΔAjt/Pt-1 and Ajt/Pt-1, respectively. The results indicate that level of earnings has greater explanatory power than change of earnings for stock returns. The yearly regressions provide similar results. For γt1, the coefficients are significant in 18 out of 19 years (the exception being 1982), while the coefficients on γt2 are significant in 14 out of 19 years. In 16 of the 19 years, the R2s from the multiple regressions are higher than the R2s from the univariate regressions of either variable.3 Altogether, consistent with EH, we find that both Ajt/Pt-1 and ΔAjt/Pt-1 explain Rjt.
3.3 Earnings Levels as a Measure of Unexpected Earnings
Lastly, we examine the relation between unexpected returns and unexpected earnings. Following EH, we regress cumulative abnormal return (CAR) on unexpected earnings. Two proxies are used to capture the unexpected portion of earnings, which includes earnings levels and earnings changes. For the level of earnings, the presumption is that the market’s expectation for earnings is zero; for the change of earnings, the expected earnings is earnings from last year.
Our replication of EH Table 4 is reported in Table R4. Our analyses show that both ψt1 and ψt2 are statistically significant in the pooled regression. The coefficients on ψt1 are significant in 16 (EH: 12) out of 19 years,4 and the coefficients on ψt2 are significant in 17 (EH: 15) out of 19 years in the annual regressions. These results suggest that the earnings level variable serves as an omitted variable in the relation between unexpected earnings and unexpected returns.
In conclusion, our replicated results of EH Tables 1 to 4 are comparable with those reported in their paper.
IV. Earnings-Return Relation: A Comparison between the Chinese
and US Stock Markets
In this section, we examine and compare the relevance of the level of earnings in the earnings-return relation between the Chinese and US stock markets in the period 1998-2011.
4.1 Univariate Analyses - Relative Explanatory Power
4.1.1 US Market
We first examine the earnings-return relation in the US for the period 1998-2011 in comparison to the 1968-1986 period. Table 1 Panel A reports the empirical results. In the pooled analysis, we find that both αt1 and φt1 are significant.5 Surprisingly, the R2 is only 1.6% in the earnings level model as compared with 7.9% in the 1968-1986 period, as reported in Table R1. The results indicate that the explanatory power of Ajt/Pt-1 for Rjt greatly diminished in the 1998-2011 period. We find that the explanatory power of ΔAjt/Pt-1 is relatively stable as the R2s are 4.1% and 4.2% in the 1968-1986 and 1998-2011 periods, respectively. Comparing R2s between the earnings level and earnings change models (4.2% versus 1.6%), ΔAjt/Pt-1 has a greater explanatory power for Rjt than Ajt/Pt-1.
3 In the remaining three cases, two are similar in value and only one has a lower R2. 4 The exception is the coefficient for 1986, which has a wrong sign. 5 We also apply White’s (1980) test to account for heteroskedasticity.

The Association between Earnings and Returns 95
Ta
ble
R1
Sim
ple
Reg
ress
ions
of A
nnua
l Sec
urit
y R
etur
ns o
n D
efla
ted
Ear
ning
s L
evel
s an
d E
arni
ngs
Cha
nges
Lev
el M
odel
: Rjt
= α t
0 + α t
1Ajt
/ Pjt-
1 + ε j
t,
Cha
nge
Mod
el:
Rjt
= φ t
0 + φ
t1A
jt / P
jt-1
+ ε j
t
Lev
el M
odel
C
hang
e M
odel
Y
ear
α t0
α t1
R2
φt0
φ t
1 R
2 N
A
ll 0.
088*
**
(30.
31)
0.88
3***
(4
9.76
) 0.
079
0.
159*
**
(61.
19)
0.64
5***
(3
5.17
) 0.
041
28,7
81
1986
0.
142*
**
(19.
40)
0.61
1***
(1
3.55
) 0.
078
0.
158*
**
(21.
13)
0.43
7***
(9
.44)
0.
039
2,17
3 19
85
0.26
3***
(2
8.40
) 1.
139*
**
(20.
50)
0.16
7
0.32
2***
(3
3.51
) 0.
788*
**
(12.
96)
0.07
4 2,
090
1984
0.
066*
**
(8.3
8)
1.09
8***
(2
2.50
) 0.
205
0.
128*
**
(15.
90)
0.52
4***
(1
0.01
) 0.
048
1,96
9 19
83
0.13
6***
(1
2.35
) 0.
549*
**
(8.3
2)
0.03
7
0.16
0***
(1
5.15
) 0.
617*
**
(8.4
7)
0.03
8 1,
812
1982
0.
512*
**
(29.
09)
0.56
8***
(6
.16)
0.
024
0.
591*
**
(36.
54)
1.13
4***
(1
1.95
) 0.
083
1,57
5 19
81
-0.1
53**
* (-
18.6
0)
0.95
8***
(1
9.43
) 0.
189
-0
.061
***
(-8.
36)
0.77
2***
(1
3.60
) 0.
103
1,61
9 19
80
0.40
3***
(2
5.70
) 0.
848*
**
(10.
79)
0.06
6
0.51
6***
(4
0.91
) 0.
753*
**
(9.7
7)
0.05
5 1,
642
1979
0.
022
(1.5
3)
0.78
6***
(1
0.32
) 0.
061
0.
117*
**
(11.
23)
0.90
2***
(1
1.80
) 0.
078
1,63
8 19
78
0.12
5***
(1
0.45
) 0.
624*
**
(9.6
7)
0.05
9
0.19
5***
(2
3.47
) 0.
602*
**
(9.9
5)
0.06
2 1,
493
1977
0.
028*
* (2
.34)
1.
132*
**
(16.
44)
0.15
7
0.15
3***
(1
7.29
) 1.
018*
**
(15.
00)
0.13
4 1,
457
1976
0.
057*
**
(5.3
0)
0.93
1***
(1
5.60
) 0.
145
0.
154*
**
(18.
60)
0.51
8***
(9
.72)
0.
062
1,43
3 19
75
0.29
5***
(2
1.39
) 1.
145*
**
(17.
18)
0.17
1
0.45
0***
(4
0.51
) 0.
919*
**
(15.
52)
0.14
4 1,
436
1974
-0
.165
***
(-14
.98)
0.
914*
**
(16.
75)
0.17
2
-0.0
58**
* (-
6.32
) 0.
637*
**
(12.
30)
0.10
1 1,
354
1973
-0
.208
***
(-20
.21)
0.
891*
**
(12.
15)
0.09
8
-0.1
43**
* (-
17.3
5)
0.68
3***
(9
.36)
0.
061
1,36
0 19
72
-0.1
86**
* (-
15.4
0)
1.52
9***
(1
1.31
) 0.
088
-0
.113
***
(-11
.83)
0.
786*
**
(8.1
0)
0.04
7 1,
320
1971
0.
040*
**
(3.6
0)
1.33
2***
(1
1.72
) 0.
098
0.
094*
**
(9.5
3)
1.06
4***
(1
0.21
) 0.
076
1,26
9 19
70
0.04
9***
(4
.51)
1.
367*
**
(11.
93)
0.10
7 0.
126*
**
(12.
25)
0.96
2***
(7
.40)
0.
044
1,19
5 19
69
-0.3
03**
* (-
29.2
8)
2.14
2***
(1
3.28
) 0.
131
-0.2
00**
* (-
26.2
5)
1.66
9***
(8
.76)
0.
061
1,17
4 19
68
0.05
3**
(2.2
0)
2.76
6***
(8
.11)
0.
079
0.22
5***
(1
8.94
) 1.
677*
**
(5.2
1)
0.03
4 77
2 M
ean
1.12
3***
(8
.85)
0.
866*
**
(11.
00)
Not
e: F
or d
efin
ition
s of
var
iabl
es, p
leas
e re
fer t
o th
e A
ppen
dix.
Par
enth
eses
sig
nify
t-st
atis
tics.
*, *
*, a
nd *
** s
igni
fy 1
0%, 5
%, a
nd 1
% le
vel o
f st
atis
tical
sig
nifi
canc
e (t
wo-
taile
d), r
espe
ctiv
ely.
96 Chen and Ho
Table R2 Regressions of Annual Security Returns on Prior-Period Earnings
Prior Earnings Model: Rjt = θt0 + θt1Ajt-1 / Pjt-1 + εjt
Year θt0 θt1 R2 N All 0.135*** (43.80) 0.298*** (14.97) 0.008 28,781 1986 0.146*** (18.85) 0.237*** (4.41) 0.009 2,173 1985 0.274*** (26.05) 0.510*** (7.59) 0.027 2,090 1984 0.101*** (11.84) 0.580*** (10.65) 0.055 1,969 1983 0.160*** (14.37) 0.043 (0.64) 0.000 1,812 1982 0.607*** (31.05) -0.527*** (-5.19) 0.017 1,575 1981 -0.118*** (-11.64) 0.513*** (7.45) 0.033 1,619 1980 0.496*** (27.77) 0.070 (0.77) 0.000 1,642 1979 0.141*** (9.11) -0.122 (-1.34) 0.001 1,638 1978 0.217*** (18.66) -0.069 (-0.96) 0.001 1,493 1977 0.159*** (12.26) 0.064 (0.79) 0.000 1,457 1976 0.154*** (15.49) 0.189*** (3.16) 0.007 1,433 1975 0.448*** (28.55) -0.058 (-0.78) 0.000 1,436 1974 -0.086*** (-6.37) 0.270*** (3.32) 0.008 1,354 1973 -0.142*** (-14.04) 0.204** (2.43) 0.004 1,360 1972 -0.095*** (-9.45) -0.026 (-0.29) 0.000 1,320 1971 0.097*** (8.59) 0.033 (0.28) 0.000 1,269 1970 0.068*** (5.27) 0.688*** (5.22) 0.022 1,195 1969 -0.257*** (-21.25) 1.052*** (5.54) 0.025 1,174 1968 0.182*** (7.51) 0.715** (2.12) 0.006 772 Mean 0.230** (2.71) Note: For definitions of variables, please refer to the Appendix. Parentheses signify t-statistics. *, **, and *** signify 10%, 5%, and 1% level of statistical significance (two-tailed), respectively. Table R3 Multiple Regressions of Annual Security Returns on Deflated Earnings Levels and Earnings Changes
Model: Rjt = γt0 + γt1Ajt / Pjt-1 + γt2Ajt / Pjt-1 + εjt
Year γt0 γt1 γt2 R2 N All 0.097*** (31.75) 0.769*** (35.77) 0.204*** (9.34) 0.082 28,781 1986 0.145*** (19.38) 0.555*** (9.66) 0.091 (1.57) 0.079 2,173 1985 0.269*** (27.61) 1.057*** (15.42) 0.144** (2.03) 0.169 2,090 1984 0.064*** (8.03) 1.135*** (19.70) -0.068 (-1.21) 0.205 1,969 1983 0.143*** (12.98) 0.375*** (5.14) 0.434*** (5.38) 0.052 1,812 1982 0.595*** (31.43) -0.045 (-0.42) 1.160*** (10.12) 0.083 1,575 1981 -0.145*** (-15.42) 0.881*** (13.27) 0.126* (1.74) 0.191 1,619 1980 0.439*** (24.53) 0.600*** (6.05) 0.394*** (4.07) 0.076 1,642 1979 0.069*** (4.35) 0.380*** (3.97) 0.663*** (6.83) 0.087 1,638 1978 0.150*** (11.74) 0.376*** (4.73) 0.393*** (5.27) 0.076 1,493 1977 0.063*** (4.87) 0.790*** (9.45) 0.568*** (6.99) 0.184 1,457 1976 0.063*** (5.73) 0.842*** (12.09) 0.146** (2.46) 0.149 1,433 1975 0.343*** (22.76) 0.807*** (10.06) 0.511*** (7.28) 0.200 1,436 1974 -0.164*** (-12.41) 0.904*** (10.77) 0.012 (0.16) 0.172 1,354 1973 -0.200*** (-18.68) 0.732*** (8.09) 0.262*** (2.97) 0.104 1,360 1972 -0.193*** (-16.17) 1.405*** (10.48) 0.655*** (6.97) 0.121 1,320 1971 0.053*** (4.68) 0.984*** (7.32) 0.579*** (4.76) 0.114 1,269 1970 0.057*** (4.59) 1.269*** (9.25) 0.195 (1.29) 0.108 1,195 1969 -0.291*** (-24.76) 1.912*** (9.92) 0.476** (2.17) 0.134 1,174 1968 0.072*** (2.65) 2.472*** (6.29) 0.545 (1.51) 0.081 772 Mean 0.917*** (6.96) 0.383*** (5.72) Note: For definitions of variables, please refer to the Appendix. Parentheses signify t-statistics. *, **, and *** signify 10%, 5%, and 1% level of statistical significance (two-tailed), respectively.

The Association between Earnings and Returns 97
Table R4 Multiple Regressions of Cumulative Abnormal Returns on Deflated Earnings Levels and Earnings Changes
Model: CARjt = t0 + t1Ajt / Pjt-1 + t2Ajt / Pjt-1 + εjt
Year ψt0 ψt1 ψt2 R2 N All -0.020*** (-8.35) 0.233*** (13.54) 0.543*** (31.11) 0.077 28,781 1986 -0.047*** (-6.16) -0.158*** (-2.71) 0.404*** (6.90) 0.023 2,173 1985 0.003 (0.40) 0.571*** (9.84) 0.297*** (4.93) 0.115 2,090 1984 0.019** (2.47) 0.643*** (11.73) 0.320*** (5.95) 0.149 1,969 1983 0.033*** (3.78) 0.014 (0.23) 0.774*** (11.95) 0.091 1,812 1982 0.057*** (4.50) -0.023 (-0.32) 0.726*** (9.42) 0.074 1,575 1981 0.065*** (5.13) 0.515*** (5.74) 0.641*** (6.53) 0.124 1,619 1980 -0.036*** (-3.11) 0.302*** (4.65) 0.409*** (6.45) 0.089 1,642 1979 -0.054*** (-3.82) 0.193** (2.28) 0.770*** (8.97) 0.100 1,638 1978 -0.106*** (-10.10) 0.044 (0.67) 0.519*** (8.49) 0.076 1,493 1977 -0.167*** (-15.70) 0.392*** (5.69) 0.611*** (9.13) 0.156 1,457 1976 -0.135*** (-13.50) 0.471*** (7.43) 0.327*** (6.04) 0.117 1,433 1975 -0.081*** (-7.08) 0.415*** (6.83) 0.438*** (8.24) 0.158 1,436 1974 -0.107*** (-8.16) 0.726*** (8.72) 0.122 (1.61) 0.149 1,354 1973 -0.006 (-0.43) 0.329*** (2.90) 1.016*** (9.17) 0.123 1,360 1972 -0.057*** (-4.38) 1.274*** (8.69) 1.128*** (10.97) 0.146 1,320 1971 -0.042*** (-3.88) 0.567*** (4.38) 0.930*** (7.94) 0.119 1,269 1970 -0.030*** (-2.68) 1.013*** (8.16) 0.222 (1.63) 0.092 1,195 1969 -0.018 (-1.06) 1.043*** (3.81) 1.761*** (5.67) 0.079 1,174 1968 -0.168*** (-7.38) 2.436*** (7.39) 0.889*** (2.93) 0.128 772 Mean 0.567*** (4.20) 0.647*** (7.22)
Note: For definitions of variables, please refer to the Appendix. Parentheses signify t-statistics. *, **, and *** signify 10%, 5%, and 1% level of statistical significance (two-tailed), respectively.
In our annual analyses, αt1 and φt1 are all significant at the 1% level.6 Although the R2s from the earnings level models are greater than the R2s from the earnings change models in 10 out of 14 years, only in 2 of the 14 years (2010 and 2007) are the R2s from the earnings level models at least two times higher than the R2s from the earnings change models. On the other hand, in 3 (2009, 2003, and 1999) of the 4 years where the R2s from the earnings change models are greater than the R2s from the earnings level models, the R2s for these years are at least two times higher.
Taken together, the univariate results indicate that the explanatory power of earnings levels for stock returns has significantly decreased and that change of earnings has a greater relative explanatory power than level of earnings in the 1998-2011 period, which is in contrast to the findings for the 1968-1986 period.
4.1.2 Chinese Market
Table 1 Panel B reports the results of the univariate regressions of returns on earnings in the Chinese stock market. In the pooled analysis, we find that both αt1 and φt1 are significant and the R2s are 4.6% and 4.7% in the earnings level and earnings change models, respectively. The results suggest that the explanatory power of Ajt/Pt-1 is comparable to that of ΔAjt/Pt-1 for Rjt.
In the annual regressions, the coefficients on αt1 and φt1 are all significant across years. In 7 out of 14 years, the R2s of the earnings level models are greater than the R2s of the
6 Except where 2003 and 1999 have the wrong sign.

98 Chen and Ho
earnings change models. In 4 of these 7 years (2002 to 2005), the R2s of the earnings level models are at least twice as large as the R2s of the earnings change models. Similarly, four of the R2s from the earnings change models (2010, 2009, 2008, and 2006) are at least as twice as large as the R2s of the earnings level models in 4 out of the 7 years in which the R2s of the earnings change models are greater than those of the earnings level models.
Overall, we find that both earnings levels and earnings changes are explanatory variables for stock returns. The difference in the relative explanatory power between these two variables seems negligible, only 0.1% in R2.
4.2 Multivariate Analyses - Incremental Explanatory Power
4.2.1 US Market
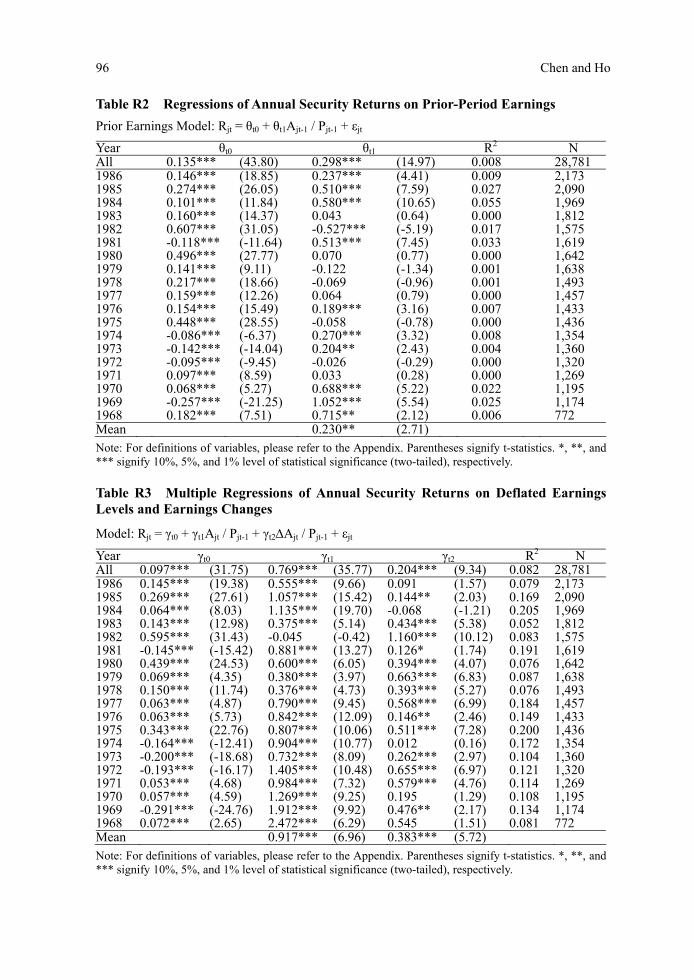
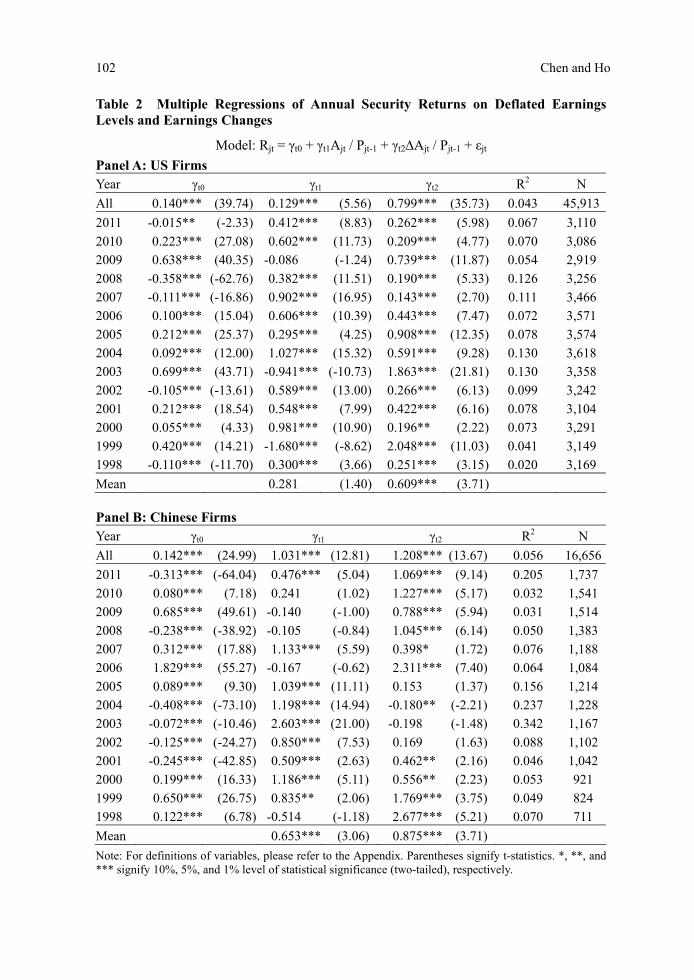
We present the US evidence from the multivariate regressions in Table 2 Panel A. In the pooled regression, we find that both γt1 and γt2 are statistically significant and the R2 is 4.3%. Relative to the R2 (8.2%) from the 1968-1986 period reported in Table R3, the R2 has fallen to 3.9% in the 1998-2011 period. These results suggest that Ajt/Pt-1 and ΔAjt/Pt-1 combined have much lower explanatory power for Rjt in the 1998-2011 period. Comparing R2 between Table 2 Panel A and Table 1 Panel A, we find that by including ΔAjt/Pt-1 into the earnings level model, the R2 increases by 2.7%. However, the R2 increases by only 0.1% when Ajt/Pt-1 is included in the earnings change model, suggesting that the explanatory power of Ajt/Pt-1 is mostly subsumed by that of ΔAjt/Pt-1.
In the annual regressions, the coefficients on γt1 are significant in 13 out of 14 years while the coefficients on γt2 are significant in all 14 years. In 13 of the 14 years,7 the R2s from the multiple regressions are higher than the R2s from the univariate regressions of either variable. When we turn to the average of the coefficients on γt1 and γt2 across years, the average of the coefficient on γt1 is insignificant while that on γt2 is still statistically significant at the 0.01 level. The insignificant result of γt1 is consistent with the finding in the pooled analysis that Ajt/Pt-1 has little explanatory power over ΔAjt/Pt-1 for Rjt.
Overall, the explanatory power of earnings levels and earnings changes for stock returns in the 1998-2011 period for the US market reduced by almost 50% relative to that in the 1968-1986 period. Specifically, level of earnings has diminished incremental explanatory power in the presence of earnings changes. Our findings suggest that the earnings change variable substitutes for the earnings level variable in the earnings-return relation.
4.2.2 Chinese Market
The results of multivariate regressions for the Chinese market are reported in Table 2 Panel B. In the pooled regression, we find that both γt1 and γt2 are statistically significant. The R2 from the multivariate regression is 5.6%, which is greater than the R2s from the earnings level model and the earnings change model by 1% and 0.9%, respectively. In the yearly regressions, for γt1, the coefficients are significant in 9 out of 14 years while the coefficients on γt2 are significant in 11 out of 14 years.8 The averages of γt1 and γt2 across years are also statistically significant, suggesting that the results are not contaminated by the effect of cross-sectional dependence. In 12 out of 14 years, the R2s from the multivariate regressions are higher than the R2s from the univariate regressions of either variable.
Taken together, the results indicate that earnings levels and earnings changes are explanatory variables for stock returns in the Chinese stock market. Both earnings
7 Where 2003 and 1999 are of the wrong sign. 8 Where 2004 is of the wrong sign.

The Association between Earnings and Returns 99
variables are complements, and their incremental explanatory powers are similar in terms of the magnitude of R2.
4.3 The Relation between Unexpected Returns and Unexpected Earnings
In Section 3.3, we show that both earnings levels and earnings changes are explanatory variables for unexpected stock returns for the US market for the period 1968-1986. We re-examine this relation in the Chinese and US markets for the period 1998-2011.
The US evidence is reported in Table 3 Panel A. Our results indicate that only the coefficient on ΔAjt/Pt-1, ψt2, is positive and statistically significant in the pooled regression while that on Ajt/Pt-1, ψt1, is insignificant, which suggests that the explanatory power of Ajt/Pt-1 is subsumed by that of ΔAjt/Pt-1. In most of the years, the yearly regression analyses provide similar results to those in the pooled analyses. Together, our results for the US for the period 1998-2011 indicate that the incremental explanatory power of earnings levels disappears and that earnings level is no longer an explanatory variable for unexpected stock returns.
We report the evidence for the Chinese market in Table 3 Panel B. Our findings show that both ψt1 and ψt2 are statistically significant in the pooled regression. In the yearly regressions, the mean of the coefficients on ΔAjt/Pt-1, ψt2, is still significant; however, that on ψt1 becomes insignificant. Indeed, the coefficients on ψt1 are positive and significant in 5 out of 14 years and on ψt2 are significant in 13 out of 14 years in the annual regressions. Overall, we find that earnings changes can explain unexpected returns in the Chinese stock market. The level of earnings is not an explanatory variable for unexpected stock returns after taking cross-sectional correlation into consideration.
4.4 Discussions Below, we discuss the different results on the value relevance of earnings in the US
between two time periods and between the Chinese and US markets.
4.4.1 Decline of the Value Relevance of Earnings in the US market
Our analyses indicate that compared with the 1968-1986 period, the value relevance of earnings levels decreased in the US market in the 1998-2011 period. Our findings are generally in line with Collins et al. (1997) and Francis and Schipper (1999) and suggest that the decline in the relevance of earnings may be attributable to earnings properties (i.e. firms incurring a loss and with one-time items) and industry membership (intangible-intensive industries). Indeed, our untabulated results indicate that the number of firms that operate in intangible-intensive industries, incur accounting loss, or have one-time items almost doubles in the 1998-2011 period relative to the 1968-1986 period. Another possible explanation is that investor sophistication has increased over time such that investors are no longer fixated on earnings level but rather explore factors that drive changes in earnings levels (e.g. Degeorge et al., 1999; Brown and Caylor, 2005).
4.4.2 Comparison of Results between the Chinese and US Markets
Our findings indicate that the relevance of earnings variables differs between the two stock markets for the period 1998-2011. In the US, the change of earnings is better than the level of earnings in explaining stock returns and the earnings change variable substitutes for the earnings level variable in the earnings-return relation. However, the relative and incremental explanatory powers of both the earnings level and earnings change variables for stock returns are similar in the Chinese market.

100 Chen and Ho
Tabl
e 1
Sim
ple
Reg
ress
ions
of A
nnua
l Sec
urit
y R
etur
ns o
n D
efla
ted
Ear
ning
s L
evel
s an
d E
arni
ngs
Cha
nges
Lev
el M
odel
: Rjt
= α t
0 + α
t1A
jt / P
jt-1 +
εjt
,
Cha
nge
Mod
el: R
jt = φ t
0 + φ t
1A
jt / P
jt-1 +
εjt
Pan
el A
: US
Fir
ms
Lev
el M
odel
Cha
nge
Mod
el
Yea
r α t
0
α t
1
R
2
φt0
φ t
1
R2
N
All
0.14
0***
(3
9.12
)
0.55
1***
(2
7.22
)
0.01
6
0.14
1***
(3
9.84
)
0.86
2***
(4
4.79
)
0.04
2 45
,913
2011
-0
.015
**
(-2.
37)
0.
553*
**
(13.
63)
0.
056
-0
.011
* (-
1.73
)
0.45
7***
(1
1.92
)
0.04
4 3,
110
2010
0.
231*
**
(28.
58)
0.
691*
**
(14.
38)
0.
063
0.
225*
**
(26.
68)
0.
395*
**
(9.4
6)
0.
028
3,08
6
2009
0.
652*
**
(40.
38)
0.
311*
**
(4.9
8)
0.
008
0.
641*
**
(40.
79)
0.
701*
**
(12.
86)
0.
054
2,91
9
2008
-0
.363
***
(-64
.34)
0.50
4***
(2
0.95
)
0.11
9
-0.3
61**
* (-
62.1
8)
0.
473*
**
(18.
04)
0.
091
3,25
6
2007
-0
.111
***
(-16
.91)
0.97
0***
(2
0.64
)
0.10
9
-0.1
06**
* (-
15.4
4)
0.
565*
**
(11.
63)
0.
038
3,46
6
2006
0.
100*
**
(14.
93)
0.
786*
**
(14.
70)
0.
057
0.
109*
**
(16.
33)
0.
698*
**
(12.
74)
0.
044
3,57
1
2005
0.
207*
**
(24.
35)
0.
730*
**
(11.
95)
0.
038
0.
216*
**
(26.
06)
1.
066*
**
(16.
80)
0.
073
3,57
4
2004
0.
097*
**
(12.
57)
1.
293*
**
(21.
10)
0.
110
0.
106*
**
(13.
60)
1.
009*
**
(16.
99)
0.
074
3,61
8
2003
0.
741*
**
(43.
66)
-0
.424
***
(-4.
71)
0.
007
0.
699*
**
(42.
98)
1.
615*
**
(19.
31)
0.
100
3,35
8
2002
-0
.101
***
(-13
.06)
0.71
8***
(1
7.76
)
0.08
9
-0.1
12**
* (-
14.2
1)
0.
528*
**
(13.
35)
0.
052
3,24
2
2001
0.
202*
**
(17.
76)
0.
809*
**
(14.
86)
0.
066
0.
215*
**
(18.
61)
0.
759*
**
(13.
92)
0.
059
3,10
4
2000
0.
051*
**
(4.0
7)
1.
108*
**
(15.
93)
0.
072
0.
080*
**
(6.2
7)
0.
807*
**
(11.
63)
0.
040
3,29
1
1999
0.
413*
**
(13.
74)
-0
.612
***
(-3.
55)
0.
004
0.
397*
**
(13.
35)
1.
253*
**
(7.6
9)
0.
018
3,14
9
1998
-0
.113
***
(-12
.12)
0.46
7***
(7
.45)
0.01
7
-0.1
06**
* (-
11.3
6)
0.
439*
**
(7.2
1)
0.
016
3,16
9
Mea
n
0.
565*
**
(4.0
1)
0
.769
***
(8.1
0)

The Association between Earnings and Returns 101
P
anel
B: C
hine
se F
irm
s
Leve
l Mod
el
C
hang
e M
odel
Yea
r α t
0
α t
1
R
2
φ t0
φ t
1
R
2 N
All
0.13
0***
(2
3.02
)
1.74
2***
(2
8.23
)
0.04
6
0.16
6***
(3
0.72
)
1.94
1***
(2
8.65
)
0.04
7 16
,656
2011
-0
.331
***
(-71
.50)
1.14
3***
(1
8.63
)
0.16
7
-0.3
00**
* (-
72.9
4)
1.
524*
**
(20.
40)
0.
193
1,73
7
2010
0.
075*
**
(6.6
8)
0.
944*
**
(4.8
4)
0.
015
0.
086*
**
(8.8
7)
1.
367*
**
(7.0
4)
0.
031
1,54
1
2009
0.
679*
**
(48.
77)
0.
385*
**
(3.5
1)
0.
008
0.
680*
**
(51.
91)
0.
704*
**
(6.8
5)
0.
030
1,51
4
2008
-0
.253
***
(-44
.61)
0.48
0***
(5
.86)
0.02
4
-0.2
40**
* (-
42.6
4)
0.
936*
**
(8.5
0)
0.
050
1,38
3
2007
0.
308*
**
(17.
80)
1.
381*
**
(9.6
9)
0.
073
0.
355*
**
(22.
42)
1.
320*
**
(8.0
1)
0.
051
1,18
8
2006
1.
831*
**
(54.
02)
0.
974*
**
(4.2
8)
0.
017
1.
823*
**
(57.
66)
2.
201*
**
(8.5
8)
0.
064
1,08
4
2005
0.
087*
**
(9.2
0)
1.
115*
**
(14.
87)
0.
154
0.
109*
**
(11.
02)
0.
893*
**
(9.5
3)
0.
070
1,21
4
2004
-0
.405
***
(-74
.39)
1.07
0***
(1
9.33
)
0.23
4
-0.3
83**
* (-
66.1
7)
0.
701*
**
(11.
50)
0.
097
1,22
8
2003
-0
.071
***
(-10
.36)
2.49
9***
(2
4.53
)
0.34
1
-0.0
22**
* (-
2.89
)
1.40
8***
(1
0.89
)
0.09
2 1,
167
2002
-0
.126
***
(-24
.76)
0.95
2***
(1
0.15
)
0.08
6
-0.1
14**
* (-
22.5
2)
0.
603*
**
(6.8
4)
0.
041
1,10
2
2001
-0
.250
***
(-48
.95)
0.83
2***
(6
.73)
0.04
2
-0.2
38**
* (-
47.1
1)
0.
897*
**
(6.5
5)
0.
040
1,04
2
2000
0.
196*
**
(16.
16)
1.
416*
**
(6.7
9)
0.
048
0.
222*
**
(19.
36)
1.
119*
**
(4.9
5)
0.
026
921
1999
0.
637*
**
(26.
28)
1.
735*
**
(5.2
7)
0.
033
0.
666*
**
(28.
71)
2.
345*
**
(6.1
6)
0.
044
824
1998
0.
071*
**
(4.6
1)
1.
320*
**
(5.0
4)
0.
035
0.
110*
**
(7.5
8)
2.
187*
**
(7.2
2)
0.
068
711
Mea
n
1.1
60**
* (8
.29)
1.30
0***
(8
.32)
Not
e: S
corr
den
otes
Spe
arm
an c
orre
latio
n. F
or d
efin
ition
s of
the
rem
aini
ng v
aria
bles
, ple
ase
refe
r to
the
App
endi
x. P
aren
thes
es s
igni
fy t-
stat
istic
s. *
, **,
and
***
sig
nify
10%
, 5%
, and
1%
leve
lof
sta
tistic
al s
igni
fica
nce
(tw
o-ta
iled)
, res
pect
ivel
y.
102 Chen and Ho
Table 2 Multiple Regressions of Annual Security Returns on Deflated Earnings Levels and Earnings Changes
Model: Rjt = γt0 + γt1Ajt / Pjt-1 + γt2Ajt / Pjt-1 + εjt
Panel A: US Firms Year γt0 γt1 γt2 R2 N
All 0.140*** (39.74) 0.129*** (5.56) 0.799*** (35.73) 0.043 45,913
2011 -0.015** (-2.33) 0.412*** (8.83) 0.262*** (5.98) 0.067 3,110
2010 0.223*** (27.08) 0.602*** (11.73) 0.209*** (4.77) 0.070 3,086
2009 0.638*** (40.35) -0.086 (-1.24) 0.739*** (11.87) 0.054 2,919
2008 -0.358*** (-62.76) 0.382*** (11.51) 0.190*** (5.33) 0.126 3,256
2007 -0.111*** (-16.86) 0.902*** (16.95) 0.143*** (2.70) 0.111 3,466
2006 0.100*** (15.04) 0.606*** (10.39) 0.443*** (7.47) 0.072 3,571
2005 0.212*** (25.37) 0.295*** (4.25) 0.908*** (12.35) 0.078 3,574
2004 0.092*** (12.00) 1.027*** (15.32) 0.591*** (9.28) 0.130 3,618
2003 0.699*** (43.71) -0.941*** (-10.73) 1.863*** (21.81) 0.130 3,358
2002 -0.105*** (-13.61) 0.589*** (13.00) 0.266*** (6.13) 0.099 3,242
2001 0.212*** (18.54) 0.548*** (7.99) 0.422*** (6.16) 0.078 3,104
2000 0.055*** (4.33) 0.981*** (10.90) 0.196** (2.22) 0.073 3,291
1999 0.420*** (14.21) -1.680*** (-8.62) 2.048*** (11.03) 0.041 3,149
1998 -0.110*** (-11.70) 0.300*** (3.66) 0.251*** (3.15) 0.020 3,169
Mean 0.281 (1.40) 0.609*** (3.71) Panel B: Chinese Firms Year γt0 γt1 γt2 R2 N
All 0.142*** (24.99) 1.031*** (12.81) 1.208*** (13.67) 0.056 16,656
2011 -0.313*** (-64.04) 0.476*** (5.04) 1.069*** (9.14) 0.205 1,737
2010 0.080*** (7.18) 0.241 (1.02) 1.227*** (5.17) 0.032 1,541
2009 0.685*** (49.61) -0.140 (-1.00) 0.788*** (5.94) 0.031 1,514
2008 -0.238*** (-38.92) -0.105 (-0.84) 1.045*** (6.14) 0.050 1,383
2007 0.312*** (17.88) 1.133*** (5.59) 0.398* (1.72) 0.076 1,188
2006 1.829*** (55.27) -0.167 (-0.62) 2.311*** (7.40) 0.064 1,084
2005 0.089*** (9.30) 1.039*** (11.11) 0.153 (1.37) 0.156 1,214
2004 -0.408*** (-73.10) 1.198*** (14.94) -0.180** (-2.21) 0.237 1,228
2003 -0.072*** (-10.46) 2.603*** (21.00) -0.198 (-1.48) 0.342 1,167
2002 -0.125*** (-24.27) 0.850*** (7.53) 0.169 (1.63) 0.088 1,102
2001 -0.245*** (-42.85) 0.509*** (2.63) 0.462** (2.16) 0.046 1,042
2000 0.199*** (16.33) 1.186*** (5.11) 0.556** (2.23) 0.053 921
1999 0.650*** (26.75) 0.835** (2.06) 1.769*** (3.75) 0.049 824
1998 0.122*** (6.78) -0.514 (-1.18) 2.677*** (5.21) 0.070 711
Mean 0.653*** (3.06) 0.875*** (3.71)
Note: For definitions of variables, please refer to the Appendix. Parentheses signify t-statistics. *, **, and *** signify 10%, 5%, and 1% level of statistical significance (two-tailed), respectively.

The Association between Earnings and Returns 103
Table 3 Multiple Regressions of Cumulative Abnormal Returns on Deflated Earnings Levels and Earnings Changes
Model: CARjt = t0 + t1Ajt / Pjt-1 + t2Ajt / Pjt-1 + εjt
Panel A: US Firms Year ψt0 ψt1 ψt2 R2 N All -0.020*** (-7.09) 0.022 (1.17) 0.663*** (36.49) 0.039 45,913 2011 -0.011 (-1.53) -0.082 (-1.55) 0.655*** (13.22) 0.063 3,110 2010 -0.031*** (-4.22) 0.293*** (6.40) 0.247*** (6.32) 0.039 3,086 2009 -0.079*** (-6.90) -0.076 (-1.51) 0.467*** (10.35) 0.040 2,919 2008 0.024* (1.87) -0.576*** (-7.75) 1.088*** (13.65) 0.056 3,256 2007 0.009 (0.95) 0.126* (1.71) 0.828*** (11.33) 0.053 3,466 2006 -0.030*** (-4.55) 0.101* (1.71) 0.720*** (12.01) 0.053 3,571 2005 -0.047*** (-6.46) -0.113* (-1.86) 1.045*** (16.28) 0.082 3,574 2004 -0.071*** (-9.64) 0.661*** (10.20) 0.697*** (11.34) 0.101 3,618 2003 0.043*** (4.00) 0.277*** (4.75) 0.588*** (10.35) 0.048 3,358 2002 -0.130*** (-14.73) 0.200*** (3.87) 0.601*** (12.13) 0.075 3,242 2001 0.033*** (2.72) 0.349*** (4.85) 0.472*** (6.56) 0.052 3,104 2000 0.119*** (8.38) 0.464*** (4.64) 0.679*** (6.93) 0.053 3,291 1999 -0.052*** (-2.81) -1.143*** (-9.32) 1.509*** (12.93) 0.054 3,149 1998 -0.062*** (-5.10) -0.463*** (-4.38) 1.056*** (10.28) 0.035 3,169 Mean 0.001 (0.01) 0.761*** (8.82) Panel B: Chinese Firms Year γt0 γt1 γt2 R2 N All -0.025*** (-7.84) 0.226*** (5.32) 0.566*** (12.30) 0.031 14,067 2011 -0.021** (-2.32) 0.048 (0.29) 1.633*** (8.10) 0.108 1,440 2010 0.022* (1.75) -0.461* (-1.76) 1.600*** (6.10) 0.029 1,421 2009 -0.035*** (-3.14) -0.200* (-1.85) 0.485*** (4.71) 0.018 1,339 2008 -0.036*** (-3.45) -1.350*** (-5.07) 2.132*** (6.86) 0.039 1,196 2007 -0.123*** (-8.55) 0.636*** (3.88) 0.345* (1.84) 0.050 1,115 2006 -0.034** (-2.15) 0.073 (0.58) 0.387*** (2.67) 0.013 989 2005 -0.022** (-2.37) 0.475*** (5.50) 0.395*** (3.87) 0.092 1,076 2004 -0.012 (-1.24) 0.794*** (6.09) 0.363*** (2.76) 0.117 1,102 2003 -0.048*** (-5.95) 2.044*** (14.19) 0.101 (0.66) 0.228 1,054 2002 0.009 (1.15) 0.393** (2.42) 0.490*** (3.37) 0.040 901 2001 0.006 (0.58) -0.944*** (-3.07) 1.399*** (4.17) 0.021 824 2000 0.013 (0.92) 0.291 (1.11) 0.624** (2.25) 0.014 737 1999 -0.019 (-0.96) 0.207 (0.70) 1.360*** (3.99) 0.054 553 1998 0.053* (1.95) -1.629*** (-2.75) 2.160*** (3.17) 0.031 320 Mean 0.027 (0.11) 0.963*** (5.01)
Note: For definitions of variables, please refer to the Appendix. Parentheses signify t-statistics. *, **, and *** signify 10%, 5%, and 1% level of statistical significance (two-tailed), respectively.
Possible explanations to account for the differences in the relevance of earnings levels between the two markets include differences in regulatory oversight, accounting standards, and investor sophistication (e.g. Bartov et al., 2005). Additionally, the earnings properties and industry membership of firms, which were discussed earlier, may also contribute to the differences in empirical results.

104 Chen and Ho
V. Conclusion
We conduct a comparative study to examine the earnings-return relation for the Chinese and US markets in the 1998-2011 period. We find that the relative explanatory power of earnings changes is higher than that of earnings levels and that the earnings change variable can substitute for the earnings level variable in explaining stock returns in our US sample for the period 1998-2011. These results are contradictory to our findings for 1968-1986. For our sample of Chinese firms in the 1998-2011 period, we find that the relative and incremental explanatory powers of the earnings change variable and the earnings level variable are similar. These differences in the empirical results on the value relevance of earnings may be attributable to differences between the two markets in terms of institutional factors (e.g. regulatory oversight, accounting standards, and investor sophistication) as well as to the earnings properties (e.g. accounting loss and one-time items) and industry membership of firms.
In conclusion, our study shows that the earnings-return relation differs between the Chinese and US markets in our sample period and that researchers and investors should exercise caution when applying or drawing earnings information for valuation tasks from US stock markets to Chinese stock markets. Additionally, stock markets may have an evolutionary path. As the Chinese stock market develops, the earnings-return relation may change over time as it did in the US market. “Open Access. This article is distributed under the terms of the Creative Commons Attribution License which permits any use, distribution, and reproduction in any medium, provided the original author(s) and the source are credited.”
References Bae, K., Tan, H., and Welker, M. (2008), ‘International GAAP Differences: The Impact on
Foreign Analysts’, Accounting Review 83 (3): 593-628. Ball, R. and Brown, P. (1968), ‘An Empirical Evaluation of Accounting Income Numbers’,
Journal of Accounting Research 6 (2): 159-178. Bartov, E., Goldberg, S., and Kim, M. (2005), ‘Comparative Value Relevance among
German, U.S. and International Accounting Standards: A German Stock Market Perspective’, Journal of Accounting Auditing and Finance 20 (2): 95-119.
Beaver, W., Lambert, R., and Morse, D. (1980), ‘The Information Content of Security Prices’, Journal of Accounting and Economics 2 (1): 3-28.
Beaver, W., Lambert, R., and Ryan, S. (1987), ‘The Information Content of Security Prices: A Second Look’, Journal of Accounting and Economics 9 (2): 139-157.
Brown, L. and Caylor, M. (2005), ‘A Temporal Analysis of Quarterly Earnings Thresholds: Propensities and Valuation Consequences’, The Accounting Review 80 (2): 423-440.
Brown, L. and Pinello, A. (2007), ‘To What Extent Does the Financial Reporting Process Curb Earnings Surprise Games?’, Journal of Accounting Research 45 (5): 947-981.
Collins, D. and Kothari, S. P. (1989), ‘An Analysis of Inter-Temporal and Cross-Sectional Determinants of Earnings Response Coefficients’, Journal of Accounting and Economics 11 (2-3): 143-181.
Collins, D., Maydew, E., and Weiss, I. (1997) ‘Changes in the Value-Relevance of Earnings and Book Values over the Past Forty Years’, Journal of Accounting and Economics 24 (1): 39-67.
Degeorge, F., Patel, J., and Zeckhauser, R. (1999), ‘Earnings Management to Exceed Thresholds’, Journal of Business 72 (1): 1-33.
Djankov, S., McLiesh, C., and Shleifer, A. (2007), ‘Private Credit in 129 Countries’,

The Association between Earnings and Returns 105
Journal of Financial Economics 84 (2): 299-329. Easton, P. and Harris, T. (1991), ‘Earnings as an Explanatory Variable for Returns’,
Journal of Accounting Research 29 (1): 19-36. Easton, P., Harris, T., and Ohlson, J. (1992), ‘Aggregate Accounting Earnings can Explain
Most of Security Returns: The Case of Long Event Windows’, Journal of Accounting and Economics 15 (2-3): 119-142.
Easton, P. and Zmijewski, M. (1989), ‘Cross-Sectional Variation in the Stock Market Response to Accounting Earnings Announcements’, Journal of Accounting and Economics 11 (2-3): 117-141.
Fama, E. and MacBeth, J. (1973), ‘Risk, Return, and Equilibrium: Empirical Tests’, Journal of Political Economy 81 (3): 607-636.
Francis, J. and Schipper, K. (1999), ‘Have Financial Statements Lost Their Relevance?’, Journal of Accounting Research 37 (2): 319-352.
Jiang, G., Lee, C. M. C. and Yue, H. (2010) ‘Tunneling through Intercorporate Loans: The China Experience’, Journal of Financial Economics 98 (1): 1-20.
Kormendi, R. and Lipe, R. (1987), ‘Earnings Innovations, Earnings Persistence and Stock Returns’, Journal of Business 60 (3): 323-345.
Kothari, S. P. (2001), ‘Capital Markets Research in Accounting’, Journal of Accounting and Economics 31 (1-3): 105-231.
Lev, B. (1989), ‘On the Usefulness of Earnings and Earnings Research: Lessons and Directions from Two Decades of Empirical Research’, Journal of Accounting Research 27 (Supplement): 153-201.
Manry, D., Tiras, S. and Wheatley, C. (2003), ‘The Influence of Interim Auditor Reviews on the Association of Returns with Earnings’, The Accounting Review 78 (1): 251-274.
White, H. (1980), ‘A Heteroskedasticity-Consistent Covariance Matrix Estimator and a Direct Test for Heteroskadasticity’, Econometrica 48 (4): 817-838.

106 Chen and Ho
Appendix: Data Definition
Variable US Market Chinese Market Rjt The cumulative return for fiscal year
t, as measured over the 12-month period from 9 months prior to the fiscal-year end to 3 months after the fiscal year-end.
Same as the US.
CARjt The cumulative abnormal return calculated over the 12-month period from 9 months prior to the fiscal-year end to 3 months after the fiscal year-end. The abnormal return is measured as the residuals from the monthly market model Rjt = β0j + β1jRmt + Zjt, where Rmt is the CRSP equally weighted market index for month t and the model is estimated over the 60 months prior to the month of the accumulation of returns.
Same as the US except that Rmt used in the calculation of abnormal returns is the equally weighted market index for the Shanghai and Shenzhen stock exchanges.
Ajt/Pt-1 Earnings per share at year t divided by stock price at year t-1. The earnings and prices variable are adjusted for stock splits and stock dividends.
Earnings before extraordinary items divided by market value of equity at year t-1.
ΔAjt/Pt-1 (Ajt Ajt-1) / Pjt-1 Same as the US.
Qjt/Pt-1 Quarterly earnings per share for year t divided by stock price at year t-1.
Same as the US.
ΔQjt/Pt-1 (Qjt Qjt-1) / Pjt-1 Same as the US.