Embed Size (px)
Citation preview
Contact Us Journalis ts Blog Log In Sign Up Send a Release
News Solutions Resources Search
News in Focus Business & Money Science & Tech Lifestyle & Health Policy & Public Interest People & Culture
The Cancer Drugs & Treatments Market - Data, Analysis &Forecasts to 2023'Nov 21, 2013, 11:04 ET f rom Report linker
NEW YORK, Nov. 21, 2013 /PRNewswire/ -- Reportlinker.com announces that a new market research
report is available in its catalogue:
T he Cance r Drugs & Tre at me nt s Marke t - Dat a, Analys is & Fore cas t s t o 20 23'T he Cance r Drugs & Tre at me nt s Marke t - Dat a, Analys is & Fore cas t s t o 20 23'
http://www.reportlinker.com/p01889380/The-Cancer-Drugs--Treatments-Market---Data-Analysis--
Forecasts-to-
2023'.html#utm_source=prnewswire&utm_medium=pr&utm_campaign=Drug_and_Medication
GMR Data forecast that the global cancer drugs and treatments market will reach $143.7bn by 2023.
GMR Data's latest report 'T he Cance r Drugs & Tre at me nt s Marke t - Dat a, Analys is &'T he Cance r Drugs & Tre at me nt s Marke t - Dat a, Analys is &
Journalists andBloggers
The newsyou need,when youneed it.
PDFmyURL lets you convert a complete website to PDF automatically!
Fore cas t s t o 20 23' Fore cas t s t o 20 23' explains just how this market will experience growth over the medium and
long term. The report also highlights forecast for the next 5 and 10 years, so that you and your
company can make specific long term plans. Don't let your competitors get the head-start on you,
order this report today.
Have you s e e n t he re ce nt ne ws on Cance r Drugs?Have you s e e n t he re ce nt ne ws on Cance r Drugs?
- Merck's new cancer drug kept more than 4 of 5 melanoma patients alive for a year
- Biopharma Alliances will be needed For Cancer Drugs in the cost conscious future – Forbes
- EU approval for Bayer's prostate cancer drug
- Sanofi ditches late-stage bone marrow cancer drug
The Anti-cancer treatment market is already worth $77.4bn (GMR Data) and continues to be one of
the largest and fastest growing areas for new drug development – can you afford not to be
involved? Should you and your company be capturing a greater market share?
Es s e nt ial f act s e xamine d in t his re portEs s e nt ial f act s e xamine d in t his re port
1) Across 2013, 15 new molecular entit ies were approved by the FDA; out of which seven were for
Oncology.
2) Currently targeted therapies dominate the oncology pipeline, followed by chemotherapy.
3) Immunotherapy drugs are gaining increasing amounts of attention due to fewer expected side
effects.
Only by ordering this in-depth exclusive report will you have full access to the unique findings. This
information is not available anywhere else. Find full details of these approved drugs alongside key
cancer drugs in their testing phases in this new GMR Data report.
Join PR Newswire forJournalists to access allof the free servicesdesignated to makeyour job easier.
In need of subjectmatter experts for yourstory? Submit a freeProf Net request andfind the sources youneed.
LEARN MORE
PDFmyURL lets you convert a complete website to PDF automatically!
Dis cove r e xact ly what t he indus t ry le ade rs are do ing T ODAY - Dis cove r e xact ly what t he indus t ry le ade rs are do ing T ODAY -
Within GMR Data's 'T he Cance r Drugs & Tre at me nt s Marke t - Dat a, Analys is &'T he Cance r Drugs & Tre at me nt s Marke t - Dat a, Analys is &
Fore cas t s t o 20 23' Fore cas t s t o 20 23' we analyse the key cancer drugs and treatments in the market currently and
how they will perform across the next decade.
Our study focuses on the individual revenues of the top 25 anti-cancer agents. With variable patents
and the threat of generics, how will these key cancer drugs fare across the next decade? – ONLY
THIS UNIQUE REPORT WILL TELL YOU
• Rituxan
• Herceptin
• Avastin
• Gleevec
• Revlimid
• Alimta
• Velcade
PLUS – In- de pt h count ry analys is – Dis cove r which count rie s and re gions willPLUS – In- de pt h count ry analys is – Dis cove r which count rie s and re gions will
drive t he oncology drugs marke t t o 20 23?drive t he oncology drugs marke t t o 20 23?
The US spent $322bn on healthcare in 2011, GMR Data estimate that the US spent $31.8bn in the
oncology market in 2012, capturing 40.5% of the market. 2nd to the US was Japan; spending
$8.9bn in 2012, capturing 11.2%. The European mainstays of the pharmaceutical sector; the UK,
Germany, France, Spain & Italy equated to 25% of the global oncology market in 2012.
But how will these country's markets develop? This report will tell you - TODAY
PDFmyURL lets you convert a complete website to PDF automatically!
Exclus ive Indus t ry s ource d inf ormat ion, not available anywhe re e ls eExclus ive Indus t ry s ource d inf ormat ion, not available anywhe re e ls e
As well as primary and secondary research sources, GMR Data have interviewed leading cancer
specialists within big pharma, R&D, wholesalers, distributors, marketeers and key clinical
organisations. From these interviews we have selected original, exclusive, transcribed interviews
with leading specialists in their field – This information is not available anywhere else.
This GMR Data report is the single tool to equip you with the latest trends in all regional markets and
why all stakeholders demand development of Cancer Drugs. This report will arm you with all you and
your company require to develop, price, launch and market a cancer drug.
With over 240+ pages, and over 270+ pages of charts, tables and graphs, this dedicated specialist
report will ensure you remain equipped and fully informed, to succeed in this competit ive market.
Chapt e r 1 Exe cut ive SummaryChapt e r 1 Exe cut ive Summary
1.1. Cancer Drugs Market Review
1.2. Chapter Breakdown
1.3. Research and Analysis Methods
Chapt e r 2 T ype s of Cance rChapt e r 2 T ype s of Cance r
2.1 Blood Cancer Types and Symptoms
2.1.2 Blood Cancer- Global Market
2.1.3 Blood Cancer- Causes and Risk Factors
PDFmyURL lets you convert a complete website to PDF automatically!
2.2 Bone Cancer Types and Symptoms
2.2.1 Bone Cancer- Global Market
2.2.2 Bone Cancer Causes and Risk Factors
2.3 Brain Cancer Types and Symptoms
2.3.1 Brain Cancer Market- Global
2.3.2 Brain Cancer- Causes and Risk Factors
2.4 Breast Cancer Types and Symptoms
2.4.1 Breast Cancer Market- Global
2.4.2 Breast Cancer Causes and Risk factors
2.5 Digestive/ Gastrointestinal Cancer Types and Symptoms
2.5.1 Gastrointestinal Cancer Market- Global
2.5.2 Gastrointestinal Cancer- Causes and Risk Factors
2.6 Endocrine Cancers Types and Symptoms
2.6.1 Endocrine Cancer Market- Global
2.6.2 Endocrine Cancer- Causes and Risk Factors
2.7 Eye Cancer Types and Symptoms
2.7.1 Eye Cancer Market- Global
2.7.2 Eye Cancer - Causes and Risk Factors
2.8 Genitourinary Cancers Types & Symptoms
2.8.1 Genitourinary Cancer Market – GlobalPDFmyURL lets you convert a complete website to PDF automatically!
2.8.2 Genitourinary Cancers - Causes and Risk Factors
2.9 Gynaecologic Cancers Types & Symptoms
2.9.1 Gynaecologic Cancer Market – Global
2.9.2 Gynaecologic Cancers - Causes and Risk Factors
2.10 Head & Neck Cancers Types & Symptoms
2.10.1 Head and Neck Cancer Market – Global
2.10.2 Head and Neck Cancer - Causes and Risk Factors
2.11 Respiratory/Lung Cancers Types & Symptoms
2.11.1 Respiratory Cancer Market – Global
2.11.2 Respiratory Cancer - Causes and Risk Factors
2.12 Skin Cancers Types & Symptoms
2.12.1 Skin Cancer – Global Market
2.12.2 Skin Cancer - Causes and Risk Factors
2.13 Worldwide Cancer Facts and Statistics
2.13.1 Cancer Incidence Facts & Statistics
2.13.2 Cancer Mortality and Survival Facts & Statistics
Chapt e r 3 Cance r; Caus e s & Eff e ct sChapt e r 3 Cance r; Caus e s & Eff e ct s
3.13 Genetic Causes
3.14 Tobacco & SmokingPDFmyURL lets you convert a complete website to PDF automatically!
3.15 Physical Activit ies and Eating Habits
3.16 Viral Infections
3.17 Bacterial Infections
3.18 Age
3.19 Carcinogens
Chapt e r 4 Cance r Tre at me nt T ype s & Side Eff e ct sChapt e r 4 Cance r Tre at me nt T ype s & Side Eff e ct s
4.1 Surgery
4.1.1 Potential Side effects of Surgery
4.2 Chemotherapy
4.2.1 Major Side effects of Chemotherapy
4.3 Radiation Therapy
4.3.1 Major Side effects of Radiation Therapy
4.4 Targeted Therapy
4.4.1 Major Side effects of Targeted Therapy
4.5 Immunotherapy (Biologic Therapy)
4.5.1 Major Side effects of Immunotherapy
4.6 Hormonal Therapy
4.6.1 Major Side effects of Hormone Therapy
PDFmyURL lets you convert a complete website to PDF automatically!
4.7 Hyperthermia
4.7.1 Major Side effects of Hyperthermia
4.8 Stem Cell Transplant
4.8.1 Major Side effects of Stem Cell Transplant
4.9 Other Therapies
4.9.1 Photodynamic Therapy
4.9.2 Side effects of Photodynamic Therapy
4.9.3 Laser Treatment
4.9.4 Side effects of Laser Treatment
Chapt e r 5 Cance r T he rapie s / Drugs Marke t Fore cas tChapt e r 5 Cance r T he rapie s / Drugs Marke t Fore cas t
5.1 Global Targeted Therapy Market – 2013 -2023
5.1.1 Rituxan/MabThera by Roche
5.1.2 Herceptin (Trastuzumab) by Roche
5.1.3 Avastin (Bevacizumab) by Roche
5.1.4 Gleevec (imatinib) by Novartis
5.1.5 Velcade (Bortezomib) by Takeda (Millennium) and J&J
5.1.6 Tarceva (Erlotinib) by Roche
5.1.7 Sutent (Sunitinib) by Pfizer
5.1.8 Sprycel (dasatinib) by Bristol Myers Squibb
5.1.9 Nexavar (Sorafenib) by Bayer and Onyx
PDFmyURL lets you convert a complete website to PDF automatically!
5.1.10 Tasigna (Nilotinib) by Novartis
5.1.11 Afinitor / Votubia (Everolimus) by Novartis
5.1.12 Xgeva (Denosumab) by Amgen
5.1.13 Yervoy (ipilimumab) by Bristol-Myers Squibb
5.1.14 Erbitux (cetuximab) by Bristol-Myers Squibb
5.2 Global Chemotherapy Market – 2013 -2023
5.2.1 Alimta (Pemetrexed) by Eli Lilly
5.2.2 Xeloda (capecitabine) by Roche
5.2.3 Eloxatin (oxaliplatin) by Sanofi-Aventis
5.2.4 Temodar / Temodal (temozolomide) by Merck & Co.
5.2.5 Vidaza (azacit idine) by Celgene
5.2.6 Taxotere (docetaxel) by Sanofi-Aventis
5.2.7 Treanda (bendamustine hydrochloride) by Teva Pharmaceuticals
5.3 Global Immunotherapy (Biological therapy) Market – 2013 -2023
5.3.1 Revlimid (lenalidomide) by Celgene
5.3.2 Gardasil (Human Papillomavirus Quadrivalent) by Merck
5.3.3 Zometa (zoledronate) by Novartis
5.4 Global Hormone Therapy Market – 2013 -2023
5.4.1 Faslodex (Fulvestrant) Injection by AstraZeneca
5.4.2 Zoladex (Goserelin acetate implant) by AstraZenecaPDFmyURL lets you convert a complete website to PDF automatically!
5.4.3 Arimidex (anastrozole) by AstraZeneca
5.4.4 Casodex (bicalutamide) by AstraZeneca
5.4.5 Sandostatin (octreotide acetate) by Novartis
Chapt e r 6 Cance r R& D Pipe line and DrugsChapt e r 6 Cance r R& D Pipe line and Drugs
6.1 R&D Pipeline
6.1.1 Oncology Drugs; Recent Approvals
6.1.2 Late Stage Cancer Drugs
6.1.3 Key Experimental Cancer Drugs Pipeline
6.1.4 Oncology Drug Pipeline – Cancer Drugs Failures
Chapt e r 7 Major Tre nds & Challe nge s in t he Global Cance r Drugs Marke tChapt e r 7 Major Tre nds & Challe nge s in t he Global Cance r Drugs Marke t
7.1 Major Trends
7.1.1 Personalised Medication
7.1.2 Increasing Cancer Threat In Low & Middle Income Countries
7.1.3 Antibody Drug Conjugates (ADC)
7.1.4 Combination Therapy
7.1.5 Key Collaborations and Alliances
7.1.6 New Drug Development
7.1.7 Immunotherapy – to be the next Industry Driver
7.2 Major Challenges
PDFmyURL lets you convert a complete website to PDF automatically!
7.2.1 Expensive Treatment
7.2.2 Biosimilars Competit ion
7.2.3 Generic Competit ion
7.2.4 Severe Side Effects of Cancer Care Treatment
7.2.5 Regulatory Hurdles in Cancer Drug Approvals
Chapt e r 8 Re gional Lands cape – T he Ke y Global Cance r Drug Marke t sChapt e r 8 Re gional Lands cape – T he Ke y Global Cance r Drug Marke t s
8.1. The US Oncology Market to 2023
8.2. The UK Oncology Market to 2023
8.3. France Oncology Market to 2023
8.4 The German Oncology Market to 2023
8.5 The Spanish Oncology Market to 2023
8.6 The Italian Oncology Market to 2023
8.7 The Japanese Oncology Market to 2023
8.8 The Rest of the World Oncology Market to 2023
Chapt e r 9 Major Playe rs in t he Oncology Marke tChapt e r 9 Major Playe rs in t he Oncology Marke t
9.1 Amgen
9.2 Ariad Pharmaceutical
9.3 ASTELLAS PHARMA
9.4 AstraZeneca
9.5 Bayer healthcare pharmaceuticals
9.6 Boehringer IngelheimPDFmyURL lets you convert a complete website to PDF automatically!
9.7 Bristol-Myers Squibb
9.8 Celgene
9.9 Eisai Co., Ltd.
9.10 Eli Lilly & Co
9.11 ImClone Systems Inc. (a subsidiary of Eli Lilly & Co)
9.12 Exelixis
9.13 GlaxoSmithKline
9.14 Merck & Co
9.15 Millennium Pharmaceuticals (Subsidiary of Takeda Oncology Company)
9.16 Novartis Pharmaceuticals
9.17 Onyx Pharmaceuticals
9.18 Pfizer Inc.
9.19 Roche
9.20 Sanofi
9.21 Teva Pharmaceuticals Industries
Chapt e r 10 Expe rt OpinionChapt e r 10 Expe rt Opinion
10.1 Dr John Marshall, Clinical Director of Oncology, Georgetown University Hospital
10.2 Dr Anderson Ryan, Senior Group Leader at Gray Institute of Radiation, Oncology and Biology, at
the University of Oxford
10.3 Dr Ben Anderson, Professor of Surgery at the University of Washington & Chair of the Breast
Health Global Init iative
PDFmyURL lets you convert a complete website to PDF automatically!
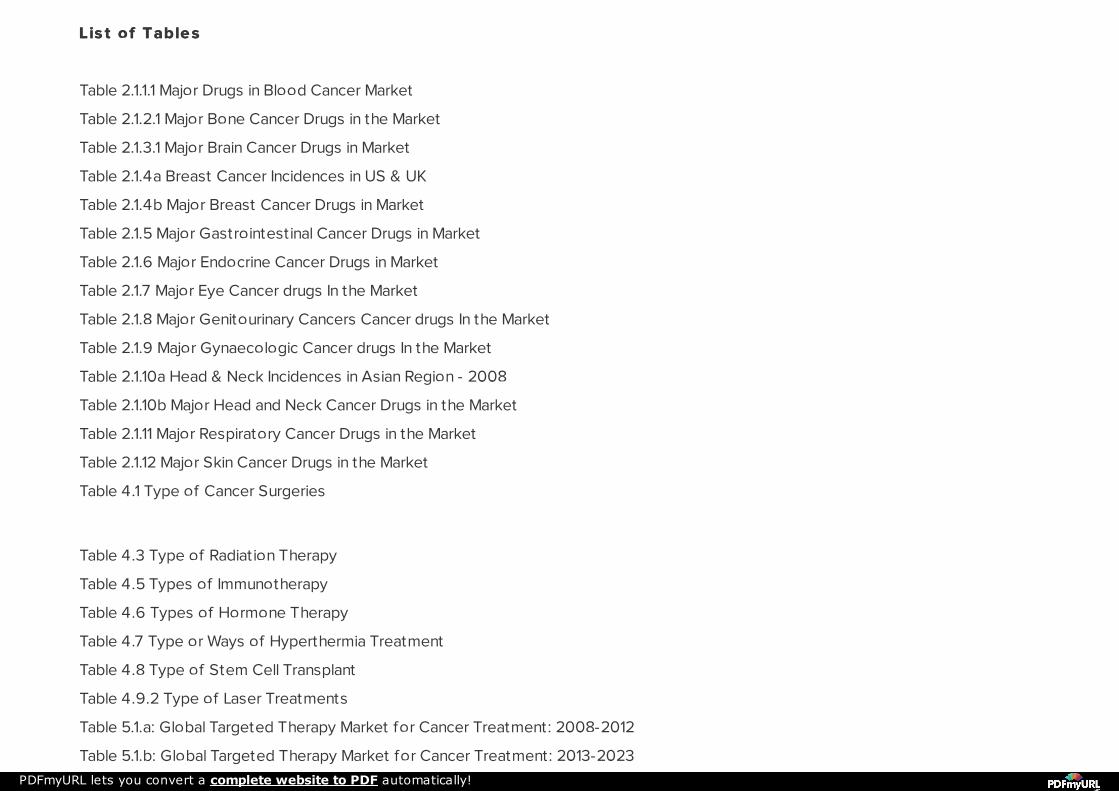
Lis t o f Table sL is t o f Table s
Table 2.1.1.1 Major Drugs in Blood Cancer Market
Table 2.1.2.1 Major Bone Cancer Drugs in the Market
Table 2.1.3.1 Major Brain Cancer Drugs in Market
Table 2.1.4a Breast Cancer Incidences in US & UK
Table 2.1.4b Major Breast Cancer Drugs in Market
Table 2.1.5 Major Gastrointestinal Cancer Drugs in Market
Table 2.1.6 Major Endocrine Cancer Drugs in Market
Table 2.1.7 Major Eye Cancer drugs In the Market
Table 2.1.8 Major Genitourinary Cancers Cancer drugs In the Market
Table 2.1.9 Major Gynaecologic Cancer drugs In the Market
Table 2.1.10a Head & Neck Incidences in Asian Region - 2008
Table 2.1.10b Major Head and Neck Cancer Drugs in the Market
Table 2.1.11 Major Respiratory Cancer Drugs in the Market
Table 2.1.12 Major Skin Cancer Drugs in the Market
Table 4.1 Type of Cancer Surgeries
Table 4.3 Type of Radiation Therapy
Table 4.5 Types of Immunotherapy
Table 4.6 Types of Hormone Therapy
Table 4.7 Type or Ways of Hyperthermia Treatment
Table 4.8 Type of Stem Cell Transplant
Table 4.9.2 Type of Laser Treatments
Table 5.1.a: Global Targeted Therapy Market for Cancer Treatment: 2008-2012
Table 5.1.b: Global Targeted Therapy Market for Cancer Treatment: 2013-2023PDFmyURL lets you convert a complete website to PDF automatically!
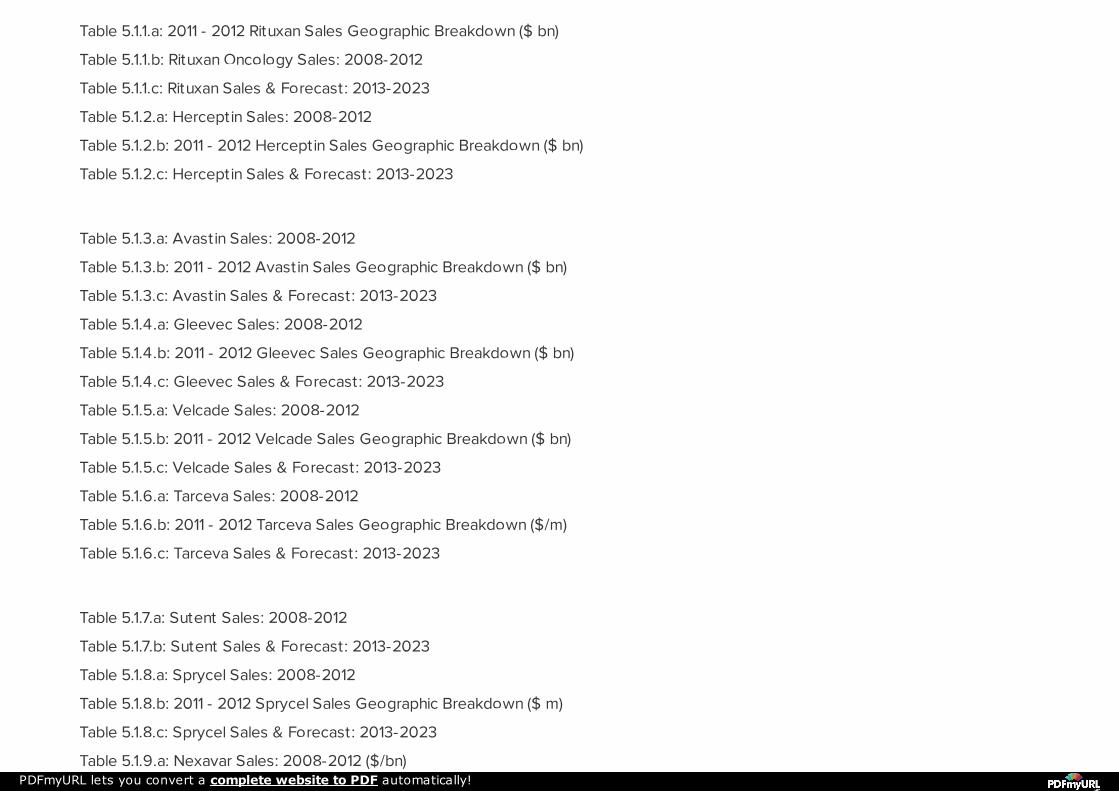
Table 5.1.1.a: 2011 - 2012 Rituxan Sales Geographic Breakdown ($ bn)
Table 5.1.1.b: Rituxan Oncology Sales: 2008-2012
Table 5.1.1.c: Rituxan Sales & Forecast: 2013-2023
Table 5.1.2.a: Herceptin Sales: 2008-2012
Table 5.1.2.b: 2011 - 2012 Herceptin Sales Geographic Breakdown ($ bn)
Table 5.1.2.c: Herceptin Sales & Forecast: 2013-2023
Table 5.1.3.a: Avastin Sales: 2008-2012
Table 5.1.3.b: 2011 - 2012 Avastin Sales Geographic Breakdown ($ bn)
Table 5.1.3.c: Avastin Sales & Forecast: 2013-2023
Table 5.1.4.a: Gleevec Sales: 2008-2012
Table 5.1.4.b: 2011 - 2012 Gleevec Sales Geographic Breakdown ($ bn)
Table 5.1.4.c: Gleevec Sales & Forecast: 2013-2023
Table 5.1.5.a: Velcade Sales: 2008-2012
Table 5.1.5.b: 2011 - 2012 Velcade Sales Geographic Breakdown ($ bn)
Table 5.1.5.c: Velcade Sales & Forecast: 2013-2023
Table 5.1.6.a: Tarceva Sales: 2008-2012
Table 5.1.6.b: 2011 - 2012 Tarceva Sales Geographic Breakdown ($/m)
Table 5.1.6.c: Tarceva Sales & Forecast: 2013-2023
Table 5.1.7.a: Sutent Sales: 2008-2012
Table 5.1.7.b: Sutent Sales & Forecast: 2013-2023
Table 5.1.8.a: Sprycel Sales: 2008-2012
Table 5.1.8.b: 2011 - 2012 Sprycel Sales Geographic Breakdown ($ m)
Table 5.1.8.c: Sprycel Sales & Forecast: 2013-2023
Table 5.1.9.a: Nexavar Sales: 2008-2012 ($/bn)PDFmyURL lets you convert a complete website to PDF automatically!
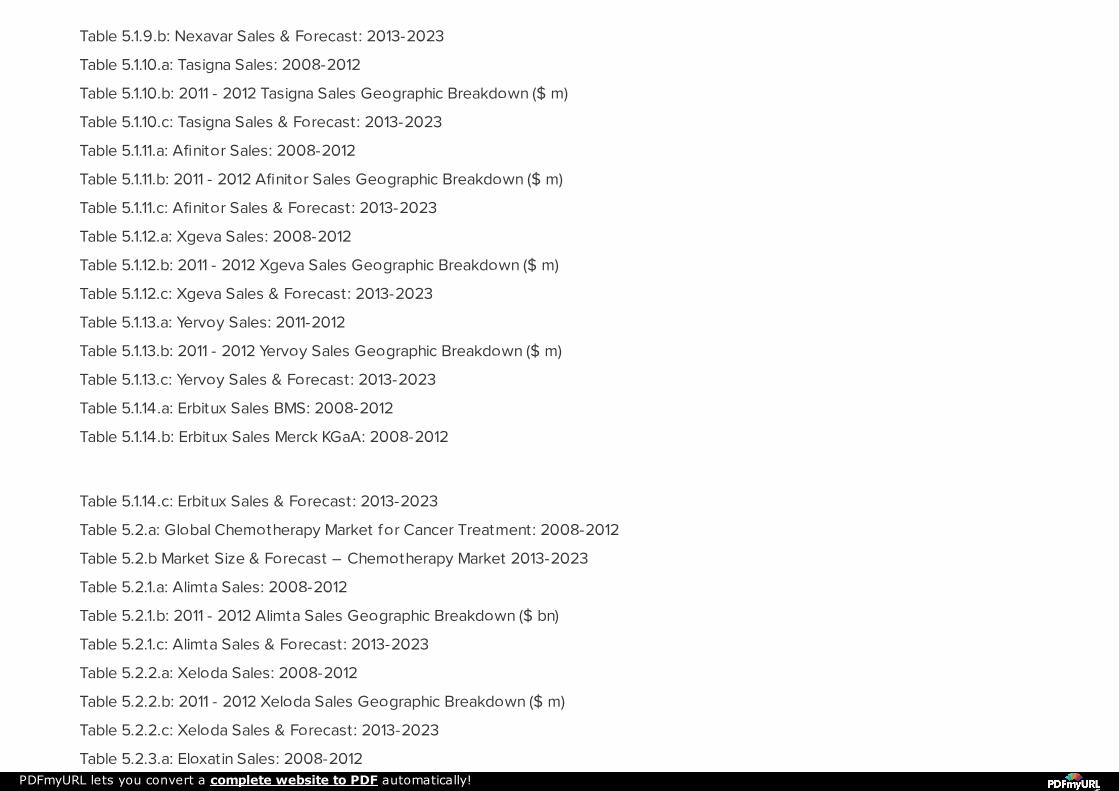
Table 5.1.9.b: Nexavar Sales & Forecast: 2013-2023
Table 5.1.10.a: Tasigna Sales: 2008-2012
Table 5.1.10.b: 2011 - 2012 Tasigna Sales Geographic Breakdown ($ m)
Table 5.1.10.c: Tasigna Sales & Forecast: 2013-2023
Table 5.1.11.a: Afinitor Sales: 2008-2012
Table 5.1.11.b: 2011 - 2012 Afinitor Sales Geographic Breakdown ($ m)
Table 5.1.11.c: Afinitor Sales & Forecast: 2013-2023
Table 5.1.12.a: Xgeva Sales: 2008-2012
Table 5.1.12.b: 2011 - 2012 Xgeva Sales Geographic Breakdown ($ m)
Table 5.1.12.c: Xgeva Sales & Forecast: 2013-2023
Table 5.1.13.a: Yervoy Sales: 2011-2012
Table 5.1.13.b: 2011 - 2012 Yervoy Sales Geographic Breakdown ($ m)
Table 5.1.13.c: Yervoy Sales & Forecast: 2013-2023
Table 5.1.14.a: Erbitux Sales BMS: 2008-2012
Table 5.1.14.b: Erbitux Sales Merck KGaA: 2008-2012
Table 5.1.14.c: Erbitux Sales & Forecast: 2013-2023
Table 5.2.a: Global Chemotherapy Market for Cancer Treatment: 2008-2012
Table 5.2.b Market Size & Forecast – Chemotherapy Market 2013-2023
Table 5.2.1.a: Alimta Sales: 2008-2012
Table 5.2.1.b: 2011 - 2012 Alimta Sales Geographic Breakdown ($ bn)
Table 5.2.1.c: Alimta Sales & Forecast: 2013-2023
Table 5.2.2.a: Xeloda Sales: 2008-2012
Table 5.2.2.b: 2011 - 2012 Xeloda Sales Geographic Breakdown ($ m)
Table 5.2.2.c: Xeloda Sales & Forecast: 2013-2023
Table 5.2.3.a: Eloxatin Sales: 2008-2012PDFmyURL lets you convert a complete website to PDF automatically!
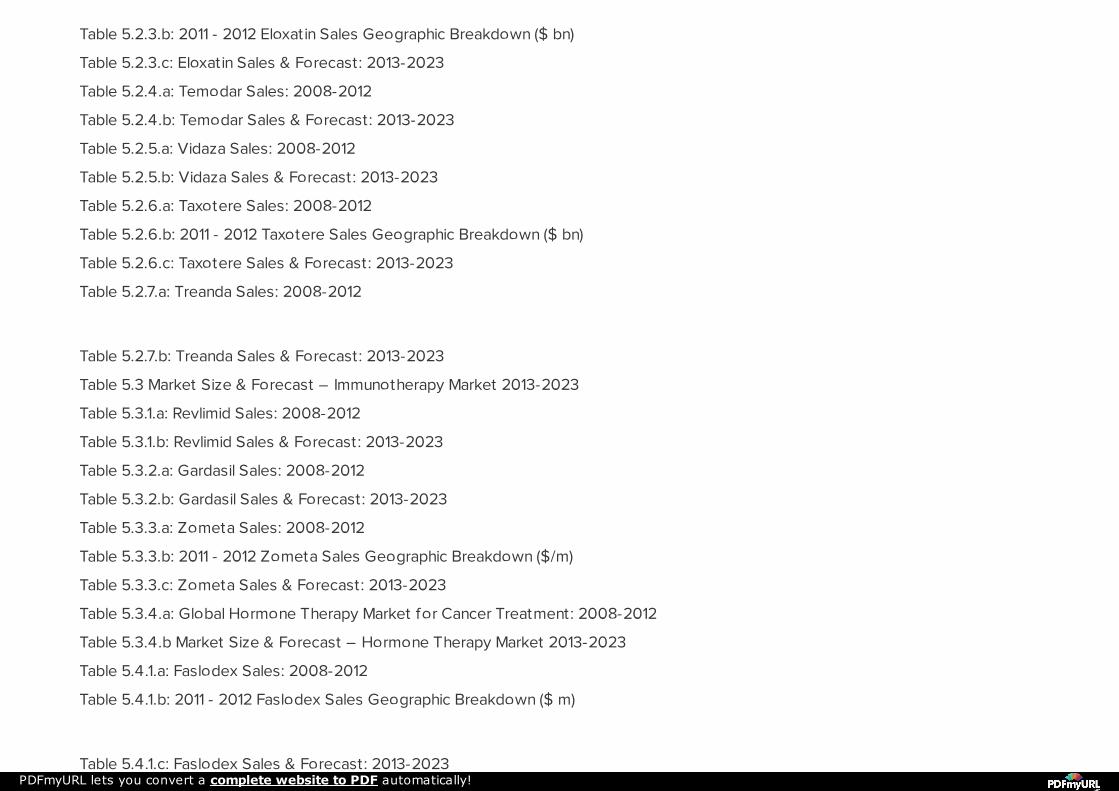
Table 5.2.3.b: 2011 - 2012 Eloxatin Sales Geographic Breakdown ($ bn)
Table 5.2.3.c: Eloxatin Sales & Forecast: 2013-2023
Table 5.2.4.a: Temodar Sales: 2008-2012
Table 5.2.4.b: Temodar Sales & Forecast: 2013-2023
Table 5.2.5.a: Vidaza Sales: 2008-2012
Table 5.2.5.b: Vidaza Sales & Forecast: 2013-2023
Table 5.2.6.a: Taxotere Sales: 2008-2012
Table 5.2.6.b: 2011 - 2012 Taxotere Sales Geographic Breakdown ($ bn)
Table 5.2.6.c: Taxotere Sales & Forecast: 2013-2023
Table 5.2.7.a: Treanda Sales: 2008-2012
Table 5.2.7.b: Treanda Sales & Forecast: 2013-2023
Table 5.3 Market Size & Forecast – Immunotherapy Market 2013-2023
Table 5.3.1.a: Revlimid Sales: 2008-2012
Table 5.3.1.b: Revlimid Sales & Forecast: 2013-2023
Table 5.3.2.a: Gardasil Sales: 2008-2012
Table 5.3.2.b: Gardasil Sales & Forecast: 2013-2023
Table 5.3.3.a: Zometa Sales: 2008-2012
Table 5.3.3.b: 2011 - 2012 Zometa Sales Geographic Breakdown ($/m)
Table 5.3.3.c: Zometa Sales & Forecast: 2013-2023
Table 5.3.4.a: Global Hormone Therapy Market for Cancer Treatment: 2008-2012
Table 5.3.4.b Market Size & Forecast – Hormone Therapy Market 2013-2023
Table 5.4.1.a: Faslodex Sales: 2008-2012
Table 5.4.1.b: 2011 - 2012 Faslodex Sales Geographic Breakdown ($ m)
Table 5.4.1.c: Faslodex Sales & Forecast: 2013-2023PDFmyURL lets you convert a complete website to PDF automatically!
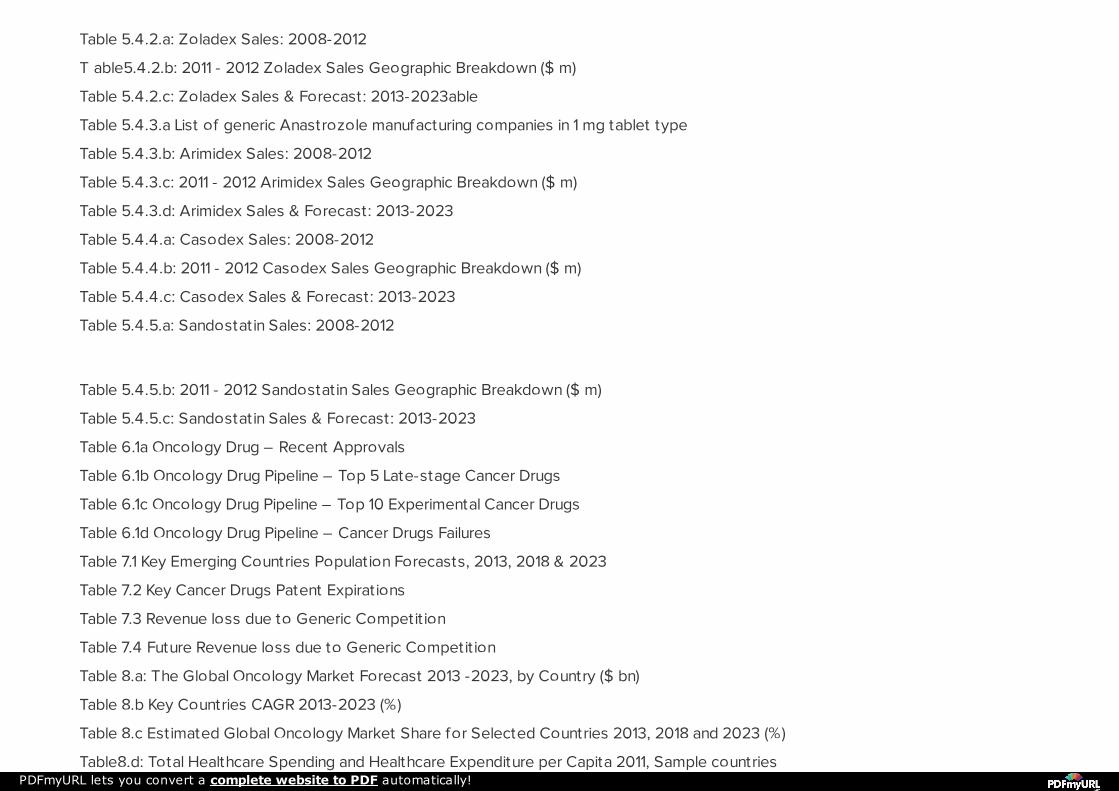
Table 5.4.2.a: Zoladex Sales: 2008-2012
T able5.4.2.b: 2011 - 2012 Zoladex Sales Geographic Breakdown ($ m)
Table 5.4.2.c: Zoladex Sales & Forecast: 2013-2023able
Table 5.4.3.a List of generic Anastrozole manufacturing companies in 1 mg tablet type
Table 5.4.3.b: Arimidex Sales: 2008-2012
Table 5.4.3.c: 2011 - 2012 Arimidex Sales Geographic Breakdown ($ m)
Table 5.4.3.d: Arimidex Sales & Forecast: 2013-2023
Table 5.4.4.a: Casodex Sales: 2008-2012
Table 5.4.4.b: 2011 - 2012 Casodex Sales Geographic Breakdown ($ m)
Table 5.4.4.c: Casodex Sales & Forecast: 2013-2023
Table 5.4.5.a: Sandostatin Sales: 2008-2012
Table 5.4.5.b: 2011 - 2012 Sandostatin Sales Geographic Breakdown ($ m)
Table 5.4.5.c: Sandostatin Sales & Forecast: 2013-2023
Table 6.1a Oncology Drug – Recent Approvals
Table 6.1b Oncology Drug Pipeline – Top 5 Late-stage Cancer Drugs
Table 6.1c Oncology Drug Pipeline – Top 10 Experimental Cancer Drugs
Table 6.1d Oncology Drug Pipeline – Cancer Drugs Failures
Table 7.1 Key Emerging Countries Population Forecasts, 2013, 2018 & 2023
Table 7.2 Key Cancer Drugs Patent Expirations
Table 7.3 Revenue loss due to Generic Competit ion
Table 7.4 Future Revenue loss due to Generic Competit ion
Table 8.a: The Global Oncology Market Forecast 2013 -2023, by Country ($ bn)
Table 8.b Key Countries CAGR 2013-2023 (%)
Table 8.c Estimated Global Oncology Market Share for Selected Countries 2013, 2018 and 2023 (%)
Table8.d: Total Healthcare Spending and Healthcare Expenditure per Capita 2011, Sample countriesPDFmyURL lets you convert a complete website to PDF automatically!
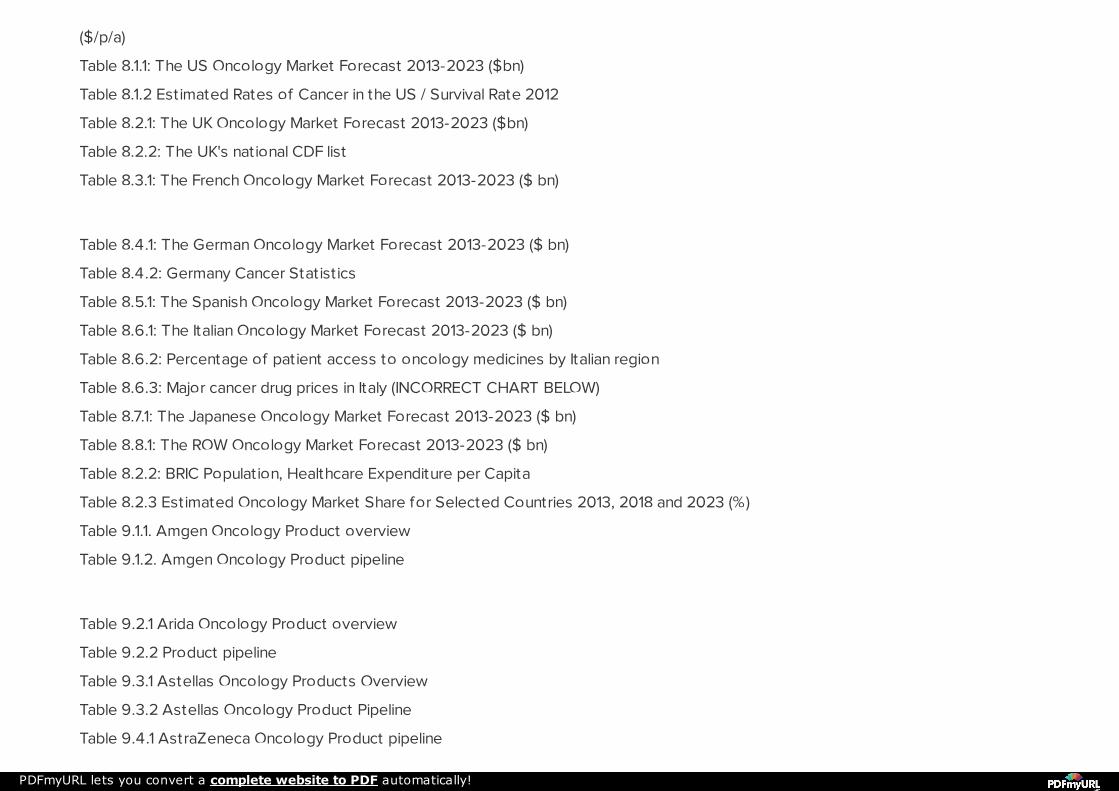
($/p/a)
Table 8.1.1: The US Oncology Market Forecast 2013-2023 ($bn)
Table 8.1.2 Estimated Rates of Cancer in the US / Survival Rate 2012
Table 8.2.1: The UK Oncology Market Forecast 2013-2023 ($bn)
Table 8.2.2: The UK's national CDF list
Table 8.3.1: The French Oncology Market Forecast 2013-2023 ($ bn)
Table 8.4.1: The German Oncology Market Forecast 2013-2023 ($ bn)
Table 8.4.2: Germany Cancer Statistics
Table 8.5.1: The Spanish Oncology Market Forecast 2013-2023 ($ bn)
Table 8.6.1: The Italian Oncology Market Forecast 2013-2023 ($ bn)
Table 8.6.2: Percentage of patient access to oncology medicines by Italian region
Table 8.6.3: Major cancer drug prices in Italy (INCORRECT CHART BELOW)
Table 8.7.1: The Japanese Oncology Market Forecast 2013-2023 ($ bn)
Table 8.8.1: The ROW Oncology Market Forecast 2013-2023 ($ bn)
Table 8.2.2: BRIC Population, Healthcare Expenditure per Capita
Table 8.2.3 Estimated Oncology Market Share for Selected Countries 2013, 2018 and 2023 (%)
Table 9.1.1. Amgen Oncology Product overview
Table 9.1.2. Amgen Oncology Product pipeline
Table 9.2.1 Arida Oncology Product overview
Table 9.2.2 Product pipeline
Table 9.3.1 Astellas Oncology Products Overview
Table 9.3.2 Astellas Oncology Product Pipeline
Table 9.4.1 AstraZeneca Oncology Product pipeline
PDFmyURL lets you convert a complete website to PDF automatically!
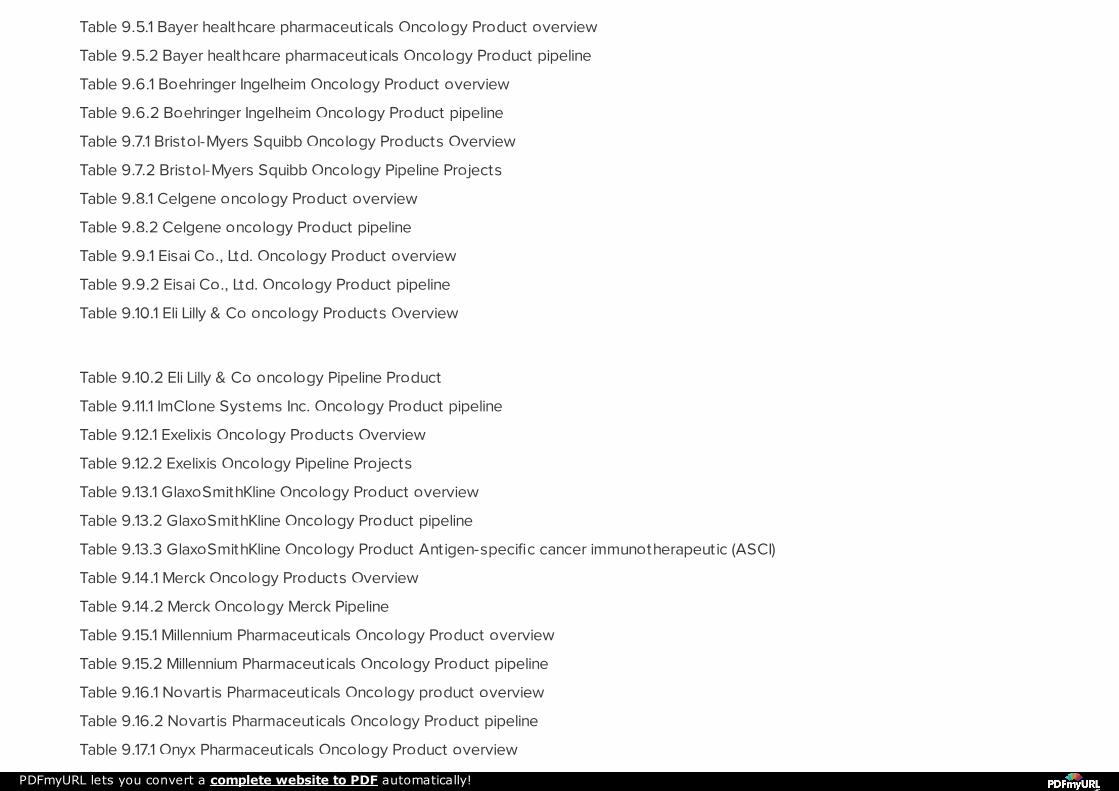
Table 9.5.1 Bayer healthcare pharmaceuticals Oncology Product overview
Table 9.5.2 Bayer healthcare pharmaceuticals Oncology Product pipeline
Table 9.6.1 Boehringer Ingelheim Oncology Product overview
Table 9.6.2 Boehringer Ingelheim Oncology Product pipeline
Table 9.7.1 Bristol-Myers Squibb Oncology Products Overview
Table 9.7.2 Bristol-Myers Squibb Oncology Pipeline Projects
Table 9.8.1 Celgene oncology Product overview
Table 9.8.2 Celgene oncology Product pipeline
Table 9.9.1 Eisai Co., Ltd. Oncology Product overview
Table 9.9.2 Eisai Co., Ltd. Oncology Product pipeline
Table 9.10.1 Eli Lilly & Co oncology Products Overview
Table 9.10.2 Eli Lilly & Co oncology Pipeline Product
Table 9.11.1 ImClone Systems Inc. Oncology Product pipeline
Table 9.12.1 Exelixis Oncology Products Overview
Table 9.12.2 Exelixis Oncology Pipeline Projects
Table 9.13.1 GlaxoSmithKline Oncology Product overview
Table 9.13.2 GlaxoSmithKline Oncology Product pipeline
Table 9.13.3 GlaxoSmithKline Oncology Product Antigen-specific cancer immunotherapeutic (ASCI)
Table 9.14.1 Merck Oncology Products Overview
Table 9.14.2 Merck Oncology Merck Pipeline
Table 9.15.1 Millennium Pharmaceuticals Oncology Product overview
Table 9.15.2 Millennium Pharmaceuticals Oncology Product pipeline
Table 9.16.1 Novartis Pharmaceuticals Oncology product overview
Table 9.16.2 Novartis Pharmaceuticals Oncology Product pipeline
Table 9.17.1 Onyx Pharmaceuticals Oncology Product overview
PDFmyURL lets you convert a complete website to PDF automatically!
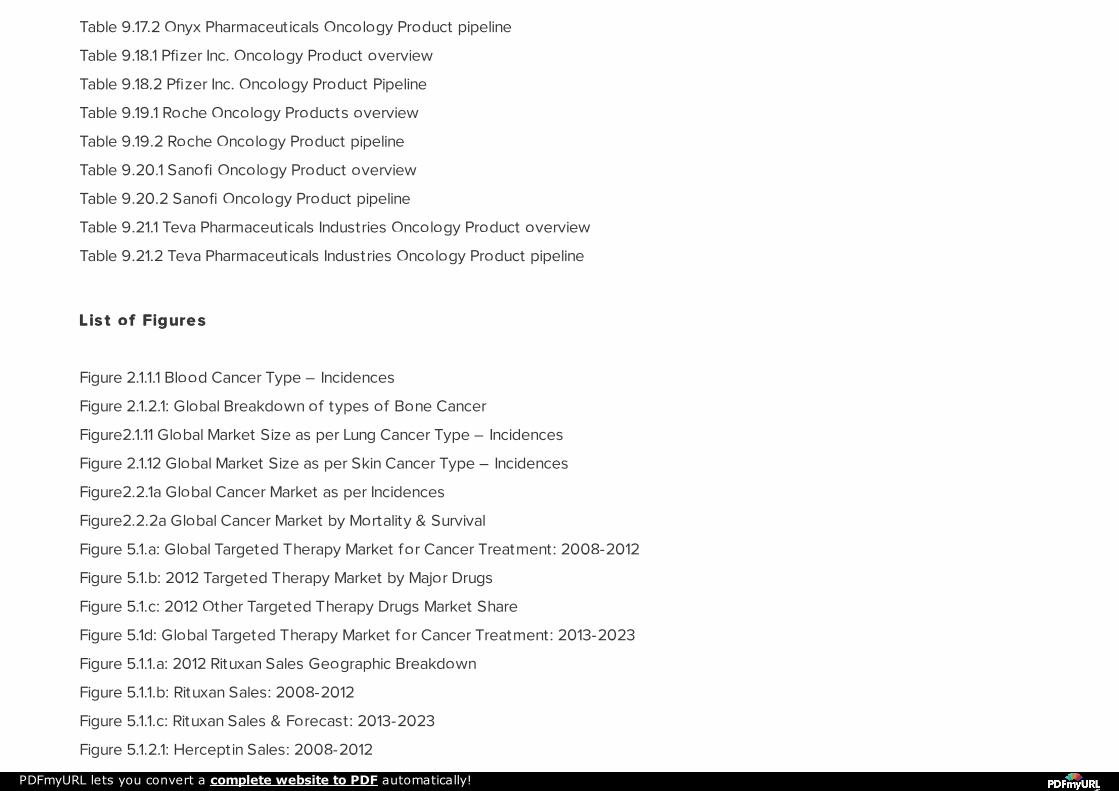
Table 9.17.2 Onyx Pharmaceuticals Oncology Product pipeline
Table 9.18.1 Pfizer Inc. Oncology Product overview
Table 9.18.2 Pfizer Inc. Oncology Product Pipeline
Table 9.19.1 Roche Oncology Products overview
Table 9.19.2 Roche Oncology Product pipeline
Table 9.20.1 Sanofi Oncology Product overview
Table 9.20.2 Sanofi Oncology Product pipeline
Table 9.21.1 Teva Pharmaceuticals Industries Oncology Product overview
Table 9.21.2 Teva Pharmaceuticals Industries Oncology Product pipeline
Lis t o f Figure sL is t o f Figure s
Figure 2.1.1.1 Blood Cancer Type – Incidences
Figure 2.1.2.1: Global Breakdown of types of Bone Cancer
Figure2.1.11 Global Market Size as per Lung Cancer Type – Incidences
Figure 2.1.12 Global Market Size as per Skin Cancer Type – Incidences
Figure2.2.1a Global Cancer Market as per Incidences
Figure2.2.2a Global Cancer Market by Mortality & Survival
Figure 5.1.a: Global Targeted Therapy Market for Cancer Treatment: 2008-2012
Figure 5.1.b: 2012 Targeted Therapy Market by Major Drugs
Figure 5.1.c: 2012 Other Targeted Therapy Drugs Market Share
Figure 5.1d: Global Targeted Therapy Market for Cancer Treatment: 2013-2023
Figure 5.1.1.a: 2012 Rituxan Sales Geographic Breakdown
Figure 5.1.1.b: Rituxan Sales: 2008-2012
Figure 5.1.1.c: Rituxan Sales & Forecast: 2013-2023
Figure 5.1.2.1: Herceptin Sales: 2008-2012
PDFmyURL lets you convert a complete website to PDF automatically!
Figure 5.1.2.2: 2012 Herceptin Sales Geographic Breakdown
Figure 5.1.2.3: Herceptin Sales & Forecast: 2013-2023
Figure 5.1.3.1: Avastin Sales: 2008-2012
Figure 5.1.3.2: 2012 Avastin Sales Geographic Breakdown
Figure 5.1.3.3: Avastin Sales & Forecast: 2013-2023
Figure 5.1.4.1: Gleevec Sales: 2008-2012
Companie s me nt ione d in t his re port ;Companie s me nt ione d in t his re port ;
Actavis
Alkem Laboratories Ltd
Ambrilia Biopharma
Amgen Inc.
Ariad Pharmaceuticals
ArQule
Astellas Pharma
Astex Pharmaceuticals
AstraZeneca
Bayer
Biocon
Biogen
BioXpress
Bristol-Myers Squibb
Cadila Healthcare
Cambridge UniversityPDFmyURL lets you convert a complete website to PDF automatically!
Cancer Research Technology Limited
Celgene
Cell Therapeutics Inc.
Celltrion
Celon Labs
Chugai
Chugai Pharmaceutical
Cipla Limited
Daiichi Sankyo Company, Limited
Debiopharm
Eisai Inc.
Eli Lilly
Fludara
Fujifilm
Fujisawa Pharmaceutical Company Ltd
Genentech
Genmab
Gilead Sciences
GlaxoSmithKline
Glenmark Pharmaceuticals Ltd
ImClone LLC
Janssen Pharmaceuticals, Inc.
Johnson & Johnson
Kyowa Hakko Kirin
PDFmyURL lets you convert a complete website to PDF automatically!
Lupin Laboratories Ltd
Lyka Labs Limited
Medicare Remedies Pvt Ltd
Merck & Co., Inc.
Micromet, Inc.
Millennium Pharmaceuticals
Miracalus Pharma Pvt Ltd
Mylan
National Institute for Health and Clinical Excellence
Neon Laboratories Ltd
Newcastle University
Northern Institute for Cancer Research
Novartis
Onconova Therapeutics
Ono Pharmaceutical
Onyx Pharmaceutical
Otsuka Pharmaceuticals
Oxford BioMedica
Oxford University
Pfizer Inc.
Pharmacyclics
Plexxikon Inc.
Regeneron Pharmaceuticals
Roche
Sanofi-AventisPDFmyURL lets you convert a complete website to PDF automatically!
Seattle Genetics
Sun Pharmaceutical Industries Ltd
SuperGen
Synthon
Taj Pharmaceuticals Ltd
Takeda
Teva Pharmaceuticals
UCLA
Yamanouchi Pharmaceutical Company Ltd
Zenyaku Kogyo Co. Ltd
To orde r t his re port : To orde r t his re port : T he Cance r Drugs & Tre at me nt s Marke t - Dat a, Analys is &T he Cance r Drugs & Tre at me nt s Marke t - Dat a, Analys is &
Fore cas t s t o 20 23'Fore cas t s t o 20 23'
ht t p ://www.re port linke r.com/p0 1889 380 /T he - Cance r- Drugs - - Tre at me nt s - Marke t -ht t p ://www.re port linke r.com/p0 1889 380 /T he - Cance r- Drugs - - Tre at me nt s - Marke t -
- - Dat a- Analys is - - Fore cas t s - t o -- - Dat a- Analys is - - Fore cas t s - t o -
20 23'.ht ml#ut m_s ource =prne ws wire & ut m_me dium=pr& ut m_campaign=Drug_and_Me dicat ion20 23'.ht ml#ut m_s ource =prne ws wire & ut m_me dium=pr& ut m_campaign=Drug_and_Me dicat ion
____________________________________________________
Cont act Clare : Cont act Clare : clare @ re port linke r.comclare @ re port linke r.com
US: (339 )- 36 8- 6 0 0 1US: (339 )- 36 8- 6 0 0 1
Int l: + 1 339 - 36 8- 6 0 0 1Int l: + 1 339 - 36 8- 6 0 0 1
SOURCE Reportlinker
PDFmyURL lets you convert a complete website to PDF automatically!
RELATED LINKS
http://www.reportlinker.com
Contact
888-776-0942from 8 AM - 10 PM ET
Chat Online with an ExpertContact Us
Solut ions
Cis ion Communication Cloud™For MarketersFor Public RelationsFor IR & ComplianceFor AgencyFor Small Bus inessAll Products
About
About PR NewswireAbout Cis ionBecome a Publishing PartnerBecome a Channel PartnerCareers Global Sites
My Services
All News ReleasesOnline Member CenterProfNet℠
Read More
DEC 16, 2016, 21:47 ET
Optometrists Global MarketBriefing 2017
DEC 16, 2016, 21:40 ET
Hospitals Global Market Briefing2017
DEC 16, 2016, 21:32 ET
Film And Video Distribut ion GlobalMarket Briefing 2017
PDFmyURL lets you convert a complete website to PDF automatically!
Te rms o f Us e Privacy Po licy Info rmatio n Se curity Po licy S tate me nt S ite MapRSS Fe e d s
Co p yrig ht © 2016 PR Ne ws wire As s o ciatio n LLC. All Rig hts Re s e rve d . A Cis io n co mp any.
PDFmyURL lets you convert a complete website to PDF automatically!