Embed Size (px)
Citation preview
The Capture of Morbidity Information in General Practice
Douglas FlemingDirector, RCGP, Birmingham Research UnitNottingham: July 20, 2005
Content of Presentation
History of morbidity surveys Purpose of morbidity surveys THE POTENTIAL OF ROUTINE
ELECTRONIC MEDICAL RECORDS FOR EPIDEMIOLOGY IN PRIMARY CARE
The Weekly Returns Service SELECTED RESULTS FROM
MORBIDITY SURVEYS
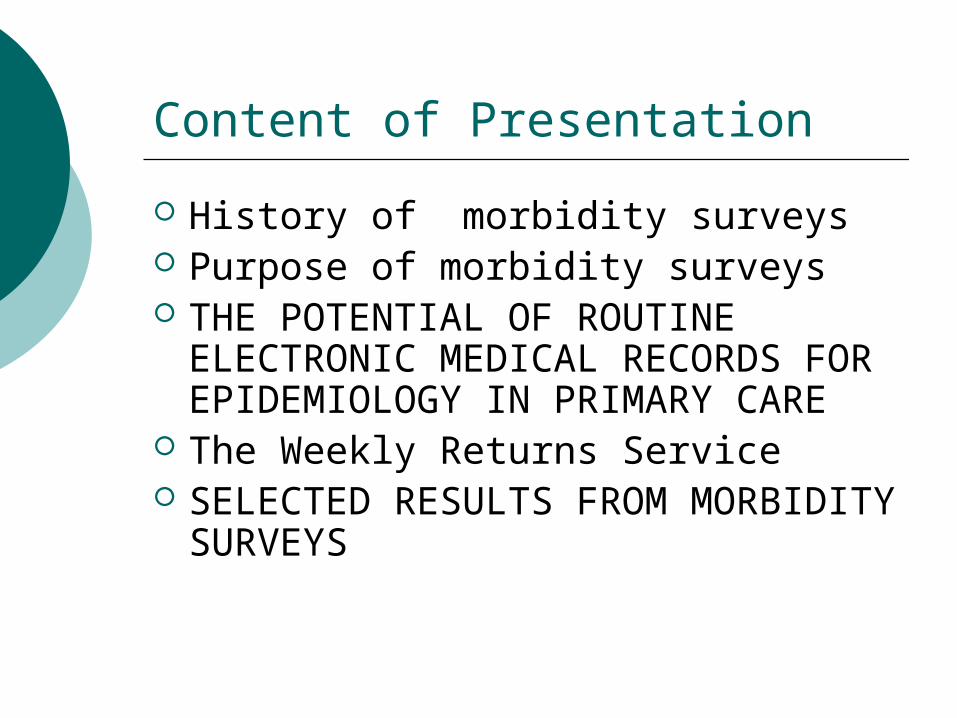
History of morbidity surveys
Deaths by cause 1851 William Farr: the establishment of the ICD-now version 10
1946 the London Sickness Survey 1956 The first national practice based
morbidity survey 1971/72 and on to 1976; 1981/82;
1991/92- the 2nd 3rd and 4th surveys Regular General Household surveys
since 1972
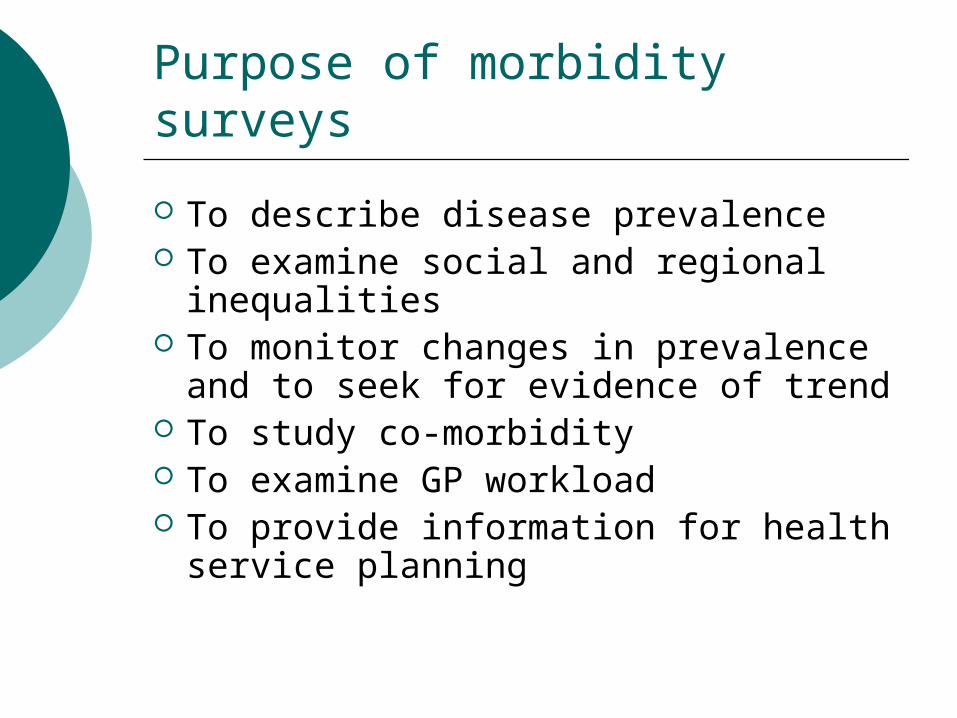
Purpose of morbidity surveys
To describe disease prevalence To examine social and regional
inequalities To monitor changes in prevalence
and to seek for evidence of trend To study co-morbidity To examine GP workload To provide information for health
service planning
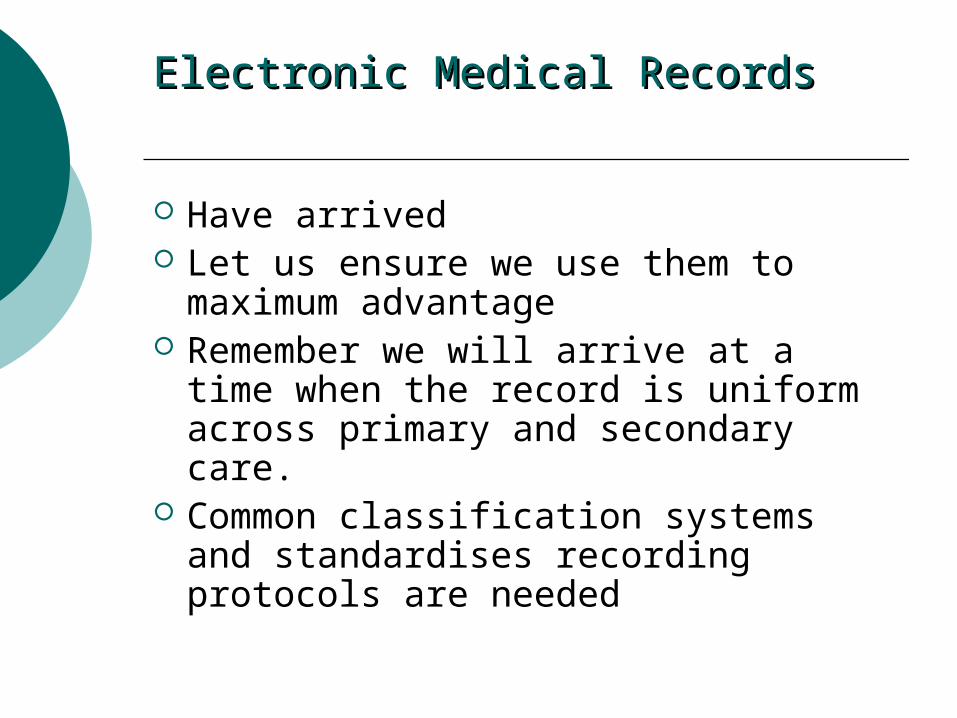
Electronic Medical RecordsElectronic Medical Records
Have arrived Let us ensure we use them to
maximum advantage Remember we will arrive at a time
when the record is uniform across primary and secondary care.
Common classification systems and standardises recording protocols are needed
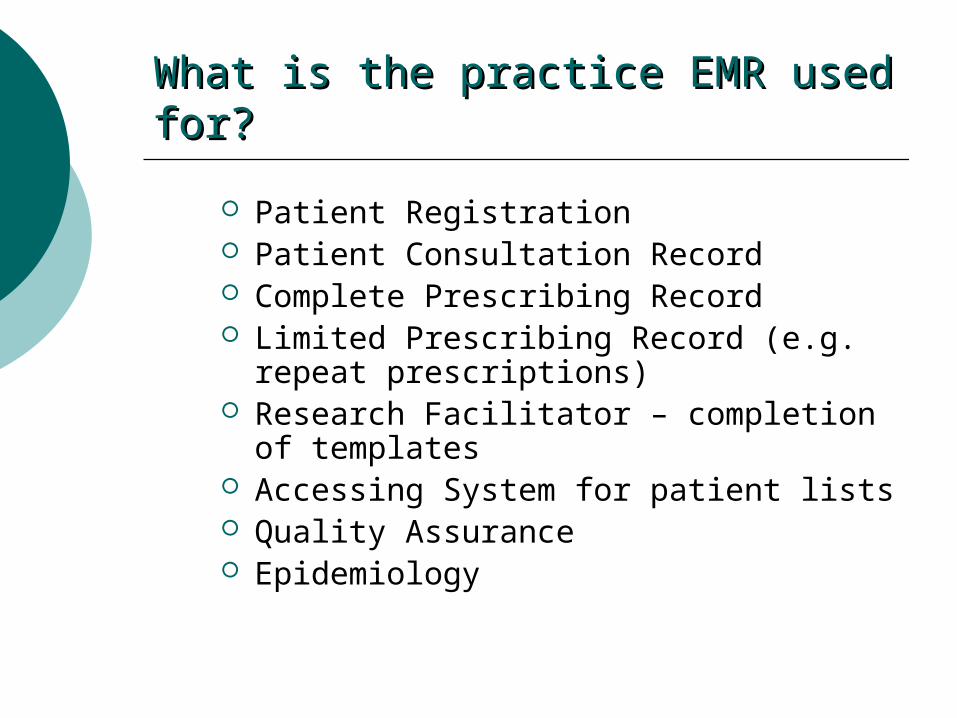
What is the practice EMR used for?What is the practice EMR used for?
Patient Registration Patient Consultation Record Complete Prescribing Record Limited Prescribing Record (e.g.
repeat prescriptions) Research Facilitator – completion of
templates Accessing System for patient lists Quality Assurance Epidemiology
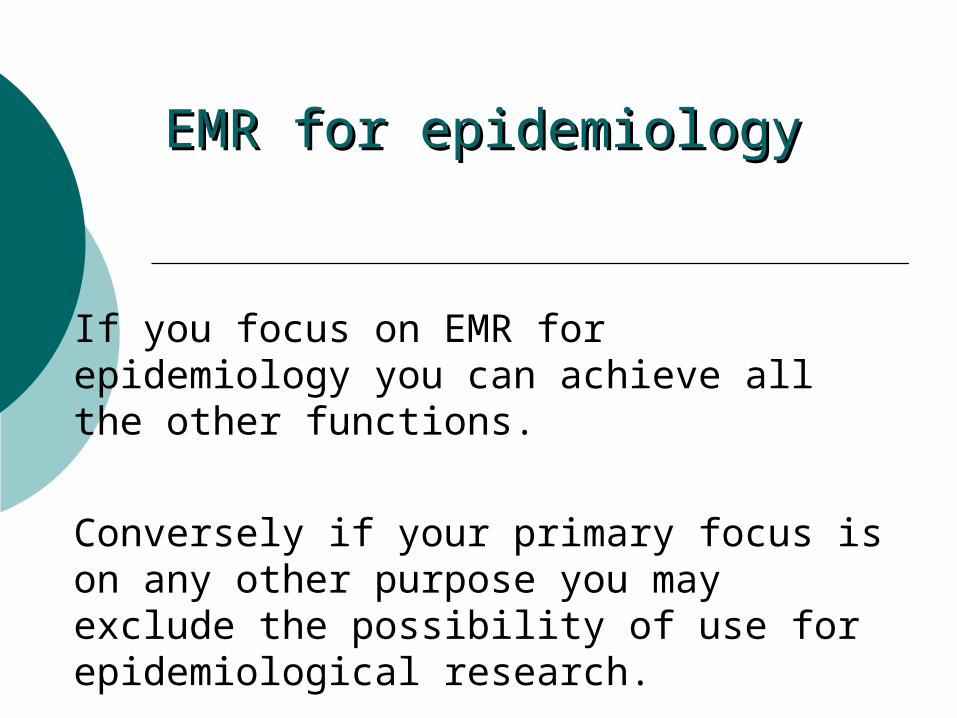
EMR for epidemiologyEMR for epidemiology
If you focus on EMR for epidemiology you can achieve all the other functions.
Conversely if your primary focus is on any other purpose you may exclude the possibility of use for epidemiological research.
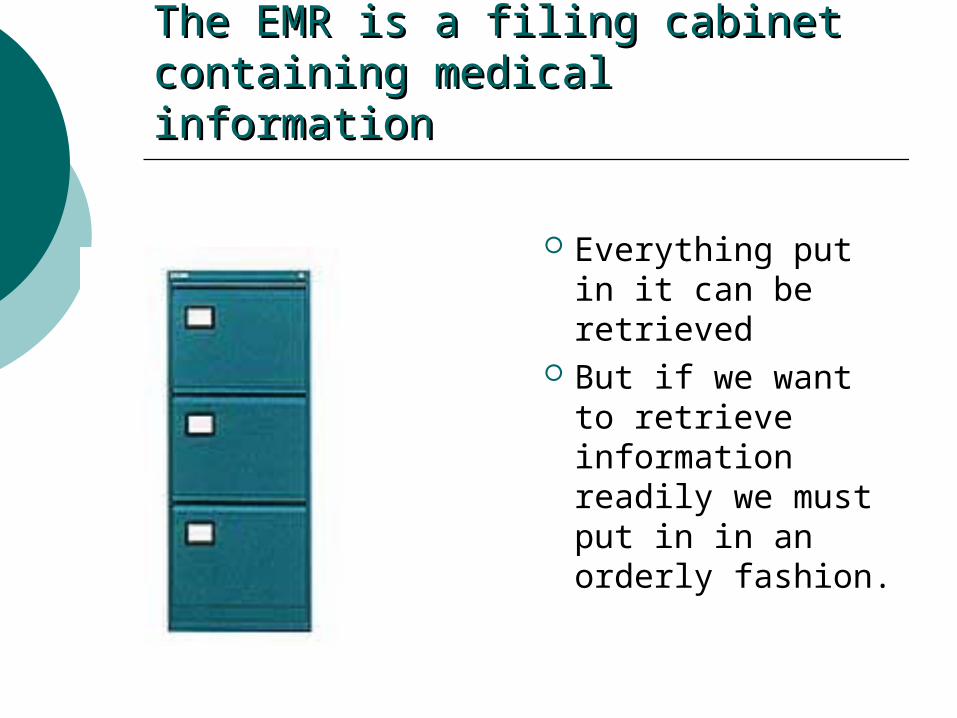
The EMR is a filing cabinet containing The EMR is a filing cabinet containing medical informationmedical information
Everything put in it can be retrieved
But if we want to retrieve information readily we must put in in an orderly fashion.
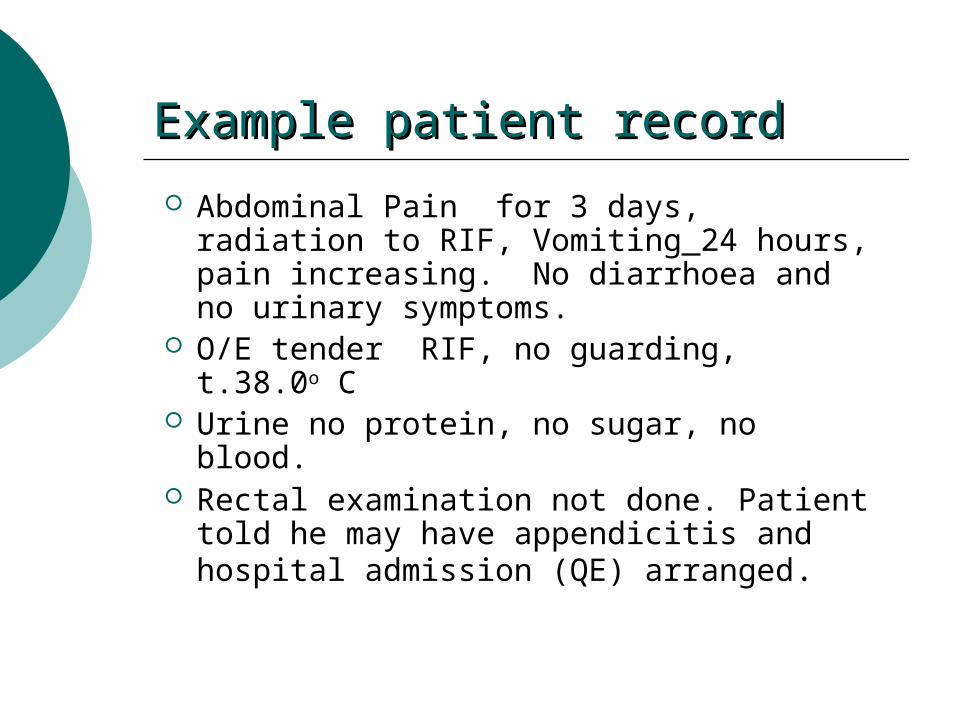
Example patient recordExample patient record
Abdominal Pain for 3 days, radiation to RIF, Vomiting 24 hours, pain increasing. No diarrhoea and no urinary symptoms.
O/E tender RIF, no guarding, t.38.0o C
Urine no protein, no sugar, no blood. Rectal examination not done. Patient
told he may have appendicitis and hospital admission (QE) arranged.
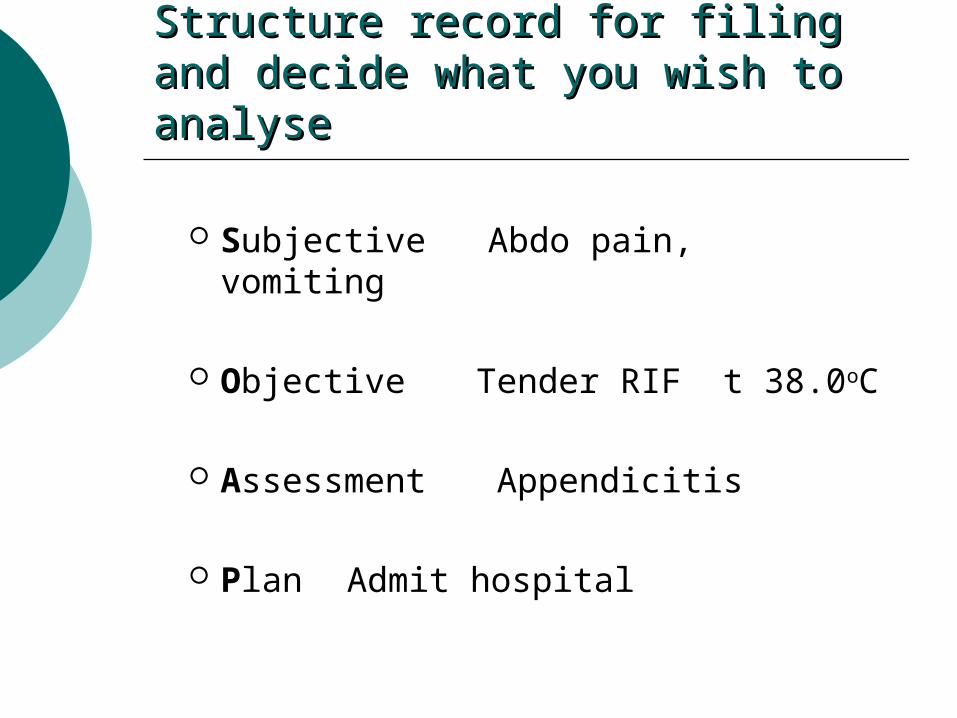
Structure record for filing and decide Structure record for filing and decide what you wish to analysewhat you wish to analyse
Subjective Abdo pain, vomiting
Objective Tender RIF t 38.0oC
Assessment Appendicitis
Plan Admit hospital
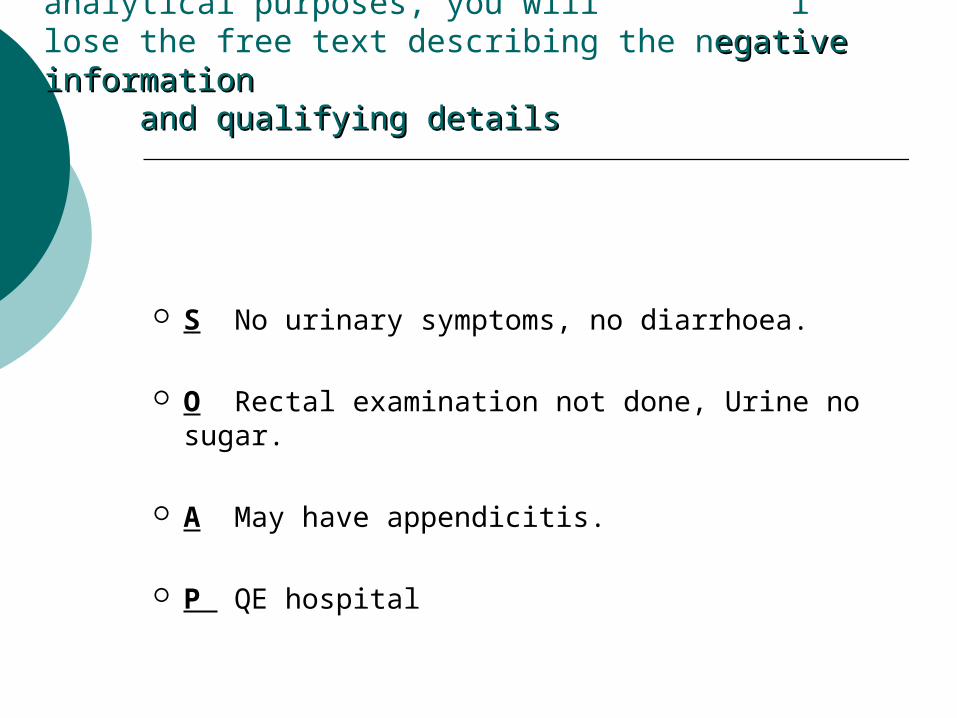
In structuring for filing, for analytical purposes, you will l lose the free text describing the negative information egative information and qualifying details and qualifying details
S No urinary symptoms, no diarrhoea.
O Rectal examination not done, Urine no sugar.
A May have appendicitis.
P QE hospital
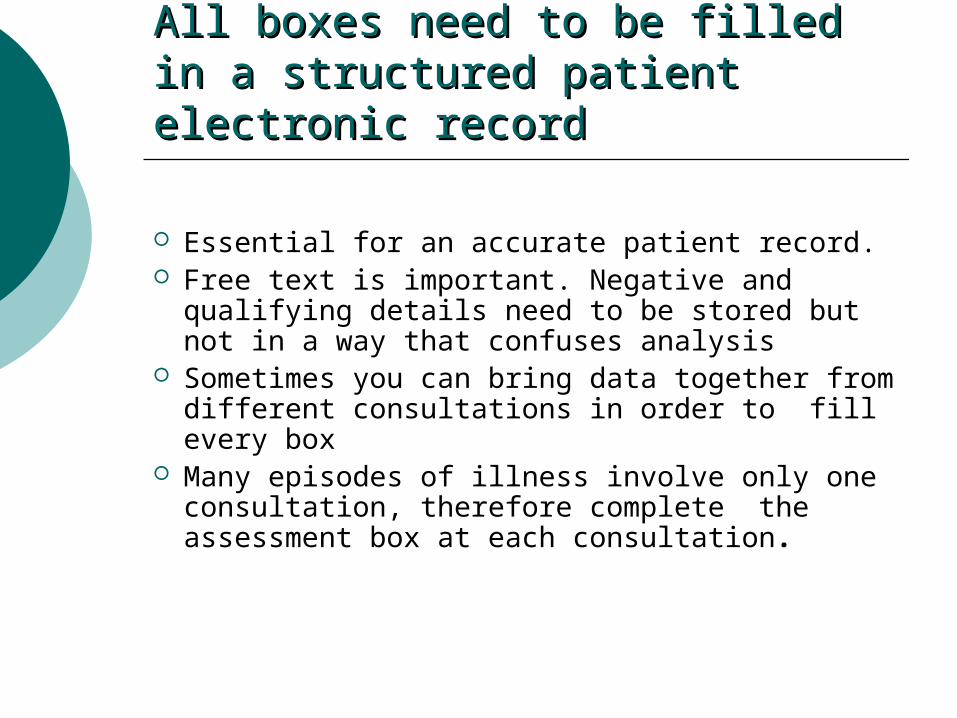
All boxes need to be filled in a All boxes need to be filled in a structured patient electronic recordstructured patient electronic record
Essential for an accurate patient record. Free text is important. Negative and
qualifying details need to be stored but not in a way that confuses analysis
Sometimes you can bring data together from different consultations in order to fill every box
Many episodes of illness involve only one consultation, therefore complete the assessment box at each consultation.
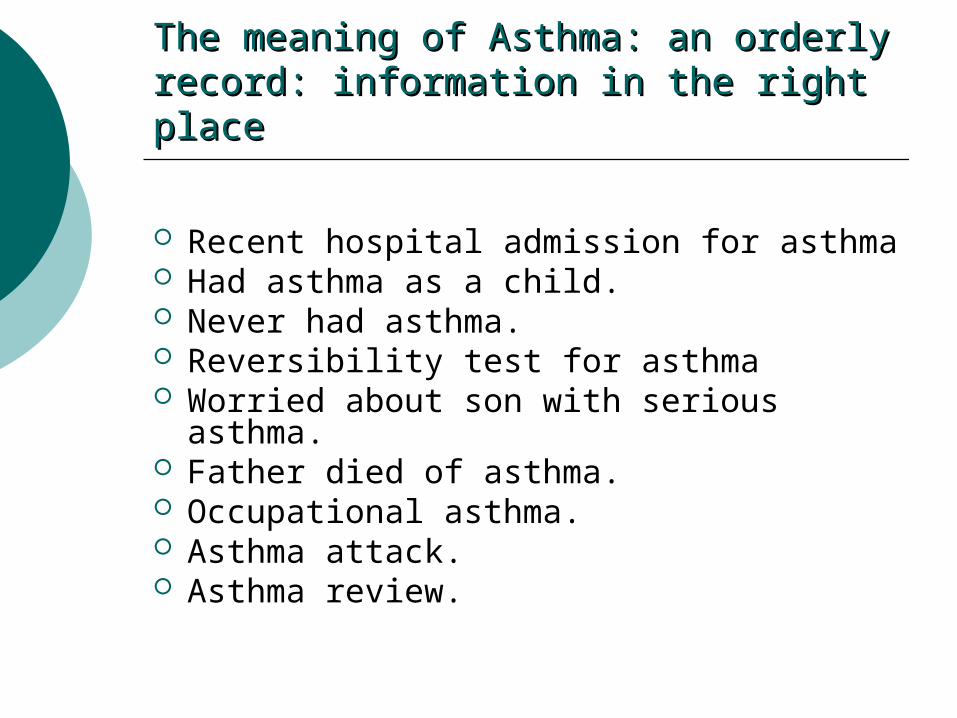
The meaning of Asthma: an orderly record: The meaning of Asthma: an orderly record: information in the right placeinformation in the right place
Recent hospital admission for asthma Had asthma as a child. Never had asthma. Reversibility test for asthma Worried about son with serious asthma. Father died of asthma. Occupational asthma. Asthma attack. Asthma review.

Who does the filing?Who does the filing?
The Classification System, but you must use it properly
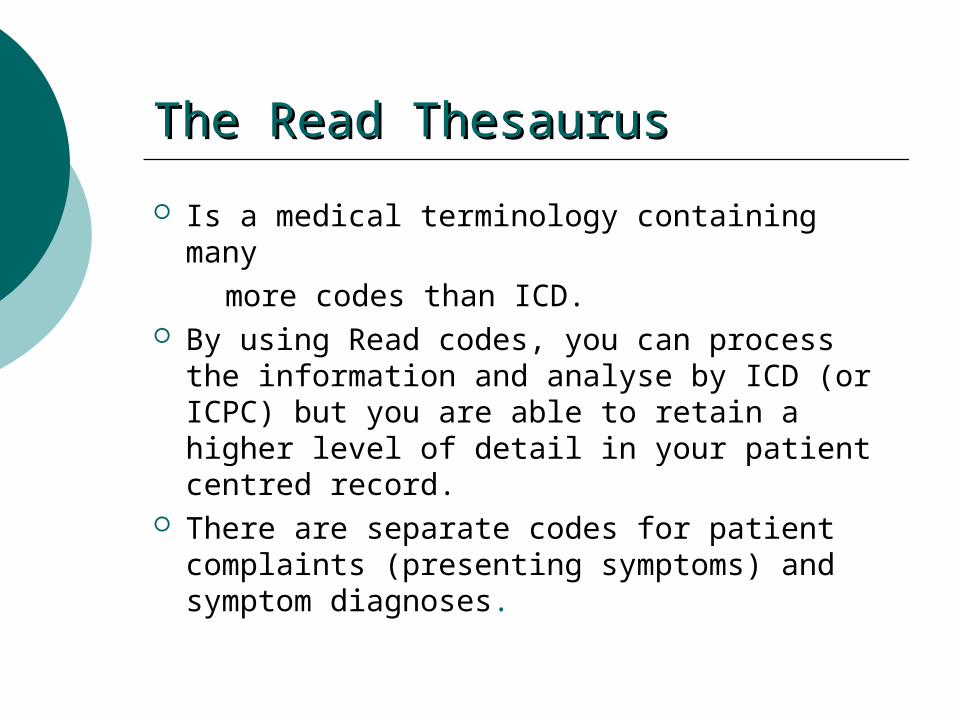
The Read ThesaurusThe Read Thesaurus
Is a medical terminology containing many more codes than ICD. By using Read codes, you can process the
information and analyse by ICD (or ICPC) but you are able to retain a higher level of detail in your patient centred record.
There are separate codes for patient complaints (presenting symptoms) and symptom diagnoses.
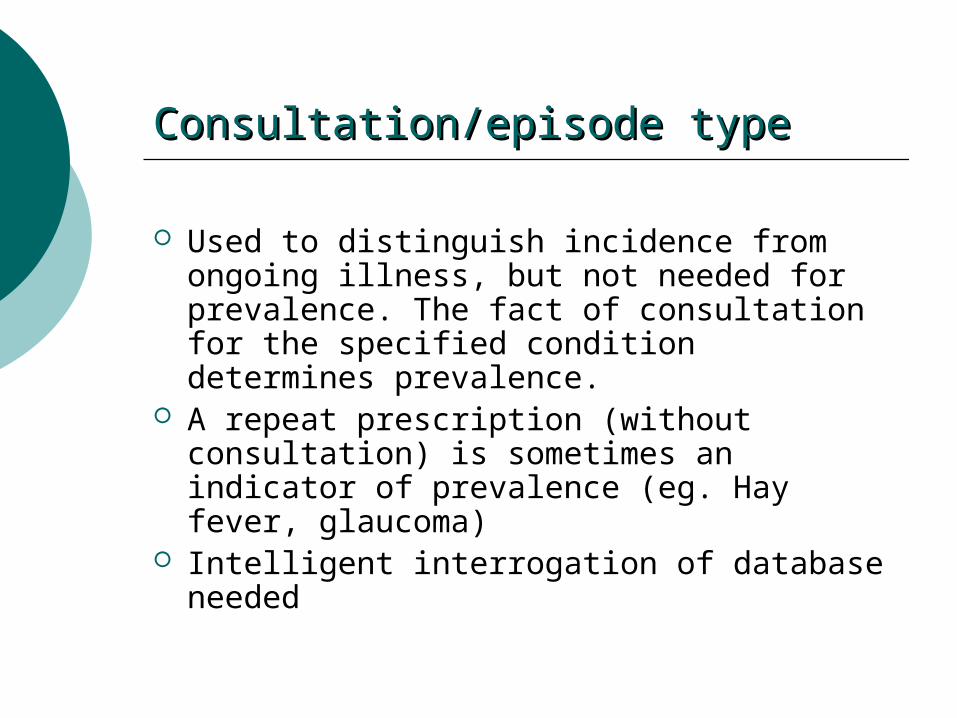
Consultation/episode typeConsultation/episode type
Used to distinguish incidence from ongoing illness, but not needed for prevalence. The fact of consultation for the specified condition determines prevalence.
A repeat prescription (without consultation) is sometimes an indicator of prevalence (eg. Hay fever, glaucoma)
Intelligent interrogation of database needed
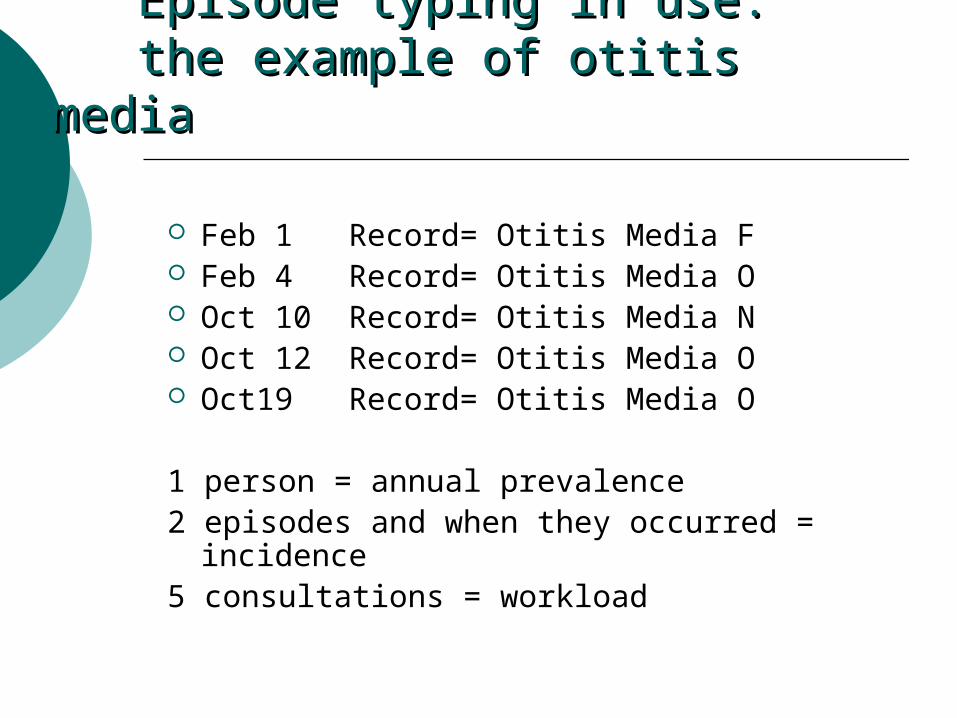
Episode typing in use:Episode typing in use: the example of otitis media the example of otitis media
Feb 1 Record= Otitis Media F Feb 4 Record= Otitis Media O Oct 10 Record= Otitis Media N Oct 12 Record= Otitis Media O Oct19 Record= Otitis Media O
1 person = annual prevalence 2 episodes and when they occurred =
incidence 5 consultations = workload
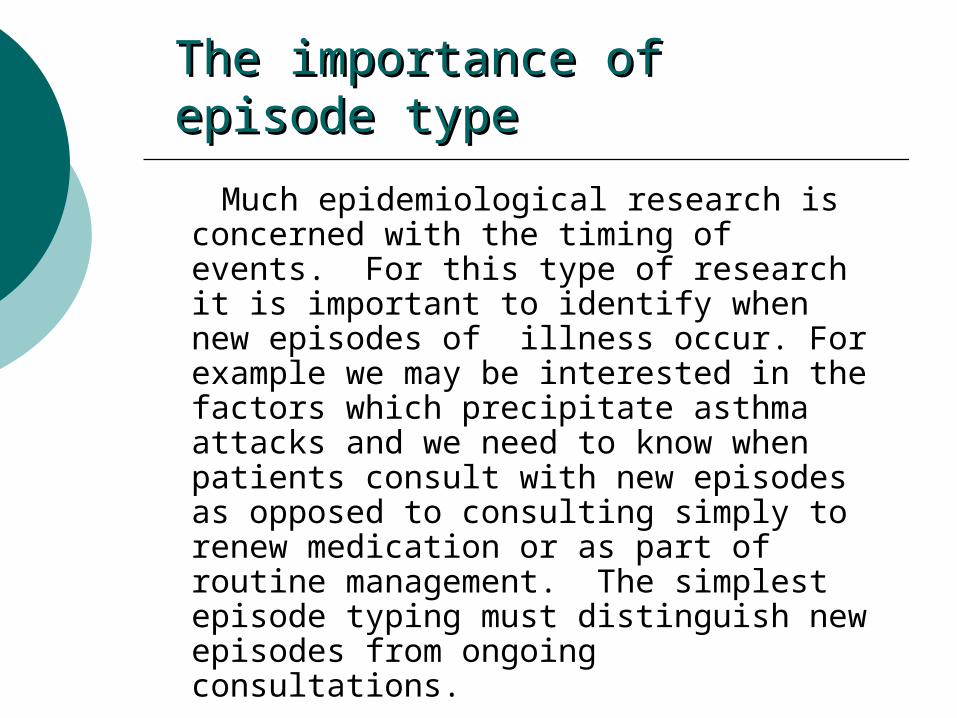
The importance of episode typeThe importance of episode type
Much epidemiological research is concerned with the timing of events. For this type of research it is important to identify when new episodes of illness occur. For example we may be interested in the factors which precipitate asthma attacks and we need to know when patients consult with new episodes as opposed to consulting simply to renew medication or as part of routine management. The simplest episode typing must distinguish new episodes from ongoing consultations.
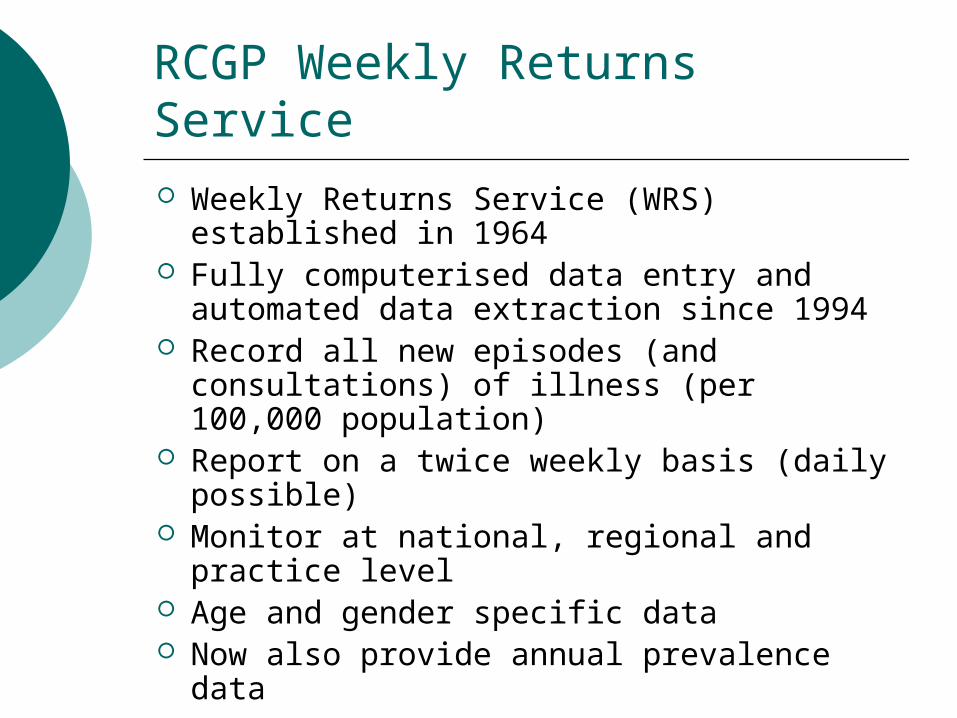
RCGP Weekly Returns Service
Weekly Returns Service (WRS) established in 1964
Fully computerised data entry and automated data extraction since 1994
Record all new episodes (and consultations) of illness (per 100,000 population)
Report on a twice weekly basis (daily possible)
Monitor at national, regional and practice level
Age and gender specific data Now also provide annual prevalence data
0
0.5
1
1.5
2
2.5
1 6 11 16 21 26 31 36 41 46 51
0
0.5
1
1.5
2
2.5
1 6 11 16 21 26 31 36 41 46 51
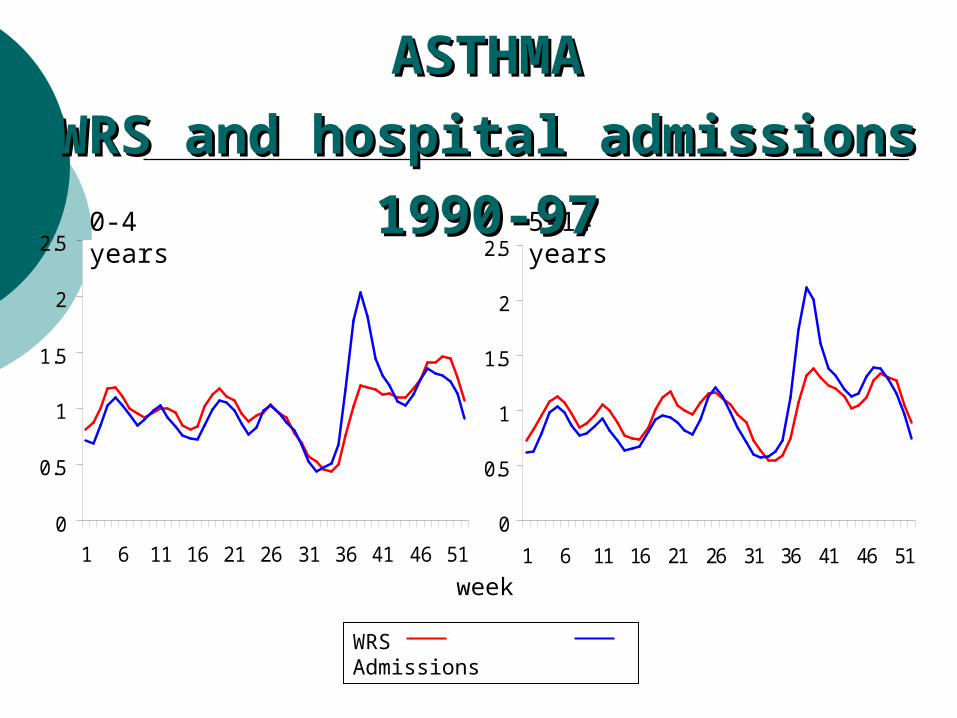
0-4 years 5-14 years
WRS Admissions
ASTHMAASTHMA
WRS and hospital admissions 1990-97WRS and hospital admissions 1990-97
week
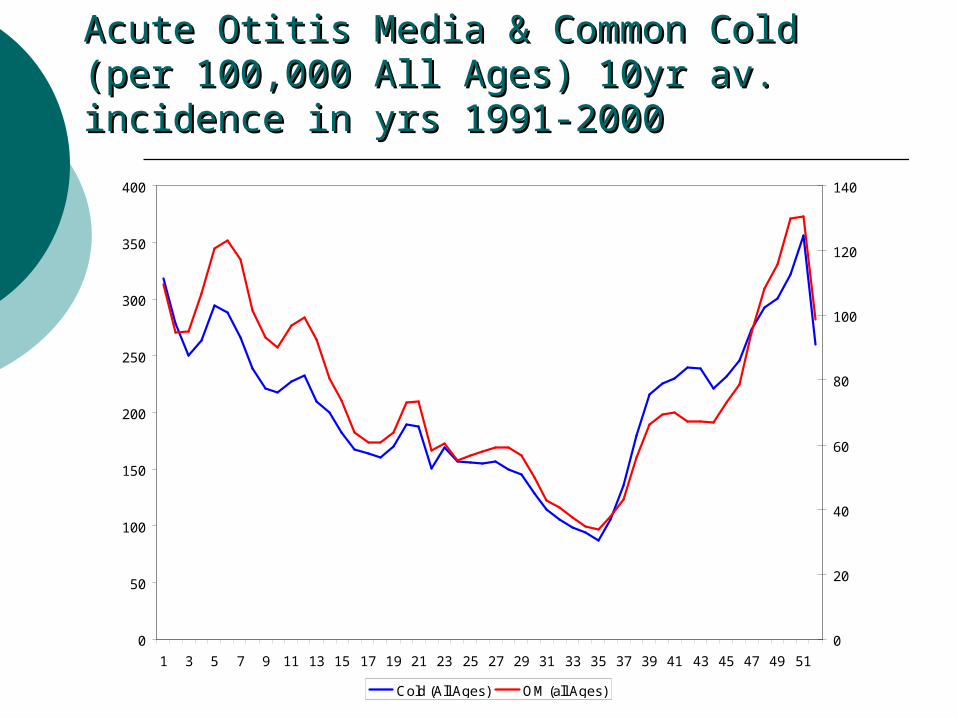
Acute Otitis Media & Common Cold (per Acute Otitis Media & Common Cold (per 100,000 All Ages) 10yr av. incidence in yrs 100,000 All Ages) 10yr av. incidence in yrs 1991-20001991-2000
0
50
100
150
200
250
300
350
400
1 3 5 7 9 11 13 15 17 19 21 23 25 27 29 31 33 35 37 39 41 43 45 47 49 51
0
20
40
60
80
100
120
140
Cold (All Ages) OM (all Ages)
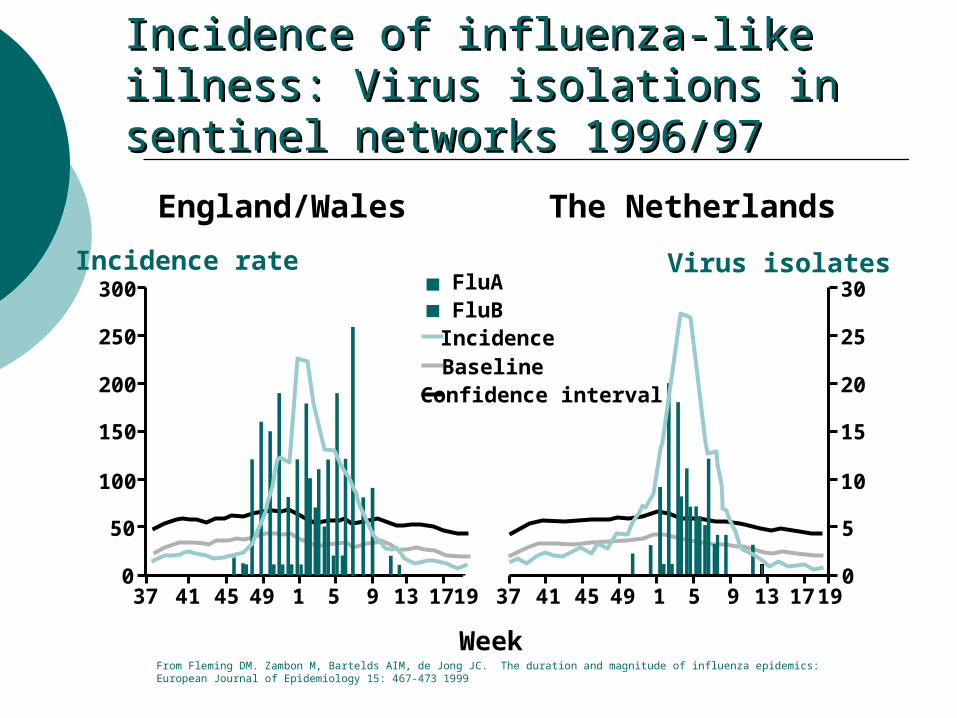
Incidence of influenza-like illness: Virus Incidence of influenza-like illness: Virus isolations in sentinel networks 1996/97isolations in sentinel networks 1996/97
England/Wales The Netherlands
0
Incidence rate Virus isolates
Week
37 41 45 49 1 5 9 13 1719
300
250
200
150
100
50
37 41 45 49 1 5 9 13 17 190
30
25
20
15
10
5
FluAFluBIncidenceBaselineConfidence interval
From Fleming DM. Zambon M, Bartelds AIM, de Jong JC. The duration and magnitude of influenza epidemics:European Journal of Epidemiology 15: 467-473 1999
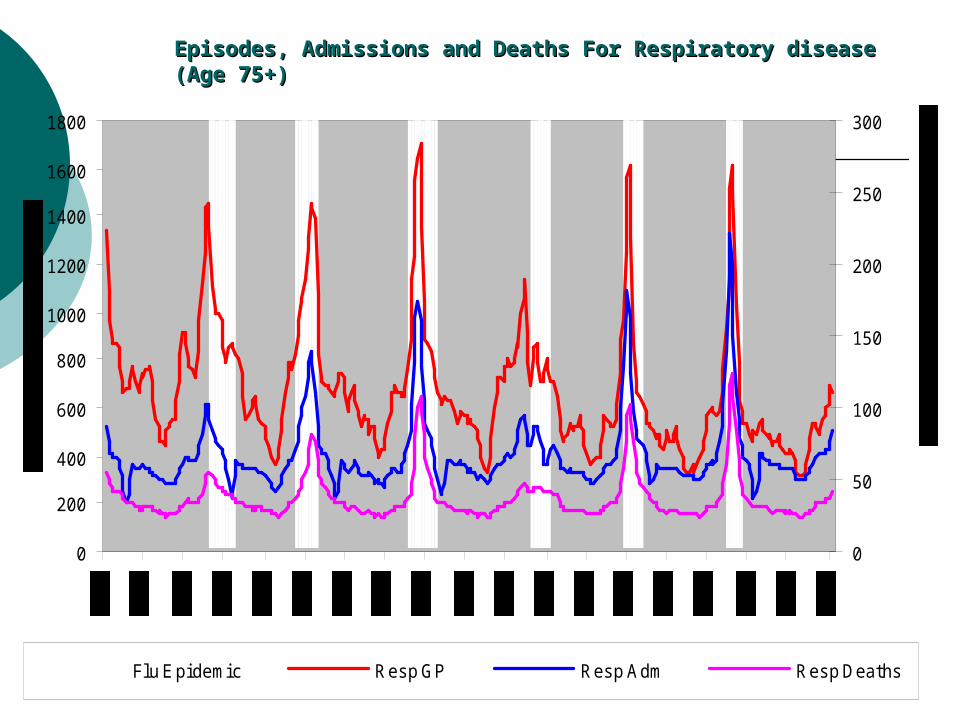
Episodes, Admissions and Deaths For Respiratory disease (Age 75+)Episodes, Admissions and Deaths For Respiratory disease (Age 75+)
0
200
400
600
800
1000
1200
1400
1600
1800
0
50
100
150
200
250
300
Flu E pidemic Resp GP Resp Adm Resp Deaths
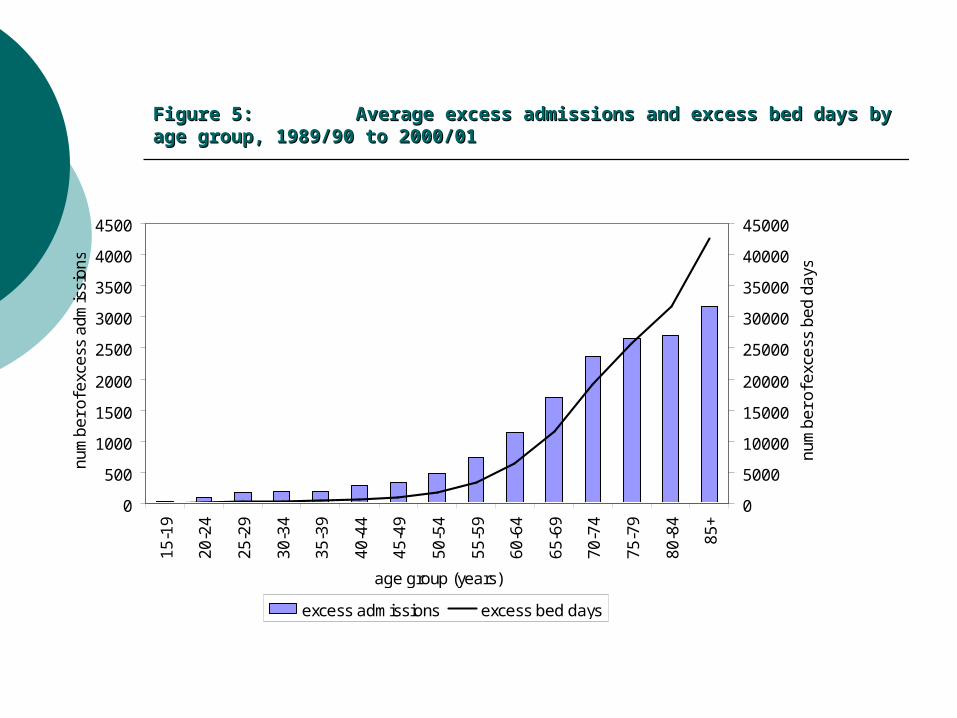
Figure 5: Figure 5: Average excess admissions and excess bed days by age group, 1989/90 Average excess admissions and excess bed days by age group, 1989/90 to 2000/01to 2000/01
0
500
1000
1500
2000
2500
3000
3500
4000
4500
15
-19
20
-24
25
-29
30
-34
35
-39
40
-44
45
-49
50
-54
55
-59
60
-64
65
-69
70
-74
75
-79
80
-84
85
+
age group (years)
nu
mb
er
of e
xce
ss a
dm
issi
on
s
0
5000
10000
15000
20000
25000
30000
35000
40000
45000
nu
mb
er
of e
xce
ss b
ed
da
ys
excess admissions excess bed days
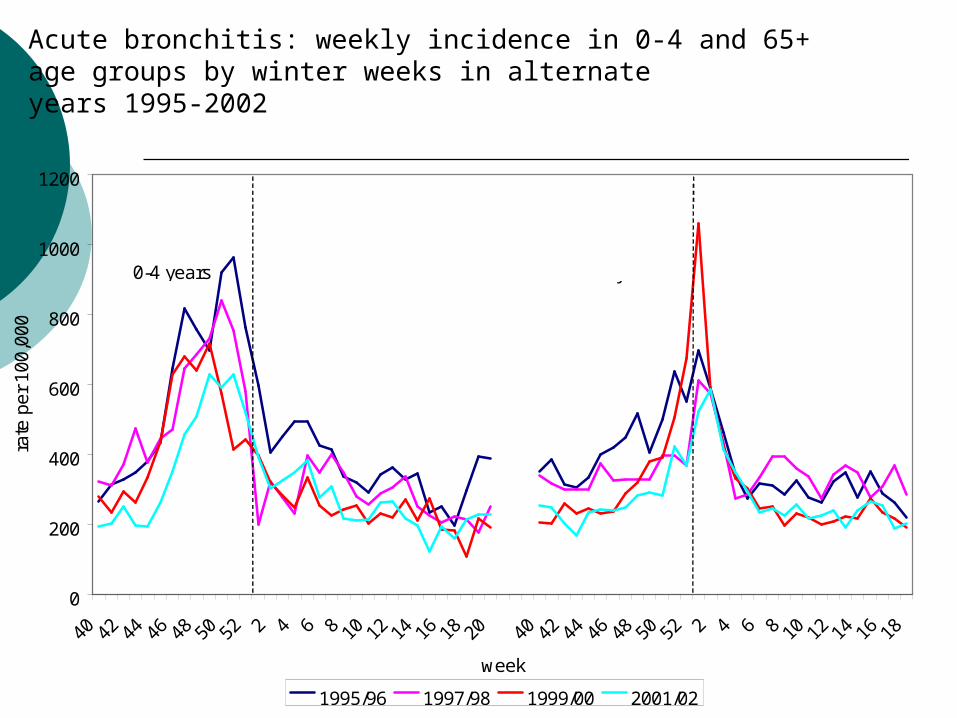
Acute bronchitis: weekly incidence in 0-4 and 65+age groups by winter weeks in alternateyears 1995-2002
0
200
400
600
800
1000
1200
40 42 44 46 48 50 52 2 4 6 8 10 12 14 16 18 20 40 42 44 46 48 50 52 2 4 6 8 10 12 14 16 18
week
rate
pe
r 1
00,0
00
1995/96 1997/98 1999/00 2001/02
0-4 years 65+ years
0
200
400
600
800
1000
1200
1400
40 42 44 46 48 50 52 2 4 6 8 10 12 14 16 18 20
w eek
RS
V r
epor
ts
0
200
400
600
800
1000
1200
1400
bron
chiti
s in
cide
nc r
ate
per
100,
000
0
200
400
600
800
1000
1200
1400
40 42 44 46 48 50 52 2 4 6 8 10 12 14 16 18 20
w eek
RS
V r
epor
ts
0
200
400
600
800
1000
1200
1400
bron
chiti
s in
cide
nce
rate
per
100
,000
RSV
Bronchitis
0
200
400
600
800
1000
1200
1400
40 42 44 46 48 50 52 2 4 6 8 10 12 14 16 18 20
w eek
RS
V r
epor
ts
0
200
400
600
800
1000
1200
1400br
onch
itis
inci
denc
e ra
te p
er 1
00,0
00
0
200
400
600
800
1000
1200
1400
40 42 44 46 48 50 52 2 4 6 8 10 12 14 16 18 20
w eek
RS
V r
epor
ts
0
200
400
600
800
1000
1200
1400
bron
chiti
s in
cide
nce
rate
per
100
,000
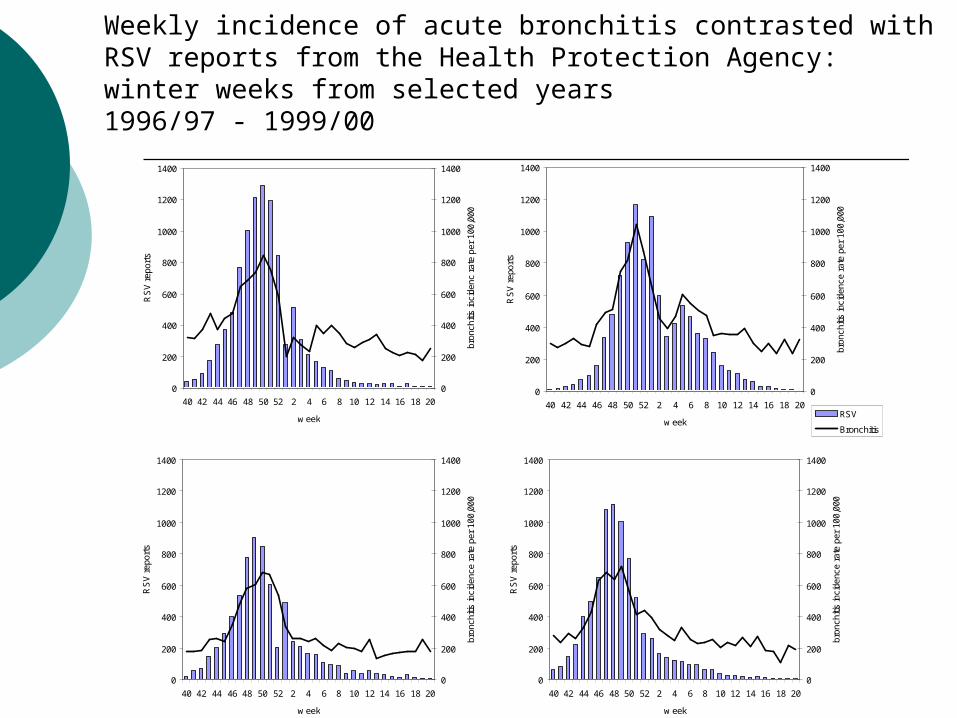
Weekly incidence of acute bronchitis contrasted withRSV reports from the Health Protection Agency:winter weeks from selected years1996/97 - 1999/00
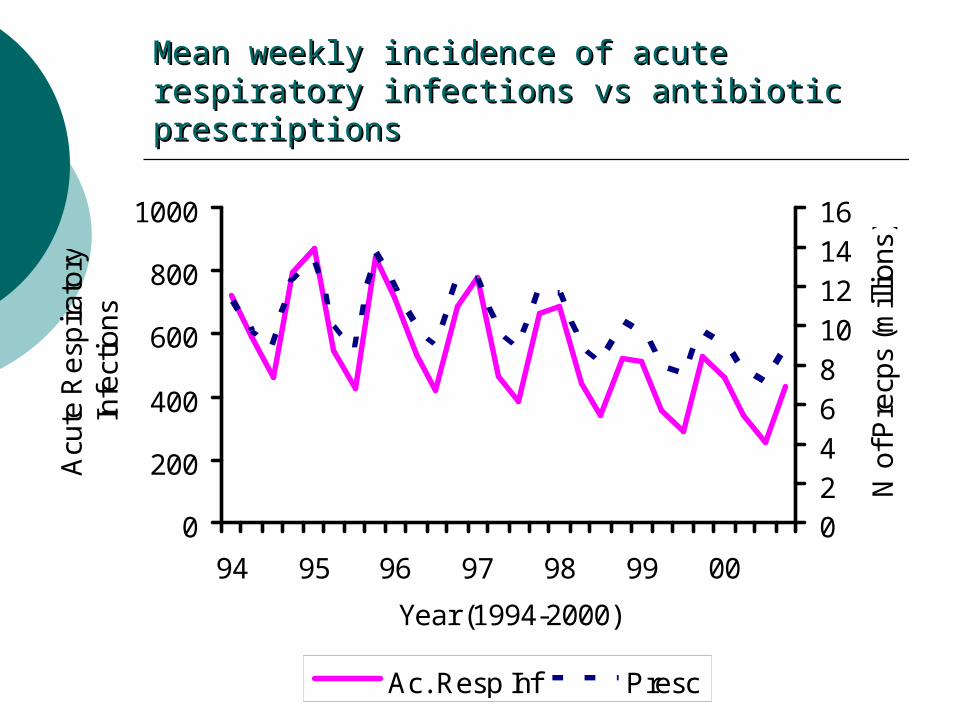
Mean weekly incidence of acute respiratory Mean weekly incidence of acute respiratory infections vs antibiotic prescriptionsinfections vs antibiotic prescriptions
0
200
400
600
800
1000
94 95 96 97 98 99 00
Year (1994-2000)
Acu
te R
esp
ira
tory
In
fect
ion
s
0246810121416
N o
f Pre
cps
(mill
ion
s)
Ac. Resp Inf Presc
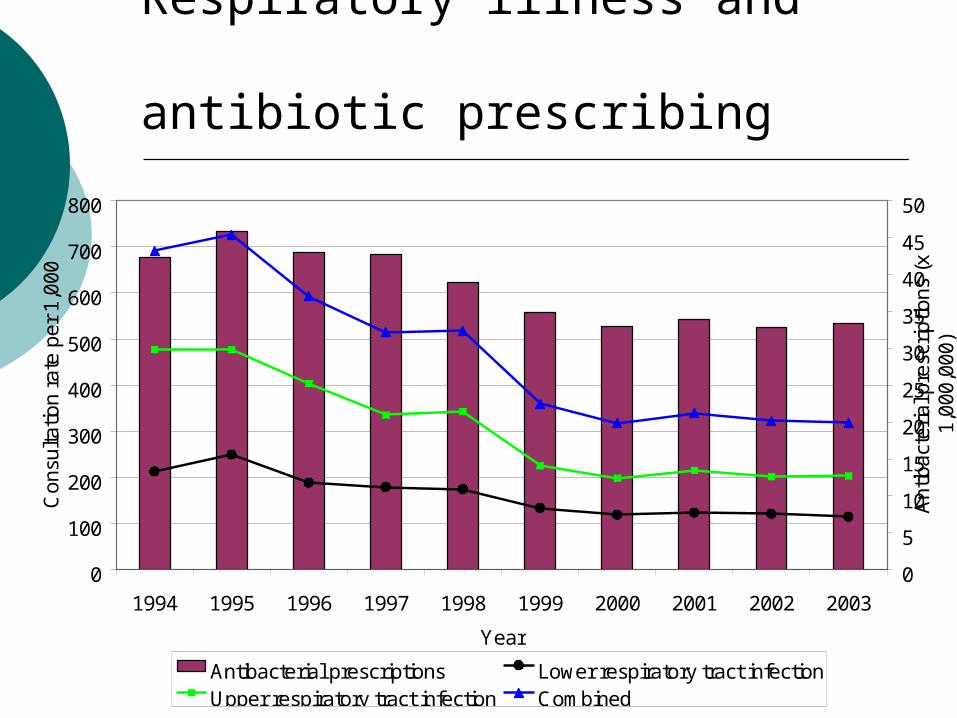
Respiratory illness and antibiotic prescribing
0
100
200
300
400
500
600
700
800
1994 1995 1996 1997 1998 1999 2000 2001 2002 2003
Year
Con
sulta
tion
rate
per
1,0
00
0
5
10
15
20
25
30
35
40
45
50
Ant
ibac
teria
l pre
scrip
tions
(x
1,00
0,00
0)
Antibacterial prescriptions Lower respiratory tract infectionUpper respiratory tract infection Combined
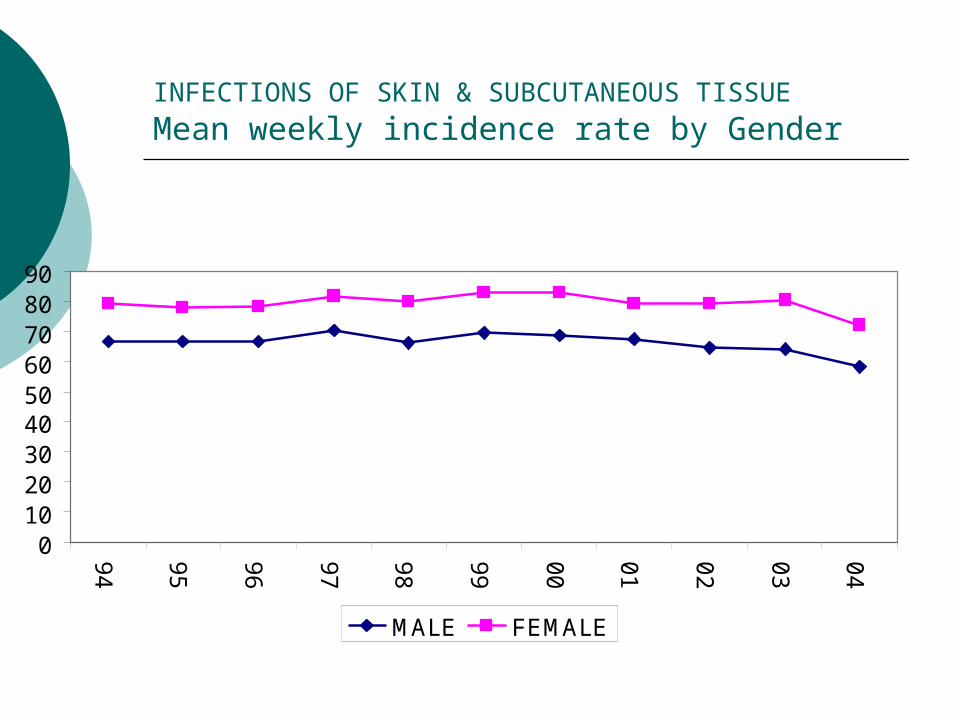
INFECTIONS OF SKIN & SUBCUTANEOUS TISSUE Mean weekly incidence rate by Gender
0102030405060708090
94
95
96
97
98
99
00
01
02
03
04
MALE FEMALE
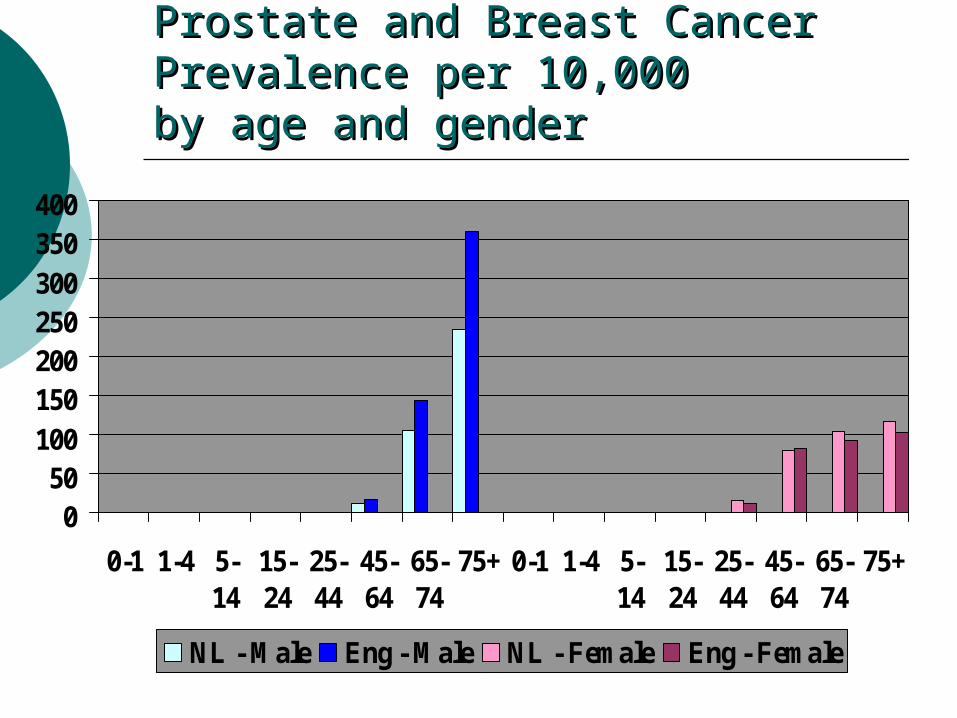
Prostate and Breast CancerProstate and Breast CancerPrevalence per 10,000 Prevalence per 10,000 by age and genderby age and gender
050
100150200250300350400
0-1 1-4 5-14
15-24
25-44
45-64
65-74
75+ 0-1 1-4 5-14
15-24
25-44
45-64
65-74
75+
NL - Male Eng - Male NL - Female Eng - Female
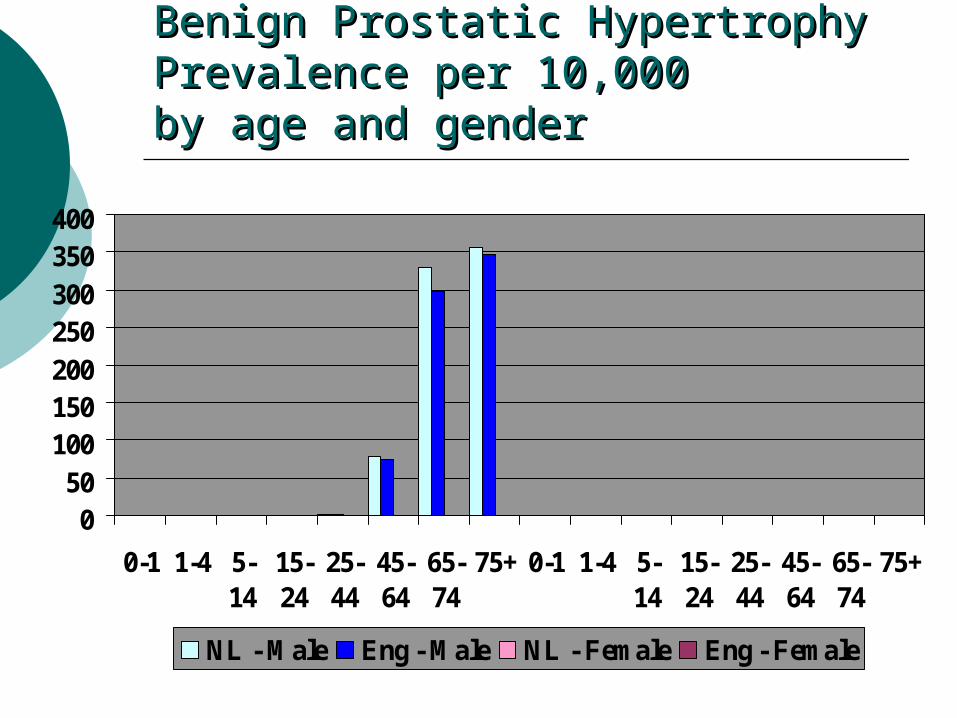
Benign Prostatic Hypertrophy Benign Prostatic Hypertrophy Prevalence per 10,000 Prevalence per 10,000 by age and genderby age and gender
050
100150200250300350400
0-1 1-4 5-14
15-24
25-44
45-64
65-74
75+ 0-1 1-4 5-14
15-24
25-44
45-64
65-74
75+
NL - Male Eng - Male NL - Female Eng - Female
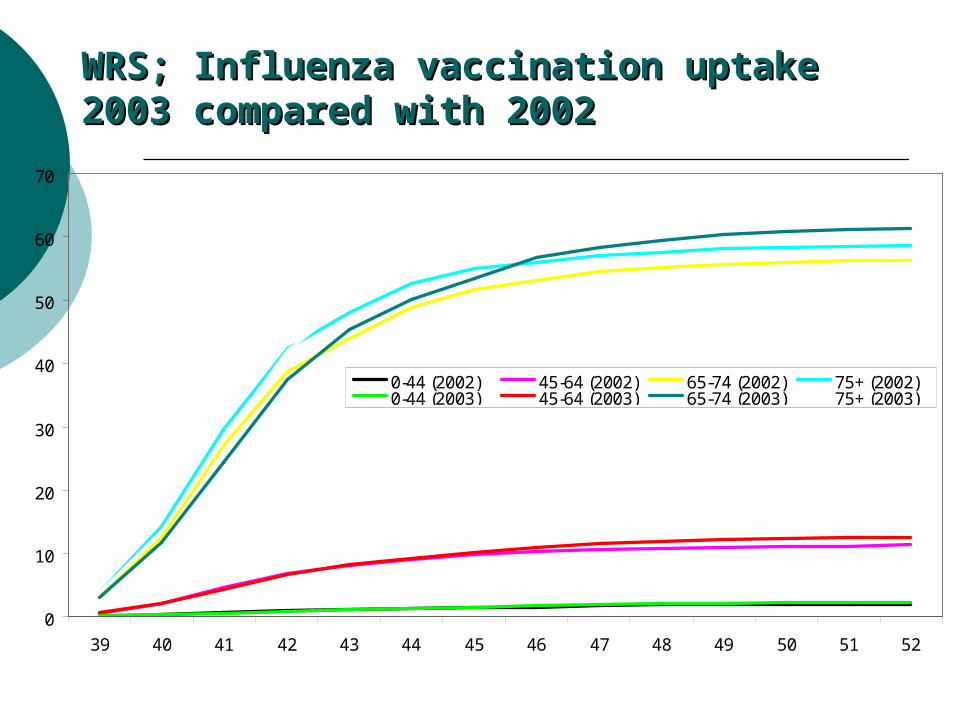
WRS; Influenza vaccination uptake 2003 WRS; Influenza vaccination uptake 2003 compared with 2002compared with 2002
0
10
20
30
40
50
60
70
39 40 41 42 43 44 45 46 47 48 49 50 51 52
0-44 (2002) 45-64 (2002) 65-74 (2002) 75+ (2002)0-44 (2003) 45-64 (2003) 65-74 (2003) 75+ (2003)
SummarySummary
Computer storage of medical records is replacing paper records.
The computer is a filing cabinet, but you need a good filing system.
Disciplined data capture is at the heart of a good record whether for routine patient management of for epidemiological research.
The classification system does the filing. Select it carefully according to your purpose and collaborators. Be wary of mapping programmes across classifications.
SOAP is a good structure on which to base your recording but if you want to concentrate your analysis on one or two of these boxes you must make appropriate entries in every box at every consultation including home visits.
Episode typing is needed to study seasonality for contemporary surveillance.